
Regulation of MINK1 by APC, PKA and MARK3/4 and ...
261
University of Dundee DOCTOR OF PHILOSOPHY Regulation of MINK1 by APC, PKA and MARK3/4 and consequences for epithelial cell biology Volk, Melanie Award date: 2021 Link to publication General rights Copyright and moral rights for the publications made accessible in the public portal are retained by the authors and/or other copyright owners and it is a condition of accessing publications that users recognise and abide by the legal requirements associated with these rights. • Users may download and print one copy of any publication from the public portal for the purpose of private study or research. • You may not further distribute the material or use it for any profit-making activity or commercial gain • You may freely distribute the URL identifying the publication in the public portal Take down policy If you believe that this document breaches copyright please contact us providing details, and we will remove access to the work immediately and investigate your claim. Download date: 19. Apr. 2022
-
Upload
khangminh22 -
Category
Documents
-
view
0 -
download
0
Transcript of Regulation of MINK1 by APC, PKA and MARK3/4 and ...
University of Dundee
DOCTOR OF PHILOSOPHY
Regulation of MINK1 by APC, PKA and MARK3/4 and consequences for epithelial cellbiology
Volk, Melanie
Award date:2021
Link to publication
General rightsCopyright and moral rights for the publications made accessible in the public portal are retained by the authors and/or other copyright ownersand it is a condition of accessing publications that users recognise and abide by the legal requirements associated with these rights.
• Users may download and print one copy of any publication from the public portal for the purpose of private study or research. • You may not further distribute the material or use it for any profit-making activity or commercial gain • You may freely distribute the URL identifying the publication in the public portal
Take down policyIf you believe that this document breaches copyright please contact us providing details, and we will remove access to the work immediatelyand investigate your claim.
Download date: 19. Apr. 2022
Regulation of MINK1 by APC, PKA and MARK3/4 and consequences for epithelial cell biology
A thesis submitted in partial fulfilment of the requirements for the degree of
Doctor of Philosophy
Melanie Scarlett Volk
Division for Cell and Developmental Biology
School of Life Sciences
University of Dundee
Thesis supervisors:
Professor Inke Näthke
Professor Carol MacKintosh
Dr Rastko Sknepnek
February 2021

I
Contents
Contents I
List of Illustrations VI
List of Tables IX
Abbreviations XI
Acknowledgements XIX
Declaration XX
Summary 1
1. Introduction and Background 2
Aims of this project 2
Adenomatous polyposis coli and colorectal cancer 3
MINK1 10
Misshapen and MIG-15 13
Protein kinases 15
MINK1 and its ohnologues 16
MINK1 19
TNIK 25
MAP4K4 27
ERM proteins 29
14-3-3 proteins 33
Protein kinase A 35
Cell migration and physical forces 36
Chapter overview 38
Chapter 3 - Interaction of APC and MINK1 38
Chapter 4 - Phosphorylation of MINK1 and binding of 14-3-3 38
II
Chapter 5 - Role of MINK1 in cell migration 39
Chapter 6 - Biological function(s) of MINK1 39
2. Material and Methods 40
Tissue culture 41
Cell lines 41
Generation of cell lines 43
Small interfering RNA (siRNA) 43
Mitotic block 43
Cell treatments to stimulate or inhibit protein kinase A (PKA) and/or microtubule
affinity-regulating protein kinase (MARK) 3/4 activity 44
MAP4K-inhibitor PF-06260933 treatment 45
Top/Fop assay 45
Live cell imaging 46
Coating of cover slips for cell adhesion assay 48
Cell adhesion assay 48
Fixation and immunofluorescence staining of cells 49
MTT cell proliferation assays 50
Spindle orientation measurement 51
RNA analysis 52
RNA extraction 52
cDNA synthesis 52
Quantitative real-time PCR (RT-qPCR) 52
Quantitative real-time PCR with Wnt signalling targets (SAB Target List H96
plates) 53
Protein analysis 54
Total protein extraction of adherent cells 54
Mitotic shake-off 55
III
Subcellular protein fractionation of adherent cultured cells 55
Immunoprecipitation with protein G sepharose 55
Immunoprecipitation with GFP-Trap® sepharose 56
In vitro kinase assays with MINK1 as substrate 57
In vitro kinase assay with MINK1 as kinase 57
Sodium dodecyl sulphate polyacrylamide gel electrophoresis (SDS-PAGE) and
Western blotting (WB) 58
Far-Western blotting (Far-WB) 60
Mass spectrometry and phosphorylation site mapping 61
Luciferase assay 62
Cell migration 63
Migration data analysis 63
3. Interaction of APC and MINK1 64
Summary 64
Inducible MINK1 overexpression in cells leads to 5- to 9-fold MINK1 expression
compared to the endogenous protein levels 66
N-terminal part of APC associates with the linker domain of MINK1 70
TNIK might compensate for MINK1 deletion 76
4. Phosphorylation of MINK1 and binding of 14-3-3 82
Summary 84
14-3-3 binds to MINK1 87
14-3-3-binding to MINK1 independent of its association with APC 90
14-3-3 binds to phosphosites in the linker domain of MINK1 94
PKA directly phosphorylates MINK1 on 14-3-3-binding phosphosites 96
MARK3/4 phosphorylates MINK1 on 14-3-3-binding phosphosites 98
Identification and validation of potential 14-3-3-binding phosphosites on MINK1
101
IV
MINK1 shows preference for threonine as substrate 110
MINK1 kinase might not be essential for phosphorylation of ERM proteins in vivo
117
5. Role of MINK1 in cell migration 120
Summary 122
Overexpression of MINK1 leads to faster cell migration 123
Correlation length over which cells influence each other’s motility is not affected
by MINK1 levels 126
MINK1 might be important for cell correlation 130
MINK1 protein levels do not alter velocity correlations of migrating U2OS cells
136
6. Biological function(s) of MINK1 143
Summary 144
Effect of MINK1 on cell substrate- and focal adhesion 147
MINK1 in Wnt signalling 155
MINK1 might be involved in proliferation 168
MINK1 on its own does not affect Hippo signalling 171
Sub-cellular localisation of MINK1 175
MINK1 might be involved in mitotic spindle orientation 184
7. Discussion 191
Biological functions of MINK1 kinase 193
Wnt signalling 205
MINK1 and colorectal cancer 207
Conclusion 209
8. Appendix 212
MATLAB scripts 212
ImageJ macro 214

V
This ImageJ macro was used in chapter 6 to 214
Subcellular localisation of MINK1 214
Conditional Mink1 knockout mouse 215
References 220
VI
List of Illustrations
Figure 1.1: Schematic of the human full-length APC protein. ............................. 4
Figure 1.2: Schematic of Wnt signalling. .............................................................. 6
Figure 1.3: Schematic of focal adhesion assembly and disassembly. .............. 8
Figure 1.4: Phylogenetic tree of the mammalian Ste20 kinase family. ............. 11
Figure 1.5: MINK1 domain structure. .................................................................. 17
Figure 1.6: Model of ERM phosphocycling. ........................................................ 30
Figure 2.1: Schematic of set up for life cell imaging of migrating cells. .......... 47
Figure 3.1: Quantification of MINK1 expression levels in inducible MINK1-overexpressing U2OS cells. ................................................................................ 68
Figure 3.2: Co-immunoprecipitation of APC and MINK1 from U2OS cells. ...... 71
Figure 3.3: Co-immunoprecipitation of APC and MINK1 from SW480 cells. .... 72
Figure 3.4: Co-immunoprecipitation of APC and MINK1 domains from U2OS cells. ...................................................................................................................... 74
Figure 3.5: Western blotting to test compensation for MINK1 depletion/deletion by its ohnologues in U2OS cells. ....................................................................... 78
Figure 3.6: RT-qPCR analysis for ohnologue compensation in U2OS cells. ... 79
Figure 3.7: Western blotting analysis for ohnologue compensation in mouse intestinal organoids. ............................................................................................ 81
Figure 4.1: Model of MINK1 phosphorylation and kinase activity. ................... 86
Figure 4.2: Immunoprecipitation of GFP-MINK1 and 14-3-3 Far-Western blotting. ................................................................................................................. 89
Figure 4.3: Immunoprecipitation of MINK1-GFP from U2OS MINK1-GFP cells and 14-3-3 Far-Western blotting. ........................................................................ 92
Figure 4.4: Immunoprecipitation of MINK1-GFP or GFP-tagged MINK1 domains and 14-3-3 Far-Western blotting. ........................................................................ 95
Figure 4.5: In vitro kinase assay with PKA kinase and GST-MINK1. .................. 97
Figure 4.6: MARK3/4 phosphorylates MINK1 on 14-3-3-binding phosphosites. ............................................................................................................................. 100
Figure 4.7: Phosphorylation site mapping of in vitro kinase assays with PKA kinase and GST-MINK1 (substrate). ................................................................. 103
VII Figure 4.8: Phosphorylation site mapping of in vitro kinase assays with PKA kinase and/or MARK3/4 kinase and GST-MINK1 (substrate). ......................... 104
Figure 4.9: In vitro kinase assays with PKA and MARK3 kinases and GST-MINK1 (substrate). ............................................................................................. 107
Figure 4.10: In vitro kinase assays with PKA and MARK4 kinases and GST-MINK1 (substrate). ............................................................................................. 108
Figure 4.11: In vitro kinase assays with (mutant) MINK1 kinase and peptide substrates. .......................................................................................................... 115
Figure 4.12: ERM phosphorylation in U2OS cells. ........................................... 118
Figure 5.1: Schematic of mammalian gut epithelium. ..................................... 120
Figure 5.2: Preparation of U2OS cells for imaging of migrating cells. ........... 124
Figure 5.3: Average speed of confluent and migrating U2OS cell over 24 hours. ............................................................................................................................. 126
Figure 5.4: Velocity-velocity correlation function in Fourier space for migrating and confluent U2OS cells. ................................................................................. 129
Figure 5.5: Velocity cluster plots of cell speed clusters of migrating and confluent U2OS cells. ........................................................................................ 133
Figure 5.6: Velocity correlation of all migrating cells in example images versus cluster of fast migration cells. .......................................................................... 135
Figure 5.7: Schematics of magnetic/electric fields. ......................................... 137
Figure 5.8: Example of the Helmholtz decomposition applied to migration U2OS cells (after t = 500 minutes). .............................................................................. 139
Figure 5.9: Step-wise analysis of correlation between Helmholtz decomposition and cell rounding events in U2OS cells. .......................................................... 140
Figure 5.10: Correlation between divergence part of Helmholtz decomposition and rounding of migrating U2OS cells over 24 hours. ................................... 141
Figure 6.1: Effect of altered MINK1 levels on adhesion to different extracellular matrix proteins. .................................................................................................. 150
Figure 6.2: Schematic of focal adhesion assembly and disassembly. .......... 151
Figure 6.3: Phosphorylation of paxillin (Y118) and FAK (Y397) in U2OS cells. ............................................................................................................................. 154
Figure 6.4: Effect of MINK1 levels on Wnt signalling targets. ......................... 158
VIII Figure 6.5: Schematic of Wnt signalling. .......................................................... 160
Figure 6.6: Effect of APC KD and MINK1 levels on Wnt signalling targets. ... 162
Figure 6.7: Effect of APC (D)KD, MINK1 KD and APC/MINK1 DKD on Wnt signalling targets. .............................................................................................. 165
Figure 6.8: Effect of MINK1 depletion on cell proliferation in U2OS and Colo320 cells. .................................................................................................................... 169
Figure 6.9: The (mammalian) core Hippo pathway. ......................................... 172
Figure 6.10: Effect of U2OS cells treated with MAP4K4/6/7 inhibitor on Hippo signalling. ........................................................................................................... 174
Figure 6.11: Subcellular localisation of MINK1. ............................................... 177
Figure 6.12: Subcellular localisation of overexpressed MINK1-GFP with/without FSK and/or H-89 treatment. ............................................................................... 181
Figure 6.13: Vesicle transport. ........................................................................... 183
Figure 6.14: Spindle orientation in U2OS cells upon MINK1 alteration. ......... 185
Figure 6.15: Phosphorylation of ERM proteins, MINK1 and phospho-ERM localisation, during mitosis............................................................................... 189
Figure 7.1: Model of inhibition and activation of MINK1 kinase activity. ....... 195
Figure 8.1: Overview of the layout of the MATLAB toolkit used to analyse migrating and confluent U2OS cells. ............................................................... 212
Figure 8.2: Strategy for conditional knockout of the Mink1 gene. .................. 217
IX
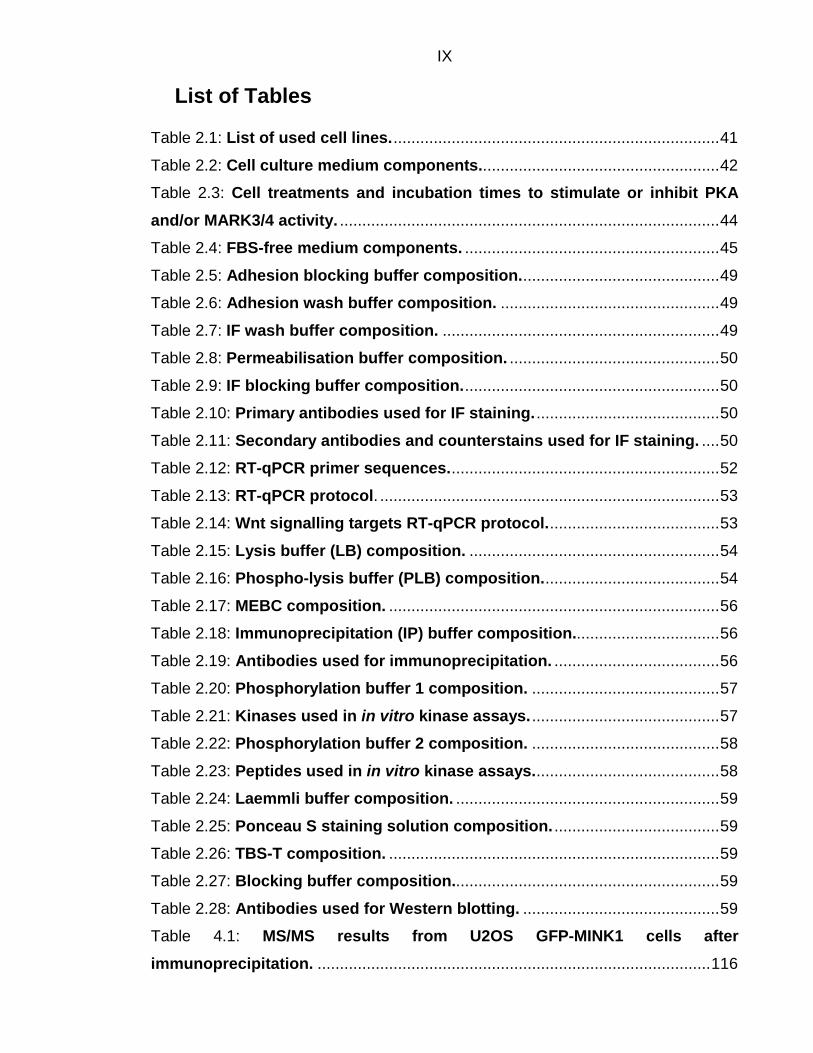
List of Tables
Table 2.1: List of used cell lines. ......................................................................... 41
Table 2.2: Cell culture medium components. ..................................................... 42
Table 2.3: Cell treatments and incubation times to stimulate or inhibit PKA and/or MARK3/4 activity. ..................................................................................... 44
Table 2.4: FBS-free medium components. ......................................................... 45
Table 2.5: Adhesion blocking buffer composition. ............................................ 49
Table 2.6: Adhesion wash buffer composition. ................................................. 49
Table 2.7: IF wash buffer composition. .............................................................. 49
Table 2.8: Permeabilisation buffer composition. ............................................... 50
Table 2.9: IF blocking buffer composition. ......................................................... 50
Table 2.10: Primary antibodies used for IF staining. ......................................... 50
Table 2.11: Secondary antibodies and counterstains used for IF staining. .... 50
Table 2.12: RT-qPCR primer sequences. ............................................................ 52
Table 2.13: RT-qPCR protocol. ............................................................................ 53
Table 2.14: Wnt signalling targets RT-qPCR protocol. ...................................... 53
Table 2.15: Lysis buffer (LB) composition. ........................................................ 54
Table 2.16: Phospho-lysis buffer (PLB) composition. ....................................... 54
Table 2.17: MEBC composition. .......................................................................... 56
Table 2.18: Immunoprecipitation (IP) buffer composition................................. 56
Table 2.19: Antibodies used for immunoprecipitation. ..................................... 56
Table 2.20: Phosphorylation buffer 1 composition. .......................................... 57
Table 2.21: Kinases used in in vitro kinase assays. .......................................... 57
Table 2.22: Phosphorylation buffer 2 composition. .......................................... 58
Table 2.23: Peptides used in in vitro kinase assays. ......................................... 58
Table 2.24: Laemmli buffer composition. ........................................................... 59
Table 2.25: Ponceau S staining solution composition. ..................................... 59
Table 2.26: TBS-T composition. .......................................................................... 59
Table 2.27: Blocking buffer composition............................................................ 59
Table 2.28: Antibodies used for Western blotting. ............................................ 59
Table 4.1: MS/MS results from U2OS GFP-MINK1 cells after immunoprecipitation. ........................................................................................ 116

X Table 6.1: Analysis of Wnt signalling target RT-qPCRs with different MINK1 levels in U2OS cells. .......................................................................................... 159
Table 8.1: Abridgment from proteins co-immunoprecipitating with GFP-MINK1 identified via MS/MS. ......................................................................................... 219
XI
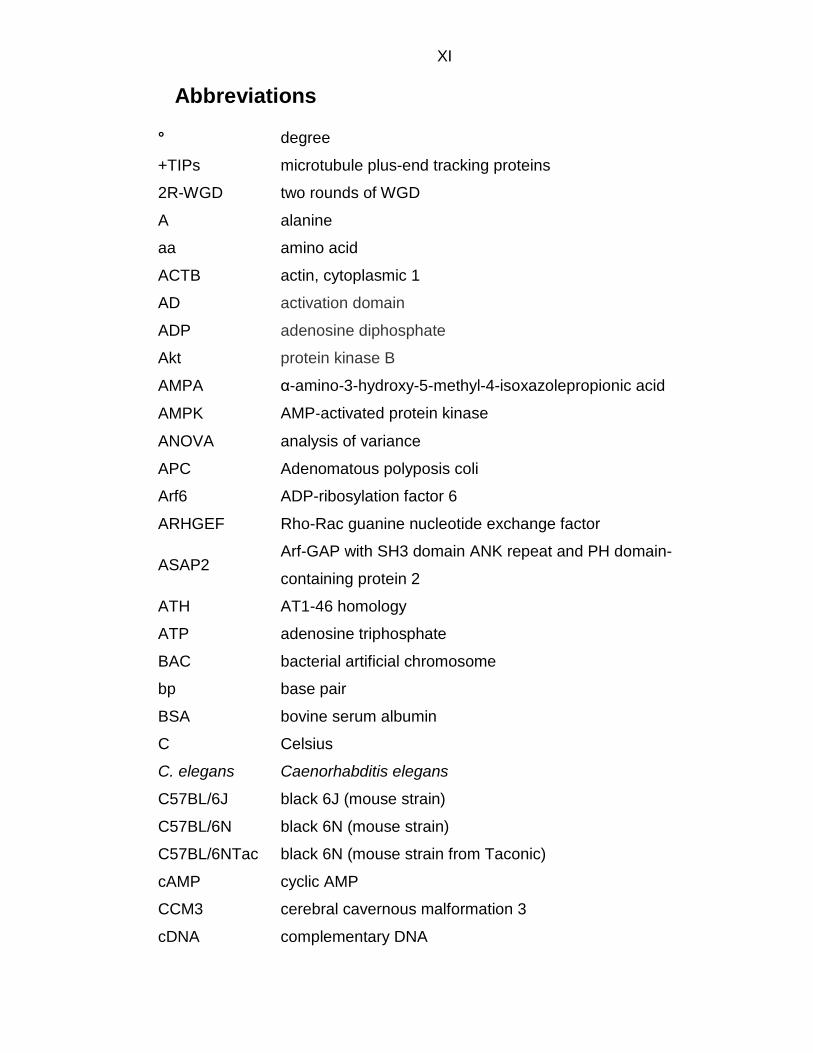
Abbreviations
° degree
+TIPs microtubule plus-end tracking proteins
2R-WGD two rounds of WGD
A alanine
aa amino acid
ACTB actin, cytoplasmic 1
AD activation domain
ADP adenosine diphosphate
Akt protein kinase B
AMPA α-amino-3-hydroxy-5-methyl-4-isoxazolepropionic acid
AMPK AMP‐activated protein kinase
ANOVA analysis of variance
APC Adenomatous polyposis coli
Arf6 ADP-ribosylation factor 6
ARHGEF Rho-Rac guanine nucleotide exchange factor
ASAP2 Arf-GAP with SH3 domain ANK repeat and PH domain-
containing protein 2
ATH AT1-46 homology
ATP adenosine triphosphate
BAC bacterial artificial chromosome
bp base pair
BSA bovine serum albumin
C Celsius
C. elegans Caenorhabditis elegans
C57BL/6J black 6J (mouse strain)
C57BL/6N black 6N (mouse strain)
C57BL/6NTac black 6N (mouse strain from Taconic)
cAMP cyclic AMP
CCM3 cerebral cavernous malformation 3
cDNA complementary DNA
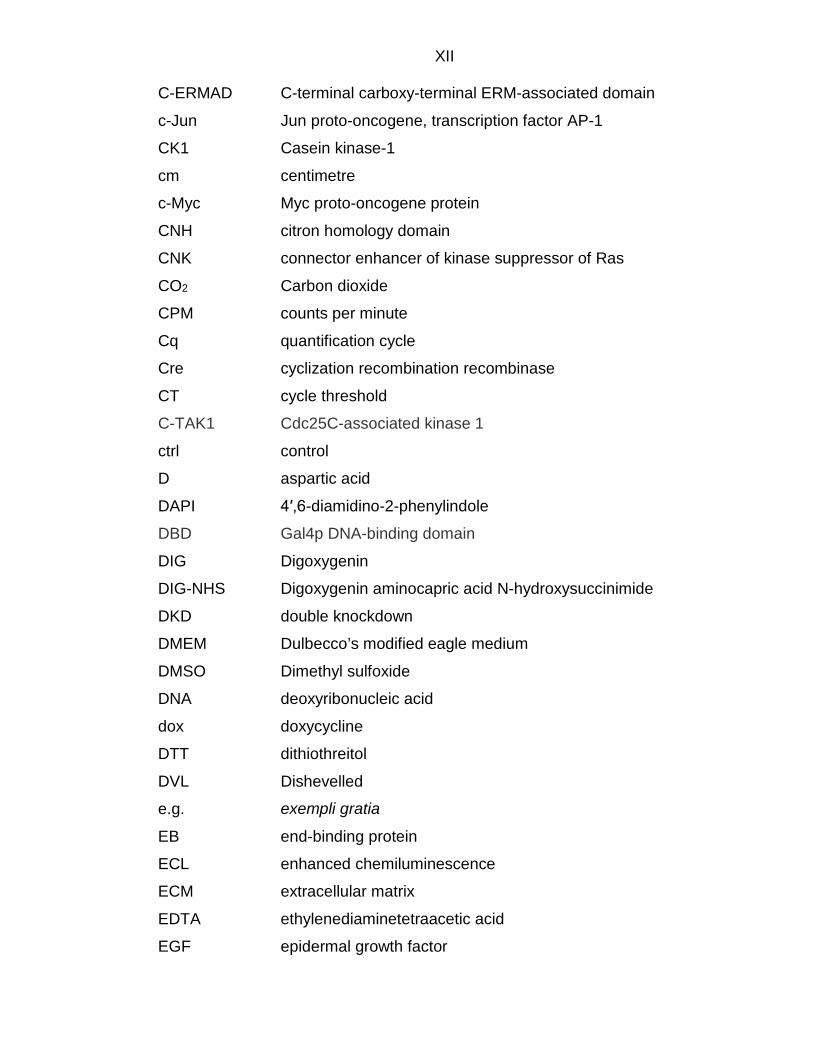
XII C-ERMAD C-terminal carboxy-terminal ERM-associated domain
c-Jun Jun proto-oncogene, transcription factor AP-1
CK1 Casein kinase-1
cm centimetre
c-Myc Myc proto-oncogene protein
CNH citron homology domain
CNK connector enhancer of kinase suppressor of Ras
CO2 Carbon dioxide
CPM counts per minute
Cq quantification cycle
Cre cyclization recombination recombinase
CT cycle threshold
C-TAK1 Cdc25C-associated kinase 1
ctrl control
D aspartic acid
DAPI 4′,6-diamidino-2-phenylindole
DBD Gal4p DNA-binding domain
DIG Digoxygenin
DIG-NHS Digoxygenin aminocapric acid N-hydroxysuccinimide
DKD double knockdown
DMEM Dulbecco’s modified eagle medium
DMSO Dimethyl sulfoxide
DNA deoxyribonucleic acid
dox doxycycline
DTT dithiothreitol
DVL Dishevelled
e.g. exempli gratia
EB end-binding protein
ECL enhanced chemiluminescence
ECM extracellular matrix
EDTA ethylenediaminetetraacetic acid
EGF epidermal growth factor

XIII ePK eukaryotic protein kinase
ER endoplasmic reticulum
ERM ezrin/radixin/moesin
ESC embryonic stem cell
etc. et cetera
EXOC6B exocyst complex component 6B
FA focal adhesion
FAP familial adenomatous polyposis
FAK focal adhesion kinase
FAP familial adenomatous polyposis
Far-WB far-Western blotting
FBS foetal bovine serum
FERM F for 4.1 protein, ezrin/radixin/moesin
FITC fluorescein isothiocyanate
Flp flippase
FRT Flp recombinase target
FSK forskolin
g gram
G glycine
G1 generation 1 (first generation after mutagenesis)
GAP GTPase activating protein
GAPDH glyceraldehyde-3-phosphate dehydrogenase
GCK germinal centre kinase
GEF guanine nucleotide exchange factor
GFP green fluorescent protein
GSK-3 glycogen synthase kinase-3
GST glutathione S-transferase
GTP nucleotide guanosine triphosphate
h hour
HCl hydrochloric acid
HIS histidine
Hpo Hippo

XIV HPRT1 hypoxanthine-guanine phosphoribosyltransferase
HPV Human Papillomavirus
HRP horseradish peroxidase
I isoleucine
i.e. id est
IF immunofluorescents
IGF1 insulin-like growth factor 1
IP Immunoprecipitation
IQGAP1 IQ-motif-containing GTPase activation protein 1
IQSEC1 IQ motif and SEC7 domain-containing protein 1
IVD in vitro diagnostic
IVF in vitro fertilisation
JNK Jun N-terminal kinase
K lysine
KA kinase activities
KAP3 kinesin superfamily-associated protein 3
KD knockdown
kDa kilo Dalton
KO knockout
l litre
L leucine
LATS/Lats Large tumour suppressor
LC-MS/MS liquid chromatography tandem-mass spectrometry
LDS lithium dodecyl sulphate
LEF lymphoid enhancer-binding factor
LGN leucine-glycine-asparagine receptor protein
LHA long homology arm
LOK lymphocyte-oriented kinase
loxP locus of x-over P1
LRP LDL-related protein
MAP4K mitogen-activated protein kinase kinase kinase kinase
MAPK mitogen-activated protein kinase
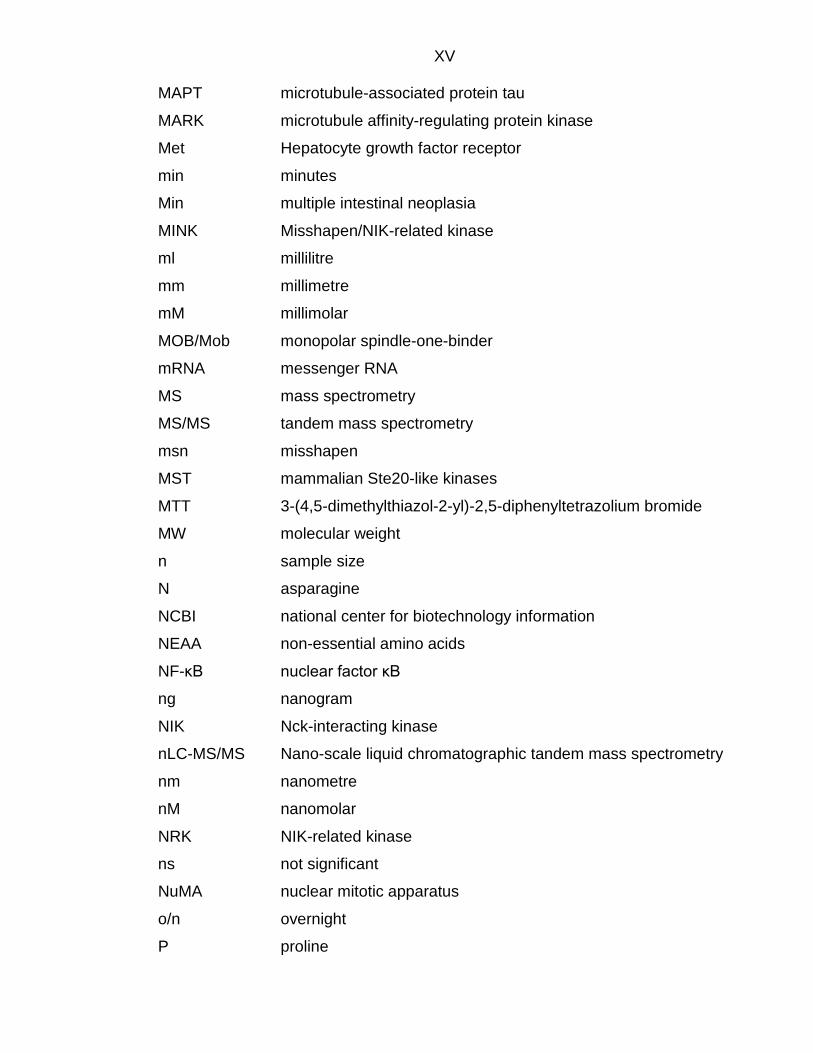
XV
MAPT microtubule-associated protein tau
MARK microtubule affinity-regulating protein kinase
Met Hepatocyte growth factor receptor
min minutes
Min multiple intestinal neoplasia
MINK Misshapen/NIK-related kinase
ml millilitre
mm millimetre
mM millimolar
MOB/Mob monopolar spindle-one-binder
mRNA messenger RNA
MS mass spectrometry
MS/MS tandem mass spectrometry
msn misshapen
MST mammalian Ste20-like kinases
MTT 3-(4,5-dimethylthiazol-2-yl)-2,5-diphenyltetrazolium bromide
MW molecular weight
n sample size
N asparagine
NCBI national center for biotechnology information
NEAA non-essential amino acids
NF-κB nuclear factor κB
ng nanogram
NIK Nck-interacting kinase
nLC-MS/MS Nano-scale liquid chromatographic tandem mass spectrometry
nm nanometre
nM nanomolar
NRK NIK-related kinase
ns not significant
NuMA nuclear mitotic apparatus
o/n overnight
P proline
XVI P/S penicillin/streptomycin
PAGE polyacrylamide gel electrophoresis
p-Akt phospho-protein kinase B
PAR partitioning-defective
PAS p-Akt substrate
PBS phosphate buffered saline
PCP planar cell polarity
pERM phospho-ERM
PFA paraformaldehyde
pHH3 phospho-Histone H3
PI(4,5)P2 phospholipid phosphatidylinositol 4,5-bisphosphate
PIV particle image velocimetry
PKA protein kinase A
PKC protein kinase C
PMA phorbol ester
PP2A Protein Phosphatase 2A
p-PKA phospho-protein kinase A
PRICKLE Prickle-like protein
pS phosphoserine
pT phosphothreonine
PuroR puromycin resistance
Q glutamine
qPCR quantitative PCR
R arginine
RhoA Ras homolog family member A
RNA ribonucleic acid
ROCK rho-associated protein kinase
RT real-time
S serine
Sav Salvador
Sd Scalloped
SD standard deviation
XVII SDS sodium dodecyl sulphate
SEM standard error of the mean
SH3BP1 SH3 domain-binding protein 1
siRNA small interfering RNA
SLK STE20-like serine/threonine-protein kinase
SLS School of Life Sciences
SMAD mothers against decapentaplegic homolog
ST SV40 Small T antigen
STK10 serine/threonine-protein kinase 10
STRIP striatin-interacting proteins
STRIPAK striatin-interacting phosphatase and kinase
STRN striatin
STRN3 S/G2 nuclear autoantigen
STRN4 striatin-4/zinedin
t time
T threonine
TAB1 TAK1-binding protein 1
TAK1 transforming growth factor-β-activated kinase 1
TAZ transcriptional co-activator with PDZ-binding motif
TBP TATA-binding protein
TBS Tris-buffered saline
TBS-T Tris-buffered saline/Triton X-100
TCF transcription factor
TEAD TEA domain family
Tet tetracycline
TGF-β transforming growth factor-beta
TIRF total internal reflection fluorescence
TNF tumour necrosis factor
TNIK TRAF2 and Nck-interacting kinase
TRAF TNF receptor-associated factor
U units
UV ultraviolet
XVIII V valine
Vis visible
vs versus
v/v volume per volume
W tryptophan
w/v weight per volume
WB Western blotting
WGD whole genome duplications
wt wild-type
Wts Warts
xg (times-) gravity
XIC extracted-ion chromatogram
XLID X-linked intellectual disability
Y tyrosine
YAP Yes-associated protein
Yki Yorkie
ZO zonula occludens
β-TrCP β-Transducin repeat-containing protein
μg microgram
μl microlitre
μm micrometre
μM micromolar

XIX
Acknowledgements
I would like to express my sincerest gratitude to my supervisors, Professor Inke
Näthke, Professor Carol MacKintosh and Dr Rastko Sknepnek, for their continuous
support throughout my PhD studies, with my related research and all their help and
advice.
I am grateful for Dr Rastko Sknepnek’s assistance and Guillermo Serrano Najera’s
advice with computational analysis and image analysis in MATLAB.
Moreover, I would like to acknowledge my collaborators Zhengcheng He and
Associate Professor Christopher Maxwell from the University of British Columbia for
their analysis of in spindle orientation in my different cell lines.
I would also like to thank my thesis committee, Professor John Rouse, Professor
Anton Gartner and Professor Tomo Tanaka, for their insightful comments and
advice, which helped me to think about my research from various perspectives.
I am grateful for my friends and fellow PhD students, for the stimulating discussions,
and especially for all the fun lunch breaks that helped to keep me sane over the last
four years. Last but not the least, I would like to thank my family: my mother and
brothers, who played a big part in me deciding to go for my PhD in the first place and
my amazing husband, who always supports and encourages me, throughout my
PhD journey, but also in all aspects of live in general, including his willingness to
move to Scotland with me.

XX
Declaration
I declare that I am the author of this thesis and that the work contained herein is my
own, except where explicitly stated otherwise. I consulted all cited references. The
work of which this thesis is a record has not been previously accepted for a higher
degree.
Melanie S. Volk
1
Summary
Colorectal cancer is the third most common cause of cancer-related deaths in the
developed world. In most colorectal cancers the tumour suppressor gene
adenomatous polyposis coli (APC) is mutated. The APC protein is closely linked to
epithelial tissue homeostasis, it is a scaffolding protein in Wnt signalling and is
important for cytoskeletal regulation. Misshapen/NIK-related kinase 1 (MINK1) was
identified as a Wnt signalling independent interaction partner of APC and MINK1 is
negatively regulated by APC in an evolutionary conserved process.
In my project, I investigated the biological function of MINK1, with the overall aim to
identify how MINK1 might contribute to the cancer phenotype induced by APC
mutations. Investigating the molecular association between APC and MINK1, I found
that the linker domain of MINK1 and the N-terminal part of APC are required.
Moreover, I confirmed that MINK1 phosphorylates ERM proteins on their activating
phosphosite in vitro. My finding that MINK1 kinase activity was markedly reduced
when the threonine ERM activating phosphosite was mutated to a serine suggested
that MINK1 may be a threonine-selective kinase. I demonstrated that PKA, MARK3
and MARK4 directly phosphorylate MINK1 on two phosphosites (S674 and S701) in
the linker domain of MINK1, which in turn enables 14-3-3-binding to MINK1. ERM
proteins play an essential role in mitotic spindle formation, orientation and function
and in cell migration. APC, too, has been linked to spindle orientation and MINK1 is
phosphorylated during mitosis. Investigating the functional link suggested by these
observations, I found that MINK1 overexpression caused spindle misorientation. So
far, I was unable to show an essential role of MINK1 phosphorylation and activation
of ERM proteins in vivo. The ability of MINK1 to phosphorylate ERM proteins at their
activating phosphosite and the role of ERM proteins in cell migration, together with
previously demonstrated roles of APC and MINK1 in cell migration, led to the
hypothesis that MINK1 contributes to migration defects observed in APC mutant
cells. I found that overexpression of MINK1 accelerated cell migration and likely
contributes to area size of coordinated cell movement in collective migration. The
exact mechanism behind these functions of MINK1 and its potential contribution to
colorectal cancer caused by APC mutation will need further investigation.
2 1. Introduction and Background
Aims of this project
Colorectal cancer is the third most common cause of cancer related death (Bray et
al., 2018). In most colorectal cancers, the tumour suppressor gene adenomatous
polyposis coli (APC) is mutated (Fearnhead et al., 2001). The APC protein is closely
linked to epithelial tissue homeostasis and has two main functions, it is a scaffolding
protein in Wnt signalling (Korinek et al., 1997; Stamos and Weis, 2013) and
important for cytoskeletal regulation (Carroll et al., 2017; Dikovskaya et al., 2007;
Dikovskaya et al., 2001; Juanes et al., 2017; Näthke et al., 1996; Yamashita et al.,
2003). A previous study from our group identified misshapen/NIK-related kinase 1
(MINK1) as a Wnt signalling-independent interaction partner of APC. We
demonstrated that MINK1 is negatively regulated by APC and this regulation is
evolutionarily conserved (Popow et al., 2019). The aims of my project were to
investigate the molecular association between APC and MINK1 and to understand
the biological function(s) and regulation of MINK1 to determine its role in APC-
mediated tumour formation. One of my aims was to identify the region(s) of MINK1
involved in the association with APC. Previous work showed that MINK1 associates
with APC in colorectal cancer cell lines (Colo320 and SW480), which only express
truncated, N-terminal portions of APC (Popow et al., 2019). This suggested that the
N-terminal part of APC associates with MINK1. MINK1 has three domains, an N-
terminal kinase domain, a linker domain, and a C-terminal citron homology (CNH)
domain and I aimed to identify which of these domains associates with APC.
Previous work suggests that protein kinase A (PKA) can phosphorylate MINK1,
which in turn enables 14-3-3-binding to MINK1 (MacKintosh group, unpublished
data). Therefore, further aims of my study were to determine whether PKA
directly/indirectly phosphorylates MINK1, to validate that this phosphorylation of
MINK1 enables 14-3-3-binding to MINK1 phosphosites and to identify the relevant
14-3-3-binding phosphosites on MINK1. Furthermore, I aimed to explore the effect
of 14-3-3-binding on the interaction between MINK1 and APC, MINK1 kinase activity
and function.
3
Adenomatous polyposis coli and colorectal cancer
Colorectal cancer is the fourth most common cancer worldwide, and the third most
common cause of cancer related deaths (Bray et al., 2018). The tumour suppressor
gene adenomatous polyposis coli (APC) is mutated in over 90% of colorectal
cancers (Rhodes et al., 2007). Heterozygous APC mutations are the underlying
cause of the dominantly inheritable autosomal condition, called familial
adenomatous polyposis (FAP). Patients with FAP develop multiple colonic
adenomatous polyps during their adult life, some of which will develop into colon
carcinomas. APC mutations also lead to the development of sporadic tumours in the
colon and other parts of the intestine and occur at the earliest stage of cancer
initiation (Groden et al., 1991; Horii et al., 1992; Jones et al., 2008; Nakatsuru et al.,
1992; Nishisho et al., 1991). Homozygous deletion (i.e. knockout)of Apc is
embryonic lethal (Fodde et al., 1994; Oshima et al., 1995) due to defects in the
development of primitive ectoderm prior to gastrulation (Moser et al., 1995b).
Heterozygous Apc mutation mice (ApcMin/+) are widely used as a colorectal cancer
model. These multiple intestinal neoplasia (Min) mice have a heterozygous mutation
at Apc codon 850 and develop multiple tumours in their intestinal tract. The
distribution of tumours along the intestine differs between human FAP patients and
Min mice; nevertheless, both are autosomal dominantly inherited (Su et al., 1992).
Therefore, Min mice provide a good model to study how APC mutations lead to
colorectal cancer (Moser et al., 1995a).
The human APC gene is located on chromosome 5 and consists of 15 exons which
encode a large APC protein that consists of 2844 amino acids and has a molecular
mass of 312 kDa (Groden et al., 1991). APC has multiple domains, which harbour
various different functions. From N- to C-terminus, APC contains the following
domains: an oligomerization domain, an armadillo repeat-domain, a domain with four
15-amino acid repeats and seven 20-amino acid repeats, three SAMP repeat
domains, a basic domain and C-terminal domains (Figure 1.1) (Zhang and Shay,
2017). Mutant C-terminally truncated APC (retaining at least the first 171 amino
acids) retains the oligomerization domain and is sufficient for APC oligomerization.
Therefore, in situations where heterozygous APC mutations exist, the truncated APC
4
can bind to full-length (wild-type) APC, creating a dominant negative effect (Su et
al., 1993). The armadillo repeat-domain is involved in interactions with other
proteins, including IQ-motif-containing GTPase activation protein 1 (IQGAP1),
protein phosphatase 2A (PP2A), a Rac-specific guanine nucleotide exchange factor
(termed Asef), and kinesin superfamily-associated protein 3 (KAP3) (Jimbo et al.,
2002; Kawasaki et al., 2000; Seeling et al., 1999; Watanabe et al., 2004). The 15-
/20-residue repeat domains and the SAMP repeat domains are important for Wnt
signalling. The four 15-amino acid repeats and seven 20-amino acid repeats are
involved in β-catenin binding and the SAMP repeats mediate the interaction between
APC and Axin (Behrens et al., 1998; Eklof Spink et al., 2001; Hart et al., 1998; Kohler
et al., 2008; Nakagawa et al., 1998; Shih et al., 2000). Motifs in the C-terminal region
of APC mediate interactions with structural proteins. The basic domain is important
for binding of microtubules and a second direct microtubule binding site is located
C-terminally of it (aa 2648-2826) (Dikovskaya et al., 2010; Gupta et al., 2014).
Another C-terminal 170 amino acid part of APC is important for the interaction with
the microtubule-associated protein EB1 (Figure 1.1). Therefore, the interaction
between APC and microtubules is mediated by two direct binding sites and indirectly
through its interaction with EB1 (Askham et al., 2000; Gupta et al., 2014; Zumbrunn
et al., 2001).
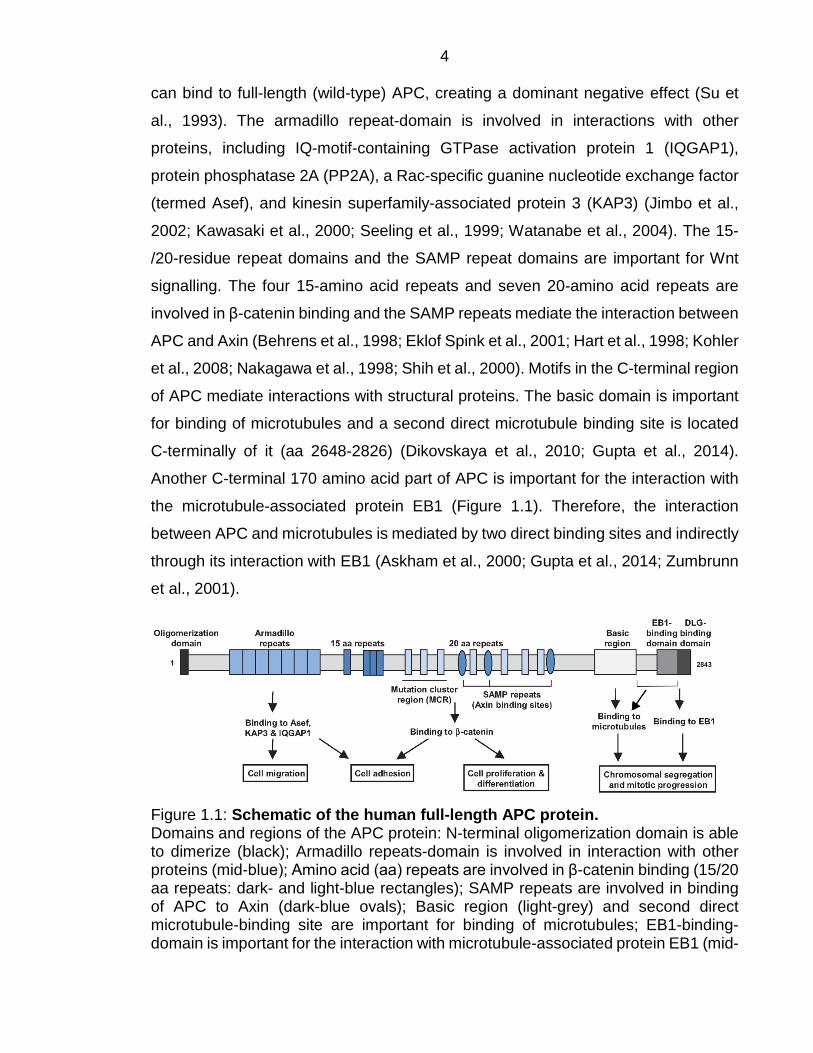
Figure 1.1: Schematic of the human full-length APC protein. Domains and regions of the APC protein: N-terminal oligomerization domain is able to dimerize (black); Armadillo repeats-domain is involved in interaction with other proteins (mid-blue); Amino acid (aa) repeats are involved in β-catenin binding (15/20 aa repeats: dark- and light-blue rectangles); SAMP repeats are involved in binding of APC to Axin (dark-blue ovals); Basic region (light-grey) and second direct microtubule-binding site are important for binding of microtubules; EB1-binding-domain is important for the interaction with microtubule-associated protein EB1 (mid-
5 grey); C-terminal DLG-binding domain is important for interaction with DLG protein (dark-grey). Altered from (Zhang and Shay, 2017).
The APC protein is important for epithelial tissue homeostasis, through its roles in
Wnt signalling and cytoskeletal regulation (Marshall et al., 2011; Nelson and Näthke,
2013; Nelson et al., 2012). This has been shown both through heterozygous APC
mutations (APCMin/+) in mouse gut epithelium and in other epithelia, epithelial cell
lines (e.g. bronchial HBE cells) and model organisms (Marshall et al., 2011; Nelson
et al., 2012). For example, the expression of C-terminally truncated APC led to
migration defects, including mesoderm cells of developing chick embryos and in
amoeboid Dictyostelium (Nelson et al., 2012). The role of APC in Wnt signalling has
been well studied and is highly linked to its role in carcinogenesis (Nelson and
Näthke, 2013; Stamos and Weis, 2013). In Wnt signalling, APC acts as a scaffolding
protein and is part of the β-catenin destruction complex, which is a multi-protein
complex consisting of APC, Axin, casein kinase-1 (CK1), glycogen synthase kinase-
3 (GSK-3) and dishevelled (DVL) (Figure 1.2). In the absence of Wnt ligands,
cytoplasmic β-catenin is phosphorylated by the β-catenin destruction complex
(Figure 1.2A). Phosphorylated β-catenin is recognised by an E3 ligase harbouring a
β-Transducin repeat-containing protein (β-TrCP). β-TrCP ubiquitinates β-catenin,
which leads to its degradation through the proteasome (Kretzschmar and Clevers,
2017). Wnt signalling is activated by the binding of Wnt ligands to frizzled and LDL-
related protein (LRP) receptors, leading to phosphorylation of LRP (Janda et al.,
2012) (Figure 1.2B). DVL interacts with phosphorylated LRP, which leads to the
recruitment of the whole β-catenin destruction complex to the plasma membrane (Li
et al., 2012). This inhibits the phosphorylation and subsequent ubiquitination of β-
catenin, therefore β-catenin accumulates in the cytoplasm and eventually
translocates into the nucleus. In the nucleus, β-catenin interacts with T-cell factor
(TCF)/lymphoid enhancer factor (LEF) transcription factors and this complex
activates the transcription of Wnt target genes (Korinek et al., 1997; Morin et al.,
1997). Therefore, APC mutations lead to an overactivation of Wnt signalling. Mutant,
C-terminally truncated APC lacks the Axin and β-catenin interaction sites and is
therefore no longer able to interact with the β-catenin destruction complex. Since the
assembly of the β-catenin destruction complex is coordinated by APC, it no longer
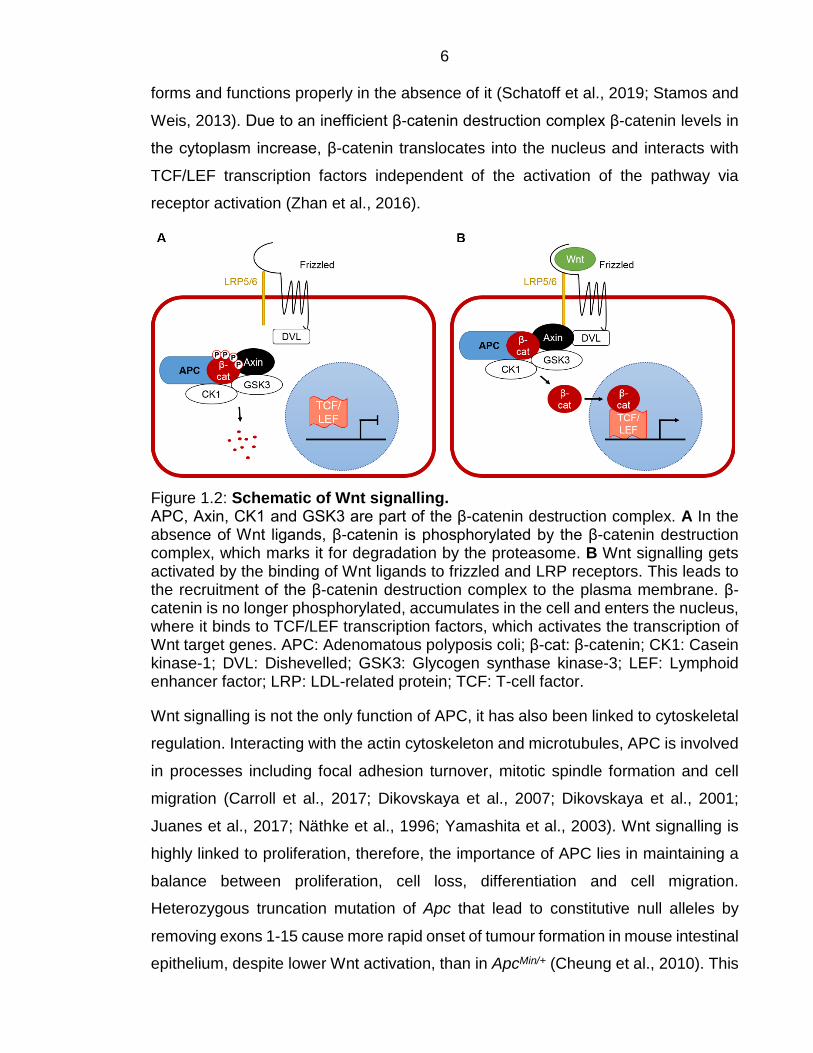
6 forms and functions properly in the absence of it (Schatoff et al., 2019; Stamos and
Weis, 2013). Due to an inefficient β-catenin destruction complex β-catenin levels in
the cytoplasm increase, β-catenin translocates into the nucleus and interacts with
TCF/LEF transcription factors independent of the activation of the pathway via
receptor activation (Zhan et al., 2016).
Figure 1.2: Schematic of Wnt signalling. APC, Axin, CK1 and GSK3 are part of the β-catenin destruction complex. A In the absence of Wnt ligands, β-catenin is phosphorylated by the β-catenin destruction complex, which marks it for degradation by the proteasome. B Wnt signalling gets activated by the binding of Wnt ligands to frizzled and LRP receptors. This leads to the recruitment of the β-catenin destruction complex to the plasma membrane. β-catenin is no longer phosphorylated, accumulates in the cell and enters the nucleus, where it binds to TCF/LEF transcription factors, which activates the transcription of Wnt target genes. APC: Adenomatous polyposis coli; β-cat: β-catenin; CK1: Casein kinase-1; DVL: Dishevelled; GSK3: Glycogen synthase kinase-3; LEF: Lymphoid enhancer factor; LRP: LDL-related protein; TCF: T-cell factor.
Wnt signalling is not the only function of APC, it has also been linked to cytoskeletal
regulation. Interacting with the actin cytoskeleton and microtubules, APC is involved
in processes including focal adhesion turnover, mitotic spindle formation and cell
migration (Carroll et al., 2017; Dikovskaya et al., 2007; Dikovskaya et al., 2001;
Juanes et al., 2017; Näthke et al., 1996; Yamashita et al., 2003). Wnt signalling is
highly linked to proliferation, therefore, the importance of APC lies in maintaining a
balance between proliferation, cell loss, differentiation and cell migration.
Heterozygous truncation mutation of Apc that lead to constitutive null alleles by
removing exons 1-15 cause more rapid onset of tumour formation in mouse intestinal
epithelium, despite lower Wnt activation, than in ApcMin/+ (Cheung et al., 2010). This
7
further strengthened the hypothesis that APC mutations are involved in
carcinogenesis through other mechanisms in addition to Wnt signalling. Therefore,
the loss of full-length APC (or the N-terminal part of APC) appears to contribute to
tumour progression by mechanisms other than Wnt signalling, but the exact
mechanisms involved are unknown.
APC has been implicated in cytoskeletal regulation through its roles in cell migration,
adhesion, focal adhesion turnover and spindle orientation. Mutation or depletion of
APC leads to migration defects (Dikovskaya et al., 2001; Näthke et al., 1996). In
healthy gut epithelium, cells divide in the stem cell compartment, which is located at
the crypt base. From here cells proliferate and migrate up the villi, through a
combination of passive and active migration, until they are shed into the gut lumen
at the top of the villi (Krndija et al., 2019). APC mutations in both mouse and human
lead to loss of directed migration, causing the accumulation of cells in the crypt
region (Dikovskaya et al., 2001; Moss et al., 1996; Näthke et al., 1996; Oshima et
al., 1997; Oshima et al., 1995). Additionally, APC is involved in cell adhesion and
focal adhesion turnover, where APC mutations have been demonstrated to lead to
increased adhesion of colorectal cancer cells (Faux et al., 2004; Juanes et al., 2017).
Focal adhesions link the extracellular matrix (ECM) to the actin cytoskeleton and
thereby anchor cells to the ECM. Therefore, focal adhesions are important for cell-
substrate adhesion and their turnover is also important for cell migration. In order for
cells to migrate properly, focal adhesions constantly have to be disassembled at the
rear and assembled at the front of migrating cells. Microtubules and actin are crucial
for focal adhesion turnover and APC interacts with both of these cytoskeletal
proteins. The binding sites for microtubules and actin are both located in the C-
terminal third of APC, and are lost in colorectal cancer, where APC is mutated and
only N-terminal fragments of APC are expressed. The current model is that during
focal adhesion assembly APC interacts with microtubule plus-end tracking proteins
(+TIPs), forming complexes that are important for the polymerisation of microtubules
(Figure 1.3). Once microtubules capture focal adhesions, APC translocates from
microtubule plus ends to focal adhesions, where it dimerises via C-terminal domains.
This coincides with the transition to focal adhesion disassembly, nucleation of actin
assembly by APC (Figure 1.3, red circles) and +TIP complex disassembly, while
8 microtubules depolymerise (Dikovskaya et al., 2010; Fearnhead et al., 2001; Juanes
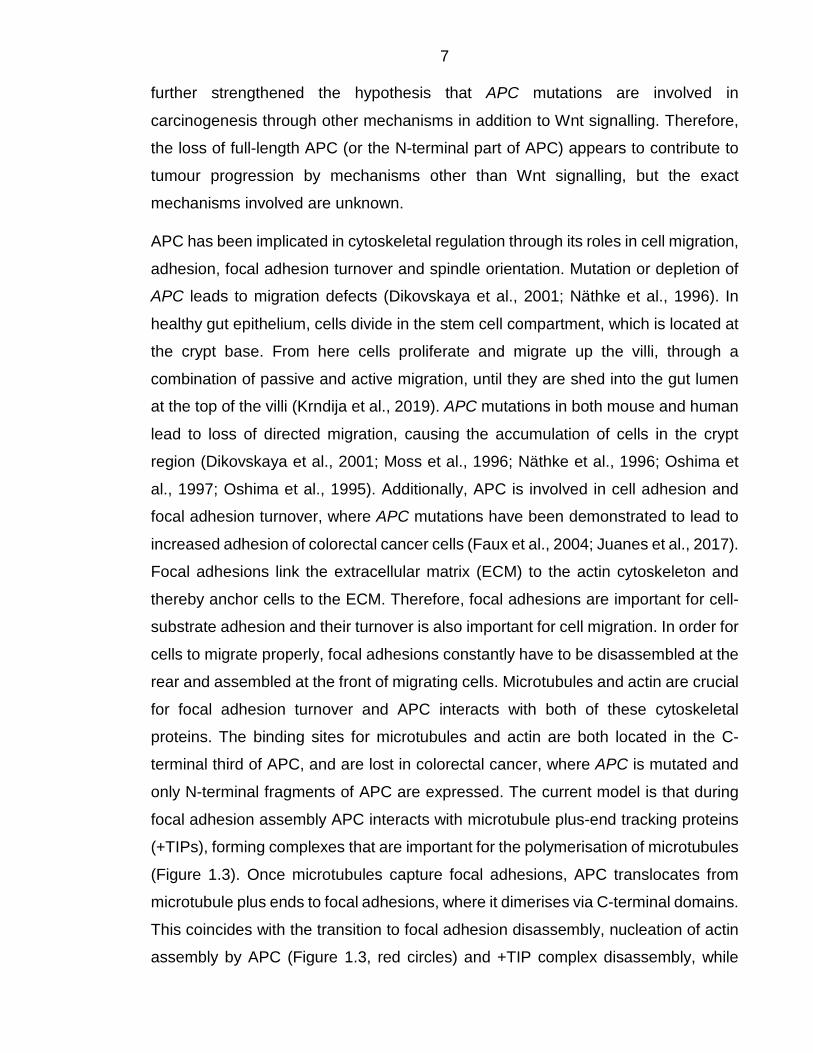
et al., 2017; Nelson and Näthke, 2013). Taking a closer look at focal adhesions, focal
adhesion kinase (FAK) and paxillin localise to the intracellular surface of the plasma
membrane, where they bind to the intracellular domain of integrins, which connect
the cells actin-cytoskeleton to the ECM (Figure 1.3). Paxillin acts as a scaffolding
protein and is important for the recruitment of other proteins (including FAK) to the
plasma membrane. When focal adhesion turnover is impaired, phosphorylation of
paxillin (T118) and of FAK (Y397) are reduced, indicating that FAK and paxillin are
important for focal adhesion turnover. Depletion of APC decreases phosphorylation
of paxillin (T118) and FAK (Y397) and this phenotype can be rescued with full-length
APC (Ezratty et al., 2005; Juanes et al., 2017; Webb et al., 2002). This indicates that
APC might be involved in phosphorylation of paxillin (T118) and FAK (Y397).
Figure 1.3: Schematic of focal adhesion assembly and disassembly. Focal adhesions (FAs) anchor the cell to the ECM. Therefore, FAK and paxillin, which are part of FAs, localise to the intracellular surface of the plasma membrane and bind the cytoplasmic domain of integrins. During FA assembly, APC interacts with microtubule +TIPs. Once microtubules capture FAs, APC translocates to FAs. During FA disassembly, APC dimerizes and nucleates actin assembly (red circles). The microtubule +TIP complex disassembles and microtubules depolymerize. ECM: extracellular matrix; FA: focal adhesion; FAK: focal adhesion kinase; +TIPs: microtubule plus-end tracking proteins. Figure was created with BioRender.com.
Moreover, APC is involved in spindle orientation during mitosis. Depletion of APC
increases spindle misorientation in Drosophila male germline stem cells and in

9 mouse and human stem cells of the small intestine and colon (Carroll et al., 2017;
Dikovskaya et al., 2007; Quyn et al., 2010; Yamashita et al., 2003). APC depletion,
or overexpression of truncated APC leads to mitotic defects including centrosomal
dysfunction, spindle destabilisation, abnormal orientation of kinetochores,
cytokinetic failure, compromised spindle assembly checkpoints resulting from
chromosome segregation errors and increased compaction of mitotic chromatin
(Dikovskaya et al., 2012; Dikovskaya et al., 2010; Dikovskaya et al., 2004;
Dikovskaya et al., 2007; Draviam et al., 2006; Green et al., 2005).
10 MINK1
Investigating the molecular mechanisms supporting the role of APC in cytoskeletal
regulation, our group previously performed a proteomic screen to identify interaction
partners of APC, unrelated to Wnt signalling. Misshapen-like kinase 1 (MINK1), or
mitogen-activated protein kinase kinase kinase kinase 6 (MAP4K6) was identified as
a Wnt signalling-independent interaction partner of APC. We further demonstrated
that APC negatively regulates MINK1 abundance and that this regulation is
evolutionarily conserved (Popow et al., 2019).
MINK1 is part of the Ste20 family of kinases and the germinal centre kinase (GCK)
IV subfamily (Dan et al., 2000; Dan et al., 2001). MINK1 has three ohnologues:
TRAF2 and NCK-interacting protein kinase (TNIK), or mitogen-activated protein
kinase kinase kinase kinase 7 (MAP4K7), mitogen-activated protein kinase kinase
kinase kinase 4 (MAP4K4), or HPK/GCK-like kinase (HGK) and Nik-related protein
kinase (NRK). All three ohnologues of MINK1 are also part of the GCK-IV kinase
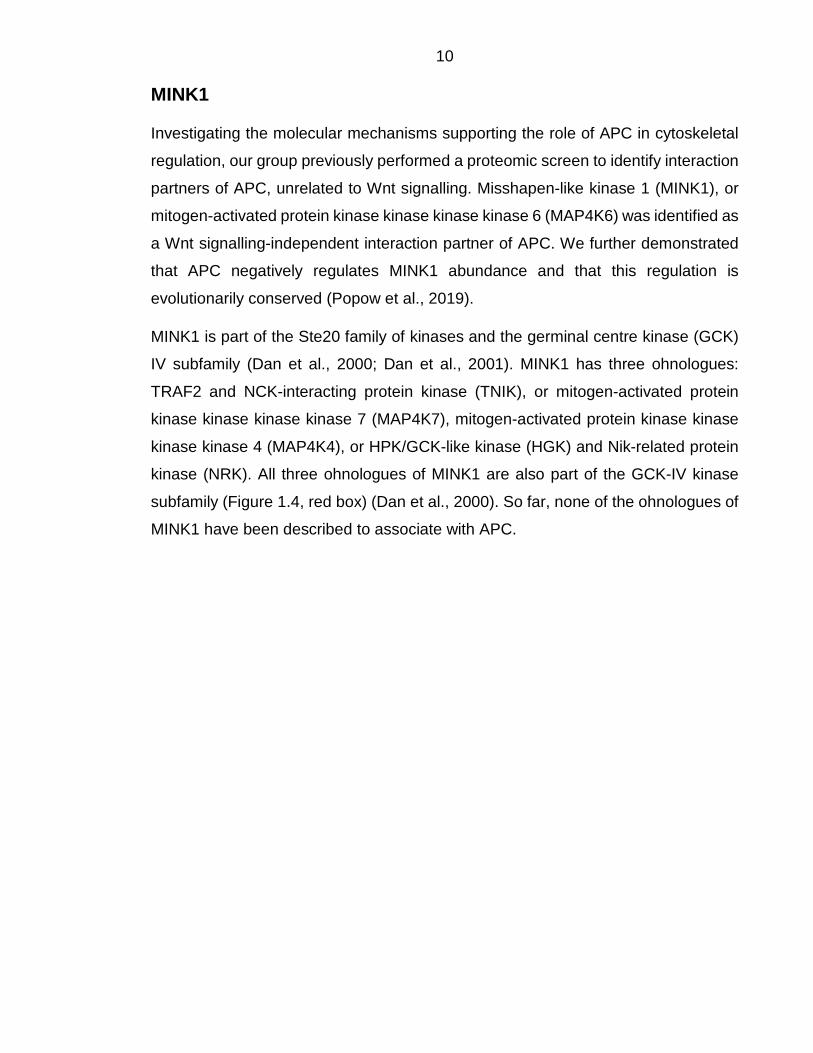
subfamily (Figure 1.4, red box) (Dan et al., 2000). So far, none of the ohnologues of
MINK1 have been described to associate with APC.
11
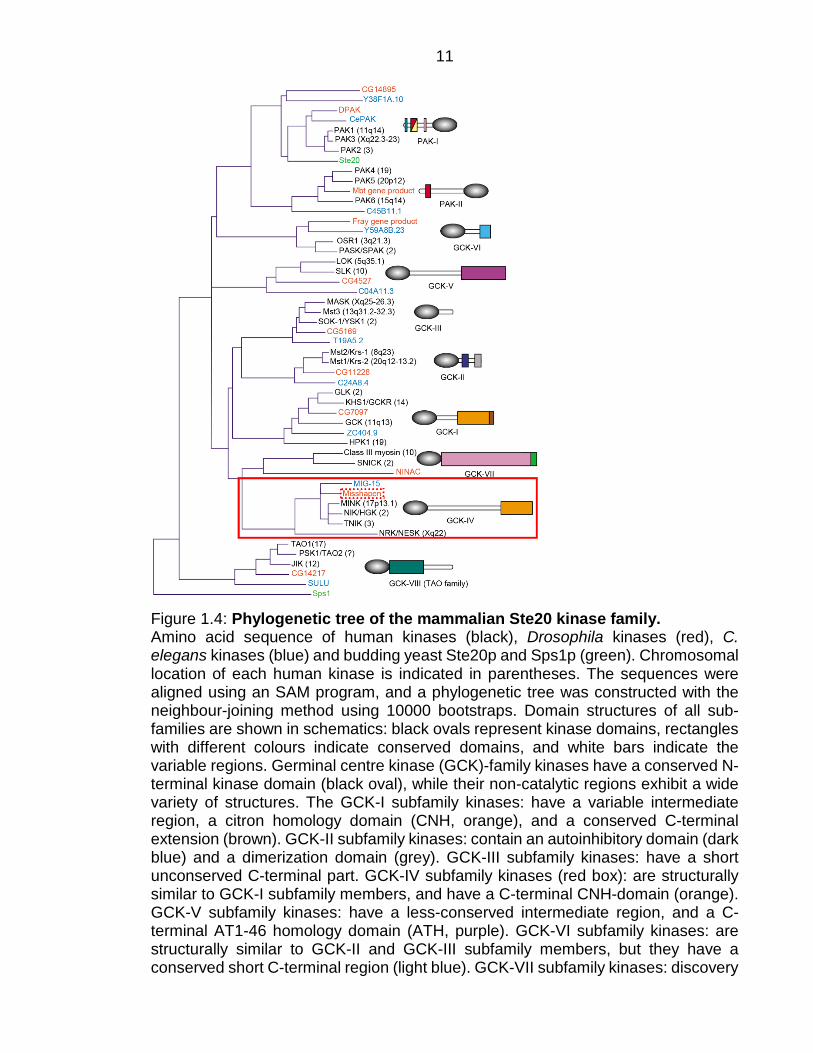
Figure 1.4: Phylogenetic tree of the mammalian Ste20 kinase family. Amino acid sequence of human kinases (black), Drosophila kinases (red), C. elegans kinases (blue) and budding yeast Ste20p and Sps1p (green). Chromosomal location of each human kinase is indicated in parentheses. The sequences were aligned using an SAM program, and a phylogenetic tree was constructed with the neighbour-joining method using 10000 bootstraps. Domain structures of all sub-families are shown in schematics: black ovals represent kinase domains, rectangles with different colours indicate conserved domains, and white bars indicate the variable regions. Germinal centre kinase (GCK)-family kinases have a conserved N-terminal kinase domain (black oval), while their non-catalytic regions exhibit a wide variety of structures. The GCK-I subfamily kinases: have a variable intermediate region, a citron homology domain (CNH, orange), and a conserved C-terminal extension (brown). GCK-II subfamily kinases: contain an autoinhibitory domain (dark blue) and a dimerization domain (grey). GCK-III subfamily kinases: have a short unconserved C-terminal part. GCK-IV subfamily kinases (red box): are structurally similar to GCK-I subfamily members, and have a C-terminal CNH-domain (orange). GCK-V subfamily kinases: have a less-conserved intermediate region, and a C-terminal AT1-46 homology domain (ATH, purple). GCK-VI subfamily kinases: are structurally similar to GCK-II and GCK-III subfamily members, but they have a conserved short C-terminal region (light blue). GCK-VII subfamily kinases: discovery
12 of human class III myosin, an orthologue of NINAC, has given rise to this subfamily which does not have a C. elegans orthologue. SNICK is a putative kinase predicted from human genome sequence. Drosophila NINAC has a Ste20-like kinase domain fused with a myosin head domain (light purple) and a calmodulin-binding domain (green). GCK-VIII subfamily kinases: contain a short less-conserved intermediate region, a long conserved region (dark green), and a C-terminal less-conserved part (Dan et al., 2001). Altered from (Dan et al., 2001). MINK1 marked by dotted red box.
Misshapen (msn) is the only homologue of the ohnologues MINK1, TNIK, MAP4K4
and NRK in Drosophila. The C. elegans homologue of all four ohnologues is
serine/threonine-protein kinase mig-15 (MIG-15). In general, ohnologues are derived
from whole genome duplications (WGD). Vertebrates went through two rounds of
WGD (2R-WGD) during evolution (MacKintosh and Ferrier, 2017; Putnam et al.,
2008). Therefore, there are four possible ohnologues of each gene in the vertebrate
genome. However, for many vertebrate genes some ohnologues were lost during
evolution. It is believed that genes encoding proteins of identical function have
disappeared, whereas ohnologue genes that survived evolved to have different
functions often as a result of small-scale mutations that subsequently led to
differences in expression patterns, altered sites of regulatory post-translational
modifications, or changes in specificities, or affinities of catalytic domains and
interaction interfaces (MacKintosh and Ferrier, 2017). Thus, while sister ohnologues
usually share certain functions, they also have distinct functions or expression
patterns.
13 Misshapen and MIG-15
The functions of MINK1 homologue MIG-15, in C. elegans, and misshapen (msn), in
Drosophila, are likely split between the vertebrate ohnologues, MINK1, TNIK,
MAP4K4 and NRK, with potential overlap, and/or tissue specificity.
C. elegans protein, MIG-15, has been implicated in cell migration of distal tip cells
(CTS) and Q neuroblasts. Mutations in mig-15 reduce the size of Q cell protrusions
during polymerisation and disrupt the maintenance of Q cell polarity (Chapman et
al., 2008; Martynovsky et al., 2012).
The Drosophila homologue of MINK1, msn, is essential for embryogenesis and msn
deletion is embryonic lethal. The name misshapen originates from the msn deletion
phenotype of abnormally shaped photoreceptor cells (Paricio et al., 1999; Su et al.,
1998). Moreover, msn kinase functions upstream of the Drosophila c-Jun N-terminal
kinase (JNK) homologue, basket, and downstream of frizzled and dishevelled
(Drosophila homologue of DVL) and has therefore been linked to the planar polarity
pathway, explaining its embryonic lethality. Both deletion and overexpression of msn
lead to epithelial planar polarity defects (Paricio et al., 1999).
Msn has also been linked to cell migration through regulation of E-cadherin,
integrins, the ERM (ezrin, radixin and moesin) protein moesin and myosin-II. Moesin
is the only ERM protein expressed in Drosophila. Drosophila border cells are somatic
cells that are part of the follicular epithelium and expression of E-cadherin is involved
in the transition of follicle cells to migratory border cells, which collectively migrate
through the egg chamber (Bai et al., 2000; Niewiadomska et al., 1999). Msn is
involved in regulation of E-cadherin expression levels and its localisation in border
cells (Cobreros-Reguera et al., 2010). In follicle cell, msn is also involved in the
regulation of adhesion to the basement membrane, through down regulation of
integrin levels (Lewellyn et al., 2013). Additionally, msn regulates protrusion
restriction through phosphorylation of moesin on its activating phosphosite (T556).
Msn also regulates myosin-II activity, and thereby cortical stiffness. The regulation
of both Moesin and myosin-II activity implicate msn in collective cell migration in
Drosophila border cells (Plutoni et al., 2019).

14 Msn is the only homologue of MINK1 in Drosophila and, therefore, might give some
indication for MINK1 functions in mammals; however, msn is the homologue of all
four mammalian ohnologues MINK1, TNIK, MAP4K4 and NRK. Thus, the functions
of msn are likely distributed between the ohnologues.
15 Protein kinases
MINK1, its ohnologues TNIK, MAP4K4 and NRK, and their homologues msn and
MIG-15 are all protein kinases. In general, protein kinases are instrumental for the
transduction of signals from extracellular to intracellular compartments, and also
within intracellular compartments. Nearly all cellular processes are controlled
through phosphorylation by kinases and dephosphorylation by phosphatases,
including metabolism, growth, division, differentiation, motility, trafficking, membrane
transport and immunity. Both protein kinases and protein phosphatases are
phosphotransferases with opposing functions: kinases catalyse the transfer of the γ-
phosphate of ATP (or GTP) usually to the hydroxyl group of tyrosine, serine, or
threonine residues of their substrates. Phosphatases dephosphorylate
phosphoproteins by catalysing the transfer of the phosphate to a water molecule.
Phosphorylation is the most common type of post-translational modification, and
more than 30% of cellular proteins are regulated by it. Protein kinases can be highly
specific, but many kinases are promiscuous and act on multiple substrates (Cohen,
2000; Manning et al., 2002a; Manning et al., 2002b; Ubersax and Ferrell Jr, 2007).
Furthermore, phosphorylation can have a range of effects on proteins, which can be
divided into four groups: 1) Phosphorylation of enzymes can affect their sensitivity
towards effectors and their affinity for substrates, or ligands; 2) Protein
phosphorylation can affect interactions between proteins and can even be required
for protein-protein interaction; 3) Phosphorylation can affect subcellular localisation;
4) Protein phosphorylation can affect protein degradation. Additionally, some
phosphorylation events may not have a function at all, these phosphorylation events
are called silent phosphorylations (Rider et al., 2009).
16 MINK1 and its ohnologues
The protein kinases MINK1, TNIK, MAP4K4 and NRK are all members of the GCK-
IV kinase subfamily. All members of this subfamily share the same three-domain
structure, consisting of an N-terminal kinase domain, a large intermediate linker
domain and a C-terminal citron homology (CNH) domain (Dan et al., 2000) (Figure
1.4 and Figure 1.5). Out of the four ohnologues, TNIK and MINK1 show the highest
sequence homology and are therefore most closely related. MAP4K4 is the next
closest relative to the two, and NRK is most different from its sister ohnologues (Dan
et al., 2000). So far, the protein structure of MINK1 was not solved, but structures
for the kinase domains of its ohnologues, TNIK (Feng et al., 2019; Masuda et al.,
2016a; Read; Vollmar et al.) and MAP4K4 (Ammirati et al., 2015a; Crawford et al.,
2014; Feng et al., 2019; Ndubaku et al., 2015; Schröder et al., 2015; Wang et al.,
2014), give closer insight into their structure. The ohnologues share the highest
sequence similarities in the kinase- and CNH domains, while their linker domains
are more diverse (Dan et al., 2000) and also disordered, while the kinase- and CHN-
domains are more ordered (Figure 1.5A). The N-terminal domain of MINK1 confers
its kinase activity (Dan et al., 2000). CNH domains were first described in citron Rho-
interacting kinase, giving rise to their name (Di Cunto et al., 1998), and are involved
in protein-protein interactions (Hu et al., 2004). The CNH domains of MINK1, TNIK
and MAP4K4 are important for the interaction with the small GTP-binding protein
Rap2 (Machida et al., 2004; Meng et al., 2018; Taira et al., 2004). The function of
the linker domain is least well understood. MINK1, TNIK and MAP4K4 are
ubiquitously expressed in most tissues, while the most distinct ohnologue, NRK, is
mostly expressed in ovaries, placenta and tissues of the male reproductive system
(Uhlén et al., 2015). The potential compensation of MINK1 and its ohnologues for
one another was described in Tnik deletion mice, where Tnik deletion caused
transcriptional upregulation of Mink1 and Nrk by 2.8- and 1.2-fold respectively, while
Nik (the mouse homologue of MAP4K4) expression remained unchanged (Masuda
et al., 2016b). This is consistent with the idea that sister ohnologues share some
functions, while they likely also have distinct functions.
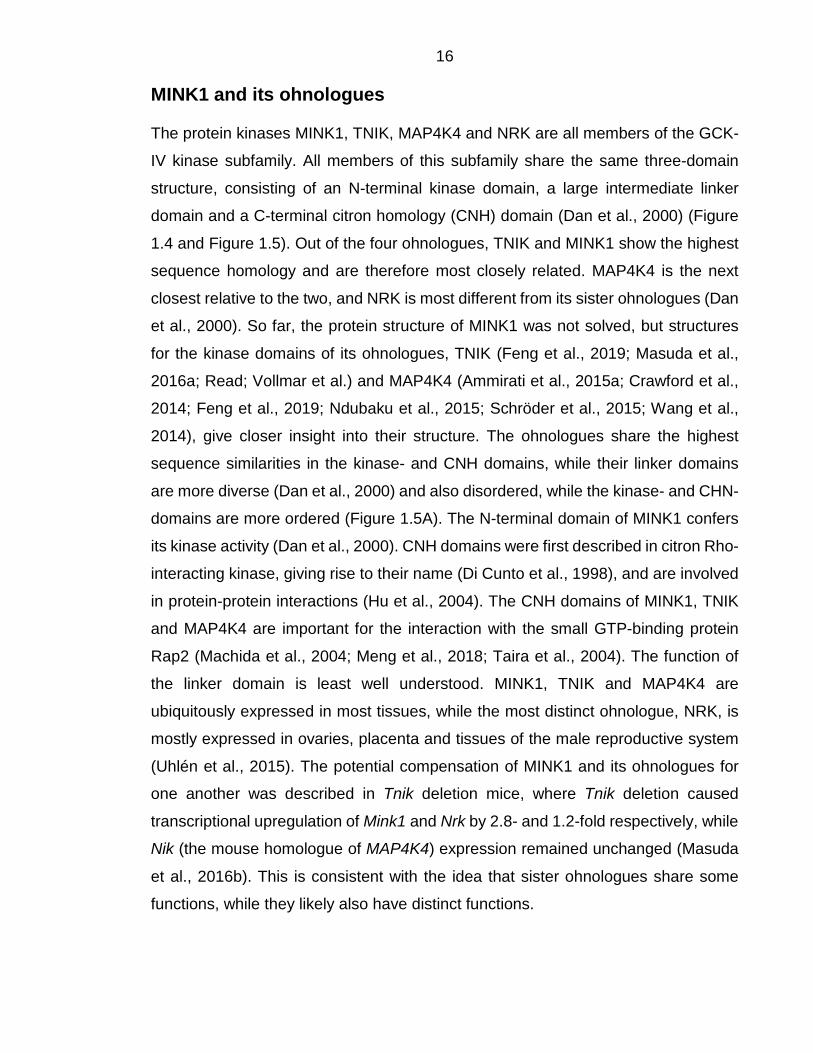
17
Figure 1.5: MINK1 domain structure. The MINK1 protein kinase consist of 1332 amino acids (aa) and has a predicted mass of 149.8 kDa. The N-terminal kinase domain stretches from aa 25-289 and the citron homology (CNH)-domain from aa 1019-1306. A MINK1 intrinsic protein disorder, domain and globularity prediction plot, generated with GlobPlot2 (Linding et al., 2003). B Schematic of the domain structure of MINK1 and all other germinal centre kinase (GCK)-IV kinase subfamily members.
One overlapping function between MINK1 (MAP4K6) and its ohnologues, MAP4K4
and TNIK (MAP4K7) has been described in Hippo signalling, where
MAP4K1/2/3/4/6/7 directly activate large tumour suppressor 1/2 (LATS1/2), and
therefore, function in parallel to mammalian Ste20-like kinases 1/2 (MST1/2). The
deletion of all MAP4Ks and MST1/2 together completely suppresses LATS1/2
phosphorylation. Therefore, MAP4Ks have recently been added to the expanded
Hippo pathway (Meng et al., 2015). In another overlapping function, MINK1, TNIK
and MAP4K4 have all been demonstrated to activate the JNK pathway through

18 phosphorylation of either JNK1 (MINK1 and MAP4K4) or JNK2 (TNIK) after co-
transfection in mammalian cell lines (Dan et al., 2000; Fu et al., 1999; Lim et al.,
2003; Yao et al., 1999). This is also in line with the theory that sister ohnologues
have both shared and distinct functions.

19 MINK1
Potentially distinct functions of MINK1 kinase have been studied in different cell
types and cell lines. However, there is no comprehensive understanding of the
biological function(s) of MINK1, so far. It has been demonstrated in epithelial MCF7
cells that MINK1 affects the subcellular localisation of β‐catenin. β‐catenin is
important for cell-cell adhesion (Hu et al., 2004). In adherents junctions, β‐catenin
links membrane-bound E-cadherin to α-catenin, and thereby to the actin-
cytoskeleton. Overexpression of MINK1 decreased membrane localisation of β‐
catenin, whereas kinase-inactive MINK1 mutants enhanced adhesion to
extracellular matrix and promoted cell-cell adhesion (Alpha S. Yap et al., 1997; Hu
et al., 2004). Moreover, MINK1 has been demonstrated to interact with the
transcription factor (TCF) 4 in HCT-116 and DLD1 cells (Shitashige et al., 2008).
Additionally, MINK1 kinase activity has been linked to cell migration. Expression of
kinase-inactive mutants of MINK1 (K54R) decreased cell motility and cell invasion
(Hu et al., 2004).
Multiple studies have also investigated how the activation of MINK1 kinase is
regulated. It has been proposed that MINK1 may interact with itself, either by forming
intermolecular dimers or intramolecularly folding to enable interaction of the kinase
domain with the CNH domain (Lim et al., 2003). Similarly, it has been proposed that
MINK1 can interact with TNIK in the same way (Mikryukov and Moss, 2012). Both
studies also proposed the hypothesis that releasing the interaction between kinase-
and CNH domain leads to activation of the kinase activity of the protein(s).
Additionally, it has been speculated that the phosphorylation of the linker domain
might lead to a conformational change that disrupts the interaction between kinase-
and CHN domain and activates MINK1 kinase (Lim et al., 2003).
Moreover, regulation of MINK1 by RAS signalling has also been suggested.
Activating mutations in RAS oncogenes are found in a third of all human tumours. It
was demonstrated in ovarian epithelial cells that RAS activates MINK1 via the
Raf/MEK/ERK signalling pathway and, in turn, MINK1 upregulates the activity of the
stress kinase p38 through MAP3K5/8 and MKK3/6, which finally leads to an
induction of p21WAF1/CIP1 and permanent cell cycle arrest, independent of p53. In this
20 study, in HOSE cell, MINK1 was proposed to have a tumour suppressor function and
to be involved in the growth-arrest and senescent-like phenotype of these cells as a
target of Ras signalling (Nicke et al., 2005).
One function that distinguishes MINK1 from its ohnologues is its interaction with the
core planar cell polarity (PCP) protein Prickle1. In HEK293 cells, Prickle1 interacts
with MINK1, but not with MAP4K4, or TNIK. MINK1 binds to and phosphorylates
Prickle1 at T370 in vitro, which is important for proper Prickle1 localisation at the
plasma membrane (Daulat et al., 2012). These findings are in agreement with
another study in Xenopus, demonstrating that MINK and TNIK activate PCP
signalling (Mikryukov and Moss, 2012). However, in mammals the interaction with
Prickle1 appears to be specific to MINK1 (Daulat et al., 2012).
Moreover, MINK1 was shown to be highly expressed in brain tissue and both MINK1
and TNIK play important roles in neurons. They are required for dendritic branching
and the expression of α-amino-3-hydroxy-5-methyl-4-isoxazolepropionic acid
(AMPA) receptors (Hussain et al., 2010). AMPA receptors are important for
neurotransmission in the mammalian central nervous system, and they are enriched
in the postsynaptic membrane on dendritic spines. AMPA receptors are highly
dynamic and their number, subunit composition, phosphorylation state and
interacting proteins can change to affect their activity (Chater and Goda, 2014).
While the function of MINK1 in dendritic cells is dependent on the activity of the small
GTPase Rap2, TNIK functions independent of Rap2. MINK1 was found to
antagonise Rap2, which stimulates dendritic pruning, reduces synaptic density and
causes removal of synaptic AMPA receptors. Therefore, MINK1 was proposed to
play a critical role in maintaining morphological and synaptic functions of dendrites
(Hussain et al., 2010).
21 MINK1 and APC in STRIPAK complexes
In another example, MINK1 kinase is phosphorylated by CDK1 and PLK1 during
mitosis in HeLa cells. So far, the exact sites which are phosphorylated by CDK1 and
PLK1 have not been identified (Hyodo et al., 2012). Moreover, MINK1 depletion
induces defects in abscission and results in multinucleated cells. MINK1 interacts
with striatin-4 (STRN4), which is part of striatin-interacting phosphatase and kinase
(STRIPAK) complexes (Hyodo et al., 2012). In general, striatin proteins organise
multiple signalling complexes by forming STRIPAK complexes (Hwang and Pallas,
2014). The proteins, striatin (STRN), S/G2 nuclear autoantigen (STRN3) and zinedin
(STRN4) represent the striatin protein family (Benoist et al., 2006). All striatin
proteins have four conserved protein-protein interaction domains, a caveolin-binding
domain, a Ca2+-calmodulin-binding domain, a coiled-coil domain and a tryptophan-
aspartate (WD)-repeat domain. All striatin family members function as scaffolding
proteins, lack catalytic activity and are regulatory or targeting subunits (B subunits)
of the serine/threonine-protein phosphatase 2A (PP2A) (Hwang and Pallas, 2014;
Moreno et al., 2000). STRIPAK complexes are involved in a range of cellular
processes and signalling pathways, including cell cycle control, apoptosis, vesicular
trafficking, Golgi assembly, cell polarity, cell migration, neural and vascular
development, and cardiac function. Additionally, STRIPAK complexes have been
linked to clinical conditions and diseases, including cardiac disease, diabetes,
cancer, autism, and cerebral cavernous malformation (Hwang and Pallas, 2014). In
general, mammalian STRIPAK complexes consist of five core components: PP2A
A- and C subunits, monopolar spindle-one-binder family 3 (MOB3), a GCK-III
subfamily kinase, cerebral cavernous malformation 3 (CCM3) protein, and striatin
interacting proteins 1 and 2 (STRIP1/STRIP2) (Goudreault et al., 2009; Kean et al.,
2011). Distinct STRIPAK complexes are formed by the core complex binding to
additional, distinct proteins (Hwang and Pallas, 2014). MINK1 is part of a STRIPAK
complex and interacts with STRN4. MINK1 is important for cytokinesis and the
depletion of either MINK1 or STRN4 in HeLa cells leads to an abscission defect and
multinucleated cells. Therefore, the negative regulation of MINK1 by STRN4-
associated PP2A might be required for successful abscission during cytokinesis
(Hyodo et al., 2012). Further evidence that PP2A is important for MINK1
22 dephosphorylation stems from the observation that MINK1 phosphorylation is
increased during mitosis, while PP2A is inhibited (Wurzenberger and Gerlich, 2011).
Immunoprecipitation from 293T cells indicates that TNIK and MAP4K4 also interact
with STRN4 (Hyodo et al., 2012). SV40 small T antigen (ST) expression increased
interactions of MAP4K4 and STRIPAK complex. MAP4K4 has been proposed as a
key PP2A substrate, necessary for cell transformation, based on the observation
that partial knock-down of MAP4K4 or inhibition of its kinase activity abolished the
need for ST in cell transformation. Likewise, partial (but not complete) knock-down
of PP2A Aα and Cα subunits leads to transformation. ST most likely promotes the
interaction of the STRIPAK complex with MAP4K4 and thereby decreases MAP4K4
kinase activity (Kim et al., 2020).
APC has also been shown to be part of a STRIPAK complex, where it acts as the
distinct protein. In this case the armadillo repeat domain of APC interacts with the
WD-repeat of all three striatin family members, STRN, STRN3 and STRN4. Striatin
and APC co-localise with zonula occludens (ZO)-1 protein in epithelial tight junction
compartments in epithelial (MDCK, CACO-2 and CFPAC-1) cells and in neurite tips
of PC12 cells. This co-localisation of APC and striatin is actin-dependent (Breitman
et al., 2008).
In general, STRIPAK complexes are important for the regulation of PP2A activity
toward specific substrates. The hypothesis that STRIPAK complexes serve as an
organising scaffold to bring substrates, such as MAP4K4 or MINK1, in contact with
PP2A is supported by the observation that PP2A substrate specificity can be
achieved in part through the specific interactions with distinct B subunits. Moreover,
phosphatase PP2A subunits are often mutated in human cancers, where the partial
loss of PP2A function contributes to cell transformation. Therefore, PP2A has tumour
suppressor activity (Kim et al., 2020).
23 MINK1 in mouse models
To investigate the function of MINK1 in vivo, several Mink1 knockout mice have been
generated. A whole body Mink1 knockout mouse used the Ella-Cre promotor, which
targets the expression of Cre recombinase to early mouse embryos (The Jackson
Laboratory, 2019). In mice, the MINK1 gene spans 34 exons. In this knockout
mouse, exons 3 and 4 were deleted, which leads to deletion of sequence domains
in the kinase domain of the MINK1 protein. Three publications reporting data
generated using these mice are available. In the first paper, the role of MINK1 in
blood homeostasis was investigated to demonstrate that MINK1 is involved in the
regulation of platelet function, haemostasis and thrombus formation (Yue et al.,
2016). A second study demonstrated that MINK1 suppresses the induction of T
helper type 17 (Th17) cells and also showed that MINK1 inhibits SMAD2 activation
by direct phosphorylation of SMAD2 on its T324 residue (Fu et al., 2017). In this
paper, the authors also verified that the entire MINK1 protein not just the kinase
domain was deleted (this was not verified in the first paper), using an antibody
against the linker domain of MINK1 consistent with the conclusion that these mice
are indeed true Mink1 knockouts. A third paper demonstrated that MINK1 acts as a
regulator of TGFβ/SMAD2 signalling, showing a stronger phosphorylation of SMAD2
by TGFβ in Mink1 knockout than in control mice. This study claims that in joints of
aging mice, Mink1 knockout protects cartilage from degeneration through increased
SMAD2 activation in chondrocytes (Yu et al., 2019). More recently, an intestinal
epithelium specific Mink1/Map4k4/Tnik triple knockout mouse was generated (Li et
al., 2019). To generate this mouse a conditional Mink1 knockout mouse was crossed
with a VillinCre mouse, a conditional Map4k4 knockout mouse and a conditional Tnik
knockout mouse. The VillinCre promotor was used to make this triple knockout
specific to the intestinal epithelium. Only older intestinal epithelial-specific
Mink1/Map4k4/Tnik triple knockout animals displayed a mild phenotype, with
increased proliferation in the lower gastrointestinal tract. MAP4Ks have been
implicated in Hippo signalling, where they activate LATS1/2 (Meng et al., 2015).
Therefore, the expression of Hippo pathway target genes was assessed in intestinal
epithelial-specific Mink1/Map4k4/Tnik triple knockout mice. Older mice displayed a
small increase in Sox9, while other Hippo pathway target genes remained
24 unchanged (Li et al., 2019). This is in line with previous findings, showing that only
the deletion of MAP4K1/2/3/4/6/7 and MST1/2 together completely suppresses
LATS1/2 phosphorylation and therefore Hippo pathway target gene expression
(Meng et al., 2015). Studies using Mink1 deletion mice show that these mice are
viable and do not have a severe phenotype. Moreover, MINK1 protein might have
different roles in different tissues. Together, studies of the different knockout mice
also indicate that the deletion of MINK1 does not lead to a drastic phenotype in the
intestinal epithelium. However, APC mutation leads to increased MINK1 protein
levels (Popow et al., 2019), therefore the question remains whether MINK1
contributes to the colorectal cancer phenotype caused by APC mutations. To
investigate this, the function of endogenous MINK1 and the phenotype caused by its
overexpression need to be investigated and compared.
25 TNIK
TNIK is the most closely related ohnologue of MINK1. It is directly involved in Wnt
signalling, where it phosphorylates and activates the transcription factor TCF4
(Mahmoudi et al., 2009; Shitashige et al., 2010). While TNIK, MINK1 and MAP4K4
are expressed in mouse intestinal crypts, mass spectrometry data indicated that
TNIK is the only one of the ohnologues that interacts with TCF4, suggesting this to
be a distinct function of TNIK. When Wnt signalling is activated through the
interaction between Wnt ligands and their receptors, β-catenin is stabilised,
accumulates in the cytoplasm and enters the nucleus where it interacts with
TCF/LEF transcription factors (Figure 1.2). In response to overactivation of Wnt
signalling, such as results from APC mutations in colorectal cancer, the TCF4/β‐
catenin complex is constitutively present (Bienz and Clevers, 2000; Korinek et al.,
1997; Morin et al., 1997). TNIK interacts with both β‐catenin and TCF4 in nuclei of
cells of mouse intestinal crypts, and is crucial for the phosphorylation and thus
activation of TCF4. TNIK binds β-catenin through its unconserved linker domain,
leading to activation of TCF4 (Mahmoudi et al., 2009). The involvement of TNIK in
Wnt signalling, and the importance of APC as a scaffolding protein for the assembly
of the key regulatory protein complex in Wnt signalling, prompted the generation of
Tnik knockout mice crossed to Min mice to determine the role of TNIK in
tumorigenesis in this model. Tnik-/-/ApcMin/+ mice develop fewer intestinal tumours
than ApcMin/+ mice (Masuda et al., 2016b). Moreover, removing Tnik on its own in
mice rendered them less prone to intestinal tumours when treated with cancer
inducing chemicals (Coba et al., 2012; Masuda et al., 2016b). This indicates that
TNIK contributes to carcinogenesis.
TNIK has also been implicated in cognitive disorders. Tnik deleted mice show
cognitive deficits, and TNIK has been implicated in post-synaptic signalling in the
nervous system (Coba et al., 2012). A recent study also demonstrated that the
scaffold protein connector enhancer of kinase suppressor of Ras2 (CNK2) directs
the subcellular localisation of TNIK in neurons (Zieger et al., 2020). Loss of function
mutations in connector enhancer of kinase suppressor of Ras 2 (CNK2) have been
shown to cause X-linked intellectual disability (XLID) and CNK2 binds both TNIK and
MINK1. TNIK and MINK1 did not interact with the ubiquitously expressed CNK1, but
26 with CNK2 which is enriched in the brain (Uhlén et al., 2015; Zieger et al., 2020). In
experiments from Zieger et al., CNK2 alone was localised at the membrane, whereas
TNIK and MINK1 alone did not localise at the membrane. Co-expression of TNIK or
MINK1 and CNK2 led to localisation of TNIK and MINK1 to the membrane.
Therefore, the interaction between TNIK and CNK2 facilitated TNIK membrane
localisation and the same was true for CNK2 and MINK1 (Zieger et al., 2020).
Moreover, successful co-immunoprecipitation experiments with N-terminally
truncated MINK1 (aa 534-1301) and CNK2 implicate the CNH domain (aa 1019-
1306) in this protein-protein interaction.
27 MAP4K4
Some functions of the Drosophila homologue msn have also been found for MAP4K4
in mammals. Similar to msn deletion in Drosophila, homozygous Map4k4 deletion in
mice is embryonic lethal, due to migration defects (Vitorino et al., 2015; Xue et al.,
2001). MAP4K4 has been implicated in focal adhesion disassembly and thereby cell
migration in both epithelial and endothelial cells (Vitorino et al., 2015; Yue et al.,
2014).
In epithelial cells of the skin, MAP4K4 associates with microtubules and depletion of
MAP4K4 leads to stabilisation of focal adhesions, and therefore, to impaired cell
migration (Yue et al., 2014). MAP4K4 binds to end-binding 2 (EB2) and IQ motif and
SEC7 domain-containing protein 1 (IQSEC1). IQSEC1 is a guanine nucleotide
exchange factor (GEF) with specificity for the small GTPase ADP-ribosylation factor
6 (Arf6) that is involved in endocytosis and vesicle recycling (D'Souza-Schorey and
Chavrier, 2006; Someya et al., 2001). Arf6 regulates internalisation and trafficking of
membrane adhesion proteins including integrin at focal adhesions, and thereby
impacts cell migration and division (Schweitzer et al., 2011). Consequently, depletion
of IQSEC1 leads to accumulation of integrin receptors on the cell surface and
stabilises cell adhesions and their link to the extracellular matrix (Dunphy et al.,
2006). There are three microtubule end-binding proteins in mammalian cells, EB1,
EB2 and EB3. EB1 and EB3 are +TIPs and regulate microtubule dynamics. EB2 is
not directly involved in microtubule dynamics (Akhmanova and Steinmetz, 2008;
Komarova et al., 2009), but important for initial microtubule reorganization during
epithelial polymerisation (Goldspink et al., 2013). Wound healing experiments on
conditional skin-specific Map4k4 knockout mice and primary keratinocytes
demonstrated that MAP4K4 is important for cell migration of keratinocytes.
Moreover, assembly and disassembly rates of focal adhesions are decreased upon
Map4k4 depletion compared to wild-type cells. MAP4K4 interacts with microtubules
through EB2 and the kinase domain of MAP4K4 is important for its role in focal
adhesion disassembly (Yue et al., 2014). MAP4K4 is also important for endothelial
cell migration. Similar to msn in Drosophila, homozygous Map4K4 knockout
(Map4K4-/-) is embryonic lethal in mice, due to migration defects of mesodermal and
endodermal cells of the primitive streak, which prevents these cells from migration
28 to their correct location. Therefore, somite and hindgut development are impaired in
Map4k4-/- embryos. Additionally, vascular development in embryos of conditional
endothelial-specific Map4k4 knockout mice is delayed. Tamoxifen inducible
homozygous Map4k4 knockout mice were used to further investigate the function of
MAP4K4 in vivo. Cell numbers and proliferation of endothelial cells of homozygous
conditional Map4k4 knockout mice and inducible homozygous Map4k4 knockout
mice was comparable to wild-type mice, but in both cases endothelial cell migration
was impaired. Another similarity between MAP4K4 and msn could be found in
activating phosphorylation of moesin. Msn was demonstrated to activate Moesin in
Drosophila border cells (Plutoni et al., 2019) and MAP4K4 in endothelial HUVEC
cells (Vitorino et al., 2015). Moreover, MAP4K4 promotes focal adhesion
disassembly in retraction fibres. Therefore, MAP4K4 phosphorylates moesin, which
in turn inactivates integrin by competing with talin, which leads to focal adhesion
disassembly and membrane retraction (Vitorino et al., 2015). Another study
demonstrated that MAP4K4 directly phosphorylates all three ERM proteins (ezrin,
radixin and moesin) on their activating phosphosites (T567, T564, and T558,
respectively) in in vitro kinase assays. ERM proteins are involved in the regulation
of membrane protrusions and cell-substrate adhesion and contribute to cell shape
(Crepaldi et al., 1997). Moreover, MAP4K4 controls growth factor-induced
membrane protrusions and cell morphology through direct phosphorylation of ERM
proteins. MAP4K4 is important for the regulation of lamellipodium formation, through
interaction with the N-terminus of ezrin, and expression of MAP4K4 kinase-dead
mutants and MAP4K4 depletion inhibits lamellipodium extension (Baumgartner et
al., 2006). Likewise, MINK1 could phosphorylate a moesin peptide on the moesin
activating phosphosite (T558) in an in vitro kinase assay (Popow, 2016).
29 ERM proteins
ERM (ezrin, radixin and moesin) proteins are potential substrates for MINK1 kinase.
This was demonstrated in a previous study that identified an ERM peptide around
the activation site of human moesin (R550LGRDKYKTLRQIRQ564), as the best
substrate for GST-tagged MINK1 kinase domain out 43 tested peptide substrates in
an in vitro kinase assay (Popow, 2016).
There are three homologues ERM proteins in mammals: ezrin, radixin and moesin.
In general, ERM proteins are widely expressed in all tissues, however they are
differentially expressed in different tissues, while ezrin is predominantly expressed
in epithelial cells, moesin performs similar functions in endothelial cells. ERM
proteins have related, overlapping function and are involved in processes, including
embryogenesis and mitosis (Berryman et al., 1993; McClatchey, 2014). All three
ERM proteins have three domains: an N-terminal globular FERM (F for 4.1 protein,
E for ezrin, R for radixin and M for moesin) domain, an α-helical domain, followed by
a small linker region, and a C-terminal carboxy-terminal ERM-associated domain (C-
ERMAD), which contains the F-actin binding site. In general, ERM proteins are
essential linker between the plasma membrane and the cytoskeleton. The N-terminal
FERM domain of ERM proteins interacts with phospholipids and proteins of the
plasma membrane, and the C-terminal F-actin binding site of ERM proteins interacts
at the same time with cortical actin. ERM proteins are activated through
phosphorylation of a conserved threonine residue, T567/T564/T558 (ezrin/radixin/
moesin respectively), which is located within the F-actin binding site (Bretscher et
al., 2002; McClatchey, 2014; Pelaseyed and Bretscher, 2018) and the activating
phosphorylation initiates a conformational change that allows ERM proteins to bind
F-actin (Figure 1.6) (Fehon et al., 2010; Pelaseyed and Bretscher, 2018). Cycling
between the phosphorylated and de-phosphorylated state is essential for ERM
activity (Roubinet et al., 2011; Viswanatha et al., 2012). In the inactive (closed)
conformation, the FERM binds to the C-ERMAD masking both the membrane
binding sites and the F-actin binding site (Clucas and Valderrama, 2015; Pelaseyed
and Bretscher, 2018). In the open confirmation, ERM proteins bind to phospholipid
phosphatidylinositol 4,5-bisphosphate (PI(4,5)P2), or to the PDZ domains (protein-
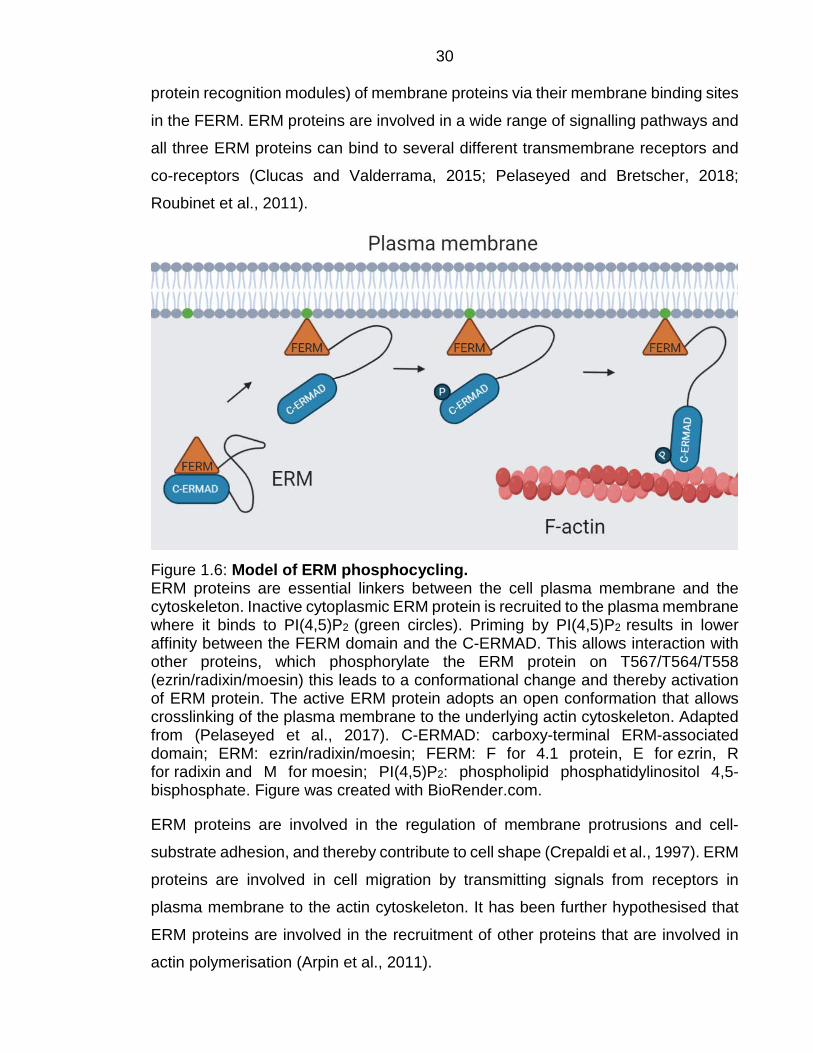
30 protein recognition modules) of membrane proteins via their membrane binding sites
in the FERM. ERM proteins are involved in a wide range of signalling pathways and
all three ERM proteins can bind to several different transmembrane receptors and
co-receptors (Clucas and Valderrama, 2015; Pelaseyed and Bretscher, 2018;
Roubinet et al., 2011).
Figure 1.6: Model of ERM phosphocycling. ERM proteins are essential linkers between the cell plasma membrane and the cytoskeleton. Inactive cytoplasmic ERM protein is recruited to the plasma membrane where it binds to PI(4,5)P2 (green circles). Priming by PI(4,5)P2 results in lower affinity between the FERM domain and the C-ERMAD. This allows interaction with other proteins, which phosphorylate the ERM protein on T567/T564/T558 (ezrin/radixin/moesin) this leads to a conformational change and thereby activation of ERM protein. The active ERM protein adopts an open conformation that allows crosslinking of the plasma membrane to the underlying actin cytoskeleton. Adapted from (Pelaseyed et al., 2017). C-ERMAD: carboxy-terminal ERM-associated domain; ERM: ezrin/radixin/moesin; FERM: F for 4.1 protein, E for ezrin, R for radixin and M for moesin; PI(4,5)P2: phospholipid phosphatidylinositol 4,5-bisphosphate. Figure was created with BioRender.com.
ERM proteins are involved in the regulation of membrane protrusions and cell-
substrate adhesion, and thereby contribute to cell shape (Crepaldi et al., 1997). ERM
proteins are involved in cell migration by transmitting signals from receptors in
plasma membrane to the actin cytoskeleton. It has been further hypothesised that
ERM proteins are involved in the recruitment of other proteins that are involved in
actin polymerisation (Arpin et al., 2011).
31 Lymphocyte-oriented kinase (LOK), also known as serine/threonine-protein kinase
10 (STK10) and STE20-like serine/threonine-protein kinase (SLK) are major
upstream kinases activating ezrin in epithelial cells (Pelaseyed and Bretscher, 2018;
Viswanatha et al., 2012). Both, LOK and SLK, are part of the Ste20 kinase family
and GCK-V subfamily (Dan et al., 2001). SLK directly phosphorylates all three ERM
proteins in epithelial (HeLa) cells and is important for ERM localisation at the mitotic
cortex (Machicoane et al., 2014). Phosphocycling is important for ERM function and
leads to frequent oscillating conformational changes between open and closed
confirmation. Decoupling of ezrin phosphocycling leads to the loss of its polarised
distribution to the apical membrane. Depletion or over-activation of ERM proteins
leads to spindle misorientation. Likewise deletion of SLK in mouse embryos leads to
spindle misorientation in neocortical progenitors (Machicoane et al., 2014). In
general spindle orientation during cell division requires precise mechanic forces to
align the mitotic spindle along the expected axis. Therefore, force generators have
to localise properly at the mitotic cortex. ERM proteins act in parallel to Gαi and both
are essential for proper leucine-glycine-asparagine receptor protein (LGN)
polarisation which in turn is important for nuclear mitotic apparatus (NuMA)
polarisation. Thereby, both ERM proteins and Gαi are critical for correct localisation
of the LGN-NuMA force generator complex. For their role in spindle orientation, ERM
proteins are phosphorylated by SLK (Machicoane et al., 2014). LOK is localised at
the microvilli of epithelial cells. Inactive cytoplasmic ezrin binds to PI(4,5)P2 on the
membrane with its FERM domain, which lowers the affinity between its FERM and
C-ERMAD. LOK binds to ezrin with its C-terminal AT1-46 homology domain (ATH)
and phosphorylates ezrin on its T567 activation site in the C-ERMAD. The activation
and conformational change of ezrin allow it to bind F-actin and thereby crosslink the
plasma membrane to the underlying actin cytoskeleton (Pelaseyed and Bretscher,
2018; Pelaseyed et al., 2017). ERM proteins are involved in mitosis, in both
Drosophila and mammals. Moesin is the only ERM in Drosophila (McCartney and
Fehon, 1996), where it is important for mitotic rounding and cell shape remodelling
during mitosis and relies on precise coupling of cortical actomyosin forces with the
plasma membrane (McClatchey, 2014; Roubinet et al., 2011). Overactivation of
moesin has been demonstrated to impair cell elongation and cytokinesis. In addition,

32 moesin can directly interact with microtubules (McClatchey, 2014; Roubinet et al.,
2011). During anaphase ERM proteins are removed from the cell poles, which
relaxes the rigid cortex leading to cell elongation and chromosome segregation.
PP1-87D/Sds22 phosphatase has been shown to dephosphorylate moesin, thereby
initiating this mechanism (McClatchey, 2014; Roubinet et al., 2011). Subsequently,
ERM proteins are restricted to the contracting cleavage furrow (McClatchey, 2014).
Moreover, ezrin has been shown to be involved in spindle orientation in human
epithelial colon (Caco2) cells and functions in positioning the interphase centrosome
and one spindle pole, likely by providing a stiff platform for astral microtubule
attachment (McClatchey, 2014). At the transition from metaphase to anaphase, ezrin
leaves the polar cortex and reappears at the cleavage furrow, which becomes the
nascent apical lumen around which cells divide to form a polarized cyst (McClatchey,
2014).
33 14-3-3 proteins
Previous work from the MacKintosh group suggested that protein kinase A (PKA)
can phosphorylate MINK1, which in turn enables 14-3-3-binding to MINK1
(unpublished data). 14-3-3 proteins are involved in all cellular processes and
signalling pathways and interact with a wide range of target proteins, including
kinases, receptor proteins, enzymes, cytoskeletal proteins, small G-proteins,
scaffolding molecules and proteins involved in cell cycle, transcriptional control of
gene expression and apoptosis (Aitken, 2006; Hermeking and Benzinger, 2006). 14-
3-3 proteins form dimers that bind to specific phosphorylated sites on hundreds of
diverse target proteins. This allows 14-3-3 proteins to assist in protein folding, protein
localisation and stimulation or inhibition of other protein-protein interactions (Aitken,
2006; Muslin et al., 1996), for example 14-3-3 links the α3 subunit of α3-nicotinic
acetylcholine receptors (α3-nAChRs) to APC (Rosenberg et al., 2008). 14-3-3
proteins bind to phosphorylated serine (pS) or threonine (pT) residues on their target
proteins. One 14-3-3 dimer usually binds two phosphorylated sides that lie in tandem
on the same target protein (Mackintosh, 2004).
Forty protein kinases of the human members of the eukaryotic protein kinase (ePK)
family have been identified to be members of the large group of well-defined 14-3-
3-binding proteins (Fu et al., 1994; Göransson et al., 2006; Meller et al., 1996).
Moreover, bioinformatic predictions identified potential 14-3-3 interaction
phosphosites on further 200 protein kinases (Madeira et al., 2015; Tinti et al., 2014).
In validation experiments, 11 of 13 tested protein kinases, selected from these 200,
displayed phosphorylation dependent interactions with 14-3-3 proteins, including
MINK1 (Gavuthami Murugesan and Carol MacKintosh, personal communication).
14-3-3 proteins have also been reported to bind to APC (Meek et al., 2004;
Rosenberg et al., 2008). These findings suggest that regulated interactions with 14-
3-3 proteins represent an underappreciated general mechanism for controlling
protein kinases.
In general, 14-3-3 dimers bind to one of two optimal 14-3-3-binding motifs, either to
mode I: RSXpSXP, or to mode II: RXY/FXpSXP. However, the 14-3-3-binding sites
on many proteins vary slightly from these optimal motifs (Mackintosh, 2004; Muslin

34 et al., 1996; Yaffe et al., 1997). 14-3-3s are highly conserved small (30 kDa) acidic
proteins that are expressed in all eukaryotes and in a wide range of tissues. There
are seven different 14-3-3 isoforms in human cells (gamma, epsilon, beta, zeta,
sigma, theta and tau) and up to 15 in plants (Aitken, 2006; Mackintosh, 2004; Yaffe,
2002; Yaffe et al., 1997). The name 14-3-3 stems from the particular migration
pattern of this protein family on 2-dimensinal DEAE-cellulose chromatography,
where 14-3-3 proteins elute in the 14th fraction of bovine brain homogenate from
DEAE cellulose columns, and starch gel electrophoresis, where they elute in
fractions 3.3 (Moore and Perez, 1967).
35 Protein kinase A
Previous work from the MacKintosh group suggests that protein kinase A (PKA) can
phosphorylate MINK1 either directly or indirectly. PKA is a protein kinase positioned
at the crossroad of multiple central signalling pathways and has a wide range of
different substrates. PKA has two regulatory subunits and two catalytic subunits
(Berridge, 2014). PKA is ubiquitously expressed in cells and generally activated by
the canonical and evolutionarily conserved second messenger cyclic adenosine
monophosphate (cAMP). cAMP binds to the regulatory subunits of PKA enabling its
catalytic subunits to phosphorylate downstream targets. In cells ubiquitous cAMP is
activated by a large number of stimuli, including neurotransmitters and hormones.
The formation of cAMP depends on the activation of G protein-coupled receptors
that use G proteins to activate the amplifier adenylyl cyclase (AC) (Berridge, 2014).
PKA can also be activated independently of cAMP, for example through a
mechanism involving nuclear factor κB (NF-κB), or through a Smad complex and
transforming growth factor-beta (TGF-β) signalling (Torres-Quesada et al., 2017).
Forskolin is a diperpene produced by the roots of Coleus forskohlii (Kanne et al.,
2015). Forskolin directly activates adenylyl cyclase, which in turn generates cAMP
from ATP to produce a rise in cAMP levels in the cell, leading to PKA activation.
Therefore, forskolin indirectly activates PKA (Seamon et al., 1981). H-89 (N-[2-
bromocinnamylamino)ethyl]-5-isoquinoline sulphonamide) is a PKA inhibitor that
binds to the catalytic subunits of PKA, and thereby inhibits PKA from binding its
natural substrate ATP (Chijiwa et al., 1990). Both forskolin and H-89 have been used
in this study to activate/inhibit PKA and study its effect on MINK1.

36 Cell migration and physical forces
Both APC and kinase activity of MINK1 are involved in cell migration (Hu et al.,
2004). The role of APC in cell migration is linked to its interaction with microtubules
and the actin cytoskeleton and mutation or depletion of APC lead to migration
defects (Dikovskaya et al., 2001; Näthke et al., 1996). Therefore, the negative
regulation of MINK1 by APC might be related to the changes in cell migration in the
gut epithelium caused by APC mutations (Popow et al., 2019).
The lining of the gut in adult mammals comprises a monolayer of columnar epithelial
cells. Gut epithelial cells migrate from the stem cell compartment in the crypt region
to the top of villi, where they are extruded into the gut lumen. The gut epithelium is
a rapidly self-renewing tissue and cell migration is crucial for its maintenance. Cell
migration has been extensively studied for single cells as well as in cell monolayers.
Collective cell migration in a monolayer is more complex and different than migration
of individual cells due to a number of constraints, e.g., cells have to coordinate their
movement in order to maintain contact with each other and with the underlying
substrate or tissue. In general, all migrating cells need to generate a front-to-rear
polarity axis, which determines the direction of their migration. Collective cell
migration is more complex, neighbouring cells interact and influence each other’s
movement (Mayor and Etienne-Manneville, 2016; Trepat and Sahai, 2018). Cell
monolayers are generally believed to have rheological properties akin to those
observed in complex fluids (e.g., honey, or blood, etc.) and exhibit flow patterns that
are more complex than laminar flows of simple liquids (Lamb, 1932). Over short
periods of time (seconds to minutes) cell monolayers behave like solids, while over
longer periods of time (tens of minutes to hours) their behaviour is liquid-like. This is
a hallmark of viscoelastic behaviour (Barnes et al., 1989). However, unlike complex
liquids, cell monolayers can produce internal active stresses and react to
environmental stimuli making their collective behaviour more complex (Mayor and
Etienne-Manneville, 2016). Cell migration patterns depend on the mechanical
properties of cells, such as cell stiffness, as well as forces generated by cells
themselves (Trepat and Sahai, 2018). However, it is often not simple to relate the
mechanical properties of the entire monolayer to that of individual cells. For example,
37 physical properties of individual cells are largely determined by the cytoskeleton,
particularly the actin and myosin filaments that form an actomyosin network that
generates contractile forces that are transmitted to the plasma membrane through
linker proteins (Mitchison et al., 2008). The nucleus also influences overall cellular
stiffness. This is generated by a cage of lamins wrapped around DNA with the
function to protect DNA from physical damage (Trepat and Sahai, 2018).
Furthermore, for collective cell migration, forces between cells are equally important
as cell-internal forces, and are transmitted by epithelial cell-cell adhesion through
tight junctions, adherens junctions and desmosomes. Additionally, cell-matrix
adhesion generates forces through the interaction between cells and the underlying
ECM (Conway and Jacquemet, 2019). Epithelial cells interact with the underlying
tissue through ECM proteins, like collagens and laminins, and through focal
adhesions (Trepat and Sahai, 2018). Interactions between migrating cells and the
substrate, as well as between neighbouring cells, generate mechanical forces.
Velocity, forces and stresses are quantities commonly used to quantify collective cell
migration. The mixture of mechanical forces operating in cell systems produce a
complex pattern of intercellular stresses that can be split into normal (due to forces
acting perpendicular to the cell’s surface) and shear stresses (due to forces acting
parallel to the cell’s surface) (Chaikin and Lubensky, 1995). Cells migrate in
directions that minimize shear stresses, which would disrupt cell-cell contacts (Mayor
and Etienne-Manneville, 2016). Therefore, the analysis of forces and the resulting
stress patterns can be used to gain insights into the mechanisms driving collective
cell migration.
38 Chapter overview
Chapter 3 - Interaction of APC and MINK1
Investigating Wnt signalling-independent interaction partners of APC, MINK1 was
identified to interact with the N-terminal part of APC (Popow et al., 2019). One aim
of this thesis was to further investigate the association between APC and MINK1.
MINK1 protein has three domains, an N-terminal kinase domain, an intermediate
linker domain and a C-terminal CNH domain. I aimed to identify which MINK1
domain is instrumental for the interaction with APC, leading to the negative
regulation of MINK1.
MINK1 is one of four ohnolog proteins in mammals that are all homologues of the
Drosophila protein msn. Ohnologues often distinguish themselves from their sister
ohnologues, either by differential expression in different tissues, or by specific
function(s), but they often also have some shared or overlapping functions.
Therefore, one question I addressed in this thesis was whether MINK1s sister
ohnologues, TNIK, MAP4K4, or NRK, can compensate for MINK1 upon its
depletion/deletion.
Chapter 4 - Phosphorylation of MINK1 and binding of 14-3-3
Previous work suggests that PKA can phosphorylate MINK1, which in turn enables
14-3-3-binding to MINK1 (MacKintosh group, unpublished data). Moreover, in mice
brains MARK3/4 and MINK1 are phosphorylated after fasting and dephosphorylated
in response to insulin treatment (Li et al., 2015). Therefore, further aims of my study
included the investigation, whether PKA and/or MARK3/4 directly or indirectly
phosphorylates MINK1, to validate that MINK1 phosphorylation enables 14-3-3-
binding to MINK1, and to identify the exact 14-3-3-binding phosphosites on MINK1.
MINK1 is a serine/threonine kinase, however, so far only threonine residues have
been described to be phosphorylated by MINK1. Therefore, I tested the hypothesis
that MINK1 is a threonine-selective kinase. It had been previously demonstrated that
MINK1 can phosphorylate the ERM activating phosphosite on an ERM peptide
39 (Popow, 2016). Hence, another aim was to further investigate the role of MINK1 in
phosphorylation of ERM proteins.
Chapter 5 - Role of MINK1 in cell migration
APC and MINK1 have both been implicated in cell migration independently and ERM
proteins that can be phosphorylated by MINK1 in vitro, are also involved in cell
migration. Thus, another aim of this study was to further investigate the role of MINK1
in cell migration. APC negatively regulates MINK1, which leads to an increase of
MINK1 protein levels upon APC mutations that also cause colorectal cancer.
Therefore, the migration phenotype of MINK1 overexpressing cells compared to cells
with endogenous MINK1 expression was most relevant.
Chapter 6 - Biological function(s) of MINK1
MINK1 protein levels increase upon APC mutations. Therefore, one aim of this thesis
was to determine the role of MINK1 in APC-mediated tumour formation.
Functions of MINK1 kinase have already been studied in different cell types and cell
lines. However, there is no comprehensive understanding of the biological
function(s) of MINK1, so far. The role of MINK1 homologue msn is better understood.
Nonetheless, there are four ohnologues in mammals, which are all homologous of
msn. Further studies are needed to validate which functions of msn are conducted
by which ohnologue(s) in mammals. Therefore, another aim of this thesis was to
investigate the biological function(s) and regulation of MINK1.
40 2. Material and Methods
This chapter aims to summarise all material and methods used throughout my thesis
and is divided into material and methods used in tissue culture and to treat cells
(Tissue culture), preparation, isolation and/or analysis of RNA (RNA analysis),
preparation, isolation and/or and analysis of proteins (Protein analysis) and imaging
data analysis used to analyse cell migration (Cell migration).
The gene and protein nomenclature I used throughout this thesis follows the
guidelines from Oxford University Press, FlyBase and C. elegans II (Oxford
University Press, 2020; Riddle et al., 1997; Thurmond et al., 2018). Therefore,
human gene names are referenced in all upper cases and italic (e.g. MINK1), while
proteins are the same, but not italic (e.g. MINK1). Mouse gene symbols are italicised,
the first letter is in upper case and all other letters are lower case (e.g. Mink1), while
mouse protein names are not italic and all upper case (e.g. MINK1) (Oxford
University Press, 2020). Drosophila gene symbols are italicised and start with an
upper-case letter for genes with dominant alleles (e.g. msn), and with a lower-case
letter for genes with recessive alleles. Drosophila protein symbols are the same as
gene symbols, but nonitalic (e.g. msn) (Thurmond et al., 2018). C. elegans gene
names consist of three italicised letters, a hyphen, and an Arabic number (e.g. mig-
15). The protein products of these genes are written in nonitalic capitals (e.g. MIG-
15) (Riddle et al., 1997).
Depletion was used throughout this thesis interchangeable with gene knock-down
and deletion with knockout.
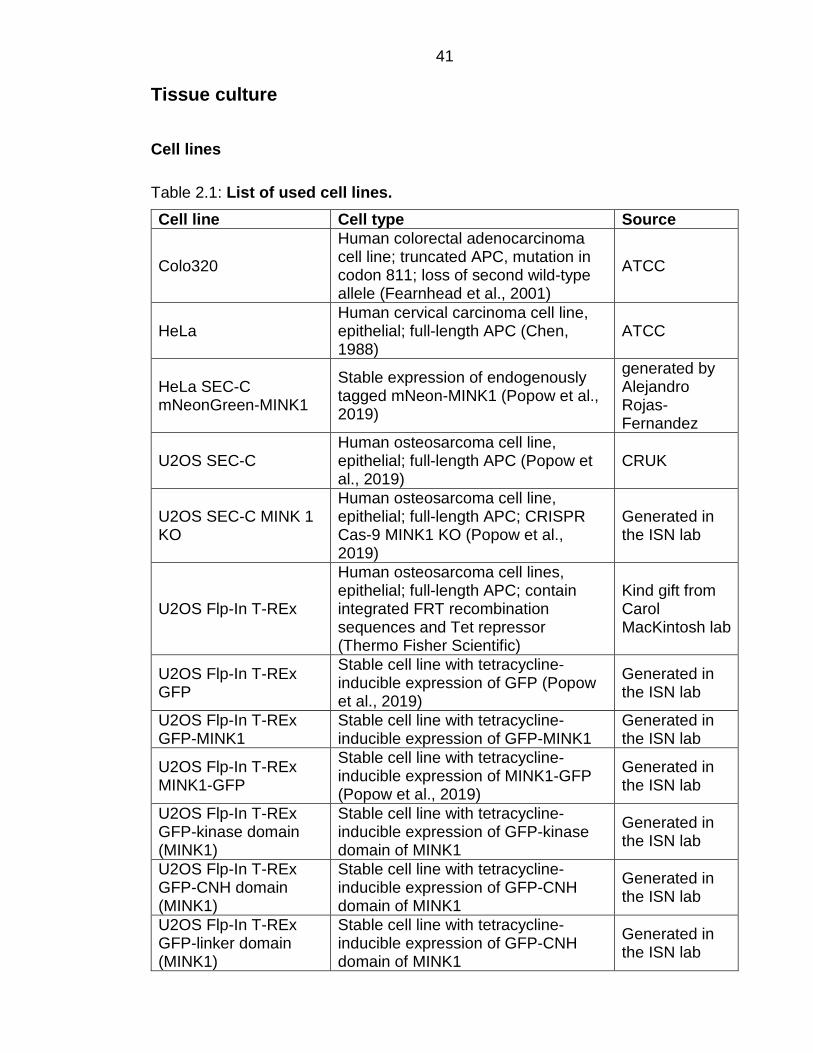
41 Tissue culture
Cell lines
Table 2.1: List of used cell lines. Cell line Cell type Source
Colo320
Human colorectal adenocarcinoma cell line; truncated APC, mutation in codon 811; loss of second wild-type allele (Fearnhead et al., 2001)
ATCC
HeLa Human cervical carcinoma cell line, epithelial; full-length APC (Chen, 1988)
ATCC
HeLa SEC-C mNeonGreen-MINK1
Stable expression of endogenously tagged mNeon-MINK1 (Popow et al., 2019)
generated by Alejandro Rojas-Fernandez
U2OS SEC-C Human osteosarcoma cell line, epithelial; full-length APC (Popow et al., 2019)
CRUK
U2OS SEC-C MINK 1 KO
Human osteosarcoma cell line, epithelial; full-length APC; CRISPR Cas-9 MINK1 KO (Popow et al., 2019)
Generated in the ISN lab
U2OS Flp-In T-REx
Human osteosarcoma cell lines, epithelial; full-length APC; contain integrated FRT recombination sequences and Tet repressor (Thermo Fisher Scientific)
Kind gift from Carol MacKintosh lab
U2OS Flp-In T-REx GFP
Stable cell line with tetracycline-inducible expression of GFP (Popow et al., 2019)
Generated in the ISN lab
U2OS Flp-In T-REx GFP-MINK1
Stable cell line with tetracycline-inducible expression of GFP-MINK1
Generated in the ISN lab
U2OS Flp-In T-REx MINK1-GFP
Stable cell line with tetracycline-inducible expression of MINK1-GFP (Popow et al., 2019)
Generated in the ISN lab
U2OS Flp-In T-REx GFP-kinase domain (MINK1)
Stable cell line with tetracycline-inducible expression of GFP-kinase domain of MINK1
Generated in the ISN lab
U2OS Flp-In T-REx GFP-CNH domain (MINK1)
Stable cell line with tetracycline-inducible expression of GFP-CNH domain of MINK1
Generated in the ISN lab
U2OS Flp-In T-REx GFP-linker domain (MINK1)
Stable cell line with tetracycline-inducible expression of GFP-CNH domain of MINK1
Generated in the ISN lab
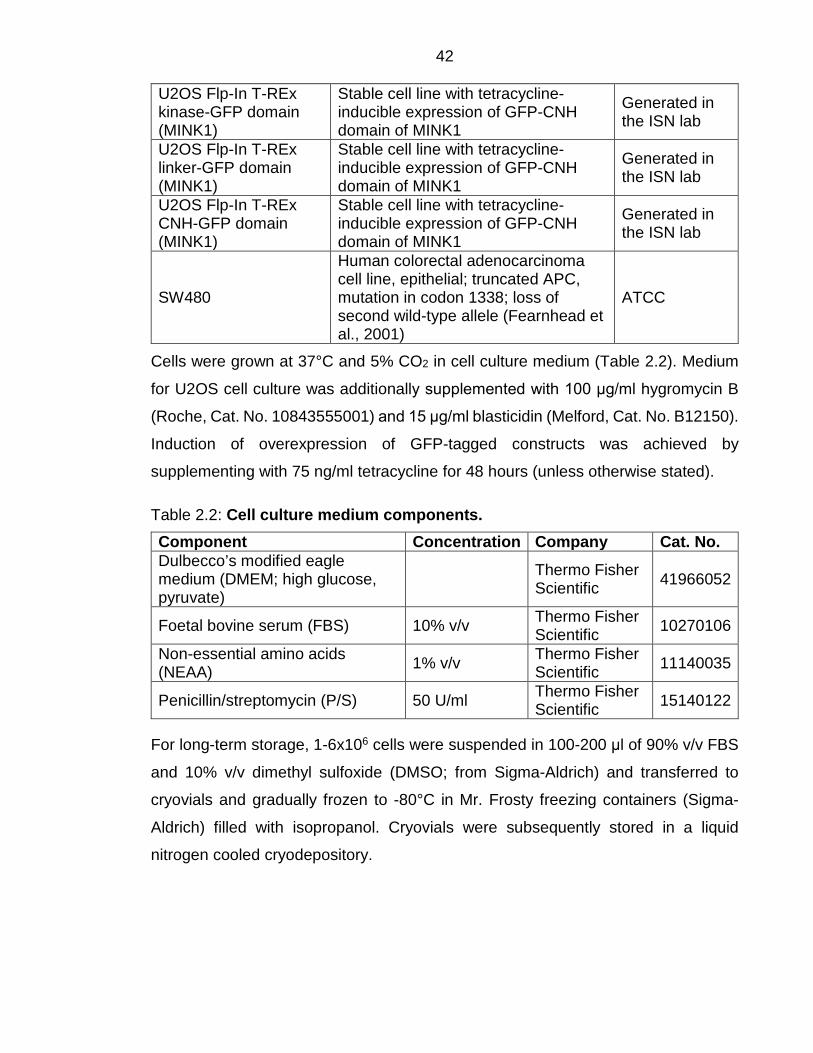
42 U2OS Flp-In T-REx kinase-GFP domain (MINK1)
Stable cell line with tetracycline-inducible expression of GFP-CNH domain of MINK1
Generated in the ISN lab
U2OS Flp-In T-REx linker-GFP domain (MINK1)
Stable cell line with tetracycline-inducible expression of GFP-CNH domain of MINK1
Generated in the ISN lab
U2OS Flp-In T-REx CNH-GFP domain (MINK1)
Stable cell line with tetracycline-inducible expression of GFP-CNH domain of MINK1
Generated in the ISN lab
SW480
Human colorectal adenocarcinoma cell line, epithelial; truncated APC, mutation in codon 1338; loss of second wild-type allele (Fearnhead et al., 2001)
ATCC
Cells were grown at 37°C and 5% CO2 in cell culture medium (Table 2.2). Medium
for U2OS cell culture was additionally supplemented with 100 μg/ml hygromycin B
(Roche, Cat. No. 10843555001) and 15 μg/ml blasticidin (Melford, Cat. No. B12150).
Induction of overexpression of GFP-tagged constructs was achieved by
supplementing with 75 ng/ml tetracycline for 48 hours (unless otherwise stated).
Table 2.2: Cell culture medium components. Component Concentration Company Cat. No. Dulbecco’s modified eagle medium (DMEM; high glucose, pyruvate)
Thermo Fisher Scientific 41966052
Foetal bovine serum (FBS) 10% v/v Thermo Fisher Scientific 10270106
Non-essential amino acids (NEAA) 1% v/v Thermo Fisher
Scientific 11140035
Penicillin/streptomycin (P/S) 50 U/ml Thermo Fisher Scientific 15140122
For long-term storage, 1-6x10⁶ cells were suspended in 100-200 μl of 90% v/v FBS
and 10% v/v dimethyl sulfoxide (DMSO; from Sigma-Aldrich) and transferred to
cryovials and gradually frozen to -80°C in Mr. Frosty freezing containers (Sigma-
Aldrich) filled with isopropanol. Cryovials were subsequently stored in a liquid
nitrogen cooled cryodepository.

43 Generation of cell lines
Stable cell lines with tetracycline/doxycycline-inducible expression of GFP-MINK1-
GFP/GFP-kinase/kinase-GFP/GFP-linker/linker-GFP/GFP-CNH/CNH-GFP were
generated using the Flp-In™ T-Rex™ system according to the manufacturer’s
instructions (Thermo Fisher Scientific) by transfecting U2OS Flp-In™ T-Rex™ host
cells with pcDNA5 FRT/TO GFP-MINK1, pcDNA5 FRT/TO GFP MINK1 kinase
domain, pcDNA5 FRT/TO MINK1 kinase domain-GFP, pcDNA5 FRT/TO GFP
MINK1 linker domain, pcDNA5 FRT/TO MINK1 linker domain-GFP, pcDNA5
FRT/TO GFP MINK1 CNH domain, pcDNA5 FRT/TO MINK1 CNH domain-GFP
respectively, and pOG44, a constitutive Flp recombinase expression plasmid.
Small interfering RNA (siRNA)
Cells were seeded one day prior to transfection at a density of 2x10⁵ (U2OS) cells
per tissue culture dish (60 mm diameter; TD6) or 1.5x10⁶ (U2OS) cells per tissue
culture flaks with 75 cm2 surface area (T75). Cells were transfected using
INTERFERin® (Polyplus-transfection) according to the manufacturer’s instructions
using 7 μl siRNA (10 μM) per TD6 and 21 μl siRNA (10 μM) per T75. Cells were
transfected with APC siRNA (siGENOME SMARTpool, Dharmacon), MINK1 siRNA
(ON-TARGETplus SMARTpool, Dharmacon), or control siRNA (siGENOME Non-
targeting siRNA #1, Dharmacon), respectively. 24 hours post transfection, a change
to fresh media was performed. RNA or protein were isolated 48 hours post
transfection (Popow et al., 2019).
Mitotic block
Cells were seeded one day prior to mitotic block, at a density of 2x10⁶ cells per tissue
culture flaks with 150 cm2 surface area (T150). On the day of treatment the medium
was replaced with fresh medium. Taxol or nocodazole were added to final
concentrations of 1.25 μg/ml (in DMSO) or 0.6 μg/ml (in DMSO) respectively to
induce mitotic arrest. DMSO was added as treatment control in corresponding
amounts. Cells were incubated overnight (approximately 16 hours) in the incubator
at 37°C and 5% CO2 (Dikovskaya et al., 2007).
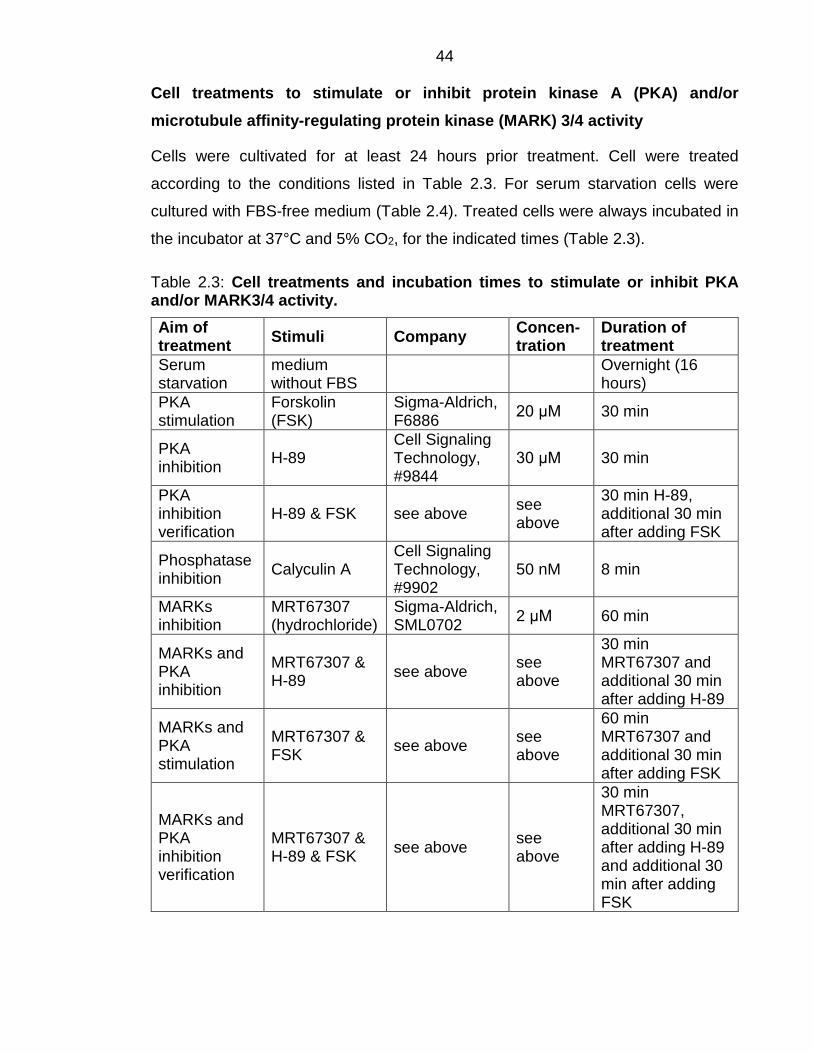
44 Cell treatments to stimulate or inhibit protein kinase A (PKA) and/or microtubule affinity-regulating protein kinase (MARK) 3/4 activity
Cells were cultivated for at least 24 hours prior treatment. Cell were treated
according to the conditions listed in Table 2.3. For serum starvation cells were
cultured with FBS-free medium (Table 2.4). Treated cells were always incubated in
the incubator at 37°C and 5% CO2, for the indicated times (Table 2.3).
Table 2.3: Cell treatments and incubation times to stimulate or inhibit PKA and/or MARK3/4 activity. Aim of treatment Stimuli Company Concen-
tration Duration of treatment
Serum starvation
medium without FBS Overnight (16
hours) PKA stimulation
Forskolin (FSK)
Sigma-Aldrich, F6886 20 μM 30 min
PKA inhibition H-89
Cell Signaling Technology, #9844
30 μM 30 min
PKA inhibition verification
H-89 & FSK see above see above
30 min H-89, additional 30 min after adding FSK
Phosphatase inhibition Calyculin A
Cell Signaling Technology, #9902
50 nM 8 min
MARKs inhibition
MRT67307 (hydrochloride)
Sigma-Aldrich, SML0702 2 μM 60 min
MARKs and PKA inhibition
MRT67307 & H-89 see above see
above
30 min MRT67307 and additional 30 min after adding H-89
MARKs and PKA stimulation
MRT67307 & FSK see above see
above
60 min MRT67307 and additional 30 min after adding FSK
MARKs and PKA inhibition verification
MRT67307 & H-89 & FSK see above see
above
30 min MRT67307, additional 30 min after adding H-89 and additional 30 min after adding FSK
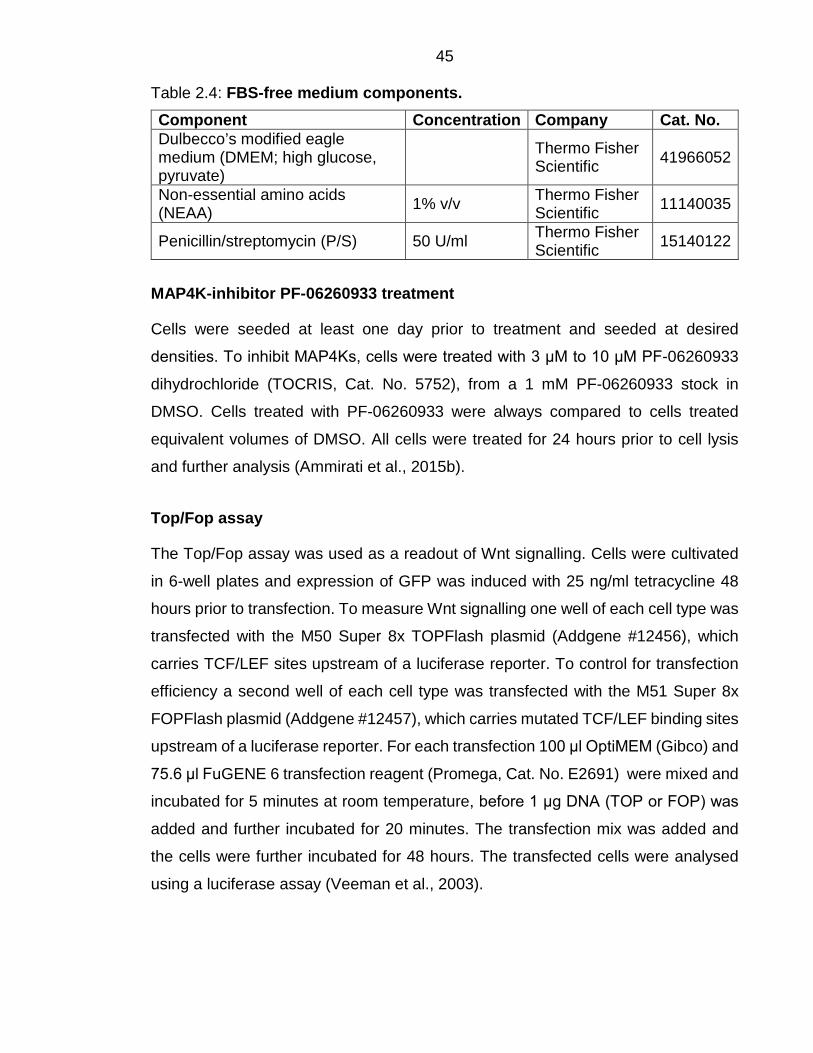
45 Table 2.4: FBS-free medium components. Component Concentration Company Cat. No. Dulbecco’s modified eagle medium (DMEM; high glucose, pyruvate)
Thermo Fisher Scientific 41966052
Non-essential amino acids (NEAA) 1% v/v Thermo Fisher
Scientific 11140035
Penicillin/streptomycin (P/S) 50 U/ml Thermo Fisher Scientific 15140122
MAP4K-inhibitor PF-06260933 treatment
Cells were seeded at least one day prior to treatment and seeded at desired
densities. To inhibit MAP4Ks, cells were treated with 3 μM to 10 μM PF-06260933
dihydrochloride (TOCRIS, Cat. No. 5752), from a 1 mM PF-06260933 stock in
DMSO. Cells treated with PF-06260933 were always compared to cells treated
equivalent volumes of DMSO. All cells were treated for 24 hours prior to cell lysis
and further analysis (Ammirati et al., 2015b).
Top/Fop assay
The Top/Fop assay was used as a readout of Wnt signalling. Cells were cultivated
in 6-well plates and expression of GFP was induced with 25 ng/ml tetracycline 48
hours prior to transfection. To measure Wnt signalling one well of each cell type was
transfected with the M50 Super 8x TOPFlash plasmid (Addgene #12456), which
carries TCF/LEF sites upstream of a luciferase reporter. To control for transfection
efficiency a second well of each cell type was transfected with the M51 Super 8x
FOPFlash plasmid (Addgene #12457), which carries mutated TCF/LEF binding sites
upstream of a luciferase reporter. For each transfection 100 μl OptiMEM (Gibco) and
75.6 μl FuGENE 6 transfection reagent (Promega, Cat. No. E2691) were mixed and
incubated for 5 minutes at room temperature, before 1 μg DNA (TOP or FOP) was
added and further incubated for 20 minutes. The transfection mix was added and
the cells were further incubated for 48 hours. The transfected cells were analysed
using a luciferase assay (Veeman et al., 2003).

46 Live cell imaging
To record cell migration, one or two culture-insert 2-wells (Ibidi) were placed in each
well of a 6-well plate. 70 μI of a 7.2x10⁵ cell/ml solution were plated in each side of
each culture-insert 2-well (Figure 2.1A). Control cells (U2OS, uninduced MINK1-
GFP, or uninduced GFP cells) were plated on three 6-wells and MINK1 KO, MINK1-
GFP overexpressing or GFP overexpressing cells were plated in the remaining three
6-wells. The cells were incubated at 37°C and 5% CO2 overnight. The next day the
incubation chamber of the total internal reflection fluorescence (TIRF) microscope
was turned on several hours before imaging to bring it to 37°C. To allow comparison
of migrating cells to background movement, negative control U2OS cells were
created by treatment with 100 μM Y-27632 (Y-27632 dihydrochloride; from TORICS,
Cat. No. 1254) 30 minutes before culture-insert 2-wells were removed. For all cell
types, 2 ml phosphate buffered saline (PBS) were added to each 6-well and the
culture-insert 2-wells were removed. The cells were washed in PBS two more times,
3 ml fresh medium were added to each well. Sterile water was added into the space
between the wells (Figure 2.1B). The outer edges of the cell patches were imaged
on the TIRF microscope with a 20x objective lens wells (Figure 2.1A, Single cell
front). 3x4 tiled-images were taken (10% stitching) at each time point, yielding to
1906.55 μm x 2518.80 μm images. Images were acquired every 10 minutes over
two days.
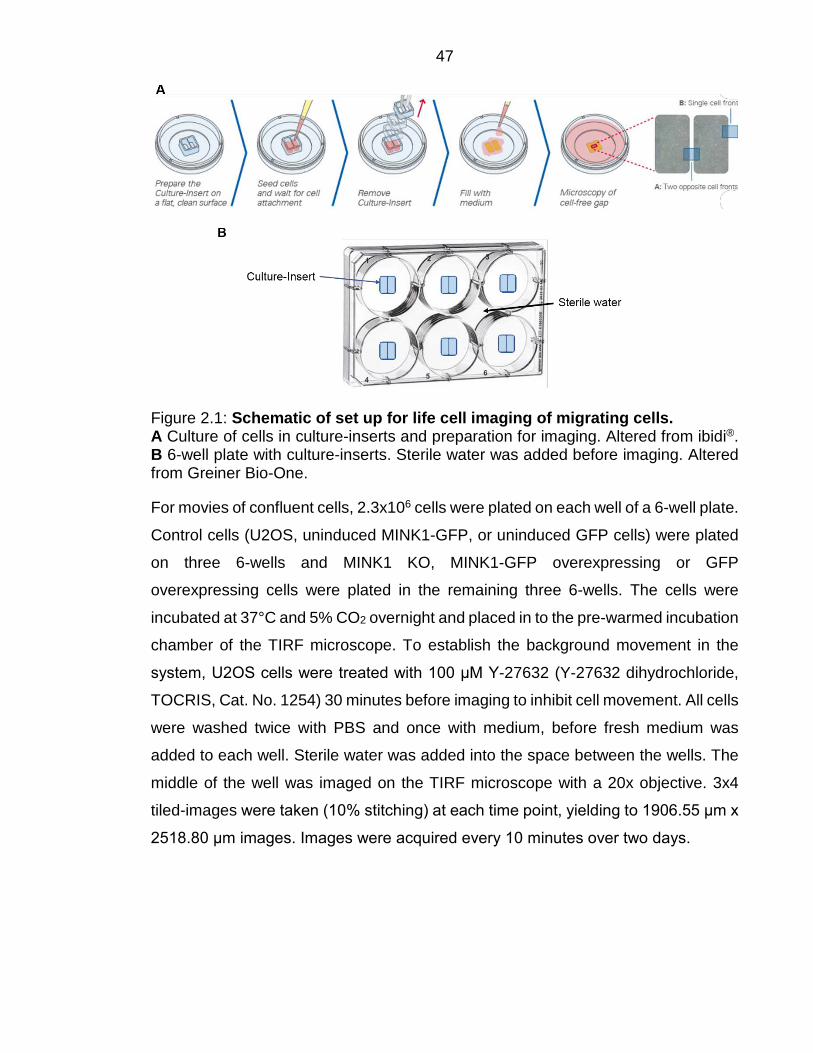
47
Figure 2.1: Schematic of set up for life cell imaging of migrating cells. A Culture of cells in culture-inserts and preparation for imaging. Altered from ibidi®. B 6-well plate with culture-inserts. Sterile water was added before imaging. Altered from Greiner Bio-One.
For movies of confluent cells, 2.3x10⁶ cells were plated on each well of a 6-well plate.
Control cells (U2OS, uninduced MINK1-GFP, or uninduced GFP cells) were plated
on three 6-wells and MINK1 KO, MINK1-GFP overexpressing or GFP
overexpressing cells were plated in the remaining three 6-wells. The cells were
incubated at 37°C and 5% CO2 overnight and placed in to the pre-warmed incubation
chamber of the TIRF microscope. To establish the background movement in the
system, U2OS cells were treated with 100 μM Y-27632 (Y-27632 dihydrochloride,
TOCRIS, Cat. No. 1254) 30 minutes before imaging to inhibit cell movement. All cells
were washed twice with PBS and once with medium, before fresh medium was
added to each well. Sterile water was added into the space between the wells. The
middle of the well was imaged on the TIRF microscope with a 20x objective. 3x4
tiled-images were taken (10% stitching) at each time point, yielding to 1906.55 μm x
2518.80 μm images. Images were acquired every 10 minutes over two days.
48 Coating of cover slips for cell adhesion assay
To measure cell adhesion to different extracellular matrix substrates, coverslips
(VWR International, round cover glasses, thickness No. 1.5, 13 mm, Cat. No. 631-
0150) were coated with collagen, fibronectin of laminin in 24-well plates. To this end,
coverslips were sterilized in 70% ethanol, individually placed into wells of 24-well
plates, and twice washed with sterile PBS. Coverslips were coated with 1 mg/ml
collagen solution (Sigma C-8897, Collagen from rat tail Bornstein and Traub type I
(Sigma Type VII) powder, in 0.1% acetic acid, filter sterilised), 16 μg/ml fibronectin
(Sigma, F4759, in PBS) or 8 μg/ml laminin (in PBS), with some coverslips remaining
uncoated and later used as uncoated controls.
For collagen coating, the collagen was incubated for 2.5 hours, at room temperature
in a tissue culture hood, before collagen was crosslinked under ultraviolet light in a
sterile tissue culture hood (lid off) and dried overnight.
For laminin coating, 8 μg/ml laminin solution was added to 24-wells with coverslips
and incubated for 2 hours at 37°C (in the incubator). The coverslips were washed
three-times in PBS, before the plates were wrapped with Parafilm (Sigma) and
stored at 4°C overnight.
For fibronectin coating, 16 μg/ml fibronectin solution was added to coverslips, before
they were air-dried for 45 minutes under a sterile tissue culture hood (lid off) at room
temperature. The plates were wrapped with Parafilm and stored them at 4°C
overnight.
Cell adhesion assay
Collagen, fibronectin or laminin coated coverslips were washed in sterile PBS and
incubated in adhesion blocking buffer (Table 2.5) at 37°C and 5% CO2 for 1 hour in
the incubator. U2OS cells were washed in sterile PBS twice and detached with 10
mM ethylenediaminetetraacetic acid (EDTA; from Sigma) in PBS for 10 minutes at
37°C and 5% CO2 in the incubator. The cells were washed in DMEM twice and
resuspended in adhesion blocking buffer (Table 2.6). Cells were counted and diluted
to yield desired concentrations. Coverslips were washed with adhesion wash buffer,
before cells were seeded and incubated for 1 hour at 37°C and 5% CO2 in the
49 incubator. Cells were agitated for different time intervals on a (bacterial tube) shaker
and washed with adhesion blocking buffer twice, before they were fixed and stained.
Table 2.5: Adhesion blocking buffer composition. Component Concentration Bovine Serum Albumin (BSA) 0.5% w/v
Listed components were diluted in sterile DMEM.
Table 2.6: Adhesion wash buffer composition. Component Concentration Bovine Serum Albumin (BSA) 0.1% w/v
Listed components were diluted in sterile DMEM.
Fixation and immunofluorescence staining of cells
Cells were fixed with 37°C pre-warmed 4% paraformaldehyde (PFA; from Sigma) at
room temperature for 10 minutes, washed in IF wash buffer (Table 2.7) and
permeabilised in permeabilisation buffer (Table 2.8) for 10 minutes at room
temperature. Cells were washed in IF wash buffer and blocked with IF blocking buffer
(Table 2.9) for 30 minutes at room temperature. Cells were incubated with primary
antibodies diluted in IF wash buffer for 60 minutes at room temperature and in a
humid chamber. Cells were washed in IF wash buffer three-times for 5 minutes and
incubated in secondary antibodies diluted in IF wash buffer for 60 minutes at room
temperature and in a humid chamber in the dark. Cells were washed in IF wash
buffer three-times for 5 minutes and counterstained with dyes and/or DAPI (1 μg/ml)
diluted in PBS for 10 to 30 minutes. Slides were mounted with mounting medium
(ProLong™ gold antifade from Invitrogen) dried overnight, sealed with nail polish,
dried again and stored at -20°C.
Table 2.7: IF wash buffer composition. Component Concentration Bovine serum albumin (BSA) 0.2% w/v Sodium azide 0.02% w/v Triton X-100 0.1% v/v

50 Listed components were diluted in PBS.
Table 2.8: Permeabilisation buffer composition. Component Concentration NP-40 1% v/v
Listed components were diluted in PBS.
Table 2.9: IF blocking buffer composition. Component Concentration normal goat serum, 5% v/v Bovine serum albumin (BSA) 2% w/v Sodium azide 0.02% w/v Triton X-100 0.1% v/v
Listed components were diluted in PBS.
Table 2.10: Primary antibodies used for IF staining. Protein Source Species Dilution Phospho-ezrin (Thr567)/radixin (Thr564)/moesin (Thr558) (48G2)
Cell Signaling Technology Rabbit 1:200
Table 2.11: Secondary antibodies and counterstains used for IF staining. Protein Source Species Dilution Alexa Fluor® 647 Invitrogen Goat anti-rabbit 1:1000 Phalloidin DyLight 550 ThermoFisher 3 - 6 units/ml
MTT cell proliferation assays
To measure proliferation of cells, the TACS® MTT cell proliferation assays kit (from
Trevigen) was used. U2OS cells were plated at a density of 1x10⁴ cells/cm2, Colo320
cells were plated at a density of 1.33x10⁴ cells/cm2. All cells were cultured overnight
at 37°C and 5% CO2 in the incubator, and transfected with siRNA (see Small
interfering RNA (siRNA)). 24 hours after siRNA transfection, cells were split into
three 96-well plates. U2OS cells were split to 2x10⁴ cells per 96-well and Colo320
were split to 1x10⁵ cells per 96-well. All samples were prepared in triplicate (three
wells). All plates were further incubated at 37°C and 5% CO2 in the incubator. 24
hours, 48 hours and 72 hours after the cells were seeded into 96-well plates MTT
reagent (Trevigen, Cat. # 4890-25-01) was added to each well of a 96-well plate and
the plate was further incubated for 2 hours at 37°C and 5% CO2 in the incubator.
Detergent reagent (Trevigen, Cat. # 4890-25-02) was added to the cells and the
51 plate was incubated overnight at room temperature in the dark. The next day the
absorbance was measured in each well, including blanks, at 570 nm in a microplate
plate reader. Average values were determined from triplicate absorbance readings,
of each sample prepared in triplicate (Popow et al., 2019).
Spindle orientation measurement
Experiments measuring spindle orientation were performed by Associate Professor
Christopher Maxwell’s group at the University of British Columbia using cells I sent
them. The following cell lines were used for analysis: MINK1 deleted (MINK1 KO
#5/10) and parental U2OS cells, and U2OS cell with inducible overexpress GFP or
GFP-MINK1. GFP and GFP-MINK1 expression was induced with doxycycline 48
hours prior to the experiment and compared to uninduced control cells. Cells were
plated on L-patterned fibronectin-coated micropatterns (CYTOO). 100 cell divisions
were analysed per cell type using microscopy and spindle orientation was analysed
(Fulcher et al., 2019).
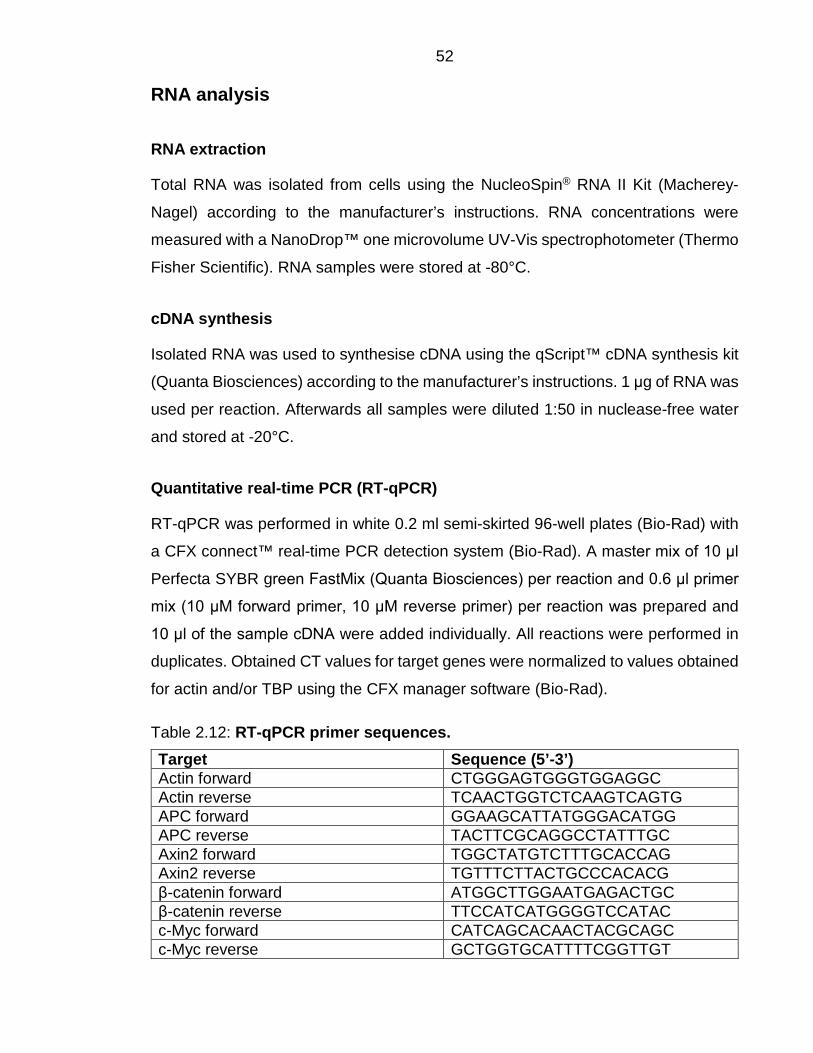
52 RNA analysis
RNA extraction
Total RNA was isolated from cells using the NucleoSpin® RNA II Kit (Macherey-
Nagel) according to the manufacturer’s instructions. RNA concentrations were
measured with a NanoDrop™ one microvolume UV-Vis spectrophotometer (Thermo
Fisher Scientific). RNA samples were stored at -80°C.
cDNA synthesis
Isolated RNA was used to synthesise cDNA using the qScript™ cDNA synthesis kit
(Quanta Biosciences) according to the manufacturer’s instructions. 1 μg of RNA was
used per reaction. Afterwards all samples were diluted 1:50 in nuclease-free water
and stored at -20°C.
Quantitative real-time PCR (RT-qPCR)
RT-qPCR was performed in white 0.2 ml semi-skirted 96-well plates (Bio-Rad) with
a CFX connect™ real-time PCR detection system (Bio-Rad). A master mix of 10 μl
Perfecta SYBR green FastMix (Quanta Biosciences) per reaction and 0.6 μl primer
mix (10 μM forward primer, 10 μM reverse primer) per reaction was prepared and
10 μl of the sample cDNA were added individually. All reactions were performed in
duplicates. Obtained CT values for target genes were normalized to values obtained
for actin and/or TBP using the CFX manager software (Bio-Rad).
Table 2.12: RT-qPCR primer sequences. Target Sequence (5’-3’) Actin forward CTGGGAGTGGGTGGAGGC Actin reverse TCAACTGGTCTCAAGTCAGTG APC forward GGAAGCATTATGGGACATGG APC reverse TACTTCGCAGGCCTATTTGC Axin2 forward TGGCTATGTCTTTGCACCAG Axin2 reverse TGTTTCTTACTGCCCACACG β-catenin forward ATGGCTTGGAATGAGACTGC β-catenin reverse TTCCATCATGGGGTCCATAC c-Myc forward CATCAGCACAACTACGCAGC c-Myc reverse GCTGGTGCATTTTCGGTTGT

53 CyclinD forward GGCGGATTGGAAATGAACTT CyclinD reverse TCCTCTCCAAAATGCCAGAG MAP4K4 forward CCAATGGCAACTCCGAGTCTGT MAP4K4 reverse GGGTCACTGAAGGAATGGGATC MINK1 forward CAGGAATACAAGCGGAAGCA MINK1 reverse GATTCATGCCCCGACCATA NRK forward CAGGCTGAAGTCCAGATAGAGC NRK reverse GTGCATGATCCTGGTTGTTAGGC TBP forward GCCAGCTTCGGAGAGTTCTGGGATT TBP reverse CGGGCACGAAGTGCAATGGTCTTTA TNIK forward ACAGTGGCTGTCAGCGACATAC TNIK reverse ATACTGCCGCTGAAACTGTCCG
Table 2.13: RT-qPCR protocol. Step Temperature [°C] Time Number of Cycles Activation 95 3 minutes 1 Denaturation 95 30 seconds
40 Annealing 60 30 seconds Extension 72 30 seconds Denaturation 95 1 minute 1 Renaturation 55 1 minute 1 Melt curve 55-95 (0.5°C increments) 10 seconds/step 1
Quantitative real-time PCR with Wnt signalling targets (SAB Target List H96 plates)
RT-qPCR was performed using Wnt signalling targets (SAB Target List) H96 plates
(Bio-Rad) and according to the manufacturer’s protocol. RT-qPCR of all cell types
was performed on three plates per cell type from independently cultured cells, with
independent RNA isolations and cDNA reverse transcriptions. The independent
results were later averaged using the CFX manager software (Bio-Rad).
Table 2.14: Wnt signalling targets RT-qPCR protocol. Step Temperature [°C] Time Number of Cycles Activation 95 2 minutes 1 Denaturation 95 5 seconds
40 Annealing/ extension 60 30 seconds
Melt curve 60-95 (0.5°C increments) 5 seconds/step 1
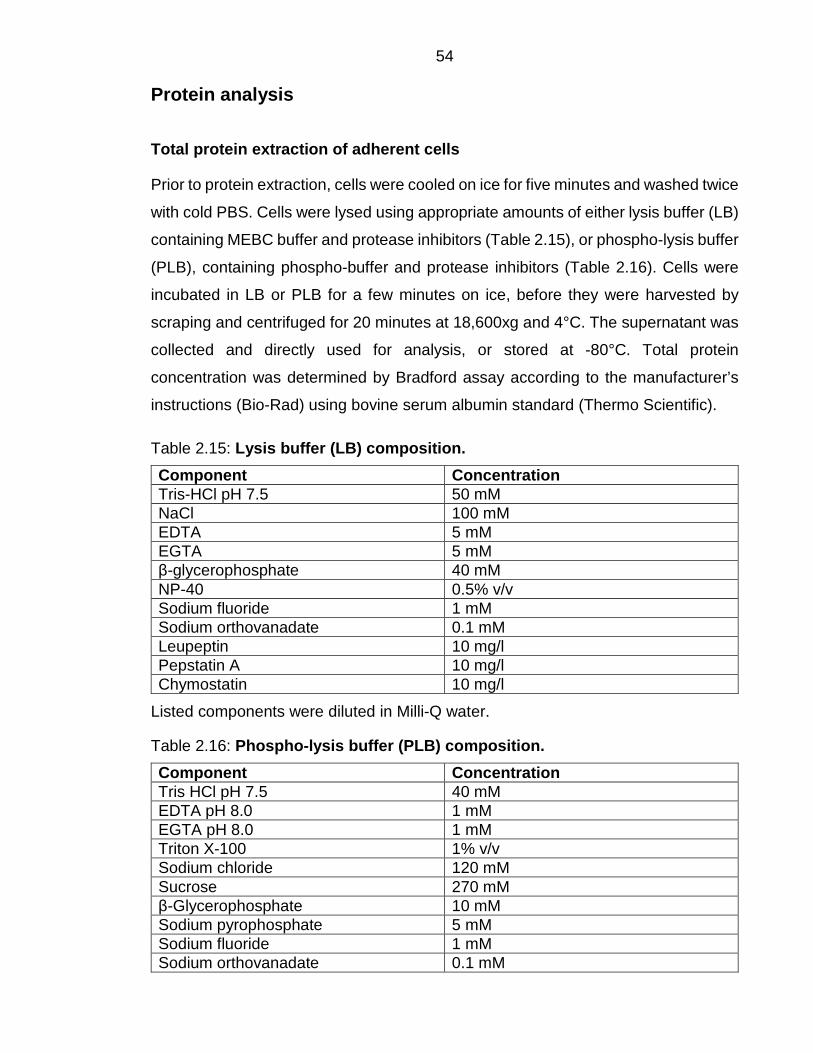
54 Protein analysis
Total protein extraction of adherent cells
Prior to protein extraction, cells were cooled on ice for five minutes and washed twice
with cold PBS. Cells were lysed using appropriate amounts of either lysis buffer (LB)
containing MEBC buffer and protease inhibitors (Table 2.15), or phospho-lysis buffer
(PLB), containing phospho-buffer and protease inhibitors (Table 2.16). Cells were
incubated in LB or PLB for a few minutes on ice, before they were harvested by
scraping and centrifuged for 20 minutes at 18,600xg and 4°C. The supernatant was
collected and directly used for analysis, or stored at -80°C. Total protein
concentration was determined by Bradford assay according to the manufacturer’s
instructions (Bio-Rad) using bovine serum albumin standard (Thermo Scientific).
Table 2.15: Lysis buffer (LB) composition. Component Concentration Tris-HCl pH 7.5 50 mM NaCl 100 mM EDTA 5 mM EGTA 5 mM β-glycerophosphate 40 mM NP-40 0.5% v/v Sodium fluoride 1 mM Sodium orthovanadate 0.1 mM Leupeptin 10 mg/l Pepstatin A 10 mg/l Chymostatin 10 mg/l
Listed components were diluted in Milli-Q water.
Table 2.16: Phospho-lysis buffer (PLB) composition. Component Concentration Tris HCl pH 7.5 40 mM EDTA pH 8.0 1 mM EGTA pH 8.0 1 mM Triton X-100 1% v/v Sodium chloride 120 mM Sucrose 270 mM β-Glycerophosphate 10 mM Sodium pyrophosphate 5 mM Sodium fluoride 1 mM Sodium orthovanadate 0.1 mM
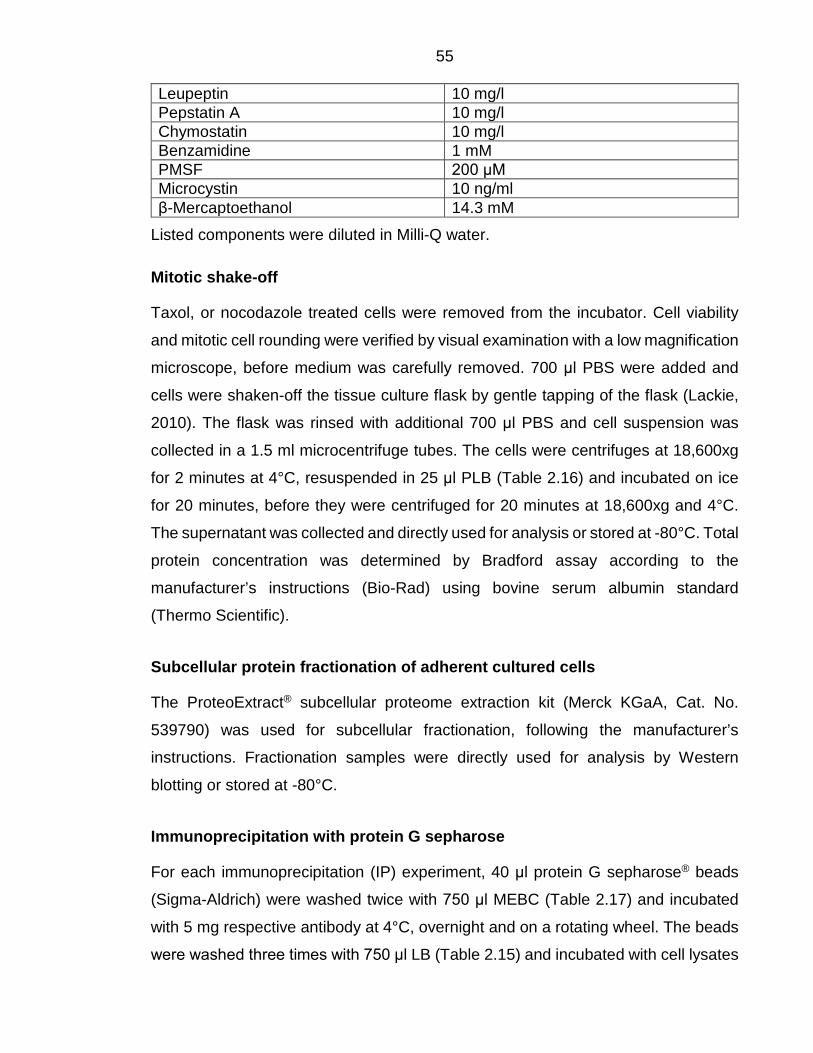
55 Leupeptin 10 mg/l Pepstatin A 10 mg/l Chymostatin 10 mg/l Benzamidine 1 mM PMSF 200 μM Microcystin 10 ng/ml β-Mercaptoethanol 14.3 mM
Listed components were diluted in Milli-Q water.
Mitotic shake-off
Taxol, or nocodazole treated cells were removed from the incubator. Cell viability
and mitotic cell rounding were verified by visual examination with a low magnification
microscope, before medium was carefully removed. 700 μl PBS were added and
cells were shaken-off the tissue culture flask by gentle tapping of the flask (Lackie,
2010). The flask was rinsed with additional 700 μl PBS and cell suspension was
collected in a 1.5 ml microcentrifuge tubes. The cells were centrifuges at 18,600xg
for 2 minutes at 4°C, resuspended in 25 μl PLB (Table 2.16) and incubated on ice
for 20 minutes, before they were centrifuged for 20 minutes at 18,600xg and 4°C.
The supernatant was collected and directly used for analysis or stored at -80°C. Total
protein concentration was determined by Bradford assay according to the
manufacturer’s instructions (Bio-Rad) using bovine serum albumin standard
(Thermo Scientific).
Subcellular protein fractionation of adherent cultured cells
The ProteoExtract® subcellular proteome extraction kit (Merck KGaA, Cat. No.
539790) was used for subcellular fractionation, following the manufacturer’s
instructions. Fractionation samples were directly used for analysis by Western
blotting or stored at -80°C.
Immunoprecipitation with protein G sepharose
For each immunoprecipitation (IP) experiment, 40 μl protein G sepharose® beads
(Sigma-Aldrich) were washed twice with 750 μl MEBC (Table 2.17) and incubated
with 5 mg respective antibody at 4°C, overnight and on a rotating wheel. The beads
were washed three times with 750 μl LB (Table 2.15) and incubated with cell lysates
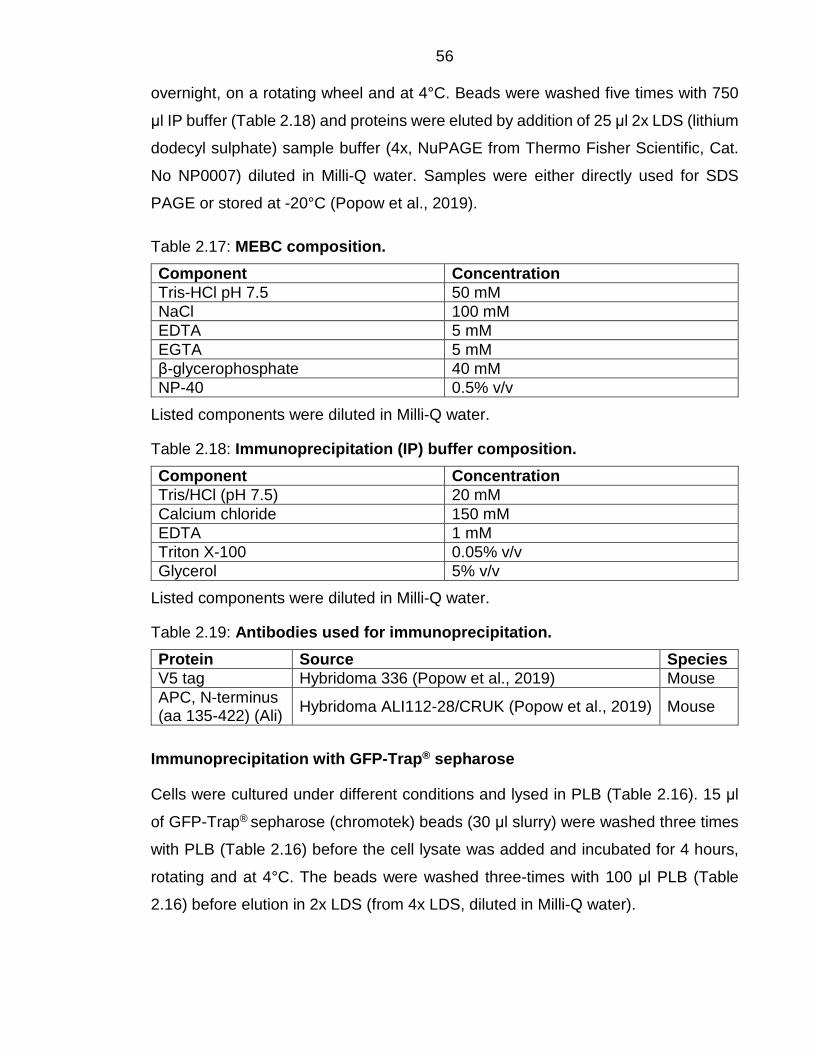
56 overnight, on a rotating wheel and at 4°C. Beads were washed five times with 750
μl IP buffer (Table 2.18) and proteins were eluted by addition of 25 μl 2x LDS (lithium
dodecyl sulphate) sample buffer (4x, NuPAGE from Thermo Fisher Scientific, Cat.
No NP0007) diluted in Milli-Q water. Samples were either directly used for SDS
PAGE or stored at -20°C (Popow et al., 2019).
Table 2.17: MEBC composition. Component Concentration Tris-HCl pH 7.5 50 mM NaCl 100 mM EDTA 5 mM EGTA 5 mM β-glycerophosphate 40 mM NP-40 0.5% v/v
Listed components were diluted in Milli-Q water.
Table 2.18: Immunoprecipitation (IP) buffer composition. Component Concentration Tris/HCl (pH 7.5) 20 mM Calcium chloride 150 mM EDTA 1 mM Triton X-100 0.05% v/v Glycerol 5% v/v
Listed components were diluted in Milli-Q water.
Table 2.19: Antibodies used for immunoprecipitation. Protein Source Species V5 tag Hybridoma 336 (Popow et al., 2019) Mouse APC, N-terminus (aa 135-422) (Ali) Hybridoma ALI112-28/CRUK (Popow et al., 2019) Mouse
Immunoprecipitation with GFP-Trap® sepharose
Cells were cultured under different conditions and lysed in PLB (Table 2.16). 15 μl
of GFP-Trap® sepharose (chromotek) beads (30 μl slurry) were washed three times
with PLB (Table 2.16) before the cell lysate was added and incubated for 4 hours,
rotating and at 4°C. The beads were washed three-times with 100 μl PLB (Table
2.16) before elution in 2x LDS (from 4x LDS, diluted in Milli-Q water).
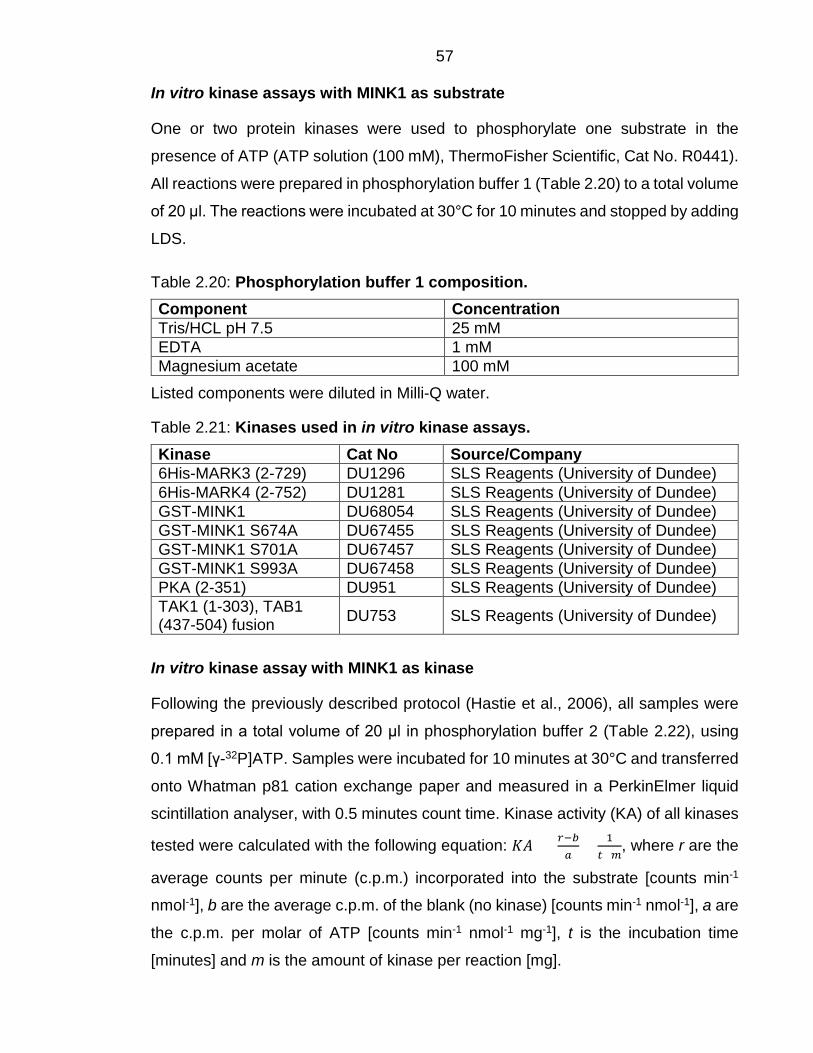
57 In vitro kinase assays with MINK1 as substrate
One or two protein kinases were used to phosphorylate one substrate in the
presence of ATP (ATP solution (100 mM), ThermoFisher Scientific, Cat No. R0441).
All reactions were prepared in phosphorylation buffer 1 (Table 2.20) to a total volume
of 20 μl. The reactions were incubated at 30°C for 10 minutes and stopped by adding
LDS.
Table 2.20: Phosphorylation buffer 1 composition. Component Concentration Tris/HCL pH 7.5 25 mM EDTA 1 mM Magnesium acetate 100 mM
Listed components were diluted in Milli-Q water.
Table 2.21: Kinases used in in vitro kinase assays. Kinase Cat No Source/Company 6His-MARK3 (2-729) DU1296 SLS Reagents (University of Dundee) 6His-MARK4 (2-752) DU1281 SLS Reagents (University of Dundee) GST-MINK1 DU68054 SLS Reagents (University of Dundee) GST-MINK1 S674A DU67455 SLS Reagents (University of Dundee) GST-MINK1 S701A DU67457 SLS Reagents (University of Dundee) GST-MINK1 S993A DU67458 SLS Reagents (University of Dundee) PKA (2-351) DU951 SLS Reagents (University of Dundee) TAK1 (1-303), TAB1 (437-504) fusion DU753 SLS Reagents (University of Dundee)
In vitro kinase assay with MINK1 as kinase
Following the previously described protocol (Hastie et al., 2006), all samples were
prepared in a total volume of 20 μl in phosphorylation buffer 2 (Table 2.22), using
0.1 mM [γ-32P]ATP. Samples were incubated for 10 minutes at 30°C and transferred
onto Whatman p81 cation exchange paper and measured in a PerkinElmer liquid
scintillation analyser, with 0.5 minutes count time. Kinase activity (KA) of all kinases
tested were calculated with the following equation: 𝐾𝐾𝐾𝐾 = 𝑟𝑟−𝑏𝑏𝑎𝑎
× 1𝑡𝑡×𝑚𝑚
, where r are the
average counts per minute (c.p.m.) incorporated into the substrate [counts min-1
nmol-1], b are the average c.p.m. of the blank (no kinase) [counts min-1 nmol-1], a are
the c.p.m. per molar of ATP [counts min-1 nmol-1 mg-1], t is the incubation time
[minutes] and m is the amount of kinase per reaction [mg].
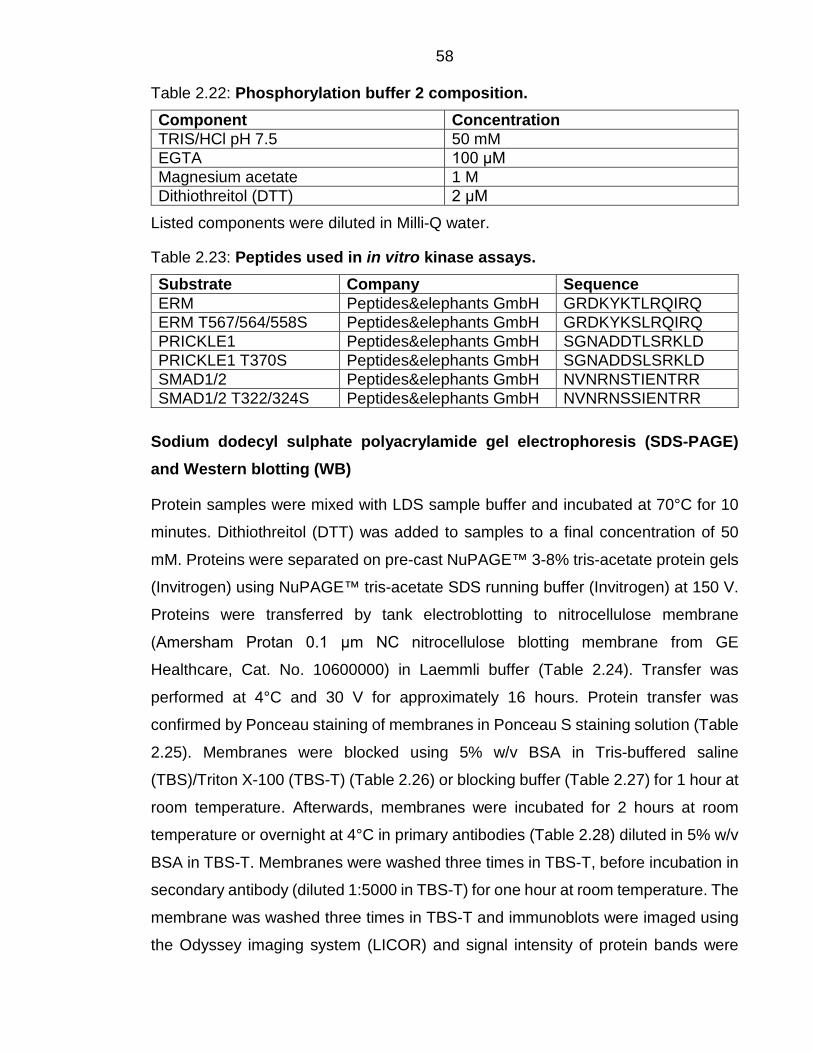
58 Table 2.22: Phosphorylation buffer 2 composition. Component Concentration TRIS/HCl pH 7.5 50 mM EGTA 100 μM Magnesium acetate 1 M Dithiothreitol (DTT) 2 μM
Listed components were diluted in Milli-Q water.
Table 2.23: Peptides used in in vitro kinase assays. Substrate Company Sequence ERM Peptides&elephants GmbH GRDKYKTLRQIRQ ERM T567/564/558S Peptides&elephants GmbH GRDKYKSLRQIRQ PRICKLE1 Peptides&elephants GmbH SGNADDTLSRKLD PRICKLE1 T370S Peptides&elephants GmbH SGNADDSLSRKLD SMAD1/2 Peptides&elephants GmbH NVNRNSTIENTRR SMAD1/2 T322/324S Peptides&elephants GmbH NVNRNSSIENTRR
Sodium dodecyl sulphate polyacrylamide gel electrophoresis (SDS-PAGE) and Western blotting (WB)
Protein samples were mixed with LDS sample buffer and incubated at 70°C for 10
minutes. Dithiothreitol (DTT) was added to samples to a final concentration of 50
mM. Proteins were separated on pre-cast NuPAGE™ 3-8% tris-acetate protein gels
(Invitrogen) using NuPAGE™ tris-acetate SDS running buffer (Invitrogen) at 150 V.
Proteins were transferred by tank electroblotting to nitrocellulose membrane
(Amersham Protan 0.1 μm NC nitrocellulose blotting membrane from GE
Healthcare, Cat. No. 10600000) in Laemmli buffer (Table 2.24). Transfer was
performed at 4°C and 30 V for approximately 16 hours. Protein transfer was
confirmed by Ponceau staining of membranes in Ponceau S staining solution (Table
2.25). Membranes were blocked using 5% w/v BSA in Tris-buffered saline
(TBS)/Triton X-100 (TBS-T) (Table 2.26) or blocking buffer (Table 2.27) for 1 hour at
room temperature. Afterwards, membranes were incubated for 2 hours at room
temperature or overnight at 4°C in primary antibodies (Table 2.28) diluted in 5% w/v
BSA in TBS-T. Membranes were washed three times in TBS-T, before incubation in
secondary antibody (diluted 1:5000 in TBS-T) for one hour at room temperature. The
membrane was washed three times in TBS-T and immunoblots were imaged using
the Odyssey imaging system (LICOR) and signal intensity of protein bands were
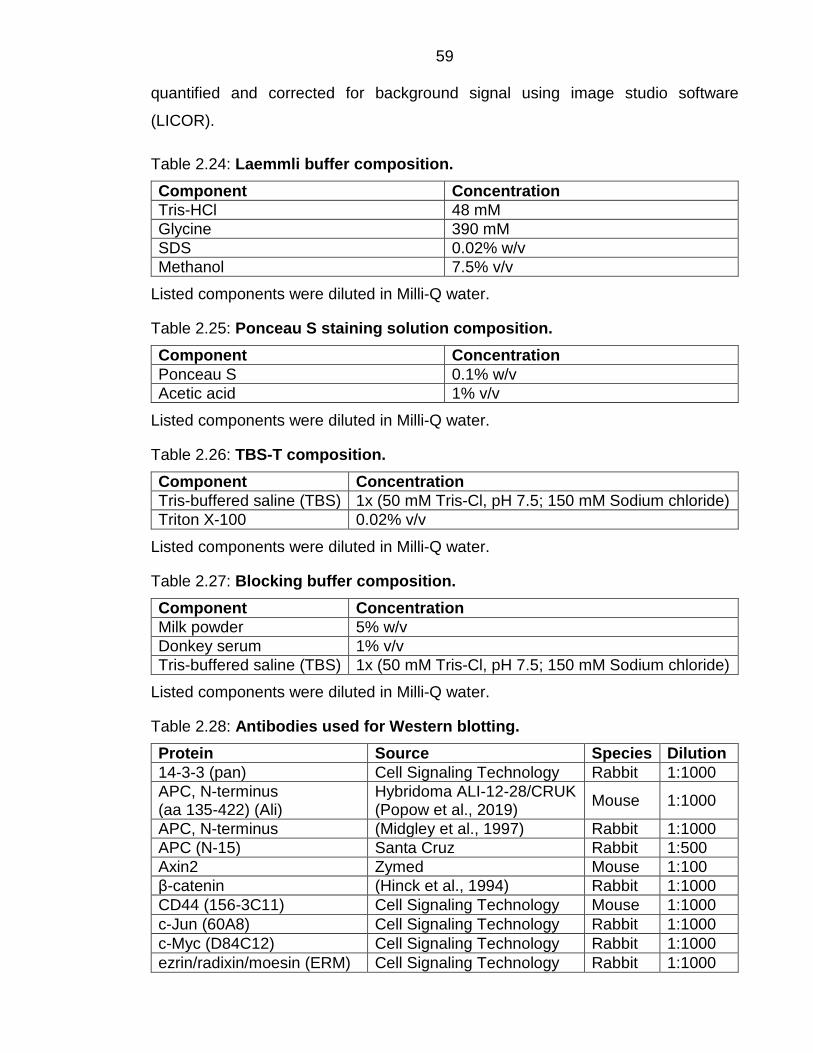
59 quantified and corrected for background signal using image studio software
(LICOR).
Table 2.24: Laemmli buffer composition. Component Concentration Tris-HCl 48 mM Glycine 390 mM SDS 0.02% w/v Methanol 7.5% v/v
Listed components were diluted in Milli-Q water.
Table 2.25: Ponceau S staining solution composition. Component Concentration Ponceau S 0.1% w/v Acetic acid 1% v/v
Listed components were diluted in Milli-Q water.
Table 2.26: TBS-T composition. Component Concentration Tris-buffered saline (TBS) 1x (50 mM Tris-Cl, pH 7.5; 150 mM Sodium chloride) Triton X-100 0.02% v/v
Listed components were diluted in Milli-Q water.
Table 2.27: Blocking buffer composition. Component Concentration Milk powder 5% w/v Donkey serum 1% v/v Tris-buffered saline (TBS) 1x (50 mM Tris-Cl, pH 7.5; 150 mM Sodium chloride)
Listed components were diluted in Milli-Q water.
Table 2.28: Antibodies used for Western blotting. Protein Source Species Dilution 14-3-3 (pan) Cell Signaling Technology Rabbit 1:1000 APC, N-terminus (aa 135-422) (Ali)
Hybridoma ALI-12-28/CRUK (Popow et al., 2019) Mouse 1:1000
APC, N-terminus (Midgley et al., 1997) Rabbit 1:1000 APC (N-15) Santa Cruz Rabbit 1:500 Axin2 Zymed Mouse 1:100 β-catenin (Hinck et al., 1994) Rabbit 1:1000 CD44 (156-3C11) Cell Signaling Technology Mouse 1:1000 c-Jun (60A8) Cell Signaling Technology Rabbit 1:1000 c-Myc (D84C12) Cell Signaling Technology Rabbit 1:1000 ezrin/radixin/moesin (ERM) Cell Signaling Technology Rabbit 1:1000
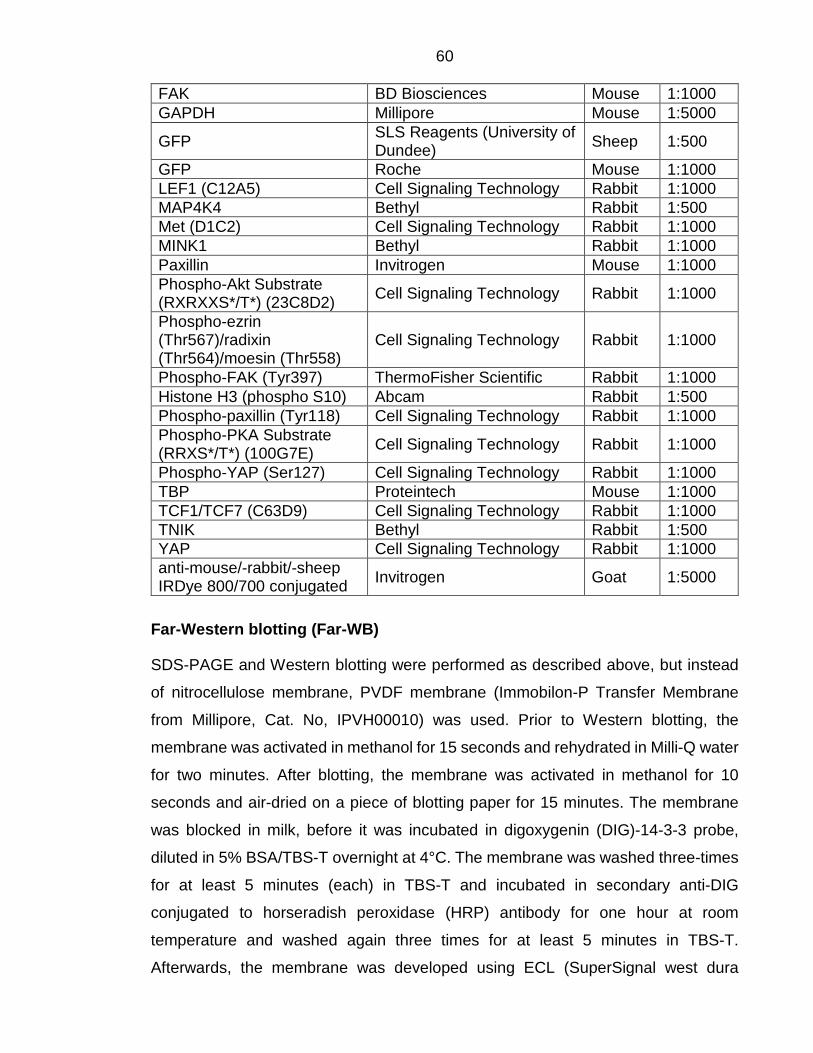
60 FAK BD Biosciences Mouse 1:1000 GAPDH Millipore Mouse 1:5000
GFP SLS Reagents (University of Dundee) Sheep 1:500
GFP Roche Mouse 1:1000 LEF1 (C12A5) Cell Signaling Technology Rabbit 1:1000 MAP4K4 Bethyl Rabbit 1:500 Met (D1C2) Cell Signaling Technology Rabbit 1:1000 MINK1 Bethyl Rabbit 1:1000 Paxillin Invitrogen Mouse 1:1000 Phospho-Akt Substrate (RXRXXS*/T*) (23C8D2) Cell Signaling Technology Rabbit 1:1000
Phospho-ezrin (Thr567)/radixin (Thr564)/moesin (Thr558)
Cell Signaling Technology Rabbit 1:1000
Phospho-FAK (Tyr397) ThermoFisher Scientific Rabbit 1:1000 Histone H3 (phospho S10) Abcam Rabbit 1:500 Phospho-paxillin (Tyr118) Cell Signaling Technology Rabbit 1:1000 Phospho-PKA Substrate (RRXS*/T*) (100G7E) Cell Signaling Technology Rabbit 1:1000
Phospho-YAP (Ser127) Cell Signaling Technology Rabbit 1:1000 TBP Proteintech Mouse 1:1000 TCF1/TCF7 (C63D9) Cell Signaling Technology Rabbit 1:1000 TNIK Bethyl Rabbit 1:500 YAP Cell Signaling Technology Rabbit 1:1000 anti-mouse/-rabbit/-sheep IRDye 800/700 conjugated Invitrogen Goat 1:5000
Far-Western blotting (Far-WB)
SDS-PAGE and Western blotting were performed as described above, but instead
of nitrocellulose membrane, PVDF membrane (Immobilon-P Transfer Membrane
from Millipore, Cat. No, IPVH00010) was used. Prior to Western blotting, the
membrane was activated in methanol for 15 seconds and rehydrated in Milli-Q water
for two minutes. After blotting, the membrane was activated in methanol for 10
seconds and air-dried on a piece of blotting paper for 15 minutes. The membrane
was blocked in milk, before it was incubated in digoxygenin (DIG)-14-3-3 probe,
diluted in 5% BSA/TBS-T overnight at 4°C. The membrane was washed three-times
for at least 5 minutes (each) in TBS-T and incubated in secondary anti-DIG
conjugated to horseradish peroxidase (HRP) antibody for one hour at room
temperature and washed again three times for at least 5 minutes in TBS-T.
Afterwards, the membrane was developed using ECL (SuperSignal west dura
61 extended duration substrate from Thermo Scientific, Prod # 34076) and exposure to
chemiluminescence film (Amersham hyperfilm ECL from GE Healthcare, Cat. No.
28906837) (RUBIO et al., 2004).
DIG-labelled 14-3-3 probe was previously produced in the in the MacKintosh lab.
Specifically, His-tagged yeast 14-3-3 (BMH1 and BMH2 isoforms) proteins were
expressed and purified (using a Nickel-NTA column) by the SLS reagents (University
of Dundee). BMH1 and BMH2 (50 μg each) were mixed and incubated at room
temperature in PBS (pH 8.5) for 10 minutes to form BMH1/BMH2 dimers.
Digoxygenin aminocapric acid N-hydroxysuccinimide (DIG-NHS) ester (10 μg) was
added to the BMH1/BMH2 mixture and incubated at room temperature for 2 hours
by gently mixing on a rocking platform. The mixture was dialysed in Slide-A-Lyzer
dialysis cassettes (10,000 MW cut-off) against PBS (pH 7.2) overnight at 4°C,
changing the dialysate (PBS) at least twice. DIG-labelled 14-3-3 (BMH1/BMH2)
protein was removed from the dialysis cassette, aliquoted and stored at -20°C
(Moorhead et al., 1999).
Mass spectrometry and phosphorylation site mapping
Samples for mass spectrometry and phosphorylation site mapping analysis were
separated by SDS PAGE (described above, page 58). SDS gels were stained with
Coomassie (using Quick Coomassie stain from Generon) following the
manufacturer’s protocol for staining and detaining. Sample bands selected for
analysis were cut out of the gel and further processed by the FingerPrints proteomics
and mass spectrometry facility at the School of Life Sciences (University of Dundee).
The facility further processed the gel bands using their optimised in-gel digestion
protocol that included in-gel reduction/alkylation, in-gel trypsin digestion followed by
peptide extraction. Extracted peptides were run by nano-scale liquid
chromatographic tandem mass spectrometry (nLC-MS/MS). MS/MS data was
analysed by the FingerPrints facility, utilising database searching with proteome
discoverer (Thermo Scientific) and Mascot (Matrix Science), to identify the protein
and sites of phosphorylation.
62 Luciferase assay
Cells were transfected with TOP/FOP vectors (see above, page 45). The cells were
washed twice with PBS and lysed in reporter lysis buffer (Promega #E3971), scraped
of the dish using a cell scraper, transferred to a 1.5 ml microcentrifuge tube and
frozen in liquid nitrogen. Afterwards, the lysate was thawed quickly and from there
on handled on ice. The lysate was vortexed for 10 to 15 seconds and spun down for
2 minutes at 12000 x g at 4°C. The pallet was discarded and three aliquots of the
supernatant were transferred to luminometer tubes. 100 μl luciferase assay
substrate (Promega, Part# E151A) were added to each 20 μl aliquot and the samples
were measured with a luminometer. The measurements of the three aliquots were
averaged for each sample.

63 Cell migration
Migration data analysis
Acquired movies of migrating and confluent cells were edited with ImageJ (version
Fiji-1.51n) and analysed using MATLAB (from MathWorks, version R2017a and
R2019b). In ImageJ movies were converted to 8-bit and regression was applied
using the Rigid Body option of the StagReg command. Afterwards the movies were
saved as single images, which were then used in MATLAB for particle image
velocimetry (PIV) analysis. The PIV data was further analysed in MATLAB. All used
MATLAB scripts are described in detail in the Appendix.
64 3. Interaction of APC and MINK1
Summary
APC is important for maintaining the balance between proliferation, cell loss,
differentiation and cell migration and therefore its loss or mutation affects epithelial
tissue homeostasis profoundly. Whereas the mechanisms for its role in Wnt
signalling are becoming clearer, how APC regulates the cytoskeleton is less well
understood. Investigating how APC is involved in cytoskeletal regulation, MINK1 was
identified as an interaction partner of APC. APC negatively regulates MINK1 and this
regulation is independent of β-catenin and Wnt signalling (Popow et al., 2019). To
further characterise the association between APC and MINK1, I aimed to identify the
domains of each protein involved in their association and could show that the N-
terminal domain of APC associates with the linker domain of MINK1.
Moreover, MINK1 is one of four ohnologues: MINK1, tumour necrosis factor (TNF)
receptor-associated factor 2 (TRAF2) and NCK-interacting protein kinase (TNIK),
mitogen-activated protein kinase kinase kinase kinase 4 (MAP4K4) and Nik-related
protein kinase (NRK). All four ohnologues are part of the same kinase subfamily
(Figure 1.4) and share the same domain structure, with an N-terminal kinase domain,
an intermediate linker domain and a C-terminal citron homology (CNH) domain
(Figure 1.5). TNIK and MINK1 are most closely related and have the highest
sequence homology. MAP4K4 is their next closest relative and NRK is most different
from the other three proteins. The highest similarity between the ohnologues lies in
their kinase- and CNH domains and their linker domains are more diverse. The close
similarity between the ohnologues raised the hypothesis that they might compensate
for each other upon depletion/deletion of one of them. Therefore, I investigated
whether TNIK, MAP4K4, or NRK are transcriptionally or translationally upregulated
upon depletion or deletion of MINK1. My experiments revealed that NRK and
MAP4K4 are unlikely to compensate for MINK1. However, TNIK expression was
increased upon MINK1 deletion, which is in agreement with another study from Tnik
knockout mice, where transcriptional Mink1 levels were increased (Masuda et al.,

65 2016b). Therefore, the potential compensation of TNIK will need to be considered in
experiments were MINK1 is deleted.
66 Inducible MINK1 overexpression in cells leads to 5- to 9-fold MINK1 expression compared to the endogenous protein levels
APC is mutated in most colorectal cancers. With its main functions in Wnt signalling
and cytoskeletal regulation, the APC protein is important for epithelial homeostasis
by maintaining balance between proliferation, cell loss, differentiation and cell
migration. The mechanisms for APC’s role in Wnt signalling are well established,
however how APC regulates the cytoskeleton is less well understood. APC
associates with MINK1, which leads to negative regulation of the later. This
interaction between MINK1 and APC is also independent of β-catenin and Wnt
signalling (Popow et al., 2019). To further investigate how APC and MINK1 are
associated, human epithelial U2OS and SW480 cells were employed. U2OS cells
were used to investigate the interaction between full-length APC and MINK1, since
all intestinal epithelial cell lines carry APC mutations. However, MINK1 might have
a different effect on epithelial homeostasis in U2OS cells compared to colorectal
cancer cells and/or intestinal epithelium. Therefore, it was initially planned to validate
all results from experiments in U2OS cells in intestinal epithelium of mice or gut
organoids (from these mice). The generation of a conditional Mink1 knockout mouse
was commissioned to Taconic Biosciences for this purpose, but its generation was
not successfully completed in time (see chapter 8 Appendix). Moreover, stable
U2OS cell lines with MINK1 knockout by CRISPR/Cas9 and stable U2OS cell lines
overexpressing MINK1 (MINK1-GFP) were already available in our lab, as well as
U2OS Flp-In T-REx cells to generate further stable cell lines with MINK1 domain
constructs. APC negatively regulates MINK1 and APC mutations lead to higher
levels of MINK1 protein (Popow et al., 2019). To mimic this effect tetracycline-
inducible MINK1-overexpressing cells were created, allowing MINK1 tagged with
GFP on the C- or N-terminus (MINK1-GFP and GFP-MINK1 cells) to be expressed.
Overexpression of MINK1-GFP could be titrated using increasing concentrations of
tetracycline (2.5 ng/ml to 2500 ng/ml). Expression of MINK1 was measured by RT-
qPCR and compared to uninduced cell, expressing only endogenous MINK1. To this
end, mRNA was isolated from cells after 24 hours and 48 hours of tetracycline
treatment. mRNA was reverse transcribed into cDNA and MINK1 expression was
analysed with RT-qPCR and normalized to actin and uninduced control cells
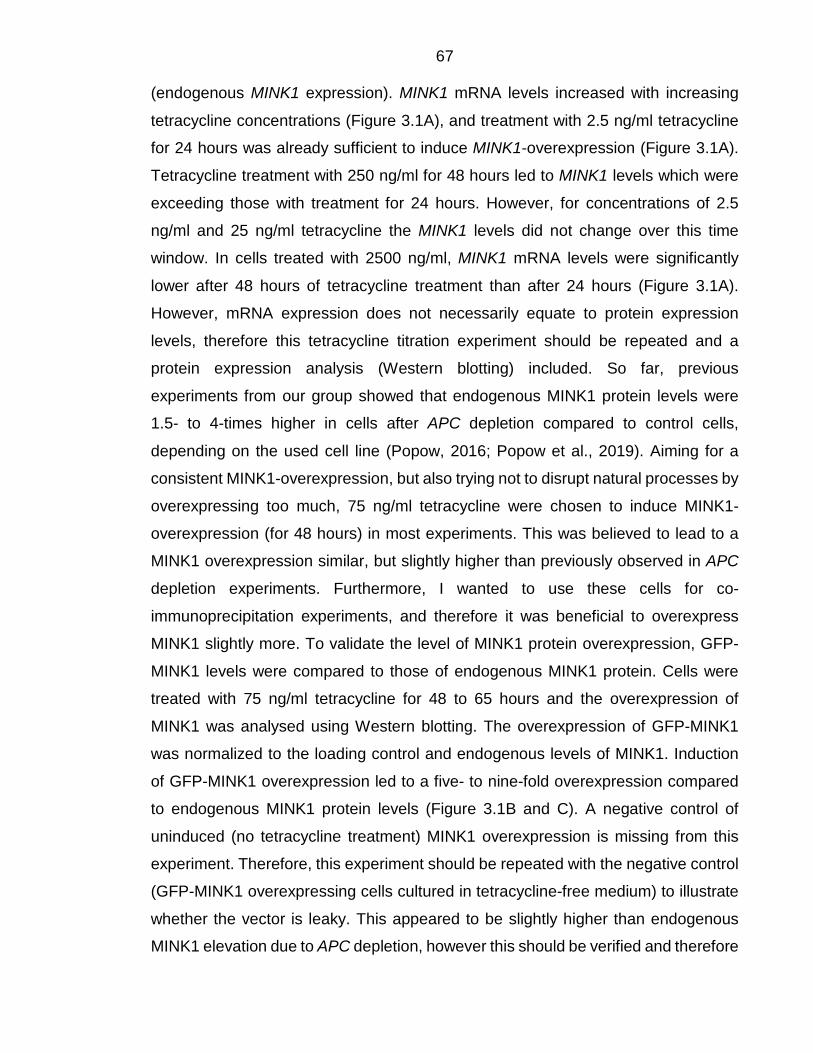
67 (endogenous MINK1 expression). MINK1 mRNA levels increased with increasing
tetracycline concentrations (Figure 3.1A), and treatment with 2.5 ng/ml tetracycline
for 24 hours was already sufficient to induce MINK1-overexpression (Figure 3.1A).
Tetracycline treatment with 250 ng/ml for 48 hours led to MINK1 levels which were
exceeding those with treatment for 24 hours. However, for concentrations of 2.5
ng/ml and 25 ng/ml tetracycline the MINK1 levels did not change over this time
window. In cells treated with 2500 ng/ml, MINK1 mRNA levels were significantly
lower after 48 hours of tetracycline treatment than after 24 hours (Figure 3.1A).
However, mRNA expression does not necessarily equate to protein expression
levels, therefore this tetracycline titration experiment should be repeated and a
protein expression analysis (Western blotting) included. So far, previous
experiments from our group showed that endogenous MINK1 protein levels were
1.5- to 4-times higher in cells after APC depletion compared to control cells,
depending on the used cell line (Popow, 2016; Popow et al., 2019). Aiming for a
consistent MINK1-overexpression, but also trying not to disrupt natural processes by
overexpressing too much, 75 ng/ml tetracycline were chosen to induce MINK1-
overexpression (for 48 hours) in most experiments. This was believed to lead to a
MINK1 overexpression similar, but slightly higher than previously observed in APC
depletion experiments. Furthermore, I wanted to use these cells for co-
immunoprecipitation experiments, and therefore it was beneficial to overexpress
MINK1 slightly more. To validate the level of MINK1 protein overexpression, GFP-
MINK1 levels were compared to those of endogenous MINK1 protein. Cells were
treated with 75 ng/ml tetracycline for 48 to 65 hours and the overexpression of
MINK1 was analysed using Western blotting. The overexpression of GFP-MINK1
was normalized to the loading control and endogenous levels of MINK1. Induction
of GFP-MINK1 overexpression led to a five- to nine-fold overexpression compared
to endogenous MINK1 protein levels (Figure 3.1B and C). A negative control of
uninduced (no tetracycline treatment) MINK1 overexpression is missing from this
experiment. Therefore, this experiment should be repeated with the negative control
(GFP-MINK1 overexpressing cells cultured in tetracycline-free medium) to illustrate
whether the vector is leaky. This appeared to be slightly higher than endogenous
MINK1 elevation due to APC depletion, however this should be verified and therefore
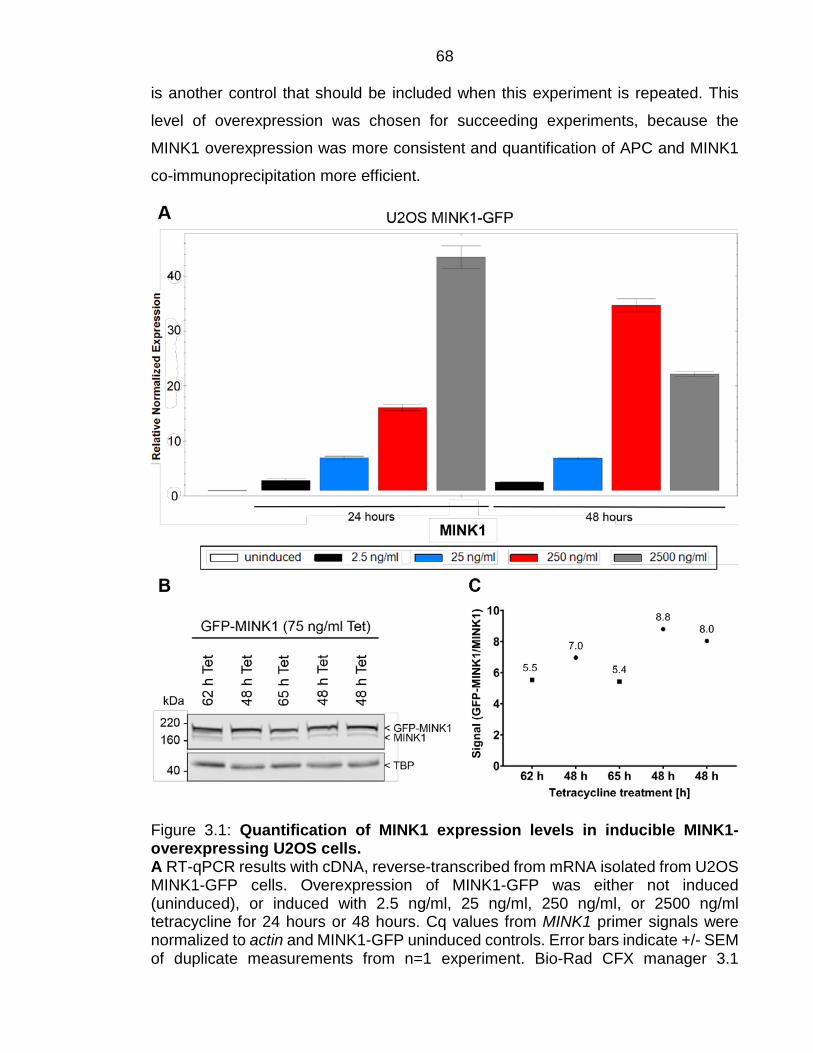
68 is another control that should be included when this experiment is repeated. This
level of overexpression was chosen for succeeding experiments, because the
MINK1 overexpression was more consistent and quantification of APC and MINK1
co-immunoprecipitation more efficient.
Figure 3.1: Quantification of MINK1 expression levels in inducible MINK1-overexpressing U2OS cells. A RT-qPCR results with cDNA, reverse-transcribed from mRNA isolated from U2OS MINK1-GFP cells. Overexpression of MINK1-GFP was either not induced (uninduced), or induced with 2.5 ng/ml, 25 ng/ml, 250 ng/ml, or 2500 ng/ml tetracycline for 24 hours or 48 hours. Cq values from MINK1 primer signals were normalized to actin and MINK1-GFP uninduced controls. Error bars indicate +/- SEM of duplicate measurements from n=1 experiment. Bio-Rad CFX manager 3.1

69 software was used to analyse the data. B Western blotting of U2OS GFP-MINK1 cell lysates. Cells were lysed after two days (48-65 hours) of treatment with 75 ng/ml tetracycline (Tet). Western blotting with antibodies against MINK1. TBP was used as loading control. C Western blotting signals were quantified using the image studio lite software (version 5.2) from LI-COR and signals of GFP-MINK1 and endogenous MINK1 were normalized to TBP. Ratios of GFP-MINK1 signals to endogenous MINK1 are displayed.
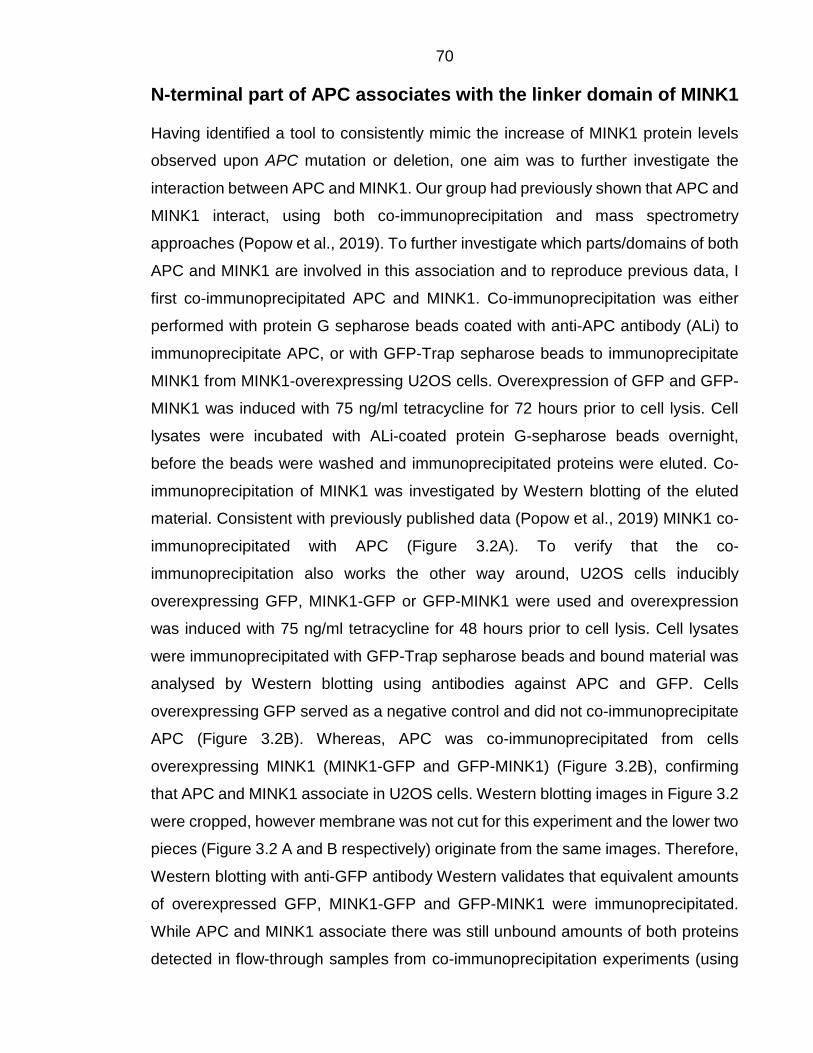
70 N-terminal part of APC associates with the linker domain of MINK1
Having identified a tool to consistently mimic the increase of MINK1 protein levels
observed upon APC mutation or deletion, one aim was to further investigate the
interaction between APC and MINK1. Our group had previously shown that APC and
MINK1 interact, using both co-immunoprecipitation and mass spectrometry
approaches (Popow et al., 2019). To further investigate which parts/domains of both
APC and MINK1 are involved in this association and to reproduce previous data, I
first co-immunoprecipitated APC and MINK1. Co-immunoprecipitation was either
performed with protein G sepharose beads coated with anti-APC antibody (ALi) to
immunoprecipitate APC, or with GFP-Trap sepharose beads to immunoprecipitate
MINK1 from MINK1-overexpressing U2OS cells. Overexpression of GFP and GFP-
MINK1 was induced with 75 ng/ml tetracycline for 72 hours prior to cell lysis. Cell
lysates were incubated with ALi-coated protein G-sepharose beads overnight,
before the beads were washed and immunoprecipitated proteins were eluted. Co-
immunoprecipitation of MINK1 was investigated by Western blotting of the eluted
material. Consistent with previously published data (Popow et al., 2019) MINK1 co-
immunoprecipitated with APC (Figure 3.2A). To verify that the co-
immunoprecipitation also works the other way around, U2OS cells inducibly
overexpressing GFP, MINK1-GFP or GFP-MINK1 were used and overexpression
was induced with 75 ng/ml tetracycline for 48 hours prior to cell lysis. Cell lysates
were immunoprecipitated with GFP-Trap sepharose beads and bound material was
analysed by Western blotting using antibodies against APC and GFP. Cells
overexpressing GFP served as a negative control and did not co-immunoprecipitate
APC (Figure 3.2B). Whereas, APC was co-immunoprecipitated from cells
overexpressing MINK1 (MINK1-GFP and GFP-MINK1) (Figure 3.2B), confirming
that APC and MINK1 associate in U2OS cells. Western blotting images in Figure 3.2
were cropped, however membrane was not cut for this experiment and the lower two
pieces (Figure 3.2 A and B respectively) originate from the same images. Therefore,
Western blotting with anti-GFP antibody Western validates that equivalent amounts
of overexpressed GFP, MINK1-GFP and GFP-MINK1 were immunoprecipitated.
While APC and MINK1 associate there was still unbound amounts of both proteins
detected in flow-through samples from co-immunoprecipitation experiments (using
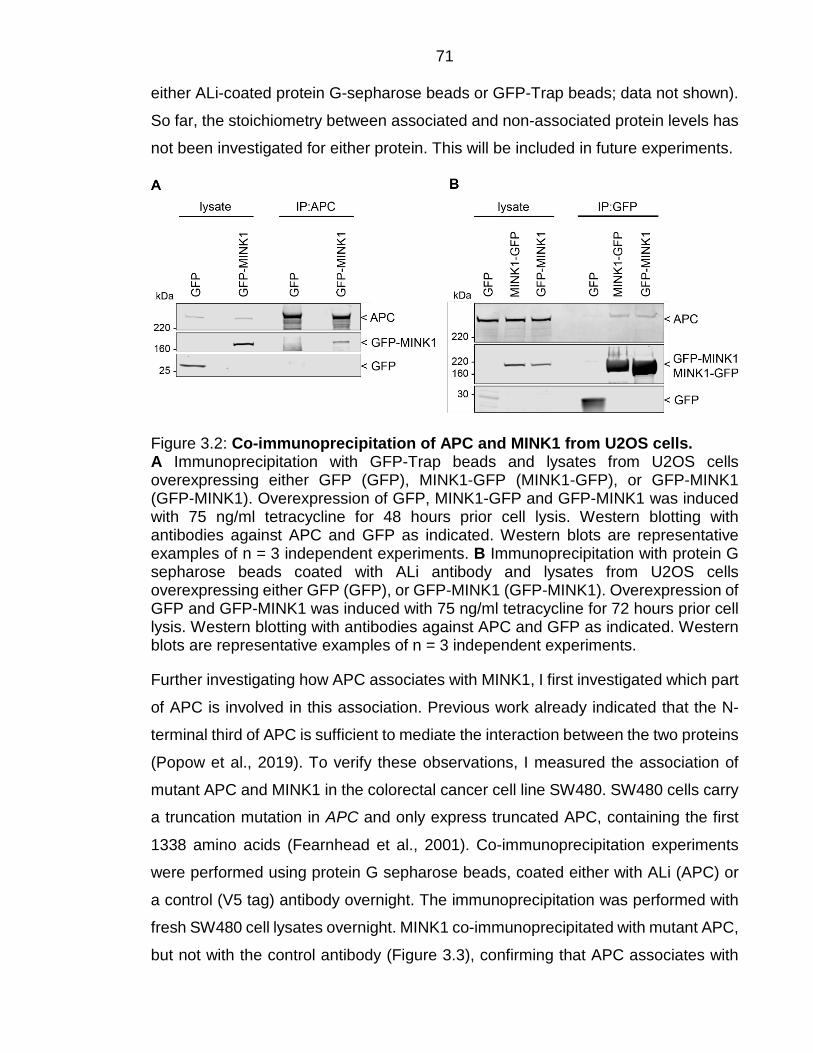
71 either ALi-coated protein G-sepharose beads or GFP-Trap beads; data not shown).
So far, the stoichiometry between associated and non-associated protein levels has
not been investigated for either protein. This will be included in future experiments.
Figure 3.2: Co-immunoprecipitation of APC and MINK1 from U2OS cells. A Immunoprecipitation with GFP-Trap beads and lysates from U2OS cells overexpressing either GFP (GFP), MINK1-GFP (MINK1-GFP), or GFP-MINK1 (GFP-MINK1). Overexpression of GFP, MINK1-GFP and GFP-MINK1 was induced with 75 ng/ml tetracycline for 48 hours prior cell lysis. Western blotting with antibodies against APC and GFP as indicated. Western blots are representative examples of n = 3 independent experiments. B Immunoprecipitation with protein G sepharose beads coated with ALi antibody and lysates from U2OS cells overexpressing either GFP (GFP), or GFP-MINK1 (GFP-MINK1). Overexpression of GFP and GFP-MINK1 was induced with 75 ng/ml tetracycline for 72 hours prior cell lysis. Western blotting with antibodies against APC and GFP as indicated. Western blots are representative examples of n = 3 independent experiments.
Further investigating how APC associates with MINK1, I first investigated which part
of APC is involved in this association. Previous work already indicated that the N-
terminal third of APC is sufficient to mediate the interaction between the two proteins
(Popow et al., 2019). To verify these observations, I measured the association of
mutant APC and MINK1 in the colorectal cancer cell line SW480. SW480 cells carry
a truncation mutation in APC and only express truncated APC, containing the first
1338 amino acids (Fearnhead et al., 2001). Co-immunoprecipitation experiments
were performed using protein G sepharose beads, coated either with ALi (APC) or
a control (V5 tag) antibody overnight. The immunoprecipitation was performed with
fresh SW480 cell lysates overnight. MINK1 co-immunoprecipitated with mutant APC,
but not with the control antibody (Figure 3.3), confirming that APC associates with

72 MINK1 via its N-terminal domains, in agreement with the previous study. To verify
that the C-terminal domains of APC are indeed dispensable for the association with
MINK1 another co-immunoprecipitation experiment should be conducted, comparing
the co-immunoprecipitation of MINK1 with APC (and the other way around).
Therefore, I would use the same cell line and co-immunoprecipitate MINK1 and APC
with either the ALi antibody or the GFP-Trap beads and compare the results between
cells expressing full-length APC to cells expressing N-terminal APC fragments.
Moreover, in some Western blotting experiments MINK1 co-immunoprecipitated with
APC ran slightly higher in comparison to the lysate (e.g. Figure 3.3). This could
indicate that only phosphorylated MINK1 associated with APC. However, this was
not observed in all co-immunoprecipitation experiments and might therefore be due
experimental setting (i.e. running of the gel). Additionally in this case the membrane
was also not scanned completely straight, which also impacts this observation.
Figure 3.3: Co-immunoprecipitation of APC and MINK1 from SW480 cells. Immunoprecipitation with ALi-coated (APC IP) and V5 tag-coated (ctrl IP) protein G sepharose beads and lysates from SW480 cells. Western blotting with antibodies against APC and MINK1 as indicated. Representative results for n = 2 experiments.
So far, it was not known which domain of MINK1 mediates the association with APC.
MINK1 belongs to the Ste20 kinase family and the germinal centre kinase (GCK)
subfamily. All GCKs have three domains: an N-terminal kinase domain, an
intermediate linker domain and a C-terminal citron homology (CNH) domain (Dan et
al., 2000). To identify the MINK1 domain that associates with APC, stable U2OS cell
lines were generated that each inducibly overexpress one of these MINK1 domains
tagged with GFP at either their N-, or C-terminus. U2OS GFP cells were used as a
negative control and MINK1-GFP cells were used as positive control. Cells
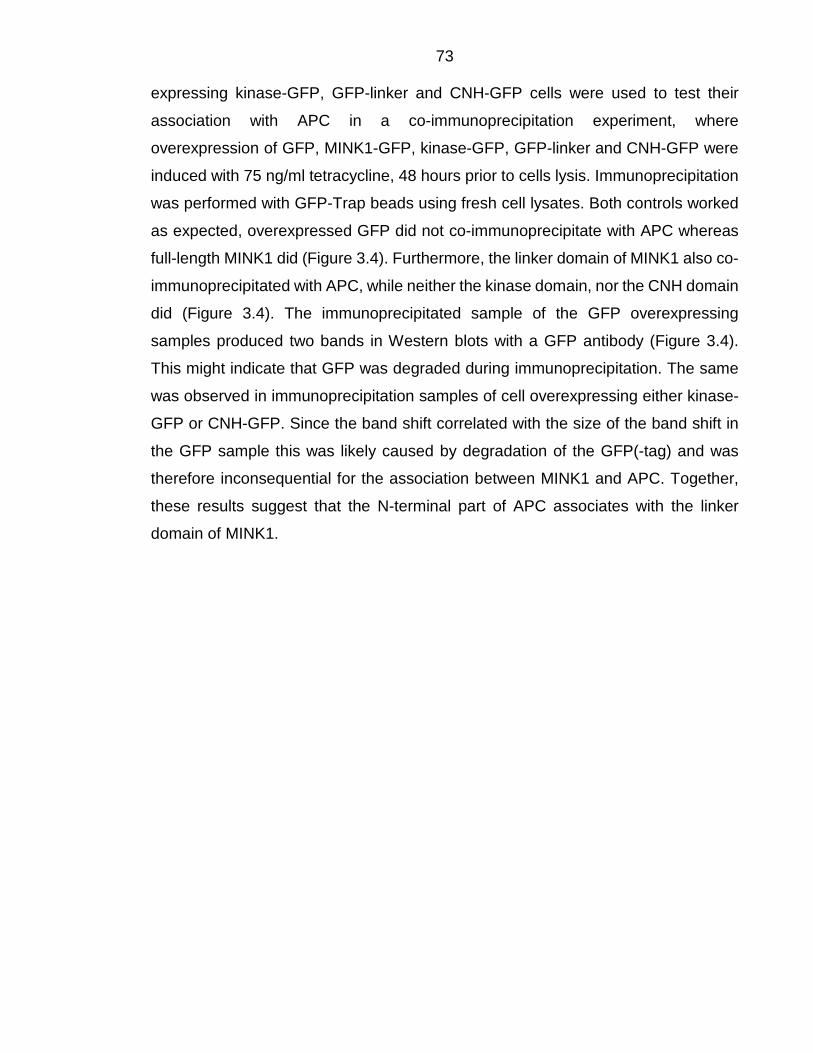
73 expressing kinase-GFP, GFP-linker and CNH-GFP cells were used to test their
association with APC in a co-immunoprecipitation experiment, where
overexpression of GFP, MINK1-GFP, kinase-GFP, GFP-linker and CNH-GFP were
induced with 75 ng/ml tetracycline, 48 hours prior to cells lysis. Immunoprecipitation
was performed with GFP-Trap beads using fresh cell lysates. Both controls worked
as expected, overexpressed GFP did not co-immunoprecipitate with APC whereas
full-length MINK1 did (Figure 3.4). Furthermore, the linker domain of MINK1 also co-
immunoprecipitated with APC, while neither the kinase domain, nor the CNH domain
did (Figure 3.4). The immunoprecipitated sample of the GFP overexpressing
samples produced two bands in Western blots with a GFP antibody (Figure 3.4).
This might indicate that GFP was degraded during immunoprecipitation. The same
was observed in immunoprecipitation samples of cell overexpressing either kinase-
GFP or CNH-GFP. Since the band shift correlated with the size of the band shift in
the GFP sample this was likely caused by degradation of the GFP(-tag) and was
therefore inconsequential for the association between MINK1 and APC. Together,
these results suggest that the N-terminal part of APC associates with the linker
domain of MINK1.
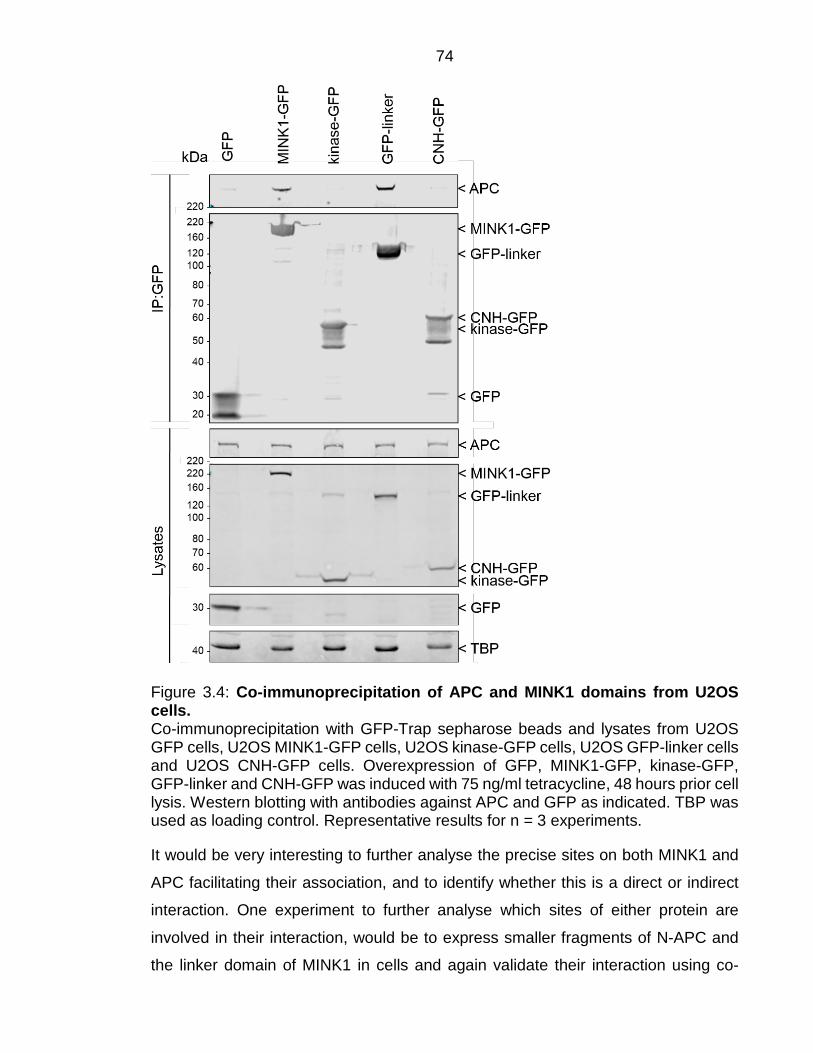
74
Figure 3.4: Co-immunoprecipitation of APC and MINK1 domains from U2OS cells. Co-immunoprecipitation with GFP-Trap sepharose beads and lysates from U2OS GFP cells, U2OS MINK1-GFP cells, U2OS kinase-GFP cells, U2OS GFP-linker cells and U2OS CNH-GFP cells. Overexpression of GFP, MINK1-GFP, kinase-GFP, GFP-linker and CNH-GFP was induced with 75 ng/ml tetracycline, 48 hours prior cell lysis. Western blotting with antibodies against APC and GFP as indicated. TBP was used as loading control. Representative results for n = 3 experiments.
It would be very interesting to further analyse the precise sites on both MINK1 and
APC facilitating their association, and to identify whether this is a direct or indirect
interaction. One experiment to further analyse which sites of either protein are
involved in their interaction, would be to express smaller fragments of N-APC and
the linker domain of MINK1 in cells and again validate their interaction using co-
75 immunoprecipitation. There are also many other methods to investigate protein-
protein interactions (PPIs), all with their specific set of advantages, disadvantages
and limitations (Rao et al., 2014). To verify whether MINK1 exists in a complex in
vivo, one approach would be to run both the recombinant protein (GST-MINK1) and
cell extract through a gel filtration column. By afterwards running different fractions
on an SDS gel and Western blotting with anti-MINK1 antibody, it would be possible
to identify whether endogenous MINK1 exists as a complex or multimer in vivo. To
investigate whether APC and MINK1 interact directly, an in vivo approach would be
a yeast two-hybrid screening. For this assay, both human proteins need to be
expressed in yeast strains. One protein is fused to a ‘bait’ (e.g. Gal4p DNA-binding
domain (DBD)), while the other protein is fused to a ‘prey’ (e.g. Gal4p transcriptional
activation domain (AD)). Both yeast strains are then mated to generate diploid cells.
If the proteins interact a reporter gene is activated (e.g. HIS3) which allows for a read
out typically though growth selective media (e.g. media lacking histidine) or a colour
change of the co-culture (e.g. LacZ) (Fields and Song, 1989). However, in vitro
interaction between APC and MINK1, or its co-immunoprecipitation form cell lysates,
does not necessarily reflect in vivo interactions in cells. Previous results indicate that
APC and endogenous MINK1 co-localise (Popow et al., 2019). Further
immunofluorescent staining could inform co-localisation of APC and MINK1.
Moreover, once exact association sites on both proteins have been identified cell
lines with either mutant APC or mutant MINK1 could be generated to verify that
MINK1 and APC associate. I could already show that the kinase- and CNH-domains
of MINK1 are not sufficient to associate with APC.
76 TNIK might compensate for MINK1 deletion
MINK1 has three ohnologues in vertebrates all of which are homologues of the
Drosophila protein misshapen (msn). Sister ohnologues usually share certain
functions, but they also often have distinct functions and/or expression patterns and
can be regulated differently.
Potential compensation of these ohnologues has been previously suggested in Tnik
knockout mice. Depleting Tnik caused transcriptional upregulation of Mink1 and Nrk
by 2.8- and 1.2-fold respectively, but did not alter Map4k4 expression (Masuda et
al., 2016b). To address the possibility that MINK1 ohnologues, TNIK, MAP4K4 and
NRK, could compensate for MINK1 upon its depletion and/or deletion, their
transcriptional and translational levels were investigated upon MINK1 depletion and
deletion, and also upon APC depletion. Moreover, TNIK, MAP4K4 and NRK protein
levels were analysed in mouse intestinal organoids from wild-type and Apc mutant
mice. Western blotting analysis of cell lines was performed with fresh lysates from
U2OS cells treated with control siRNA (ctrl KD), APC siRNA (APC KD), or MINK1
siRNA (MINK1 KD), with fresh lysates from HeLa mNeon-MINK1 cells, U2OS
mNeon-MINK1 cells, U2OS cells (U2OS wt) and U2OS MINK1 knockout cells (U2OS
MINK1 KO, two different clones, 5 and 10). Generation of U2OS MINK1 KO cells
has been previously described and successful KO was verified by amplification of
genomic DNA of MINK1 KO cells by PCR and sequencing. Additionally, MINK1
protein expression was screened by Western blotting analysis (Popow et al.,
2019).Western blotting was performed with antibodies against APC, MINK1, TNIK,
MAP4K4 and TBP (as loading control) (Figure 3.5A). The Western blotting signals
were quantified and normalized against TBP and the control for each cell
type/genotype (Figure 3.5B). RT-qPCR was performed from cDNA samples, which
were reverse-transcribed from mRNA samples, isolated from U2OS cells. U2OS
cells were treated with control siRNA (ctrl KD), APC siRNA (APC KD), or MINK1
siRNA (MINK1 KD) prior to RNA isolation. Additionally, mRNA was isolated from
MINK1 depleted U2OS cell (U2OS MINK1 KO) and parental U2OS cells (Figure 3.6).
MINK1 depletion in U2OS cells led to slight, but not significant increase in TNIK and
MAP4K4 protein levels (Figure 3.5), while their expression was slightly reduced at
77 the transcriptional level (Figure 3.6B). APC depletion in U2OS cells led to a slight
increase in MINK1, TNIK and MAP4K4 protein (Figure 3.5) and to an increase in
MINK1 mRNA (Figure 3.6B). TNIK mRNA levels on the other hand were reduced
and MAP4K4 mRNA level did not change upon APC depletion (APC KD) (Figure
3.6B). MINK1 deletion in U2OS cells lead to a small, but significant increase of TNIK
protein levels in one MINK1 KO clone (U2OS MINK1 KO 5), but not in another clone
(U2OS MINK1 KO 10) (Figure 3.5). Additionally, MINK1 deletion (MINK1 KO) did not
change MAP4K4 protein levels (Figure 3.5). Moreover, MINK1 deletion lead to a
slight increase in both U2OS MINK1 KO clones tested (Figure 3.6A). Together, this
indicates that TNIK might compensate for MINK1 deletion at least at the translational
level (Figure 3.5). NRK mRNA levels were very low in U2OS cells overall, and
decreased even more upon APC, or MINK1 depletion (Figure 3.6A), and were
slightly reduced in U2OS MINK1 knockout cells (Figure 3.6B).
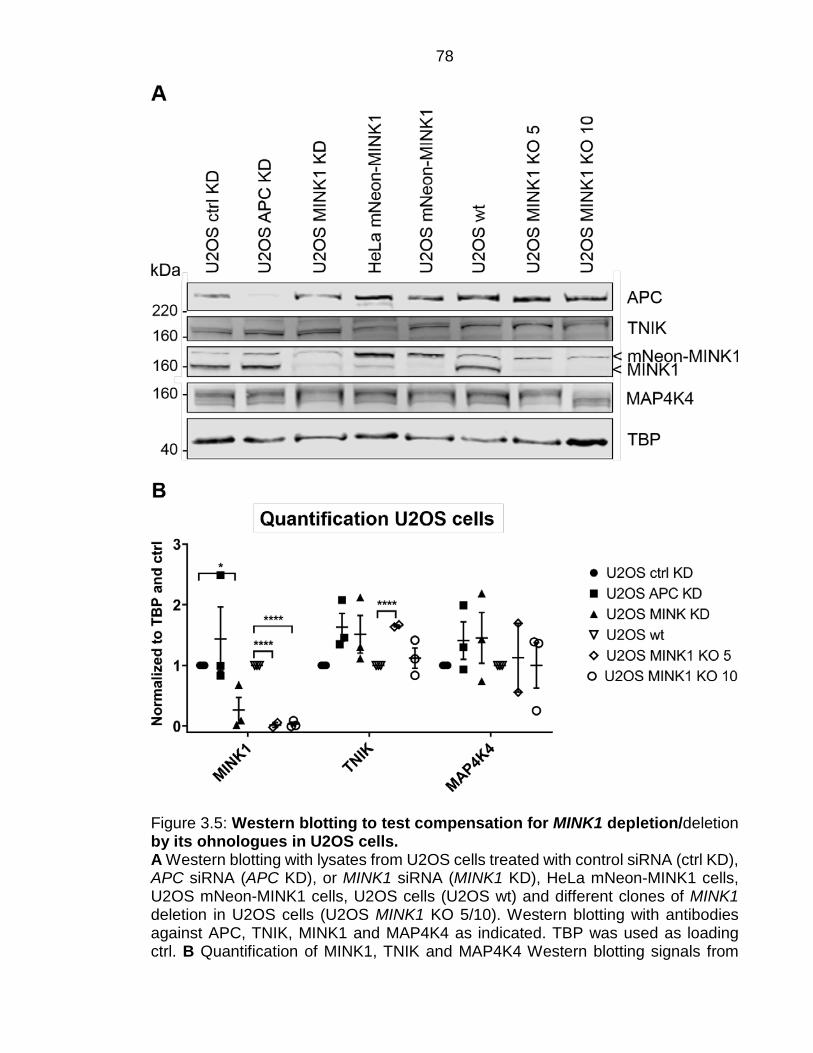
78
Figure 3.5: Western blotting to test compensation for MINK1 depletion/deletion by its ohnologues in U2OS cells. A Western blotting with lysates from U2OS cells treated with control siRNA (ctrl KD), APC siRNA (APC KD), or MINK1 siRNA (MINK1 KD), HeLa mNeon-MINK1 cells, U2OS mNeon-MINK1 cells, U2OS cells (U2OS wt) and different clones of MINK1 deletion in U2OS cells (U2OS MINK1 KO 5/10). Western blotting with antibodies against APC, TNIK, MINK1 and MAP4K4 as indicated. TBP was used as loading ctrl. B Quantification of MINK1, TNIK and MAP4K4 Western blotting signals from
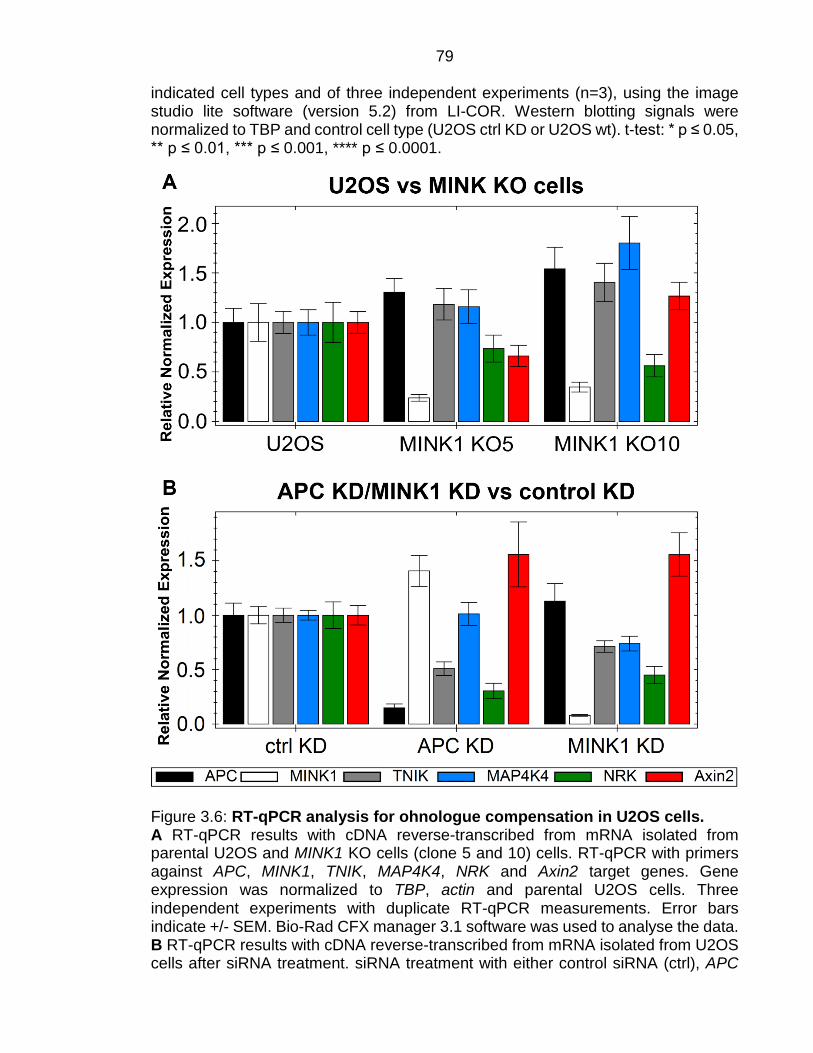
79 indicated cell types and of three independent experiments (n=3), using the image studio lite software (version 5.2) from LI-COR. Western blotting signals were normalized to TBP and control cell type (U2OS ctrl KD or U2OS wt). t-test: * p ≤ 0.05, ** p ≤ 0.01, *** p ≤ 0.001, **** p ≤ 0.0001.
Figure 3.6: RT-qPCR analysis for ohnologue compensation in U2OS cells. A RT-qPCR results with cDNA reverse-transcribed from mRNA isolated from parental U2OS and MINK1 KO cells (clone 5 and 10) cells. RT-qPCR with primers against APC, MINK1, TNIK, MAP4K4, NRK and Axin2 target genes. Gene expression was normalized to TBP, actin and parental U2OS cells. Three independent experiments with duplicate RT-qPCR measurements. Error bars indicate +/- SEM. Bio-Rad CFX manager 3.1 software was used to analyse the data. B RT-qPCR results with cDNA reverse-transcribed from mRNA isolated from U2OS cells after siRNA treatment. siRNA treatment with either control siRNA (ctrl), APC
80 siRNA (APC KD), or MINK1 siRNA (MINK1 KD). RT-qPCR with primers against APC, MINK1, TNIK, MAP4K4, NRK and Axin2 target genes. Gene expression was normalized to TBP, actin and control siRNA treatment. Three independent experiments with duplicate RT-qPCR measurements. Error bars indicate +/- SEM. Bio-Rad CFX manager 3.1 software was used to analyse the data.
The potential compensation of TNIK and MAP4K4 for MINK1 was further
investigated in mouse intestinal organoids using frozen cell lysates from wild-type
(wt), heterozygous (ApcMin/+) and homozygous (ApcMin/Min) ApcMin (multiple intestinal
neoplasia) organoids, all generated from mice with C57BL/6J background. ApcMin
mice carry a nonsense mutation at codon 850 in one Apc allele, and are used as a
model organism to study Apc germline mutations in vivo. Like human patients
carrying heterozygous APC mutations, mice carrying a heterozygous ApcMin
(ApcMin/+) mutation are predisposed to intestinal adenoma formation and therefore
used to study colorectal cancer formation and progression (Moser et al., 1995a).
Western blotting analysis of cell lysates from mouse intestinal organoids was
performed with antibodies against APC, MINK1, TNIK and MAP4K4. NRK is not
expressed in intestinal epithelium (‘The Human Protein Atlas’ and RNA sequencing
data from our lab, data not shown) (Chen et al., 2019; Uhlén et al., 2015), therefore
its potential compensation for MINK1 was not relevant for this analysis. MINK1 and
TNIK protein levels were lower in mouse intestinal ApcMin/Min organoids compared to
wild-type (wt) organoids (Figure 3.7). The downregulation of MINK1 protein levels
contradicts previous results from our group, demonstrating an upregulation of MINK1
in Apc depleted mouse intestinal tissue and organoids (Popow et al., 2019). This
might be due to the use of frozen samples (in my experiments) instead of fresh
lysates, which were used in previous experiments. Long term storage, freezing and
thawing can lead to protein degradation, which could impact protein association.
Therefore, this experiment should be repeated with fresh lysates from mouse
intestinal organoids or tissue.
Altogether, it is possible that TNIK could compensate for MINK1 deletion, which
needs to be considered for all experiments using MINK1 depletion/deletion. That
MINK1 and TNIK might compensate for each other is also supported by the
observation that Mink1 RNA expression is upregulated upon Tnik deletion in Tnik-/-
mice (Masuda et al., 2016b).

81
Figure 3.7: Western blotting analysis for ohnologue compensation in mouse intestinal organoids. A, B Western blotting with lysates from wild-type (wt), heterozygous (ApcMin/+) and homozygous (ApcMin/Min) multiple intestinal neoplasia (Min) mouse intestinal organoids A Western blotting with antibodies against APC and TNIK as indicated. TBP was used as loading ctrl. B Western blotting with antibodies against MINK1 and MAP4K4. TBP was used as loading ctrl. C Quantification of MINK1, TNIK and MAP4K4 Western blotting signals from indicated genotypes of mouse intestinal organoids. Two independent experiments (n=2). Western blotting (WB) signal were normalized to TBP and wild-type organoid signals using the image studio lite software (version 5.2) from LI-COR.
82 4. Phosphorylation of MINK1 and binding of 14-3-3
14-3-3 proteins are a family of dimeric proteins that can regulate function and
conformation of their target proteins in various ways. 1Typically, a single 14-3-3-
dimer binds to two specific phosphorylated sides that lie in tandem on the same
target protein. Both of these phosphosites can either be phosphorylated by the same
kinase, or by different kinases. 14-3-3-binding often leads to conformational changes
of their target protein, but it can also influence interactions between the target protein
and interaction partners (Johnson et al., 2010; Mackintosh, 2004).
Forty human members of the eukaryotic protein kinase (ePK) family, including
microtubule affinity-regulating protein kinases 3 (MARK3), protein kinase C (PKC)
and Raf-1, are among the plethora of well-defined 14-3-3-binding proteins (Fu et al.,
1994; Göransson et al., 2006; Meller et al., 1996).
The serine/threonine kinases MARK3 and MARK4 belong to the partitioning-
defective (PAR)-1/MARK kinases and are AMP‐activated protein kinase (AMPK)
family members. MARK3 is also known as PAR-1a or Cdc25C-associated kinase 1
(C-TAK1) and MARK4 is also known as PAR-1b. All AMPK-related kinase (AMPK-
RK) family members are comprised of an N-terminal catalytic domain, a UBA domain
and a C-terminal spacer sequence (Bright et al., 2009; Manning et al., 2002b; Peng
et al., 1998). MARK kinases are involved in cell polarity and are regulated by
phosphorylation of a T-loop threonine residue (Drewes and Nurse, 2003; Spicer et
al., 2003). The MARK catalytic domain contains two phosphorylation sites
(T211/S215 in MARK3 and T214/S218 in MARK4) (Bright et al., 2009). All AMPK-
RKs are also activated by LKB1, also known as serine/threonine protein kinase
STK11. LKB1 is a widely expressed serine/threonine protein kinase. Mutations in the
LKB1 gene cause Peutz-Jeghers syndrome, which leads to the predisposition for a
wide spectrum of benign and malignant tumours. (Hemminki et al., 1998; Jenne et
al., 1998; Lizcano et al., 2004). Therefore, LKB1 is a tumour suppressor, which
regulates AMPK and most of the AMPK-RKs. LBK1 phosphorylates both activating
T-loop residues of MARK3 (T211 and S215), but only the threonine residue of
MARK4 (T214) (Lizcano et al., 2004).
83 MARK kinases have been linked to Alzheimer’s disease, as they phosphorylate the
microtubule-associated protein tau (MAPT), which is found in a hyperphosphorylated
state in neurons of Alzheimer’s disease patients (Chin et al., 2000). This is in line
with the observation that MARK3/4 were phosphorylated after fasting (Li et al.,
2015), since type 2 diabetes mellitus is strongly associated with dementia and
Alzheimer’s disease (Strachan et al., 2011). Both MARK3 and MARK4 have also
directly been implicated in energy metabolism and type 2 diabetes. AMPK is
important for cellular energy balance and integrates nutritional and hormonal signals
in the brain. AMPK is implicated in the regulation of food intake and body weight by
mediating adipokines and it is also implicated in glucose- and lipid homeostasis.
AMPK enhances insulin sensitivity and glycaemic control, and thereby reduces the
risk for type 2 diabetes (Kahn et al., 2005). Mark3 knock-down mice are
hypermetabolic and exhibit resistance to diet-induced obesity, but do not alter
glucose or insulin sensitivity (Lennerz et al., 2010). MARK4 has also been linked to
energy metabolism and type 2 diabetes. Mark4 knockout mice also show reduced
adiposity, resistance to high fat diet-induced weight gain and insulin hypersensitivity
(Sun et al., 2012). Type 2 diabetes is caused by insulin resistance leading to loss of
glucose control in the bloodstream, which has been demonstrated to cause tissue
damage and to increase the risk of vascular diseases. Overnight fasting in mice
leads to phosphorylation of many proteins in the brain including MARKs, and
injection of insulin or glucose triggers the rapid dephosphorylation of these proteins
(Li et al., 2015). Fasting also activated PKA, which phosphorylates MARK3 at T507.
MARK3/4 are also phosphorylated by forskolin treatment, which indicates that
MARK3 and MARK4 are potential substrates for PKA (Li et al., 2015; Smith et al.,
2011).
MARK3 is also involved in epithelial cell polarity and is activated though
phosphorylation by LKB1, in turn MARK3 phosphorylates Rho-Rac guanine
nucleotide exchange factor 2 (ARHGEF2) at its regulatory site (S151). This enables
14-3-3-binding to ARHGEF2, which triggers its dissociation from microtubules.
ARHGEF2 is now an active GEF and in turn activates RHOA and thereby enables
stress fibre and focal adhesion formation (Sandí et al., 2017).Fasting leads to
phosphorylation of many different proteins in the mouse brain that consequently bind
84 to 14-3-3 proteins, moreover systemic injections of insulin or glucose into the
bloodstream were demonstrated to trigger rapid dephosphorylation and loss of 14-
3-3-binding of these brain proteins. Proteins that were phosphorylated after fasting
include microtubule affinity regulating kinase 3 (MARK3), MARK4 (Li et al., 2015)
and MINK1 (unpublished data from the MacKintosh group). This suggests that
MINK1 and MARK3/4 might be involved in the same signalling pathways. The
binding of 14-3-3 to GFP-MINK1 from stably-transfected HEK293 cells was
promoted when cells were stimulated by the adenylate cyclase activator forskolin
(FSK), but not when cells were stimulated with insulin-like growth factor 1 (IGF1),
epidermal growth factor (EGF), phorbol ester (PMA), AMPK activator A769662 and
Calcium (Ca2+) ionophore A23187, as determined by co-immunoprecipitation of
MINK1 with endogenous 14-3-3 and direct binding of exogenous 14-3-3 to the
immunoprecipitated MINK1 in Far-Western assays. The forskolin-stimulated binding
of 14-3-3 to MINK1 was prevented by the non-specific PKA inhibitor H-89
(unpublished data from MacKintosh group).
Summary
Previous work suggested that PKA can phosphorylate MINK1, which in turn enables
14-3-3-binding to MINK1 (MacKintosh group, unpublished data). One aim of my
study was to determine whether PKA directly or indirectly phosphorylates MINK1, to
validate that this phosphorylation of MINK1 enables 14-3-3-binding to MINK1
phosphosites and to identify these 14-3-3-binding phosphosites on MINK1.
Furthermore, I aimed to explore the effect of 14-3-3-binding on the interaction
between MINK1 and APC, MINK1 kinase activity and function.
My experiments confirmed that 14-3-3 binds to MINK1 in U2OS cells. This interaction
did not measurably change the interaction between MINK1 and APC. Vice versa,
APC depletion led to decreased 14-3-3-binding to MINK1. Furthermore, 14-3-3
bound to phosphosites in the linker domain of MINK1. In vitro kinase assays
confirmed that PKA, MARK3 and MARK4 directly phosphorylate MINK1 on 14-3-3-
binding phosphosites (Figure 4.1). Using mass spectrometry, I identified initially
three potential 14-3-3-binding sites on MINK1 (S674, S701 and S993). PKA and
MARK3 phosphorylated MINK1 on all three 14-3-3-binding phosphosites, whereas
85 MARK4 only phosphorylated MINK1 on S674 and S701, but not on S993. Using
MINK1 carrying single residue mutations in each of these sites in in vitro kinase
assays , I confirmed that the 14-3-3-binding sites on MINK1 were most likely the two
serine residues S674 and S701 (Figure 4.1).
Investigating the kinase activity and function of MINK1, I found that MINK1 kinase
phosphorylates in vitro the peptide derived from ezrin, radixin and moesin (ERM)
proteins that contains their activation site (T567/T564/T558). ERM proteins are
activated through phosphorylation of this conserved threonine residue which is
T567/564/558 on ezrin/radixin/moesin respectively. This activating threonine
phosphorylation initiates a conformational change which allows ERM proteins to bind
F-actin, thereby connecting the cytoskeleton and the plasma membrane (Bretscher
et al., 2002; McClatchey, 2014; Pelaseyed and Bretscher, 2018). However, MINK1
kinase activity was markedly reduced towards this ERM peptide when the
phosphorylatable threonine was substituted by a serine residue (T567/564/558S). In
contrast, a control serine/threonine kinase was able to phosphorylate both
substrates equally well. This finding suggested that MINK1 might be a threonine-
selective kinase. I further investigated whether MINK1 might be important for ERM
activation in vivo. Thus far, my experiments did not produce evidence for an essential
role of MINK1 for the phosphorylation and thereby activation of ERM proteins.
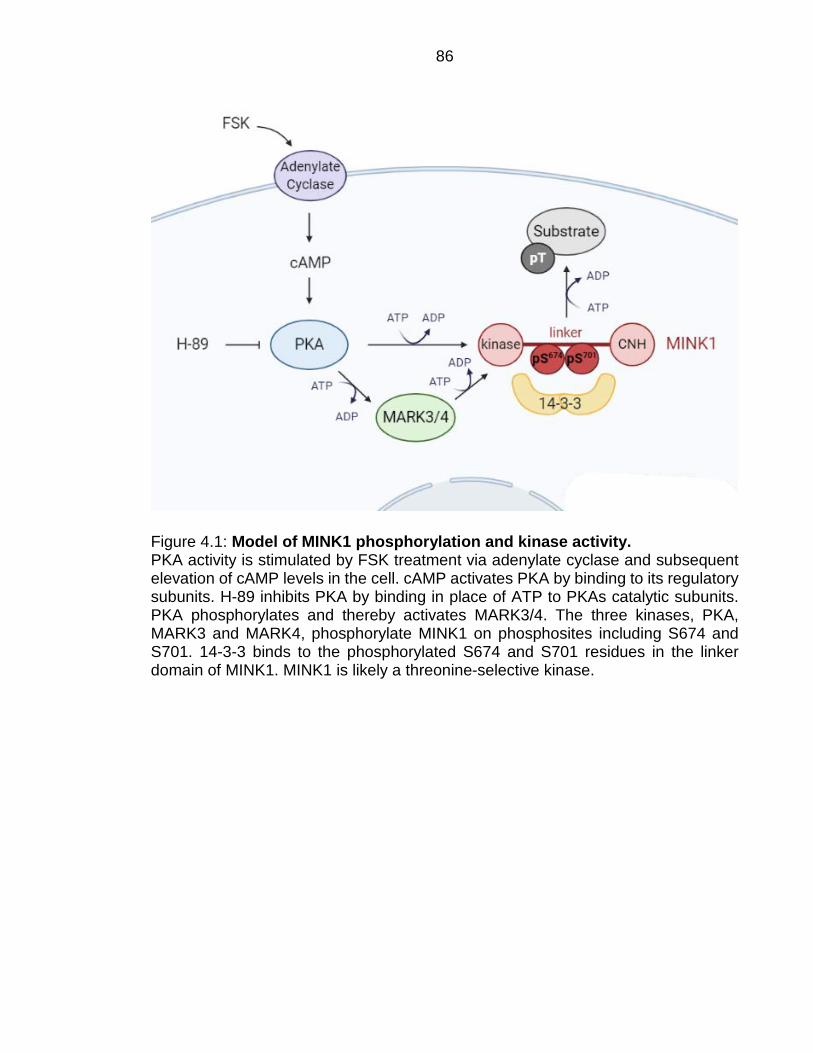
86
Figure 4.1: Model of MINK1 phosphorylation and kinase activity. PKA activity is stimulated by FSK treatment via adenylate cyclase and subsequent elevation of cAMP levels in the cell. cAMP activates PKA by binding to its regulatory subunits. H-89 inhibits PKA by binding in place of ATP to PKAs catalytic subunits. PKA phosphorylates and thereby activates MARK3/4. The three kinases, PKA, MARK3 and MARK4, phosphorylate MINK1 on phosphosites including S674 and S701. 14-3-3 binds to the phosphorylated S674 and S701 residues in the linker domain of MINK1. MINK1 is likely a threonine-selective kinase.

87 14-3-3 binds to MINK1
Previous studies showed that 14-3-3 can bind to MINK1, possibly in response to
phosphorylation of MINK1 by PKA (unpublished data from the MacKintosh group). I
aimed to further test the hypothesis that PKA phosphorylates MINK1 to enable 14-
3-3-binding to PKA phosphorylated sites. Furthermore, I aimed to identify the specific
phosphosites on MINK1 to which 14-3-3 binds and explore the effect 14-3-3-binding
might have on MINK1 kinase activity and/or function. 14-3-3 has also been reported
to bind to APC (Meek et al., 2004; Rosenberg et al., 2008). Therefore, another aim
was to analyse whether 14-3-3 might be involved in the association of APC and
MINK1.
To this end, 14-3-3-binding to MINK1 was investigated in U2OS cells. To determine
whether PKA might phosphorylate MINK1, U2OS cells were either serum starved
overnight, treated with forskolin (FSK), treated with H-89 followed by FSK treatment,
or treated with calyculin A. Treated cells were compared to untreated cells. Serum
deprived (starved) and untreated (ctrl) cells served as negative controls for
phosphorylation by PKA, while calyculin A treatment was used as positive control.
Calyculin A is an inhibitor of PPP family protein phosphatases (Holy and Brautigan,
2012) and was expected to block dephosphorylation in cells, therefore leading to an
accumulation of phosphorylated MINK1. FSK activates adenylyl cyclase and thereby
increases intracellular levels of cyclic AMP (cAMP). cAMP in turn activates PKA by
binding to the regulatory subunits of PKA, releasing the kinase for activation
(Berridge, 2014). H-89 inhibits PKA activity (and activity of several other protein
kinases), by binding to its catalytic subunits and thereby prevents PKA from binding
to its natural substrate Mg-ATP (Berridge, 2014). PKA has been previously
discovered to promote 14-3-3 binding to MINK1 in HEK293 cells with stable
expression of GFP-MINK1. In this experiment cells were treated with various stimuli
for different AGC kinases, including FSK, insulin-like growth factor 1 (IGF1),
epidermal growth factor (EGF), phorbol ester (PMA), AMPK activator A769662 and
Calcium (Ca2+) ionophore A23187. Afterwards, MINK1 was immunoprecipitated and
14-3-3-binding to MINK1 was analysed with Far-Western blotting. Out of the tested
stimuli FSK was the only one that significantly increased 14-3-3 binding to MINK1
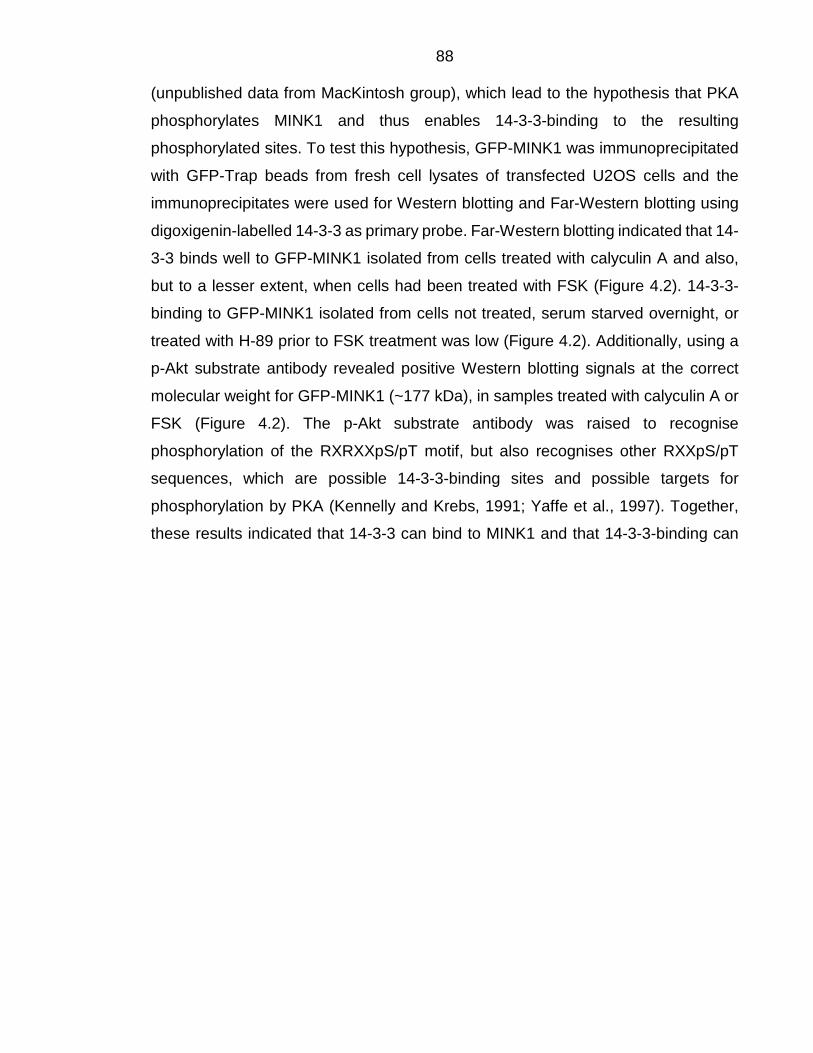
88 (unpublished data from MacKintosh group), which lead to the hypothesis that PKA
phosphorylates MINK1 and thus enables 14-3-3-binding to the resulting
phosphorylated sites. To test this hypothesis, GFP-MINK1 was immunoprecipitated
with GFP-Trap beads from fresh cell lysates of transfected U2OS cells and the
immunoprecipitates were used for Western blotting and Far-Western blotting using
digoxigenin-labelled 14-3-3 as primary probe. Far-Western blotting indicated that 14-
3-3 binds well to GFP-MINK1 isolated from cells treated with calyculin A and also,
but to a lesser extent, when cells had been treated with FSK (Figure 4.2). 14-3-3-
binding to GFP-MINK1 isolated from cells not treated, serum starved overnight, or
treated with H-89 prior to FSK treatment was low (Figure 4.2). Additionally, using a
p-Akt substrate antibody revealed positive Western blotting signals at the correct
molecular weight for GFP-MINK1 (~177 kDa), in samples treated with calyculin A or
FSK (Figure 4.2). The p-Akt substrate antibody was raised to recognise
phosphorylation of the RXRXXpS/pT motif, but also recognises other RXXpS/pT
sequences, which are possible 14-3-3-binding sites and possible targets for
phosphorylation by PKA (Kennelly and Krebs, 1991; Yaffe et al., 1997). Together,
these results indicated that 14-3-3 can bind to MINK1 and that 14-3-3-binding can
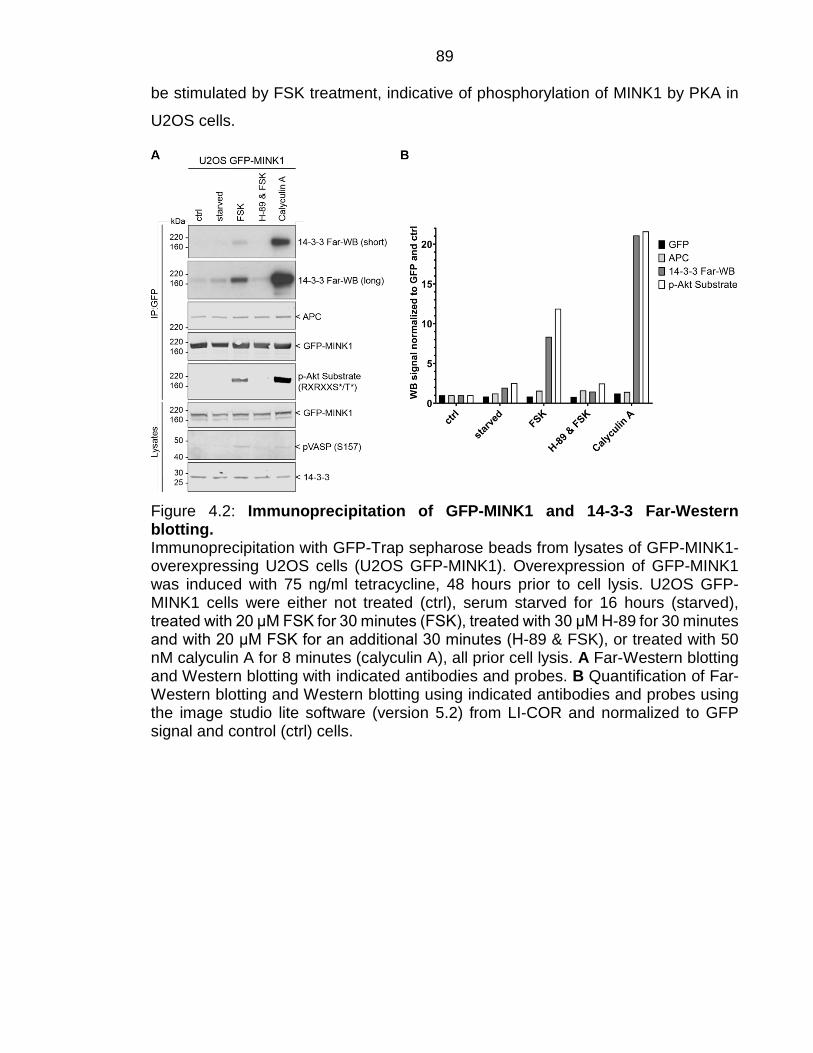
89 be stimulated by FSK treatment, indicative of phosphorylation of MINK1 by PKA in
U2OS cells.
Figure 4.2: Immunoprecipitation of GFP-MINK1 and 14-3-3 Far-Western blotting. Immunoprecipitation with GFP-Trap sepharose beads from lysates of GFP-MINK1-overexpressing U2OS cells (U2OS GFP-MINK1). Overexpression of GFP-MINK1 was induced with 75 ng/ml tetracycline, 48 hours prior to cell lysis. U2OS GFP-MINK1 cells were either not treated (ctrl), serum starved for 16 hours (starved), treated with 20 μM FSK for 30 minutes (FSK), treated with 30 μM H-89 for 30 minutes and with 20 μM FSK for an additional 30 minutes (H-89 & FSK), or treated with 50 nM calyculin A for 8 minutes (calyculin A), all prior cell lysis. A Far-Western blotting and Western blotting with indicated antibodies and probes. B Quantification of Far-Western blotting and Western blotting using indicated antibodies and probes using the image studio lite software (version 5.2) from LI-COR and normalized to GFP signal and control (ctrl) cells.
90 14-3-3-binding to MINK1 independent of its association with APC
I demonstrated in the previous chapter 3 (Interaction of APC and MINK1) that MINK1
associates with APC in U2OS cells. To investigate potential functions of 14-3-3-
binding to MINK1, I first tested whether 14-3-3-binding to MINK1 impacts the
interaction between MINK1 and APC. To this end, lysates from U2OS cells
overexpressing MINK1-GFP were either not treated, treated with FSK, or with H-89
and FSK. All cells were lysed, proteins were immunoprecipitated with GFP-Trap
beads and analysed using 14-3-3 Far-Western blotting and Western blotting.
Treatment with FSK increased 14-3-3-binding to MINK1 (Figure 4.3A and B), similar
to previous experiments (Figure 4.2). While FSK treatment increased the 14-3-3 Far-
Western blotting signal almost 20-fold, treatment with H-89 prior to FSK treatment
weakened this effect, but the 14-3-3 Far-Western blotting signal was still increased
compared to the untreated control cells (Figure 4.3A and B). Meanwhile, the amount
of co-immunoprecipitated APC did not change in response to FSK, or H-89 and FSK
treatment (Figure 4.3A, B and Figure 4.2), indicating that 14-3-3-binding to MINK1
does not affect the interaction between MINK1 and APC under these conditions.
To further examine whether the association of MINK1 and APC influences the ability
of 14-3-3 to dock onto MINK1, U2OS cells overexpressing MINK1-GFP were
depleted of APC using siRNA. Subsequently, cells were treated with FSK, or with H-
89 and FSK, or left untreated. Cells were lysed and immunoprecipitated with GFP-
Trap beads and analysed using 14-3-3 Far-Western blotting and Western blotting.
FSK treatment increased 14-3-3-binding to MINK1 in cells previously depleted for
APC (APC KD) and in cells treated with control siRNA (ctrl KD) (Figure 4.3C and D).
However, 14-3-3-binding to MINK1 was slightly lower in all APC depleted (APC KD)
cells compared to cells treated with control siRNA (ctrl KD) (Figure 4.3C and D).
Together, there was no significant evidence that 14-3-3-binding to MINK1 influences
the interaction between MINK1 and APC, but the depletion of APC may decrease
14-3-3-binding to MINK1. Thus, it is possible that the interaction of APC and MINK1
influences 14-3-3-binding to MINK1. 14-3-3-binding to APC could also be assessed
by immunoprecipitation of APC from U2OS cells and MINK1 KO cells in combination
with Far-Western blotting. This would indicate whether 14-3-3-binding to APC

91 changes upon the abundance of and interaction with MINK1. Additionally, 14-3-3
levels could be quantified using Far-Western blotting of cell lysates from MINK1
overexpressing cells with and without APC depletion and with/without FSK
stimulation. In combination this could inform the question whether 14-3-3-binding to
MINK1 might facilitate its association with APC or whether this is a competition.
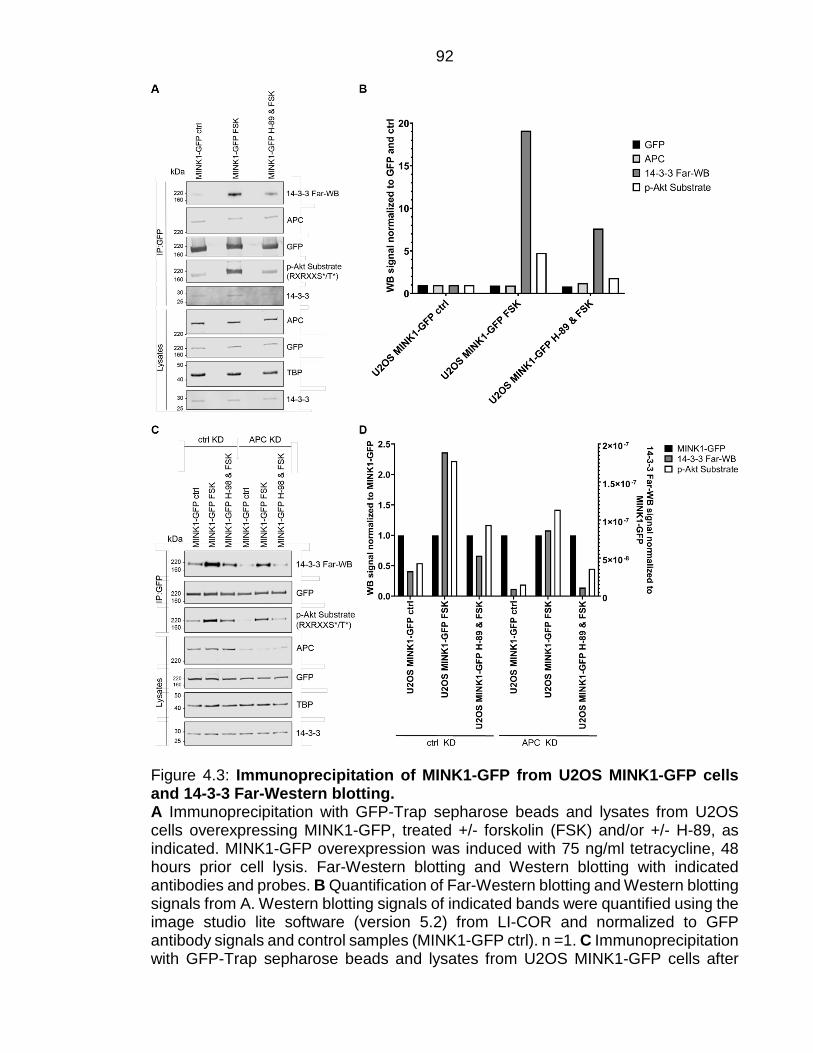
92
Figure 4.3: Immunoprecipitation of MINK1-GFP from U2OS MINK1-GFP cells and 14-3-3 Far-Western blotting. A Immunoprecipitation with GFP-Trap sepharose beads and lysates from U2OS cells overexpressing MINK1-GFP, treated +/- forskolin (FSK) and/or +/- H-89, as indicated. MINK1-GFP overexpression was induced with 75 ng/ml tetracycline, 48 hours prior cell lysis. Far-Western blotting and Western blotting with indicated antibodies and probes. B Quantification of Far-Western blotting and Western blotting signals from A. Western blotting signals of indicated bands were quantified using the image studio lite software (version 5.2) from LI-COR and normalized to GFP antibody signals and control samples (MINK1-GFP ctrl). n =1. C Immunoprecipitation with GFP-Trap sepharose beads and lysates from U2OS MINK1-GFP cells after

93 ctrl/APC siRNA (ctrl KD/APC KD) and treatments +/- FSK and/or +/- H-89, as indicated. MINK1-GFP overexpression was induced with 75 ng/ml tetracycline, 48 hours prior cell lysis. Far-Western blotting and Western blotting with indicated antibodies and probes. D Quantification of Far-Western blotting and Western blotting signals from C. Western blotting signals of indicated bands were quantified using the image studio lite software (version 5.2) from LI-COR and normalized to GFP antibody signals. Left y-axis indicates values of antibodies against GFP (MINK1-GFP), APC and p-Akt Substrate normalized to GFP antibody signals, while the right y-axis indicates values for 14-3-3 Far-Western blotting signals normalized to GFP antibody signals. n =1.
94 14-3-3 binds to phosphosites in the linker domain of MINK1
14-3-3 proteins form dimers that bind to two phosphorylated sites on target proteins
(Aitken, 2006). After demonstrating that 14-3-3 binds to phosphorylated sites on
MINK1 the next aim was to identify these phosphosites on MINK1. MINK1 is a
member of the Ste20 kinase family and the germinal centre kinase (GCK)-IV
subfamily (Dan et al., 2001). All members of this kinase subfamily, including MINK1,
possess an N-terminal kinase domain and a C-terminal citron homology domain
(CNH) domain, which are joined by a linker domain (Figure 1.5). To identify which
MINK1-domain binds to 14-3-3, immunoprecipitation with GFP-Trap beads from
lysates of cells expressing GFP-tagged fragments of MINK1 was utilised. U2OS cells
overexpressing GFP were used as negative control, because 14-3-3 was not
expected to bind to GFP. U2OS cells overexpressing MINK1-GFP were used as
positive control, I could already demonstrate in previous experiments that 14-3-3
binds to full-length MINK1 in FSK stimulated cells (Figure 4.2 and Figure 4.3). All
cells were lysed and proteins from their lysates were immunoprecipitated with GFP-
Trap beads. The eluted material was divided and used for 14-3-3 Far-Western
blotting and for Western blotting. 14-3-3-binding was detected on full-length MINK1
and the linker-domain of MINK1 (Figure 4.4). 14-3-3 did not bind to MINK1 kinase-
or CNH-domain (Figure 4.4). While 14-3-3-binding to the MINK1 linker-domain
appeared slightly weaker than to full-length MINK1, in both cases treatment with FSK
increased 14-3-3-binding compared to untreated controls (Figure 4.4). Together,
these results indicated that 14-3-3 binds the linker-domain of MINK1, on site(s)
phosphorylated by PKA.
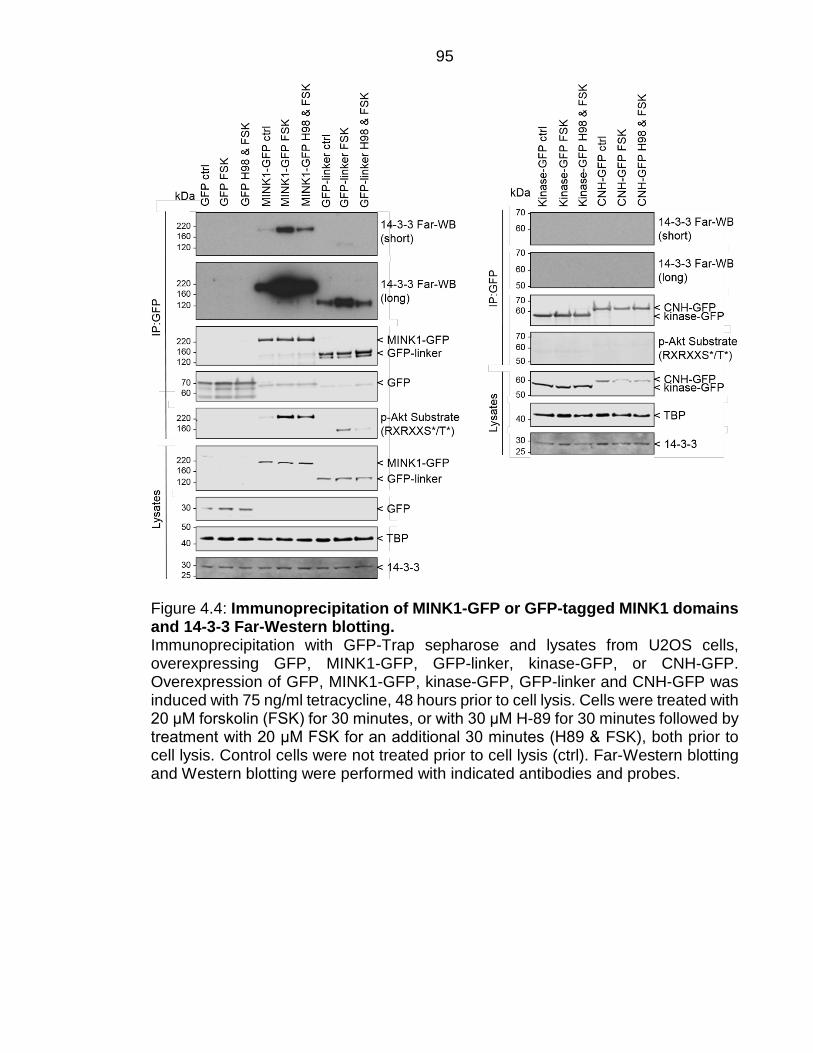
95
Figure 4.4: Immunoprecipitation of MINK1-GFP or GFP-tagged MINK1 domains and 14-3-3 Far-Western blotting. Immunoprecipitation with GFP-Trap sepharose and lysates from U2OS cells, overexpressing GFP, MINK1-GFP, GFP-linker, kinase-GFP, or CNH-GFP. Overexpression of GFP, MINK1-GFP, kinase-GFP, GFP-linker and CNH-GFP was induced with 75 ng/ml tetracycline, 48 hours prior to cell lysis. Cells were treated with 20 μM forskolin (FSK) for 30 minutes, or with 30 μM H-89 for 30 minutes followed by treatment with 20 μM FSK for an additional 30 minutes (H89 & FSK), both prior to cell lysis. Control cells were not treated prior to cell lysis (ctrl). Far-Western blotting and Western blotting were performed with indicated antibodies and probes.
96 PKA directly phosphorylates MINK1 on 14-3-3-binding phosphosites
14-3-3-binding to MINK1 was markedly increased by FSK treatment and this effect
could be prevented by treatment with H-89 (Figure 4.2, Figure 4.3 and Figure 4.4).
PKA is activated though a signalling cascade activated by FSK, and is directly
inhibited by H-89. Therefore, PKA may phosphorylate MINK1, and enable 14-3-3-
binding to the resulting phosphorylated sites. PKA has been previously shown to
phosphorylate 14-3-3-binding sites on many other proteins (Johnson et al., 2010;
Mackintosh, 2004). To determine whether PKA phosphorylates MINK1 directly, or
whether this phosphorylation requires other proteins, an in vitro kinase assay was
employed. For this in vitro kinase assay the catalytic domain of PKA (2 - 351) was
used as kinase and human N-terminally GST-tagged MINK1 (GST-MINK1) as
substrate. GST-MINK1 was generated by SLS reagents and services (University of
Dundee), who isolated the protein after its expression in bacteria. Western blotting
with p-PKA substrate and p-Akt substrate antibodies and Far-Western blotting were
used to analyse GST-MINK1 phosphorylation and subsequent binding of 14-3-3 to
phosphosite(s) on MINK1. Both antibodies, p-PKA substrate and p-Akt substrate,
recognise phosphorylation of motifs (RRXpS/pT and RXRXXpS/pT) that are possible
14-3-3-binding sites and possible targets for phosphorylation by PKA (Kennelly and
Krebs, 1991; Yaffe et al., 1997). 14-3-3 Far-Western blotting and Western blotting
with p-PKA substrate and p-Akt substrate antibodies indicated phosphorylation of,
and subsequent 14-3-3-binding to, GST-MINK1 (Figure 4.5). Moreover, much
weaker 14-3-3-binding could be detected from the in vitro kinase assay with GST-
MINK1 alone, indicating that MINK1 might autophosphorylate and also enable 14-3-
3-binding (Figure 4.5). On the other hand, in this case there were no detectable
signals on the Western blots probed with p-PKA substrate and p-Akt substrate
antibodies (Figure 4.5). Overall, these experiments demonstrated that MINK1 can
be directly phosphorylated by PKA and that this phosphorylation leads to 14-3-3-
binding.
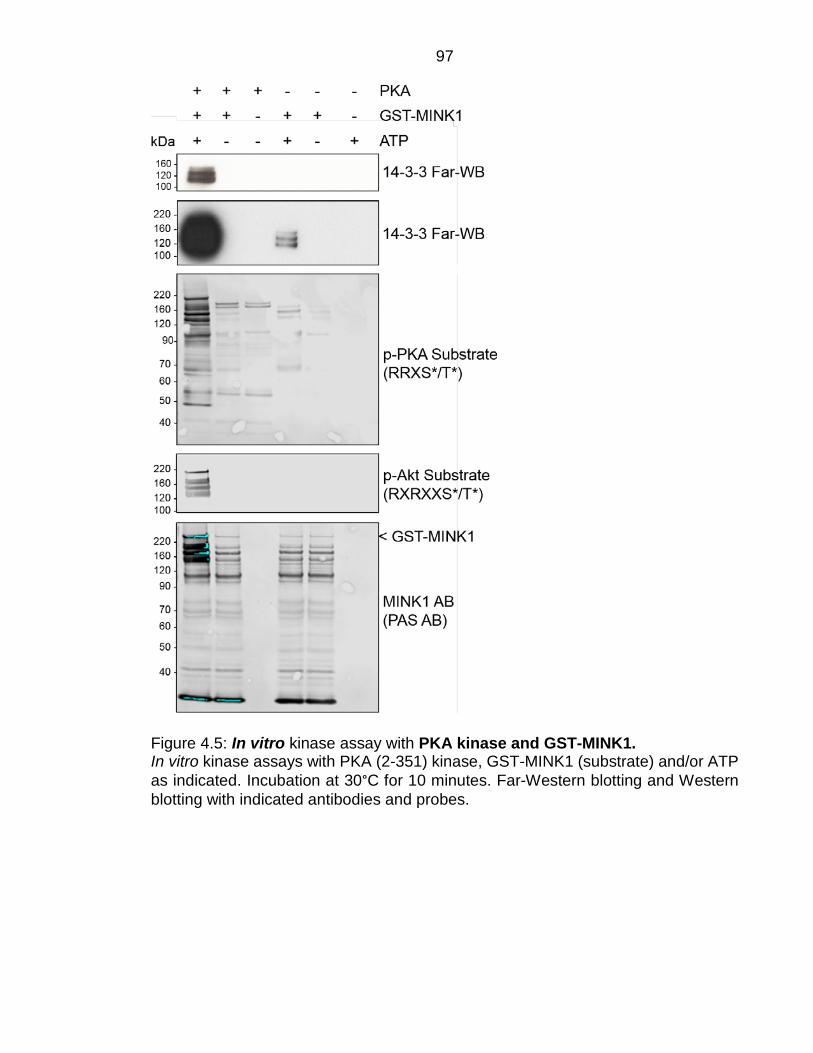
97
Figure 4.5: In vitro kinase assay with PKA kinase and GST-MINK1. In vitro kinase assays with PKA (2-351) kinase, GST-MINK1 (substrate) and/or ATP as indicated. Incubation at 30°C for 10 minutes. Far-Western blotting and Western blotting with indicated antibodies and probes.
98 MARK3/4 phosphorylates MINK1 on 14-3-3-binding phosphosites
Thus far, 14-3-3 Far-Western blotting with cell lysates from cells treated with
calyculin A produced stronger signals than from cells treatment with FSK (Figure
4.2). Moreover, MINK1 phosphorylation indicated by Western blotting with p-Akt
substrate antibody was also stronger for cells treated with calyculin A than with FSK
(Figure 4.2). This might indicate that, while PKA directly phosphorylates MINK1,
enabling 14-3-3-binding to these phosphosites, PKA might only phosphorylate one
of the 14-3-3-binding phosphosites on MINK1 and that there are other kinases that
also phosphorylate MINK1 on additional 14-3-3-binding phosphosites. 14-3-3-
dimers bind to two specific phosphorylated sides that lie in tandem on the same
target protein, but these phosphosites can be phosphorylated by the same, or by
different kinases. A previous study indicated that PKA might directly or indirectly
phosphorylate MARK3/4 (Li et al., 2015). This study and unpublished results from
the MacKintosh group suggested that PKA activation, MARK3/4 phosphorylation,
and MINK1 phosphorylation occur at the same time. Therefore, I hypothesised that
MINK1 might be phosphorylated by PKA on one 14-3-3-binding phosphosite and by
MARK3/4 on the other 14-3-3-binding phosphosite. This would explain why MINK1
phosphorylation by PKA might be sufficient for 14-3-3 to bind to this phosphorylated
site, but that binding is enhanced by additional phosphorylation of MINK1 by
MARK3/4 on the second phosphosite. Furthermore, previous studies also suggest
that PKA might be able to phosphorylate MARK3/4 (Li et al., 2015; Smith et al.,
2011), which might add another layer of complexity to MINK1 phosphorylation.
To test this hypothesis, I first investigated whether MARK3/4 could directly
phosphorylate MINK1, and whether phosphorylation of PKA and MARK3/4 together
led to a stronger phosphorylation of MINK1 than PKA alone. Therefore, in vitro
kinase assays with MARK3 (2 - 729), or MARK4 (2 - 752), and/or PKA (2 - 351) as
kinases and with GST-MINK1 as substrate were performed and analysed by
Western blotting and 14-3-3 Far-Western blotting. All three kinases, PKA, MARK3
and MARK4, alone were able to phosphorylate GST-MINK1 on their own and in each
case this phosphorylation enabled 14-3-3-binding (Figure 4.6A and B). In vitro kinase
assays with either MARK3 or MARK4 together with PKA led to slightly stronger 14-
99 3-3 Far-Western blotting signals than either kinase on its own (Figure 4.6A and B,
first lanes). Moreover, PKA seemed to also directly phosphorylate MARK3/4. This
was indicated by multiple signals in Western blots using p-PKA substrate and p-Akt
substrate antibodies (75 to 100 kDa in the case of MARK3, and 45 to 100 kDa for
MARK4) (Figure 4.6A and B).
The phosphorylation of MINK1 by PKA and MARK3/4 was further investigated in
vivo using U2OS cells either overexpressing MINK1-GFP or the MINK1 linker
domain (linker-GFP). Cells were treated with FSK to stimulate PKA activation, with
H-89 to inhibit PKA, with MRT67307 to inhibit MARK3/4, or with a combination of
these chemicals. Afterwards, cells were lysed, immunoprecipitated with GFP-Trap
sepharose beads, and analysed with 14-3-3 Far-Western blotting and Western
blotting. FSK treatment, and MRT67307 treatment followed by FSK treatment, both
led to 14-3-3-binding to MINK1 (Figure 4.6C and D). This indicated that MARK3/4
inhibition did not influence PKA kinase activity in cells treated with the strong
adenylate cyclase activator, FSK. However, FSK promotes a strong sustained
activation of PKA and therefore might obscure any influence of MARK3/4.
Together, these results suggest that all three kinases, MARK3, MARK4 and PKA,
can phosphorylate MINK1 on 14-3-3-binding phosphosites. Moreover, it is possible
that MARK3/4 and PKA each phosphorylate MINK1 on different phosphosites.
Therefore, MINK1 phosphorylation by all three kinases together might lead to
stronger 14-3-3-bindingcompared to either kinase alone.
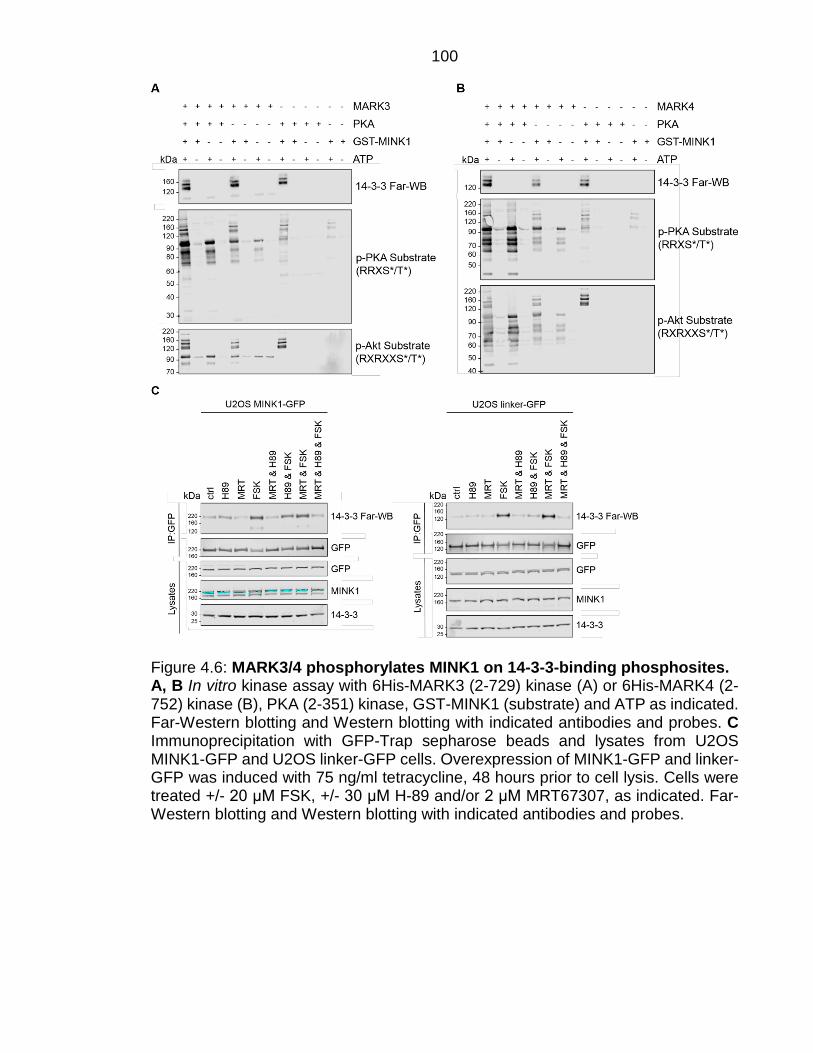
100
Figure 4.6: MARK3/4 phosphorylates MINK1 on 14-3-3-binding phosphosites. A, B In vitro kinase assay with 6His-MARK3 (2-729) kinase (A) or 6His-MARK4 (2-752) kinase (B), PKA (2-351) kinase, GST-MINK1 (substrate) and ATP as indicated. Far-Western blotting and Western blotting with indicated antibodies and probes. C Immunoprecipitation with GFP-Trap sepharose beads and lysates from U2OS MINK1-GFP and U2OS linker-GFP cells. Overexpression of MINK1-GFP and linker-GFP was induced with 75 ng/ml tetracycline, 48 hours prior to cell lysis. Cells were treated +/- 20 μM FSK, +/- 30 μM H-89 and/or 2 μM MRT67307, as indicated. Far-Western blotting and Western blotting with indicated antibodies and probes.
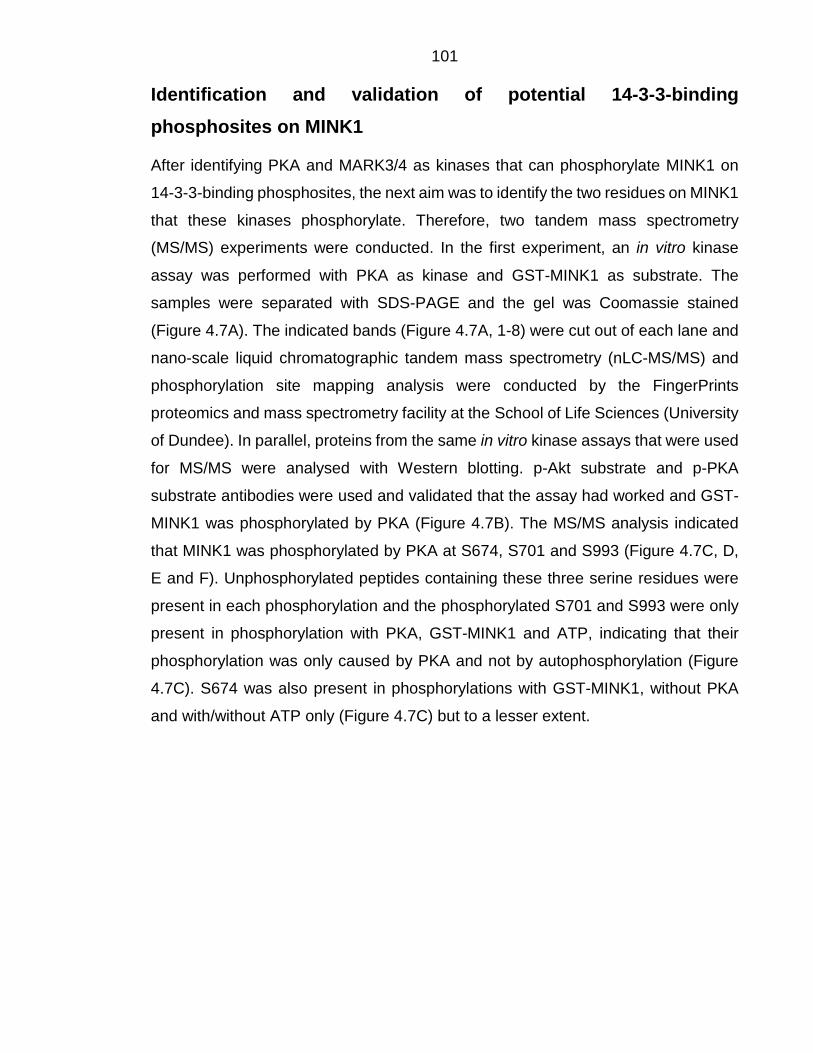
101 Identification and validation of potential 14-3-3-binding phosphosites on MINK1
After identifying PKA and MARK3/4 as kinases that can phosphorylate MINK1 on
14-3-3-binding phosphosites, the next aim was to identify the two residues on MINK1
that these kinases phosphorylate. Therefore, two tandem mass spectrometry
(MS/MS) experiments were conducted. In the first experiment, an in vitro kinase
assay was performed with PKA as kinase and GST-MINK1 as substrate. The
samples were separated with SDS-PAGE and the gel was Coomassie stained
(Figure 4.7A). The indicated bands (Figure 4.7A, 1-8) were cut out of each lane and
nano-scale liquid chromatographic tandem mass spectrometry (nLC-MS/MS) and
phosphorylation site mapping analysis were conducted by the FingerPrints
proteomics and mass spectrometry facility at the School of Life Sciences (University
of Dundee). In parallel, proteins from the same in vitro kinase assays that were used
for MS/MS were analysed with Western blotting. p-Akt substrate and p-PKA
substrate antibodies were used and validated that the assay had worked and GST-
MINK1 was phosphorylated by PKA (Figure 4.7B). The MS/MS analysis indicated
that MINK1 was phosphorylated by PKA at S674, S701 and S993 (Figure 4.7C, D,
E and F). Unphosphorylated peptides containing these three serine residues were
present in each phosphorylation and the phosphorylated S701 and S993 were only
present in phosphorylation with PKA, GST-MINK1 and ATP, indicating that their
phosphorylation was only caused by PKA and not by autophosphorylation (Figure
4.7C). S674 was also present in phosphorylations with GST-MINK1, without PKA
and with/without ATP only (Figure 4.7C) but to a lesser extent.
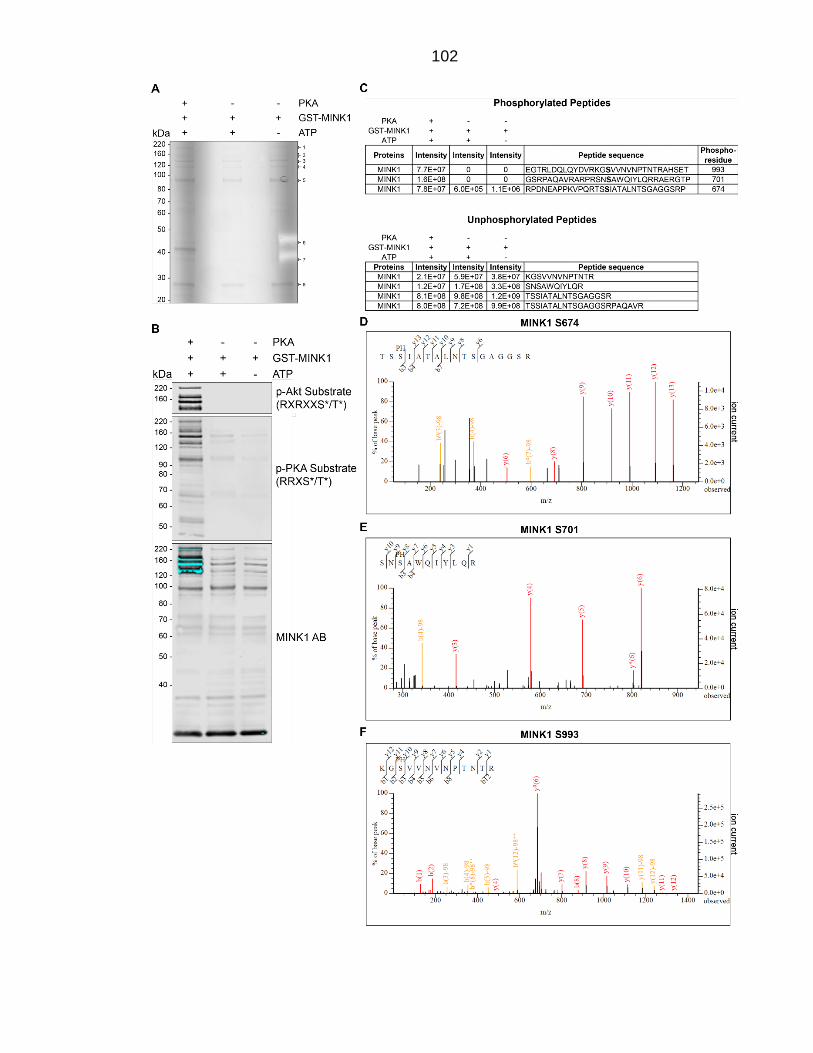
102
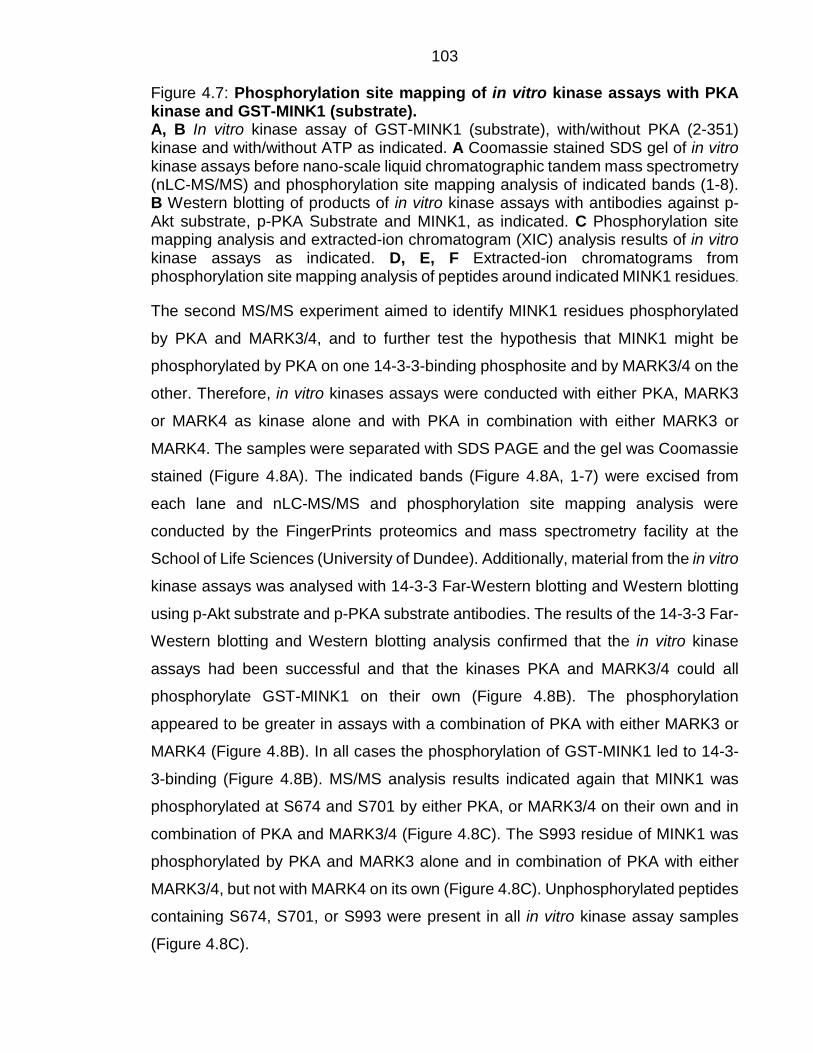
103 Figure 4.7: Phosphorylation site mapping of in vitro kinase assays with PKA kinase and GST-MINK1 (substrate). A, B In vitro kinase assay of GST-MINK1 (substrate), with/without PKA (2-351) kinase and with/without ATP as indicated. A Coomassie stained SDS gel of in vitro kinase assays before nano-scale liquid chromatographic tandem mass spectrometry (nLC-MS/MS) and phosphorylation site mapping analysis of indicated bands (1-8). B Western blotting of products of in vitro kinase assays with antibodies against p-Akt substrate, p-PKA Substrate and MINK1, as indicated. C Phosphorylation site mapping analysis and extracted-ion chromatogram (XIC) analysis results of in vitro kinase assays as indicated. D, E, F Extracted-ion chromatograms from phosphorylation site mapping analysis of peptides around indicated MINK1 residues.
The second MS/MS experiment aimed to identify MINK1 residues phosphorylated
by PKA and MARK3/4, and to further test the hypothesis that MINK1 might be
phosphorylated by PKA on one 14-3-3-binding phosphosite and by MARK3/4 on the
other. Therefore, in vitro kinases assays were conducted with either PKA, MARK3
or MARK4 as kinase alone and with PKA in combination with either MARK3 or
MARK4. The samples were separated with SDS PAGE and the gel was Coomassie
stained (Figure 4.8A). The indicated bands (Figure 4.8A, 1-7) were excised from
each lane and nLC-MS/MS and phosphorylation site mapping analysis were
conducted by the FingerPrints proteomics and mass spectrometry facility at the
School of Life Sciences (University of Dundee). Additionally, material from the in vitro
kinase assays was analysed with 14-3-3 Far-Western blotting and Western blotting
using p-Akt substrate and p-PKA substrate antibodies. The results of the 14-3-3 Far-
Western blotting and Western blotting analysis confirmed that the in vitro kinase
assays had been successful and that the kinases PKA and MARK3/4 could all
phosphorylate GST-MINK1 on their own (Figure 4.8B). The phosphorylation
appeared to be greater in assays with a combination of PKA with either MARK3 or
MARK4 (Figure 4.8B). In all cases the phosphorylation of GST-MINK1 led to 14-3-
3-binding (Figure 4.8B). MS/MS analysis results indicated again that MINK1 was
phosphorylated at S674 and S701 by either PKA, or MARK3/4 on their own and in
combination of PKA and MARK3/4 (Figure 4.8C). The S993 residue of MINK1 was
phosphorylated by PKA and MARK3 alone and in combination of PKA with either
MARK3/4, but not with MARK4 on its own (Figure 4.8C). Unphosphorylated peptides
containing S674, S701, or S993 were present in all in vitro kinase assay samples
(Figure 4.8C).
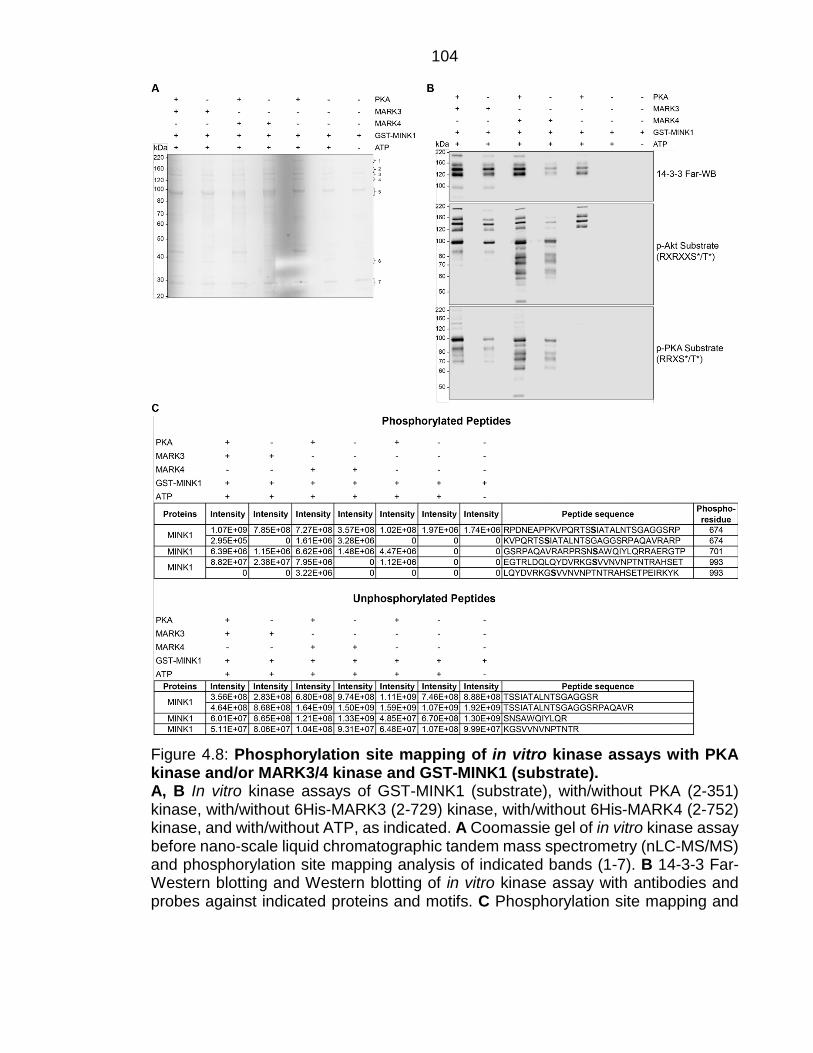
104
Figure 4.8: Phosphorylation site mapping of in vitro kinase assays with PKA kinase and/or MARK3/4 kinase and GST-MINK1 (substrate). A, B In vitro kinase assays of GST-MINK1 (substrate), with/without PKA (2-351) kinase, with/without 6His-MARK3 (2-729) kinase, with/without 6His-MARK4 (2-752) kinase, and with/without ATP, as indicated. A Coomassie gel of in vitro kinase assay before nano-scale liquid chromatographic tandem mass spectrometry (nLC-MS/MS) and phosphorylation site mapping analysis of indicated bands (1-7). B 14-3-3 Far-Western blotting and Western blotting of in vitro kinase assay with antibodies and probes against indicated proteins and motifs. C Phosphorylation site mapping and
105 extracted-ion chromatogram (XIC) analysis results of in vitro kinase assay as indicated.
The three identified MINK1 phosphosites (S674, S701 and S993) are potential mode
I (RXXpSXP) 14-3-3-binding phosphosites, with a small variation, being the
phosphoserines in the MINK1 sequence RTSpSIA, RSNpSAW and RKGpSVV
respectively. The +2 proline residue in the mode I motif has been demonstrated to
be present in less than half of the 14-3-3-binding motifs (Johnson et al., 2010),
therefore the three MINK1 phosphoserines S674, S701 and S993 were all potential
14-3-3-binding motifs. To test this hypothesis, single mutant GST-MINK1 was
created with serine to alanine substitutions of these residues (GST-MINK1 S674A,
GST-MINK1 S701A and GST-MINK1 S933A). To match the amounts of mutant and
wild-type GST-MINK1, GST-MINK1 and its mutants were separated with SDS PAGE
and the gel was Coomassie stained. The amount of full-length GST-MINK1 in each
lane was quantified using the image studio lite software (version 5.2) from LI-COR
and the amount were adjusted a few times. The uppermost four bands were used
for this quantification (approximately 120-200 kDa) since full-length GST-MINK1 has
a molecular weight of 176 kDa. Thereby, the ratios of 2.12 μg GST-MINK1 to 5.49
μg GST-MINK1 S674A to 4.75 μg GST-MINK1 S701A to 4.78 μg GST-MINK1 S993A
were determined to contain approximately similar levels of GST-MINK1 (Figure
4.9A). These ratios of GST-MINK1 and its mutants were used as substrates for in
vitro kinase assays with PKA and/or MARK3/4 as kinases to determine whether 14-
3-3-binding to MINK1 depended on phosphorylation of S674, S701 and/or S993. 14-
3-3 Far-Western blotting of these in vitro kinase assays indicated that 14-3-3-binding
to MINK1 was lost in in vitro kinase assays with PKA and GST-MINK1 S674A or
GST-MINK1 S701A (Figure 4.9B, C, Figure 4.10A and B). Additionally, 14-3-3-
binding to MINK1 was lost or weaker from in vitro kinase assays with MARK3/4 alone
or in combination with PKA and GST-MINK1 S674A or GST-MINK1 S701A as
substrates (Figure 4.9B, C, Figure 4.10A and B). 14-3-3-binding to MINK1 was not
altered in mutant GST-MINK1 S993A treated with PKA, or MARK3/4, or PKA and
MARK3/4 as kinase(s) (Figure 4.9D and Figure 4.10C).
Overall, PKA and MARK3/4 phosphorylated MINK1 residues S674, S701 and S993,
and phosphorylation of the residues S674 and S701 enabled 14-3-3-binding to

106 MINK1. Furthermore, both PKA and MARK3/4 were able to phosphorylate both
phosphosites on MINK1. My results further indicate that PKA directly phosphorylate
MARK3/4.
It would also be beneficial to raise phosphospecific antibodies against MINK1 S674
and S701 to further validate that these phosphosites are indeed phosphorylated by
PKA and MARK3/4. These antibodies could also further aid in vivo studies to identify
e.g. cell cycle states, or cell treatments that activate PKA and MARK3/4 and lead to
phosphorylation of MINK1 at these phosphosites.

107
Figure 4.9: In vitro kinase assays with PKA and MARK3 kinases and GST-MINK1 (substrate). A Coomassie stained SDS gel of GST-MINK1 and mutant GST-MINK1 (GST-MINK1 S674A, GST-MINK1 S701A and GST-MINK1 S933A) as indicated. B, C, D 14-3-3 Far-Western blotting and Western blotting of in vitro kinase assays with antibodies and probes against indicated proteins and motifs. B In vitro kinase assay of GST-MINK1 or GST-MINK1 S674A, with/without PKA (residues 2-351) kinase, and/or 6His-MARK3 (2-729) kinase. C In vitro kinase assay of GST-MINK1 or GST-MINK1 S701A, with/without PKA (2-351) kinase, and/or 6His-MARK3 (2-752) kinase. D In
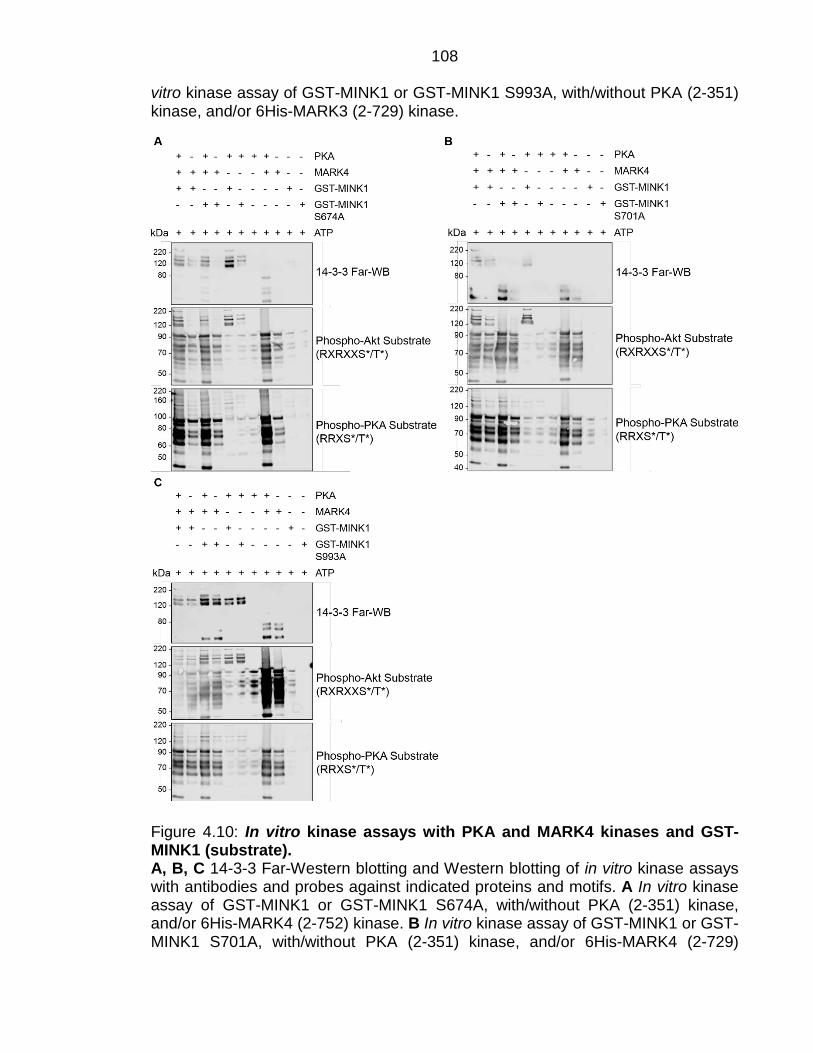
108 vitro kinase assay of GST-MINK1 or GST-MINK1 S993A, with/without PKA (2-351) kinase, and/or 6His-MARK3 (2-729) kinase.
Figure 4.10: In vitro kinase assays with PKA and MARK4 kinases and GST-MINK1 (substrate). A, B, C 14-3-3 Far-Western blotting and Western blotting of in vitro kinase assays with antibodies and probes against indicated proteins and motifs. A In vitro kinase assay of GST-MINK1 or GST-MINK1 S674A, with/without PKA (2-351) kinase, and/or 6His-MARK4 (2-752) kinase. B In vitro kinase assay of GST-MINK1 or GST-MINK1 S701A, with/without PKA (2-351) kinase, and/or 6His-MARK4 (2-729)

109 kinase. C In vitro kinase assay of GST-MINK1 or GST-MINK1 S933A, with/without PKA (2-351) kinase, and/or 6His-MARK4 (2-752) kinase.
110 MINK1 shows preference for threonine as substrate
MINK1 is a serine/threonine kinase, a Ste20 kinase family member and part of the
GCK subfamily. In general, Ste20 kinases activate mitogen-activated protein kinase
(MAPK) pathways and thereby control proteins and cellular function, including cell
proliferation, differentiation, cytoskeletal reorganization and apoptosis. MINK1
kinase activity was first validated in in vitro kinase assays demonstrating that MINK1
phosphorylates myelin basic protein (MBP) and can also auto-phosphorylate.
Moreover, MINK1 has been described to phosphorylate JNK1 and p38, suggesting
a potential role of MINK1 in JNK and/or p38 pathway(s) (Dan et al., 2000; Dan et al.,
2001).
Identification of interaction partners or targets of MINK1 kinase can give insight into
MINK1 function and which signalling pathways MINK1 is involved in. Potential
targets of MINK1 kinase were previously described to include prickle-like protein 1/2
(PRICKLE1/2) and mothers against decapentaplegic homolog 1/2 (SMAD1/2)
proteins, as well as a peptide derived from ezrin/radixin/moesin (ERM) proteins.
PRICKLE1/2 are planar cell polarity (PCP) proteins. In vertebrates PCP proteins,
including PRICKLE1/2, are important for cell polarity in different tissues and
developmental stages, including correct patenting of cochlear epithelium and control
of cell movements during gastrulation (Daulat et al., 2012). In a previous study,
MINK1 was described to phosphorylate PRICKLE1/2. HEK293T cells stably
expressing FLAG-PRICKLE1 or FLAG-PRICKLE2, were used and mass
spectrometry on immunoprecipitated lysates indicated that MINK1 interacts with
both PRICKLE1 and PRICKLE2. Interaction of MINK1 and PRICKLE1/2 was verified
using HEK293T cells transfected with relevant expression vectors of PRICKLE1/2
and MINK1. These proteins were affinity purified and interactions confirmed by
Western blotting. Additionally, transfection with PRICKLE1/2 and TNIK, or MAP4K4
expression vectors indicated that neither TNIK, nor MAP4K4 interact with
PRICKLE1/2. MINK1 directly phosphorylates PRICKLE1 at its T370 residue, which
was shown in an in vitro kinase assay (Daulat et al., 2012). The Drosophila homologue
of MINK1, misshapen (msn), has been described to regulate Smad1 by
phosphorylating its α-helix 1. Moreover, MINK1, TNIK and MAP4K4 have been
111 implicated in the phosphorylation of SMAD1 on residue T322. All three ohnologues,
MINK1, TNIK and MAP4K4, are mammalian homologues of the Drosophila protein,
msn (Kaneko et al., 2011). SMADs are transcription factors that are involved in TGF-
β signal transduction, where they carry signals from the cell surface to the nucleus
(Attisano and Wrana, 2002). TGF-β signalling is important for the regulation of
embryonic development and tissue homeostasis (Wu and Hill, 2009). MINK1 was
shown to interact with SMAD2 in primary mouse T cells and human Jurak T cells,
and to directly phosphorylate SMAD2 at T324. SMAD2 phosphorylation by MINK1
inhibits SMAD2 activation, negatively regulating T helper type 17 cell differentiation
(Fu et al., 2017). In a previous study, our group proposed ERM proteins as potential
substrates of MINK1 kinase. A substrate screen was performed with 43 peptide
substrates from a variety of proteins including controls like MBP, Poly (Glu Tyr 4:1)
and Histone H1. This scree identified an ERM peptide (550RLGRDKYKTLRQIRQ564
- human moesin), as the best substrate (out of all tested) for GST-tagged MINK1
kinase domain in an in vitro kinase assay (Popow, 2016). ERM proteins are essential
mediators between the cell plasma membrane and the cytoskeleton, in their function
of linking phospholipids and proteins of the plasma membrane to cortical actin
(McClatchey, 2014). Additionally, ERM proteins have multiple functions in different
cellular processes, including embryogenesis and mitosis. The phosphorylation of
ERM proteins is essential for their activation and leads to conformational change
(Fehon et al., 2010; Pelaseyed and Bretscher, 2018) and cycling between the
phosphorylated and de-phosphorylated state is essential for ERM activity (Roubinet
et al., 2011; Viswanatha et al., 2012). The ability of MINK1 to phosphorylate ERM
proteins on their activating T567/T564/T558 residue (of ezrin/radixin/moesin
respectively), suggests that MINK1 might be important for the activation of ERM
proteins. Moreover, a recent study demonstrated that msn, the Drosophila
homologue of MINK1, regulates protrusion restriction in Drosophila border cells
through Moesin phosphorylation. Moesin is the only ERM expressed in Drosophila
and msn phosphorylates Moesin on its activating phosphosite (T556) (Plutoni et al.,
2019).
It is striking that so far only threonine residues were described to be phosphorylated
by MINK1. Therefore, I hypothesised that MINK1 might be a threonine-selective
112 kinase. To test this hypothesis another in vitro kinase assay was performed with
GST-MINK1 kinase and peptides from three MINK1 targets described in the
literature: ERM, PRICKLE1 and SMAD1/2, as substrates. ERM, PRICKLE1 and
SMAD1/2 peptides were designed so that the relevant threonine was flanked by six
residues on either side. These peptides, as well as the same peptides with the
natural threonine residue substituted by a serine, were obtained from
Peptides&elephants GmbH. A fusion protein of two kinases, the N-terminal part of
transforming growth factor-β-activated kinase 1 (TAK1, residues 1-303) and the C-
terminal part of TAK1-binding protein 1 (TAB1, residues 437-504), was used as
serine/threonine kinase control that is known to phosphorylate serine and threonine
residues equally well. The in vitro kinase assay was performed with 50 μg/ml kinase,
150 μM ERM, or ERM T567/564/558S peptide, or 300 μM SMAD1/2, SMAD1/2
T322/324S, PRICKLE1, or PRICKLE1 T370S peptide as substrates and 0.1 mM [γ-32P] ATP per reaction. All samples were prepared in triplicate, incubated for 10
minutes at 30°C, transferred onto Whatman p81 cation exchange paper and
measured in a PerkinElmer liquid scintillation analyser. Average values of triplicate
samples were used to calculate kinase activities (KA, in counts per n(ATP) and
m(kinase)). GST-MINK1 kinase phosphorylated the ERM peptide, but not SMAD1/2
or PRICKLE1 peptides (Figure 4.11A), indicating that while MINK1 might be able to
phosphorylate SMAD1/2 and PRICKLE1 proteins, the full-length proteins might be
needed for their interaction with MINK1 and thus their phosphorylation. Moreover, I
detected PRICKLE1 to interact with MINK1 in a proteomic screen with GFP-MINK1
overexpressed in U2OS cells and immunoprecipitated with GFP-Trap beads (Table
4.1). Interestingly, PRICKLE1 only co-immunoprecipitated with MINK1 in untreated
control cells, but not in cells treated with FSK, H-89, or calyculin A prior to cell lysis.
The proteomic screen also revealed a potential interaction of MINK1 with ERM
proteins, regardless of treatment (Table 4.1). However, a negative control of cells
overexpressing GFP alone was missing from this proteomic screen and should be
included in a repeat of this this experiment. This negative control would indicate all
proteins that might interact with the GFP-tag or the GFP-Trap beads and are
therefore unspecific for MINK1. SMAD1/2 and PRICKLE2 were not detected in any
of my samples suggesting that they did not interact with MINK1 under the analysed
113 conditions. TAK1/TAB1 fusion kinase phosphorylated both the wild-type ERM and
ERM T567/564/558S peptide with similar efficiency as expected for a
serine/threonine kinase (Figure 4.11A). MINK1 on the other hand showed an even
higher kinase activity (than TAK1/TAB1 fusion protein) with ERM peptide as
substrate, but only a very low kinase activity with the ERM T567/564/558S peptide
as substrate (Figure 4.11A and B). This is consistent with the idea that MINK1 might
be a threonine-selective kinase. However, additional MINK1 substrates are needed
to verify that MINK1 is a threonine-selective kinase and this effect is not specific to
the ERM peptide.
My previous experiments showed that PKA and MARK3/4 kinases phosphorylate
MINK1 on residues S674 and S701 and that this enabled binding of 14-3-3 to these
phosphorylated MINK1 sites. To test whether 14-3-3-binding to these phosphosites
is important for the kinase activity of MINK1, an in vitro kinase assay was performed
with either MINK1, mutant MINK1 S674A, or mutant MINK1 S701A as kinase and
ERM, or ERM T567/564/558S peptides as substrate. The amounts of MINK1 kinase
and its mutant forms were titrated to contain approximately similar levels of GST-
MINK1 (as described above, Figure 4.9A). All samples were prepared in triplicate
and inclusion of radioactive phosphate (γ-32P) was measured in a scintillation
counter (as described above). Average values of triplicate samples were used to
calculate kinase activities. MINK1 kinase activity was similar for wild-type MINK1 and
both of its mutant forms (S674, and S701) (Figure 4.11B). Moreover, mutant MINK1
phosphorylated the ERM peptide, but the ERM T567/564/558S peptide to much
lesser extent similar to MINK1. This indicates that the S674 and S701 residues of
MINK1 are not essential for its threonine-selectivity. MINK1 was not phosphorylated
prior to kinase assay. To investigate whether MINK1 phosphorylation and/or 14-3-3-
binding to its phosphorylated sites are important for MINK1 kinase activity MINK1
could be incubated with PKA or MARK3/4 and/or 14-3-3 prior to this in vitro kinase
assay.
To validate differences in substrate specificity of the ERM peptide over the mutant
ERM T567/564/558S peptide for MINK1 enzyme Michaelis-Menten kinetics were
modelled. In general, Michaelis-Menten kinetics are used to characterise reactions,
which are catalysed by enzymes. The Michaelis-Menten equation assumes a rapid,
114 reversible formation of a complex between the enzyme (E) and its substrate (S),
which is proportional to the production rate of the product (P): 𝑣𝑣 = 𝑑𝑑[𝑃𝑃]𝑑𝑑𝑡𝑡
= 𝑉𝑉𝑚𝑚𝑚𝑚𝑚𝑚[𝑆𝑆]𝐾𝐾𝑚𝑚+[𝑆𝑆]
. The
Michalis constant (Km) is defined as the substrate concentration at which the reaction
rate is at its half-maximum. Vmax is the maximum velocity of the reaction (Berg et al.,
2006). A small Km indicates that the enzyme is saturated by a small amount of
substrate, which indicates a greater affinity for this substrate than a larger Km which
would indicate that the enzyme needs a larger substrate amount to become
saturated. To identify differences in substrate specificity of the ERM peptide over the
mutant ERM T567/564/558S peptide for MINK1 kinase, in vitro kinase assays were
performed with increasing concentrations of either ERM, or ERM T567/564/558S
peptide as substrate. Samples were prepared in triplicate and inclusion of radioactive
phosphate (γ-32P) was measured in a scintillation counter again. The results were
used to calculate Michaelis-Menten kinetics variables Vmax and Km for both
substrates. Using the ERM peptide as substrate led to a Km of 194 μM and a Vmax of
25331 min-1, while the ERM T567/564/558S peptide as substrate led to a Km of 3612
μM and a Vmax of 15359 min-1 (Figure 4.11C). This indicates that MINK1 kinase has
much higher substrate affinity for the ERM peptide than for the ERM T567/564/558S
peptide.
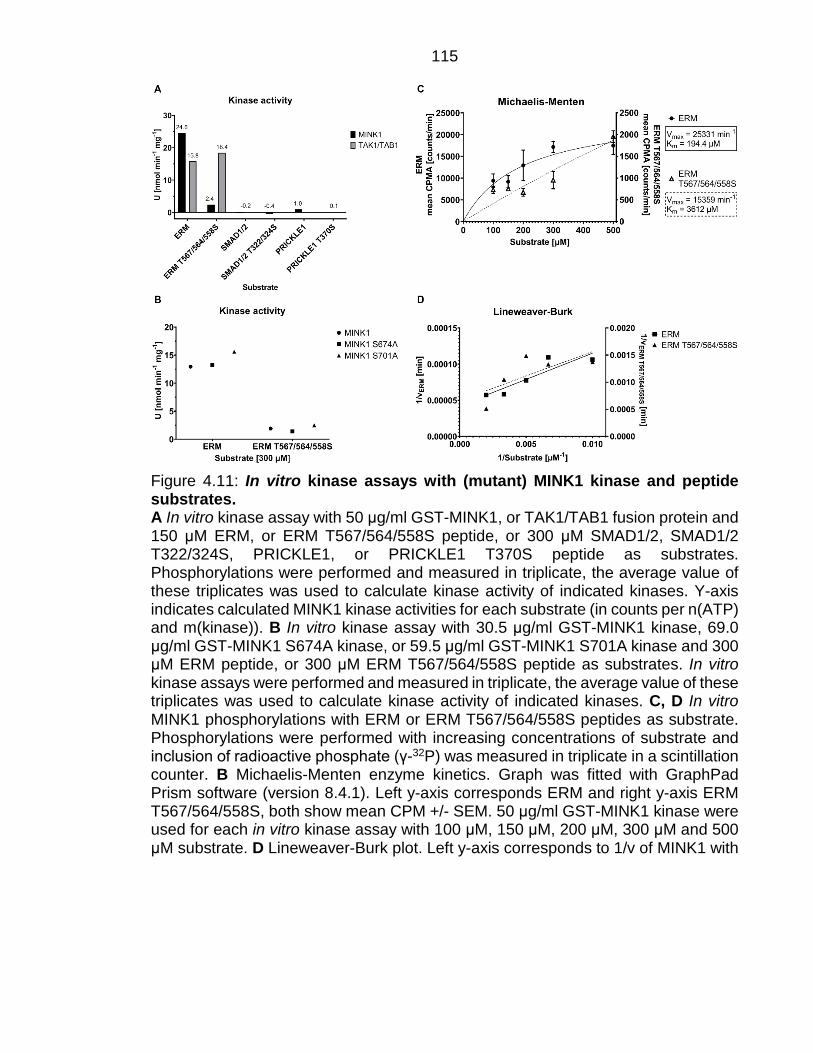
115
Figure 4.11: In vitro kinase assays with (mutant) MINK1 kinase and peptide substrates. A In vitro kinase assay with 50 μg/ml GST-MINK1, or TAK1/TAB1 fusion protein and 150 μM ERM, or ERM T567/564/558S peptide, or 300 μM SMAD1/2, SMAD1/2 T322/324S, PRICKLE1, or PRICKLE1 T370S peptide as substrates. Phosphorylations were performed and measured in triplicate, the average value of these triplicates was used to calculate kinase activity of indicated kinases. Y-axis indicates calculated MINK1 kinase activities for each substrate (in counts per n(ATP) and m(kinase)). B In vitro kinase assay with 30.5 μg/ml GST-MINK1 kinase, 69.0 μg/ml GST-MINK1 S674A kinase, or 59.5 μg/ml GST-MINK1 S701A kinase and 300 μM ERM peptide, or 300 μM ERM T567/564/558S peptide as substrates. In vitro kinase assays were performed and measured in triplicate, the average value of these triplicates was used to calculate kinase activity of indicated kinases. C, D In vitro MINK1 phosphorylations with ERM or ERM T567/564/558S peptides as substrate. Phosphorylations were performed with increasing concentrations of substrate and inclusion of radioactive phosphate (γ-32P) was measured in triplicate in a scintillation counter. B Michaelis-Menten enzyme kinetics. Graph was fitted with GraphPad Prism software (version 8.4.1). Left y-axis corresponds ERM and right y-axis ERM T567/564/558S, both show mean CPM +/- SEM. 50 μg/ml GST-MINK1 kinase were used for each in vitro kinase assay with 100 μM, 150 μM, 200 μM, 300 μM and 500 μM substrate. D Lineweaver-Burk plot. Left y-axis corresponds to 1/v of MINK1 with
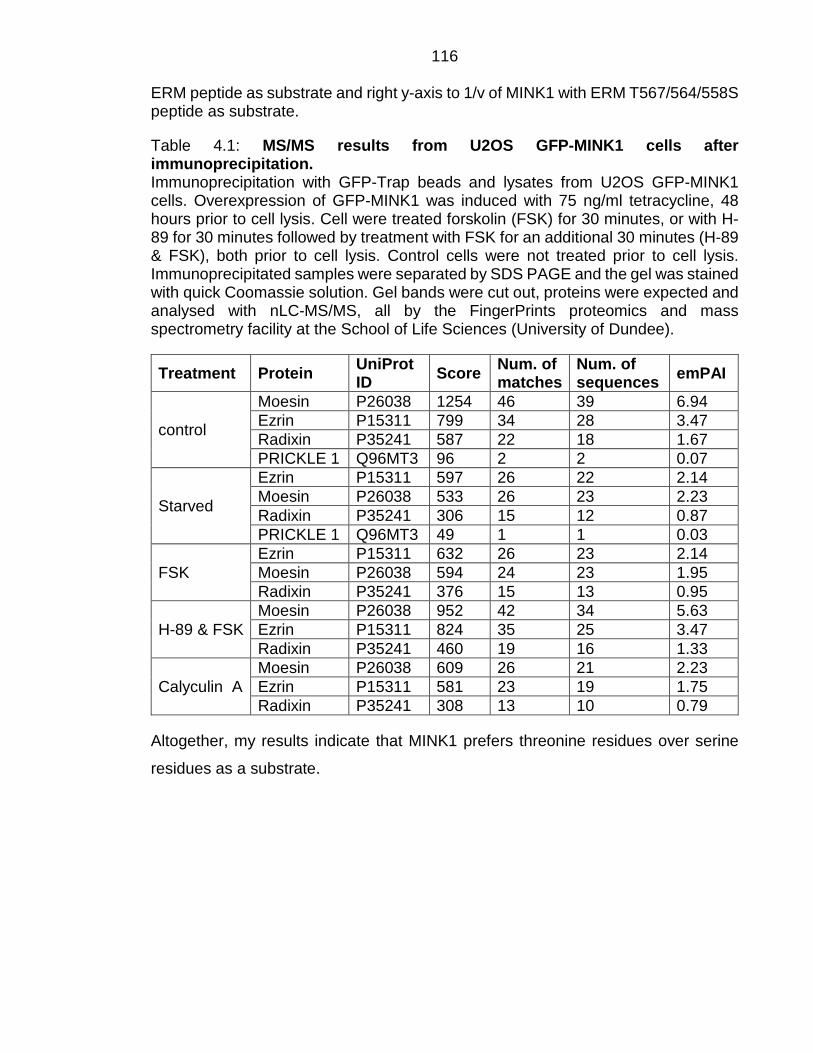
116 ERM peptide as substrate and right y-axis to 1/v of MINK1 with ERM T567/564/558S peptide as substrate.
Table 4.1: MS/MS results from U2OS GFP-MINK1 cells after immunoprecipitation. Immunoprecipitation with GFP-Trap beads and lysates from U2OS GFP-MINK1 cells. Overexpression of GFP-MINK1 was induced with 75 ng/ml tetracycline, 48 hours prior to cell lysis. Cell were treated forskolin (FSK) for 30 minutes, or with H-89 for 30 minutes followed by treatment with FSK for an additional 30 minutes (H-89 & FSK), both prior to cell lysis. Control cells were not treated prior to cell lysis. Immunoprecipitated samples were separated by SDS PAGE and the gel was stained with quick Coomassie solution. Gel bands were cut out, proteins were expected and analysed with nLC-MS/MS, all by the FingerPrints proteomics and mass spectrometry facility at the School of Life Sciences (University of Dundee).
Treatment Protein UniProt ID Score Num. of
matches Num. of sequences emPAI
control
Moesin P26038 1254 46 39 6.94 Ezrin P15311 799 34 28 3.47 Radixin P35241 587 22 18 1.67 PRICKLE 1 Q96MT3 96 2 2 0.07
Starved
Ezrin P15311 597 26 22 2.14 Moesin P26038 533 26 23 2.23 Radixin P35241 306 15 12 0.87 PRICKLE 1 Q96MT3 49 1 1 0.03
FSK Ezrin P15311 632 26 23 2.14 Moesin P26038 594 24 23 1.95 Radixin P35241 376 15 13 0.95
H-89 & FSK Moesin P26038 952 42 34 5.63 Ezrin P15311 824 35 25 3.47 Radixin P35241 460 19 16 1.33
Calyculin A Moesin P26038 609 26 21 2.23 Ezrin P15311 581 23 19 1.75 Radixin P35241 308 13 10 0.79
Altogether, my results indicate that MINK1 prefers threonine residues over serine
residues as a substrate.
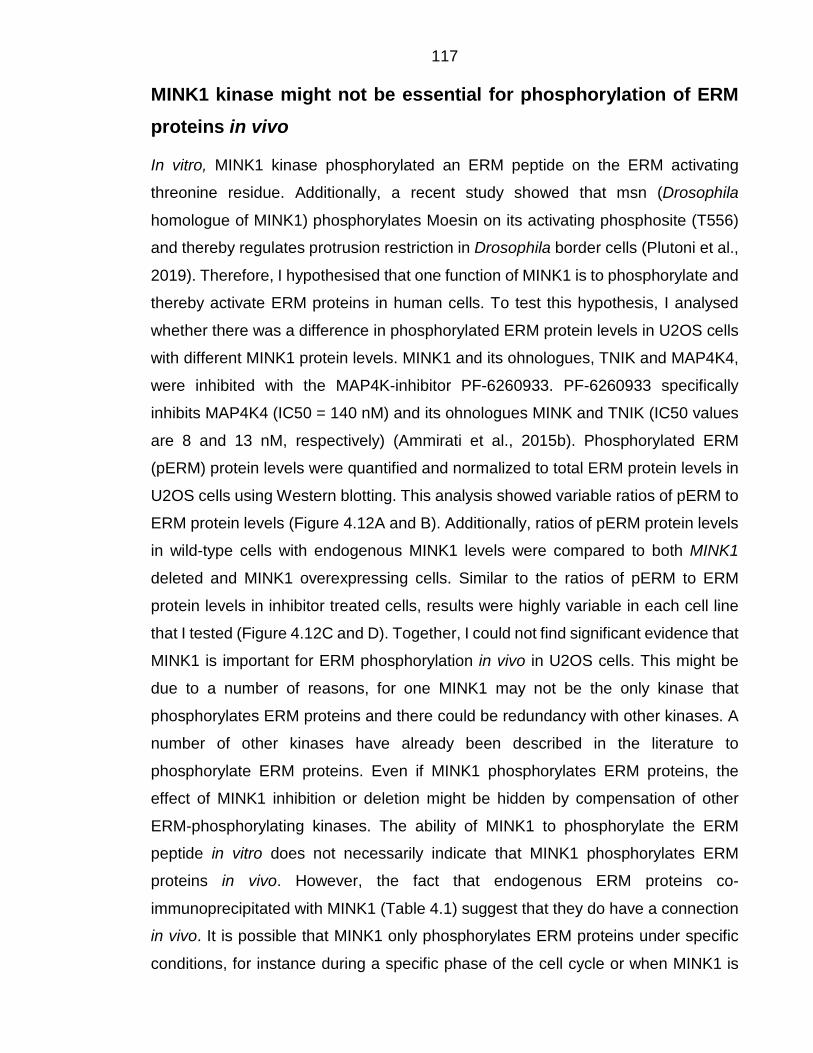
117 MINK1 kinase might not be essential for phosphorylation of ERM proteins in vivo
In vitro, MINK1 kinase phosphorylated an ERM peptide on the ERM activating
threonine residue. Additionally, a recent study showed that msn (Drosophila
homologue of MINK1) phosphorylates Moesin on its activating phosphosite (T556)
and thereby regulates protrusion restriction in Drosophila border cells (Plutoni et al.,
2019). Therefore, I hypothesised that one function of MINK1 is to phosphorylate and
thereby activate ERM proteins in human cells. To test this hypothesis, I analysed
whether there was a difference in phosphorylated ERM protein levels in U2OS cells
with different MINK1 protein levels. MINK1 and its ohnologues, TNIK and MAP4K4,
were inhibited with the MAP4K-inhibitor PF-6260933. PF-6260933 specifically
inhibits MAP4K4 (IC50 = 140 nM) and its ohnologues MINK and TNIK (IC50 values
are 8 and 13 nM, respectively) (Ammirati et al., 2015b). Phosphorylated ERM
(pERM) protein levels were quantified and normalized to total ERM protein levels in
U2OS cells using Western blotting. This analysis showed variable ratios of pERM to
ERM protein levels (Figure 4.12A and B). Additionally, ratios of pERM protein levels
in wild-type cells with endogenous MINK1 levels were compared to both MINK1
deleted and MINK1 overexpressing cells. Similar to the ratios of pERM to ERM
protein levels in inhibitor treated cells, results were highly variable in each cell line
that I tested (Figure 4.12C and D). Together, I could not find significant evidence that
MINK1 is important for ERM phosphorylation in vivo in U2OS cells. This might be
due to a number of reasons, for one MINK1 may not be the only kinase that
phosphorylates ERM proteins and there could be redundancy with other kinases. A
number of other kinases have already been described in the literature to
phosphorylate ERM proteins. Even if MINK1 phosphorylates ERM proteins, the
effect of MINK1 inhibition or deletion might be hidden by compensation of other
ERM-phosphorylating kinases. The ability of MINK1 to phosphorylate the ERM
peptide in vitro does not necessarily indicate that MINK1 phosphorylates ERM
proteins in vivo. However, the fact that endogenous ERM proteins co-
immunoprecipitated with MINK1 (Table 4.1) suggest that they do have a connection
in vivo. It is possible that MINK1 only phosphorylates ERM proteins under specific
conditions, for instance during a specific phase of the cell cycle or when MINK1 is
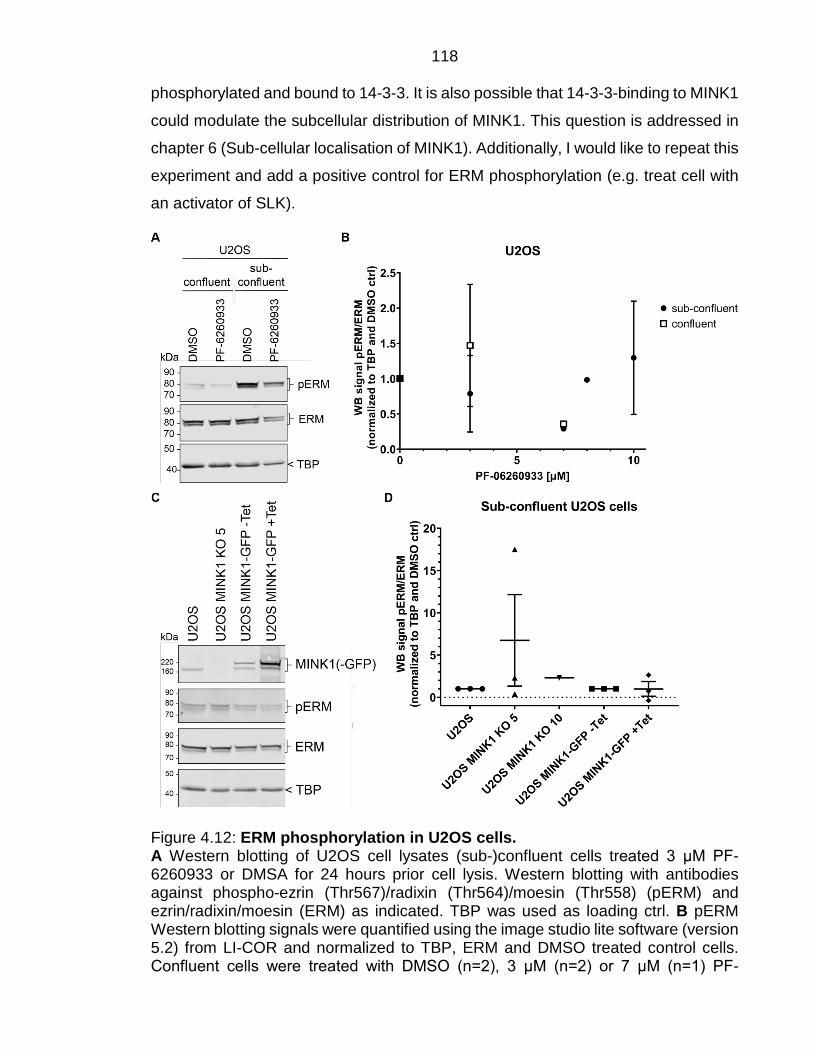
118 phosphorylated and bound to 14-3-3. It is also possible that 14-3-3-binding to MINK1
could modulate the subcellular distribution of MINK1. This question is addressed in
chapter 6 (Sub-cellular localisation of MINK1). Additionally, I would like to repeat this
experiment and add a positive control for ERM phosphorylation (e.g. treat cell with
an activator of SLK).
Figure 4.12: ERM phosphorylation in U2OS cells. A Western blotting of U2OS cell lysates (sub-)confluent cells treated 3 μM PF-6260933 or DMSA for 24 hours prior cell lysis. Western blotting with antibodies against phospho-ezrin (Thr567)/radixin (Thr564)/moesin (Thr558) (pERM) and ezrin/radixin/moesin (ERM) as indicated. TBP was used as loading ctrl. B pERM Western blotting signals were quantified using the image studio lite software (version 5.2) from LI-COR and normalized to TBP, ERM and DMSO treated control cells. Confluent cells were treated with DMSO (n=2), 3 μM (n=2) or 7 μM (n=1) PF-
119 6260933 and sub-confluent cells were treated with DMSO (n=7), 3 μM (n=5), 7 μM (n=2), 8 μM (n=1), or 10 μM (n=2) PF-6260933. Mean values, error bars indicate +/- SD. C Western blotting of cell lysates from sub-confluent U2OS cells, MINK1 KO 5 cells and MINK1-GFP cells +/- tetracycline (Tet). Induction of MINK1-GFP overexpression with 75 ng/ml tetracycline, for 48 hours prior to cell lysis. Western blotting with antibodies against MINK1, phospho-ezrin (Thr567)/radixin (Thr564)/moesin (Thr558) (pERM) and ezrin/radixin/moesin (ERM). TBP was used as loading ctrl. D pERM Western blotting signals from U2OS, MINK1 KO (#5 and #10) and MINK1-GFP (+/- Tet) cells were quantified using the image studio lite software (version 5.2) from LI-COR and normalized to TBP, ERM and DMSO treated control cells. Error bars indicate +/- SEM. n=3 (for MINK1 KO 10 n=1).
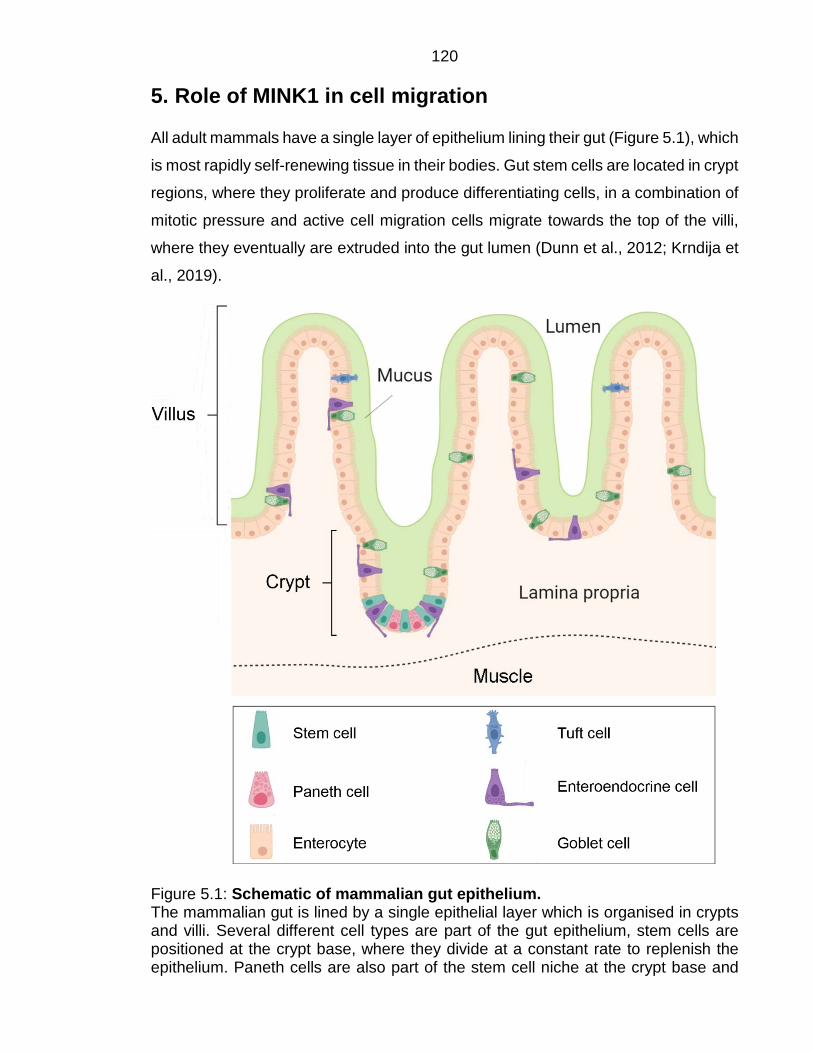
120 5. Role of MINK1 in cell migration
All adult mammals have a single layer of epithelium lining their gut (Figure 5.1), which
is most rapidly self-renewing tissue in their bodies. Gut stem cells are located in crypt
regions, where they proliferate and produce differentiating cells, in a combination of
mitotic pressure and active cell migration cells migrate towards the top of the villi,
where they eventually are extruded into the gut lumen (Dunn et al., 2012; Krndija et
al., 2019).
Figure 5.1: Schematic of mammalian gut epithelium. The mammalian gut is lined by a single epithelial layer which is organised in crypts and villi. Several different cell types are part of the gut epithelium, stem cells are positioned at the crypt base, where they divide at a constant rate to replenish the epithelium. Paneth cells are also part of the stem cell niche at the crypt base and
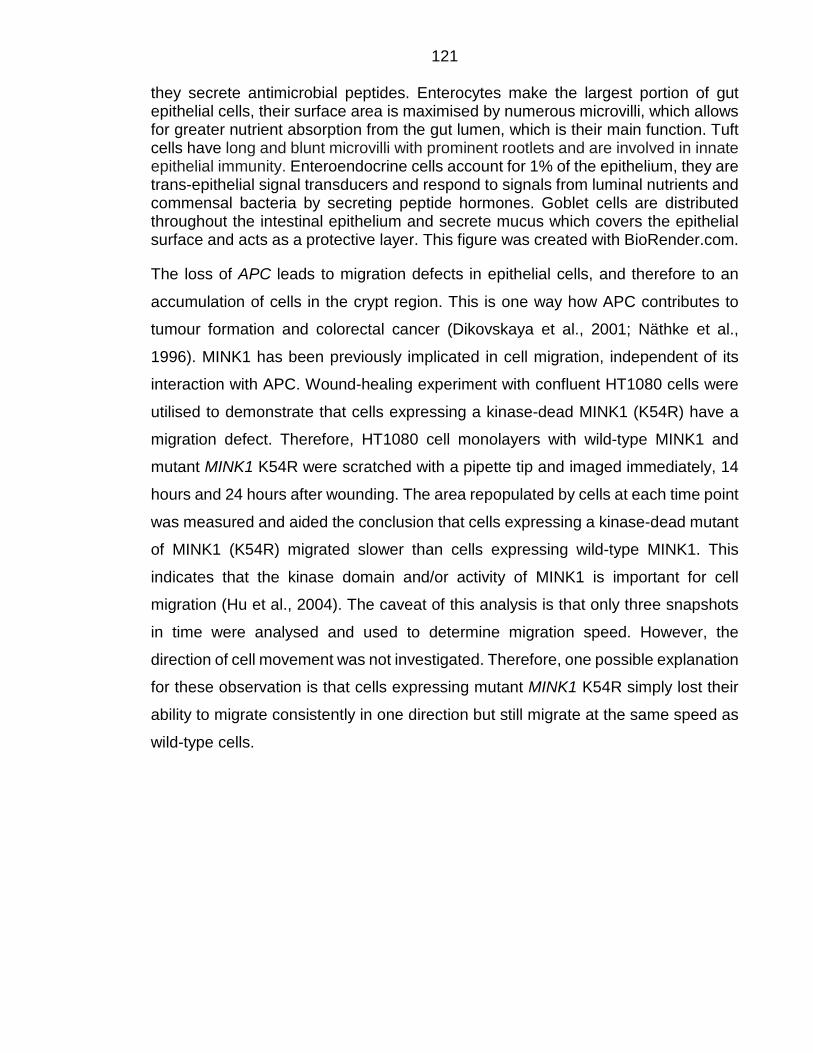
121 they secrete antimicrobial peptides. Enterocytes make the largest portion of gut epithelial cells, their surface area is maximised by numerous microvilli, which allows for greater nutrient absorption from the gut lumen, which is their main function. Tuft cells have long and blunt microvilli with prominent rootlets and are involved in innate epithelial immunity. Enteroendocrine cells account for 1% of the epithelium, they are trans-epithelial signal transducers and respond to signals from luminal nutrients and commensal bacteria by secreting peptide hormones. Goblet cells are distributed throughout the intestinal epithelium and secrete mucus which covers the epithelial surface and acts as a protective layer. This figure was created with BioRender.com.
The loss of APC leads to migration defects in epithelial cells, and therefore to an
accumulation of cells in the crypt region. This is one way how APC contributes to
tumour formation and colorectal cancer (Dikovskaya et al., 2001; Näthke et al.,
1996). MINK1 has been previously implicated in cell migration, independent of its
interaction with APC. Wound-healing experiment with confluent HT1080 cells were
utilised to demonstrate that cells expressing a kinase-dead MINK1 (K54R) have a
migration defect. Therefore, HT1080 cell monolayers with wild-type MINK1 and
mutant MINK1 K54R were scratched with a pipette tip and imaged immediately, 14
hours and 24 hours after wounding. The area repopulated by cells at each time point
was measured and aided the conclusion that cells expressing a kinase-dead mutant
of MINK1 (K54R) migrated slower than cells expressing wild-type MINK1. This
indicates that the kinase domain and/or activity of MINK1 is important for cell
migration (Hu et al., 2004). The caveat of this analysis is that only three snapshots
in time were analysed and used to determine migration speed. However, the
direction of cell movement was not investigated. Therefore, one possible explanation
for these observation is that cells expressing mutant MINK1 K54R simply lost their
ability to migrate consistently in one direction but still migrate at the same speed as
wild-type cells.

122 Summary
Both APC and MINK1 have been implicated in cell migration on their own. Moreover,
APC and MINK1 have been demonstrated to interact and APC negatively regulates
MINK1 ((Popow et al., 2019) and chapter 3). MINK1 is able to phosphorylate ERM
proteins at their activating phosphosite (see chapter 4) and ERM proteins are also
involved in cell migration. This led to the hypothesis that MINK1 contributes to
migration defects, observed in APC mutant/depleted cells. Therefore, one aim of this
thesis was to investigate whether MINK1 is involved in cell migration. To this end,
PIV was used to determine whether MINK1 deletion or overexpression changed the
features of velocity profiles and whether this could illuminate the effect MINK1 might
have on cell-cell interactions, adhesion properties, and/or motility.
Using computational analysis and PIV, I found that overexpression of MINK1 in
U2OS cells led to faster cell migration compared to control cells. Moreover, my
analysis yielded no evidence that the overall correlation length (the distance over
which cells influence each other’s movement) was influenced by MINK1 expression
levels in U2OS cells. However, this broad analysis included averaging over whole
images and multiple timeframes (up to 306). Therefore, I further analysed sequential
U2OS images to investigate potentially more subtle effects by identifying correlation
clusters within each image, investigating speeds of PIV interrogation sections to
determine regions of fast cell movement between frames. This indicated that MINK1
overexpression leads to bigger clusters of fast cell migration, while MINK1 deletion
had the opposite effect. Together, this indicates that MINK1 is important for cell
correlation and that MINK1 deletion leads to correlation defects.
I further investigated velocity correlations of migrating U2OS cells with different
levels of MINK1 expression, using Helmholtz decomposition. Helmholtz
decomposition was used to split velocity fields into divergence-free and curl-free
components, and to analyse whether cell divisions could be predicted using the curl-
free part alone. My analysis indicated that areas with high values of divergence
weakly to moderately correlate with cell rounding events (which can either be
dividing or apoptotic cells), but this correlations were not altered depending on
MINK1 expression.
123 Overexpression of MINK1 leads to faster cell migration
APC mutations lead to migration defects in epithelial cells. MINK1 has been
implicated in cell migration as well, and MINK1 kinase defects are believed to slow
down cell migration (Hu et al., 2004). APC negatively regulates MINK1 (Popow et
al., 2019). Therefore, I hypothesised that MINK1 contributes to cell migration, and
might therefore contribute to migration defects observed in cells with mutant APC
that contribute to the cancer development in intestinal epithelium. To test this
hypothesis, U2OS cells with different expression levels of MINK1 were compared
under confluent and migrating conditions. U2OS cells treated with the rho-
associated protein kinase (ROCK)-inhibitor Y-27632 were employed to simulate
non-migrating controls. Y-27632 is an ATP-competitive inhibitor of ROCK kinases,
ROCK I and ROCK II (Uehata et al., 1997). ROCK kinases are effectors of the small
GTPase Rho and have been implicated in the formation of stress fibres and focal
adhesions (Amano et al., 1997). Additionally, ROCK kinases are important for cell
migration (Riento and Ridley, 2003). MINK1 deleted cells (MINK1 KO) and parental
cells were analysed and compared. MINK1-GFP overexpressing cells (MINK1-GFP
+Tet) were compared to uninduced control cells (MINK1-GFP -Tet). GFP
overexpressing cells (GFP +Tet) were compared to uninduced control cells (GFP -
Tet), and served as control to demonstrate that the tetracycline treatment, and/or the
overexpression of GFP alone did not alter cell migration. For migration analysis, cells
were cultured to confluency in culture-insert 2 wells, which were then removed to
generate a straight edge of cells which then migrated out (Figure 5.2). Alternatively,
cells were cultured to confluency on 6-well dishes. Single cell fronts of migrating cells
and confluent cells were imaged for all conditions and cell types by total internal
reflection fluorescence (TIRF) microscopy. Tiled 3 x 4 images were acquired every
ten minutes, for up to 51 hours. To account for errors introduced by image stitching
and illumination differences between both the tiles of the images and between time
points, empty plates with medium and without cells were imaged the same ways as
plates with cells, and thereby served as background controls.
124
Figure 5.2: Preparation of U2OS cells for imaging of migrating cells. Image altered from ibidi® (ibidi, 2020).
PIV was used to compare velocity fields between all genotypes, because it was not
feasible to calculate all forces of all cells in these sequential images. Migration speed
was the first quantity describing cell migration that was investigated utilising PIV
(using PIVlab (Thielicke, 2020; Thielicke and Stamhuis, 2014) in MATLAB from
MathWorks). PIV was used to compute the velocity vectors for a predefined number
of points for each frame of a series of images, in this case the sequential images
from live cell imaging. The length of each velocity vector, 𝒔𝒔 = √𝑢𝑢2 + 𝑣𝑣2 (where u and
v were horizontal and vertical components of the velocity vector, respectively, and
bold symbols indicate vectors) described the speed of a given point in time, defined
to be the time midway between two consecutive image frames. Speeds of individual
PIV regions were averaged to produce the mean speed (�̅�𝑠) for a given frame, i.e,
�̅�𝑠 = 1𝑛𝑛∑ �𝑢𝑢𝑖𝑖2 + 𝑣𝑣𝑖𝑖2𝑛𝑛𝑖𝑖=1 , where n was the total number of PIV regions and index i
counted those regions. The average speed for all time points of one genotype were
average to produce the average migration speed for each cell type over time. The
average speed for each genotype was calculated, both for the sequential images of
migrating and confluent cells, and plotted over 24 hours. Empty plates were used as
background control, to identify background movement generated by inadequate
stitching, especially differences in stitching between sequential images. Additionally,
background can be generated by differences in illumination of tiles in the tiled images
and between sequential images. For both controls, empty plates and cells treated
with the ROCK-inhibitor Y-27632, the average speed did not change over 24 hours,
neither in the confluent, nor the migrating condition (Figure 5.3). The controls also
indicated a background movement of around 3 μm/h, which was not generated by
migrating cells since the empty plates did not have any cells (just medium), also the
inhibitor treatment prevented cell migration. All other confluent cells moved faster in
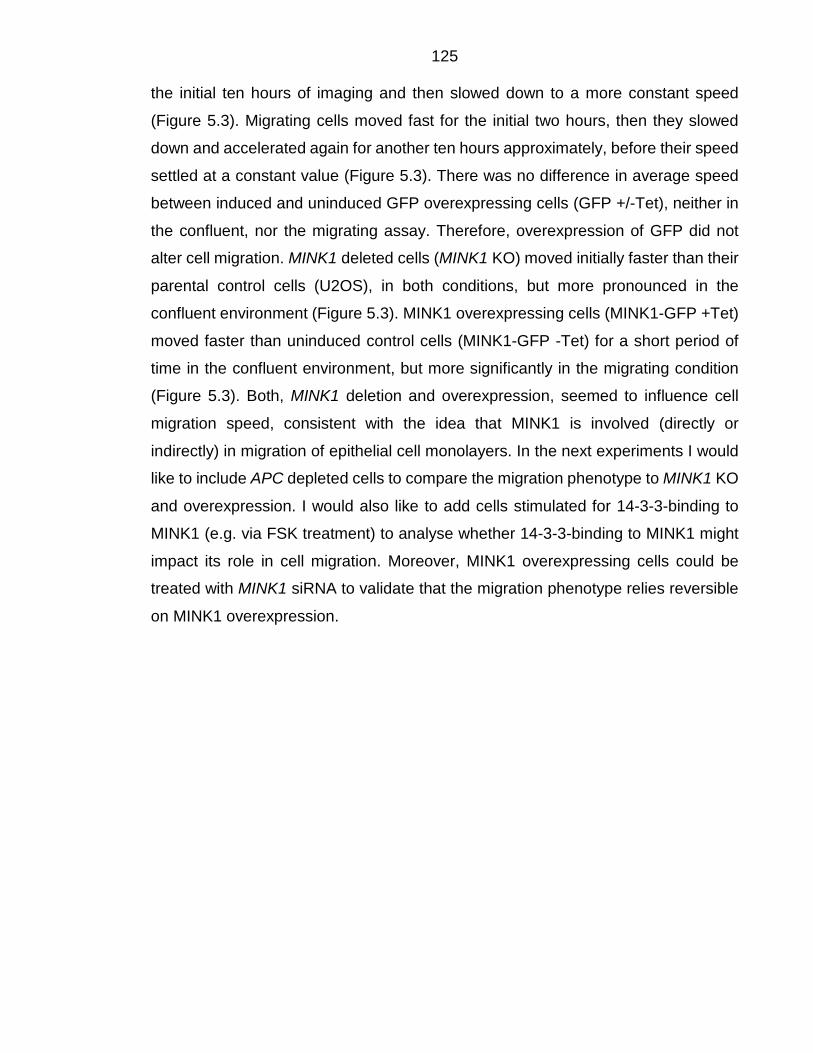
125 the initial ten hours of imaging and then slowed down to a more constant speed
(Figure 5.3). Migrating cells moved fast for the initial two hours, then they slowed
down and accelerated again for another ten hours approximately, before their speed
settled at a constant value (Figure 5.3). There was no difference in average speed
between induced and uninduced GFP overexpressing cells (GFP +/-Tet), neither in
the confluent, nor the migrating assay. Therefore, overexpression of GFP did not
alter cell migration. MINK1 deleted cells (MINK1 KO) moved initially faster than their
parental control cells (U2OS), in both conditions, but more pronounced in the
confluent environment (Figure 5.3). MINK1 overexpressing cells (MINK1-GFP +Tet)
moved faster than uninduced control cells (MINK1-GFP -Tet) for a short period of
time in the confluent environment, but more significantly in the migrating condition
(Figure 5.3). Both, MINK1 deletion and overexpression, seemed to influence cell
migration speed, consistent with the idea that MINK1 is involved (directly or
indirectly) in migration of epithelial cell monolayers. In the next experiments I would
like to include APC depleted cells to compare the migration phenotype to MINK1 KO
and overexpression. I would also like to add cells stimulated for 14-3-3-binding to
MINK1 (e.g. via FSK treatment) to analyse whether 14-3-3-binding to MINK1 might
impact its role in cell migration. Moreover, MINK1 overexpressing cells could be
treated with MINK1 siRNA to validate that the migration phenotype relies reversible
on MINK1 overexpression.
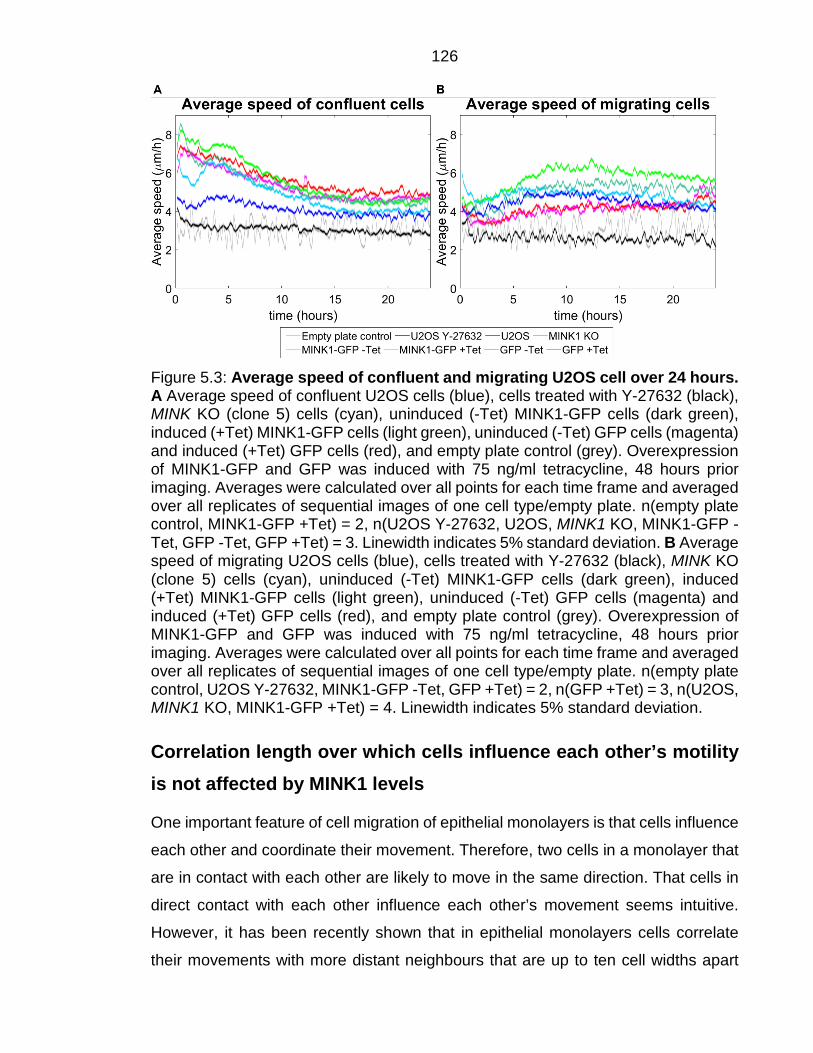
126
Figure 5.3: Average speed of confluent and migrating U2OS cell over 24 hours. A Average speed of confluent U2OS cells (blue), cells treated with Y-27632 (black), MINK KO (clone 5) cells (cyan), uninduced (-Tet) MINK1-GFP cells (dark green), induced (+Tet) MINK1-GFP cells (light green), uninduced (-Tet) GFP cells (magenta) and induced (+Tet) GFP cells (red), and empty plate control (grey). Overexpression of MINK1-GFP and GFP was induced with 75 ng/ml tetracycline, 48 hours prior imaging. Averages were calculated over all points for each time frame and averaged over all replicates of sequential images of one cell type/empty plate. n(empty plate control, MINK1-GFP +Tet) = 2, n(U2OS Y-27632, U2OS, MINK1 KO, MINK1-GFP -Tet, GFP -Tet, GFP +Tet) = 3. Linewidth indicates 5% standard deviation. B Average speed of migrating U2OS cells (blue), cells treated with Y-27632 (black), MINK KO (clone 5) cells (cyan), uninduced (-Tet) MINK1-GFP cells (dark green), induced (+Tet) MINK1-GFP cells (light green), uninduced (-Tet) GFP cells (magenta) and induced (+Tet) GFP cells (red), and empty plate control (grey). Overexpression of MINK1-GFP and GFP was induced with 75 ng/ml tetracycline, 48 hours prior imaging. Averages were calculated over all points for each time frame and averaged over all replicates of sequential images of one cell type/empty plate. n(empty plate control, U2OS Y-27632, MINK1-GFP -Tet, GFP +Tet) = 2, n(GFP +Tet) = 3, n(U2OS, MINK1 KO, MINK1-GFP +Tet) = 4. Linewidth indicates 5% standard deviation.
Correlation length over which cells influence each other’s motility is not affected by MINK1 levels
One important feature of cell migration of epithelial monolayers is that cells influence
each other and coordinate their movement. Therefore, two cells in a monolayer that
are in contact with each other are likely to move in the same direction. That cells in
direct contact with each other influence each other’s movement seems intuitive.
However, it has been recently shown that in epithelial monolayers cells correlate
their movements with more distant neighbours that are up to ten cell widths apart

127 (Henkes et al., 2020). To investigate whether the deletion or overexpression of
MINK1 influences such correlations of cell velocities, velocity fields were transformed
to Fourier space. The calculated velocity fields were placed on an N x M grid, where
N are the number of points in x-direction and M are the number of points in y-
direction. Therefore, the function v has the value 𝒗𝒗(𝑥𝑥𝑚𝑚,𝑦𝑦𝑛𝑛) for a given point in this
grid, where 𝑥𝑥𝑚𝑚 = 𝑚𝑚∆𝑥𝑥 and 𝑦𝑦𝑛𝑛 = 𝑛𝑛∆𝑦𝑦 with 𝑚𝑚 ∈ {1, … ,𝑁𝑁},𝑛𝑛 ∈ {1, … , 𝑀𝑀},∆𝑥𝑥 = 𝐿𝐿𝑥𝑥/𝑁𝑁
and ∆𝑦𝑦 = 𝐿𝐿𝑦𝑦/𝑀𝑀 (Lx and Ly are the width and height of each image in μm,
respectively). The discrete Fourier transform of the PIV velocity fields is defined as:
𝒗𝒗�(𝑞𝑞𝑟𝑟 ,𝑞𝑞𝑠𝑠) = 1𝑁𝑁𝑁𝑁
∑ ∑ 𝒗𝒗(𝑥𝑥𝑚𝑚, 𝑦𝑦𝑛𝑛)𝑒𝑒𝑖𝑖(𝑞𝑞𝑟𝑟𝑥𝑥𝑚𝑚+𝑞𝑞𝑠𝑠𝑦𝑦𝑛𝑛)𝑁𝑁−1𝑛𝑛=0
𝑁𝑁−1𝑚𝑚=0 , where the reciprocal vectors were
defined as: 𝒒𝒒 = (𝑟𝑟∆𝑞𝑞𝑥𝑥, 𝑠𝑠∆𝑞𝑞𝑦𝑦) with 𝑟𝑟 ∈ {1, … ,𝑁𝑁}, 𝑠𝑠 ∈ {1, … ,𝑀𝑀} and ∆qx = 2πLx
, ∆qy = 2πLy
,
𝑖𝑖 = √−1 and bold symbols indicate vectors. Since the direction of the q‐vector is not
important, it was averaged over and all quantities of interest were plotted as a
function of magnitude of the q-vector, i.e. |𝒒𝒒| = �𝑞𝑞𝑟𝑟2 + 𝑞𝑞𝑠𝑠2 = �(2𝜋𝜋𝐿𝐿𝑚𝑚
)2𝑟𝑟2 + (2𝜋𝜋𝐿𝐿𝑦𝑦
)2𝑠𝑠2. The
image dimension of all sequential images from all genotypes were: Lx = 1905.55 μm
and Ly = 2518.8 μm. Therefore, the smallest non-zero value of |𝒒𝒒| was |𝒒𝒒| =
�∆𝑞𝑞𝑥𝑥2 + ∆𝑞𝑞𝑦𝑦2 = �(2𝜋𝜋𝐿𝐿𝑚𝑚
)2 + (2𝜋𝜋𝐿𝐿𝑦𝑦
)2 ≈ 0.00413 1µm
. In real space, this corresponds to 2𝜋𝜋|𝒒𝒒| ≈
1520 µm. The typical cell length of a U2OS cell in these sequential images was
between 25-70 μm (Figure 5.4A), with migrating cells being more elongated. The
largest value of |𝒒𝒒| was set to 0.15 1µm
, which corresponds to 2𝜋𝜋|𝒒𝒒| ≈ 41.9 µm, because
it would not make sense to probe distances smaller than one cell diameter.
A quantity of particular interest was the velocity-velocity correlation function in
Fourier space, defined as 𝐶𝐶𝑣𝑣𝑣𝑣(𝑞𝑞) = ⟨|𝒗𝒗�(𝑞𝑞)|2⟩𝑁𝑁𝑁𝑁⟨𝑣𝑣2⟩
, where ⟨𝑣𝑣2⟩ = ⟨ 1𝑁𝑁𝑁𝑁
∑ ∑ |𝒗𝒗(𝑥𝑥𝑚𝑚,𝑦𝑦𝑛𝑛)|2𝑁𝑁𝑛𝑛=1
𝑁𝑁𝑚𝑚=1 ⟩
is the mean-squared velocity and ⟨… ⟩ denotes the average over all sequential
images. Cells treated with the ROCK-inhibitor Y-27632 (U2OS Y-27632) generated
curves with slightly different slopes than the other cell types (Figure 5.4B-E). The
inhibitor prevented cells from migrating, but they were still able to move slightly. This
control also indicated that differences in cell motility could be detected with this
analysis. However, there were very small differences between graphs from cells

128 deleted for MINK1 or overexpressing it, when compared to their respective controls
(Figure 5.4B-E). This indicates that MINK1 might not significantly change the
correlation length over which cells influence each other’s motility.
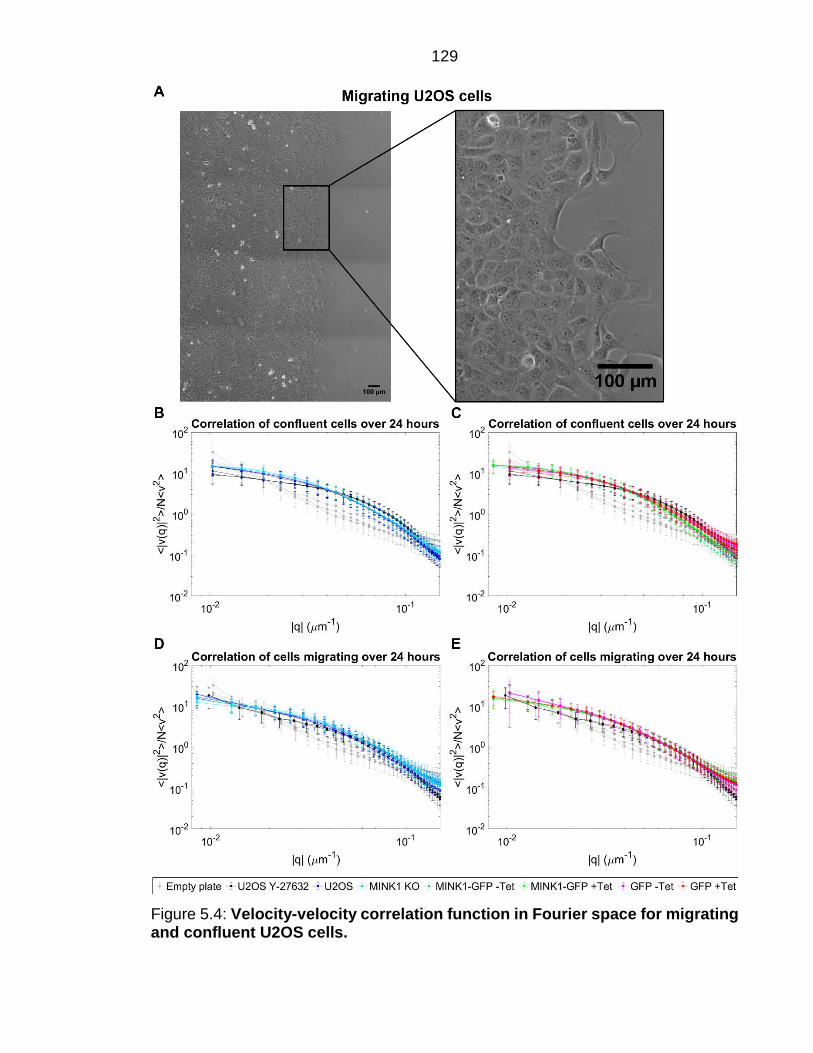
129
Figure 5.4: Velocity-velocity correlation function in Fourier space for migrating and confluent U2OS cells.
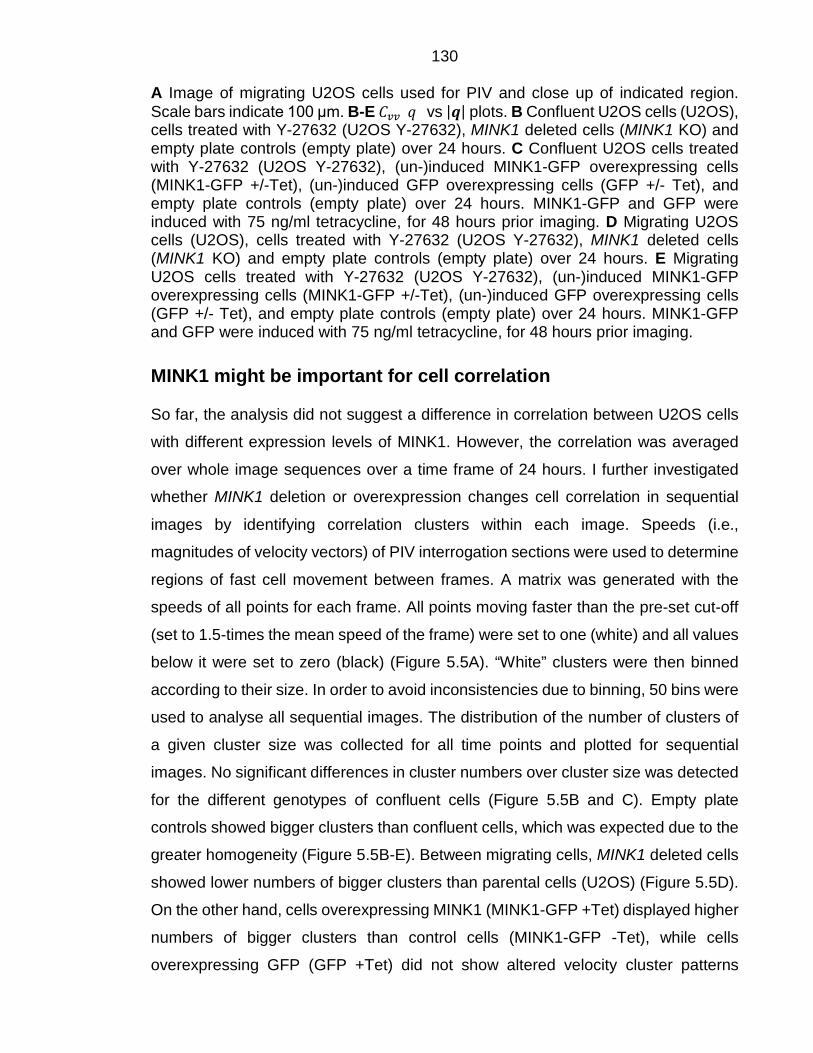
130 A Image of migrating U2OS cells used for PIV and close up of indicated region. Scale bars indicate 100 μm. B-E 𝐶𝐶𝑣𝑣𝑣𝑣(𝑞𝑞) vs |𝒒𝒒| plots. B Confluent U2OS cells (U2OS), cells treated with Y-27632 (U2OS Y-27632), MINK1 deleted cells (MINK1 KO) and empty plate controls (empty plate) over 24 hours. C Confluent U2OS cells treated with Y-27632 (U2OS Y-27632), (un-)induced MINK1-GFP overexpressing cells (MINK1-GFP +/-Tet), (un-)induced GFP overexpressing cells (GFP +/- Tet), and empty plate controls (empty plate) over 24 hours. MINK1-GFP and GFP were induced with 75 ng/ml tetracycline, for 48 hours prior imaging. D Migrating U2OS cells (U2OS), cells treated with Y-27632 (U2OS Y-27632), MINK1 deleted cells (MINK1 KO) and empty plate controls (empty plate) over 24 hours. E Migrating U2OS cells treated with Y-27632 (U2OS Y-27632), (un-)induced MINK1-GFP overexpressing cells (MINK1-GFP +/-Tet), (un-)induced GFP overexpressing cells (GFP +/- Tet), and empty plate controls (empty plate) over 24 hours. MINK1-GFP and GFP were induced with 75 ng/ml tetracycline, for 48 hours prior imaging.
MINK1 might be important for cell correlation
So far, the analysis did not suggest a difference in correlation between U2OS cells
with different expression levels of MINK1. However, the correlation was averaged
over whole image sequences over a time frame of 24 hours. I further investigated
whether MINK1 deletion or overexpression changes cell correlation in sequential
images by identifying correlation clusters within each image. Speeds (i.e.,
magnitudes of velocity vectors) of PIV interrogation sections were used to determine
regions of fast cell movement between frames. A matrix was generated with the
speeds of all points for each frame. All points moving faster than the pre-set cut-off
(set to 1.5-times the mean speed of the frame) were set to one (white) and all values
below it were set to zero (black) (Figure 5.5A). “White” clusters were then binned
according to their size. In order to avoid inconsistencies due to binning, 50 bins were
used to analyse all sequential images. The distribution of the number of clusters of
a given cluster size was collected for all time points and plotted for sequential
images. No significant differences in cluster numbers over cluster size was detected
for the different genotypes of confluent cells (Figure 5.5B and C). Empty plate
controls showed bigger clusters than confluent cells, which was expected due to the
greater homogeneity (Figure 5.5B-E). Between migrating cells, MINK1 deleted cells
showed lower numbers of bigger clusters than parental cells (U2OS) (Figure 5.5D).
On the other hand, cells overexpressing MINK1 (MINK1-GFP +Tet) displayed higher
numbers of bigger clusters than control cells (MINK1-GFP -Tet), while cells
overexpressing GFP (GFP +Tet) did not show altered velocity cluster patterns

131 compared to control cells (GFP -Tet) (Figure 5.5E). These results were in agreement
with my previous results indicating that MINK1 overexpressing cells migrate faster
(Figure 5.3B) compared to control cells.
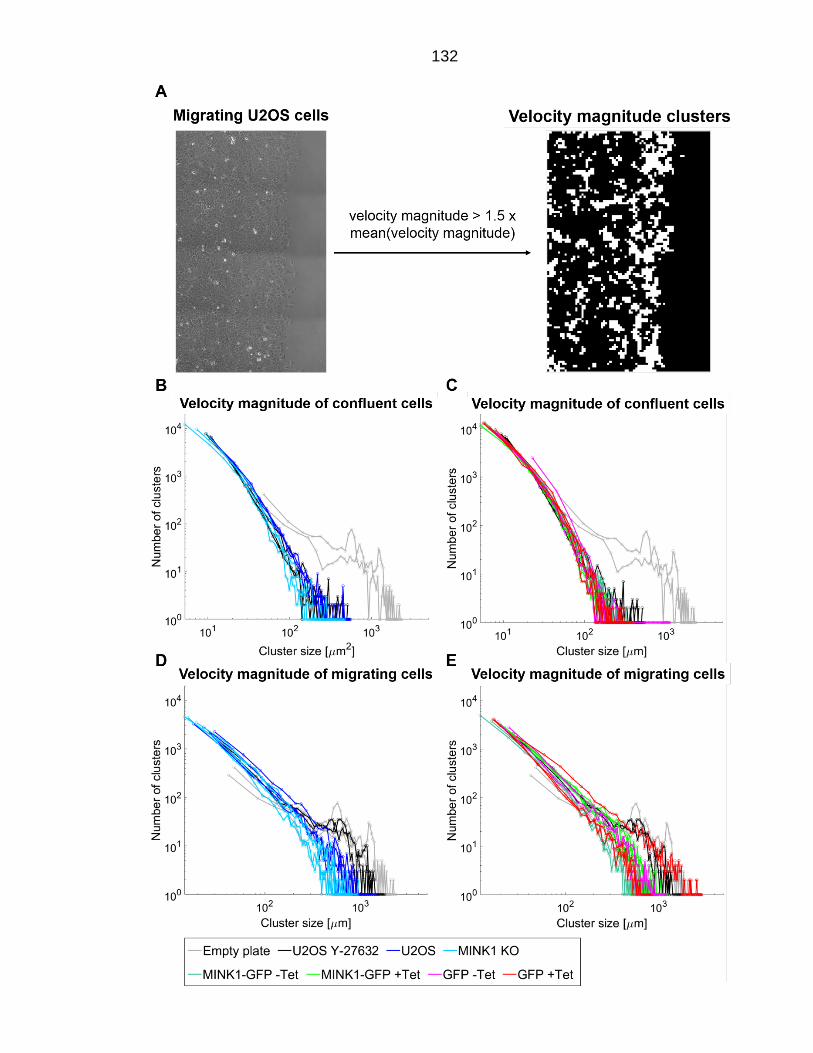
132
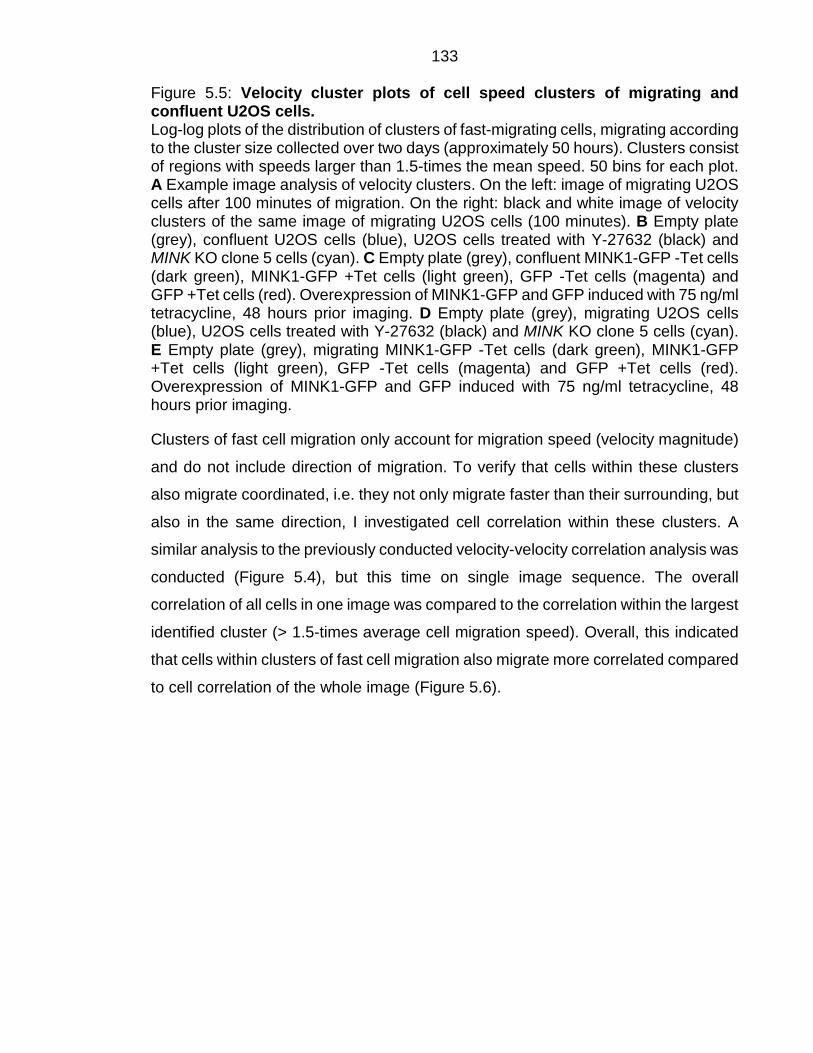
133 Figure 5.5: Velocity cluster plots of cell speed clusters of migrating and confluent U2OS cells. Log-log plots of the distribution of clusters of fast-migrating cells, migrating according to the cluster size collected over two days (approximately 50 hours). Clusters consist of regions with speeds larger than 1.5-times the mean speed. 50 bins for each plot. A Example image analysis of velocity clusters. On the left: image of migrating U2OS cells after 100 minutes of migration. On the right: black and white image of velocity clusters of the same image of migrating U2OS cells (100 minutes). B Empty plate (grey), confluent U2OS cells (blue), U2OS cells treated with Y-27632 (black) and MINK KO clone 5 cells (cyan). C Empty plate (grey), confluent MINK1-GFP -Tet cells (dark green), MINK1-GFP +Tet cells (light green), GFP -Tet cells (magenta) and GFP +Tet cells (red). Overexpression of MINK1-GFP and GFP induced with 75 ng/ml tetracycline, 48 hours prior imaging. D Empty plate (grey), migrating U2OS cells (blue), U2OS cells treated with Y-27632 (black) and MINK KO clone 5 cells (cyan). E Empty plate (grey), migrating MINK1-GFP -Tet cells (dark green), MINK1-GFP +Tet cells (light green), GFP -Tet cells (magenta) and GFP +Tet cells (red). Overexpression of MINK1-GFP and GFP induced with 75 ng/ml tetracycline, 48 hours prior imaging.
Clusters of fast cell migration only account for migration speed (velocity magnitude)
and do not include direction of migration. To verify that cells within these clusters
also migrate coordinated, i.e. they not only migrate faster than their surrounding, but
also in the same direction, I investigated cell correlation within these clusters. A
similar analysis to the previously conducted velocity-velocity correlation analysis was
conducted (Figure 5.4), but this time on single image sequence. The overall
correlation of all cells in one image was compared to the correlation within the largest
identified cluster (> 1.5-times average cell migration speed). Overall, this indicated
that cells within clusters of fast cell migration also migrate more correlated compared
to cell correlation of the whole image (Figure 5.6).
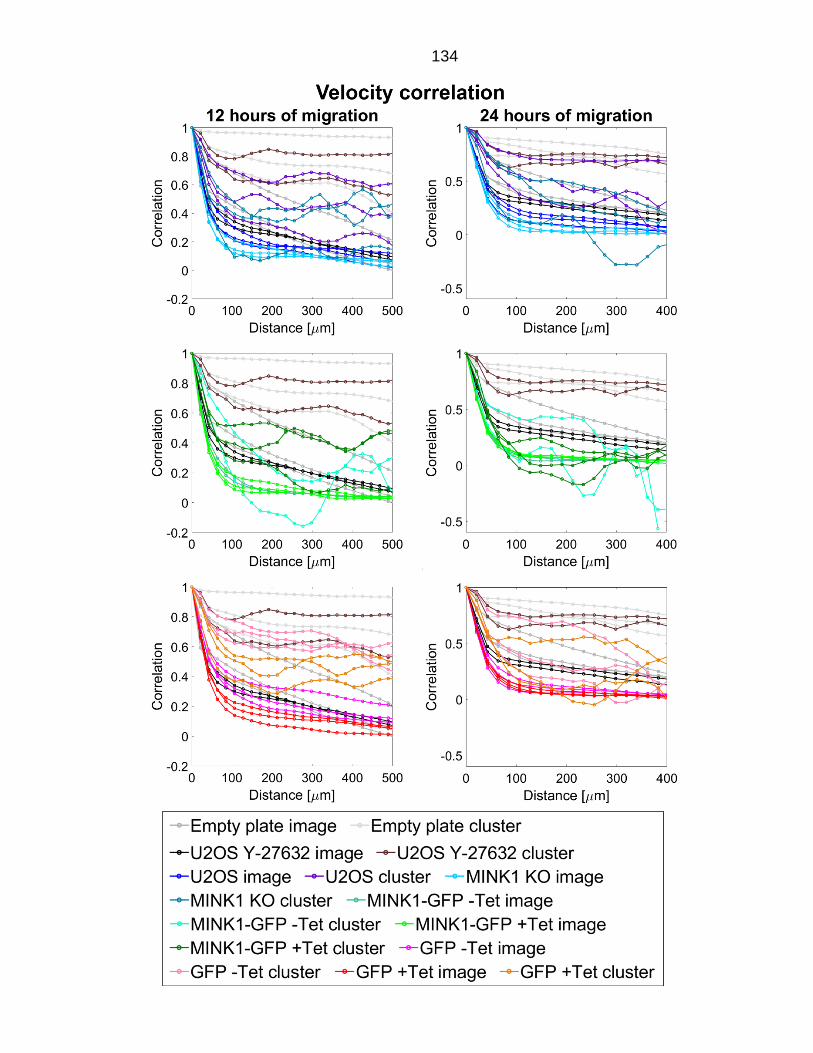
134
135 Figure 5.6: Velocity correlation of all migrating cells in example images versus cluster of fast migration cells. Velocity correlation over example image sequences (image) and within the biggest identified cluster fast (greater than 1.5-times faster than the average) cell migration speed (cluster) were analysed. Clusters of fast migration were identified in a previous analysis (Figure 5.5). The left panel shows the analysis on example images after 12 hours of migration. The right panel shows the analysis on example images after 24 hours of migration.
Together, these results suggest that MINK1 overexpression might lead to bigger
clusters of cells migrating, which overall could lead to higher mean speed (faster
mean migration). Moreover, cells within clusters of faster cell migration are more
correlated than cells outside these cluster. Overall, this indicates that MINK1 is
important for cell correlation and that MINK1 deletion leads to correlation defects. To
further investigate this, I would like to rescue the MINK1 deletion by transfecting
these cells with MINK1 and validate that this rescues the phenotype. In parallel, I
would like to deplete MINK1 from MINK1 overexpressing cells with siRNA and also
validate that this can reverse the observed phenotype.
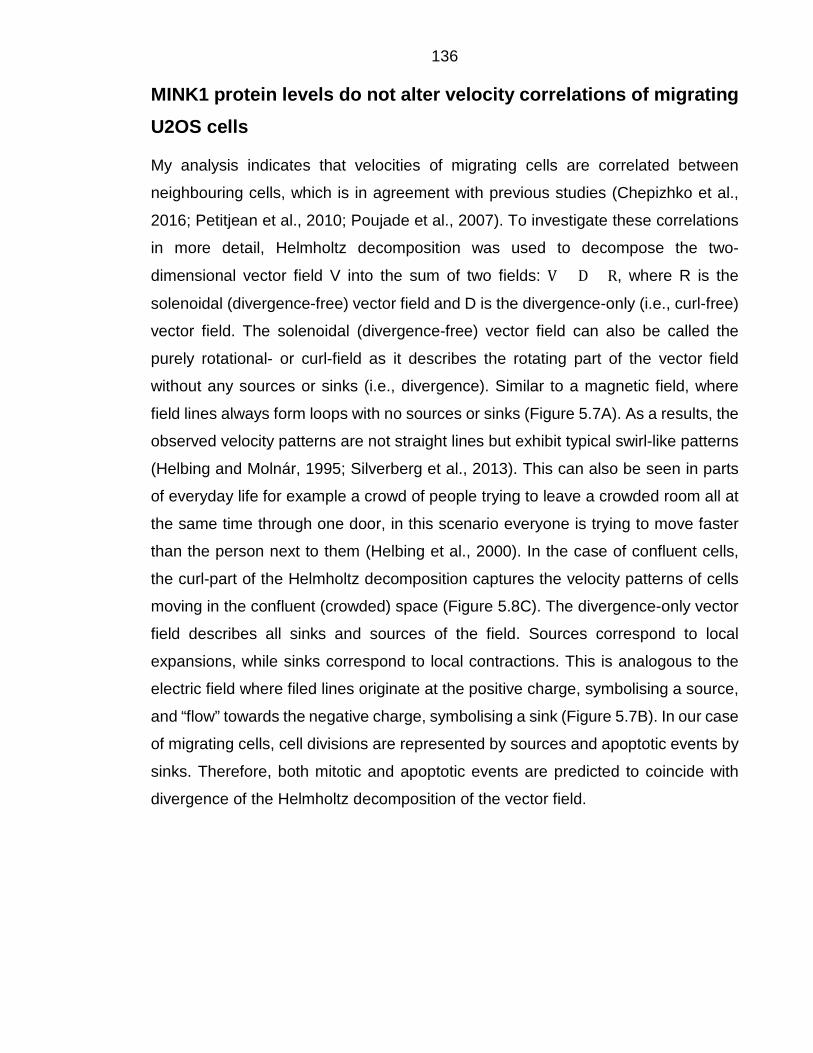
136 MINK1 protein levels do not alter velocity correlations of migrating U2OS cells
My analysis indicates that velocities of migrating cells are correlated between
neighbouring cells, which is in agreement with previous studies (Chepizhko et al.,
2016; Petitjean et al., 2010; Poujade et al., 2007). To investigate these correlations
in more detail, Helmholtz decomposition was used to decompose the two-
dimensional vector field V into the sum of two fields: V = D + R, where R is the
solenoidal (divergence-free) vector field and D is the divergence-only (i.e., curl-free)
vector field. The solenoidal (divergence-free) vector field can also be called the
purely rotational- or curl-field as it describes the rotating part of the vector field
without any sources or sinks (i.e., divergence). Similar to a magnetic field, where
field lines always form loops with no sources or sinks (Figure 5.7A). As a results, the
observed velocity patterns are not straight lines but exhibit typical swirl-like patterns
(Helbing and Molnár, 1995; Silverberg et al., 2013). This can also be seen in parts
of everyday life for example a crowd of people trying to leave a crowded room all at
the same time through one door, in this scenario everyone is trying to move faster
than the person next to them (Helbing et al., 2000). In the case of confluent cells,
the curl-part of the Helmholtz decomposition captures the velocity patterns of cells
moving in the confluent (crowded) space (Figure 5.8C). The divergence-only vector
field describes all sinks and sources of the field. Sources correspond to local
expansions, while sinks correspond to local contractions. This is analogous to the
electric field where filed lines originate at the positive charge, symbolising a source,
and “flow” towards the negative charge, symbolising a sink (Figure 5.7B). In our case
of migrating cells, cell divisions are represented by sources and apoptotic events by
sinks. Therefore, both mitotic and apoptotic events are predicted to coincide with
divergence of the Helmholtz decomposition of the vector field.
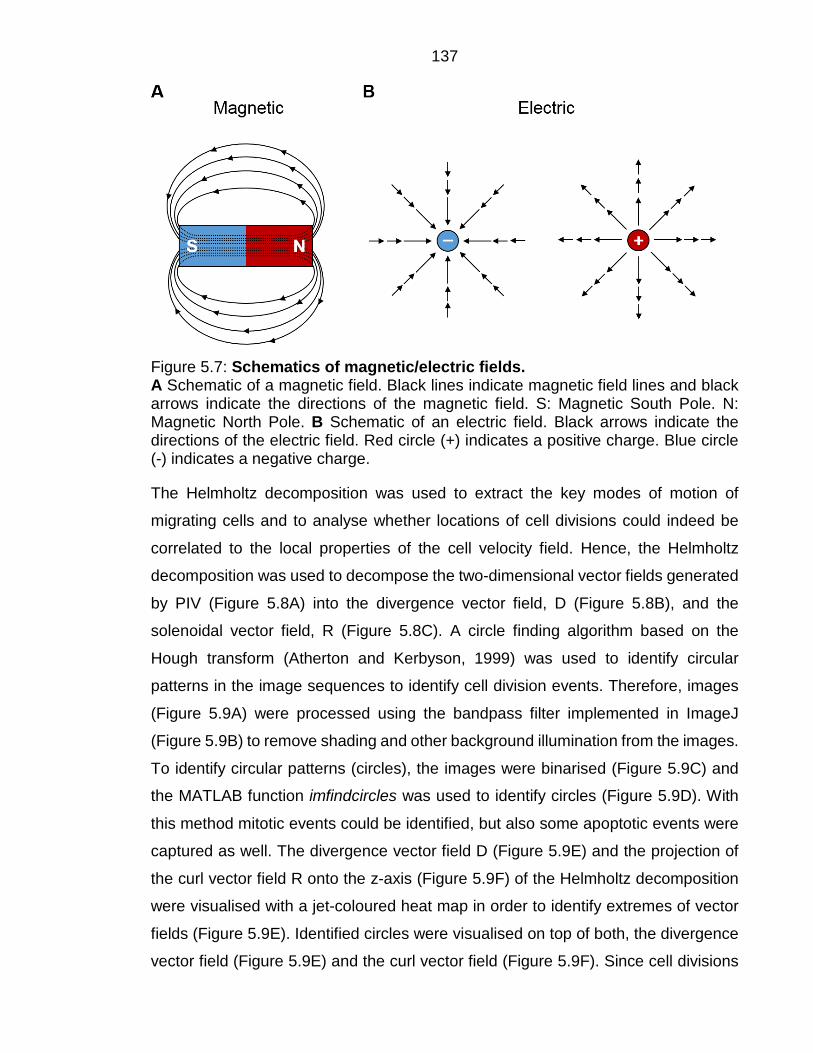
137
Figure 5.7: Schematics of magnetic/electric fields. A Schematic of a magnetic field. Black lines indicate magnetic field lines and black arrows indicate the directions of the magnetic field. S: Magnetic South Pole. N: Magnetic North Pole. B Schematic of an electric field. Black arrows indicate the directions of the electric field. Red circle (+) indicates a positive charge. Blue circle (-) indicates a negative charge.
The Helmholtz decomposition was used to extract the key modes of motion of
migrating cells and to analyse whether locations of cell divisions could indeed be
correlated to the local properties of the cell velocity field. Hence, the Helmholtz
decomposition was used to decompose the two-dimensional vector fields generated
by PIV (Figure 5.8A) into the divergence vector field, D (Figure 5.8B), and the
solenoidal vector field, R (Figure 5.8C). A circle finding algorithm based on the
Hough transform (Atherton and Kerbyson, 1999) was used to identify circular
patterns in the image sequences to identify cell division events. Therefore, images
(Figure 5.9A) were processed using the bandpass filter implemented in ImageJ
(Figure 5.9B) to remove shading and other background illumination from the images.
To identify circular patterns (circles), the images were binarised (Figure 5.9C) and
the MATLAB function imfindcircles was used to identify circles (Figure 5.9D). With
this method mitotic events could be identified, but also some apoptotic events were
captured as well. The divergence vector field D (Figure 5.9E) and the projection of
the curl vector field R onto the z-axis (Figure 5.9F) of the Helmholtz decomposition
were visualised with a jet-coloured heat map in order to identify extremes of vector
fields (Figure 5.9E). Identified circles were visualised on top of both, the divergence
vector field (Figure 5.9E) and the curl vector field (Figure 5.9F). Since cell divisions
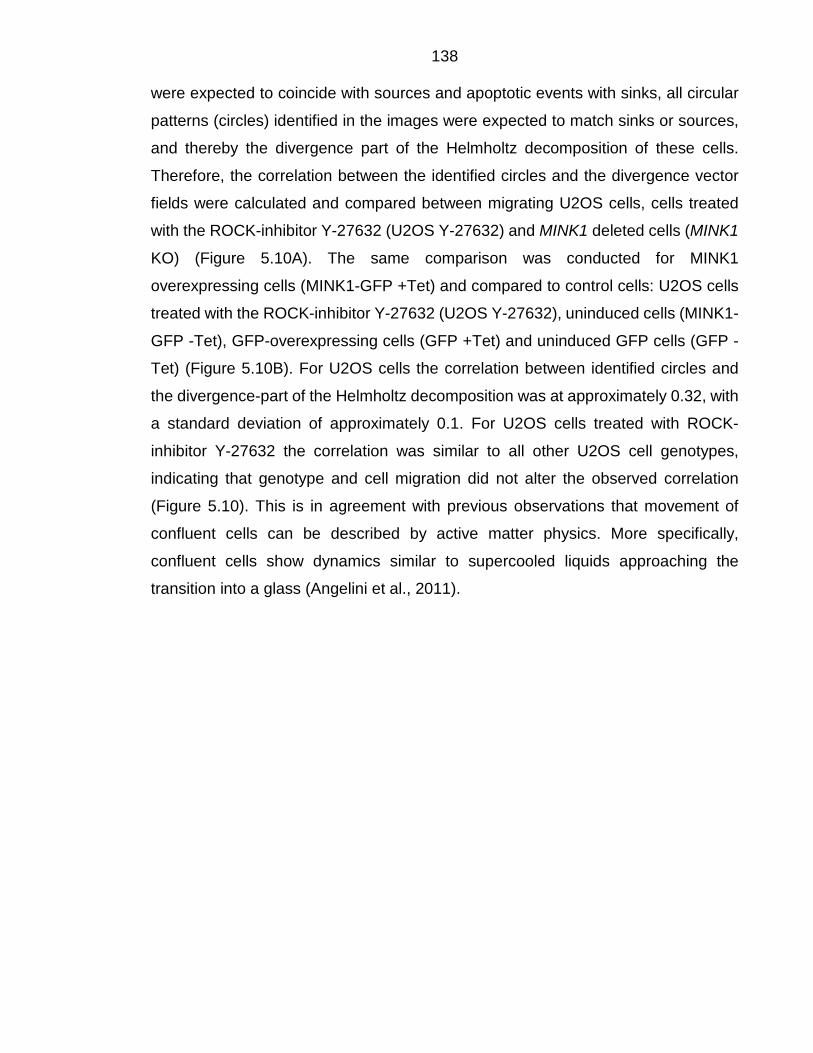
138 were expected to coincide with sources and apoptotic events with sinks, all circular
patterns (circles) identified in the images were expected to match sinks or sources,
and thereby the divergence part of the Helmholtz decomposition of these cells.
Therefore, the correlation between the identified circles and the divergence vector
fields were calculated and compared between migrating U2OS cells, cells treated
with the ROCK-inhibitor Y-27632 (U2OS Y-27632) and MINK1 deleted cells (MINK1
KO) (Figure 5.10A). The same comparison was conducted for MINK1
overexpressing cells (MINK1-GFP +Tet) and compared to control cells: U2OS cells
treated with the ROCK-inhibitor Y-27632 (U2OS Y-27632), uninduced cells (MINK1-
GFP -Tet), GFP-overexpressing cells (GFP +Tet) and uninduced GFP cells (GFP -
Tet) (Figure 5.10B). For U2OS cells the correlation between identified circles and
the divergence-part of the Helmholtz decomposition was at approximately 0.32, with
a standard deviation of approximately 0.1. For U2OS cells treated with ROCK-
inhibitor Y-27632 the correlation was similar to all other U2OS cell genotypes,
indicating that genotype and cell migration did not alter the observed correlation
(Figure 5.10). This is in agreement with previous observations that movement of
confluent cells can be described by active matter physics. More specifically,
confluent cells show dynamics similar to supercooled liquids approaching the
transition into a glass (Angelini et al., 2011).
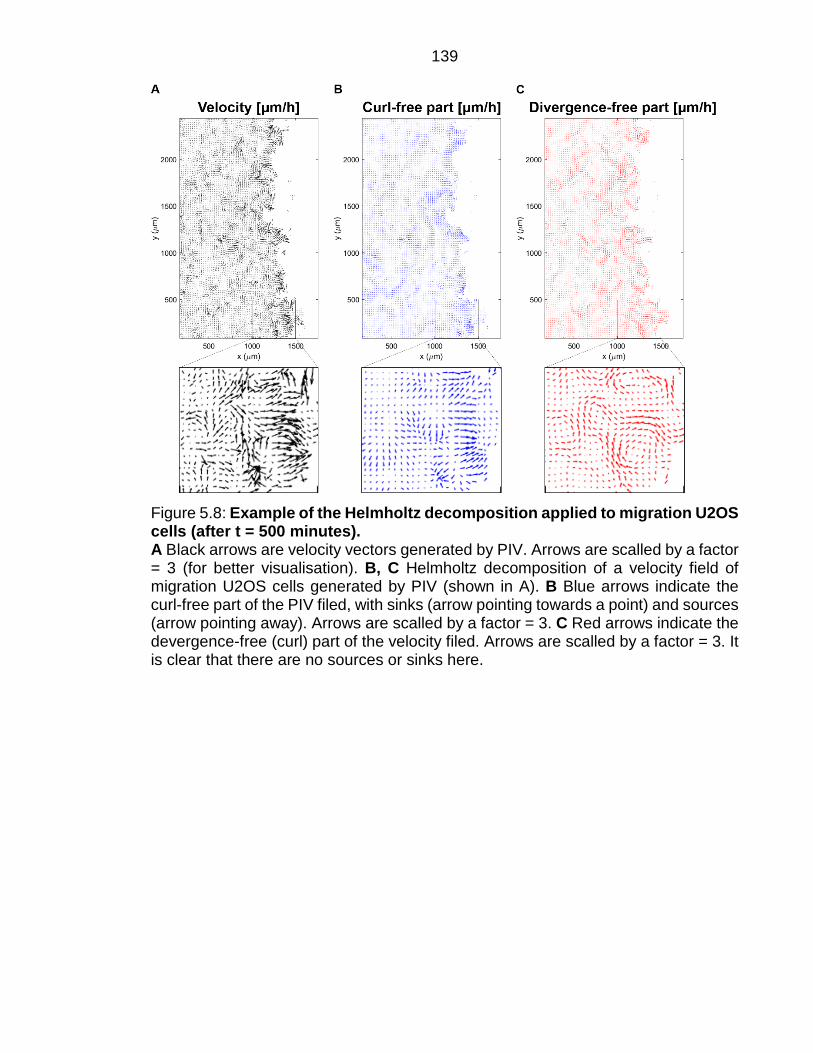
139
Figure 5.8: Example of the Helmholtz decomposition applied to migration U2OS cells (after t = 500 minutes). A Black arrows are velocity vectors generated by PIV. Arrows are scalled by a factor = 3 (for better visualisation). B, C Helmholtz decomposition of a velocity field of migration U2OS cells generated by PIV (shown in A). B Blue arrows indicate the curl-free part of the PIV filed, with sinks (arrow pointing towards a point) and sources (arrow pointing away). Arrows are scalled by a factor = 3. C Red arrows indicate the devergence-free (curl) part of the velocity filed. Arrows are scalled by a factor = 3. It is clear that there are no sources or sinks here.
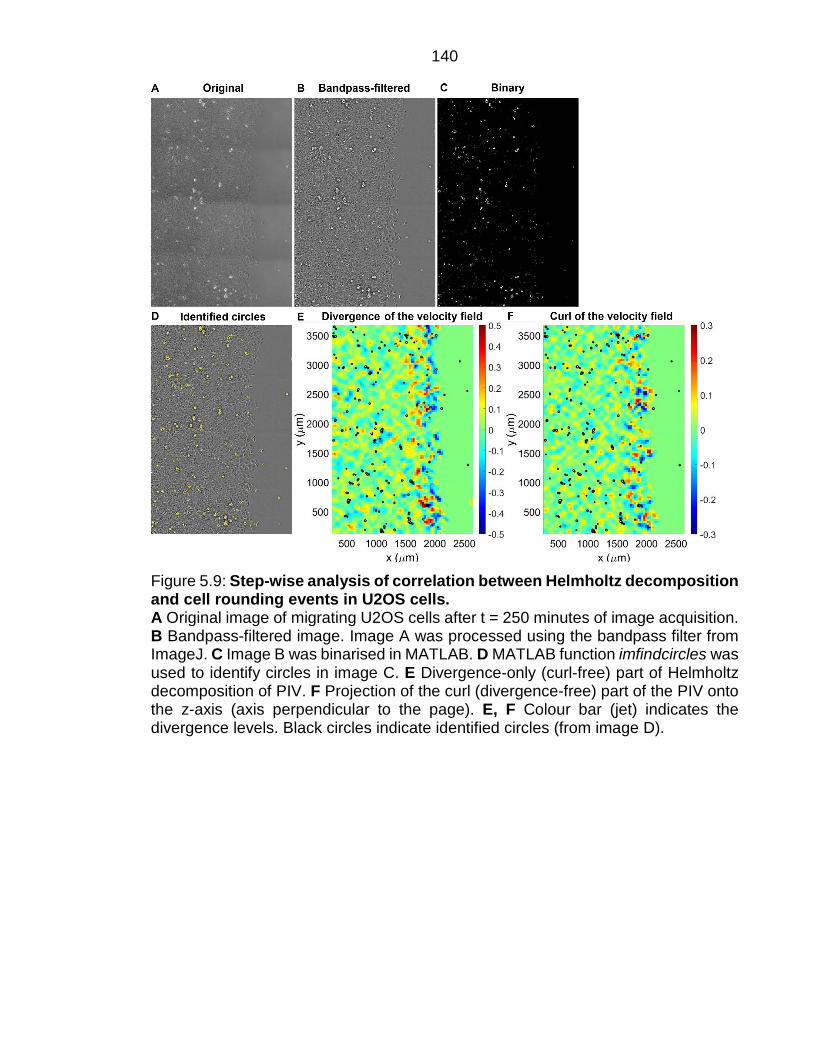
140
Figure 5.9: Step-wise analysis of correlation between Helmholtz decomposition and cell rounding events in U2OS cells. A Original image of migrating U2OS cells after t = 250 minutes of image acquisition. B Bandpass-filtered image. Image A was processed using the bandpass filter from ImageJ. C Image B was binarised in MATLAB. D MATLAB function imfindcircles was used to identify circles in image C. E Divergence-only (curl-free) part of Helmholtz decomposition of PIV. F Projection of the curl (divergence-free) part of the PIV onto the z-axis (axis perpendicular to the page). E, F Colour bar (jet) indicates the divergence levels. Black circles indicate identified circles (from image D).
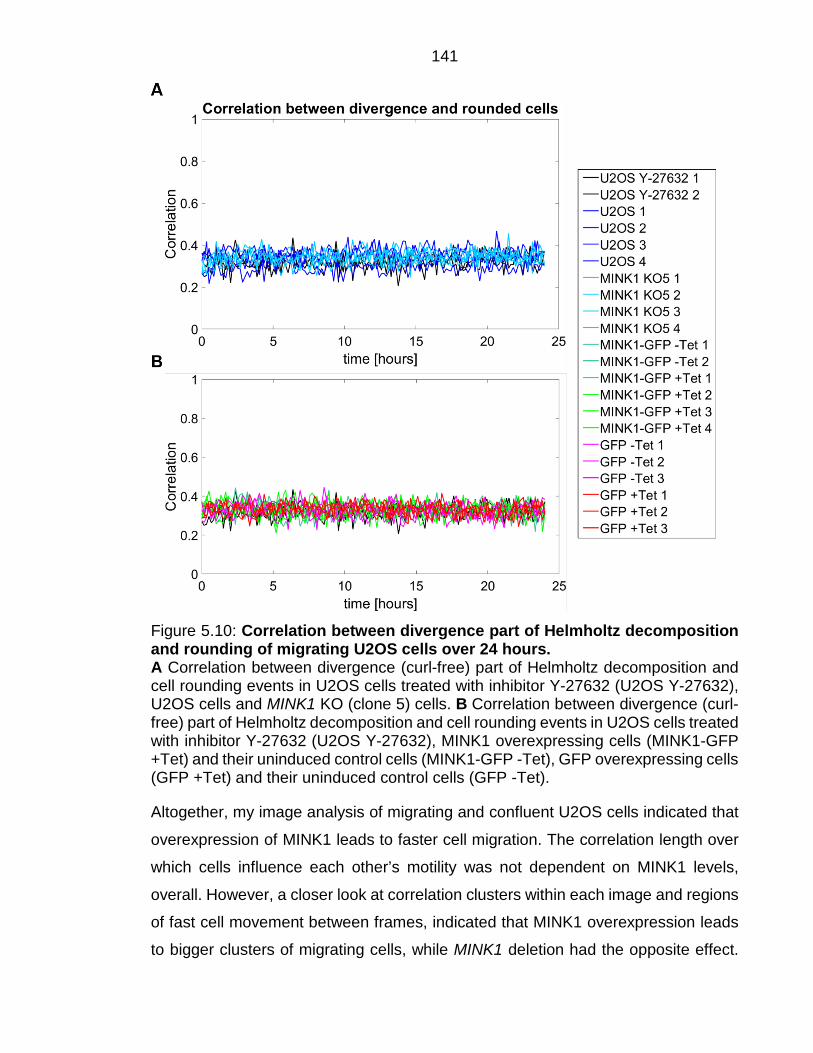
141
Figure 5.10: Correlation between divergence part of Helmholtz decomposition and rounding of migrating U2OS cells over 24 hours. A Correlation between divergence (curl-free) part of Helmholtz decomposition and cell rounding events in U2OS cells treated with inhibitor Y-27632 (U2OS Y-27632), U2OS cells and MINK1 KO (clone 5) cells. B Correlation between divergence (curl-free) part of Helmholtz decomposition and cell rounding events in U2OS cells treated with inhibitor Y-27632 (U2OS Y-27632), MINK1 overexpressing cells (MINK1-GFP +Tet) and their uninduced control cells (MINK1-GFP -Tet), GFP overexpressing cells (GFP +Tet) and their uninduced control cells (GFP -Tet).
Altogether, my image analysis of migrating and confluent U2OS cells indicated that
overexpression of MINK1 leads to faster cell migration. The correlation length over
which cells influence each other’s motility was not dependent on MINK1 levels,
overall. However, a closer look at correlation clusters within each image and regions
of fast cell movement between frames, indicated that MINK1 overexpression leads
to bigger clusters of migrating cells, while MINK1 deletion had the opposite effect.
142 This indicates that MINK1 is likely important for cell correlation and that MINK1
deletion leads to correlation defects. The analysis of velocity correlations of migrating
U2OS cells using Helmholtz decomposition indicated that while areas with high
values of divergence weakly to moderately correlate with cell rounding events, there
was no difference upon altered MINK1 expression.
Together, my results indicate that MINK1 contributes to cell migration, and thus
might contribute to migration defects observed in mutant APC cells that contribute
to the cancer development in intestinal epithelium. However, APC deletion/mutation
leads to migration defects, whereas MINK1 overexpression led to faster migration.
Given that APC negatively regulates MINK1 this indicates that elevated MINK1
levels are not part of the mechanism that causes migration defects in APC mutant
cells. Additionally, the MINK1 overexpression I used in these experiments was
higher than physiological MINK1 overexpression that is caused by APC mutations.
Therefore, the impact MINK1 overexpression has on cell migration in colorectal
cancer is likely weaker compared to effects that were demonstrated here. The role
of APC in migration is likely independent of MINK1 and seems to dominate the
migration phenotype, while the contributions of MINK1 are more subtle. To further
verify whether MINK1 impacts the APC mutation phenotype in cell migration, I would
like to include APC depletion to the experimental conditions and compare these cells
to cells with altered levels of MINK1. Moreover, it might be even more insightful to
repeat this analysis on a colorectal cancer cell line and to include MINK1
depletion/overexpression, full-length APC rescue and APC deletion to the compared
conditions.
143 6. Biological function(s) of MINK1
The APC protein is implicated in many cellular processes including Wnt signalling
(Bienz and Clevers, 2000; Zhan et al., 2016) and cytoskeletal regulation (Dikovskaya
et al., 2001; Hanson and Miller, 2005; Näthke, 2005; Zumbrunn et al., 2001). The
importance of APC in maintaining the balance between proliferation, cell loss,
differentiation and cell migration explains why its loss or mutation affects epithelial
tissue profoundly. Whereas the mechanisms for its role in Wnt signalling are
becoming clearer, how APC regulates the cytoskeleton and contributes to cell
migration and adhesion is less well understood. Truncation mutation of Apc, which
removes the exons one to 15 (ApcΔe1-15), leads to constitutive null alleles. In mouse
intestinal epithelium heterozygous for these mutations tumours form more rapidly,
despite lower Wnt activation, than in ApcMin/+ mice. ApcMin/+ mice have a
heterozygous nonsense mutation at codon 850, and therefore express an N-terminal
mutant APC protein fragment (Cheung et al., 2010). This finding indicated that loss
of full-length APC (or at least the presence of the N-terminal fragment of APC)
contribute to tumour progression by mechanisms other than Wnt signalling.
To investigate in more detail, how APC regulates different cellular processes, a
proteomic screen was performed in a previous study, to identify interaction partners
of endogenous APC and also to determine whether their abundance was affected
by APC. This revealed that APC interacts with and negatively regulates the
abundance of MINK1 (Popow et al., 2019). In epithelial cells, MINK1 regulation by
APC is evolutionarily conserved between Drosophila follicular epithelium, mouse
intestinal tissue and organoids, and human cells (Popow et al., 2019).
Misshapen (msn), the Drosophila homologue of MINK1, is important for epithelial
cell migration. MINK1 has also been implicated in migration and adhesion (Cobreros-
Reguera et al., 2010; Hu et al., 2004; Plutoni et al., 2019). Since, the role of APC in
cytoskeletal regulation is not well understood, one aim of my thesis was to test the
hypothesis that the interaction between APC and MINK1 and the regulation of
MINK1 by APC contributes to the cytoskeletal regulation by APC. I aimed to
understand how APC regulates MINK1 expression levels and to identify the
biological function(s) of MINK1 in epithelial cells.
144 Summary
MINK1 has been implicated in cell adhesion. Previous work from our group
demonstrated that MINK1 overexpression in U2OS cells leads to an increase in
adhesion (Popow et al., 2019). However, there is also contradictory data
demonstrating that in MCF7 cells MINK1 overexpression decreases cell-cell
adhesion, whereas cells lacking a functional kinase domain showed increased cell-
cell adhesion (Hu et al., 2004). Therefore, I further investigated the role of MINK1 in
adhesion and found a slight trend towards stronger substrate adhesion of cells
overexpressing MINK1 and decreased adhesion to fibronectin of cells deleted for
MINK1 compared to control cells. Additionally, APC is involved in focal adhesion
turnover, where APC depletion decreases phosphorylation of paxillin and focal
adhesion kinase (FAK). Phosphorylation of both, paxillin and FAK, is crucial for
proper focal adhesion turnover (Ezratty et al., 2005; Juanes et al., 2017; Webb et
al., 2002). Preliminary experiments, investigating the potential role of MINK1 for FAK
and paxillin phosphorylation, did not provide any evidence for a role of MINK1 in
focal adhesion turnover.
TRAF2 and NCK-interacting protein kinase (TNIK) is an ohnologue of MINK1 and is
its closest related kinase. TNIK has been implicated in Wnt signalling through its
ability to activate transcription factor 4 (TCF4) (Shitashige et al., 2010). I thoroughly
tested whether MINK1 is also involved in Wnt signalling, using Western blotting, real-
time (RT)-qPCR and a TOP/FOP assay. My results did not reveal a direct
involvement of MINK1 in Wnt signalling. I further investigated whether MINK1 might
contribute to the cancer phenotype of APC-depleted cells through its involvement in
cell proliferation and found that MINK1 might be involved in proliferation independent
of Wnt signalling.
Another ohnologue and close relative of MINK1 is mitogen-activated protein kinase
kinase kinase kinase 4 (MAP4K4). MAP4K4 has been linked to Hippo signalling and
was reported to promote Yes-associated protein (YAP) phosphorylation (Kim et al.,
2020). I examined whether MINK1 depletion alters the ratio between phosphorylated
YAP over total YAP protein level and could not detect significant changes upon
MINK1 depletion. However, a recent study demonstrated that MAP4Ks
145 (MAP4K1/2/3 and MAP4K4/MINK1/TNIK (MAP4K4/6/7)) can directly activate
LATS1/2 similar to MST1/2 and are therefore components of the extended Hippo
pathway. However, MAP4K1/2/3/4/6/7 are able to compensate for each other’s
depletion and MAP4Ks acts in parallel to MST1/2 and are at least partially redundant
in the regulation of Hippo signalling (Meng et al., 2015), which explains why depletion
of MINK1 on its own did not alter YAP phosphorylation.
In agreement with various roles of APC in different cellular processes, APC also
localises to different subcellular compartments, including cell-cell junctions, the
apical membrane, the cytoplasm and the nucleus. Previous work using
immunofluorescence microscopy on HeLa cells expressing endogenously
mNeonGreen-labelled MINK1 found it to be enriched at tips of protrusions and at
lateral plasma membranes in areas of cell-cell contacts (Popow et al., 2019).
Additionally, localisation of MINK1 to the cytoplasm has been demonstrated (Nonaka
et al., 2008). I investigated the sub-cellular localisation of MINK1 further using a
fractionation assay and found ~50% of the overexpressed MINK1-GFP co-
fractionated with the cytosolic fraction, ~25% with membrane fraction (including
organelles) and ~16% with the nucleus fraction. I verified these results with
immunofluorescence microscopy of HeLa mNeonGreen-MINK1 cells and found
endogenous MINK1 localised again in the cytosol and at plasma membranes,
especially in regions of cell-cell contact.
APC has been linked to spindle orientation (Carroll et al., 2017; Dikovskaya et al.,
2007; Quyn et al., 2010; Yamashita et al., 2003) and MINK1 is phosphorylated during
mitosis (Hyodo et al., 2012). Therefore, I investigated the potential involvement of
MINK1 in spindle orientation and found that MINK1 overexpression led to increased
spindle misorientation, which indicates a potential role of MINK1 in anchoring of the
mitotic spindle to the cortex. Additionally, I demonstrated in chapter 4
(Phosphorylation of MINK1 and binding of 14-3-3) that MINK1 can phosphorylate the
activation site on ERM proteins. ERM proteins play an essential role in mitotic
spindle formation, orientation and function (McClatchey, 2014). Therefore, I tested
whether MINK1 might be involved in spindle orientation through phosphorylation of
ERM proteins during mitosis. Using immunofluorescence microscopy, I found that
while MINK1 and phospho-ERM proteins co-localise during mitosis, phosphorylation

146 of ERM proteins was not altered when MINK1 was deleted or overexpressed,
suggesting that the role of MINK1 in spindle orientation is likely independent of its
ability to phosphorylate ERM proteins, and that other kinases can perform this
regulation of ERM proteins in mitosis.
147 Effect of MINK1 on cell substrate- and focal adhesion
The APC protein has been shown to be involved in cell adhesion and its mutation
leads to increased adhesion of colorectal cancer cells (Faux et al., 2004). Previous
work from our group suggests that MINK1 might be important for adhesion as
overexpression of MINK1 in U2OS cells led to a significant increase in their
attachment to plates coated with collagen compared to controls (Popow et al., 2019).
Results from another study in human epithelial MCF7 cells, demonstrated that
overexpression of full-length MINK1 decreases cell-cell adhesion, whereas the
overexpression of a catalytically inactive form of MINK1 (K54R) increased cell-cell
adhesion (Hu et al., 2004). In this context it is also important to mention that I found
MINK1-overexpressing cells to migrate faster than their control cells in U2OS cells
(chapter 5), which could be caused by changes in adhesion.
To further investigate whether MINK1 is involved in cell-cell or cell-substrate
adhesion, glass coverslips were either coated with collagen, fibronectin or laminin
and U2OS cells were allowed to loosely attach to the coated coverslips before they
were agitated for a short period of time. Cells either lacking or overexpressing MINK1
were compared to parental control cells. Cells that remained after agitation were
fixed and counterstained with DAPI and phalloidin. Cell adhesion was quantified
using immunofluorescence confocal microscopy (Zeiss 710 confocal microscope)
and counting the number of nuclei per field of view using an ImageJ macro (see
Appendix). In general, cells did not adhere to collagen or laminin very well and there
were very few cells left after agitation for 30 seconds in all cell types, except in the
uninduced MINK1 overexpressing cells (Figure 6.1A, B, E, F). Therefore, it was not
possible to determine differences in adhesion to these substrates between cell types.
However, cells adhered more strongly to fibronectin and in this case, when
comparing the number of cells bound to fibronectin before and after agitation, the
ratio was slightly lower for cells deleted of MINK1 (U2OS MINK KO) compared to
parental (U2OS) cells (Figure 6.1C, D). The overexpression of GFP did not have an
effect on adhesion to fibronectin. There was no difference in the ratio of cells after
agitation to cells without agitation, comparing cells with induced overexpression of
GFP (U2OS GFP induced) to uninduced control cells (UOS GFP uninduced) (Figure

148 6.1C, D). Cells overexpressing MINK1 (U2OS MINK1-GFP induced) adhered slightly
stronger to fibronectin than uninduced control cells (U2OS MINK1-GFP uninduced)
(Figure 6.1C, D). Overall, these data showed a slightly stronger adhesion to
fibronectin of cells overexpressing MINK1 and weaker adhesion of cells deleted for
MINK1 compared to their respective controls, but more robust assays will be
required to investigate this further. In future experiments the expression of MINK1 or
GFP should be tested with Western blotting in parallel to the adhesion assay, to
validate that the expression of intended proteins was induced efficiently. In future
experiments it will also be important to verify that tetracycline alone does not have
an effect on cell adhesion, which could not be ruled out so far (Figure 6.1). To ensure
that experiments are indeed more robust a positive (adhesive) control and negative
(non-adhesive) control should be included as well. The positive control should be for
example a stabiliser for focal adhesions and a negative control could be an integrin
depletion or inhibitor. APC depletion should also be included so MINK1 deletion or
overexpression phenotypes can be compared to it. APC depletion could also serve
as a positive control, because APC depletion would be expected to increased
adhesion.
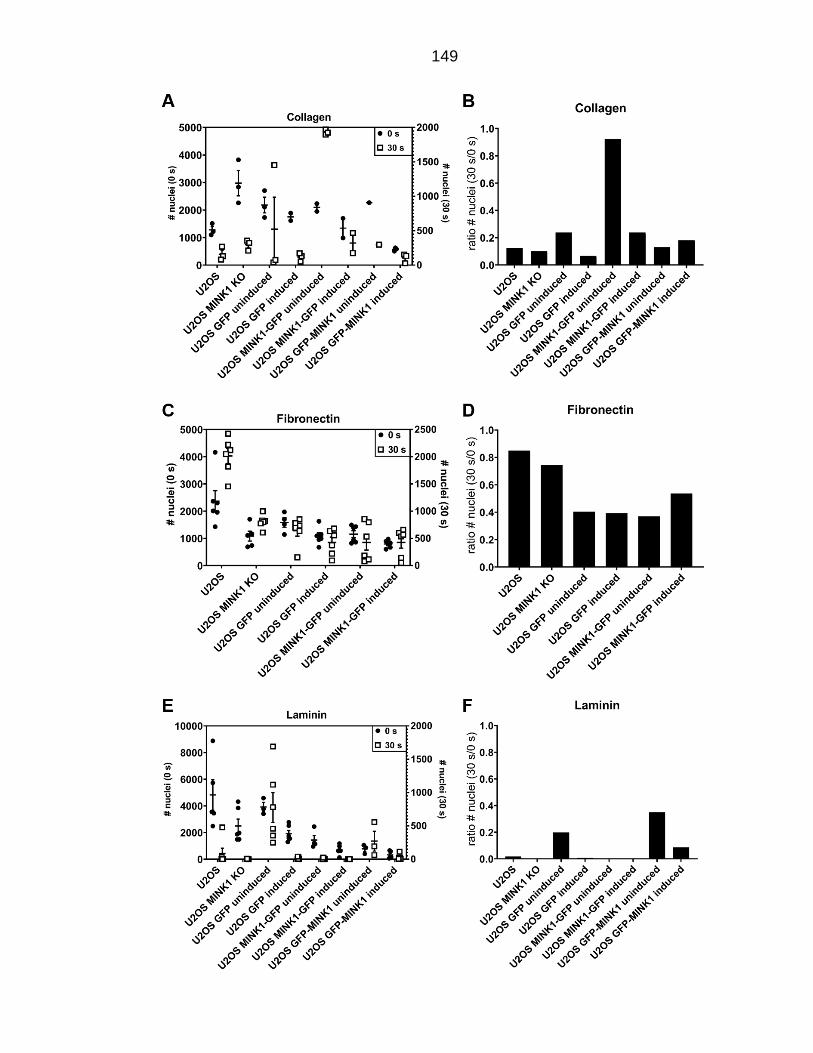
149
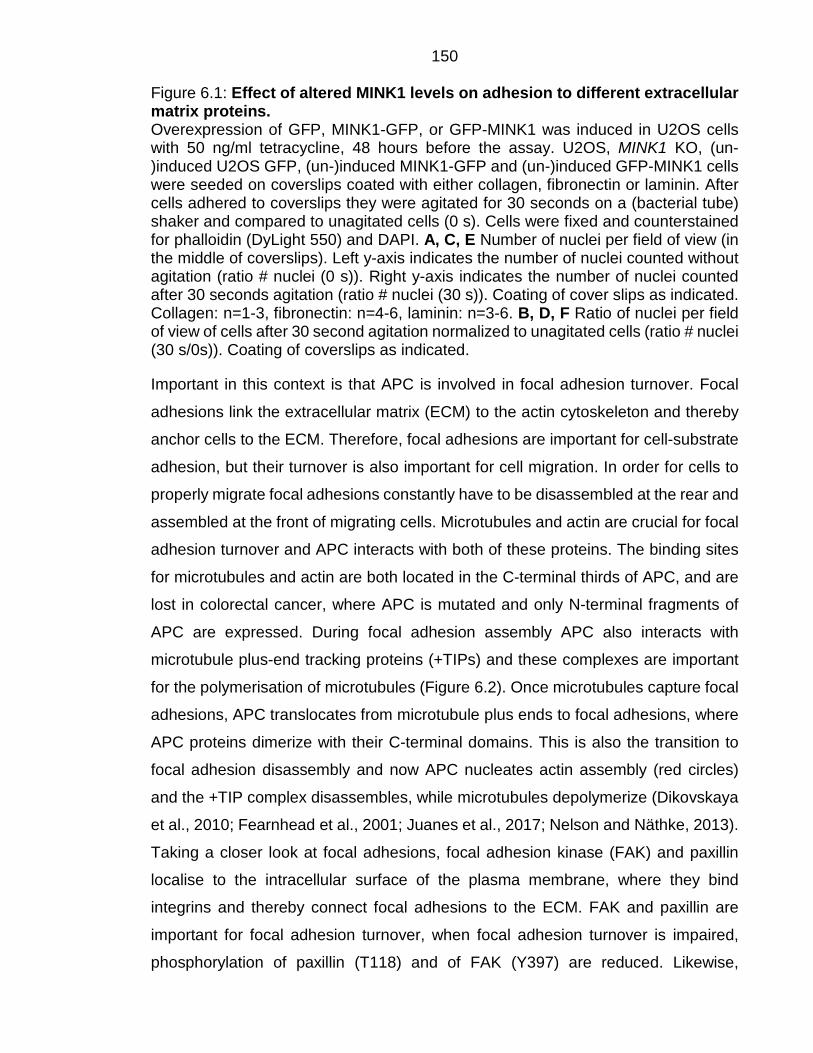
150 Figure 6.1: Effect of altered MINK1 levels on adhesion to different extracellular matrix proteins. Overexpression of GFP, MINK1-GFP, or GFP-MINK1 was induced in U2OS cells with 50 ng/ml tetracycline, 48 hours before the assay. U2OS, MINK1 KO, (un-)induced U2OS GFP, (un-)induced MINK1-GFP and (un-)induced GFP-MINK1 cells were seeded on coverslips coated with either collagen, fibronectin or laminin. After cells adhered to coverslips they were agitated for 30 seconds on a (bacterial tube) shaker and compared to unagitated cells (0 s). Cells were fixed and counterstained for phalloidin (DyLight 550) and DAPI. A, C, E Number of nuclei per field of view (in the middle of coverslips). Left y-axis indicates the number of nuclei counted without agitation (ratio # nuclei (0 s)). Right y-axis indicates the number of nuclei counted after 30 seconds agitation (ratio # nuclei (30 s)). Coating of cover slips as indicated. Collagen: n=1-3, fibronectin: n=4-6, laminin: n=3-6. B, D, F Ratio of nuclei per field of view of cells after 30 second agitation normalized to unagitated cells (ratio # nuclei (30 s/0s)). Coating of coverslips as indicated.
Important in this context is that APC is involved in focal adhesion turnover. Focal
adhesions link the extracellular matrix (ECM) to the actin cytoskeleton and thereby
anchor cells to the ECM. Therefore, focal adhesions are important for cell-substrate
adhesion, but their turnover is also important for cell migration. In order for cells to
properly migrate focal adhesions constantly have to be disassembled at the rear and
assembled at the front of migrating cells. Microtubules and actin are crucial for focal
adhesion turnover and APC interacts with both of these proteins. The binding sites
for microtubules and actin are both located in the C-terminal thirds of APC, and are
lost in colorectal cancer, where APC is mutated and only N-terminal fragments of
APC are expressed. During focal adhesion assembly APC also interacts with
microtubule plus-end tracking proteins (+TIPs) and these complexes are important
for the polymerisation of microtubules (Figure 6.2). Once microtubules capture focal
adhesions, APC translocates from microtubule plus ends to focal adhesions, where
APC proteins dimerize with their C-terminal domains. This is also the transition to
focal adhesion disassembly and now APC nucleates actin assembly (red circles)
and the +TIP complex disassembles, while microtubules depolymerize (Dikovskaya
et al., 2010; Fearnhead et al., 2001; Juanes et al., 2017; Nelson and Näthke, 2013).
Taking a closer look at focal adhesions, focal adhesion kinase (FAK) and paxillin
localise to the intracellular surface of the plasma membrane, where they bind
integrins and thereby connect focal adhesions to the ECM. FAK and paxillin are
important for focal adhesion turnover, when focal adhesion turnover is impaired,
phosphorylation of paxillin (T118) and of FAK (Y397) are reduced. Likewise,
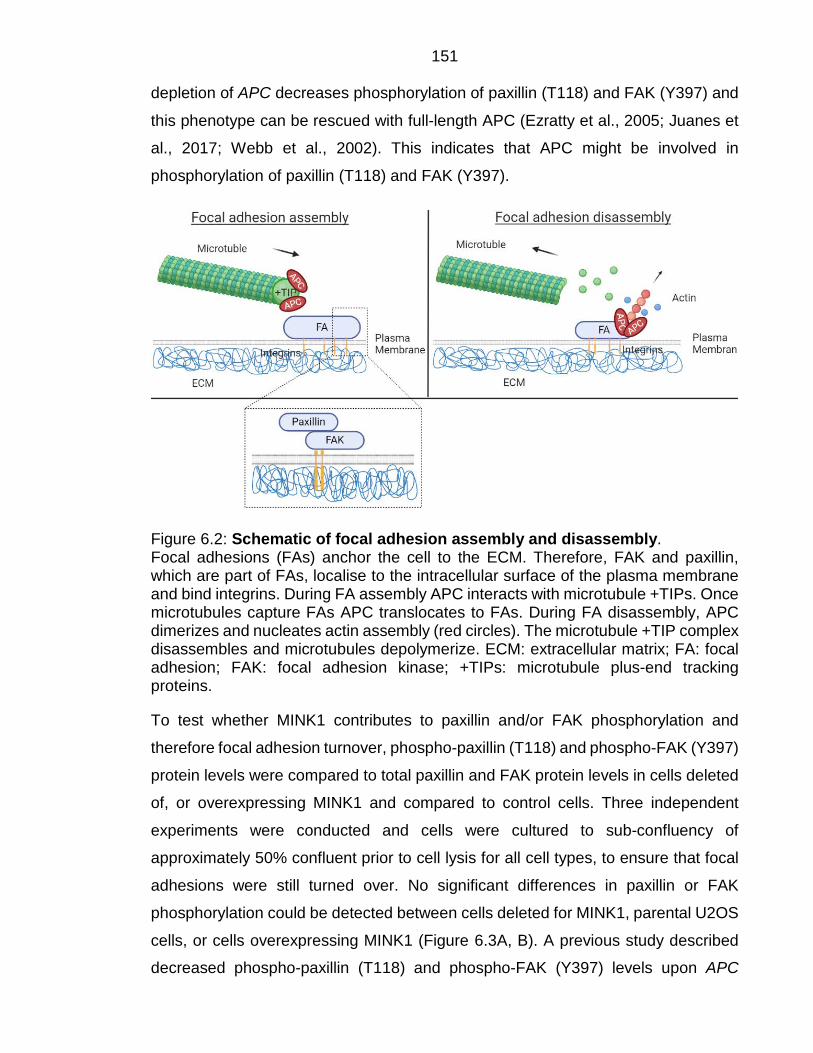
151 depletion of APC decreases phosphorylation of paxillin (T118) and FAK (Y397) and
this phenotype can be rescued with full-length APC (Ezratty et al., 2005; Juanes et
al., 2017; Webb et al., 2002). This indicates that APC might be involved in
phosphorylation of paxillin (T118) and FAK (Y397).
Figure 6.2: Schematic of focal adhesion assembly and disassembly. Focal adhesions (FAs) anchor the cell to the ECM. Therefore, FAK and paxillin, which are part of FAs, localise to the intracellular surface of the plasma membrane and bind integrins. During FA assembly APC interacts with microtubule +TIPs. Once microtubules capture FAs APC translocates to FAs. During FA disassembly, APC dimerizes and nucleates actin assembly (red circles). The microtubule +TIP complex disassembles and microtubules depolymerize. ECM: extracellular matrix; FA: focal adhesion; FAK: focal adhesion kinase; +TIPs: microtubule plus-end tracking proteins.
To test whether MINK1 contributes to paxillin and/or FAK phosphorylation and
therefore focal adhesion turnover, phospho-paxillin (T118) and phospho-FAK (Y397)
protein levels were compared to total paxillin and FAK protein levels in cells deleted
of, or overexpressing MINK1 and compared to control cells. Three independent
experiments were conducted and cells were cultured to sub-confluency of
approximately 50% confluent prior to cell lysis for all cell types, to ensure that focal
adhesions were still turned over. No significant differences in paxillin or FAK
phosphorylation could be detected between cells deleted for MINK1, parental U2OS
cells, or cells overexpressing MINK1 (Figure 6.3A, B). A previous study described
decreased phospho-paxillin (T118) and phospho-FAK (Y397) levels upon APC
152 depletion with siRNA in U2OS cells. However, in this case, the authors did not
normalize the phospho-protein expression to the total protein expression (Juanes et
al., 2017). To make my data more comparable, I analysed the data by only
normalizing phospho-paxillin (T118) and phospho-FAK (Y397) protein levels to the
loading control (GAPDH). This analysis showed phospho-paxillin levels were
slightly, but not significantly, downregulated upon APC depletion (APC KD)
compared to the control condition (ctrl KD) consistent with published data (Figure
6.3C). However, phospho-FAK levels did not consistently change upon APC
depletion (APC KD) (Figure 6.3C). Deletion of MINK1 was associated with lower
phospho-paxillin and phospho-FAK in one knock out clone (#10), but not in another
(#5) (Figure 6.3C). In future experiments a MINK1 rescue of MINK1 deletion cells
should be included to the tested cell types to validate that changes in phospho-
paxillin and phospho-FAK levels were caused by MINK1 deletion. Together, I could
not completely reproduce published findings by Juanes et al. and the relative amount
of phospho-paxillin and phospho-FAK were varied between experiments. Therefore,
I could not conclude whether MINK1 is involved in focal adhesion turnover and
further research will be required to answer this question.
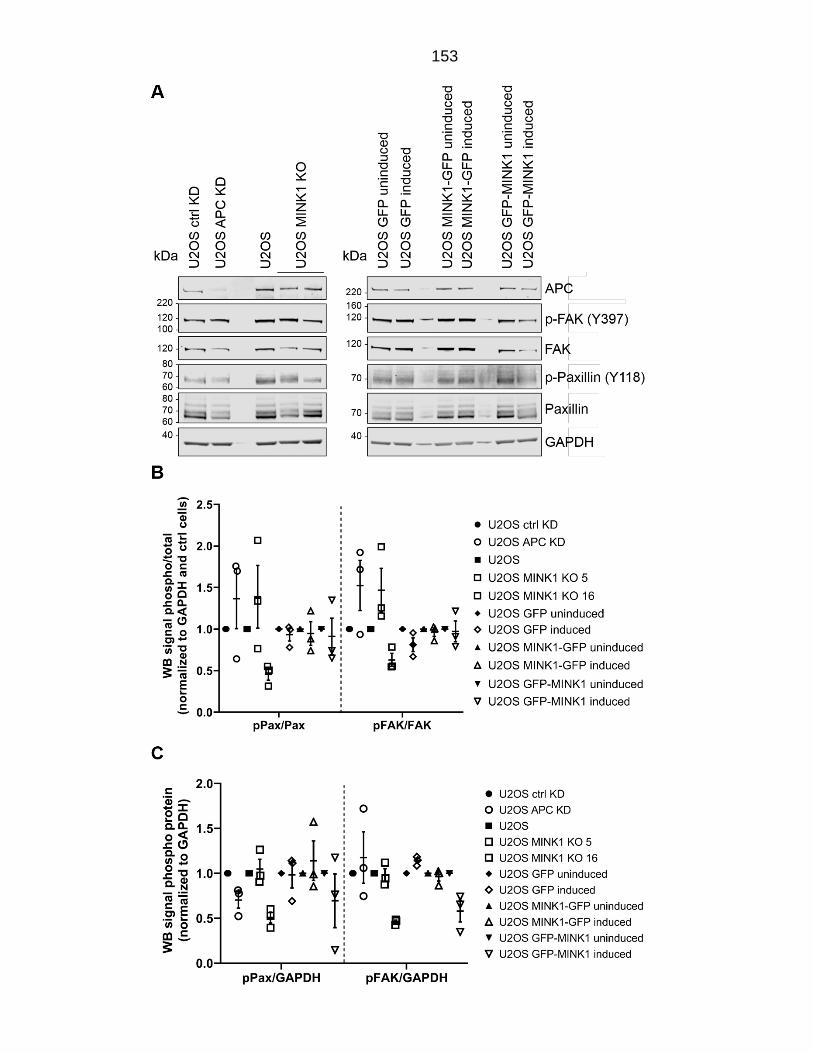
153
154 Figure 6.3: Phosphorylation of paxillin (Y118) and FAK (Y397) in U2OS cells. A Representative Western blot with cell lysates from U2OS cells, MINK1 KO cells (clones 5 and 16), cells after siRNA treatment (ctrl siRNA or APC siRNA as indicated) and cells with (un-)induced overexpression of GFP, GFP-MINK1, or MINK1-GFP. Overexpression of GFP, GFP-MINK1 or MINK1-GFP was induced with 50 ng/ml tetracycline for 48 hours prior cell lysis. Membranes were blotted with antibodies against APC, phospho-FAK (Y397), FAK, phospho-paxillin (Y118) and paxillin, as indicated. GAPDH was used as loading control. B Ratios of phospho-paxillin or phospho-FAK Western blotting signals were quantified using the image studio lite software (version 5.2) from LI-COR and normalized to total protein signals (paxillin or FAK) and loading control (GAPDH) signals. Western blotting data from three individual experiments. Error bars indicate +/- SEM. C Ratios of phospho-paxillin or phospho-FAK Western blotting signals were quantified using the image studio lite software (version 5.2) from LI-COR and normalized to loading control (GAPDH). Western blotting data from three individual experiments. Error bars indicate +/- SEM.
155 MINK1 in Wnt signalling
APC acts as a scaffolding protein in canonical Wnt signalling and is part of the β-
catenin destruction complex, which phosphorylates β-catenin marking it for
degradation by the proteasome. The inability of mutant APC to aid β-catenin
phosphorylation leads to an over-activation of Wnt signalling by constitutive
activation of TCF/β-catenin complexes in APC mutant cells (Seidensticker and
Behrens, 2000).
The MINK1 ohnologue TNIK is its closest relative. Both kinases are part of the Ste20
kinase family and the germinal centre kinase subfamily IV (GCK-IV). They have three
domains: an N-terminal kinase domain an intermediate linker domain and a C-
terminal citron homology domain (CNH). Human MINK1 and TNIK share 90%
sequence homology in the kinase and the CNH domain (Dan et al., 2000). TNIK has
been implicated in canonical Wnt signalling. It has been shown to be part of the
TCF4 and β-catenin complex in colorectal cancer cells. TNIK, but not its catalytically
inactive form (K54R), phosphorylates and thereby activates TCF4 during Wnt
signalling. This link of TNIK to colorectal cancer led to its being proposed as a drug
target for colorectal cancer treatment (Shitashige et al., 2010). To investigate
whether MINK1 is also involved in Wnt signalling, similar to its ohnologue TNIK, the
abundance of common Wnt target proteins in the presence and absence of MINK1
were investigated, using cell lysates from three different MINK1 deleted (MINK1 KO)
clones, and MINK1 overexpressing cells (MINK1-GFP). No significant difference in
expression could be detected in any of the chosen Wnt target proteins (Figure 6.4A),
suggesting that MINK1 is not involved in canonical Wnt signalling. Additionally,
mRNA expression of the well-established Wnt target, Axin2, was measured using
RT-qPCR. Axin2 mRNA expression was significantly reduced in the absence of
MINK1 (Figure 6.4B), suggesting that MINK1 might be involved in Wnt signalling by
stimulating the expression of Axin2. Due to these inconclusive results the role of
MINK1 in Wnt signalling was further investigated using a commonly used TOP/FOP
reporter assay that measures TCF-stimulated transcription. SW480 cells were
included in this assay as a positive control, because of their high expression levels
of β-catenin protein. The TOP/FOP assay revealed a significant inhibition of Wnt
156 signalling in one MINK1 KO clone (#5), but not in another (#16), and it did not show
significant differences in response to MINK1 overexpression (Figure 6.4C).
However, it is still possible that MINK1 affects β-catenin-independent aspects of Wnt
signalling. Additionally, TOP/FOP assay results were extremely variable between
cell passages. Therefore, an additional method was used to further investigate
whether MINK1 is involved in canonical Wnt signalling. The effect of MINK1 deletion
and overexpression on 88 Wnt target genes was measured using qPCR plates in
combination with RT-qPCR. APC was depleted using siRNA (APC KD) in U2OS cells
and used as positive readout for Wnt (over-)activation. A pairwise analysis was
conducted, normalizing APC depleted cells (APC siRNA) to cells transfected with
control siRNA (ctrl siRNA), MINK1 KO cells to parental U2OS cells, and cells with
induced overexpression of either GFP or MINK1 (U2OS GFP +/GFP-MINK1
+/MINK1-GFP +) to respective uninduced cells (U2OS GFP -/GFP-MINK1 -/MINK1-
GFP -) (Figure 6.4D). Expression of all 88 genes was compared between the
genotypes and filtered for genes that were significantly up- or downregulated by at
least 1.5-fold compared to their relevant controls. These groups were also compared
with each other and seven genes were found to be up- or downregulated more than
1.5-fold in APC depleted cells and also in MINK1 deleted (MINK1 KO) cells (both
compared to controls) (Table 6.1). Out of these seven genes, four were regulated in
the same direction, both in APC and MINK1 deleted cells, indicating that MINK1
deleted cells show a Wnt signalling phenotype more similar to that of APC depleted
cells, than MINK1 overexpressing cells. This suggests that MINK1 on its own could
be involved in dampening canonical Wnt signalling, potentially through activation of
Axin2 (Figure 6.5). Like Axin, Axin2 is a tumour suppressor that negatively regulates
Wnt signalling. Axin2 interacts with APC, GSK3β and β-catenin and is involved in
the down-regulation of β-catenin (Jho et al., 2002; Liu et al., 2000). My observations
raise the possibility that MINK1 upregulation in APC mutant cells could act as an
inhibitor to control over-activated Wnt signalling. However, I could not detect
consistent changes in Wnt signalling target gene expression in response to deletion
or overexpression of MINK1 (Figure 6.4, Table 6.1). I did not test the effect of MINK1
deletion or overexpression on Wnt signalling after stimulating Wnt signalling directly
with e.g. Wnt ligands. Therefore, my results only indicate no change in baseline

157 levels of canonical Wnt signalling in U2OS cells upon changes in MINK1 expression.
It would be interesting to repeat the qPCR with the Wnt target genes qPCR plates,
after stimulation of Wnt signalling with Wnt ligands and to compare the results to the
unstimulated experiment. In both cases I would also compare APC depletion and
MINK1 deletion and overexpression to control cells. Moreover, positive and negative
controls should be included. A GSK-3 inhibitor could be used as a positive Wnt
response control and a negative control could be a Wnt inhibitor.
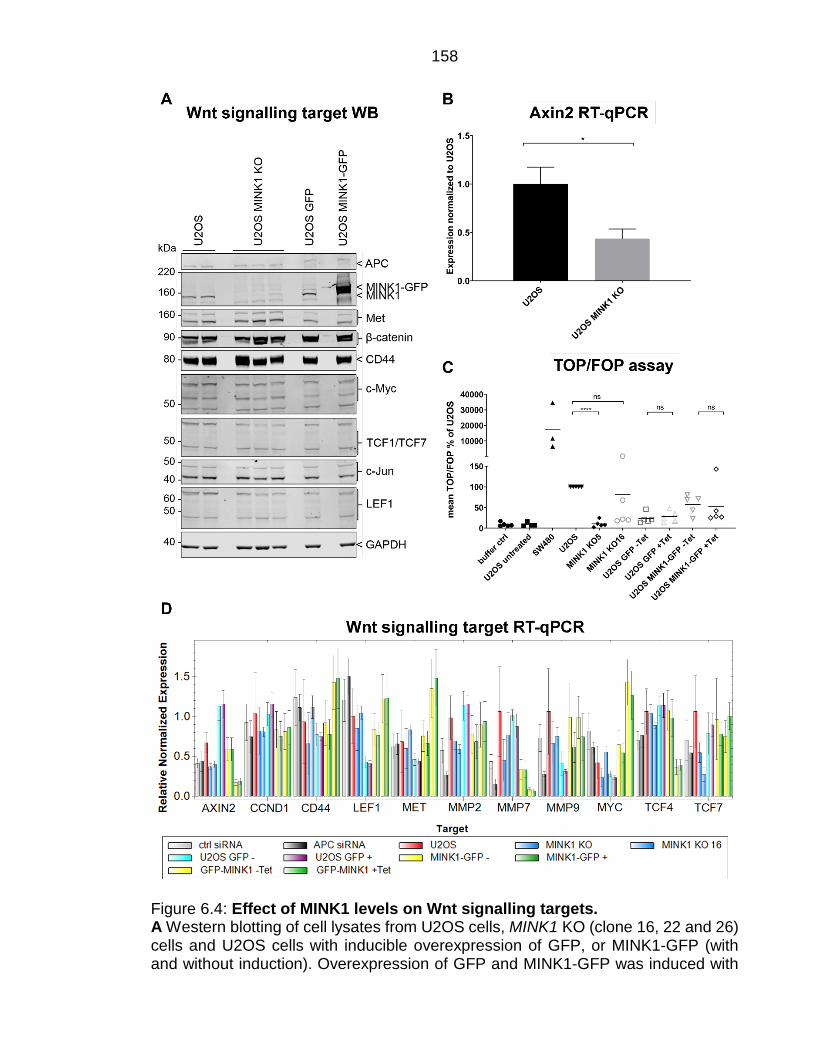
158
Figure 6.4: Effect of MINK1 levels on Wnt signalling targets. A Western blotting of cell lysates from U2OS cells, MINK1 KO (clone 16, 22 and 26) cells and U2OS cells with inducible overexpression of GFP, or MINK1-GFP (with and without induction). Overexpression of GFP and MINK1-GFP was induced with
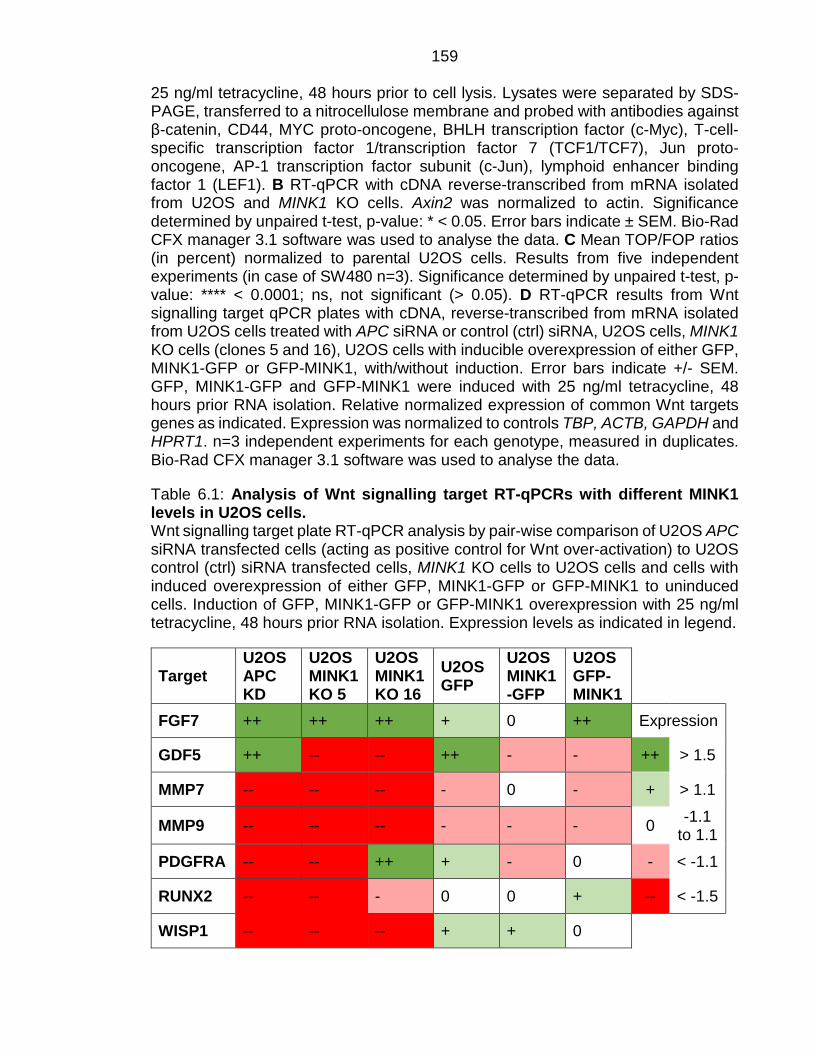
159 25 ng/ml tetracycline, 48 hours prior to cell lysis. Lysates were separated by SDS-PAGE, transferred to a nitrocellulose membrane and probed with antibodies against β-catenin, CD44, MYC proto-oncogene, BHLH transcription factor (c-Myc), T-cell-specific transcription factor 1/transcription factor 7 (TCF1/TCF7), Jun proto-oncogene, AP-1 transcription factor subunit (c-Jun), lymphoid enhancer binding factor 1 (LEF1). B RT-qPCR with cDNA reverse-transcribed from mRNA isolated from U2OS and MINK1 KO cells. Axin2 was normalized to actin. Significance determined by unpaired t-test, p-value: * < 0.05. Error bars indicate ± SEM. Bio-Rad CFX manager 3.1 software was used to analyse the data. C Mean TOP/FOP ratios (in percent) normalized to parental U2OS cells. Results from five independent experiments (in case of SW480 n=3). Significance determined by unpaired t-test, p-value: **** < 0.0001; ns, not significant (> 0.05). D RT-qPCR results from Wnt signalling target qPCR plates with cDNA, reverse-transcribed from mRNA isolated from U2OS cells treated with APC siRNA or control (ctrl) siRNA, U2OS cells, MINK1 KO cells (clones 5 and 16), U2OS cells with inducible overexpression of either GFP, MINK1-GFP or GFP-MINK1, with/without induction. Error bars indicate +/- SEM. GFP, MINK1-GFP and GFP-MINK1 were induced with 25 ng/ml tetracycline, 48 hours prior RNA isolation. Relative normalized expression of common Wnt targets genes as indicated. Expression was normalized to controls TBP, ACTB, GAPDH and HPRT1. n=3 independent experiments for each genotype, measured in duplicates. Bio-Rad CFX manager 3.1 software was used to analyse the data.
Table 6.1: Analysis of Wnt signalling target RT-qPCRs with different MINK1 levels in U2OS cells. Wnt signalling target plate RT-qPCR analysis by pair-wise comparison of U2OS APC siRNA transfected cells (acting as positive control for Wnt over-activation) to U2OS control (ctrl) siRNA transfected cells, MINK1 KO cells to U2OS cells and cells with induced overexpression of either GFP, MINK1-GFP or GFP-MINK1 to uninduced cells. Induction of GFP, MINK1-GFP or GFP-MINK1 overexpression with 25 ng/ml tetracycline, 48 hours prior RNA isolation. Expression levels as indicated in legend.
Target U2OS APC KD
U2OS MINK1 KO 5
U2OS MINK1 KO 16
U2OS GFP
U2OS MINK1-GFP
U2OS GFP-MINK1
FGF7 ++ ++ ++ + 0 ++ Expression
GDF5 ++ -- -- ++ - - ++ > 1.5
MMP7 -- -- -- - 0 - + > 1.1
MMP9 -- -- -- - - - 0 -1.1 to 1.1
PDGFRA -- -- ++ + - 0 - < -1.1
RUNX2 -- -- - 0 0 + -- < -1.5
WISP1 -- -- -- + + 0
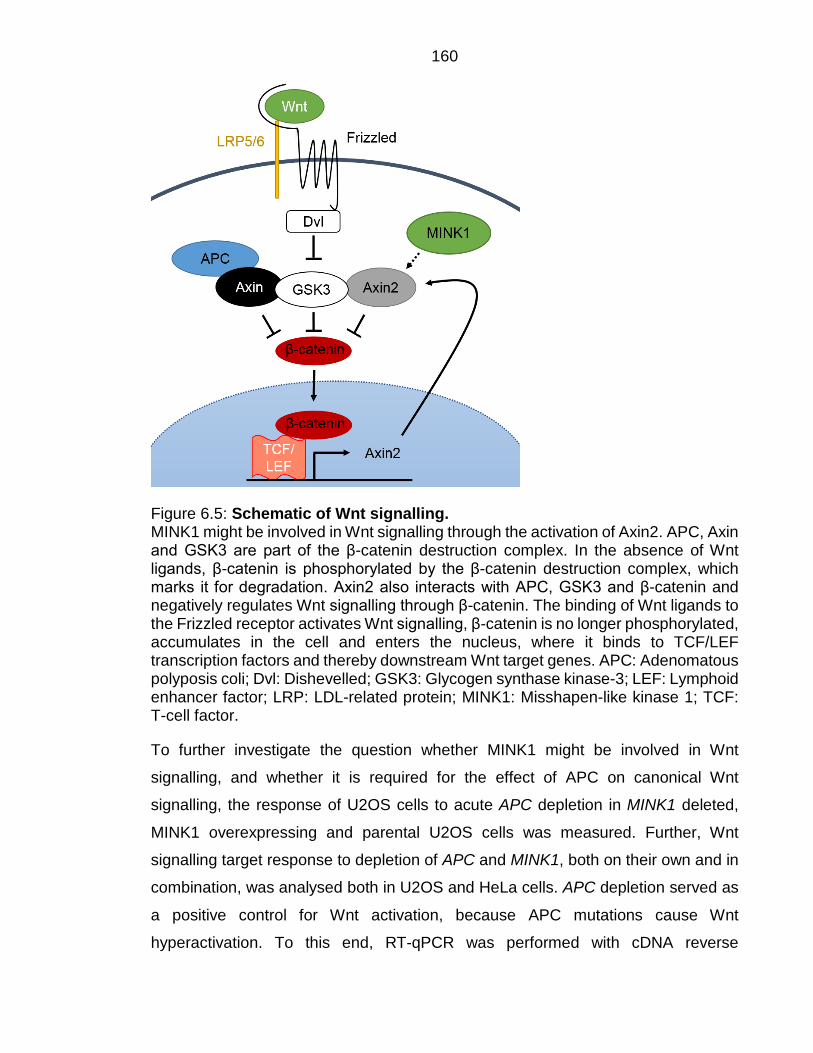
160
Figure 6.5: Schematic of Wnt signalling. MINK1 might be involved in Wnt signalling through the activation of Axin2. APC, Axin and GSK3 are part of the β-catenin destruction complex. In the absence of Wnt ligands, β-catenin is phosphorylated by the β-catenin destruction complex, which marks it for degradation. Axin2 also interacts with APC, GSK3 and β-catenin and negatively regulates Wnt signalling through β-catenin. The binding of Wnt ligands to the Frizzled receptor activates Wnt signalling, β-catenin is no longer phosphorylated, accumulates in the cell and enters the nucleus, where it binds to TCF/LEF transcription factors and thereby downstream Wnt target genes. APC: Adenomatous polyposis coli; Dvl: Dishevelled; GSK3: Glycogen synthase kinase-3; LEF: Lymphoid enhancer factor; LRP: LDL-related protein; MINK1: Misshapen-like kinase 1; TCF: T-cell factor.
To further investigate the question whether MINK1 might be involved in Wnt
signalling, and whether it is required for the effect of APC on canonical Wnt
signalling, the response of U2OS cells to acute APC depletion in MINK1 deleted,
MINK1 overexpressing and parental U2OS cells was measured. Further, Wnt
signalling target response to depletion of APC and MINK1, both on their own and in
combination, was analysed both in U2OS and HeLa cells. APC depletion served as
a positive control for Wnt activation, because APC mutations cause Wnt
hyperactivation. To this end, RT-qPCR was performed with cDNA reverse
161 transcribed from mRNA, isolated from parental U2OS cells, cells deleted of MINK1
(MINK1 KO) and (un-)induced MINK1 overexpressing cells (MINK1-GFP +/-Tet)
transfected with either control (ctrl) or APC siRNA. In U2OS cells β-catenin, Axin2
and CyclinD mRNA levels increased, while c-Myc mRNA levels decreased upon
APC depletion (APC KD) compared to control treatment (ctrl KD) in MINK1 knockout
(MINK1 KO), parental U2OS and uninduced MINK1-GFP cells (U2OS MINK1-GFP
-Tet) (Figure 6.6A). In MINK1-GFP overexpressing cells (U2OS MINK1-GFP +Tet)
β-catenin, Axin2, CyclinD and c-Myc mRNA levels were all slightly increased upon
APC depletion (APC KD) compared to control treatment (ctrl KD). However, in these
cells APC mRNA levels were similar in ctrl KD and APC KD samples (Figure 6.6A).
SDS-PAGE and Western blotting were performed on parental U2OS cells, cells
deleted of MINK1 (MINK1 KO) and (un-)induced MINK1 overexpressing cells
(MINK1-GFP +/-Tet) transfected with control (ctrl) or APC siRNA to investigate the
effect of APC depletion on the transcriptional level. APC depletion (APC KD) led to
a slight increase in β-catenin protein levels in U2OS cells, one MINK1 KO clone
(#10), but not the other (#5), and (un-)induced MINK1-GFP overexpressing cells
(MINK1-GFP +/-Tet) (Figure 6.6B and C). Axin2 protein levels were increased upon
APC depletion (APC KD) in U2OS cells (parental of MINK1 KO cells) and one MINK1
KO clone (#10), but not the other (#5), and slightly decreased in MINK1-GFP
overexpressing cells (MINK1-GFP +Tet) (Figure 6.6B and C).
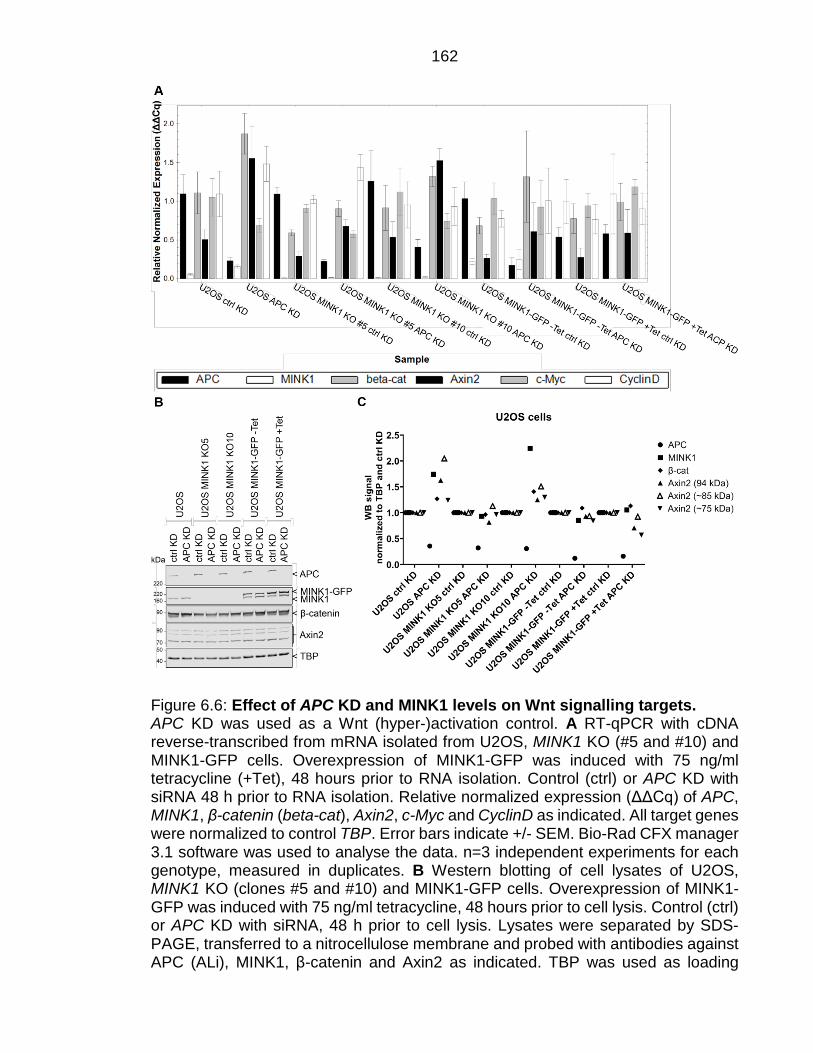
162
Figure 6.6: Effect of APC KD and MINK1 levels on Wnt signalling targets. APC KD was used as a Wnt (hyper-)activation control. A RT-qPCR with cDNA reverse-transcribed from mRNA isolated from U2OS, MINK1 KO (#5 and #10) and MINK1-GFP cells. Overexpression of MINK1-GFP was induced with 75 ng/ml tetracycline (+Tet), 48 hours prior to RNA isolation. Control (ctrl) or APC KD with siRNA 48 h prior to RNA isolation. Relative normalized expression (ΔΔCq) of APC, MINK1, β-catenin (beta-cat), Axin2, c-Myc and CyclinD as indicated. All target genes were normalized to control TBP. Error bars indicate +/- SEM. Bio-Rad CFX manager 3.1 software was used to analyse the data. n=3 independent experiments for each genotype, measured in duplicates. B Western blotting of cell lysates of U2OS, MINK1 KO (clones #5 and #10) and MINK1-GFP cells. Overexpression of MINK1-GFP was induced with 75 ng/ml tetracycline, 48 hours prior to cell lysis. Control (ctrl) or APC KD with siRNA, 48 h prior to cell lysis. Lysates were separated by SDS-PAGE, transferred to a nitrocellulose membrane and probed with antibodies against APC (ALi), MINK1, β-catenin and Axin2 as indicated. TBP was used as loading
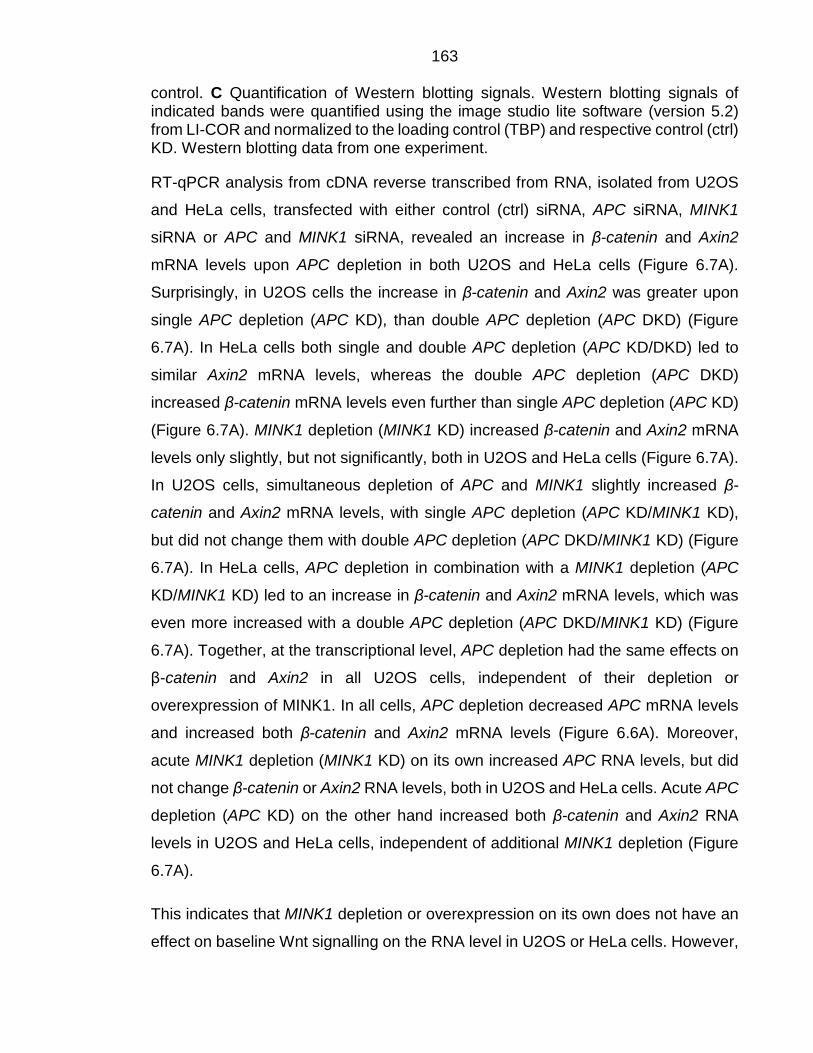
163 control. C Quantification of Western blotting signals. Western blotting signals of indicated bands were quantified using the image studio lite software (version 5.2) from LI-COR and normalized to the loading control (TBP) and respective control (ctrl) KD. Western blotting data from one experiment.
RT-qPCR analysis from cDNA reverse transcribed from RNA, isolated from U2OS
and HeLa cells, transfected with either control (ctrl) siRNA, APC siRNA, MINK1
siRNA or APC and MINK1 siRNA, revealed an increase in β-catenin and Axin2
mRNA levels upon APC depletion in both U2OS and HeLa cells (Figure 6.7A).
Surprisingly, in U2OS cells the increase in β-catenin and Axin2 was greater upon
single APC depletion (APC KD), than double APC depletion (APC DKD) (Figure
6.7A). In HeLa cells both single and double APC depletion (APC KD/DKD) led to
similar Axin2 mRNA levels, whereas the double APC depletion (APC DKD)
increased β-catenin mRNA levels even further than single APC depletion (APC KD)
(Figure 6.7A). MINK1 depletion (MINK1 KD) increased β-catenin and Axin2 mRNA
levels only slightly, but not significantly, both in U2OS and HeLa cells (Figure 6.7A).
In U2OS cells, simultaneous depletion of APC and MINK1 slightly increased β-
catenin and Axin2 mRNA levels, with single APC depletion (APC KD/MINK1 KD),
but did not change them with double APC depletion (APC DKD/MINK1 KD) (Figure
6.7A). In HeLa cells, APC depletion in combination with a MINK1 depletion (APC
KD/MINK1 KD) led to an increase in β-catenin and Axin2 mRNA levels, which was
even more increased with a double APC depletion (APC DKD/MINK1 KD) (Figure
6.7A). Together, at the transcriptional level, APC depletion had the same effects on
β-catenin and Axin2 in all U2OS cells, independent of their depletion or
overexpression of MINK1. In all cells, APC depletion decreased APC mRNA levels
and increased both β-catenin and Axin2 mRNA levels (Figure 6.6A). Moreover,
acute MINK1 depletion (MINK1 KD) on its own increased APC RNA levels, but did
not change β-catenin or Axin2 RNA levels, both in U2OS and HeLa cells. Acute APC
depletion (APC KD) on the other hand increased both β-catenin and Axin2 RNA
levels in U2OS and HeLa cells, independent of additional MINK1 depletion (Figure
6.7A).
This indicates that MINK1 depletion or overexpression on its own does not have an
effect on baseline Wnt signalling on the RNA level in U2OS or HeLa cells. However,
164 I have not tested the effects on canonical Wnt signalling after stimulation with Wnt
ligands. I further tested whether MINK1 affects baseline Wnt signalling on the protein
level, using APC knockdown as a control for (over-)activation of canonical Wnt
signalling, but without inducing Wnt signalling. I used SDS-PAGE and Western
blotting analysis of U2OS and HeLa cells, both transfected with control siRNA (ctrl
KD), APC siRNA, either once 48 h prior to cell lysis (APC KD) or twice with an
additional treatment 24 h after the first one (APC DKD), MINK1 siRNA or APC and
MINK1 siRNA (in this case APC KD was performed twice, while MINK1 KD was only
performed once, APC DKD/MINK1 KD). The double knockdown of APC and MINK1
together was used to test whether the effect of APC depletion was altered upon
additional MINK1 depletion. In U2OS cells, the single treatment with APC siRNA
(APC KD) led to a slight increase in β-catenin protein and a slight increase in the
lower two Axin2 bands, but not the characteristic 94 kDa band (Figure 6.7B and C).
Similar to the mRNA levels the protein levels of β-catenin and Axin2 changed less
after repeated APC siRNA treatment (APC DKD). MINK1 KD led to small decrease
in β-catenin levels and a slight increase in Axin2 (Figure 6.7B and C). In the APC
DKD/MINK1 KD both β-catenin and Axin2 protein levels were similar to those in the
control treatment (ctrl KD) (Figure 6.7B and C). In HeLa cells, APC depletion had a
more pronounced effect. APC depletion led to a large increase in β-catenin protein
levels (11- to 15-fold higher signal than in ctrl KD) in all APC depletions (APC KD,
APC DKD and APC DKD/MINK1 KD) (Figure 6.7B and C). Axin2 levels were also
increased in all APC depletions. MINK1 depletion also led to an increase of β-catenin
protein levels in HeLa cells (around 3-fold compared to ctrl KD), but only a very small
increase in Axin2 (Figure 6.7B and C).
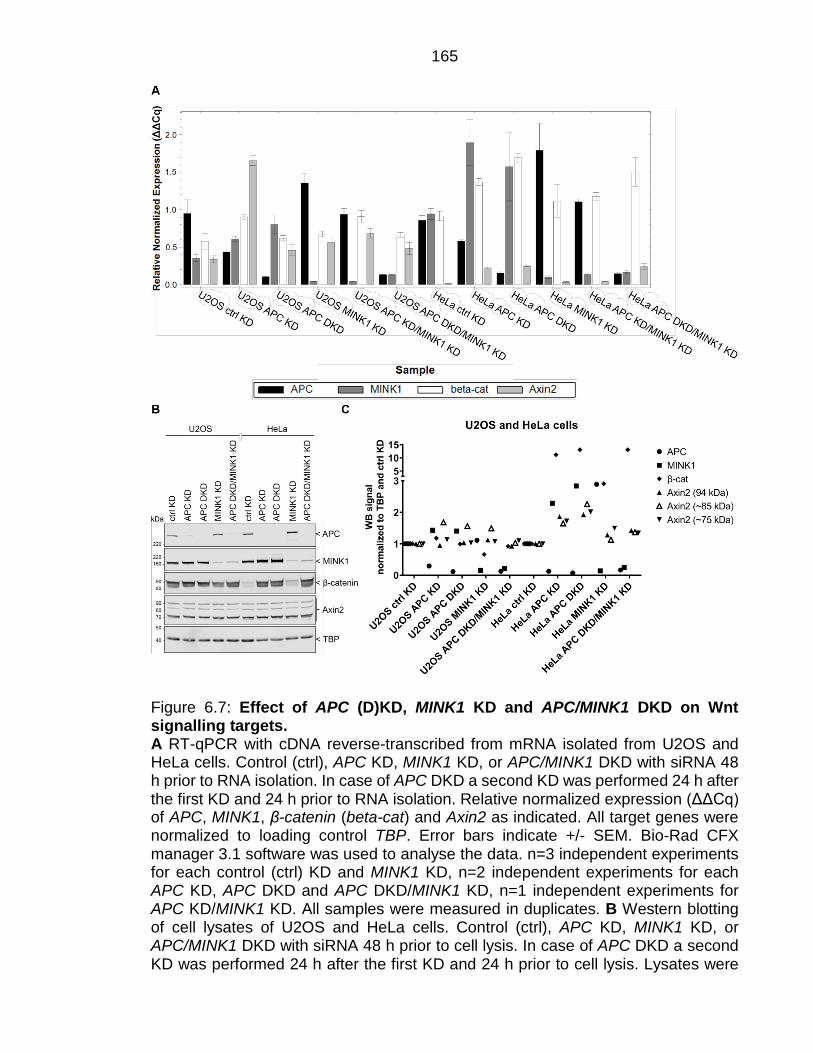
165
Figure 6.7: Effect of APC (D)KD, MINK1 KD and APC/MINK1 DKD on Wnt signalling targets. A RT-qPCR with cDNA reverse-transcribed from mRNA isolated from U2OS and HeLa cells. Control (ctrl), APC KD, MINK1 KD, or APC/MINK1 DKD with siRNA 48 h prior to RNA isolation. In case of APC DKD a second KD was performed 24 h after the first KD and 24 h prior to RNA isolation. Relative normalized expression (ΔΔCq) of APC, MINK1, β-catenin (beta-cat) and Axin2 as indicated. All target genes were normalized to loading control TBP. Error bars indicate +/- SEM. Bio-Rad CFX manager 3.1 software was used to analyse the data. n=3 independent experiments for each control (ctrl) KD and MINK1 KD, n=2 independent experiments for each APC KD, APC DKD and APC DKD/MINK1 KD, n=1 independent experiments for APC KD/MINK1 KD. All samples were measured in duplicates. B Western blotting of cell lysates of U2OS and HeLa cells. Control (ctrl), APC KD, MINK1 KD, or APC/MINK1 DKD with siRNA 48 h prior to cell lysis. In case of APC DKD a second KD was performed 24 h after the first KD and 24 h prior to cell lysis. Lysates were
166 separated by SDS-PAGE, transferred to a nitrocellulose membrane and probed with antibodies against APC (Ali), MINK1, β-catenin and Axin2 as indicated. TBP was used as loading control. C Quantification of Western blotting signals. Western blotting signals of indicated bands were quantified using the image studio lite software (version 5.2) from LI-COR and normalized to the loading control TBP and respective control (ctrl) KD. Western blotting data from one experiment.
Overall, the acute depletion of APC (APC KD) led to an increase in MINK1
expression, transcriptionally and translationally, both in U2OS and HeLa cells
(Figure 6.6 and Figure 6.7). In turn, MINK1 depletion (MINK1 KD) led to an increase
in APC mRNA expression, both in U2OS and HeLa cells, but APC protein was only
increased in HeLa and not in U2OS cells (Figure 6.7). In stable MINK1 deletion
U2OS cell lines, APC protein levels were also slightly increased (Figure 6.6B). The
increase in β-catenin and Axin2, both mRNA and protein, were dependent on APC
depletion and the additional depletion of MINK1 with siRNA, or deletion of MINK1 in
MINK1 KO cell lines, did not significantly add to these effects. Therefore, this
analysis did not yield any evidence that MINK1 might be directly involved in
canonical Wnt signalling in U2OS or HeLa cells. We could previously demonstrate
that MINK1 is regulated independent of β-catenin (both transcriptionally and
translationally) (Popow et al., 2019).
However, interestingly MINK1 depletion in HeLa cells led to a much stronger
increase in β-catenin and Axin2 levels than in U2OS cells, particularly at the protein
level. This could simply be due to the differences in cells. While both U2OS and
HeLa cells are epithelial cell lines, they come from different tissues and different
types of cancer. Both are derived from human female donors, but while HeLa cells
stem from cervical adenocarcinoma, U2OS cells are bone derived and from an
osteosarcoma. Like all cancer derived cell lines both U2OS and HeLa cells show
highly altered chromosome counts. Both U2OS and HeLa cells express wild-type
APC (Ayala-Calvillo et al., 2018; Newton et al., 2010), they do not have mutations in
the p53 gene and express wild-type p53. However, the donor of the HeLa cell line
was infected with the human papillomavirus (HPV), which causes most cervical
cancers. HPV inserts its DNA into host cells, resulting in the production of a p53-
binding protein, E6 protein, which leads to degradation of the p53 protein in HeLa
cells, leading to low p53 protein levels (Leroy et al., 2014). However, the more likely
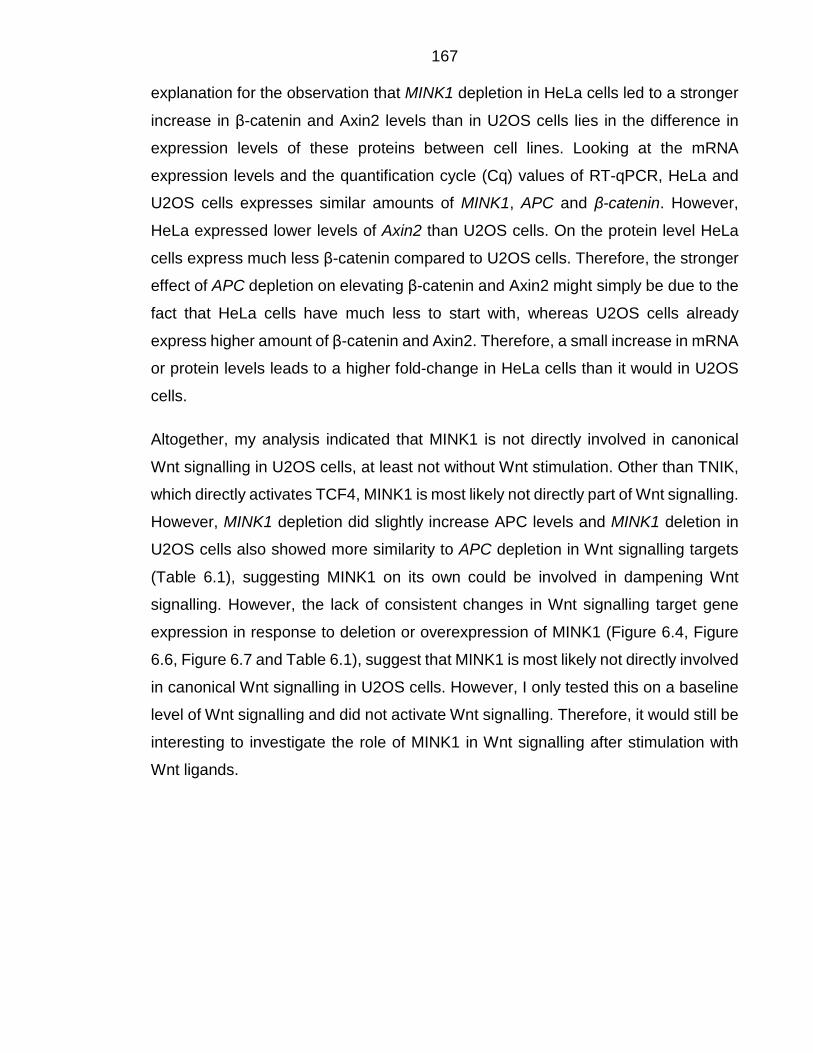
167 explanation for the observation that MINK1 depletion in HeLa cells led to a stronger
increase in β-catenin and Axin2 levels than in U2OS cells lies in the difference in
expression levels of these proteins between cell lines. Looking at the mRNA
expression levels and the quantification cycle (Cq) values of RT-qPCR, HeLa and
U2OS cells expresses similar amounts of MINK1, APC and β-catenin. However,
HeLa expressed lower levels of Axin2 than U2OS cells. On the protein level HeLa
cells express much less β-catenin compared to U2OS cells. Therefore, the stronger
effect of APC depletion on elevating β-catenin and Axin2 might simply be due to the
fact that HeLa cells have much less to start with, whereas U2OS cells already
express higher amount of β-catenin and Axin2. Therefore, a small increase in mRNA
or protein levels leads to a higher fold-change in HeLa cells than it would in U2OS
cells.
Altogether, my analysis indicated that MINK1 is not directly involved in canonical
Wnt signalling in U2OS cells, at least not without Wnt stimulation. Other than TNIK,
which directly activates TCF4, MINK1 is most likely not directly part of Wnt signalling.
However, MINK1 depletion did slightly increase APC levels and MINK1 deletion in
U2OS cells also showed more similarity to APC depletion in Wnt signalling targets
(Table 6.1), suggesting MINK1 on its own could be involved in dampening Wnt
signalling. However, the lack of consistent changes in Wnt signalling target gene
expression in response to deletion or overexpression of MINK1 (Figure 6.4, Figure
6.6, Figure 6.7 and Table 6.1), suggest that MINK1 is most likely not directly involved
in canonical Wnt signalling in U2OS cells. However, I only tested this on a baseline
level of Wnt signalling and did not activate Wnt signalling. Therefore, it would still be
interesting to investigate the role of MINK1 in Wnt signalling after stimulation with
Wnt ligands.
168 MINK1 might be involved in proliferation
Increased proliferation is one of the hallmarks of cancer. In general, cancer cells
show deregulation of growth-promoting signals. The tumour suppressor APC has
been linked to proliferation, especially via its role in canonical Wnt signalling
(Langlands et al., 2018). MINK1 is elevated in APC depleted cells (see chapter 3:
Interaction of APC and MINK1, and (Popow et al., 2019)), to investigate whether
MINK1 is involved in the increased proliferation in cancer cells, a MTT (tetrazolium
salt 3-[4,5-di-methylthiazol-2yl]-2,5-diphenyl-tetrazolium bromide) proliferation
assay was used to measure proliferation rates of cells over three days in U2OS and
colorectal cancer (Colo320) cells. In U2OS cells loss of APC (APC KD) led to an
increase in β-catenin and MINK1 protein levels (Figure 6.8A), but cell proliferation
was significantly reduced 72 hours after APC depletion (APC KD) compared to
control cells (ctrl KD) (Figure 6.8B). However, simultaneous depletion of APC and
MINK1 led to a proliferation rate comparable to control cells (Figure 6.8B).
Surprisingly, in U2OS cells APC depletion did not increase cell proliferation, as is
usually predicted for over-activation of Wnt signalling. This might be explained by
the ‘just-right’ Wnt signalling hypothesis, which proposes an optimal level of Wnt
signalling is involved in increasing growth (Langlands et al., 2018). This means that
both less and more than optimal Wnt signalling can lead to decreased proliferation
in comparison to optimal Wnt signalling. In the case of this experiment the control
conditions might be just below optimal conditions for Wnt signalling and thereby the
over-activation by APC depletion exceeds the maximum leading to suboptimal Wnt
signalling and reduced proliferation. In Colo320 cells, which carry an APC mutation
and express mutant APC (1-811), Wnt signalling is over-activated, which is expected
to lead to an increased proliferation. In the MTT assays, both β-catenin and MINK1
depletion led to significantly decreased proliferation after 72 hours in these cells.
MINK1 depletion led to a similar, but more pronounced proliferation defect than β-
catenin depletion (Figure 6.8C and D). Depletion of β-catenin deactivates canonical
Wnt signalling, therefore a reduction in proliferation was expected. Together, these
results indicate that MINK1 might be involved in cell proliferation. In both cell types
the depletion of MINK1, which is upregulated by APC depletion, rescued the
decreased proliferation phenotype in APC depleted cells and returned it to the
169 control condition (Figure 6.8). To further validate these results, I would like to rescue
APC and/or MINK1 depletion with MINK1 and/or APC. This should reverse the
phenotype and thereby validate that the observations are indeed caused by the
respective depletion. Moreover, Data from previous results (chapter 6) indicated that
MINK1 is most likely not directly involved in canonical Wnt signalling, but might
activate Axin2. Therefore, its potential involvement in proliferation is most likely
independent of Wnt signalling. However, it would be interesting to further investigate
the potential activation of Axin2 by MINK1, which would explain some of the more
subtle effects MINK1 potentially has on Wnt signalling and might explain the effect
MINK1 has on proliferation (Figure 6.5).
Figure 6.8: Effect of MINK1 depletion on cell proliferation in U2OS and Colo320 cells. A Western blotting with cell lysates from U2OS cells treated with control siRNA (ctrl KD), APC siRNA (APC KD), APC and β-catenin siRNA (APC/β-catenin DKD), or APC and MINK1 siRNA (APC/MINK1 DKD). Cell lysates were collected 24 hours, 48 hours and 72 hours after siRNA transfection. Membranes were blotted with antibodies against APC, β-catenin or MINK1, as indicated. GAPDH was used as loading control. B MTT proliferation assay in U2OS cells treated with siRNA against APC alone, or APC and MINK1 simultaneously. Mean absorbance from triplicate measurements, normalized to the mean absorbance at 24 hours. Error bars display

170 +/- SD. Significance relative to control determined by multiple comparisons two-way ANOVA, p-value: * < 0.05. C Western blotting with cell lysates from Colo320 cells treated with control siRNA (ctrl KD), MINK1 siRNA (MINK1 KD), or β-catenin siRNA (β-catenin KD). Cell lysates were collected 24 hours, 48 hours and 72 hours after siRNA transfection. Membranes were blotted with antibodies against β-catenin and MINK1, as indicated. GAPDH was used as loading control. D MTT proliferation assay in Colo320 cells treated with siRNA against β-catenin or MINK1. Shown is the mean absorbance from triplicate measurements normalized to the mean absorbance at 24 hours. Error bars display +/- SD. Significance relative to control determined by multiple comparisons two-way ANOVA, p-value: * < 0.05, ** < 0.01.
171 MINK1 on its own does not affect Hippo signalling
Hippo is another signalling pathway that plays an important role in intestinal
homeostasis and regeneration. It crosstalks to other signalling pathways, including
Wnt and Notch (Barry and Camargo, 2013). The Hippo pathway itself and its
functions are conserved from Drosophila to mammals and the core pathway
including its signalling cascade has been well established (Bossuyt et al., 2014;
Hong et al., 2016; Yu and Guan, 2013). Mutations and altered expression of the
Hippo pathway core components has been described to lead to uncontrolled cell
growth, malignant progression and cancer (Moroishi et al., 2015). In the core Hippo
pathway, the mammalian Ste20-like kinases 1/2 (MST1/2) get activated through
phosphorylation from upstream signals (Figure 6.9). The kinase activity of MAST1/2
is enhanced by its adaptor protein Sav family WW domain-containing protein 1
(SAV1). MST1/2 phosphorylate and thereby activate the large tumour suppressor
1/2 (LATS1/2). The LATS1/2 adaptor proteins Mps one binder 1a (MOB1A) and
MOB1B are also phosphorylated by MST1/2. MOB1A/1B bind to LATS1/2 and
thereby increases its kinase activity. LATS1/2 directly interacts with and
phosphorylates yes-associated protein (YAP) and transcriptional co-activator with
PDZ-binding motif (TAZ). Phosphorylation of YAP/TAZ keeps them from entering the
nucleus and either leads to protein degradation, or to interaction with 14-3-3 proteins
and therefore to cytoplasmic retention. Dephosphorylation of YAP/TAZ allows the
proteins to enter the nucleus, where they bind to transcription factors TEAD1-4 and
induce gene transcription (Figure 6.9A) (Meng et al., 2015; Yu and Guan, 2013).
Recent studies have proposed that the Drosophila MINK1 homologue, msn,
contributes to Hippo signalling by interacting with and activating the LATS1/2
homologue, NDR family kinase Warts (Wts), thereby negatively regulating the
YAP/TAZ homologue, Yorkie (Yki) (Li et al., 2014). The MINK1 ohnologue, MAP4K4,
has also been linked to Hippo signalling and reported to promote YAP
phosphorylation at serine 127 (S127) (Kim et al., 2020).
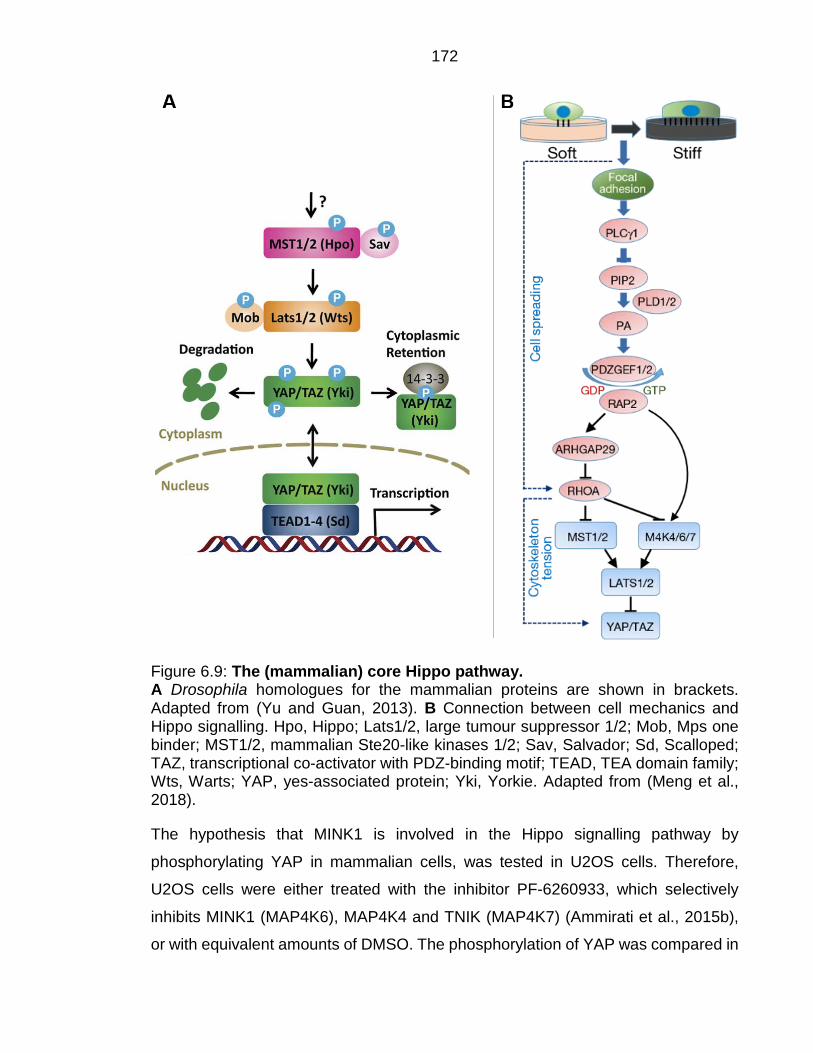
172
Figure 6.9: The (mammalian) core Hippo pathway. A Drosophila homologues for the mammalian proteins are shown in brackets. Adapted from (Yu and Guan, 2013). B Connection between cell mechanics and Hippo signalling. Hpo, Hippo; Lats1/2, large tumour suppressor 1/2; Mob, Mps one binder; MST1/2, mammalian Ste20-like kinases 1/2; Sav, Salvador; Sd, Scalloped; TAZ, transcriptional co-activator with PDZ-binding motif; TEAD, TEA domain family; Wts, Warts; YAP, yes-associated protein; Yki, Yorkie. Adapted from (Meng et al., 2018).
The hypothesis that MINK1 is involved in the Hippo signalling pathway by
phosphorylating YAP in mammalian cells, was tested in U2OS cells. Therefore,
U2OS cells were either treated with the inhibitor PF-6260933, which selectively
inhibits MINK1 (MAP4K6), MAP4K4 and TNIK (MAP4K7) (Ammirati et al., 2015b),
or with equivalent amounts of DMSO. The phosphorylation of YAP was compared in
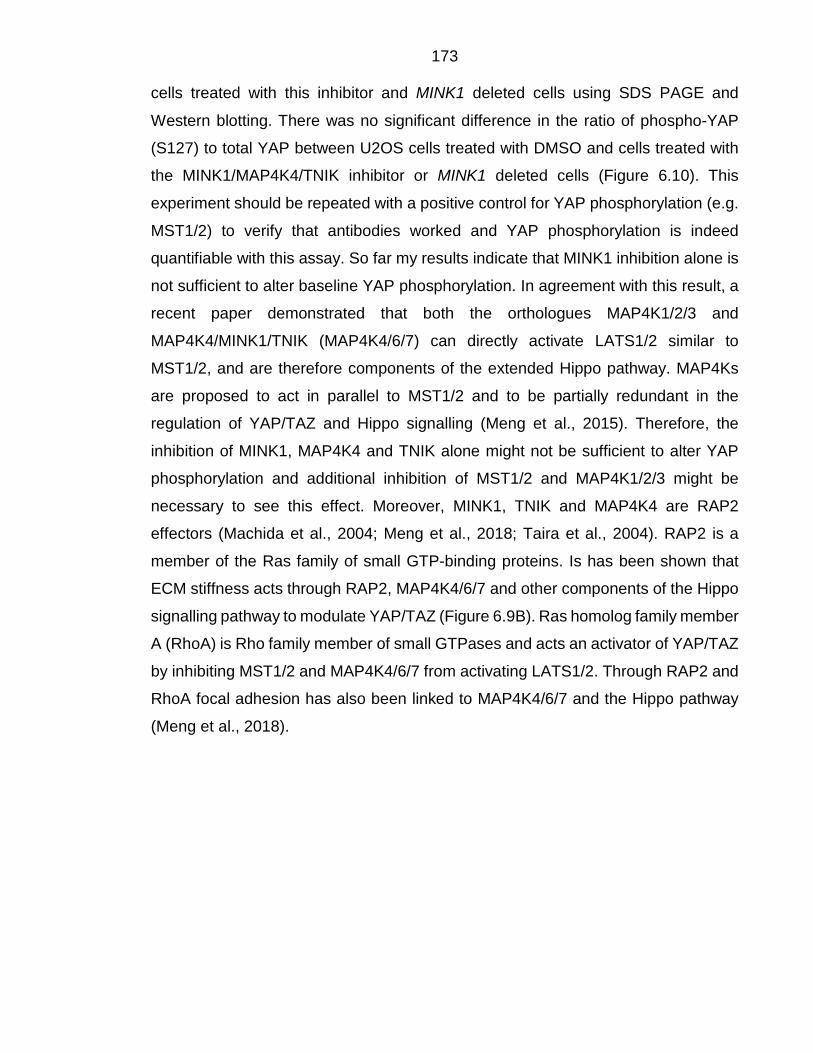
173 cells treated with this inhibitor and MINK1 deleted cells using SDS PAGE and
Western blotting. There was no significant difference in the ratio of phospho-YAP
(S127) to total YAP between U2OS cells treated with DMSO and cells treated with
the MINK1/MAP4K4/TNIK inhibitor or MINK1 deleted cells (Figure 6.10). This
experiment should be repeated with a positive control for YAP phosphorylation (e.g.
MST1/2) to verify that antibodies worked and YAP phosphorylation is indeed
quantifiable with this assay. So far my results indicate that MINK1 inhibition alone is
not sufficient to alter baseline YAP phosphorylation. In agreement with this result, a
recent paper demonstrated that both the orthologues MAP4K1/2/3 and
MAP4K4/MINK1/TNIK (MAP4K4/6/7) can directly activate LATS1/2 similar to
MST1/2, and are therefore components of the extended Hippo pathway. MAP4Ks
are proposed to act in parallel to MST1/2 and to be partially redundant in the
regulation of YAP/TAZ and Hippo signalling (Meng et al., 2015). Therefore, the
inhibition of MINK1, MAP4K4 and TNIK alone might not be sufficient to alter YAP
phosphorylation and additional inhibition of MST1/2 and MAP4K1/2/3 might be
necessary to see this effect. Moreover, MINK1, TNIK and MAP4K4 are RAP2
effectors (Machida et al., 2004; Meng et al., 2018; Taira et al., 2004). RAP2 is a
member of the Ras family of small GTP-binding proteins. Is has been shown that
ECM stiffness acts through RAP2, MAP4K4/6/7 and other components of the Hippo
signalling pathway to modulate YAP/TAZ (Figure 6.9B). Ras homolog family member
A (RhoA) is Rho family member of small GTPases and acts an activator of YAP/TAZ
by inhibiting MST1/2 and MAP4K4/6/7 from activating LATS1/2. Through RAP2 and
RhoA focal adhesion has also been linked to MAP4K4/6/7 and the Hippo pathway
(Meng et al., 2018).
174
Figure 6.10: Effect of U2OS cells treated with MAP4K4/6/7 inhibitor on Hippo signalling. A Western blotting with cell lysates from U2OS cells treated with DMSO, 3 μM PF-6260933, or 7 μM PF-6260933 and U2OS MINK1 KO cell lysates. Membranes were blotted with antibodies against p-YAP (S127) and YAP. TBP was used as loading control. Western blots are representative of two independent experiments. B Quantification of Western blotting signals of phospho-YAP (S127) normalized to total YAP and loading control TBP using the image studio lite software (version 5.2) from LI-COR. For DMSO treatment, 7 μM PF-6260933 treatment and U2OS MINK1 KO: n = 2, for 3 μM PF-6260933 treatment n = 1.
175 Sub-cellular localisation of MINK1
In agreement with the different roles of APC in various cellular processes like
canonical Wnt signalling, migration and focal adhesion turnover, APC has been
demonstrated to localise to different subcellular compartments, including cell-cell
junctions, the apical membrane, the cytoplasm and the nucleus. Additionally, in
migrating cells APC has been shown to associate with microtubules at the leading
edge and to cluster in actively protruding regions of cell membranes (Näthke et al.,
1996).
Previous work from our group, using immunofluorescence microscopy on HeLa cells
expressing endogenously mNeonGreen-labelled MINK1 found endogenous MINK1
to be enriched at tips of protrusions and at lateral plasma membranes in areas of
cell-cell contacts between neighbouring cells. However, no mNeonGreen signal was
detected in regions of the plasma membrane without contact to neighbour cells
(Popow et al., 2019). MINK1 localisation to the cytoplasm has also been
demonstrated previously (Nonaka et al., 2008). Additionally, it was proposed that
MINK1 co-localises with the Golgi complex in HeLa cells (Hu et al., 2004), but
previous work from our group using depletion of MINK1 by siRNA demonstrated that
these staining patterns were likely a result of antibody cross-reactivity (Popow et al.,
2019).
Moreover, APC negatively regulates MINK1. To further investigate how elevated
levels of MINK1 protein could contribute to biological function(s) of mutant APC, the
subcellular localisation of MINK1 was investigated in U2OS cells utilising a cell
fractionation assay and live cell imaging of endogenously mNeonGreen-tagged
MINK1 in HeLa cells. For subcellular fractionations, cell lysates from U2OS cells with
and without induced overexpression of MINK1-GFP were used. The cell fractionation
assay produced four fractions comprising proteins of the following sub-cellular
compartments: 1) cytosol, 2) membrane and organelles, 3) nucleus and 4)
cytoskeleton. Whole cell lysates of U2OS cells with induced (+Tet) and uninduced (-
Tet) overexpression of MINK1-GFP were used as control. Endogenous MINK1 levels
in cell fractions were too low to be detected by Western blotting, while the
overexpressed MINK1-GFP protein was detectable (Figure 6.11A). Approximately
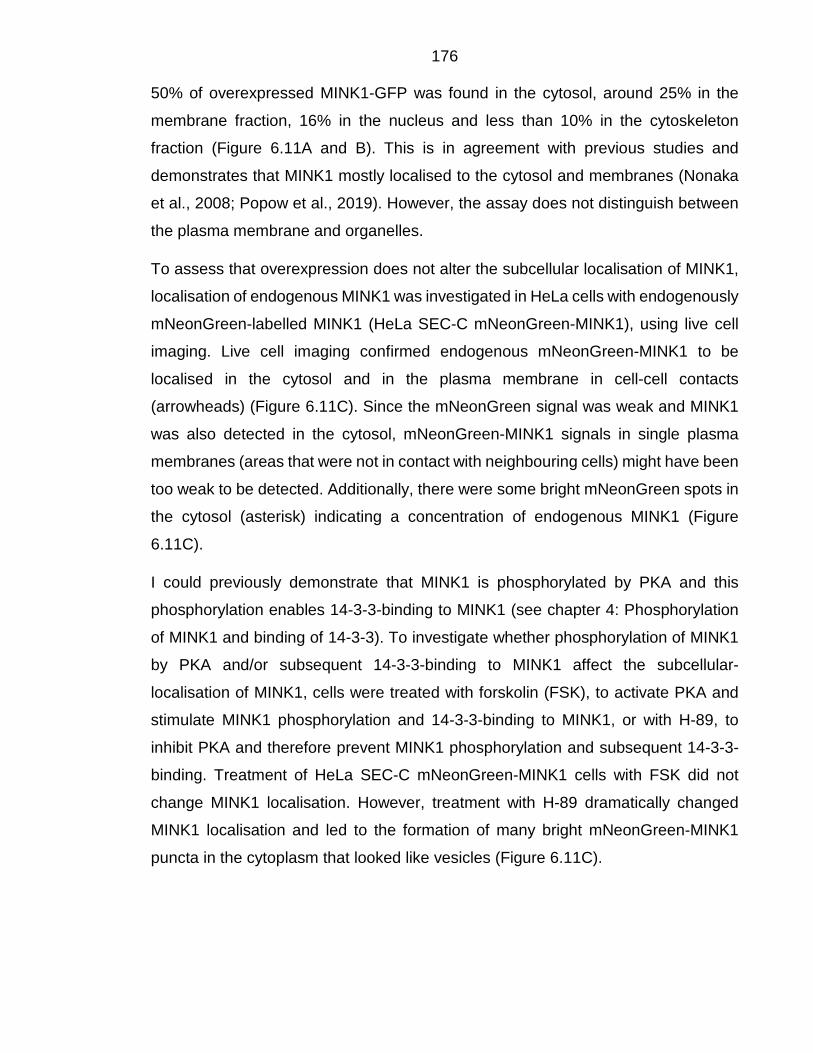
176 50% of overexpressed MINK1-GFP was found in the cytosol, around 25% in the
membrane fraction, 16% in the nucleus and less than 10% in the cytoskeleton
fraction (Figure 6.11A and B). This is in agreement with previous studies and
demonstrates that MINK1 mostly localised to the cytosol and membranes (Nonaka
et al., 2008; Popow et al., 2019). However, the assay does not distinguish between
the plasma membrane and organelles.
To assess that overexpression does not alter the subcellular localisation of MINK1,
localisation of endogenous MINK1 was investigated in HeLa cells with endogenously
mNeonGreen-labelled MINK1 (HeLa SEC-C mNeonGreen-MINK1), using live cell
imaging. Live cell imaging confirmed endogenous mNeonGreen-MINK1 to be
localised in the cytosol and in the plasma membrane in cell-cell contacts
(arrowheads) (Figure 6.11C). Since the mNeonGreen signal was weak and MINK1
was also detected in the cytosol, mNeonGreen-MINK1 signals in single plasma
membranes (areas that were not in contact with neighbouring cells) might have been
too weak to be detected. Additionally, there were some bright mNeonGreen spots in
the cytosol (asterisk) indicating a concentration of endogenous MINK1 (Figure
6.11C).
I could previously demonstrate that MINK1 is phosphorylated by PKA and this
phosphorylation enables 14-3-3-binding to MINK1 (see chapter 4: Phosphorylation
of MINK1 and binding of 14-3-3). To investigate whether phosphorylation of MINK1
by PKA and/or subsequent 14-3-3-binding to MINK1 affect the subcellular-
localisation of MINK1, cells were treated with forskolin (FSK), to activate PKA and
stimulate MINK1 phosphorylation and 14-3-3-binding to MINK1, or with H-89, to
inhibit PKA and therefore prevent MINK1 phosphorylation and subsequent 14-3-3-
binding. Treatment of HeLa SEC-C mNeonGreen-MINK1 cells with FSK did not
change MINK1 localisation. However, treatment with H-89 dramatically changed
MINK1 localisation and led to the formation of many bright mNeonGreen-MINK1
puncta in the cytoplasm that looked like vesicles (Figure 6.11C).
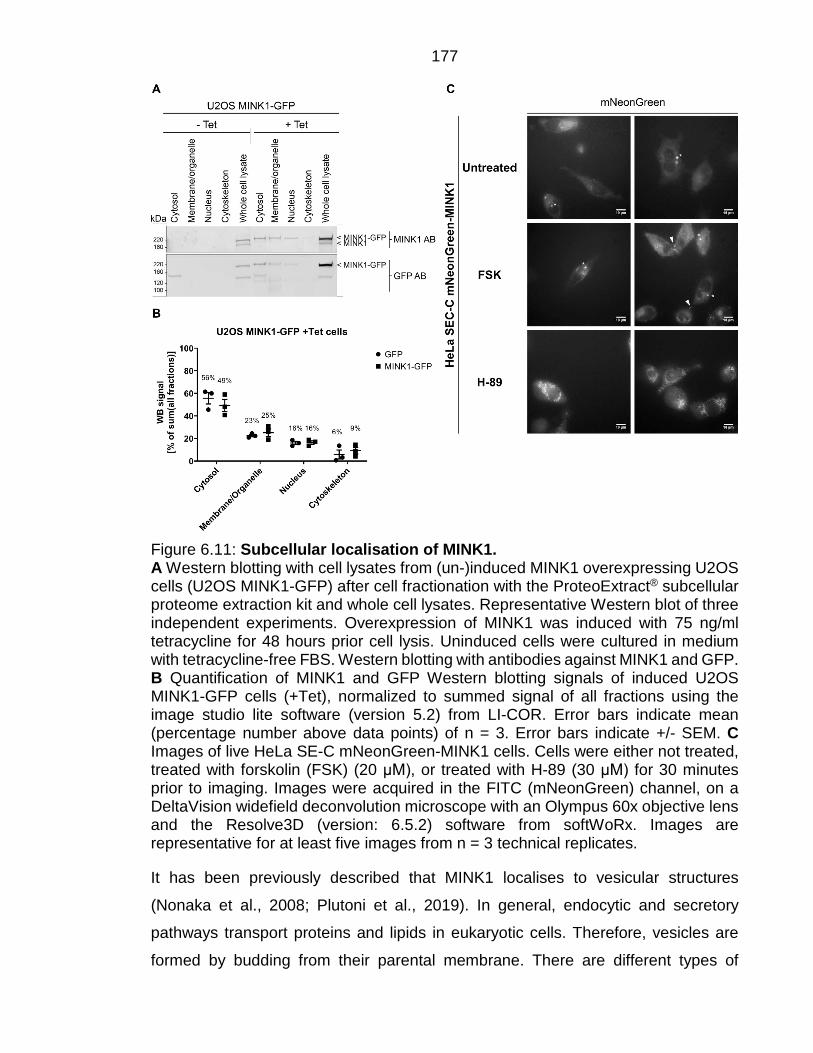
177
Figure 6.11: Subcellular localisation of MINK1. A Western blotting with cell lysates from (un-)induced MINK1 overexpressing U2OS cells (U2OS MINK1-GFP) after cell fractionation with the ProteoExtract® subcellular proteome extraction kit and whole cell lysates. Representative Western blot of three independent experiments. Overexpression of MINK1 was induced with 75 ng/ml tetracycline for 48 hours prior cell lysis. Uninduced cells were cultured in medium with tetracycline-free FBS. Western blotting with antibodies against MINK1 and GFP. B Quantification of MINK1 and GFP Western blotting signals of induced U2OS MINK1-GFP cells (+Tet), normalized to summed signal of all fractions using the image studio lite software (version 5.2) from LI-COR. Error bars indicate mean (percentage number above data points) of n = 3. Error bars indicate +/- SEM. C Images of live HeLa SE-C mNeonGreen-MINK1 cells. Cells were either not treated, treated with forskolin (FSK) (20 μM), or treated with H-89 (30 μM) for 30 minutes prior to imaging. Images were acquired in the FITC (mNeonGreen) channel, on a DeltaVision widefield deconvolution microscope with an Olympus 60x objective lens and the Resolve3D (version: 6.5.2) software from softWoRx. Images are representative for at least five images from n = 3 technical replicates.
It has been previously described that MINK1 localises to vesicular structures
(Nonaka et al., 2008; Plutoni et al., 2019). In general, endocytic and secretory
pathways transport proteins and lipids in eukaryotic cells. Therefore, vesicles are
formed by budding from their parental membrane. There are different types of
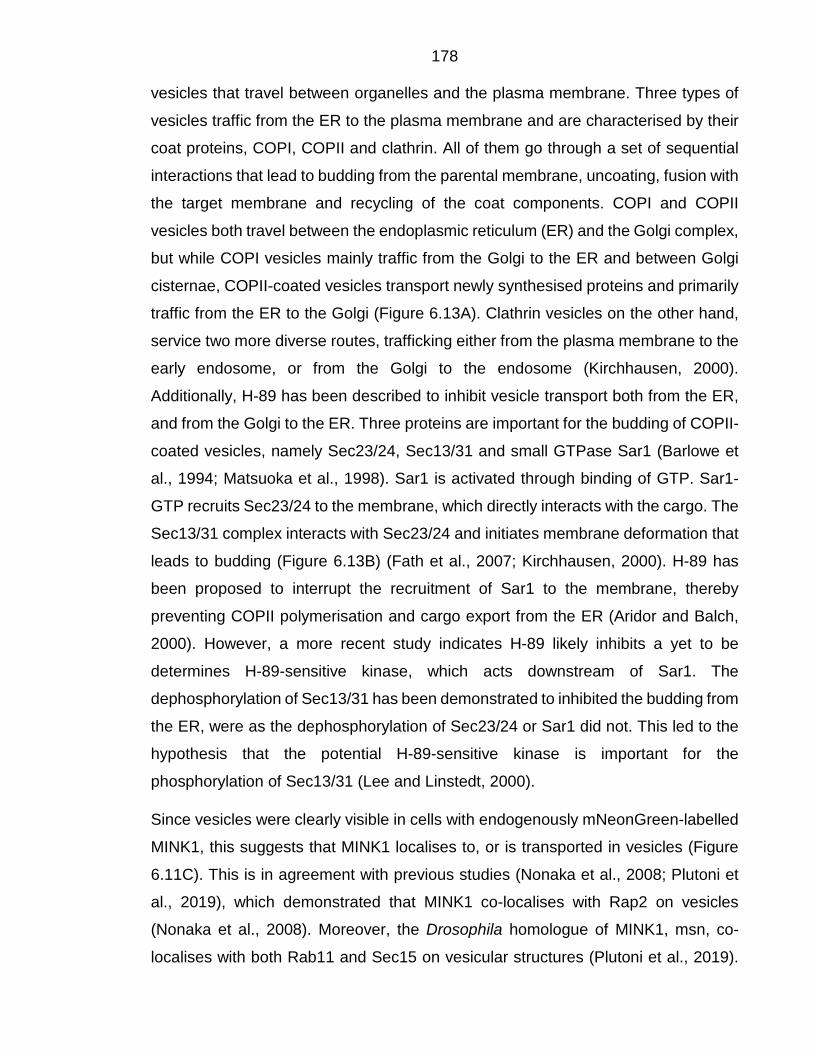
178 vesicles that travel between organelles and the plasma membrane. Three types of
vesicles traffic from the ER to the plasma membrane and are characterised by their
coat proteins, COPI, COPII and clathrin. All of them go through a set of sequential
interactions that lead to budding from the parental membrane, uncoating, fusion with
the target membrane and recycling of the coat components. COPI and COPII
vesicles both travel between the endoplasmic reticulum (ER) and the Golgi complex,
but while COPI vesicles mainly traffic from the Golgi to the ER and between Golgi
cisternae, COPII-coated vesicles transport newly synthesised proteins and primarily
traffic from the ER to the Golgi (Figure 6.13A). Clathrin vesicles on the other hand,
service two more diverse routes, trafficking either from the plasma membrane to the
early endosome, or from the Golgi to the endosome (Kirchhausen, 2000).
Additionally, H-89 has been described to inhibit vesicle transport both from the ER,
and from the Golgi to the ER. Three proteins are important for the budding of COPII-
coated vesicles, namely Sec23/24, Sec13/31 and small GTPase Sar1 (Barlowe et
al., 1994; Matsuoka et al., 1998). Sar1 is activated through binding of GTP. Sar1-
GTP recruits Sec23/24 to the membrane, which directly interacts with the cargo. The
Sec13/31 complex interacts with Sec23/24 and initiates membrane deformation that
leads to budding (Figure 6.13B) (Fath et al., 2007; Kirchhausen, 2000). H-89 has
been proposed to interrupt the recruitment of Sar1 to the membrane, thereby
preventing COPII polymerisation and cargo export from the ER (Aridor and Balch,
2000). However, a more recent study indicates H-89 likely inhibits a yet to be
determines H-89-sensitive kinase, which acts downstream of Sar1. The
dephosphorylation of Sec13/31 has been demonstrated to inhibited the budding from
the ER, were as the dephosphorylation of Sec23/24 or Sar1 did not. This led to the
hypothesis that the potential H-89-sensitive kinase is important for the
phosphorylation of Sec13/31 (Lee and Linstedt, 2000).
Since vesicles were clearly visible in cells with endogenously mNeonGreen-labelled
MINK1, this suggests that MINK1 localises to, or is transported in vesicles (Figure
6.11C). This is in agreement with previous studies (Nonaka et al., 2008; Plutoni et
al., 2019), which demonstrated that MINK1 co-localises with Rap2 on vesicles
(Nonaka et al., 2008). Moreover, the Drosophila homologue of MINK1, msn, co-
localises with both Rab11 and Sec15 on vesicular structures (Plutoni et al., 2019).
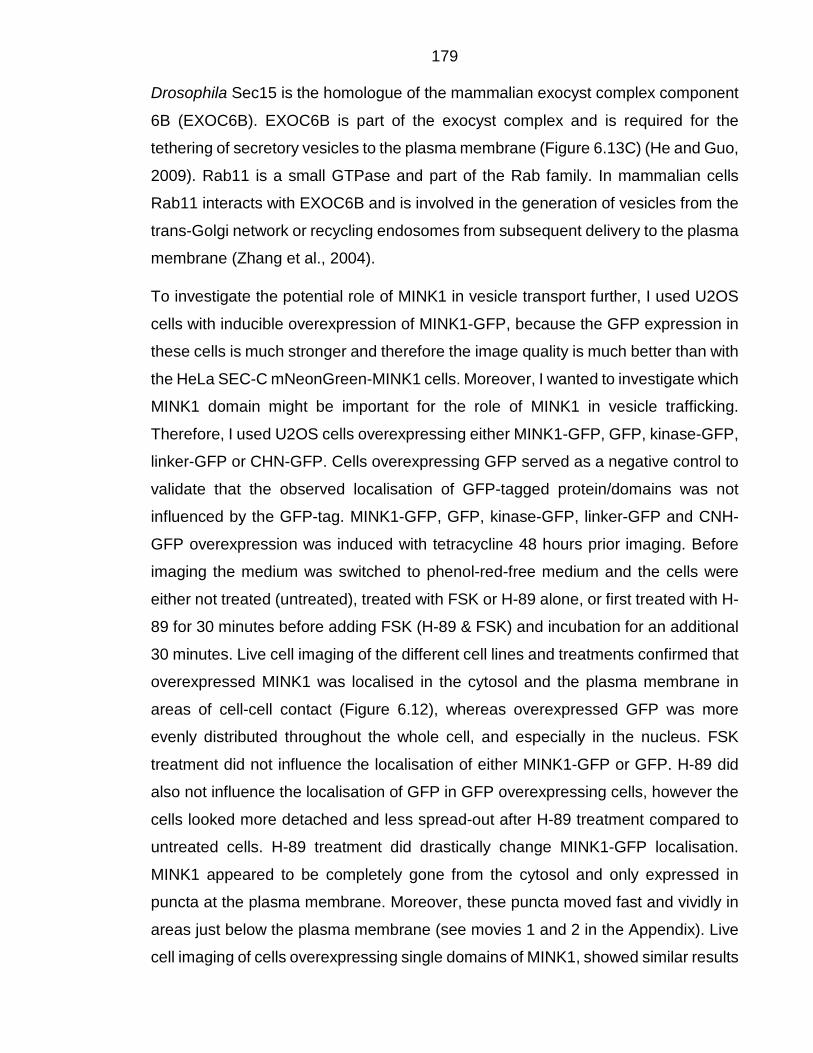
179 Drosophila Sec15 is the homologue of the mammalian exocyst complex component
6B (EXOC6B). EXOC6B is part of the exocyst complex and is required for the
tethering of secretory vesicles to the plasma membrane (Figure 6.13C) (He and Guo,
2009). Rab11 is a small GTPase and part of the Rab family. In mammalian cells
Rab11 interacts with EXOC6B and is involved in the generation of vesicles from the
trans-Golgi network or recycling endosomes from subsequent delivery to the plasma
membrane (Zhang et al., 2004).
To investigate the potential role of MINK1 in vesicle transport further, I used U2OS
cells with inducible overexpression of MINK1-GFP, because the GFP expression in
these cells is much stronger and therefore the image quality is much better than with
the HeLa SEC-C mNeonGreen-MINK1 cells. Moreover, I wanted to investigate which
MINK1 domain might be important for the role of MINK1 in vesicle trafficking.
Therefore, I used U2OS cells overexpressing either MINK1-GFP, GFP, kinase-GFP,
linker-GFP or CHN-GFP. Cells overexpressing GFP served as a negative control to
validate that the observed localisation of GFP-tagged protein/domains was not
influenced by the GFP-tag. MINK1-GFP, GFP, kinase-GFP, linker-GFP and CNH-
GFP overexpression was induced with tetracycline 48 hours prior imaging. Before
imaging the medium was switched to phenol-red-free medium and the cells were
either not treated (untreated), treated with FSK or H-89 alone, or first treated with H-
89 for 30 minutes before adding FSK (H-89 & FSK) and incubation for an additional
30 minutes. Live cell imaging of the different cell lines and treatments confirmed that
overexpressed MINK1 was localised in the cytosol and the plasma membrane in
areas of cell-cell contact (Figure 6.12), whereas overexpressed GFP was more
evenly distributed throughout the whole cell, and especially in the nucleus. FSK
treatment did not influence the localisation of either MINK1-GFP or GFP. H-89 did
also not influence the localisation of GFP in GFP overexpressing cells, however the
cells looked more detached and less spread-out after H-89 treatment compared to
untreated cells. H-89 treatment did drastically change MINK1-GFP localisation.
MINK1 appeared to be completely gone from the cytosol and only expressed in
puncta at the plasma membrane. Moreover, these puncta moved fast and vividly in
areas just below the plasma membrane (see movies 1 and 2 in the Appendix). Live
cell imaging of cells overexpressing single domains of MINK1, showed similar results
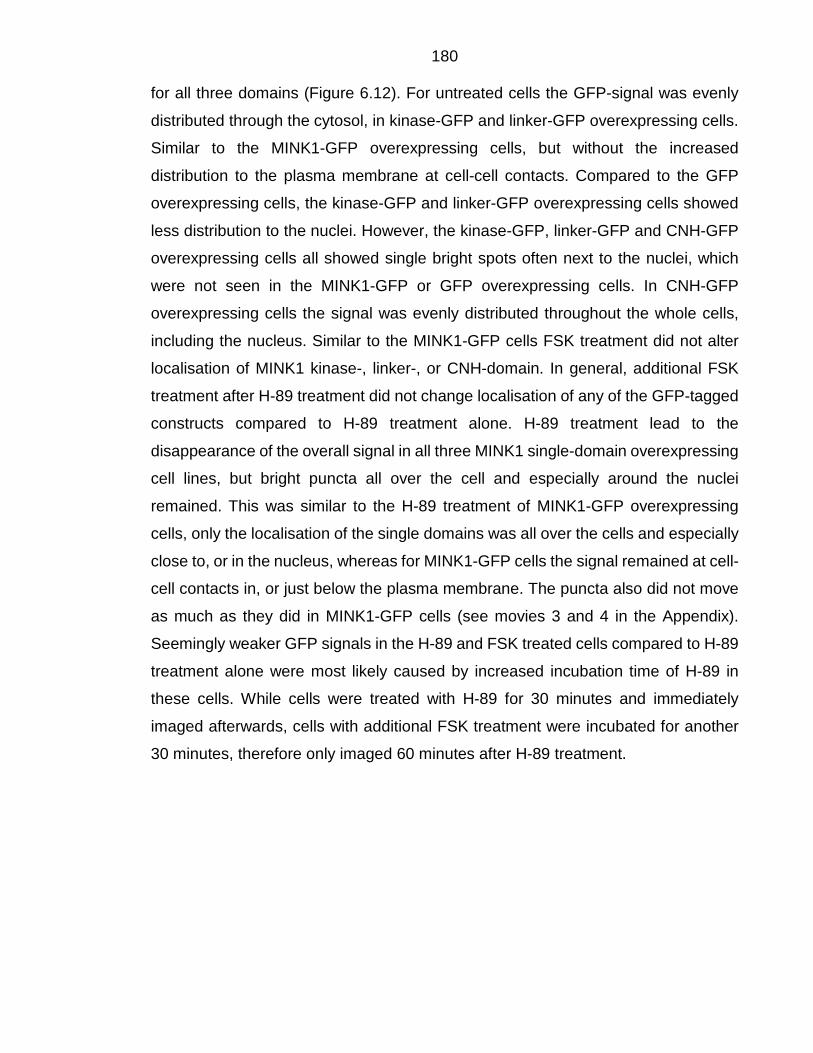
180 for all three domains (Figure 6.12). For untreated cells the GFP-signal was evenly
distributed through the cytosol, in kinase-GFP and linker-GFP overexpressing cells.
Similar to the MINK1-GFP overexpressing cells, but without the increased
distribution to the plasma membrane at cell-cell contacts. Compared to the GFP
overexpressing cells, the kinase-GFP and linker-GFP overexpressing cells showed
less distribution to the nuclei. However, the kinase-GFP, linker-GFP and CNH-GFP
overexpressing cells all showed single bright spots often next to the nuclei, which
were not seen in the MINK1-GFP or GFP overexpressing cells. In CNH-GFP
overexpressing cells the signal was evenly distributed throughout the whole cells,
including the nucleus. Similar to the MINK1-GFP cells FSK treatment did not alter
localisation of MINK1 kinase-, linker-, or CNH-domain. In general, additional FSK
treatment after H-89 treatment did not change localisation of any of the GFP-tagged
constructs compared to H-89 treatment alone. H-89 treatment lead to the
disappearance of the overall signal in all three MINK1 single-domain overexpressing
cell lines, but bright puncta all over the cell and especially around the nuclei
remained. This was similar to the H-89 treatment of MINK1-GFP overexpressing
cells, only the localisation of the single domains was all over the cells and especially
close to, or in the nucleus, whereas for MINK1-GFP cells the signal remained at cell-
cell contacts in, or just below the plasma membrane. The puncta also did not move
as much as they did in MINK1-GFP cells (see movies 3 and 4 in the Appendix).
Seemingly weaker GFP signals in the H-89 and FSK treated cells compared to H-89
treatment alone were most likely caused by increased incubation time of H-89 in
these cells. While cells were treated with H-89 for 30 minutes and immediately
imaged afterwards, cells with additional FSK treatment were incubated for another
30 minutes, therefore only imaged 60 minutes after H-89 treatment.
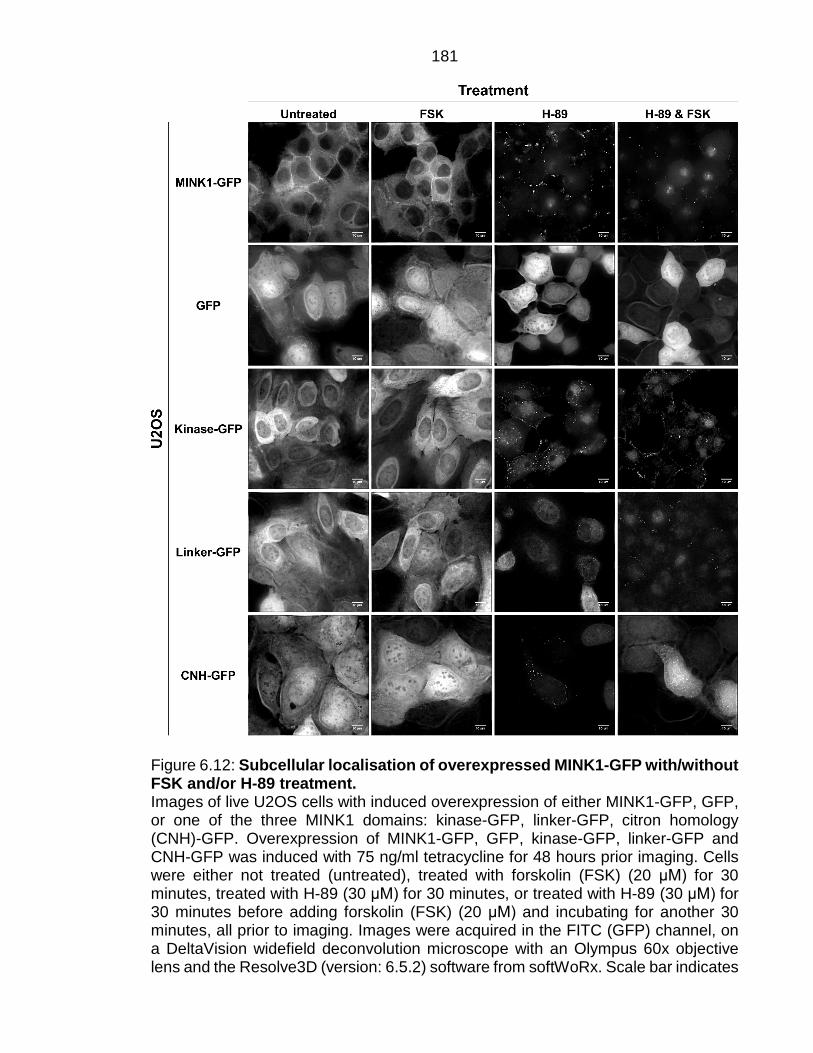
181
Figure 6.12: Subcellular localisation of overexpressed MINK1-GFP with/without FSK and/or H-89 treatment. Images of live U2OS cells with induced overexpression of either MINK1-GFP, GFP, or one of the three MINK1 domains: kinase-GFP, linker-GFP, citron homology (CNH)-GFP. Overexpression of MINK1-GFP, GFP, kinase-GFP, linker-GFP and CNH-GFP was induced with 75 ng/ml tetracycline for 48 hours prior imaging. Cells were either not treated (untreated), treated with forskolin (FSK) (20 μM) for 30 minutes, treated with H-89 (30 μM) for 30 minutes, or treated with H-89 (30 μM) for 30 minutes before adding forskolin (FSK) (20 μM) and incubating for another 30 minutes, all prior to imaging. Images were acquired in the FITC (GFP) channel, on a DeltaVision widefield deconvolution microscope with an Olympus 60x objective lens and the Resolve3D (version: 6.5.2) software from softWoRx. Scale bar indicates
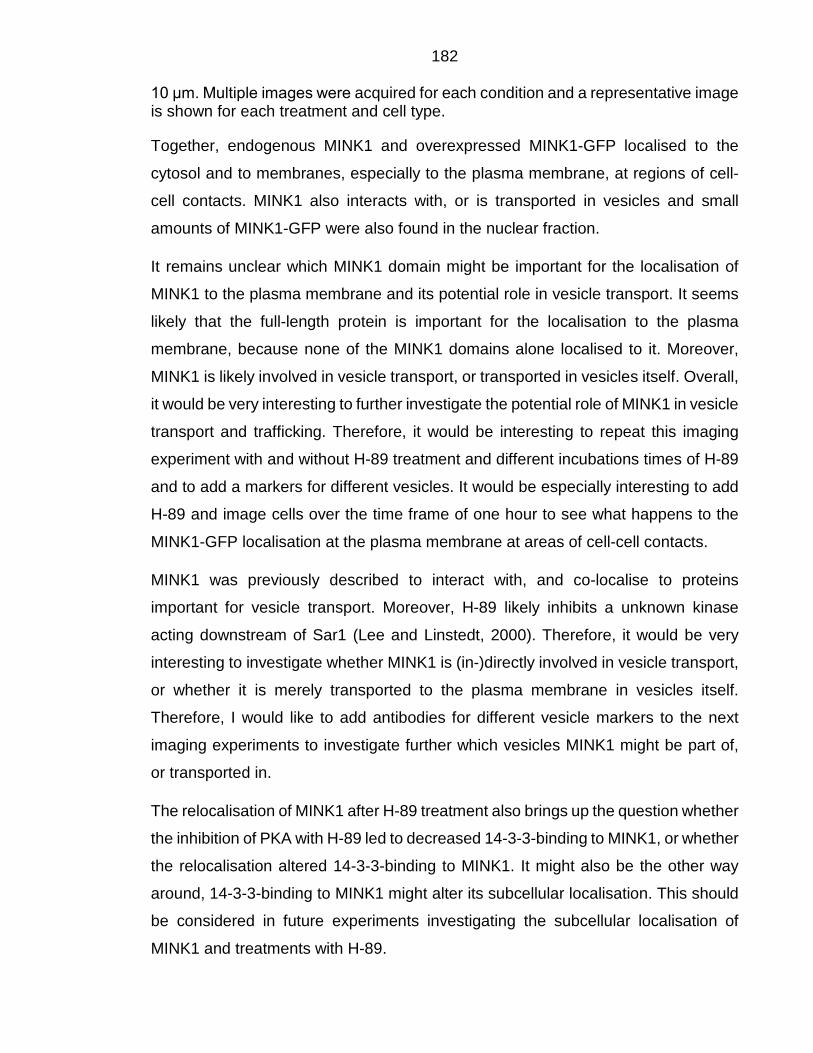
182 10 μm. Multiple images were acquired for each condition and a representative image is shown for each treatment and cell type.
Together, endogenous MINK1 and overexpressed MINK1-GFP localised to the
cytosol and to membranes, especially to the plasma membrane, at regions of cell-
cell contacts. MINK1 also interacts with, or is transported in vesicles and small
amounts of MINK1-GFP were also found in the nuclear fraction.
It remains unclear which MINK1 domain might be important for the localisation of
MINK1 to the plasma membrane and its potential role in vesicle transport. It seems
likely that the full-length protein is important for the localisation to the plasma
membrane, because none of the MINK1 domains alone localised to it. Moreover,
MINK1 is likely involved in vesicle transport, or transported in vesicles itself. Overall,
it would be very interesting to further investigate the potential role of MINK1 in vesicle
transport and trafficking. Therefore, it would be interesting to repeat this imaging
experiment with and without H-89 treatment and different incubations times of H-89
and to add a markers for different vesicles. It would be especially interesting to add
H-89 and image cells over the time frame of one hour to see what happens to the
MINK1-GFP localisation at the plasma membrane at areas of cell-cell contacts.
MINK1 was previously described to interact with, and co-localise to proteins
important for vesicle transport. Moreover, H-89 likely inhibits a unknown kinase
acting downstream of Sar1 (Lee and Linstedt, 2000). Therefore, it would be very
interesting to investigate whether MINK1 is (in-)directly involved in vesicle transport,
or whether it is merely transported to the plasma membrane in vesicles itself.
Therefore, I would like to add antibodies for different vesicle markers to the next
imaging experiments to investigate further which vesicles MINK1 might be part of,
or transported in.
The relocalisation of MINK1 after H-89 treatment also brings up the question whether
the inhibition of PKA with H-89 led to decreased 14-3-3-binding to MINK1, or whether
the relocalisation altered 14-3-3-binding to MINK1. It might also be the other way
around, 14-3-3-binding to MINK1 might alter its subcellular localisation. This should
be considered in future experiments investigating the subcellular localisation of
MINK1 and treatments with H-89.
183
Figure 6.13: Vesicle transport. A There are three types of vesicles, characterised by different coat proteins, which transport cargo between organelles, the plasma membrane and endosomes. Created with BioRender.com. B Coat assembly of COPII-coated vesicles. From (Miller, 2013). C Exocyst assembly and vesicle tethering. From (Wu and Guo, 2015).
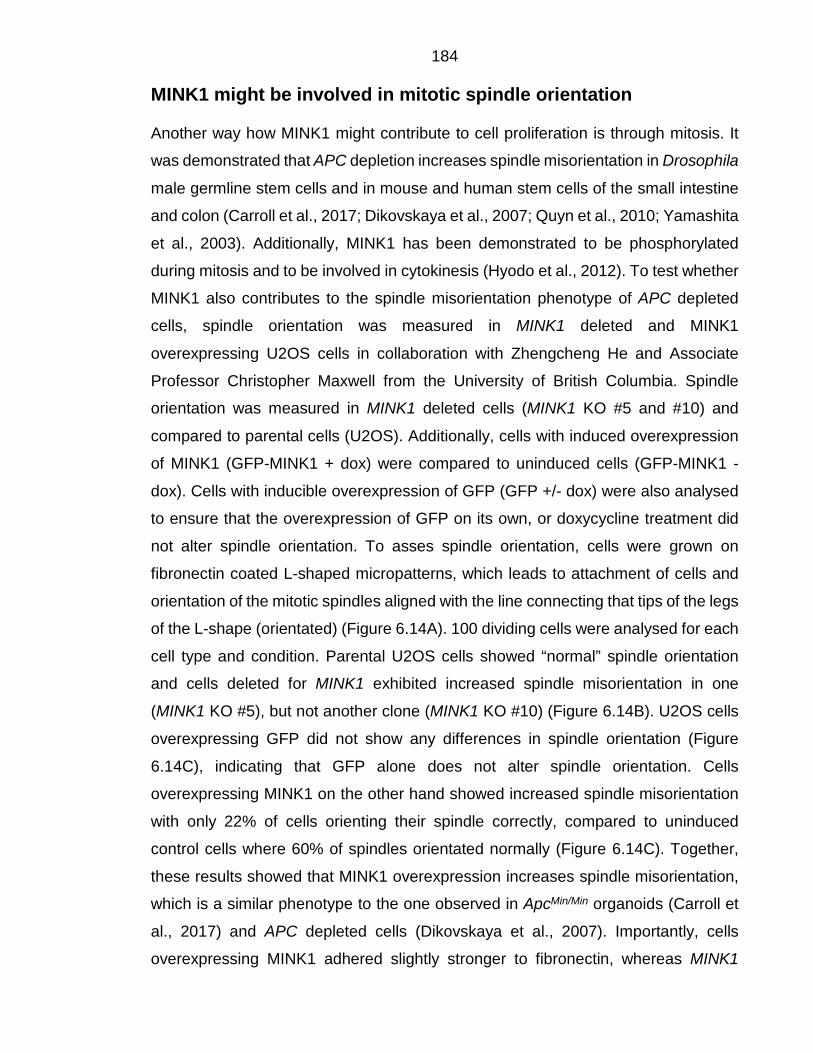
184 MINK1 might be involved in mitotic spindle orientation
Another way how MINK1 might contribute to cell proliferation is through mitosis. It
was demonstrated that APC depletion increases spindle misorientation in Drosophila
male germline stem cells and in mouse and human stem cells of the small intestine
and colon (Carroll et al., 2017; Dikovskaya et al., 2007; Quyn et al., 2010; Yamashita
et al., 2003). Additionally, MINK1 has been demonstrated to be phosphorylated
during mitosis and to be involved in cytokinesis (Hyodo et al., 2012). To test whether
MINK1 also contributes to the spindle misorientation phenotype of APC depleted
cells, spindle orientation was measured in MINK1 deleted and MINK1
overexpressing U2OS cells in collaboration with Zhengcheng He and Associate
Professor Christopher Maxwell from the University of British Columbia. Spindle
orientation was measured in MINK1 deleted cells (MINK1 KO #5 and #10) and
compared to parental cells (U2OS). Additionally, cells with induced overexpression
of MINK1 (GFP-MINK1 + dox) were compared to uninduced cells (GFP-MINK1 -
dox). Cells with inducible overexpression of GFP (GFP +/- dox) were also analysed
to ensure that the overexpression of GFP on its own, or doxycycline treatment did
not alter spindle orientation. To asses spindle orientation, cells were grown on
fibronectin coated L-shaped micropatterns, which leads to attachment of cells and
orientation of the mitotic spindles aligned with the line connecting that tips of the legs
of the L-shape (orientated) (Figure 6.14A). 100 dividing cells were analysed for each
cell type and condition. Parental U2OS cells showed “normal” spindle orientation
and cells deleted for MINK1 exhibited increased spindle misorientation in one
(MINK1 KO #5), but not another clone (MINK1 KO #10) (Figure 6.14B). U2OS cells
overexpressing GFP did not show any differences in spindle orientation (Figure
6.14C), indicating that GFP alone does not alter spindle orientation. Cells
overexpressing MINK1 on the other hand showed increased spindle misorientation
with only 22% of cells orienting their spindle correctly, compared to uninduced
control cells where 60% of spindles orientated normally (Figure 6.14C). Together,
these results showed that MINK1 overexpression increases spindle misorientation,
which is a similar phenotype to the one observed in ApcMin/Min organoids (Carroll et
al., 2017) and APC depleted cells (Dikovskaya et al., 2007). Importantly, cells
overexpressing MINK1 adhered slightly stronger to fibronectin, whereas MINK1
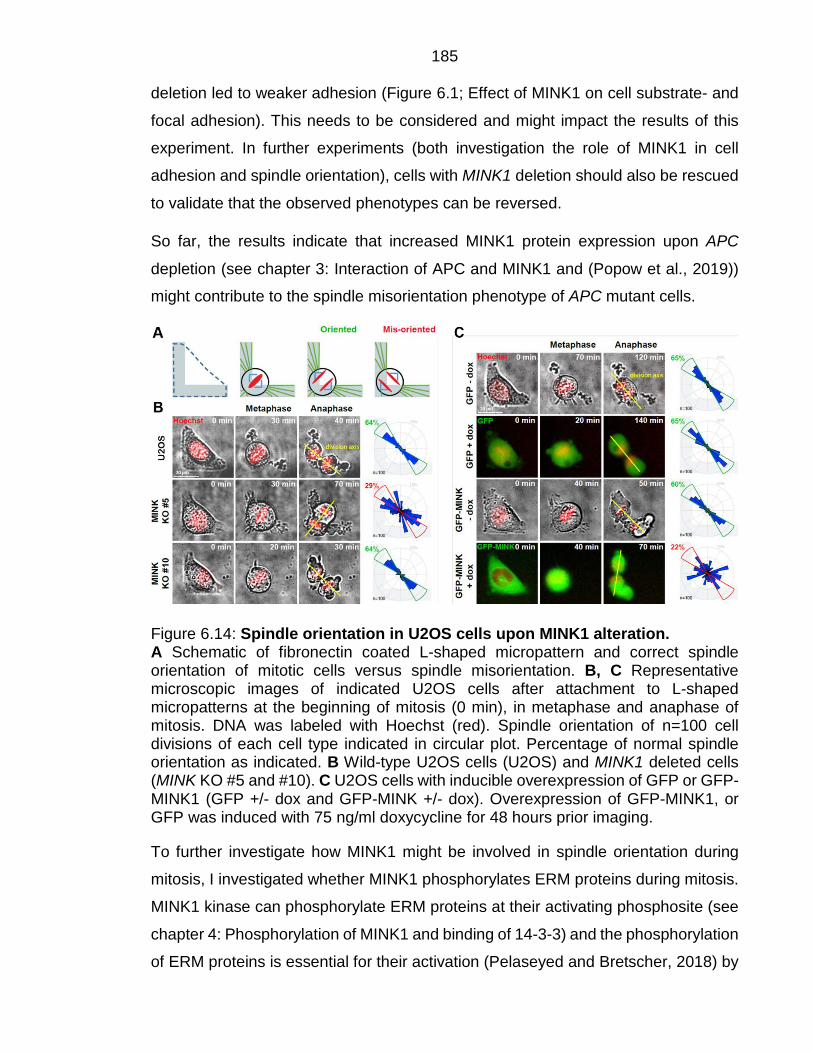
185 deletion led to weaker adhesion (Figure 6.1; Effect of MINK1 on cell substrate- and
focal adhesion). This needs to be considered and might impact the results of this
experiment. In further experiments (both investigation the role of MINK1 in cell
adhesion and spindle orientation), cells with MINK1 deletion should also be rescued
to validate that the observed phenotypes can be reversed.
So far, the results indicate that increased MINK1 protein expression upon APC
depletion (see chapter 3: Interaction of APC and MINK1 and (Popow et al., 2019))
might contribute to the spindle misorientation phenotype of APC mutant cells.
Figure 6.14: Spindle orientation in U2OS cells upon MINK1 alteration. A Schematic of fibronectin coated L-shaped micropattern and correct spindle orientation of mitotic cells versus spindle misorientation. B, C Representative microscopic images of indicated U2OS cells after attachment to L-shaped micropatterns at the beginning of mitosis (0 min), in metaphase and anaphase of mitosis. DNA was labeled with Hoechst (red). Spindle orientation of n=100 cell divisions of each cell type indicated in circular plot. Percentage of normal spindle orientation as indicated. B Wild-type U2OS cells (U2OS) and MINK1 deleted cells (MINK KO #5 and #10). C U2OS cells with inducible overexpression of GFP or GFP-MINK1 (GFP +/- dox and GFP-MINK +/- dox). Overexpression of GFP-MINK1, or GFP was induced with 75 ng/ml doxycycline for 48 hours prior imaging.
To further investigate how MINK1 might be involved in spindle orientation during
mitosis, I investigated whether MINK1 phosphorylates ERM proteins during mitosis.
MINK1 kinase can phosphorylate ERM proteins at their activating phosphosite (see
chapter 4: Phosphorylation of MINK1 and binding of 14-3-3) and the phosphorylation
of ERM proteins is essential for their activation (Pelaseyed and Bretscher, 2018) by
186 causing a conformational change that permits interactions with the cytoskeleton and
membrane proteins (Fehon et al., 2010). Moreover, continuous cycling between
phosphorylated and de-phosphorylated state is essential for normal ERM function
(Roubinet et al., 2011; Viswanatha et al., 2012). It was previously shown that ERM
depletion or over-activation leads to spindle misorientation (Machicoane et al.,
2014). Moreover, the STE20-like serine/threonine-protein kinase (SLK) and the
MINK1 ohnologue MAP4K4 (NIK in mice) can phosphorylate all ERM proteins (ezrin,
radixin and moesin) (Baumgartner et al., 2006; Clucas and Valderrama, 2015;
Machicoane et al., 2014). SLK has also been demonstrated to aid correct ERM
localisation at the mitotic cortex and its depletion leads to spindle misorientation
(Machicoane et al., 2014). SLK, MINK1 and MAP4K4 are all part of the Ste20 kinase
family and the germinal centre kinase (GCK) subfamily, but while MINK1 and
MAP4K4 are part of the GCK subfamily IV (GCK-IV) and have a C-terminal CNH
domain, SLK is part of subfamily V (GCK-V) with a C-terminal AT1-46 homology
domain (ATH) (Dan et al., 2001). Moesin is the only ERM protein expressed in
Drosophila and has been demonstrated to be instrumental in mitotic rounding. The
key function of mitotic rounding is to provide mechanical stability for spindle
formation (McClatchey, 2014). Moreover, the Drosophila homologue of MINK1, msn,
has been demonstrated to phosphorylate and thereby activate Moesin (Plutoni et al.,
2019). In intestinal epithelial cells ezrin is the only ERM protein expressed, and it
has been implicated in centrosome and spindle orientation in colorectal cancer cells
(McClatchey, 2014). Based on this background, I hypothesised that MINK1 might be
involved in spindle orientation, similar to SLK, by phosphorylation of ERM proteins
to support their correct localisation at the cortex of mitotic cells. To test this
hypothesis, I investigated whether MINK1 might influence spindle orientation
through ERM phosphorylation during mitosis. To this end, U2OS cells deleted for
MINK1 or overexpressing MINK1 were arrested in mitosis by treatment with taxol or
nocodazole and compared to DMSO treated and parental control cells. Both taxol
and nocodazole arrest cells in G2/M phase of mitosis, but taxol stabilises microtubule
polymerisation, preventing their disassembly (Wahl et al., 1996), while nocodazole
inhibits microtubule polymerisation and thereby hinders the formation of spindles
(National Center for Biotechnology Information). After mitotic arrest, mitotic cells
187 were lysed and the ratio of phospho-ERM to total ERM protein was measured using
Western blotting. Cells treated with nocodazole or taxol were collected by mitotic
shake-off and lysed similar to DMSO-treated cells. Nocodazole and taxol treated
cells were successfully enriched for mitotic cells, as verified by Western blotting with
an antibody against phospho-histone H3 (S10) (pHH3) (Figure 6.15A and B).
Phosphorylation of histone H3 at serine-10 (pHH3) occurs during late G2 to early
prophase and is important for chromosome condensation and therefore for mitosis.
Dephosphorylation of phospho-histone H3 occurs slowly from late anaphase to early
telophase. Therefore, histone H3 is heavily phosphorylated during metaphase (Kim
et al., 2017). It was however not verified whether the mitotic arrest was uniform. ERM
phosphorylation was investigated by comparing Western blotting signal for phospho-
ERM (pERM) to that of total ERM (ERM). As expected, the ratio of phospho-ERM to
total ERM signal was higher in cells treated with taxol than in cells treated with
DMSO, for all cell types (Figure 6.15A, B and C). The phospho-ERM to total ERM
ratio in U2OS cells deleted of MINK1 and treated with taxol (U2OS MINK1 KO taxol)
was on average lower than for parental cells (U2OS taxol) (Figure 6.15A and C).
However, the phospho-ERM to ERM ratio of cells overexpressing MINK1-GFP and
treated with taxol (U2OS MINK1-GFP +Tet taxol) was on average also lower than
that in control cells (U2OS MINK1-GFP -Tet taxol) (Figure 6.15B and C). Together,
this indicates that both the deletion and overexpression of MINK1 might lead to a
reduction in phosphorylation of ERM proteins during mitosis. This could have
different reasons, if MINK1 directly phosphorylates ERM proteins then MINK1
depletion would logically lead to a decrease in ERM phosphorylation. The decrease
of ERM phosphorylation in MINK1 overexpression might be explained if
overexpressed MINK1 sequesters ERM proteins away from the plasma membrane
or disrupting the normal phosphorylation/dephosphorylation cycle that is essential
for their normal activity (Roubinet et al., 2011; Viswanatha et al., 2012).
To further investigate whether MINK1 and phospho-ERM proteins co-localise during
mitosis, MINK1 deleted U2OS cells (U2OS SEC-C MINK1 KO5), parental cells
(U2OS SEC-C), (un)induced MINK1-GFP overexpressing cells (U2OS MINK1-GFP
+/-Tet) and HeLa cells with endogenous MINK1 tagged with mNeonGreen (HeLa
SEC-C mNeonGreen-MINK1) were fixed and stained with a phospho-ERM (pERM)
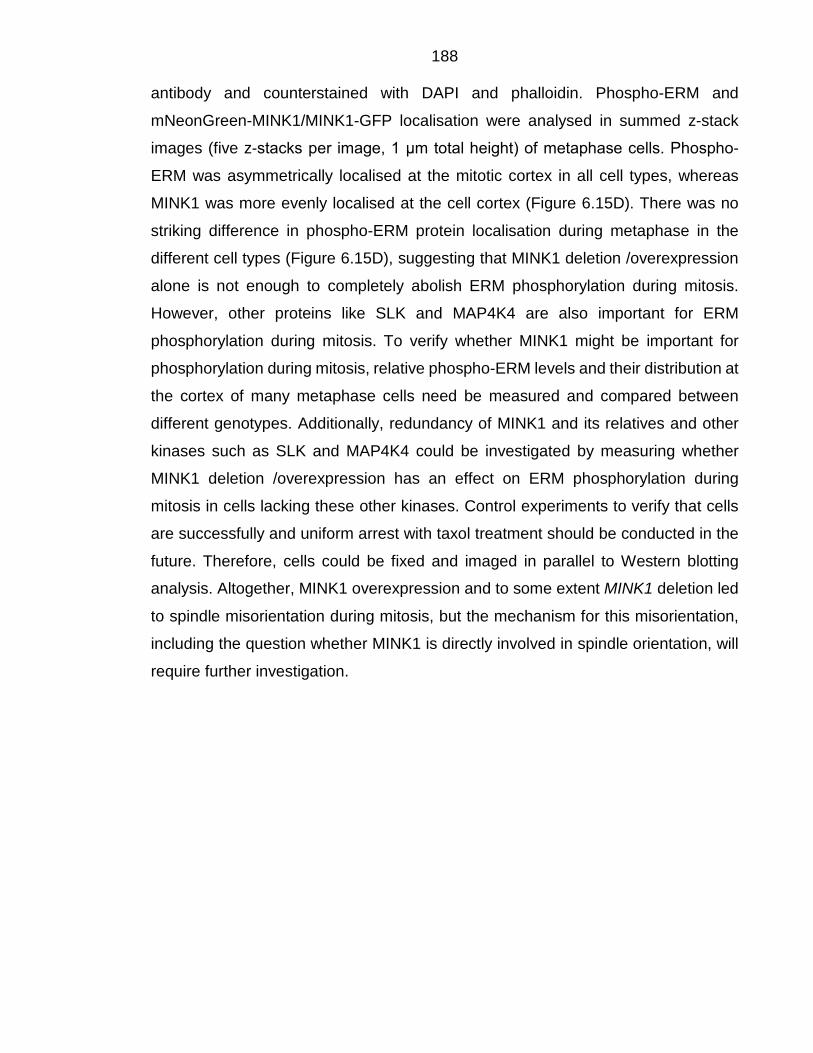
188 antibody and counterstained with DAPI and phalloidin. Phospho-ERM and
mNeonGreen-MINK1/MINK1-GFP localisation were analysed in summed z-stack
images (five z-stacks per image, 1 μm total height) of metaphase cells. Phospho-
ERM was asymmetrically localised at the mitotic cortex in all cell types, whereas
MINK1 was more evenly localised at the cell cortex (Figure 6.15D). There was no
striking difference in phospho-ERM protein localisation during metaphase in the
different cell types (Figure 6.15D), suggesting that MINK1 deletion /overexpression
alone is not enough to completely abolish ERM phosphorylation during mitosis.
However, other proteins like SLK and MAP4K4 are also important for ERM
phosphorylation during mitosis. To verify whether MINK1 might be important for
phosphorylation during mitosis, relative phospho-ERM levels and their distribution at
the cortex of many metaphase cells need be measured and compared between
different genotypes. Additionally, redundancy of MINK1 and its relatives and other
kinases such as SLK and MAP4K4 could be investigated by measuring whether
MINK1 deletion /overexpression has an effect on ERM phosphorylation during
mitosis in cells lacking these other kinases. Control experiments to verify that cells
are successfully and uniform arrest with taxol treatment should be conducted in the
future. Therefore, cells could be fixed and imaged in parallel to Western blotting
analysis. Altogether, MINK1 overexpression and to some extent MINK1 deletion led
to spindle misorientation during mitosis, but the mechanism for this misorientation,
including the question whether MINK1 is directly involved in spindle orientation, will
require further investigation.
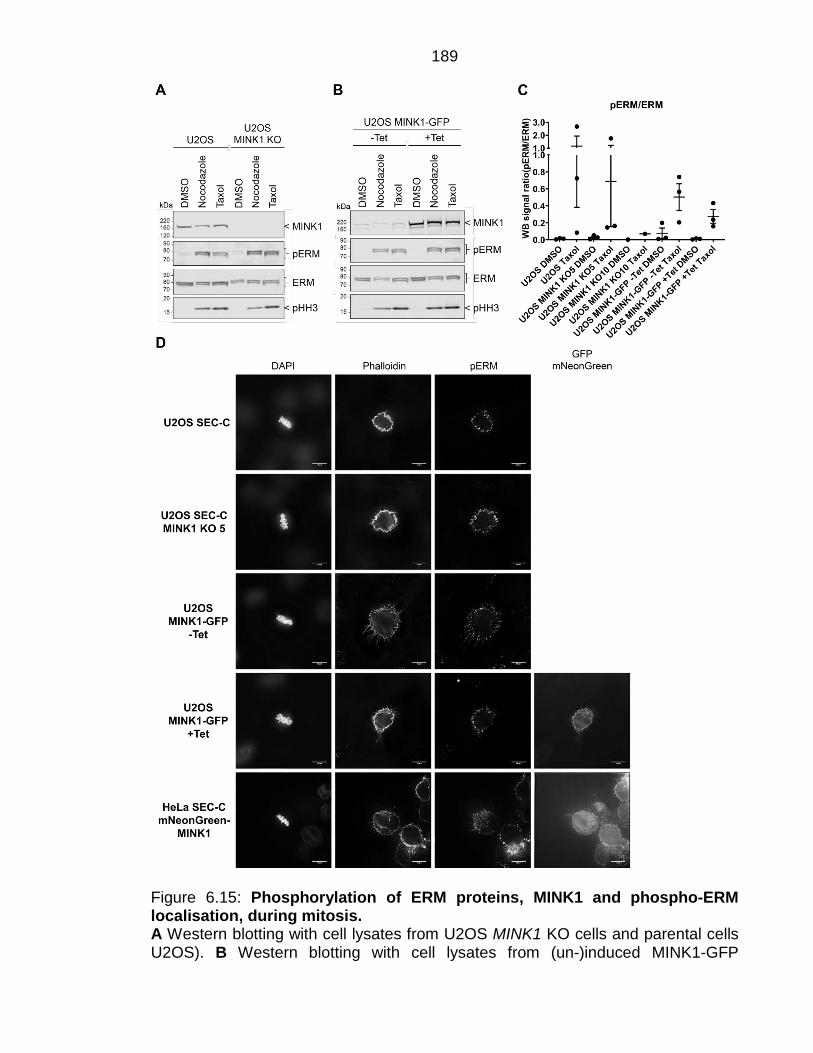
189
Figure 6.15: Phosphorylation of ERM proteins, MINK1 and phospho-ERM localisation, during mitosis. A Western blotting with cell lysates from U2OS MINK1 KO cells and parental cells U2OS). B Western blotting with cell lysates from (un-)induced MINK1-GFP
190 overexpressing cells (U2OS MINK1-GFP +/-Tet). Overexpression of MINK1 was induced with 75 ng/ml tetracycline for 48 hours prior cell lysis. Uninduced cells were cultured in medium with tetracycline-free FBS. A, B Cells were treated with taxol (1.25 μg/ml in DMSO), nocodazole (0.6 μg/ml in DMSO), or DMSO overnight. Western blotting with antibodies against MINK1, phospho-ezrin (Thr567)/radixin (Thr564)/moesin (Thr558) (pERM), ezrin/radixin/moesin (ERM) and phospho-histone H3 (S10) (pHH3). C Quantification of the ratio of phospho-ERM to ERM Western blotting signals of U2OS, U2OS MINK1 KO and U2OS MINK1-GFP +/-Tet cells, treated with DMSO or taxol, using the image studio lite software (version 5.2) from LI-COR. Error bars indicate mean +/- SEM of n=3 (for U2OS MINK1 KO10 cells n=1). D Images of fixed U2OS MINK1 KO cells, parental cells, U2OS MINK1-GFP cells +/- Tet and HeLa SEC-C mNeonGreen-MINK1 cells. Cells were stained with primary phospho-ERM antibody, secondary Alexa Fluor 647 antibody and counterstained with DAPI and phalloidin DyLight 550. Images were acquired on a DeltaVision widefield deconvolution microscope with an Olympus 100x objective lens and the Resolve3D (version: 6.5.2) software from softWoRx. Images show the sum of five z-stacks each. Z-stacks were acquired ever 0.2 μm. Scale bar indicates 10 μm.
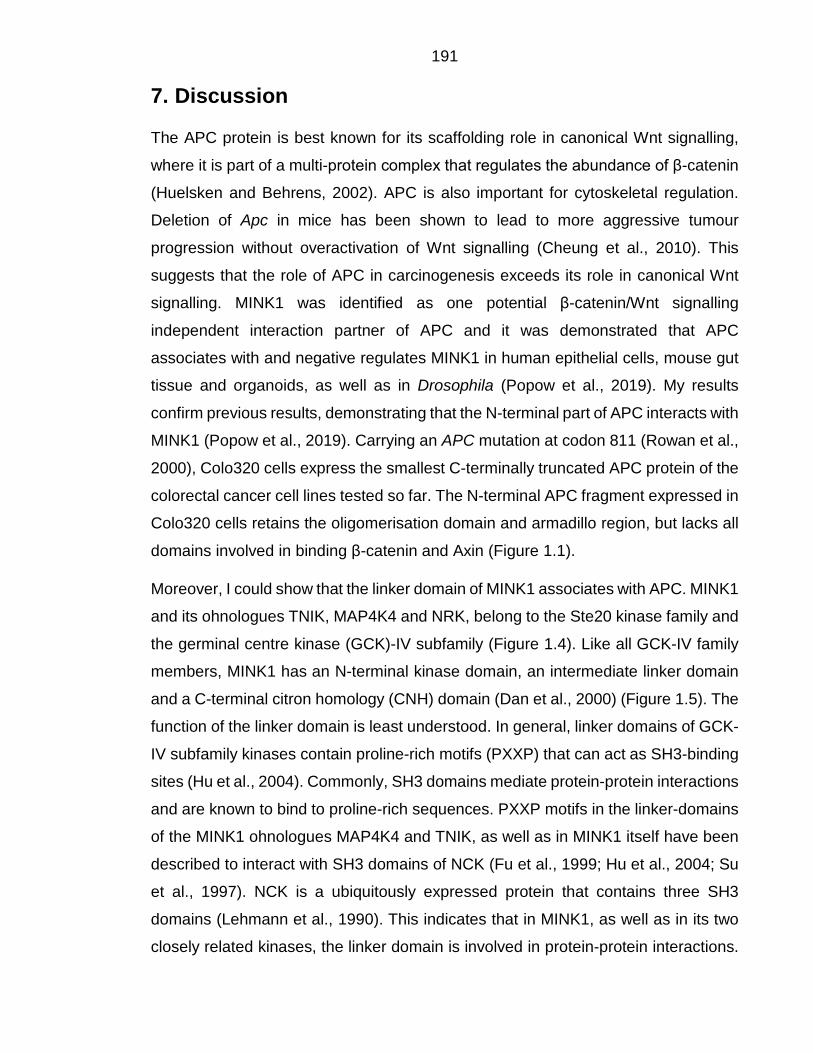
191 7. Discussion
The APC protein is best known for its scaffolding role in canonical Wnt signalling,
where it is part of a multi-protein complex that regulates the abundance of β-catenin
(Huelsken and Behrens, 2002). APC is also important for cytoskeletal regulation.
Deletion of Apc in mice has been shown to lead to more aggressive tumour
progression without overactivation of Wnt signalling (Cheung et al., 2010). This
suggests that the role of APC in carcinogenesis exceeds its role in canonical Wnt
signalling. MINK1 was identified as one potential β-catenin/Wnt signalling
independent interaction partner of APC and it was demonstrated that APC
associates with and negative regulates MINK1 in human epithelial cells, mouse gut
tissue and organoids, as well as in Drosophila (Popow et al., 2019). My results
confirm previous results, demonstrating that the N-terminal part of APC interacts with
MINK1 (Popow et al., 2019). Carrying an APC mutation at codon 811 (Rowan et al.,
2000), Colo320 cells express the smallest C-terminally truncated APC protein of the
colorectal cancer cell lines tested so far. The N-terminal APC fragment expressed in
Colo320 cells retains the oligomerisation domain and armadillo region, but lacks all
domains involved in binding β-catenin and Axin (Figure 1.1).
Moreover, I could show that the linker domain of MINK1 associates with APC. MINK1
and its ohnologues TNIK, MAP4K4 and NRK, belong to the Ste20 kinase family and
the germinal centre kinase (GCK)-IV subfamily (Figure 1.4). Like all GCK-IV family
members, MINK1 has an N-terminal kinase domain, an intermediate linker domain
and a C-terminal citron homology (CNH) domain (Dan et al., 2000) (Figure 1.5). The
function of the linker domain is least understood. In general, linker domains of GCK-
IV subfamily kinases contain proline-rich motifs (PXXP) that can act as SH3-binding
sites (Hu et al., 2004). Commonly, SH3 domains mediate protein-protein interactions
and are known to bind to proline-rich sequences. PXXP motifs in the linker-domains
of the MINK1 ohnologues MAP4K4 and TNIK, as well as in MINK1 itself have been
described to interact with SH3 domains of NCK (Fu et al., 1999; Hu et al., 2004; Su
et al., 1997). NCK is a ubiquitously expressed protein that contains three SH3
domains (Lehmann et al., 1990). This indicates that in MINK1, as well as in its two
closely related kinases, the linker domain is involved in protein-protein interactions.
192 PXXP motifs in the linker-domain of MINK1 might be involved in interactions with
other proteins. Using mass spectrometry, I identified multiple proteins that co-
immunoprecipitated with MINK1 from lysates of MINK1 overexpressing cells (Table
8.1). One of them was the E3 ubiquitin-protein ligase SH3RF3. Another one was
SH3 domain-binding protein 1 (SH3BP1), a GTPase activating protein (GAP) that
belongs to the RhoGAP family and has been demonstrated to be important for cell
migration through interaction with RAC1 (Parrini et al., 2011). Another SH3 domain
protein that co-immunoprecipitated with MINK1 was the Arf-GAP with SH3 domain
ANK repeat and PH domain-containing protein 2 (ASAP2), which activates the small
GTPases ARF1/5/6. ASAP2 has been described to regulate formation of post-Golgi
vesicles and to be involved in regulating the subcellular localisation of paxillin,
implicating it in focal adhesion assembly and cell migration (Andreev et al., 1999;
Kondo et al., 2000). Endophilin-A2 has been implicated in endocytosis (Renard et
al., 2015) and also co-immunoprecipitated with MINK1. The interaction between
these proteins and MINK1 add further links between MINK1 and the machinery that
regulates cell migration.
193 Biological functions of MINK1 kinase
I also found that binding of 14-3-3 proteins to MINK1 depends on phosphorylation of
residues in the linker domain of MINK1. Interestingly, both the interaction of MINK1
with APC and 14-3-3-binding to MINK1, rely on the linker domain of MINK1.
However, binding of 14-3-3 to phosphorylated sites on MINK1 did not affect the
association of APC and MINK1. However, 14-3-3-binding to MINK1 was reduced
upon APC depletion, indicating that the association between APC and MINK1 might
impact on 14-3-3-binding to MINK1. This could be a steric effect, or the association
between APC and MINK1 could inhibit MINK1 phosphorylation of the 14-3-3-binding
phosphosites S674 and S701, and thus indirectly impact 14-3-3-binding to MINK1.
On the other hand, 14-3-3-binding to MINK1 was observed in in vitro kinase assay
in the absence of APC, suggesting that APC is not necessary for 14-3-3-binding in
vitro. However, it might be important in vivo and could for example influence protein
conformation, or folding of MINK1. To answer this question, it will be necessary to
determine whether APC and MINK1 interact directly or indirectly, first. This will be
aided by knowing the precise sites on both MINK1 and APC that facilitate their
association. One possible approach to investigate this would be to express
increasingly smaller fragments of the N-terminal regions of APC and the linker
domain of MINK1 (with a GFP-tag) in cells, and then to measure their interaction
using co-immunoprecipitation (via GFP-Trap beads). There are many methods to
investigate protein-protein interactions, which could be used to determine whether
MINK1 and APC interact directly or indirectly, and more generally whether MINK1
exists in a complex in vivo. One approach to investigate the latter would be to subject
both, isolated recombinant protein (GST-MINK1) and cell extract to gel filtration.
Using Western blotting with antibodies to compare which fractions contain purified
and endogenous MINK1 would reveal whether endogenous MINK1 exists as a
complex or multimer in vivo. To investigate whether APC and MINK1 interact directly,
one possible in vivo approach would be yeast two-hybrid screening. The knowledge
of how APC and MINK1 interact and knowing the precise sites on both proteins that
facilitate their association can help solve the question how APC regulates
abundance of MINK1. Moreover, it could give insight into biological functions of
MINK1 by allowing to generate specific tools that interfere with the interaction. APC
194 might be important for MINK1 activity, by facilitating MINK1 phosphorylation through
either interaction with an upstream kinase that phosphorylates MINK1, or
conformational changes of MINK1. The interaction between APC and MINK1 might
also be important for 14-3-3-binding to MINK1, as my results indicated reduced 14-
3-3-binding to MINK1 upon APC depletion. The interaction between APC and MINK1
could also be responsible for targeting MINK1 for degradation, which would explain
the negative regulation of MINK1 protein levels by APC (Popow et al., 2019).
I found that the three kinases protein kinase A (PKA), microtubule affinity regulating
kinase 3 (MARK3) and MARK4 and also the small protein 14-3-3 likely influence
MINK1 activity. I demonstrated that PKA, MARK3 and MARK4 directly phosphorylate
MINK1S674 and S701 sites in the linker domain, which leads to14-3-3-binding to
these phosphorylated sites. To confirm that S674 and S701 are indeed the MINK1
phosphosites 14-3-3 dimers bind to, a MINK1 double-mutant with both phosphosites
involved in 14-3-3-binding mutated to alanine (S674A and S701A) should be
generated. To validate that these two serine residues are indeed the two
phosphosites on MINK1 responsible for 14-3-3-binding, I would use the MINK1
double mutant (MINK1 S674A, S701A) as a substrate for PKA and/or MARK3/4
kinases in in vitro kinase assays and test whether 14-3-3-binding to MINK1 is
completely abolished upon the mutation of both sites. It would also be beneficial to
raise phosphospecific antibodies against MINK1 pS764 and pS701, to quantify the
phosphorylation of these phosphosites. In the next step, I would like to test whether
14-3-3-binding to MINK1 impacts on its kinase activity. Therefore, I would use in vitro
kinase assay with MINK1, the ERM peptide (as substrate) and 14-3-3. Since MINK1
will need to be phosphorylated for 14-3-3 to bind I would also include PKA or
MARK3/4 for direct phosphorylation of MINK1. Together with all relevant controls
this should indicate whether 14-3-3-binding to MINK1 impacts on its kinase activity.
If this turns out be the case, it would also be possible to use Michaelis-Menten
enzyme kinetics to determine the difference in kinase activity with versus without 14-
3-3. The MINK1 double-mutant with both 14-3-3-binding sites mutated to alanine
(MINK1 S674A, S701A) could serve as a negative control and I would also include
a kinase dead mutant of MINK1 (K54R) as negative control. Supporting the
hypothesis that 14-3-3-binding to MINK1 might be important for its kinase activity, it
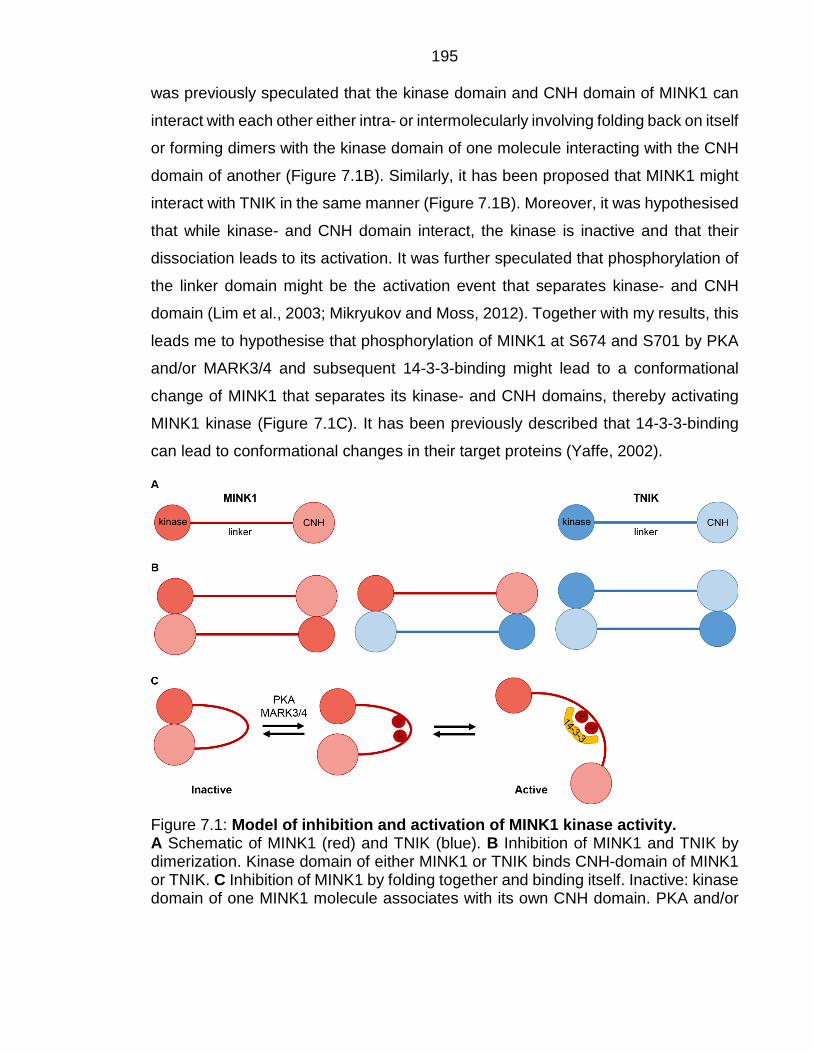
195 was previously speculated that the kinase domain and CNH domain of MINK1 can
interact with each other either intra- or intermolecularly involving folding back on itself
or forming dimers with the kinase domain of one molecule interacting with the CNH
domain of another (Figure 7.1B). Similarly, it has been proposed that MINK1 might
interact with TNIK in the same manner (Figure 7.1B). Moreover, it was hypothesised
that while kinase- and CNH domain interact, the kinase is inactive and that their
dissociation leads to its activation. It was further speculated that phosphorylation of
the linker domain might be the activation event that separates kinase- and CNH
domain (Lim et al., 2003; Mikryukov and Moss, 2012). Together with my results, this
leads me to hypothesise that phosphorylation of MINK1 at S674 and S701 by PKA
and/or MARK3/4 and subsequent 14-3-3-binding might lead to a conformational
change of MINK1 that separates its kinase- and CNH domains, thereby activating
MINK1 kinase (Figure 7.1C). It has been previously described that 14-3-3-binding
can lead to conformational changes in their target proteins (Yaffe, 2002).
Figure 7.1: Model of inhibition and activation of MINK1 kinase activity. A Schematic of MINK1 (red) and TNIK (blue). B Inhibition of MINK1 and TNIK by dimerization. Kinase domain of either MINK1 or TNIK binds CNH-domain of MINK1 or TNIK. C Inhibition of MINK1 by folding together and binding itself. Inactive: kinase domain of one MINK1 molecule associates with its own CNH domain. PKA and/or
196 MARK3/4 phosphorylate MINK1 on S674 and S701. Activation of MINK1 kinase activity through phosphorylation and subsequent 14-3-3-binding.
In my experiments, 14-3-3-binding to MINK1 was reduced upon APC depletion,
which raises the question whether the association between APC and MINK1 is
involved in 14-3-3-binding to MINK1. To investigate this further, it would also be
helpful to know whether APC and MINK1 interact directly. If APC and MINK1 interact
directly and my hypothesis that the kinase-domain and CNH-domain of MINK1
interact, which leads to an inactivation of the kinase (Figure 7.1C), is correct, it would
be possible that the phosphorylation of MINK1 at residues S674 and S701 releases
the interaction between kinase- and CNH domain and in turn the association with
APC might help to separate the two domain and enable 14-3-3-binding to MINK1. It
is also possible that the 14-3-3-dimers bind to one phosphosite on MINK1 and
another phosphosite on APC. To further investigate these questions and
hypotheses, GFP-tagged MINK1 single- (MINK1 S674A or MINK1 S701A) and
double mutants (MINK1 S674A, S701A) could be expressed in MINK1 deleted U2OS
cells. I would also include MINK1-GFP overexpressing cells as positive control.
Expression levels of all MINK1 constructs will have to be equal, which can be
achieved by manipulating the amount of transfected mutant MINK1 and the induction
of MINK1-GFP with various concentrations of tetracycline. Once equal MINK1
mutant and overexpression are achieved, I would immunoprecipitate MINK1 from
lysates with GFP-Trap beads and investigate both 14-3-3-binding using far-Western
blotting and co-immunoprecipitation of APC with Western blotting, and compare
mutant MINK1 cells to MINK1 overexpressing cells (positive control). This could
verify, whether S674 and S701 are 14-3-3-binding sites on MINK1 in vivo. Moreover,
from my results showing that APC interaction with MINK1 was not altered upon 14-
3-3-binding, I would expect APC co-immunoprecipitation not to change. Mass
spectrometry analysis of these immunoprecipitated lysates could also aid the
investigation for the function of 14-3-3-binding to MINK1. Once the precise sites on
MINK1 for the interaction with APC are identified it would be possible to rescue
MINK1 deletion in cells with full-length MINK1 fragments around these sites, or with
mutants of MINK1 at these sites. Afterwards, I would investigate whether this
impacts 14-3-3-binding to MINK1. This could further inform the question whether the
197 association between APC and MINK1 is important for 14-3-3-binding to MINK1.
Three kinases, PKA and MARK3/4, directly phosphorylate MINK1 on at least two
serine residues and this phosphorylation enables 14-3-3-binding to MINK1. This
provides insight into signalling pathways MINK1 might be involved in. PKA has many
substrates and is therefore involved in many signalling pathways, including roles in
cell cycle regulation, cell proliferation, cytoskeleton remodelling. MARK3 has been
linked to epithelial cell polarity (Sandí et al., 2017). However, knowing MINK1 kinase
substrates would be even more informative, to understand MINK1 function. So far,
the planar cell polarity (PCP) proteins Prickle-like protein 1 (PRICKLE1) and
PRICKLE2 and the transcription factors SMAD1/2 have been described as MINK1
kinase substrates (Daulat et al., 2012; Fu et al., 2017; Kaneko et al., 2011).
Additionally, previous work in our lab demonstrated that MINK1 could phosphorylate
an ERM peptide in vitro (Popow, 2016). This indicates that MINK1 phosphorylates
ERM peptides at the activation threonine residue (T567/T564/T558) in vitro. This is
in line with a recent study in Drosophila demonstrated that misshapen (msn), the
Drosophila homologue of MINK1, phosphorylates Moesin, the only ERM protein
expressed in Drosophila (McCartney and Fehon, 1996), on its activating phosphosite
(T556). The authors also demonstrate that msn is important for the regulation of
protrusion restriction in Drosophila border cells (Plutoni et al., 2019). In mammals
the three ERM homologues, ezrin/radixin/moesin, are widely expressed in all tissues
and have overlapping functions (McClatchey, 2014). However, epithelial cells
predominantly express ezrin and in the intestinal epithelium only ezrin has been
detected (Pelaseyed and Bretscher, 2018). I demonstrated that MINK1
phosphorylates ERM peptides including the conserved activating threonine residue
(T567/T564/T558) in in vitro kinase assays. The same peptide containing a serine
residue instead of the threonine (ERM T567/564/558S) was phosphorylated about
10-fold less well by MINK1 and Michaelis-Menten kinetics of MINK1 with either
substrate resulted in much higher substrate affinity for the ERM peptide than for the
ERM T567/564/558S peptide (Km(ERM) = 194 μM, Km(ERM) = 3612 μM). This
indicates that MINK1 can phosphorylate peptides representing the activating domain
of ERM proteins only when the activating threonine residue is present, and thus
MINK1 might be a threonine-selective kinase. Moreover, in a mass spectrometry
198 experiment that aimed to identify proteins that co-immunoprecipitate with GFP-
MINK1, I also found ERM proteins (Table 8.1 (in the Appendix)), consistent with the
idea that MINK1 interacts with and phosphorylates ERM proteins. I investigated this
further comparing phosphorylated ERM protein levels in U2OS cells with different
MINK1 protein levels. This experiment did not reveal any differences in the relative
amount of phosphorylated ERM proteins in vivo in U2OS cells. ERM proteins also
play an essential role in mitotic spindle formation, orientation and function
(McClatchey, 2014). I demonstrated together with Prof Maxwell’s group that MINK1
overexpressing U2OS cells misorient their spindles. Spindle orientation was guided
using fibronectin coated L-shaped micropatterns, which in control cells directed
spindle orientation along a specific axis. However, in MINK1-overexpressing cells
spindle orientation was completely random. Similarly, APC depletion or mutation has
been previously demonstrated to also cause spindle misorientation during mitosis.
APC forms a complex with the spindle assembly check-point proteins Bub1 and
BubR1 and these kinases phosphorylate APC in vitro (Kaplan et al., 2001).
Moreover, expression of truncated APC fragments leads to abnormal chromosome
segregation, thought to be caused by the inability of proper microtubule plus-end
attachment and disorganization of the microtubule network, which leads to an
inhibition of congression in metaphase (Dikovskaya et al., 2004; Green and Kaplan
2003; Green et al., 2005). It has been demonstrated that APC depleted cells show
mitotic spindle assembly checkpoint defects leading to an accumulation of polyploid
cells (Dikovskaya et al., 2004). Loss of APC has been shown to also decrease
apoptosis (Dikovskaya et al., 2004). In combination these two defects, triggered by
loss of APC, increase polyploidy. The increase in misaligned spindles in MINK1
overexpressing cells, is consistent with the idea that the upregulation of MINK1 that
results from loss of APC may be at least partially responsible for the mitotic defects
in APC mutant cells. Further evidence for a role for MINK1 in mitosis, was provided
by experiments showing that overexpression of MINK1 leads to prolonged
cytokinesis. This was demonstrated measuring progression through mitosis in
control cells, MINK1 deleted cells and MINK1 overexpressing cells by using phase
contrast recordings. For this analysis, three undergraduate students in our group
independently analysed blinded data and measured the time cells needed to
199 complete different stages of mitosis, including the time required from the appearance
of a cleavage furrow to completion of cytokinesis (data not shown). Another study
previously demonstrated that MINK1 deletion leads to prolonged cytokinesis and
cells lacking MINK1 were impaired in abscission leading to multinucleated cells
(Hyodo et al., 2012). This suggests a role of MINK1 in cytokinesis, with both too
much and too little MINK1 prolonging the process and causing more frequent failures
to complete it. APC associates with and negatively regulates MINK1 (Popow et al.,
2019) and both APC mutation and MINK1 overexpression cause spindle
misorientation. Additionally, APC mutation and MINK1 deletion both lead to
multinucleated cells. Therefore, the interaction between APC and MINK1 might
impact on spindle orientation and cytokinesis. ERM proteins could be one target of
MINK1 that could explain this relationship. However, I could not find evidence that
MINK1 phosphorylates ERM proteins in U2OS cells so far, not even in mitotically
arrested cells. One possible explanation for this is that MINK1 phosphorylates ERM
proteins only during a specific stage of the cell cycle that was not represented in the
conditions I used. The interaction between APC and MINK1 might also be important
for cytokinesis independent of ERM proteins. Moreover, both APC and MINK1
interact with proteins of striatin-interacting phosphatase and kinase (STRIPAK)
protein complexes. STRN4 is a STRIPAK complexes component and a regulatory
subunit of protein phosphatase 2A (PP2A), and STRN4 depletion has been
previously demonstrated to induce multinucleated cells and to inhibit abscission
during cytokinesis, similar to MINK1 depletion (Hyodo et al., 2012). STRIPAK
complexes are involved in a wide range of cellular processes and signalling
pathways, depending on their interaction. MINK1 has been previously suggested to
impact on cytokinesis through its interaction with the STRIPAK protein zinedin
(STRN4). My results indicated that STRN4 associates with MINK1 in U2OS cells. In
a co-immunoprecipitation experiment with lysates from U2OS cell overexpressing
GFP-MINK1 and subsequent mass spectrometry analysis of co-immunoprecipitated
proteins, STRN4 was co-immunoprecipitated with MINK1 (Table 8.1 (in the
Appendix)). APC has been reported to interact with the striatin family members, too,
specifically striatin (STRN), S/G2 nuclear autoantigen (STRN3) and STRN4, and
thus also interacts with STRIPAK complexes (Breitman et al., 2008; Hwang and
200 Pallas, 2014). Therefore, STRIPAK complexes might be a good starting point to
further investigate the involvement and interaction of APC and MINK1 in spindle
orientation and cytokinesis. To investigate whether the association between MINK1
and APC is altered during mitosis, cells could be arrested in mitosis (e.g. with taxol)
and the association could be investigated using co-immunoprecipitation, similar to
previous experiments.
ERM proteins are also involved in cell migration through signal transmission from
membrane receptors to the actin cytoskeleton. It is not yet clear how ERM proteins
impact the reorganisation of the actin cytoskeleton during cell migration, but the
general idea is that phosphorylation of ERM proteins is instrumental to recruit
regulatory proteins for actin polymerisation (Arpin et al., 2011). The MINK1
ohnologue, MAP4K4, has been shown to directly phosphorylate ERM proteins
providing a signalling mechanism for controlling growth factor-induced membrane
protrusion and cell morphology (Baumgartner et al., 2006). Moreover, msn, the
Drosophila homologue of MINK1, has been shown to impact cell migration by
regulation of protrusion restrictions through phosphorylation and consequent
activation of Moesin, the only ERM protein expressed in Drosophila (Plutoni et al.,
2019). MINK1 has also been previously implicated in cell migration and it was
demonstrated that HT1080 cells expressing a kinase-dead mutant of MINK1 (K54R)
take significantly longer to close a wound (in a wound-healing scratch assay) than
cells expressing wild-type MINK1 (Hu et al., 2004). My results indicate that MINK1
contributes to cell migration, however the molecular mechanism behind this needs
further investigation. Moreover, during intestinal tumour formation, caused by APC
mutation, mutant cells are surrounded by healthy cells which they need to
outcompete. Therefore, faster cell migration, like in MINK1 overexpressing cells,
might give cancer cells an advantage over their wild-type neighbours. However, in
the gut epithelium faster migration up the villi would lead to faster shedding of the
cells into the gut lumen. APC mutant cells have been shown to have migrate defects
and to migrate slower or not at all (upward) (Dikovskaya et al., 2001; Näthke et al.,
1996). Apc mutant cells are also less adherent and move less coordinated, allowing
mutant cell to not only migrate up the villi but also sideways and to eventually even
invade underlying tissue. This was shown in mice with chimeric overexpression of
201 APC, which causes disordered migration of intestinal epithelial cells and decreases
cell adhesion (Wong et al., 1996). The opposite was observed upon chimeric
overexpression of E-cadherin, which leads to highly ordered migration and to
stronger adhesion in mouse intestinal epithelium (Hermiston et al., 1996). To further
investigate how MINK1 might be involved in cell migration, I would like to investigate
the role of MINK1 in cell adhesion. I would analyse whether cell adhesions change
upon MINK1 deletion or overexpression, by quantifying adhesion proteins, like β-
catenin, E-cadherin and claudins, in cell contacts with immunofluorescence staining.
Moreover, it would be interesting to investigate whether MINK1 protein levels are
decreased upon APC overexpression. Additionally, cell competition has been
previously linked to many cancers and it has been described that cancer cells show
features to outcompete or kill surrounding wild-type cells (Suijkerbuijk et al., 2016;
Vivarelli et al., 2012). Therefore, MINK1 overexpression could give APC mutant cells
a competitive advantage over surrounding cells. This could be tested in co-culture
competition migration analysis. Therefore, MINK1-GFP overexpressing cells could
be co-cultured with wild-type U2OS cells. The GFP-tag can be used to identify cells
with MINK1 overexpression. I would use image analysis and PIV to analyse whether
MINK1 overexpressing cells and wild-type cells mix, or whether one population
outcompetes the other. Different densities of cells and co-culture ratios should be
tested in this context. Afterwards, I would investigate these co-cultures in a migrating
situation. Given that MINK1 overexpressing cells migrate faster than wild-type U2OS
cells, I would investigate whether MINK1 overexpressing cells act as leader cells at
the migrating front. Furthermore, it was not yet investigated whether MINK1
expression is altered by overexpression of APC, however APC negatively regulates
MINK1 (Popow et al., 2019) and MINK1 overexpression leads to bigger correlation
clusters, while MINK1 deletion leads to smaller correlation cluster and APC
overexpression leads to decreased correlation (Wong et al., 1996). Therefore,
MINK1 might contribute to migration defects observed in APC mutant cells that
contribute to the cancer development in intestinal epithelium. On the other hand,
APC mutation or depletion leads to migration defects in epithelial cells, which
prevents cell from migrating up from the crypt region to the top of the villi. This leads
to an accumulation of cells in the crypt region (Dikovskaya et al., 2001; Näthke et
202 al., 1996). This phenotype may be linked to the role of APC in binding microtubules
and focal adhesion turnover. APC binds and bundles microtubules and interacts with
other microtubule plus-end tracking proteins (+TIPs) and these protein complexes
further promote microtubule polymerisation (Dikovskaya et al., 2004; Juanes et al.,
2017; Kroboth et al., 2007) (Figure 6.2). Therefore, APC depletion/mutation leads to
decreased migration, whereas MINK1 overexpression leads to faster migrating of
cells. This is contrary to what was expected based on the idea that increasing MINK1
expression is responsible for some of effects of APC depletion or mutation. However,
the complexity of the molecular processes that govern migration, particularly the
coordinated migration of epithelial cells, makes such a simple relationship unlikely.
Regardless, my data is consistent with the idea that MINK1 plays are role in cell
migration that may be independent of its association with and negative regulation by
APC and cell migration in gut epithelium might be more complex than can be
analysed from migration of an isolated monolayer of epithelial cells grown in a plastic
dish. Data from Mink1 knockout mice suggest that MINK1 is not crucial for migration
of epithelial cells, as they are viable (Li et al., 2019; Yue et al., 2016).
Another crucial factor influencing cell migration is adhesion of cells to their substrate,
and APC plays a role in the dynamics of focal adhesions. APC directly binds to actin
and using the same APC domain that binds microtubules is proposed to bind and
bundle F-actin (Moseley et al., 2007). APC can directly nucleate actin and has been
shown to be involved in phosphorylation of focal adhesion kinases paxillin and FAK,
which is important for the disassembly and turnover of focal adhesions (Juanes et
al., 2017). I aimed to determine whether the negative regulation of MINK1 by APC
might also play a role in focal adhesion turnover. If this was the case, I would have
expected MINK1 overexpression to have the same or at least a similar effect on focal
adhesion turnover as APC depletion or mutation. So far, my experiments did not
reveal a role for MINK1 in focal adhesion turnover. However, previous studies
demonstrated that MINK1 ohnologue, MAP4K4, is involved in focal adhesion
disassembly, both in epithelial and endothelial cells, where it interacts with and
activates ezrin and moesin, respectively (Vitorino et al., 2015; Yue et al., 2014). To
investigate whether MINK1 has overlapping or similar function, the dynamics of focal
adhesion in MINK1 deleted and overexpressing cells need to be measured and
203 related to phosphorylation of ERM proteins by MINK1 in vivo. In its role in focal
adhesion disassembly, MAP4K4 associates with the +TIP protein ending binding 2
(EB2) and IQ motif and SEC7 domain-containing protein 1 (IQSEC1). IQSEC1 is a
GEF which has specificity for the small GTPase ADP-ribosylation factor 6 (Arf6). At
focal adhesions Arf6 regulates internalisation and trafficking of integrins (Schweitzer
et al., 2011). Consequently, depletion of IQSEC1 leads to accumulation of integrin
receptors on the cell surface and stabilises cell adhesions to the extracellular matrix
(Dunphy et al., 2006). Therefore, another starting point to investigate whether MINK1
is involved in focal adhesion turnover would be to investigate whether MINK1
interacts with microtubules and/or +TIP proteins, similar to MAP4K4. So far, I did not
identify an interaction between MINK1 and EB2, or IQSEC1 from my
immunoprecipitation and mass spectrometry experiment from MINK1
overexpressing cells. EB2 shares significant homology with EB1, which has been
shown to bind APC (Su et al., 1995). Moreover, it has not yet been investigated
whether the APC function on focal adhesion turnover is linked to the function of
MAP4K4. My experiments indicated a slight but not significant upregulation of
MAP4K4 upon APC depletion on the protein level, but not the RNA level.
MINK1 has other biological functions that seem to be independent of APC. A recent
study demonstrated that MAP4Ks are part of the expanded Hippo pathway. Previous
studies demonstrated that both the Drosophila homologue of MINK1, msn, and the
mammalian ohnologue, MAP4K4, are involved in Hippo signalling. Therefore, I
investigated whether MINK1 on its own is also involved in Hippo signalling. My
results did not indicate that MINK1 was involved in Hippo signalling. However, a
recent study demonstrated that MAP4K1/2/3/4/6/7 directly activate large tumour
suppressor 1/2 (LATS1/2) and the combined deletion of MAP4Ks and mammalian
Ste20-like kinases 1/2 (MST1/2) suppresses LATS1/2 phosphorylation, indicating
overlapping functions of MAP4Ks and MST1/2 (Meng et al., 2015). This explains
why the deletion of MINK1 on its own did not show an effect on YAP phosphorylation.
Moreover, it provides evidence for at least one overlapping function between MINK1
(MAP4K6) and its ohnologues TNIK (MAP4K7) and MAP4K4. MINK1 and its
ohnologues show high sequence homologies, which raises the question whether
they share additional overlapping functions. They might for example have similar
204 functions but in different tissues, or at different developmental stages (Force et al.,
1999). The overlapping function of MAP4Ks in Hippo signalling are an example of
MINK1 and its ohnologues compensating for each other. Investigating the possibility
that MINK1 ohnologues might compensate for MINK1 deletion, I found TNIK protein
levels to be increased in one MINK1 knockout clone, but not another. Likewise,
Mink1 RNA expression has been shown to be upregulated upon Tnik deletion in
Tnik-/- mice (Masuda et al., 2016b). Another study in human umbilical vein
endothelial cells (HUVEC) demonstrated that depletion of MAP4K4 with siRNA did
not change RNA expression of MINK1, or TNIK, likewise TNIK siRNA treatment did
not change MINK1, or MAP4K4 expression. In another case, MINK1 depletion with
siRNA increased TNIK RNA expression (Vitorino et al., 2015). Together, this
indicates that MINK1 and it ohnologues likely compensate for each other, but this
appears to be a mild effect, that also seems to be highly context dependent.
However, it indicates that it is important to consider all sister ohnologues, when
investigating the function of one of these proteins.
205 Wnt signalling
APC is scaffolding protein in canonical Wnt signalling and part of the β-catenin
destruction complex. APC mutation compromises its inability to aid β-catenin
phosphorylation, and therefore causes overactivation of Wnt signalling through
constitutive activation of TCF/β-catenin complexes (Huelsken and Behrens, 2002;
Seidensticker and Behrens, 2000). It was previously established in our group that
the negative regulation of MINK1 by APC is independent of β-catenin/Wnt signalling
(Popow et al., 2019). The MINK1 ohnologue, TNIK, has been demonstrated to be
involved in canonical Wnt signalling by phosphorylating TCF4 (TCF7L2) at S154
(Shitashige et al., 2010). Additionally, my results demonstrate that TNIK protein
levels were increased upon MINK1 deletion, indicating that TNIK might compensate
for MINK1 in this context. Together, with the high sequence homology of both
kinases this might suggest overlapping function for both proteins. I found no
indication that MINK1 is directly involved in canonical Wnt signalling. However, I only
measured Wnt signalling activity at in baseline conditions and did not determine
whether the ability to respond to Wnt ligands was altered in MINK1 overexpressing
or deleted cells. I did however compare baseline RNA and protein levels of common
Wnt targets in U2OS cells that expressed various amounts of MINK1 (MINK1
deletion, endogenous MINK1 level and MINK1 overexpression) and compared their
response to APC depletion, which was expected to induce Wnt overactivation. My
RT-qPCR results demonstrated that Axin2 mRNA expression is significantly reduced
in the absence of MINK1 in U2OS cells, which indicates that MINK1 might affect
transcriptional Axin2 expression. So far, I could not find any evidence that MINK1
influences translational Axin2 expression. Western blotting with lysates of MINK1
deleted U2OS cells did not show significant differences in Axin2 protein levels, and
I could not identify Axin2 in my proteomics experiment from co-immunoprecipitation
with GFP-MINK1. Indicating that Axin2 and MINK1 are not associated in U2OS cells,
or that Axin2 protein levels were too low to permit detection. However, Axin2 is a
Wnt signalling target gene and the Axin2 protein negatively regulates β-catenin
(Figure 6.5). Therefore, MINK1 would not need to interact with Axin2 directly to
activate it and could potentially activate Axin2 (and other Wnt target genes) through
phosphorylation of transcription factors, similar to its ohnologue TNIK. On the other
206 hand, my in vitro kinase assay results suggest that MINK1 is a threonine-selective
kinase, which could explain why MINK1 does not phosphorylate TCF4,
distinguishing it from TNIK. To test this idea would require using in vitro kinase assay
of TCF4 peptide substrates and comparing mutant TCF4 peptides where the serine
is replaced by a threonine (S154T). Moreover, MINK1 has to interact with TCF4 in
order to phosphorylate this transcription factor, which is located in the nucleus. My
results suggest that MINK1 is predominantly located in the cytosol and membrane
and only very little resides in the nucleus. However, even small amounts of MINK1
in the nucleus could interacts with and/or phosphorylate transcription factors.
Moreover, TNIK has been shown to interact with TCF4 via its kinase domain
(Mahmoudi et al., 2009). The kinase domain is conserved between the four
ohnologues (MINK1, TNIK, MAP4K4 and NRK) (Becker et al., 2000; Dan et al.,
2000). While TNIK, MINK1 and MAP4K4 are expressed in mouse intestinal crypts,
only TNIK seems to interact with and phosphorylate TCF4 (Mahmoudi et al., 2009).
One explanation for this might be that only TNIK can enter the nucleus, or another
one would be that TNIK binds to β-catenin through its linker domain (Mahmoudi et
al., 2009), which is the most diverse domain between the four ohnologues (MINK1,
TNIK, MAP4K4 and NRK) (Becker et al., 2000; Dan et al., 2000). The interaction
between TNIK and β-catenin is important for the interaction and phosphorylation of
TCF4 by TNIK (Mahmoudi et al., 2009). Thus, it might further explain why only TNIK,
and none of its ohnologues, are involved in canonical Wnt signalling.
207 MINK1 and colorectal cancer
To further verify whether MINK1 contributes to tumour formation and colorectal
cancer progression induced by APC mutations a conditional Mink1 deletion mouse
was commissioned from Taconic. The aim was to use such mice to create an
intestinal-specific Mink1 knockout mouse by crossing the conditional Mink1 deletion
allele mice to Villin-Cre mice (VilCre;Mink1fl/fl). Additionally, I planned to use these
VilCre;Mink1fl/fl mice to determine the contribution of MINK1 to the phenotype of APC
mutations on intestinal tumorigenesis. Specifically, the aim was to cross the
VilCre;Mink1fl/fl mice to ApcMin/+ mice to determine whether the colorectal cancer
phenotype differs from that of the ApcMin/+ mice. Unfortunately, the generation of the
Mink1 deletion mouse was delayed by over a year preventing me from using this
approach. Two Mink1 knockout mice have been described in the literature already.
A complete Mink1 knockout mouse, was accomplished by deletion of Mink1 exon
three and four. These mice displayed impaired thrombus formation in platelets, but
further tissue analysis was lacking (Yue et al., 2016). The second, a conditional
Mink1 knockout, mouse was generated by inducing a stop codon after exon six (Li
et al., 2019). In both cases the mice were viable. Moreover, knockout mice have also
been created for the MINK1 ohnologues, MAP4K4 and TNIK. Map4k4 deletion in
mice leads to embryonic lethality caused by a migration defect of mesodermal and
endodermal cells (Xue et al., 2001). Moreover, endothelial-specific loss of Map4k4
in mice leads to postnatal lethality due to leakage of chyle into the thoracic cavity after
birth (chylothorax) (Roth Flach et al., 2016). MAP4K4 is critical for lymphatic vascular
development and has been shown to be instrumental in endothelial cells. It is also
required for immune cell recruitment in atherosclerosis, suggesting it might be a
useful druggable target in this vascular inflammation disease (Roth Flach et al.,
2016; Roth Flach et al., 2015). Mice deleted of Tnik are viable and their phenotype
indicates that TNIK has a role in dendritic and neuronal development and function.
Hence, TNIK deficiency has been implicated in psychiatric disorders and intellectual
disability (Anazi et al., 2016; Burette et al., 2015; Coba et al., 2012; Wang et al.,
2016). Moreover, an intestinal epithelium specific triple knockout mouse was
generated from Map4k4flox (Roth Flach et al., 2015), Tnikflox (Burette et al., 2015) and
Mink1flox alleles (Li et al., 2019). All three proteins are expressed in the intestine,
208 including the epithelial cells lining intestinal crypts. Mice with intestinal-specific triple-
deletion of Mink1, Map4k4 and Tnik (VilCre;MAP4Kf/f triple) do not show a severe
phenotype. However, twelve months old mice displayed mildly increased
proliferation in cells of the gastrointestinal tract (Li et al., 2019). The minor phenotype
of VilCre;MAP4Kf/f triple mice suggests that the deletion of Mink1 alone does not affect
the intestinal epithelium. Regardless, this does not preclude a role for MINK1 in the
tumour promoting effects of APC mutations, which would be determined by crossing
Mink1 conditional knockout mice carrying the Villin-Cre promotor to ApcMin/+ mice,
and then measuring how the Mink1 deletion from intestinal epithelium alters effects
of Apc loss. MINK1 is negatively regulated by APC and MINK1 is upregulated in
intestinal epithelium of ApcMin/+ mice. Therefore, if MINK1 is involved in the colorectal
cancer phenotype the expectation is that the phenotype will be less severe with
MINK1 was lacking from the intestinally epithelium. The generation of a conditional
Mink1 deletion mouse (by Taconic) was eventually successful and relevant sperm
was received to allow generation of these mice in the future.
209 Conclusion
My study showed that the linker domain of MINK1 interacts with the N-terminal
domain of APC, and our previous study showed that MINK1 is negatively regulated
by APC (Popow et al., 2019). Moreover, I could show in vitro that MINK1
phosphorylates a peptide derived from ERM proteins and representing the ERM
protein activation phosphosite. MINK1 kinase activity was markedly reduced by
substituting the phosphorylatable threonine of the ERM activation site to a serine
residue (T567/564/558S), which suggest that MINK1 might be a threonine-selective
kinase, which would distinguish it from its closest related sister ohnologue, TNIK,
and might also explain why MINK1 is most likely not directly involved in canonical
Wnt signalling. TNIK has been previously shown to be involved in Wnt signalling by
binding β-catenin through its unconserved linker domain and activating
phosphorylation of TCF4 (S154) (Mahmoudi et al., 2009).
I demonstrated that PKA, MARK3 and MARK4 directly phosphorylate MINK1 on two
phosphosites (S674 and S701) in the linker domain of MINK1, which in turn enables
14-3-3-binding to these phosphosites. Moreover, 14-3-3-binding to MINK1 was
reduced upon APC depletion, but APC protein levels did not change upon 14-3-3-
binding to MINK1, indicating that the interaction of MINK1 with APC might be
important for 14-3-3-binding.
ERM proteins play an essential role in mitotic spindle formation, orientation and
function, as well as in collective cell migration (McClatchey, 2014). APC mutation or
depletion leads to migration defects in epithelial cells. If the interaction between APC
and MINK1 was involved in cell migration, one would expect MINK1 overexpression
to lead to a similar migration phenotype as APC depletion, given that APC negatively
regulates MINK1. However, my analysis indicates that MINK1 overexpressing cells
migrate faster than control cells. Therefore, MINK1 might be involved in cell
migration independent of its association with APC, and the role of APC in cell
migration is likely dependent on its interaction with microtubules and involvement in
focal adhesion turnover (Dikovskaya et al., 2010; Fearnhead et al., 2001; Juanes et
al., 2017; Nelson and Näthke, 2013). Furthermore, overexpression of APC in murine
intestinal epithelium leads to disordered (less coordinated) migration of intestinal
210 epithelial cells and decreases cell adhesion (Wong et al., 1996). My results indicate
that MINK1 overexpression led to bigger regions of fast migrating cells, while MINK1
deletion had the opposite effect. Therefore, MINK1 overexpression might decrease
cell adhesion similar to Apc depletion, which will need further investigation.
Additionally, within these regions of faster cell migration, MINK1 overexpressing cells
moved more coordinated, which is in agreement with the finding that APC
overexpression leads to less coordinated migration.
ERM proteins also play an essential role in mitotic spindle formation and orientation
(McClatchey, 2014). APC has been linked to spindle orientation (Carroll et al., 2017;
Dikovskaya et al., 2007; Quyn et al., 2010; Yamashita et al., 2003) and MINK1 is
phosphorylated during mitosis (Hyodo et al., 2012). This led me to investigate the
role of MINK1 in spindle orientation, where I found that MINK1 overexpression leads
to spindle misorientation, similar to APC depletion. Moreover, both MINK1
overexpression and APC mutation lead to cytokinesis defects. Therefore, the
association between MINK1 and APC, and the negative regulation of MINK1 by APC
might be important for proper spindle orientation. However, whether MINK1 actually
phosphorylates ERM proteins in vivo will need to be studied further. My experiment
showed MINK1 localisation uniformly at the plasma membrane during mitosis. The
exact mechanism how MINK1 influences spindle orientation and cell migration are
not yet clear and need further investigation. Since it is possible that mNeonGreen-,
or GFP-tags impact on MINK1 interaction and localisation it would be beneficial to
also include rescue experiments with untagged MINK1 to further investigate these
questions.
The deletion of Mink1 in mice does not cause a severe phenotype and homozygous
Mink1 depletion mice are viable (Li et al., 2019; Yue et al., 2016), whereas
homozygous Apc deletion is embryonic lethal (Moser et al., 1995b; Oshima et al.,
1995). However, MINK1 is negatively regulated by APC, therefore any phenotype
that is caused by the upregulation of MINK1 through APC depletion would be
expected to also be seen upon MINK1 overexpression. It would therefore, still be
beneficial to further investigate the phenotype caused by MINK1 overexpression,
and to investigate the exact mechanisms that are involved in the faster cell migration
and spindle misorientation, and whether ERM proteins might be involved in either or
211 both phenotypes. Moreover, a next step would also be to validate that the S674 and
S701 phosphosites are the only two 14-3-3-binding sites on MINK1. Therefore, a
MINK1 double mutation of both sites should be generated and investigated. Further
in vitro kinase assays could also help answer whether 14-3-3-binding to MINK1 is
important for MINK1 kinase activity. Further in vivo experiments should be conducted
to investigate how APC might be involved in 14-3-3-binding, as 14-3-3-binding to
MINK1 seemed to be decreased upon APC depletion.
The conditional Mink1 deletion mouse that was successfully created (by Taconic)
can now be bred and crossed with ApcMin/+ mice to validate whether the ApcMin/+
phenotype (development of intestinal tumours) can be rescued. Similarly, Tnik
deletion mice (Tnik-/-) have been crossed to ApcMin/+ mice and it was shown that
these Tnik−/−/ApcMin/+ mice develop fewer intestinal tumours than ApcMin/+ mice
(Masuda et al., 2016b).
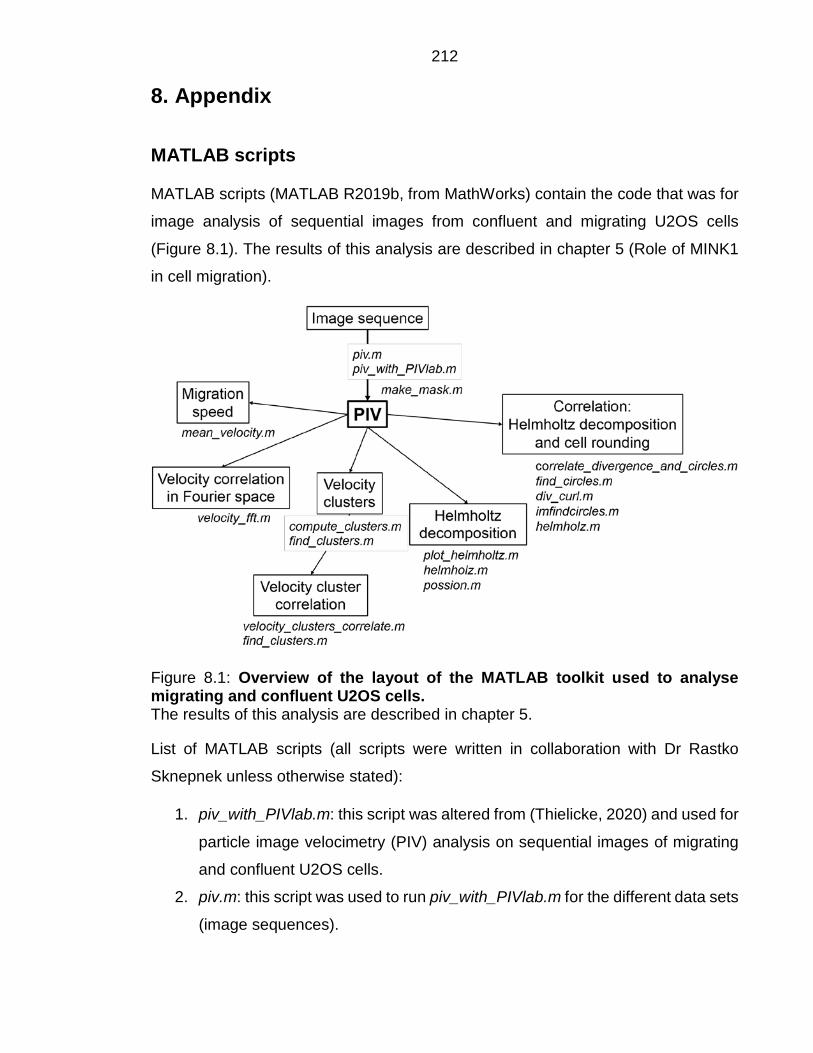
212 8. Appendix
MATLAB scripts
MATLAB scripts (MATLAB R2019b, from MathWorks) contain the code that was for
image analysis of sequential images from confluent and migrating U2OS cells
(Figure 8.1). The results of this analysis are described in chapter 5 (Role of MINK1
in cell migration).
Figure 8.1: Overview of the layout of the MATLAB toolkit used to analyse migrating and confluent U2OS cells. The results of this analysis are described in chapter 5.
List of MATLAB scripts (all scripts were written in collaboration with Dr Rastko
Sknepnek unless otherwise stated):
1. piv_with_PIVlab.m: this script was altered from (Thielicke, 2020) and used for
particle image velocimetry (PIV) analysis on sequential images of migrating
and confluent U2OS cells.
2. piv.m: this script was used to run piv_with_PIVlab.m for the different data sets
(image sequences).
213
3. make_mask.m: this script was used to extract the PIV data only over the area
covered by cells.
4. mean_velocity.m: this script was used to compute the mean velocity of each
experiment (image sequences). Afterwards, the mean speed over time was
calculated for each genotype/treatment by averaging over all experiments of
the same genotype/treatment.
5. velocity_fft.m: this script was used to compute the modulus squared of the
Fourier transform for the velocity field.
6. find_clusters.m: this script identified clusters of fast migrating cells in image
sequences and is called by the compute_clusters.m script.
7. compute_clusters.m: this script was used for cluster analysis on migrating and
confluent U2OS cells used to compute cumulative numbers of velocity
clusters of moving cells.
8. velocity_cluster_correlate.m: this script was used to compare velocity
correlation of example image sequences to velocity correlation within the
biggest identified cluster of faster than average cell migration speed.
9. helmholz.m: this script was used to compute the Helmholtz decomposition of
the velocity field (generated by PIV), using the possion.m script. This script is
called by the plot_helmholtz.m and the div_curl.m script.
10. plot_helmholtz.m: this script was used to generate figures illustrating the
velocity vector field, the divergence-free and the curl-free part of the
Helmholtz decomposition and calls the helmholz.m script.
11. poisson.m: this scripted was used to solve the Poisson equation and calls the
helmholz.m script.
12. correlate_divergence_and_circles.m: this script was used for step-wise
analysis of correlation between Helmholtz decomposition and cell rounding
events in U2OS cells. This script calls the find_circles.m script and the
div_curl.m script.
13. find_circles.m: this script was used to identify circles in a sequence of frames
and was used by the correlate_divergence_and_circles.m script. This script
calls the imfindcircles.m script.
214
14. div_curl.m: this script was used to compute divergence-free and curl-free
parts of the Helmholtz decomposition and was used by the
correlate_divergence_and_circles.m script. This script calls the helmholz.m
script.
All MATLAB scripts are available for download at https://dmail-
my.sharepoint.com/:f:/r/personal/msvolk_dundee_ac_uk/Documents/PhD%20thesi
s/Thesis_Appendix/MATLAB_files?csf=1&web=1&e=D261tx
ImageJ macro
This ImageJ macro was used in chapter 6 to quantify cell adhesion by counting the
number of nuclei per field of view in images from immunofluorescence labelled cell
samples. The macro is available for download at https://dmail-
my.sharepoint.com/:u:/r/personal/msvolk_dundee_ac_uk/Documents/PhD%20thesi
s/Thesis_Appendix/ImageJ_macro_adhesion.ijm?csf=1&web=1&e=QiieIk
Subcellular localisation of MINK1
All subcellular localisation movies are part of chapter 6 (Sub-cellular localisation of
MINK1). They can be viewed and downloaded at https://dmail-
my.sharepoint.com/:f:/r/personal/msvolk_dundee_ac_uk/Documents/PhD%20thesi
s/Thesis_Appendix/Subcellular_localization_movies?csf=1&web=1&e=wNtGgt
Movie 1: Movie of subcellular localisation of overexpressed MINK1-GFP after H-89 treatment. Live cell imaging of U2OS cells with induced overexpression MINK1-GFP. Overexpression of MINK1-GFP was induced with 75 ng/ml tetracycline for 48 hours prior imaging. Cells were treated with H-89 (30 μM) for 30 minutes prior to imaging. Images were acquired in the FITC (GFP) channel ever second for 60 seconds, on a DeltaVision widefield deconvolution microscope with an Olympus 60x objective lens and the Resolve3D (version: 6.5.2) software from softWoRx. Scale bar indicates 10 μm.
Movie 2: Movie of subcellular localisation of overexpressed MINK1-GFP after H-89 treatment. Live cell imaging of U2OS cells with induced overexpression MINK1-GFP. Overexpression of MINK1-GFP was induced with 75 ng/ml tetracycline for 48 hours prior imaging. Cells were treated with H-89 (30 μM) for 30 minutes prior to imaging. Images were acquired in the FITC (GFP) channel ever second for 60 seconds, on a
215 DeltaVision widefield deconvolution microscope with an Olympus 60x objective lens and the Resolve3D (version: 6.5.2) software from softWoRx. Scale bar indicates 10 μm.
Movie 3: Movie of subcellular localisation of overexpressed kinase-GFP after H-89 treatment. Live cell imaging of U2OS cells with induced overexpression MINK1 kinase domain with a C-terminal GFP-tag (kinase-GFP). Overexpression of kinase-GFP was induced with 75 ng/ml tetracycline for 48 hours prior imaging. Cells were treated with H-89 (30 μM) for 30 minutes prior to imaging. Images were acquired in the FITC (GFP) channel ever second for 60 seconds, on a DeltaVision widefield deconvolution microscope with an Olympus 60x objective lens and the Resolve3D (version: 6.5.2) software from softWoRx. Scale bar indicates 10 μm.
Movie 4: Movie of subcellular localisation of overexpressed kinase-GFP after H-89 treatment. Live cell imaging of U2OS cells with induced overexpression MINK1 kinase domain with a C-terminal GFP-tag (kinase-GFP). Overexpression of kinase-GFP was induced with 75 ng/ml tetracycline for 48 hours prior imaging. Cells were treated with H-89 (30 μM) for 30 minutes prior to imaging. Images were acquired in the FITC (GFP) channel ever second for 60 seconds, on a DeltaVision widefield deconvolution microscope with an Olympus 60x objective lens and the Resolve3D (version: 6.5.2) software from softWoRx. Scale bar indicates 10 μm.
Conditional Mink1 knockout mouse
The project to generate a conditional Mink1 knockout (KO) mouse was
commissioned to Taconic Biosciences. In mice the Mink1 gene is located on
chromosome 11 and has 34 exons. The targeting strategy of Taconic aimed to
generate a conditional KO and a constitutive KO of the Mink1 gene in C57BL/6NTac
mice in the following seven main steps: 1) Characterization of the locus; 2)
Conditional targeting vector construction and DNA sequencing; 3) Transfection of
vector into C57BL/6NTac embryonic stem cells (ESCs); 4) Isolation of targeted ESC
clones and molecular validation by southern analysis with external and internal
probes; 5) Injection of targeted ESC into diploid blastocysts; 6) Chimera generation;
7) Crossbreeding of chimeras with flippase (Flp) deleter mice for in vivo selection
marker deletion and to generate mice heterozygous for the conditional KO allele. In
more detail, the initial strategy of Taconic (Figure 8.2) was based on the national
centre for biotechnology information (NCBI) transcript, NM_001045964.1. Mink1
exon 1 contains the translation initiation codon and exons 7 to 11 were aimed to be
flanked by loxP (locus of x-over P1) sites. Therefore, the size of the loxP-flanked
216 region was approximately 2.3 kb. The positive selection marker was chosen to be a
puromycin resistance (PuroR) cassette and was flanked by FLP recombinase target
(FRT) sites and inserted into intron 11. The targeting vector was generated using
bacterial artificial chromosome (BAC) clones from the C57BL/6J RPCI-23 BAC
library and was transfected into the Taconic C57BL/6NTac ESC line. Homologous
recombinant clones were isolated using positive PuroR, and negative thymidine
kinase, selections. The conditional KO allele was obtained after Flp-mediated
removal of the selection marker and the constitutive KO allele was obtained after in
vivo cyclization recombination recombinase (Cre)-mediated recombination. The
selection of exons 7 to 11 was expected to result in the loss of function of the Mink1
gene by deleting part of the kinase domain and by generating a frameshift from exon
6 to exons 12-19, generating a premature stop codon in exon 12. In addition, the
resulting transcript may be a target for non-sense mediated RNA decay, and may
therefore not be expressed at significant levels. The remaining recombination sites
are located in non-conserved regions of the genome. The potential risks that Taconic
highlighted for this approach were that intron 6 is only 625 bp long, and although the
proximal loxP site would be inserted into a non-conserved sequence of intron 6.
Therefore, it could not be completely ruled out that the loxP site might interfere with
the expression of Mink1 from the conditional KO allele. Similarly, intron 11 is only
741 bp long and although the distal loxP site would be inserted into a non-conserved
sequence of intron 11, therefore it was again possible for the insertion to interfere
with the expression of Mink1.
The successful generation of heterozygous mice was expected to be achieved within
46 weeks. Unfortunately, the project encountered unforeseen problems at multiple
steps. First of all, there were cloning challenges with the long homology arm (LHA),
which delayed the targeting vector design. These issues were eventually resolved.
Subsequently, additional cloning difficulties led to a change of the vector backbone
from high copy number to low copy number. This further delayed the project.
Eventually, cloning in mouse ESCs was successful. In the next step, sperm was
generated and in vitro fertilisation (IVF) was performed in C57BL/6NTac mice to
generate heterozygous animals. At this stage the project encountered new
problems, which led to further delays, at first, five male chimeras were culled for
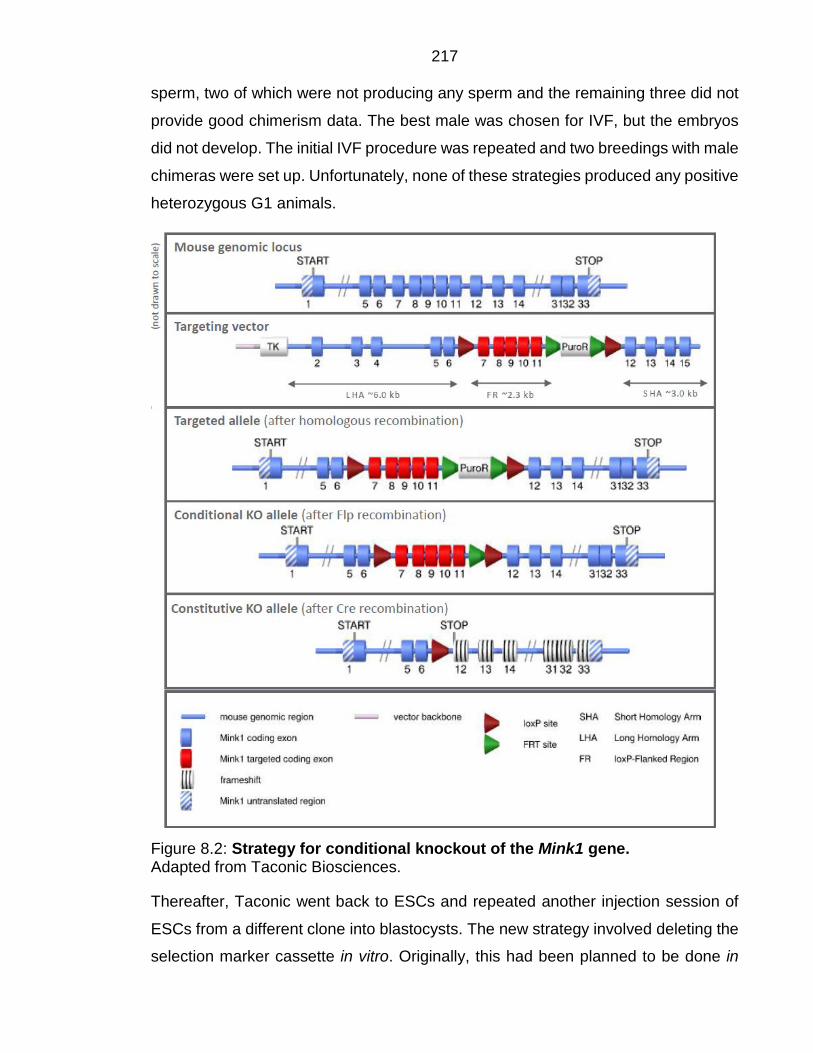
217 sperm, two of which were not producing any sperm and the remaining three did not
provide good chimerism data. The best male was chosen for IVF, but the embryos
did not develop. The initial IVF procedure was repeated and two breedings with male
chimeras were set up. Unfortunately, none of these strategies produced any positive
heterozygous G1 animals.
Figure 8.2: Strategy for conditional knockout of the Mink1 gene. Adapted from Taconic Biosciences.
Thereafter, Taconic went back to ESCs and repeated another injection session of
ESCs from a different clone into blastocysts. The new strategy involved deleting the
selection marker cassette in vitro. Originally, this had been planned to be done in

218 vivo and that would have been a faster approach. Again two in vitro diagnostic (IVD)
clones were injected into blastocysts, unfortunately this was not very successful.
One injection produced ten pups, but only one weak chimera and from the second
injection only one pub was born. After another round of chimera generation and more
IVFs heterozygous Mink1 KO mice were finally accomplished. Sperm was
harvested, cryoconserved and is now ready for the generation of conditional Mink1
KO mice.

219
Table 8.1: Abridgment from proteins co-immunoprecipitating with GFP-MINK1 identified via MS/MS. Lysates from induced GFP-MINK1 overexpressing U2OS cells were co-immunoprecipitation with GFP-Trap sepharose beads and separated with SDS PAGE. GFP-MINK1 overexpression was induced with 75 ng/ml tetracycline 48 hours prior cell lysis. Co-immunoprecipitated proteins were identified via nLC-MS/MS by the FingerPrints proteomics and mass spectrometry facility at the School of Life Sciences (University of Dundee). Listed is a small subset of proteins identified in this experiment.
UniProt ID Gene name Score Mass Num. of
matches Num. of sequences emPAI Protein
Q8N4C8 MINK1 6625 150413 212 78 27.16 Misshapen-like kinase 1 P26038 MOES 1254 67892 46 39 6.94 Moesin P15311 EZRI 799 69484 34 28 3.47 Ezrin P35241 RADI 587 68635 22 18 1.67 Radixin
O43150 ASAP2 60 112835 2 1 0.06 Arf-GAP with SH3 domain, ANK repeat and PH domain-containing protein 2
Q9NRL3 STRN4 739 81287 21 16 1.13 Striatin-4 O43815 STRN 583 86535 14 10 0.59 Striatin Q13033 STRN3 462 87554 11 7 0.47 Striatin-3 Q14847 LASP1 252 30097 7 6 1.02 LIM and SH3 domain protein 1 Q96MT3 PRIC1 96 96179 2 2 0.07 Prickle-like protein 1 Q99961 SH3G1 64 41692 1 1 0.08 Endophilin-A2 Q9Y3L3 3BP1 63 76008 1 1 0.04 SH3 domain-binding protein 1 Q8TEJ3 SH3R3 50 93916 1 1 0.03 E3 ubiquitin-protein ligase SH3RF3
220
References
Aitken, A. 2006. 14-3-3 proteins: A historic overview. Seminars in Cancer Biology. 16:162-172.
Akhmanova, A., and M.O. Steinmetz. 2008. Tracking the ends: a dynamic protein network controls the fate of microtubule tips. Nature Reviews Molecular Cell Biology. 9:309-322.
Alpha S. Yap, a. William M. Brieher, and B.M. Gumbiner. 1997. MOLECULAR AND FUNCTIONAL ANALYSIS OF CADHERIN-BASED ADHERENS JUNCTIONS. Annual Review of Cell and Developmental Biology. 13:119-146.
Amano, M., K. Chihara, K. Kimura, Y. Fukata, N. Nakamura, Y. Matsuura, and K. Kaibuchi. 1997. Formation of Actin Stress Fibers and Focal Adhesions Enhanced by Rho-Kinase. Science. 275:1308-1311.
Ammirati, M., S.W. Bagley, S.K. Bhattacharya, L. Buckbinder, A.A. Carlo, R. Conrad, C. Cortes, R.L. Dow, M.S. Dowling, A. El-Kattan, K. Ford, C.R.W. Guimarães, D. Hepworth, W. Jiao, J. LaPerle, S. Liu, A. Londregan, P.M. Loria, A.M. Mathiowetz, M. Munchhof, S.T.M. Orr, D.N. Petersen, D.A. Price, A. Skoura, A.C. Smith, and J. Wang. 2015a. Discovery of an in Vivo Tool to Establish Proof-of-Concept for MAP4K4-Based Antidiabetic Treatment. In ACS medicinal chemistry letters. Vol. 6. 1128-1133.
Ammirati, M., S.W. Bagley, S.K. Bhattacharya, L. Buckbinder, A.A. Carlo, R. Conrad, C. Cortes, R.L. Dow, M.S. Dowling, A. El-Kattan, K. Ford, C.R.W. Guimarães, D. Hepworth, W. Jiao, J. LaPerle, S. Liu, A. Londregan, P.M. Loria, A.M. Mathiowetz, M. Munchhof, S.T.M. Orr, D.N. Petersen, D.A. Price, A. Skoura, A.C. Smith, and J. Wang. 2015b. Discovery of an in Vivo Tool to Establish Proof-of-Concept for MAP4K4-Based Antidiabetic Treatment. ACS Medicinal Chemistry Letters. 6:1128-1133.
Anazi, S., H.E. Shamseldin, D. AlNaqeb, M. Abouelhoda, D. Monies, M.A. Salih, K. Al-Rubeaan, and F.S. Alkuraya. 2016. A null mutation in TNIK defines a novel locus for intellectual disability. Human Genetics. 135:773-778.
Andreev, J., J.-P. Simon, D.D. Sabatini, J. Kam, G. Plowman, P.A. Randazzo, and J. Schlessinger. 1999. Identification of a New Pyk2 Target Protein with Arf-GAP Activity. Molecular and Cellular Biology. 19:2338-2350.
Angelini, T.E., E. Hannezo, X. Trepat, M. Marquez, J.J. Fredberg, and D.A. Weitz. 2011. Glass-like dynamics of collective cell migration. Proceedings of the National Academy of Sciences. 108:4714-4719.
Aridor, M., and W.E. Balch. 2000. Kinase Signaling Initiates Coat Complex II (COPII) Recruitment and Export from the Mammalian Endoplasmic Reticulum. Journal of Biological Chemistry. 275:35673-35676.
Arpin, M., D. Chirivino, A. Naba, and I. Zwaenepoel. 2011. Emerging role for ERM proteins in cell adhesion and migration. Cell Adh Migr. 5:199-206.
Askham, J.M., P. Moncur, A.F. Markham, and E.E. Morrison. 2000. Regulation and function of the interaction between the APC tumour suppressor protein and EB1. Oncogene. 19:1950.
Atherton, T.J., and D.J. Kerbyson. 1999. Size invariant circle detection. Image and Vision Computing. 17:795-803.

221 Attisano, L., and J.L. Wrana. 2002. Signal Transduction by the TGF-β Superfamily.
Science. 296:1646-1647. Ayala-Calvillo, E., L.H. Mojica-Vázquez, A. García-Carrancá, and L. González-
Maya. 2018. Wnt/β‑catenin pathway activation and silencing of the APC gene in HPV‑positive human cervical cancer‑derived cells. Mol Med Rep. 17:200-208.
Bai, J., Y. Uehara, and D.J. Montell. 2000. Regulation of Invasive Cell Behavior by Taiman, a Drosophila Protein Related to AIB1, a Steroid Receptor Coactivator Amplified in Breast Cancer. Cell. 103:1047-1058.
Barlowe, C., L. Orci, T. Yeung, M. Hosobuchi, S. Hamamoto, N. Salama, M.F. Rexach, M. Ravazzola, M. Amherdt, and R. Schekman. 1994. COPII: A membrane coat formed by Sec proteins that drive vesicle budding from the endoplasmic reticulum. Cell. 77:895-907.
Barnes, H.A., J.F. Hutton, and K. Walters. 1989. An Introduction to Rheology. Elsevier Science.
Barry, E.R., and F.D. Camargo. 2013. The Hippo superhighway: signaling crossroads converging on the Hippo/Yap pathway in stem cells and development. Current Opinion in Cell Biology. 25:247-253.
Baumgartner, M., A.L. Sillman, E.M. Blackwood, J. Srivastava, N. Madson, J.W. Schilling, J.H. Wright, and D.L. Barber. 2006. The Nck-interacting kinase phosphorylates ERM proteins for formation of lamellipodium by growth factors. Proceedings of the National Academy of Sciences. 103:13391-13396.
Becker, E., U. Huynh-Do, S. Holland, T. Pawson, T.O. Daniel, and E.Y. Skolnik. 2000. Nck-Interacting Ste20 Kinase Couples Eph Receptors to c-Jun N-Terminal Kinase and Integrin Activation. Molecular and Cellular Biology. 20:1537-1545.
Behrens, J., B.-A. Jerchow, M. Würtele, J. Grimm, C. Asbrand, R. Wirtz, M. Kühl, D. Wedlich, and W. Birchmeier. 1998. Functional Interaction of an Axin Homolog, Conductin, with β-Catenin, APC, and GSK3β. Science. 280:596-599.
Benoist, M., S. Gaillard, and F. Castets. 2006. The striatin family: A new signaling platform in dendritic spines. Journal of Physiology-Paris. 99:146-153.
Berg, J.M., J.L. Tymoczko, and L. Stryer. 2006. Biochemistry (6th ed.). W H Freeman & Co, New York, NY.
Berridge, M.J. 2014. Module 2: Cell Signalling Pathways. Cell Signalling Biology. 6:csb0001002.
Berryman, M., Z. Franck, and A. Bretscher. 1993. Ezrin is concentrated in the apical microvilli of a wide variety of epithelial cells whereas moesin is found primarily in endothelial cells. Journal of Cell Science. 105:1025-1043.
Bienz, M., and H. Clevers. 2000. Linking Colorectal Cancer to Wnt Signaling. Cell. 103:311-320.
Bossuyt, W., C.L. Chen, Q. Chen, M. Sudol, H. McNeill, D. Pan, A. Kopp, and G. Halder. 2014. An evolutionary shift in the regulation of the Hippo pathway between mice and flies. Oncogene. 33:1218-1228.
Bray, F., J. Ferlay, I. Soerjomataram, R.L. Siegel, L.A. Torre, and A. Jemal. 2018. Global cancer statistics 2018: GLOBOCAN estimates of incidence and mortality worldwide for 36 cancers in 185 countries. CA: A Cancer Journal for Clinicians. 68:394-424.
222 Breitman, M., A. Zilberberg, M. Caspi, and R. Rosin-Arbesfeld. 2008. The armadillo
repeat domain of the APC tumor suppressor protein interacts with Striatin family members. Biochimica et Biophysica Acta (BBA) - Molecular Cell Research. 1783:1792-1802.
Bretscher, A., K. Edwards, and R.G. Fehon. 2002. ERM proteins and merlin: integrators at the cell cortex. Nature Reviews Molecular Cell Biology. 3:586-599.
Bright, N.J., C. Thornton, and D. Carling. 2009. The regulation and function of mammalian AMPK-related kinases. Acta Physiologica. 196:15-26.
Burette, A.C., K.D. Phend, S. Burette, Q. Lin, M. Liang, G. Foltz, N. Taylor, Q. Wang, N.J. Brandon, B. Bates, M.D. Ehlers, and R.J. Weinberg. 2015. Organization of TNIK in dendritic spines. Journal of Comparative Neurology. 523:1913-1924.
Carroll, T.D., A.J. Langlands, J.M. Osborne, I.P. Newton, P.L. Appleton, and I. Näthke. 2017. Interkinetic nuclear migration and basal tethering facilitates post-mitotic daughter separation in intestinal organoids. Journal of Cell Science. 130:3862-3877.
Chaikin, P.M., and T.C. Lubensky. 1995. Principles of Condensed Matter Physics. Cambridge University Press, Cambridge.
Chapman, J.O., H. Li, and E.A. Lundquist. 2008. The MIG-15 NIK kinase acts cell-autonomously in neuroblast polarization and migration in C. elegans. Developmental Biology. 324:245-257.
Chater, T.E., and Y. Goda. 2014. The role of AMPA receptors in postsynaptic mechanisms of synaptic plasticity. Frontiers in Cellular Neuroscience. 8.
Chen, T.R. 1988. Re-evaluation of HeLa, HeLa S3, and HEp-2 karyotypes. Cytogenetic and Genome Research. 48:19-24.
Chen, Y., M. Vandereyken, I.P. Newton, I. Moraga, I.S. Näthke, and M. Swamy. 2019. Loss of adenomatous polyposis coli function renders intestinal epithelial cells resistant to the cytokine IL-22. PLOS Biology. 17:e3000540.
Chepizhko, O., C. Giampietro, E. Mastrapasqua, M. Nourazar, M. Ascagni, M. Sugni, U. Fascio, L. Leggio, C. Malinverno, G. Scita, S. Santucci, M.J. Alava, S. Zapperi, and C.A.M. La Porta. 2016. Bursts of activity in collective cell migration. Proceedings of the National Academy of Sciences. 113:11408-11413.
Cheung, A.F., A.M. Carter, K.K. Kostova, J.F. Woodruff, D. Crowley, R.T. Bronson, K.M. Haigis, and T. Jacks. 2010. Complete deletion of Apc results in severe polyposis in mice. Oncogene. 29:1857-1864.
Chijiwa, T., A. Mishima, M. Hagiwara, M. Sano, K. Hayashi, T. Inoue, K. Naito, T. Toshioka, and H. Hidaka. 1990. Inhibition of forskolin-induced neurite outgrowth and protein phosphorylation by a newly synthesized selective inhibitor of cyclic AMP-dependent protein kinase, N-[2-(p-bromocinnamylamino)ethyl]-5-isoquinolinesulfonamide (H-89), of PC12D pheochromocytoma cells. Journal of Biological Chemistry. 265:5267-5272.
Chin, J.Y., R.B. Knowles, A. Schneider, G. Drewes, E.-M. Mandelkow, and B.T. Hyman. 2000. Microtubule-Affinity Regulating Kinase (MARK) Is Tightly Associated with Neurofibrillary Tangles in Alzheimer Brain: A Fluorescence Resonance Energy Transfer Study. Journal of Neuropathology & Experimental Neurology. 59:966-971.
223 Clucas, J., and F. Valderrama. 2015. ERM proteins in cancer progression. Journal
of Cell Science. 128:1253-1253. Coba, M.P., N.H. Komiyama, J. Nithianantharajah, M.V. Kopanitsa, T. Indersmitten,
N.G. Skene, E.J. Tuck, D.G. Fricker, K.A. Elsegood, L.E. Stanford, N.O. Afinowi, L.M. Saksida, T.J. Bussey, T.J. O'Dell, and S.G.N. Grant. 2012. TNiK Is Required for Postsynaptic and Nuclear Signaling Pathways and Cognitive Function. The Journal of Neuroscience. 32:13987-13999.
Cobreros-Reguera, L., A. Fernández-Miñán, C.H. Fernández-Espartero, H. López-Schier, A. González-Reyes, and M.D. Martín-Bermudo. 2010. The Ste20 kinase misshapen is essential for the invasive behaviour of ovarian epithelial cells in Drosophila. EMBO Rep. 11:943-949.
Cohen, P. 2000. The regulation of protein function by multisite phosphorylation – a 25 year update. Trends in Biochemical Sciences. 25:596-601.
Conway, J.R.W., and G. Jacquemet. 2019. Cell matrix adhesion in cell migration. Essays in Biochemistry. 63:535-551.
Crawford, T.D., C.O. Ndubaku, H. Chen, J.W. Boggs, B.J. Bravo, K. Delatorre, A.M. Giannetti, S.E. Gould, S.F. Harris, S.R. Magnuson, E. McNamara, L.J. Murray, J. Nonomiya, A. Sambrone, S. Schmidt, T. Smyczek, M. Stanley, P. Vitorino, L. Wang, K. West, P. Wu, and W. Ye. 2014. Discovery of selective 4-Amino-pyridopyrimidine inhibitors of MAP4K4 using fragment-based lead identification and optimization. Journal of medicinal chemistry. 57:3484-3493.
Crepaldi, T., A. Gautreau, P.M. Comoglio, D. Louvard, and M. Arpin. 1997. Ezrin Is an Effector of Hepatocyte Growth Factor–mediated Migration and Morphogenesis in Epithelial Cells. Journal of Cell Biology. 138:423-434.
D'Souza-Schorey, C., and P. Chavrier. 2006. ARF proteins: roles in membrane traffic and beyond. Nature Reviews Molecular Cell Biology. 7:347-358.
Dan, I., N.M. Watanabe, T. Kobayashi, K. Yamashita-Suzuki, Y. Fukagaya, E. Kajikawa, W.K. Kimura, T.M. Nakashima, K. Matsumoto, J. Ninomiya-Tsuji, and A. Kusumi. 2000. Molecular cloning of MINK, a novel member of mammalian GCK family kinases, which is up-regulated during postnatal mouse cerebral development. FEBS Letters. 469:19-23.
Dan, I., N.M. Watanabe, and A. Kusumi. 2001. The Ste20 group kinases as regulators of MAP kinase cascades. Trends in Cell Biology. 11:220-230.
Daulat, A.M., O. Luu, A. Sing, L. Zhang, J.L. Wrana, H. McNeill, R. Winklbauer, and S. Angers. 2012. Mink1 Regulates β-Catenin-Independent Wnt Signaling via Prickle Phosphorylation. Molecular and Cellular Biology. 32:173-185.
Di Cunto, F., E. Calautti, J. Hsiao, L. Ong, G. Topley, E. Turco, and G.P. Dotto. 1998. Citron Rho-interacting Kinase, a Novel Tissue-specific Ser/Thr Kinase Encompassing the Rho-Rac-binding Protein Citron. Journal of Biological Chemistry. 273:29706-29711.
Dikovskaya, D., G. Khoudoli, I.P. Newton, G.S. Chadha, D. Klotz, A. Visvanathan, A. Lamond, J.R. Swedlow, and I.S. Näthke. 2012. The Adenomatous Polyposis Coli Protein Contributes to Normal Compaction of Mitotic Chromatin. PLOS ONE. 7:e38102.
Dikovskaya, D., Z. Li, I.P. Newton, I. Davidson, J.R.A. Hutchins, P. Kalab, P.R. Clarke, and I.S. Näthke. 2010. Microtubule assembly by the Apc protein is regulated by importin-β—RanGTP. Journal of Cell Science. 123:736-746.
224 Dikovskaya, D., I.P. Newton, and I.S. Näthke. 2004. The Adenomatous Polyposis
Coli Protein Is Required for the Formation of Robust Spindles Formed in CSF Xenopus Extracts. Molecular Biology of the Cell. 15:2978-2991.
Dikovskaya, D., D. Schiffmann, I.P. Newton, A. Oakley, K. Kroboth, O. Sansom, T.J. Jamieson, V. Meniel, A. Clarke, and I.S. Näthke. 2007. Loss of APC induces polyploidy as a result of a combination of defects in mitosis and apoptosis. The Journal of Cell Biology. 176:183-195.
Dikovskaya, D., J. Zumbrunn, G.A. Penman, and I.S. Näthke. 2001. The adenomatous polyposis coli protein: in the limelight out at the edge. Trends in Cell Biology. 11:378-384.
Draviam, V.M., I. Shapiro, B. Aldridge, and P.K. Sorger. 2006. Misorientation and reduced stretching of aligned sister kinetochores promote chromosome missegregation in EB1- or APC-depleted cells. The EMBO Journal. 25:2814-2827.
Drewes, G., and P. Nurse. 2003. The protein kinase kin1, the fission yeast orthologue of mammalian MARK/PAR-1, localises to new cell ends after mitosis and is important for bipolar growth. FEBS Letters. 554:45-49.
Dunn, S.-J., P.L. Appleton, S.A. Nelson, I.S. Näthke, D.J. Gavaghan, and J.M. Osborne. 2012. A Two-Dimensional Model of the Colonic Crypt Accounting for the Role of the Basement Membrane and Pericryptal Fibroblast Sheath. PLOS Computational Biology. 8:e1002515.
Dunphy, J.L., R. Moravec, K. Ly, T.K. Lasell, P. Melancon, and J.E. Casanova. 2006. The Arf6 GEF GEP100/BRAG2 Regulates Cell Adhesion by Controlling Endocytosis of β1 Integrins. Current Biology. 16:315-320.
Eklof Spink, K., S.G. Fridman, and W.I. Weis. 2001. Molecular mechanisms of beta-catenin recognition by adenomatous polyposis coli revealed by the structure of an APC-beta-catenin complex. The EMBO journal. 20:6203-6212.
Ezratty, E.J., M.A. Partridge, and G.G. Gundersen. 2005. Microtubule-induced focal adhesion disassembly is mediated by dynamin and focal adhesion kinase. Nature Cell Biology. 7:581.
Fath, S., J.D. Mancias, X. Bi, and J. Goldberg. 2007. Structure and Organization of Coat Proteins in the COPII Cage. Cell. 129:1325-1336.
Faux, M.C., J.L. Ross, C. Meeker, T. Johns, H. Ji, R.J. Simpson, M.J. Layton, and A.W. Burgess. 2004. Restoration of full-length adenomatous polyposis coli (APC) protein in a colon cancer cell line enhances cell adhesion. Journal of Cell Science. 117:427-439.
Fearnhead, N.S., M.P. Britton, and W.F. Bodmer. 2001. The ABC of APC. Human molecular genetics. 10:721-733.
Fehon, R.G., A.I. McClatchey, and A. Bretscher. 2010. Organizing the cell cortex: the role of ERM proteins. Nature Reviews Molecular Cell Biology. 11:276-287.
Feng, J.A., P. Lee, M.H. Alaoui, K. Barrett, G. Castanedo, R. Godemann, P. McEwan, X. Wang, P. Wu, Y. Zhang, S.F. Harris, and S.T. Staben. 2019. Structure Based Design of Potent Selective Inhibitors of Protein Kinase D1 (PKD1). In ACS medicinal chemistry letters. Vol. 10. 1260-1265.
Fields, S., and O.-k. Song. 1989. A novel genetic system to detect protein–protein interactions. Nature. 340:245-246.
Fodde, R., W. Edelmann, K. Yang, C. van Leeuwen, C. Carlson, B. Renault, C. Breukel, E. Alt, M. Lipkin, and P.M. Khan. 1994. A targeted chain-termination
225
mutation in the mouse Apc gene results in multiple intestinal tumors. Proceedings of the National Academy of Sciences. 91:8969-8973.
Force, A., M. Lynch, F.B. Pickett, A. Amores, Y.-l. Yan, and J. Postlethwait. 1999. Preservation of Duplicate Genes by Complementary, Degenerative Mutations. Genetics. 151:1531-1545.
Fu, C.A., M. Shen, B.C.B. Huang, J. Lasaga, D.G. Payan, and Y. Luo. 1999. TNIK, a Novel Member of the Germinal Center Kinase Family That Activates the c-Jun N-terminal Kinase Pathway and Regulates the Cytoskeleton. Journal of Biological Chemistry. 274:30729-30737.
Fu, G., Q. Xu, Y. Qiu, X. Jin, T. Xu, S. Dong, J. Wang, Y. Ke, H. Hu, X. Cao, D. Wang, H. Cantor, X. Gao, and L. Lu. 2017. Suppression of Th17 cell differentiation by misshapen/NIK-related kinase MINK1. The Journal of Experimental Medicine. 214:1453-1469.
Fu, H., K. Xia, D. Pallas, C. Cui, K. Conroy, R. Narsimhan, H. Mamon, R. Collier, and T. Roberts. 1994. Interaction of the protein kinase Raf-1 with 14-3-3 proteins. Science. 266:126-129.
Fulcher, L.J., Z. He, L. Mei, T.J. Macartney, N.T. Wood, A.R. Prescott, A.J. Whigham, J. Varghese, R. Gourlay, G. Ball, R. Clarke, D.G. Campbell, C.A. Maxwell, and G.P. Sapkota. 2019. FAM83D directs protein kinase CK1α to the mitotic spindle for proper spindle positioning. EMBO reports. 20:e47495.
Goldspink, D.A., J.R. Gadsby, G. Bellett, J. Keynton, B.J. Tyrrell, E.K. Lund, P.P. Powell, P. Thomas, and M.M. Mogensen. 2013. The microtubule end-binding protein EB2 is a central regulator of microtubule reorganisation in apico-basal epithelial differentiation. Journal of Cell Science. 126:4000-4014.
Göransson, O., M. Deak, S. Wullschleger, N.A. Morrice, A.R. Prescott, and D.R. Alessi. 2006. Regulation of the polarity kinases PAR-1/MARK by 14-3-3 interaction and phosphorylation. Journal of Cell Science. 119:4059-4070.
Goudreault, M., L.M. D’Ambrosio, M.J. Kean, M.J. Mullin, B.G. Larsen, A. Sanchez, S. Chaudhry, G.I. Chen, F. Sicheri, A.I. Nesvizhskii, R. Aebersold, B. Raught, and A.-C. Gingras. 2009. A PP2A Phosphatase High Density Interaction Network Identifies a Novel Striatin-interacting Phosphatase and Kinase Complex Linked to the Cerebral Cavernous Malformation 3 (CCM3) Protein. Molecular & Cellular Proteomics. 8:157-171.
Green , R.A., and K.B. Kaplan 2003. Chromosome instability in colorectal tumor cells is associated with defects in microtubule plus-end attachments caused by a dominant mutation in APC. The Journal of Cell Biology. 163:949-961.
Green, R.A., R. Wollman, and K.B. Kaplan. 2005. APC and EB1 Function Together in Mitosis to Regulate Spindle Dynamics and Chromosome Alignment. Molecular Biology of the Cell. 16:4609-4622.
Groden, J., A. Thliveris, W. Samowitz, M. Carlson, L. Gelbert, H. Albertsen, G. Joslyn, J. Stevens, L. Spirio, M. Robertson, L. Sargeant, K. Krapcho, E. Wolff, R. Burt, J.P. Hughes, J. Warrington, J. McPherson, J. Wasmuth, D. Le Paslier, H. Abderrahim, D. Cohen, M. Leppert, and R. White. 1991. Identification and characterization of the familial adenomatous polyposis coli gene. Cell. 66:589-600.
Gupta, K.K., E.O. Alberico, I.S. Näthke, and H.V. Goodson. 2014. Promoting microtubule assembly: A hypothesis for the functional significance of the +TIP network. BioEssays. 36:818-826.
226 Hanson, C.A., and J.R. Miller. 2005. Non-traditional roles for the Adenomatous
Polyposis Coli (APC) tumor suppressor protein. Gene. 361:1-12. Hart, M.J., R. de los Santos, I.N. Albert, B. Rubinfeld, and P. Polakis. 1998.
Downregulation of β-catenin by human Axin and its association with the APC tumor suppressor, β-catenin and GSK3β. Current Biology. 8:573-581.
Hastie, C.J., H.J. McLauchlan, and P. Cohen. 2006. Assay of protein kinases using radiolabeled ATP: a protocol. Nature Protocols. 1:968-971.
He, B., and W. Guo. 2009. The exocyst complex in polarized exocytosis. Current Opinion in Cell Biology. 21:537-542.
Helbing, D., I. Farkas, and T. Vicsek. 2000. Simulating dynamical features of escape panic. Nature. 407:487-490.
Helbing, D., and P. Molnár. 1995. Social force model for pedestrian dynamics. Physical Review E. 51:4282-4286.
Hemminki, A., D. Markie, I. Tomlinson, E. Avizienyte, S. Roth, A. Loukola, G. Bignell, W. Warren, M. Aminoff, P. Höglund, H. Järvinen, P. Kristo, K. Pelin, M. Ridanpää, R. Salovaara, T. Toro, W. Bodmer, S. Olschwang, A.S. Olsen, M.R. Stratton, A. de la Chapelle, and L.A. Aaltonen. 1998. A serine/threonine kinase gene defective in Peutz–Jeghers syndrome. Nature. 391:184-187.
Henkes, S., K. Kostanjevec, J.M. Collinson, R. Sknepnek, and E. Bertin. 2020. Dense active matter model of motion patterns in confluent cell monolayers. Nature Communications. 11:1405.
Hermeking, H., and A. Benzinger. 2006. 14-3-3 proteins in cell cycle regulation. Seminars in Cancer Biology. 16:183-192.
Hermiston, M.L., M.H. Wong, and J.I. Gordon. 1996. Forced expression of E-cadherin in the mouse intestinal epithelium slows cell migration and provides evidence for nonautonomous regulation of cell fate in a self-renewing system. Genes & Development. 10:985-996.
Hinck, L., I.S. Näthke, J. Papkoff, and W.J. Nelson. 1994. Dynamics of cadherin/catenin complex formation: novel protein interactions and pathways of complex assembly. The Journal of Cell Biology. 125:1327-1340.
Holy, M., and D.L. Brautigan. 2012. Calyculin A from Discodermia calyx is a dual action toxin that blocks calcium influx and inhibits protein Ser/Thr phosphatases. Toxins (Basel). 4:940-954.
Hong, A.W., Z. Meng, and K.-L. Guan. 2016. The Hippo pathway in intestinal regeneration and disease. Nature Reviews Gastroenterology &Amp; Hepatology. 13:324.
Horii, A., S. Nakatsuru, Y. Miyoshi, S. Ichii, H. Nagase, H. Ando, A. Yanagisawa, E. Tsuchiya, Y. Kato, and Y. Nakamura. 1992. Frequent Somatic Mutations of the <em>APC</em> Gene in Human Pancreatic Cancer. Cancer Research. 52:6696-6698.
Hu, Y., C. Leo, S. Yu, B.C.B. Huang, H. Wang, M. Shen, Y. Luo, S. Daniel-Issakani, D.G. Payan, and X. Xu. 2004. Identification and Functional Characterization of a Novel Human Misshapen/Nck Interacting Kinase-related Kinase, hMINKβ. Journal of Biological Chemistry. 279:54387-54397.
Huelsken, J., and J. Behrens. 2002. The Wnt signalling pathway. Journal of Cell Science. 115:3977-3978.
Hussain, N.K., H. Hsin, R.L. Huganir, and M. Sheng. 2010. MINK and TNIK Differentially Act on Rap2-Mediated Signal Transduction to Regulate
227
Neuronal Structure and AMPA Receptor Function. The Journal of Neuroscience. 30:14786-14794.
Hwang, J., and D.C. Pallas. 2014. STRIPAK complexes: Structure, biological function, and involvement in human diseases. The International Journal of Biochemistry & Cell Biology. 47:118-148.
Hyodo, T., S. Ito, H. Hasegawa, E. Asano, M. Maeda, T. Urano, M. Takahashi, M. Hamaguchi, and T. Senga. 2012. Misshapen-like kinase 1 (MINK1) Is a Novel Component of Striatin-interacting Phosphatase and Kinase (STRIPAK) and Is Required for the Completion of Cytokinesis. Journal of Biological Chemistry. 287:25019-25029.
ibidi. 2020. Principle for Wound Healing and Migration Assays. Vol. 2020. Janda, C.Y., D. Waghray, A.M. Levin, C. Thomas, and K.C. Garcia. 2012. Structural
Basis of Wnt Recognition by Frizzled. Science. 337:59-64. Jenne, D.E., H. Reomann, J.-i. Nezu, W. Friedel, S. Loff, R. Jeschke, O. Müller, W.
Back, and M. Zimmer. 1998. Peutz-Jeghers syndrome is caused by mutations in a novel serine threoninekinase. Nature Genetics. 18:38-43.
Jho, E.-h., T. Zhang, C. Domon, C.-K. Joo, J.-N. Freund, and F. Costantini. 2002. Wnt/β-Catenin/Tcf Signaling Induces the Transcription of Axin2, a Negative Regulator of the Signaling Pathway. Molecular and Cellular Biology. 22:1172-1183.
Jimbo, T., Y. Kawasaki, R. Koyama, R. Sato, S. Takada, K. Haraguchi, and T. Akiyama. 2002. Identification of a link between the tumour suppressor APC and the kinesin superfamily. Nature Cell Biology. 4:323-327.
Johnson, C., S. Crowther, M.J. Stafford, D.G. Campbell, R. Toth, and C. MacKintosh. 2010. Bioinformatic and experimental survey of 14-3-3-binding sites. Biochem J. 427:69-78.
Jones, S., W.-d. Chen, G. Parmigiani, F. Diehl, N. Beerenwinkel, T. Antal, A. Traulsen, M.A. Nowak, C. Siegel, V.E. Velculescu, K.W. Kinzler, B. Vogelstein, J. Willis, and S.D. Markowitz. 2008. Comparative lesion sequencing provides insights into tumor evolution. Proceedings of the National Academy of Sciences. 105:4283-4288.
Juanes, M.A., H. Bouguenina, J.A. Eskin, R. Jaiswal, A. Badache, and B.L. Goode. 2017. Adenomatous polyposis coli nucleates actin assembly to drive cell migration and microtubule-induced focal adhesion turnover. The Journal of Cell Biology.
Kahn, B.B., T. Alquier, D. Carling, and D.G. Hardie. 2005. AMP-activated protein kinase: Ancient energy gauge provides clues to modern understanding of metabolism. Cell Metabolism. 1:15-25.
Kaneko, S., X. Chen, P. Lu, X. Yao, T.G. Wright, M. Rajurkar, K.-i. Kariya, J. Mao, Y.T. Ip, and L. Xu. 2011. Smad inhibition by the Ste20 kinase Misshapen. Proceedings of the National Academy of Sciences. 108:11127-11132.
Kanne, H., N. Burte, V. Prasanna, and R. Gujjula. 2015. Extraction and elemental analysis of <i>Coleus forskohlii</i> extract. Pharmacognosy Research. 7:237-241.
Kaplan, K.B., A.A. Burds, J.R. Swedlow, S.S. Bekir, P.K. Sorger, and I.S. Näthke. 2001. A role for the Adenomatous Polyposis Coli protein in chromosome segregation. Nature Cell Biology. 3:429-432.
228 Kawasaki, Y., T. Senda, T. Ishidate, R. Koyama, T. Morishita, Y. Iwayama, O.
Higuchi, and T. Akiyama. 2000. Asef, a Link Between the Tumor Suppressor APC and G-Protein Signaling. Science. 289:1194-1197.
Kean, M.J., D.F. Ceccarelli, M. Goudreault, M. Sanches, S. Tate, B. Larsen, L.C.D. Gibson, W.B. Derry, I.C. Scott, L. Pelletier, G.S. Baillie, F. Sicheri, and A.-C. Gingras. 2011. Structure-Function Analysis of Core STRIPAK Proteins: A SIGNALING COMPLEX IMPLICATED IN GOLGI POLARIZATION. Journal of Biological Chemistry. 286:25065-25075.
Kennelly, P.J., and E.G. Krebs. 1991. Consensus sequences as substrate specificity determinants for protein kinases and protein phosphatases. Journal of Biological Chemistry. 266:15555-15558.
Kim, J.-Y., H.S. Jeong, T. Chung, M. Kim, J.H. Lee, W.H. Jung, and J.S. Koo. 2017. The value of phosphohistone H3 as a proliferation marker for evaluating invasive breast cancers: A comparative study with Ki67. Oncotarget. 8:65064-65076.
Kim, J.W., C. Berrios, M. Kim, A.E. Schade, G. Adelmant, H. Yeerna, E. Damato, A.B. Iniguez, L. Florens, M.P. Washburn, K. Stegmaier, N.S. Gray, P. Tamayo, O. Gjoerup, J.A. Marto, J. DeCaprio, and W.C. Hahn. 2020. STRIPAK directs PP2A activity toward MAP4K4 to promote oncogenic transformation of human cells. eLife. 9:e53003.
Kirchhausen, T. 2000. Three ways to make a vesicle. Nature Reviews Molecular Cell Biology. 1:187-198.
Kohler, E.M., A. Derungs, G. Daum, J. Behrens, and J. Schneikert. 2008. Functional definition of the mutation cluster region of adenomatous polyposis coli in colorectal tumours. Human molecular genetics. 17:1978-1987.
Komarova, Y., C.O. De Groot, I. Grigoriev, S.M. Gouveia, E.L. Munteanu, J.M. Schober, S. Honnappa, R.M. Buey, C.C. Hoogenraad, M. Dogterom, G.G. Borisy, M.O. Steinmetz, and A. Akhmanova. 2009. Mammalian end binding proteins control persistent microtubule growth. Journal of Cell Biology. 184:691-706.
Kondo, A., S. Hashimoto, H. Yano, K. Nagayama, Y. Mazaki, and H. Sabe. 2000. A New Paxillin-binding Protein, PAG3/Papα/KIAA0400, Bearing an ADP-Ribosylation Factor GTPase-activating Protein Activity, Is Involved in Paxillin Recruitment to Focal Adhesions and Cell Migration. Molecular Biology of the Cell. 11:1315-1327.
Korinek, V., N. Barker, P.J. Morin, D. van Wichen, R. de Weger, K.W. Kinzler, B. Vogelstein, and H. Clevers. 1997. Constitutive Transcriptional Activation by a β-Catenin-Tcf Complex in APC<sup>−/−</sup> Colon Carcinoma. Science. 275:1784-1787.
Kretzschmar, K., and H. Clevers. 2017. Wnt/β-catenin signaling in adult mammalian epithelial stem cells. Developmental Biology. 428:273-282.
Krndija, D., F. El Marjou, B. Guirao, S. Richon, O. Leroy, Y. Bellaiche, E. Hannezo, and D. Matic Vignjevic. 2019. Active cell migration is critical for steady-state epithelial turnover in the gut. Science. 365:705-710.
Kroboth, K., I.P. Newton, K. Kita, D. Dikovskaya, J. Zumbrunn, C.M. Waterman-Storer, and I.S. Näthke. 2007. Lack of Adenomatous Polyposis Coli Protein Correlates with a Decrease in Cell Migration and Overall Changes in Microtubule Stability. Molecular Biology of the Cell. 18:910-918.
229 Lackie, J. 2010. mitotic shake-off method. Oxford University Press. Lamb, H. 1932. Hydrodynamics. Dover Publications. Langlands, A.J., T.D. Carroll, Y. Chen, and I. Näthke. 2018. Chir99021 and Valproic
acid reduce the proliferative advantage of Apc mutant cells. Cell Death & Disease. 9:255.
Lee, T.H., and A.D. Linstedt. 2000. Potential Role for Protein Kinases in Regulation of Bidirectional Endoplasmic Reticulum-to-Golgi Transport Revealed by Protein Kinase Inhibitor H89. Molecular Biology of the Cell. 11:2577-2590.
Lehmann, J.M., G. Riethmüller, and J.P. Johnson. 1990. Nck, a melanoma cDNA encoding a cytoplasmic protein consisting of the src homology units SH2 and SH3. Nucleic Acids Research. 18:1048-1048.
Lennerz, J.K., J.B. Hurov, L.S. White, K.T. Lewandowski, J.L. Prior, G.J. Planer, R.W. Gereau, D. Piwnica-Worms, R.E. Schmidt, and H. Piwnica-Worms. 2010. Loss of Par-1a/MARK3/C-TAK1 Kinase Leads to Reduced Adiposity, Resistance to Hepatic Steatosis, and Defective Gluconeogenesis. Molecular and Cellular Biology. 30:5043-5056.
Leroy, B., L. Girard, A. Hollestelle, J.D. Minna, A.F. Gazdar, and T. Soussi. 2014. Analysis of TP53 mutation status in human cancer cell lines: a reassessment. Hum Mutat. 35:756-765.
Lewellyn, L., M. Cetera, and S. Horne-Badovinac. 2013. Misshapen decreases integrin levels to promote epithelial motility and planar polarity in <em>Drosophila</em>. The Journal of Cell Biology. 200:721-729.
Li, M., C. Quan, R. Toth, D.G. Campbell, C. MacKintosh, H.Y. Wang, and S. Chen. 2015. Fasting and Systemic Insulin Signaling Regulate Phosphorylation of Brain Proteins That Modulate Cell Morphology and Link to Neurological Disorders. Journal of Biological Chemistry. 290:30030-30041.
Li, Q., S. Li, S. Mana-Capelli, Rachel J. Roth Flach, Laura V. Danai, A. Amcheslavsky, Y. Nie, S. Kaneko, X. Yao, X. Chen, Jennifer L. Cotton, J. Mao, D. McCollum, J. Jiang, Michael P. Czech, L. Xu, and Y.T. Ip. 2014. The Conserved Misshapen-Warts-Yorkie Pathway Acts in Enteroblasts to Regulate Intestinal Stem Cells in Drosophila. Developmental Cell. 31:291-304.
Li, Q., N.K. Nirala, H.-J. Chen, Y. Nie, W. Wang, B. Zhang, M.P. Czech, Q. Wang, L. Xu, J. Mao, and Y.T. Ip. 2019. The Misshapen subfamily of Ste20 kinases regulate proliferation in the aging mammalian intestinal epithelium. Journal of Cellular Physiology. 234:21925-21936.
Li, Vivian S.W., Ser S. Ng, Paul J. Boersema, Teck Y. Low, Wouter R. Karthaus, Jan P. Gerlach, S. Mohammed, Albert J.R. Heck, Madelon M. Maurice, T. Mahmoudi, and H. Clevers. 2012. Wnt Signaling through Inhibition of β-Catenin Degradation in an Intact Axin1 Complex. Cell. 149:1245-1256.
Lim, J., A. Lennard, P.W. Sheppard, and S. Kellie. 2003. Identification of residues which regulate activity of the STE20-related kinase hMINK. Biochemical and Biophysical Research Communications. 300:694-698.
Linding, R., R.B. Russell, V. Neduva, and T.J. Gibson. 2003. GlobPlot: exploring protein sequences for globularity and disorder. Nucleic Acids Research. 31:3701-3708.
Liu, W., X. Dong, M. Mai, R.S. Seelan, K. Taniguchi, K.K. Krishnadath, K.C. Halling, J.M. Cunningham, C. Qian, E. Christensen, P.C. Roche, D.I. Smith, and S.N.
230
Thibodeau. 2000. Mutations in AXIN2 cause colorectal cancer with defective mismatch repair by activating β-catenin/TCF signalling. Nature Genetics. 26:146-147.
Lizcano, J.M., O. Göransson, R. Toth, M. Deak, N.A. Morrice, J. Boudeau, S.A. Hawley, L. Udd, T.P. Mäkelä, D.G. Hardie, and D.R. Alessi. 2004. LKB1 is a master kinase that activates 13 kinases of the AMPK subfamily, including MARK/PAR-1. The EMBO Journal. 23:833-843.
Machicoane, M., C.A. de Frutos, J. Fink, M. Rocancourt, Y. Lombardi, S. Garel, M. Piel, and A. Echard. 2014. SLK-dependent activation of ERMs controls LGN–NuMA localization and spindle orientation. Journal of Cell Biology. 205:791-799.
Machida, N., M. Umikawa, K. Takei, N. Sakima, B.-E. Myagmar, K. Taira, H. Uezato, Y. Ogawa, and K.-i. Kariya. 2004. Mitogen-activated Protein Kinase Kinase Kinase Kinase 4 as a Putative Effector of Rap2 to Activate the c-Jun N-terminal Kinase. Journal of Biological Chemistry. 279:15711-15714.
Mackintosh, C. 2004. Dynamic interactions between 14-3-3 proteins and phosphoproteins regulate diverse cellular processes. Biochem J. 381:329-342.
MacKintosh, C., and D.E.K. Ferrier. 2017. Recent advances in understanding the roles of whole genome duplications in evolution. F1000Res. 6:1623-1623.
Madeira, F., M. Tinti, G. Murugesan, E. Berrett, M. Stafford, R. Toth, C. Cole, C. MacKintosh, and G.J. Barton. 2015. 14-3-3-Pred: improved methods to predict 14-3-3-binding phosphopeptides. Bioinformatics. 31:2276-2283.
Mahmoudi, T., V.S.W. Li, S.S. Ng, N. Taouatas, R.G.J. Vries, S. Mohammed, A.J. Heck, and H. Clevers. 2009. The kinase TNIK is an essential activator of Wnt target genes. The EMBO Journal. 28:3329-3340.
Manning, G., G.D. Plowman, T. Hunter, and S. Sudarsanam. 2002a. Evolution of protein kinase signaling from yeast to man. Trends in Biochemical Sciences. 27:514-520.
Manning, G., D.B. Whyte, R. Martinez, T. Hunter, and S. Sudarsanam. 2002b. The Protein Kinase Complement of the Human Genome. Science. 298:1912-1934.
Marshall, T.W., I.E. Lloyd, J.M. Delalande, I. Näthke, and J. Rosenblatt. 2011. The tumor suppressor adenomatous polyposis coli controls the direction in which a cell extrudes from an epithelium. Molecular Biology of the Cell. 22:3962-3970.
Martynovsky, M., M.-C. Wong, D.T. Byrd, J. Kimble, and J.E. Schwarzbauer. 2012. mig-38, a novel gene that regulates distal tip cell turning during gonadogenesis in C. elegans hermaphrodites. Developmental Biology. 368:404-414.
Masuda, M., Y. Uno, N. Ohbayashi, H. Ohata, A. Mimata, M. Kukimoto-Niino, H. Moriyama, S. Kashimoto, T. Inoue, N. Goto, K. Okamoto, M. Shirouzu, M. Sawa, and T. Yamada. 2016a. TNIK inhibition abrogates colorectal cancer stemness. In Nature communications. Vol. 7. 12586.
Masuda, M., Y. Uno, N. Ohbayashi, H. Ohata, A. Mimata, M. Kukimoto-Niino, H. Moriyama, S. Kashimoto, T. Inoue, N. Goto, K. Okamoto, M. Shirouzu, M. Sawa, and T. Yamada. 2016b. TNIK inhibition abrogates colorectal cancer stemness. Nature Communications. 7:12586.

231 Matsuoka, K., L. Orci, M. Amherdt, S.Y. Bednarek, S. Hamamoto, R. Schekman,
and T. Yeung. 1998. COPII-Coated Vesicle Formation Reconstituted with Purified Coat Proteins and Chemically Defined Liposomes. Cell. 93:263-275.
Mayor, R., and S. Etienne-Manneville. 2016. The front and rear of collective cell migration. Nature Reviews Molecular Cell Biology. 17:97.
McCartney, B.M., and R.G. Fehon. 1996. Distinct cellular and subcellular patterns of expression imply distinct functions for the Drosophila homologues of moesin and the neurofibromatosis 2 tumor suppressor, merlin. Journal of Cell Biology. 133:843-852.
McClatchey, A.I. 2014. ERM proteins at a glance. Journal of Cell Science. 127:3199-3204.
Meek, S.E.M., W.S. Lane, and H. Piwnica-Worms. 2004. Comprehensive Proteomic Analysis of Interphase and Mitotic 14-3-3-binding Proteins. Journal of Biological Chemistry. 279:32046-32054.
Meller, N., Y.C. Liu, T.L. Collins, N. Bonnefoy-Bérard, G. Baier, N. Isakov, and A. Altman. 1996. Direct interaction between protein kinase C theta (PKC theta) and 14-3-3 tau in T cells: 14-3-3 overexpression results in inhibition of PKC theta translocation and function. Molecular and Cellular Biology. 16:5782-5791.
Meng, Z., T. Moroishi, V. Mottier-Pavie, S.W. Plouffe, C.G. Hansen, A.W. Hong, H.W. Park, J.-S. Mo, W. Lu, S. Lu, F. Flores, F.-X. Yu, G. Halder, and K.-L. Guan. 2015. MAP4K family kinases act in parallel to MST1/2 to activate LATS1/2 in the Hippo pathway. Nature Communications. 6:8357.
Meng, Z., Y. Qiu, K.C. Lin, A. Kumar, J.K. Placone, C. Fang, K.-C. Wang, S. Lu, M. Pan, A.W. Hong, T. Moroishi, M. Luo, S.W. Plouffe, Y. Diao, Z. Ye, H.W. Park, X. Wang, F.-X. Yu, S. Chien, C.-Y. Wang, B. Ren, A.J. Engler, and K.-L. Guan. 2018. RAP2 mediates mechanoresponses of the Hippo pathway. Nature. 560:655-660.
Midgley, C.A., S. White, R. Howitt, V. Save, M.G. Dunlop, P.A. Hall, D.P. Lane, A.H. Wyllie, and V.J. Bubb. 1997. APC expression in normal human tissues. The Journal of pathology. 181:426-433.
Mikryukov, A., and T. Moss. 2012. Agonistic and Antagonistic Roles for TNIK and MINK in Non-Canonical and Canonical Wnt Signalling. PLOS ONE. 7:e43330.
Miller, E.A. 2013. The COPII cage sharpens its image. Nature Structural & Molecular Biology. 20:139-140.
Mitchison, T.J., G.T. Charras, and L. Mahadevan. 2008. Implications of a poroelastic cytoplasm for the dynamics of animal cell shape. Seminars in Cell & Developmental Biology. 19:215-223.
Moore, B., and V. Perez. 1967. Physiological and Biochemical Aspects of Nervous integration. Englewood Cliffs NJ, Prentice-Hall.
Moorhead, G., P. Douglas, V. Cotelle, J. Harthill, N. Morrice, S. Meek, U. Deiting, M. Stitt, M. Scarabel, A. Aitken, and C. MacKintosh. 1999. Phosphorylation-dependent interactions between enzymes of plant metabolism and 14-3-3 proteins. The Plant Journal. 18:1-12.
Moreno, C.S., S. Park, K. Nelson, D. Ashby, F. Hubalek, W.S. Lane, and D.C. Pallas. 2000. WD40 Repeat Proteins Striatin and S/G2 Nuclear Autoantigen Are Members of a Novel Family of Calmodulin-binding Proteins That Associate
232
with Protein Phosphatase 2A. Journal of Biological Chemistry. 275:5257-5263.
Morin, P.J., A.B. Sparks, V. Korinek, N. Barker, H. Clevers, B. Vogelstein, and K.W. Kinzler. 1997. Activation of β-Catenin-Tcf Signaling in Colon Cancer by Mutations in β-Catenin or APC. Science. 275:1787-1790.
Moroishi, T., C.G. Hansen, and K.-L. Guan. 2015. The emerging roles of YAP and TAZ in cancer. Nature Reviews Cancer. 15:73-79.
Moseley, J.B., F. Bartolini, K. Okada, Y. Wen, G.G. Gundersen, and B.L. Goode. 2007. Regulated Binding of Adenomatous Polyposis Coli Protein to Actin. Journal of Biological Chemistry. 282:12661-12668.
Moser, A.R., C. Luongo, K.A. Gould, M.K. McNeley, A.R. Shoemaker, and W.F. Dove. 1995a. ApcMin: A mouse model for intestinal and mammary tumorigenesis. European Journal of Cancer. 31:1061-1064.
Moser, A.R., A.R. Shoemaker, C.S. Connelly, L. Clipson, K.A. Gould, C. Luongo, W.F. Dove, P.H. Siggers, and R.L. Gardner. 1995b. Homozygosity for the Minallele of Apc results in disruption of mouse development prior to gastrulation. Developmental Dynamics. 203:422-433.
Moss, S.F., T.C. Liu, A. Petrotos, T.M. Hsu, L.I. Gold, and P.R. Holt. 1996. Inward growth of colonic adenomatous polyps. Gastroenterology. 111:1425-1432.
Muslin, A.J., J.W. Tanner, P.M. Allen, and A.S. Shaw. 1996. Interaction of 14-3-3 with Signaling Proteins Is Mediated by the Recognition of Phosphoserine. Cell. 84:889-897.
Nakagawa, H., Y. Murata, K. Koyama, A. Fujiyama, Y. Miyoshi, M. Monden, T. Akiyama, and Y. Nakamura. 1998. Identification of a Brain-specific <em>APC</em> Homologue, <em>APCL</em>, and Its Interaction with β-Catenin. Cancer Research. 58:5176-5181.
Nakatsuru, S., A. Yanagisawa, S. Ichii, E. Tahara, Y. Kato, Y. Nakamura, and A. Horii. 1992. Somatic mutation of the APC gene in gastric cancer: frequent mutations in very well differentiated adenocarcinoma and signet-ring cell carcinoma. Human molecular genetics. 1:559-563.
Näthke, I. 2005. Relationship between the role of the adenomatous polyposis coli protein in colon cancer and its contribution to cytoskeletal regulation. Biochemical Society Transactions. 33:694-697.
Näthke, I.S., C.L. Adams, P. Polakis, J.H. Sellin, and W.J. Nelson. 1996. The adenomatous polyposis coli tumor suppressor protein localizes to plasma membrane sites involved in active cell migration. The Journal of Cell Biology. 134:165-179.
National Center for Biotechnology Information. 2020. Nocodazole. Vol. 2020. PubChem Database.
Ndubaku, C.O., T.D. Crawford, H. Chen, J.W. Boggs, J. Drobnick, S.F. Harris, R. Jesudason, E. McNamara, J. Nonomiya, A. Sambrone, S. Schmidt, T. Smyczek, P. Vitorino, L. Wang, P. Wu, S. Yeung, J. Chen, K. Chen, C.Z. Ding, T. Wang, Z. Xu, S.E. Gould, L.J. Murray, and W. Ye. 2015. Structure-Based Design of GNE-495, a Potent and Selective MAP4K4 Inhibitor with Efficacy in Retinal Angiogenesis. In ACS medicinal chemistry letters. Vol. 6. 913-918.
Nelson, S., and I.S. Näthke. 2013. Interactions and functions of the adenomatous polyposis coli (APC) protein at a glance. Journal of Cell Science. 126:873-877.
233 Nelson, S.A., Z. Li, I.P. Newton, D. Fraser, R.E. Milne, D.M.A. Martin, D. Schiffmann,
X. Yang, D. Dormann, C.J. Weijer, P.L. Appleton, and I.S. Näthke. 2012. Tumorigenic fragments of APC cause dominant defects in directional cell migration in multiple model systems. Disease Models & Mechanisms. 5:940-947.
Newton, I.P., N.S. Kenneth, P.L. Appleton, I. Näthke, and S. Rocha. 2010. Adenomatous polyposis coli and hypoxia-inducible factor-1{alpha} have an antagonistic connection. Molecular biology of the cell. 21:3630-3638.
Nicke, B., J. Bastien, S.J. Khanna, P.H. Warne, V. Cowling, S.J. Cook, G. Peters, O. Delpuech, A. Schulze, K. Berns, J. Mullenders, R.L. Beijersbergen, R. Bernards, T.S. Ganesan, J. Downward, and D.C. Hancock. 2005. Involvement of MINK, a Ste20 Family Kinase, in Ras Oncogene-Induced Growth Arrest in Human Ovarian Surface Epithelial Cells. Molecular Cell. 20:673-685.
Niewiadomska, P., D. Godt, and U. Tepass. 1999. DE-Cadherin Is Required for Intercellular Motility during Drosophila Oogenesis. Journal of Cell Biology. 144:533-547.
Nishisho, I., Y. Nakamura, Y. Miyoshi, Y. Miki, H. Ando, A. Horii, K. Koyama, J. Utsunomiya, S. Baba, and P. Hedge. 1991. Mutations of chromosome 5q21 genes in FAP and colorectal cancer patients. Science. 253:665-669.
Nonaka, H., K. Takei, M. Umikawa, M. Oshiro, K. Kuninaka, M. Bayarjargal, T. Asato, Y. Yamashiro, Y. Uechi, S. Endo, T. Suzuki, and K.-i. Kariya. 2008. MINK is a Rap2 effector for phosphorylation of the postsynaptic scaffold protein TANC1. Biochemical and Biophysical Research Communications. 377:573-578.
Oshima, H., M. Oshima, M. Kobayashi, M. Tsutsumi, and M.M. Taketo. 1997. Morphological and Molecular Processes of Polyp Formation in <em>Apc</em>Δ716 Knockout Mice. Cancer Research. 57:1644-1649.
Oshima, M., H. Oshima, K. Kitagawa, M. Kobayashi, C. Itakura, and M. Taketo. 1995. Loss of Apc heterozygosity and abnormal tissue building in nascent intestinal polyps in mice carrying a truncated Apc gene. Proceedings of the National Academy of Sciences. 92:4482-4486.
Oxford University Press. 2020. Gene/Protein Nomenclature Guidelines and Requirements. Vol. 2020. O.U. Press, editor.
Paricio, N., F. Feiguin, M. Boutros, S. Eaton, and M. Mlodzik. 1999. The <em>Drosophila</em> STE20‐like kinase Misshapen is required downstream of the Frizzled receptor in planar polarity signaling. The EMBO Journal. 18:4669-4678.
Parrini, Maria C., A. Sadou-Dubourgnoux, K. Aoki, K. Kunida, M. Biondini, A. Hatzoglou, P. Poullet, E. Formstecher, C. Yeaman, M. Matsuda, C. Rossé, and J. Camonis. 2011. SH3BP1, an Exocyst-Associated RhoGAP, Inactivates Rac1 at the Front to Drive Cell Motility. Molecular Cell. 42:650-661.
Pelaseyed, T., and A. Bretscher. 2018. Regulation of actin-based apical structures on epithelial cells. Journal of Cell Science. 131:jcs221853.
Pelaseyed, T., R. Viswanatha, C. Sauvanet, J.J. Filter, M.L. Goldberg, and A. Bretscher. 2017. Ezrin activation by LOK phosphorylation involves a PIP2-dependent wedge mechanism. eLife. 6:e22759.
234 Peng, C., P. Graves, S. Ogg, R. Thoma, M. Byrnes, 3rd, Z. Wu, M. Stephenson, and
H. Piwnica-Worms. 1998. C-TAK1 protein kinase phosphorylates human Cdc25C on serine 216 and promotes 14-3-3 protein binding. Cell Growth Differ. 9:197-208.
Petitjean, L., M. Reffay, E. Grasland-Mongrain, M. Poujade, B. Ladoux, A. Buguin, and P. Silberzan. 2010. Velocity fields in a collectively migrating epithelium. Biophysical journal. 98:1790-1800.
Plutoni, C., S. Keil, C. Zeledon, L.E.A. Delsin, B. Decelle, P.P. Roux, S. Carréno, and G. Emery. 2019. Misshapen coordinates protrusion restriction and actomyosin contractility during collective cell migration. Nature communications. 10:3940-3940.
Popow, O. 2016. Novel interactions and functions of the Adenomatous polyposis coli protein. In Division for Cell and Developmental Biology. Vol. Doctor of Philosophy. University of Dundee - School of Life Sciences. 1-199.
Popow, O., J.A. Paulo, M.H. Tatham, M.S. Volk, A. Rojas-Fernandez, N. Loyer, I.P. Newton, J. Januschke, K.M. Haigis, and I. Nathke. 2019. Identification of endogenous Adenomatous polyposis coli interaction partners and β-catenin-independent targets by proteomics. Molecular Cancer Research:molcanres.1154.2018.
Poujade, M., E. Grasland-Mongrain, A. Hertzog, J. Jouanneau, P. Chavrier, B. Ladoux, A. Buguin, and P. Silberzan. 2007. Collective migration of an epithelial monolayer in response to a model wound. Proceedings of the National Academy of Sciences. 104:15988-15993.
Putnam, N.H., T. Butts, D.E.K. Ferrier, R.F. Furlong, U. Hellsten, T. Kawashima, M. Robinson-Rechavi, E. Shoguchi, A. Terry, J.-K. Yu, E.l. Benito-Gutiérrez, I. Dubchak, J. Garcia-Fernàndez, J.J. Gibson-Brown, I.V. Grigoriev, A.C. Horton, P.J. de Jong, J. Jurka, V.V. Kapitonov, Y. Kohara, Y. Kuroki, E. Lindquist, S. Lucas, K. Osoegawa, L.A. Pennacchio, A.A. Salamov, Y. Satou, T. Sauka-Spengler, J. Schmutz, T. Shin-I, A. Toyoda, M. Bronner-Fraser, A. Fujiyama, L.Z. Holland, P.W.H. Holland, N. Satoh, and D.S. Rokhsar. 2008. The amphioxus genome and the evolution of the chordate karyotype. Nature. 453:1064-1071.
Quyn, A.J., P.L. Appleton, F.A. Carey, R.J.C. Steele, N. Barker, H. Clevers, R.A. Ridgway, O.J. Sansom, and I.S. Näthke. 2010. Spindle Orientation Bias in Gut Epithelial Stem Cell Compartments Is Lost in Precancerous Tissue. Cell Stem Cell. 6:175-181.
Rao, V.S., K. Srinivas, G.N. Sujini, and G.N.S. Kumar. 2014. Protein-Protein Interaction Detection: Methods and Analysis. International Journal of Proteomics. 2014:147648.
Read, J. Human tnik in complex with compound 9. To be published. Renard, H.-F., M. Simunovic, J. Lemière, E. Boucrot, M.D. Garcia-Castillo, S.
Arumugam, V. Chambon, C. Lamaze, C. Wunder, A.K. Kenworthy, A.A. Schmidt, H.T. McMahon, C. Sykes, P. Bassereau, and L. Johannes. 2015. Endophilin-A2 functions in membrane scission in clathrin-independent endocytosis. Nature. 517:493-496.
Rhodes, D.R., S. Kalyana-Sundaram, V. Mahavisno, R. Varambally, J. Yu, B.B. Briggs, T.R. Barrette, M.J. Anstet, C. Kincead-Beal, P. Kulkarni, S. Varambally, D. Ghosh, and A.M. Chinnaiyan. 2007. Oncomine 3.0: Genes,
235
Pathways, and Networks in a Collection of 18,000 Cancer Gene Expression Profiles. Neoplasia. 9:166-180.
Riddle, D., T. Blumenthal, B. Meyer, and e. al. 1997. Part A, Genetic Nomenclature. In C. elegans II. 2nd edition. C.S.H. (NY), editor. Cold Spring Harbor Laboratory Press.
Rider, M.H., E. Waelkens, R. Derua, and D. Vertommen. 2009. Fulfilling the Krebs and Beavo criteria for studying protein phosphorylation in the era of mass spectrometry-driven kinome research. Archives of Physiology and Biochemistry. 115:298-310.
Riento, K., and A.J. Ridley. 2003. ROCKs: multifunctional kinases in cell behaviour. Nature Reviews Molecular Cell Biology. 4:446-456.
Rosenberg, M.M., F. Yang, M. Giovanni, J.L. Mohn, M.K. Temburni, and M.H. Jacob. 2008. Adenomatous polyposis coli plays a key role, in vivo, in coordinating assembly of the neuronal nicotinic postsynaptic complex. Molecular and Cellular Neuroscience. 38:138-152.
Roth Flach, R.J., C.-A. Guo, L.V. Danai, J.C. Yawe, S. Gujja, Y.J.K. Edwards, and M.P. Czech. 2016. Endothelial Mitogen-Activated Protein Kinase Kinase Kinase Kinase 4 Is Critical for Lymphatic Vascular Development and Function. Molecular and Cellular Biology. 36:1740-1749.
Roth Flach, R.J., A. Skoura, A. Matevossian, L.V. Danai, W. Zheng, C. Cortes, S.K. Bhattacharya, M. Aouadi, N. Hagan, J.C. Yawe, P. Vangala, L.G. Menendez, M.P. Cooper, T.P. Fitzgibbons, L. Buckbinder, and M.P. Czech. 2015. Endothelial protein kinase MAP4K4 promotes vascular inflammation and atherosclerosis. Nature Communications. 6:8995.
Roubinet, C., B. Decelle, G. Chicanne, J.F. Dorn, B. Payrastre, F. Payre, and S. Carreno. 2011. Molecular networks linked by Moesin drive remodeling of the cell cortex during mitosis. Journal of Cell Biology. 195:99-112.
Rowan, A.J., H. Lamlum, M. Ilyas, J. Wheeler, J. Straub, A. Papadopoulou, D. Bicknell, W.F. Bodmer, and I.P. Tomlinson. 2000. APC mutations in sporadic colorectal tumors: A mutational "hotspot" and interdependence of the "two hits". Proceedings of the National Academy of Sciences of the United States of America. 97:3352-3357.
RUBIO, M.P., K.M. GERAGHTY, B.H.C. WONG, N.T. WOOD, D.G. CAMPBELL, N. MORRICE, and C. MACKINTOSH. 2004. 14-3-3-affinity purification of over 200 human phosphoproteins reveals new links to regulation of cellular metabolism, proliferation and trafficking. Biochemical Journal. 379:395-408.
Sandí, M.-J., C.B. Marshall, M. Balan, É. Coyaud, M. Zhou, D.M. Monson, N. Ishiyama, A.A. Chandrakumar, J. La Rose, A.L. Couzens, A.-C. Gingras, B. Raught, W. Xu, M. Ikura, D.K. Morrison, and R. Rottapel. 2017. MARK3-mediated phosphorylation of ARHGEF2 couples microtubules to the actin cytoskeleton to establish cell polarity. Sci Signal. 10:eaan3286.
Schatoff, E.M., S. Goswami, M.P. Zafra, M. Foronda, M. Shusterman, B.I. Leach, A. Katti, B.J. Diaz, and L.E. Dow. 2019. Distinct Colorectal Cancer–Associated APC Mutations Dictate Response to Tankyrase Inhibition. Cancer Discovery. 9:1358-1371.
Schröder, P., T. Förster, S. Kleine, C. Becker, A. Richters, S. Ziegler, D. Rauh, K. Kumar, and H. Waldmann. 2015. Neuritogenic militarinone-inspired 4-
236
hydroxypyridones target the stress pathway kinase MAP4K4. Angew Chem Int Ed Engl. 54:12398-12403.
Schweitzer, J.K., A.E. Sedgwick, and C. D'Souza-Schorey. 2011. ARF6-mediated endocytic recycling impacts cell movement, cell division and lipid homeostasis. Seminars in Cell & Developmental Biology. 22:39-47.
Seamon, K.B., W. Padgett, and J.W. Daly. 1981. Forskolin: unique diterpene activator of adenylate cyclase in membranes and in intact cells. Proceedings of the National Academy of Sciences of the United States of America. 78:3363-3367.
Seeling, J.M., J.R. Miller, R. Gil, R.T. Moon, R. White, and D.M. Virshup. 1999. Regulation of β-Catenin Signaling by the B56 Subunit of Protein Phosphatase 2A. Science. 283:2089-2091.
Seidensticker, M.J., and J. Behrens. 2000. Biochemical interactions in the wnt pathway. Biochimica et Biophysica Acta (BBA) - Molecular Cell Research. 1495:168-182.
Shih, I.-M., J. Yu, T.-C. He, B. Vogelstein, and K.W. Kinzler. 2000. The β-Catenin Binding Domain of Adenomatous Polyposis Coli Is Sufficient for Tumor Suppression. Cancer Research. 60:1671-1676.
Shitashige, M., R. Satow, T. Jigami, K. Aoki, K. Honda, T. Shibata, M. Ono, S. Hirohashi, and T. Yamada. 2010. Traf2- and Nck-Interacting Kinase Is Essential for Wnt Signaling and Colorectal Cancer Growth. Cancer Research. 70:5024-5033.
Silverberg, J.L., M. Bierbaum, J.P. Sethna, and I. Cohen. 2013. Collective Motion of Humans in Mosh and Circle Pits at Heavy Metal Concerts. Physical Review Letters. 110:228701.
Smith, F.D., B.K. Samelson, and J.D. Scott. 2011. Discovery of cellular substrates for protein kinase A using a peptide array screening protocol. Biochem J. 438:103-110.
Someya, A., M. Sata, K. Takeda, G. Pacheco-Rodriguez, V.J. Ferrans, J. Moss, and M. Vaughan. 2001. ARF-GEP<sub>100</sub>, a guanine nucleotide-exchange protein for ADP-ribosylation factor 6. Proceedings of the National Academy of Sciences. 98:2413-2418.
Spicer, J., S. Rayter, N. Young, R. Elliott, A. Ashworth, and D. Smith. 2003. Regulation of the Wnt signalling component PAR1A by the Peutz–Jeghers syndrome kinase LKB1. Oncogene. 22:4752-4756.
Stamos, J.L., and W.I. Weis. 2013. The β-Catenin Destruction Complex. Cold Spring Harbor Perspectives in Biology. 5.
Strachan, M.W.J., R.M. Reynolds, R.E. Marioni, and J.F. Price. 2011. Cognitive function, dementia and type 2 diabetes mellitus in the elderly. Nature Reviews Endocrinology. 7:108-114.
Su, L.-K., M. Burrell, D.E. Hill, J. Gyuris, R. Brent, R. Wiltshire, J. Trent, B. Vogelstein, and K.W. Kinzler. 1995. APC Binds to the Novel Protein EB1. Cancer Research. 55:2972-2977.
Su, L.-K., K.A. Johnson, K.J. Smith, D.E. Hill, B. Vogelstein, and K.W. Kinzler. 1993. Association between Wild Type and Mutant <em>APC</em> Gene Products. Cancer Research. 53:2728-2731.
237 Su, L., K. Kinzler, B. Vogelstein, A. Preisinger, A. Moser, C. Luongo, K. Gould, and
W. Dove. 1992. Multiple intestinal neoplasia caused by a mutation in the murine homolog of the APC gene. Science. 256:668-670.
Su, Y.C., J. Han, S. Xu, M. Cobb, and E.Y. Skolnik. 1997. NIK is a new Ste20‐related kinase that binds NCK and MEKK1 and activates the SAPK/JNK cascade via a conserved regulatory domain. The EMBO Journal. 16:1279-1290.
Su, Y.C., J.E. Treisman, and E.Y. Skolnik. 1998. The Drosophila Ste20-related kinase misshapen is required for embryonic dorsal closure and acts through a JNK MAPK module on an evolutionarily conserved signaling pathway. Genes Dev. 12:2371-2380.
Suijkerbuijk, S.J.E., G. Kolahgar, I. Kucinski, and E. Piddini. 2016. Cell Competition Drives the Growth of Intestinal Adenomas in Drosophila. Current Biology. 26:428-438.
Sun, C., L. Tian, J. Nie, H. Zhang, X. Han, and Y. Shi. 2012. Inactivation of MARK4, an AMP-activated protein kinase (AMPK)-related kinase, leads to insulin hypersensitivity and resistance to diet-induced obesity. The Journal of biological chemistry. 287:38305-38315.
Taira, K., M. Umikawa, K. Takei, B.-E. Myagmar, M. Shinzato, N. Machida, H. Uezato, S. Nonaka, and K.-i. Kariya. 2004. The Traf2- and Nck-interacting Kinase as a Putative Effector of Rap2 to Regulate Actin Cytoskeleton. Journal of Biological Chemistry. 279:49488-49496.
The Jackson Laboratory. 2019. Tg(EIIa-cre)C5379Lmgd/J. Vol. 2019. Thielicke, W. 2020. PIVlab - particle image velocimetry (PIV) tool. MATLAB Central
File Exchange. Thielicke, W., and E.J. Stamhuis. 2014. PIVlab – Towards User-friendly, Affordable
and Accurate Digital Particle Image Velocimetry in MATLAB. Journal of Open Research Software. 2:e30.
Thurmond, J., J.L. Goodman, V.B. Strelets, H. Attrill, L S. Gramates, S.J. Marygold, B.B. Matthews, G. Millburn, G. Antonazzo, V. Trovisco, T.C. Kaufman, B.R. Calvi, and t.F. Consortium. 2018. FlyBase 2.0: the next generation. Nucleic Acids Research. 47:D759-D765.
Tinti, M., F. Madeira, G. Murugesan, G. Hoxhaj, R. Toth, and C. MacKintosh. 2014. ANIA: ANnotation and Integrated Analysis of the 14-3-3 interactome. Database. 2014.
Torres-Quesada, O., J.E. Mayrhofer, and E. Stefan. 2017. The many faces of compartmentalized PKA signalosomes. Cellular Signalling. 37:1-11.
Trepat, X., and E. Sahai. 2018. Mesoscale physical principles of collective cell organization. Nature Physics. 14:671-682.
Ubersax, J.A., and J.E. Ferrell Jr. 2007. Mechanisms of specificity in protein phosphorylation. Nature Reviews Molecular Cell Biology. 8:530-541.
Uehata, M., T. Ishizaki, H. Satoh, T. Ono, T. Kawahara, T. Morishita, H. Tamakawa, K. Yamagami, J. Inui, M. Maekawa, and S. Narumiya. 1997. Calcium sensitization of smooth muscle mediated by a Rho-associated protein kinase in hypertension. Nature. 389:990-994.
Uhlén, M., L. Fagerberg, B.M. Hallström, C. Lindskog, P. Oksvold, A. Mardinoglu, Å. Sivertsson, C. Kampf, E. Sjöstedt, A. Asplund, I. Olsson, K. Edlund, E. Lundberg, S. Navani, C.A.-K. Szigyarto, J. Odeberg, D. Djureinovic, J.O. Takanen, S. Hober, T. Alm, P.-H. Edqvist, H. Berling, H. Tegel, J. Mulder, J.
238
Rockberg, P. Nilsson, J.M. Schwenk, M. Hamsten, K. von Feilitzen, M. Forsberg, L. Persson, F. Johansson, M. Zwahlen, G. von Heijne, J. Nielsen, and F. Pontén. 2015. Tissue-based map of the human proteome. Science. 347:1260419.
Veeman, M.T., D.C. Slusarski, A. Kaykas, S.H. Louie, and R.T. Moon. 2003. Zebrafish Prickle, a Modulator of Noncanonical Wnt/Fz Signaling, Regulates Gastrulation Movements. Current Biology. 13:680-685.
Viswanatha, R., P.Y. Ohouo, M.B. Smolka, and A. Bretscher. 2012. Local phosphocycling mediated by LOK/SLK restricts ezrin function to the apical aspect of epithelial cells. Journal of Cell Biology. 199:969-984.
Vitorino, P., S. Yeung, A. Crow, J. Bakke, T. Smyczek, K. West, E. McNamara, J. Eastham-Anderson, S. Gould, S.F. Harris, C. Ndubaku, and W. Ye. 2015. MAP4K4 regulates integrin-FERM binding to control endothelial cell motility. Nature. 519:425-430.
Vivarelli, S., L. Wagstaff, and E. Piddini. 2012. Cell wars: regulation of cell survival and proliferation by cell competition. Essays in Biochemistry. 53:69-82.
Vollmar, M., I. Alfano, B. Shrestha, J. Bray, J.R.C. Muniz, A. Roos, P. Filippakopoulos, N. Burgess-Brown, E. Ugochukwu, O. Gileadi, C. Phillips, P. Mahajan, A.C.W. Pike, O. Fedorov, A. Chaikuad, F. von Delft, C. Bountra, C.H. Arrowsmith, J. Weigelt, A. Edwards, and S. Knapp. Crystal structure of the kinase domain of human Traf2- and Nck- interacting Kinase with Wee1Chk1 inhibitor. To be published.
Wahl, A.F., K.L. Donaldson, C. Faircnild, F.Y.F. Lee, S.A. Foster, G.W. Demers, and D.A. Galloway. 1996. Loss of normal p53 function confers sensitization to Taxol by increasing G2/M arrest and apoptosis. Nature Medicine. 2:72-79.
Wang, L., M. Stanley, J.W. Boggs, T.D. Crawford, B.J. Bravo, A.M. Giannetti, S.F. Harris, S.R. Magnuson, J. Nonomiya, S. Schmidt, P. Wu, W. Ye, S.E. Gould, L.J. Murray, C.O. Ndubaku, and H. Chen. 2014. Fragment-based identification and optimization of a class of potent pyrrolo[2,1-f][1,2,4]triazine MAP4K4 inhibitors. Bioorg Med Chem Lett. 24:4546-4552.
Wang, Q., S.P. Amato, D.M. Rubitski, M.M. Hayward, B.L. Kormos, P.R. Verhoest, L. Xu, N.J. Brandon, and M.D. Ehlers. 2016. Identification of Phosphorylation Consensus Sequences and Endogenous Neuronal Substrates of the Psychiatric Risk Kinase TNIK. Journal of Pharmacology and Experimental Therapeutics. 356:410-423.
Watanabe, T., S. Wang, J. Noritake, K. Sato, M. Fukata, M. Takefuji, M. Nakagawa, N. Izumi, T. Akiyama, and K. Kaibuchi. 2004. Interaction with IQGAP1 Links APC to Rac1, Cdc42, and Actin Filaments during Cell Polarization and Migration. Developmental Cell. 7:871-883.
Webb, D.J., J.T. Parsons, and A.F. Horwitz. 2002. Adhesion assembly, disassembly and turnover in migrating cells – over and over and over again. Nature Cell Biology. 4:E97.
Wong, M.H., M.L. Hermiston, A.J. Syder, and J.I. Gordon. 1996. Forced expression of the tumor suppressor adenomatosis polyposis coli protein induces disordered cell migration in the intestinal epithelium. Proceedings of the National Academy of Sciences of the United States of America. 93:9588-9593.
239 Wu, B., and W. Guo. 2015. The Exocyst at a Glance. Journal of Cell Science.
128:2957-2964. Wu, M.Y., and C.S. Hill. 2009. TGF-β Superfamily Signaling in Embryonic
Development and Homeostasis. Developmental Cell. 16:329-343. Wurzenberger, C., and D.W. Gerlich. 2011. Phosphatases: providing safe passage
through mitotic exit. Nature Reviews Molecular Cell Biology. 12:469-482. Xue, Y., X. Wang, Z. Li, N. Gotoh, D. Chapman, and E.Y. Skolnik. 2001. Mesodermal
patterning defect in mice lacking the Ste20 NCK interacting kinase (NIK). Development. 128:1559-1572.
Yaffe, M.B. 2002. How do 14-3-3 proteins work? – Gatekeeper phosphorylation and the molecular anvil hypothesis. FEBS Letters. 513:53-57.
Yaffe, M.B., K. Rittinger, S. Volinia, P.R. Caron, A. Aitken, H. Leffers, S.J. Gamblin, S.J. Smerdon, and L.C. Cantley. 1997. The Structural Basis for 14-3-3:Phosphopeptide Binding Specificity. Cell. 91:961-971.
Yamashita, Y.M., D.L. Jones, and M.T. Fuller. 2003. Orientation of Asymmetric Stem Cell Division by the APC Tumor Suppressor and Centrosome. Science. 301:1547-1550.
Yu, D., J. Hu, Z. Sheng, G. Fu, Y. Wang, Y. Chen, Z. Pan, X. Zhang, Y. Wu, H. Sun, J. Dai, L. Lu, and H. Ouyang. 2019. Dual roles of misshapen/NIK-related kinase (MINK1) in osteoarthritis subtypes through the activation of TGFβ signaling. Osteoarthritis and Cartilage.
Yu, F.-X., and K.-L. Guan. 2013. The Hippo pathway: regulators and regulations. Genes & Development. 27:355-371.
Yue, J., M. Xie, X. Gou, P. Lee, Michael D. Schneider, and X. Wu. 2014. Microtubules Regulate Focal Adhesion Dynamics through MAP4K4. Developmental Cell. 31:572-585.
Yue, M., D. Luo, S. Yu, P. Liu, Q. Zhou, M. Hu, Y. Liu, S. Wang, Q. Huang, Y. Niu, L. Lu, and H. Hu. 2016. Misshapen/NIK-related kinase (MINK1) is involved in platelet function, hemostasis, and thrombus formation. Blood. 127:927-937.
Zhan, T., N. Rindtorff, and M. Boutros. 2016. Wnt signaling in cancer. Oncogene. 36:1461.
Zhang, L., and J.W. Shay. 2017. Multiple Roles of APC and its Therapeutic Implications in Colorectal Cancer. J Natl Cancer Inst. 109:djw332.
Zhang, X.-M., S. Ellis, A. Sriratana, C.A. Mitchell, and T. Rowe. 2004. Sec15 Is an Effector for the Rab11 GTPase in Mammalian Cells. Journal of Biological Chemistry. 279:43027-43034.
Zieger, H.L., S.-A. Kunde, N. Rademacher, B. Schmerl, and S.A. Shoichet. 2020. Disease-associated synaptic scaffold protein CNK2 modulates PSD size and influences localisation of the regulatory kinase TNIK. Scientific Reports. 10:5709.
Zumbrunn, J., K. Kinoshita, A.A. Hyman, and I.S. Näthke. 2001. Binding of the adenomatous polyposis coli protein to microtubules increases microtubule stability and is regulated by GSK3β phosphorylation. Current Biology. 11:44-49.