PET of Hypoxia and Perfusion with 62 Cu-ATSM and 62 Cu-PTSM Using a 62 Zn/ 62 Cu Generator
Upload
independentCategory
view
0download
0
Catalysis Today 70 (2001) 91–105
Interaction of N2, CO and NO with Cu-exchanged ETS-10:a compared FTIR study with other Cu-zeolites
and with dispersed Cu2O�
S. Bordigaa,∗, C. Pazéa, G. Berliera, D. Scaranoa, G. Spotoa,A. Zecchinaa, C. Lambertib
a Dipartimento di Chimica IFM, I-10125 Via P. Giuria 7, Torino, Italyb Dipartimento di Chimica IFM, Unità INFM Torino-Università, I-10125 Via P. Giuria 7, Torino, Italy
Abstract
After a brief overview of the reasons why, in spite of the high fraction of framework Ti(IV) atoms, Engelhard titanosilicate(ETS-10) cannot be used as competitive catalyst in partial oxidation reactions, we draw the attention on the fact that the highcation density of ETS-10 can be the key property for potential new catalytic applications of this recent material. Amongall, cation exchange with Cu2+ can yield to Cu-ETS-10, a promising material for environmental catalysis. We so present adetailed characterization of this material using N2, CO and NO as probe molecules. In spite of the rather high complexity ofthe obtained spectra, a comparison with similar experiments (described in the literature or ad hoc performed for this work) onother Cu-exchanged zeolites and on Cu2O dispersed on silica and on MCM-41, allows a full interpretation of the spectroscopicproperties. It is shown that copper is present both as counterion and in the form of Cu2O nanoclusters dispersed in the ETS-10channels and in the external surface. Finally, IR spectroscopy has been used to demonstrate that Cu-ETS-10 is active in thedecomposition of NO. © 2001 Published by Elsevier Science B.V.
Keywords: Titanosilicate; ETS-10; FTIR spectroscopy; CO; N2; NO; Cu-exchanged zeolites; NO decomposition
1. Introduction
Engelhard titanosilicate (ETS-10) is a new microp-orous crystalline material belonging to the family ofTi-substituted silicates containing Ti in octahedral co-ordination [1,2]. Because of its inherently disorderednature, preventing the use of conventional diffractionapproaches, the structure of ETS-10 was solved only5 years after its synthesis by Anderson et al. [3–5]. To
� Paper submitted for publication on Catalysis Today as an articlein the special issue devoted to Jean-Claude Lavalley’s 60th birthdayentitled: “IR Spectroscopy Applied to Catalysis”.
∗ Corresponding author. Tel.:+39-011-6707858;fax: +39-011-6707855.E-mail address: [email protected] (S. Bordiga).
achieve this goal, high resolution transmission elec-tron microscopy, powder X-ray diffraction, solid stateNMR and molecular modeling techniques were used.They proved that ETS-10 framework is composed ofcorner-sharing SiO4 tetrahedra and TiO6 octahedralinked through bridging oxygen atoms, and that twosets of perpendicular 12-ring channels having an el-liptical cross-section 7.6 Å × 4.9 Å are present. Therecent single crystal study by Wang and Jacobson [6]has confirmed the model of Anderson et al. To have acomplete view on the recent progresses obtained in thesynthesis and in the characterization of microporoustitanosilicates and mixed octahedra–tetrahedra frame-work oxides, the reader should refer to the review ofRocha and Anderson [7].
0920-5861/01/$ – see front matter © 2001 Published by Elsevier Science B.V.PII: S0920-5861(01)00410-2

92 S. Bordiga et al. / Catalysis Today 70 (2001) 91–105
It is worth noticing that the TiO6 octahedra inETS-10 are linked together with formation of linear· · · –O–Ti–O–Ti–O–Ti–O–· · · chains (each Ti atombeing also linked, in the perpendicular plane, to fourSi atoms through oxygen bridges). Sankar et al. [8],performing Ti K-edge extended X-ray absorption finestructure (EXAFS), have confirmed the octahedral co-ordination of Ti proposed in Refs. [3–5] highlightingthe local structure around titanium. The presence ofsuch linear· · · –O–Ti–O–Ti–O–Ti–O–· · · chains rep-resents the realization of a monoatomic quantum wirehosted in a silicaceous matrix exhibiting interestingand promising optical properties [9–11].
The octahedral coordination of Ti in ETS-10 isdifferent from that found in other titanosilicates suchas Ti-� [12] or TS-1 [13–15], where Ti is tetrahe-drally coordinated, like silicon, to four framework Oatoms. This implies that Ti atoms in ETS-10 havealready saturated their coordination sphere and thatthey cannot interact with molecules adsorbed in thechannels. This was demonstrated by Sankar et al. [8],who have showed that the Ti K-edge XANES spectraof ETS-10 are not affected by interaction with lig-ands, contrarily to what observed for TS-1, where Tiis able to modify reversibly its coordination sphere[14–16]. As a consequence, ETS-10 is not suitablefor oxidation catalysis employing H2O2 under mildconditions as is the case of TS-1 [13,14].
It should therefore be concluded that the octahe-dral coordination of titanium in ETS-10 makes thechemistry of Ti of no catalytic interest. Nevertheless,the insertion of a Ti(IV) atom in a 6-fold coordi-nated framework site implies the transfer of twoelectrons to the lattice which so becomes negativelycharged. The resulting negative charge of the frame-work Si40Ti8O104
16− unit is balanced by the presenceof Na+ and K+ counterions located in the channels[17–19]. The high number of framework Ti(Si/Ti =5) and the fact that each Ti needs the presence of twomonovalent counterions, make the number of coun-terions rather high. This fact implies that ETS-10 is amicroporous material exhibiting remarkable cation ex-change capabilities. As a consequence, ETS-10 showspotential application in the fields of bi-functionalityinduced by metal loading [7], of photocatalysis [7,20]and of base catalysis [7] (vide infra).
It has been shown that alkali-metal cations caneasily substitute the original Na+ and K+ counterions
leading to the Li+, Na+, K+, Rb+ or Cs+ forms[10,21] and that the cation exchange with alkali-metalcations represent a reliable mean to tune the basic-ity of the material. This property has been exploitedby Anderson and co-workers [22] and by the groupof Sivasanker [23,24], who have studied the bifunc-tional reforming reaction of hexane to benzene overPt-supported basic ETS-10. The high basicity ofETS-10 is evidenced in the conversion of isopropanolto acetone [25] and in the dehydration oft-butanol[7].
The high cation density suggests that the exchangecapacity towards di-valent cations should be facil-itated. Indeed, ETS-10 has been shown to be par-ticularly selective in the hosting of Pb2+ [26] andCd2+ [7] cations. Very recently, Otero Areán et al.[27] reported an IR investigation on Mg2+-ETS-10.Finally, the group of Ragaini [28–31] has performedan extensive study of the Fisher–Tropsch chemistryperformed with cobalt and ruthenium-exchangedETS-10.
The promising exchange capabilities of this tita-nosilicate, together with the fact that copper-exchangedzeolites have recently attracted a great interest ascatalyst for the direct conversion of NO into N2and O2 [32–35] have encouraged us to prepare aCu2+-ETS-10 sample. In this contribution, we willdescribe for the first time the spectroscopic proper-ties of N2, CO and NO interacting at liquid nitro-gen temperature with copper cations hosted insideETS-10. Comparison will be made with IR data ob-tained on Cu-ZSM-5 [36], Cu-Y [37], Cu-mordenite[38], Cu-� [39] and on Cu grafted on MCM-41 [40].Comparison will also be made with the IR spectraof N2, CO and NO adsorbed on other cationic formof ETS-10. To understand the spectroscopy of COon Cu-ETS-10, a comparison with the spectra ofcarbon monoxide dosed on Cu2O dispersed on sil-ica [41] and on MCM-41 [40] will be made. In thiscontribution, new IR experiments have been ad hocperformed by dosing N2 and NO on Cu2O dispersedon silica.
2. Experimental
The ETS-10 sample used in this study was kindlysupplied by Engelhard (Iselin, NJ). Chemical anal-
S. Bordiga et al. / Catalysis Today 70 (2001) 91–105 93
ysis showed a Na+/K+ ratio of 2.64, and powderX-ray diffraction showed good crystallinity andconfirmed the expected structure type. No additionaldiffraction lines were found. After conventional ionexchange procedures with NaNO3, as described else-where [21], the achieved Na+/K+ ratio was 5.30.We shall refer in the following to this sample as thesodium-exchanged form or as Na-ETS-10. MCM-41sample, with Si/Al ≈ 20 and pore diameter of≈40 Å,has been kindly supplied by EniTecnologie laborato-ries of San Donato Milanese (MI), Italy. Commercialsilica (Aerosil from Degussa, s.a. ≈ 330 m2 g−1) hasbeen used.
To obtain a Cu-exchanged ETS-10, Na-ETS-10powder was exchanged twice with Cu(NO3)2 (Aldrich,analytical grade) as described in Ref. [42] for thepreparation of Cu2+-ZSM-5. The so-obtained sam-ples will be hereafter labeled as Na-Cu-ETS-10(A),and Na-Cu-ETS-10(B), after the first and second ex-change, respectively. MCM-41- and silica-supportedCu2O samples have been prepared by impregnationof the support with an aqueous solution of Cu(NO3)2and followed by a high-temperature treatment invacuo (873 K for MCM-41 and 1073 K for silica)as extensively described in Refs. [40,41], respec-tively. The latter sample is labeled as Cu2O/SiO2(10% Cu/Si wt. ratio), while the former is labeled asCu-MCM-41 and Cu2O/MCM-41 for low (1% Cu/Siwt. ratio) and high (10% Cu/Si wt. ratio) Cu loading,respectively.
Samples for IR studies were compressed intoself-supporting wafers and degassed in dynamic vac-uum (residual pressure<10−4 Torr) inside an IRcell allowing in situ high-temperature treatments, gasdosage, and low-temperature measurements to bemade. Na-ETS-10, Na-Cu-ETS-10(A) and Na-Cu-ETS-10(B) were degassed at 673 K for 2 h, whileCu-MCM-41, Cu2O/MCM-41 and Cu2O/SiO2 sam-ples were degassed at 873 K (MCM-41) and 1073 K(silica). The IR spectra were recorded, at 2 cm−1
resolution, on a Bruker IFS66 FTIR spectrometer. Al-though the IR cell was permanently cooled with liquidnitrogen, the actual sample temperature (under theIR beam) was likely to be ca. 100–110 K. The waferspectrum taken before gas dosage was used as a blank.All spectra shown in this paper are blank subtracted.UV–Vis diffuse reflectance experiments have beenperformed with a Varian CARY5 spectrophotometer.
3. Results and discussion
Copper zeolites can be prepared in over-exchangedform [32] by exchange with water solution of cupricsalts. For over-exchanged form we intend a form,containing more than one CuII ion per two frameworkAl. These over-exchanged(Cu/Al > 0.5) zeolitesshow the highest activity for the decomposition ofnitrogen oxides.
With the aim of reaching high exchange levels, since1992, our group has proposed an alternative exchangeprocedure consisting in the interaction of CuCl in thevapor phase with the zeolites in the protonic form[32,43–46], resulting in the Si(OH+)Al + CuClgas→Si(OCu+)Al + HClgas reaction. This exchange ap-proach allows the direct insertion of cuprous ions andthe virtual achievement of a 200% exchange (i.e. aCu/Al ratio of 1). We were unable to follow the sameroute for the preparation of a Cu-ETS-10 sample, sinceit needs thermal treatments at a temperature wherethe protonic form of ETS-10 is unstable. For this rea-son, the conventional exchange route has been adopted(see Section 2). Due to the potentially high cation ex-change capabilities of ETS-10 discussed in Section 1,this inconvenience is of secondary importance for theachievement of rather high copper loadings.
It must be, however, underlined that, over Cu-exchanged zeolites catalysts prepared by ion exchangewith aqueous solutions of a Cu2+ salt, IR, UV–Vis,EPR, XPS, XANES and EXAFS studies have shown[32,42,47,48] good evidence for the presence of bothisolated Cu2+ and Cu+ ions and of several oxocationssuch as [Cu–O–Cu]+ and [Cu–O–Cu]2+, togetherwith copper oxide aggregates, Cu2O nano-crystals.In view of the high Cu loading, a great heterogene-ity of copper species is expected for Na-Cu-ETS-10samples.
It is widely recognized [42,48–51] that an effectivereduction of samples containing hydrated cupric ionscan be obtained during activation under dynamicvac-uum. This fact is often called “self-reduction” of Cu2+.Different chemical Cu2+ → Cu+ pathways have beenproposed in the literature to explain the process. Wewill not enter in this complex debate here and we shalljust accept the phenomenon as a matter of fact. For amore detailed discussion, the reader should refer to therecent works of Dossi et al. [51] and Turnes Palominoet al. [42]. On these bases, we expect that also in our
94 S. Bordiga et al. / Catalysis Today 70 (2001) 91–105
case Cu+ will be certainly present after activation invacuo at high temperature.
3.1. UV–Vis study of the preparedan activated samples
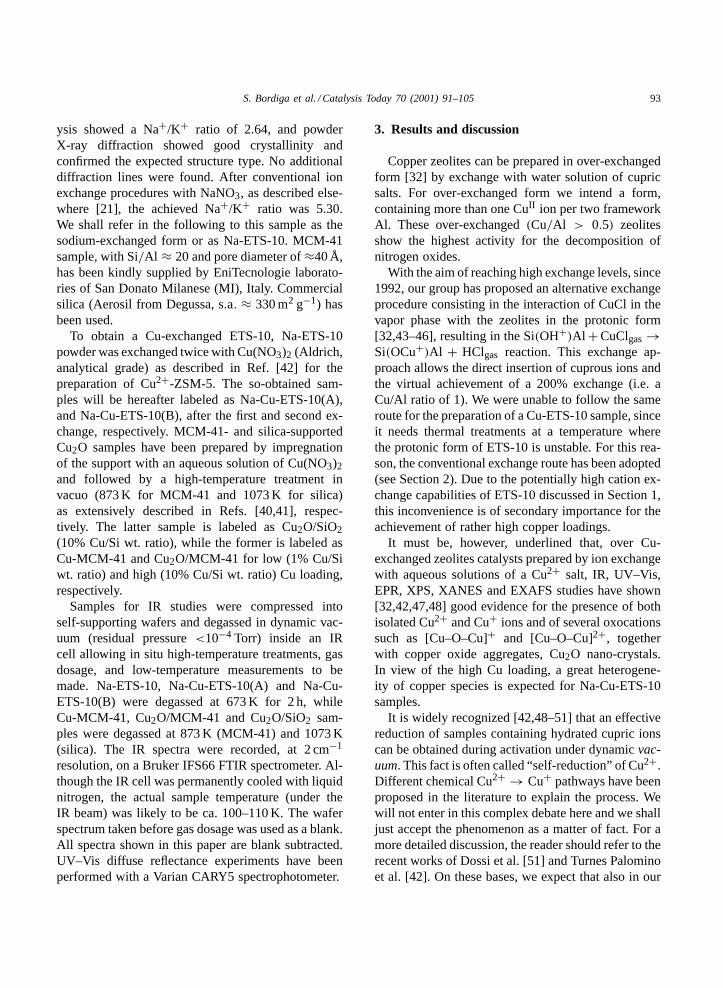
Na-ETS-10 sample has no absorption in the 30,000–7500 cm−1 range and exhibits a sharp edge at≈32,600 cm−1 (≈4.03 eV) due to the Ti4+O2− →Ti3+O− ligand to metal charge transfer (LMCT)[9–11] (see spectrum 1 in Fig. 1). Since the energyvalue of this LMCT is dictated by quantum confine-ment effects in the mono-atomic· · · –O–Ti–O–Ti–O–
Fig. 1. UV–Vis spectra collected in the reflectance mode of:(1) hydrated Na-ETS-10; (2) hydrated Na-Cu-ETS-10(B); (3)Na-Cu-ETS-10(B) dehydrated at 383 K; (4) Na-Cu- ETS-10(B)dehydrated at 673 K; (5) Cu2O bulk. The UV–Vis spectrum of theCu2O/SiO2 sample is not reported, since its edge corresponds tothat of Cu2O bulk [41].
· · · quantum wire, we do not expect any significantshift upon cation exchange with Cu(NO3)2. The in-variance of the LMCT edge for Na-Cu-ETS-10(B)sample (i.e. the sample exchanged twice) is demon-strated in Fig. 1 (spectrum 2). In this spectrum, the ap-pearance of a new band centered around 12,700 cm−1
(typical d–d transition of the d9 Cu2+ cation) is thedirect proof that cupric cations have been successfullyinserted in the ETS-10 sample. Dehydration of thesample by evacuation at 383 K causes an increase ofthe d–d transition intensity together with a blue shift ofthe maximum at 13,400 cm−1 (spectrum 3 in Fig. 1).This is exactly the expected behavior of the d–dband upon loss of the coordinated water molecules,and similar spectra have recently been reported for aCu2+-ZSM-5 sample [42]. The same experiments per-formed on the Na-Cu-ETS-10(A) sample (not reportedfor brevity) yield to similar although less intensespectra, as expected for a less-exchanged sample.
Upon increasing the thermal treatment tempera-ture (spectrum 4 in Fig. 1), the spectrum of sample(B) (and sample (A) as well, not reported) changeabruptly. However, the modification is completelydifferent from that observed for Cu2+-ZSM-5 [42].Starting from 473 K, in Cu2+-ZSM-5 a progressivedecrement of the d–d band is observed up to its totaldisappearance on samples activated at 673 K, witness-ing that Cu2+ → Cu+ reduction is occurring [42].On sample Na-Cu-ETS-10(B), the appearance of twostrong and complex edges in the 16,500–20,000 cm−1
region is observed. To understand this phenomenon,a comparison with the UV–Vis spectrum of Cu2O isuseful (spectrum 5 in Fig. 1). In fact, cuprous oxidehas a well-defined gap at 16,280 cm−1 (evidencedby the very sharp edge in Fig. 1) which coincideswith the first edge of Cu-ETS-10(B) at 16,300 cm−1.This can be explained in terms of the formation ofa consistent amount of Cu2O particles. The secondedge at about 20,000 cm−1 is slightly blue-shifted:we think that this is due to confinement effects inCu2O nano-particles (these effects can be observedonly if the size of the cuprous oxide crystals is in thenanometer/subnanometer scale, see the abundant liter-ature quoted in Ref. [10]). In conclusion, the UV–Visspectra reveal a bimodal distribution of Cu2O parti-cles. We think that the larger ones are located on theexternal surface, while the smaller ones are encagedinside the zeolite framework. Due to their smaller

S. Bordiga et al. / Catalysis Today 70 (2001) 91–105 95
dimension, the particles encaged in the zeolite willplay a dominant role in the adsorptive properties.
Upon thermal treatment at high temperature, thed–d band of the Cu2+ is still observable (see inflectionat about 12,000 cm−1). However, the dominating fea-tures of Cu2O in the region of interest prevent a quan-tification. Based on our experience, we shall assumethat most of the cupric cations have been reducedto Cu+ and that they belong to two families: ex-traframework Cu+ counterions (like in Cu+-ZSM-5)and Cu+ ions in Cu2O particles. This assumptionwill be strongly confirmed by the IR studies reportedhereafter.
The presence of Cu2O in Cu-zeolites prepared withthis cation exchange method is not unexpected, andalready claimed by several groups (see above). Notealso that we have already used the same preparationmethod for supporting Cu2O on silica or on MCM-41[40,41]. It is in fact well known that CuO, formedby thermolysis of Cu(NO3)2, has the propensity tolose oxygen atoms when heated at high tempera-tures in vacuo: this implies that a thermal treatmentof the samples causes the “self-reduction” of CuOinto Cu2O. We think that the formation of Cu2Oparticles in ETS-10 is likely favored by the high cop-per concentration inside the exchanged (hydrated)material.
3.2. IR spectroscopy of adsorbed N2
The use of di-nitrogen as probe molecule is partic-ularly suitable, since the N–N stretching frequency isexpected to appear in two definitively different spec-tral regions for the Na+· · · N2 and for the Cu+· · · N2adducts. It is a matter of fact that the interaction of N2with alkali-metal cations, being only of electrostaticnature, yields aν(NN) in the 2335–2325 cm−1 range[21,52,53], while the interaction with cuprous ionsinside zeolites gives aν(NN) in the 2300–2295 cm−1
region [36,54]. For sake of comparison, Table 1reports the N–N stretching frequencies of di-nitrogenadducts in zeolites, zeotypes and on Cu2O dispersedon silica. The use of N2 will thus allow a spectro-scopic determination of the exchange level for acces-sible cations, i.e. those present in the 12-memberedrings forming the channels.
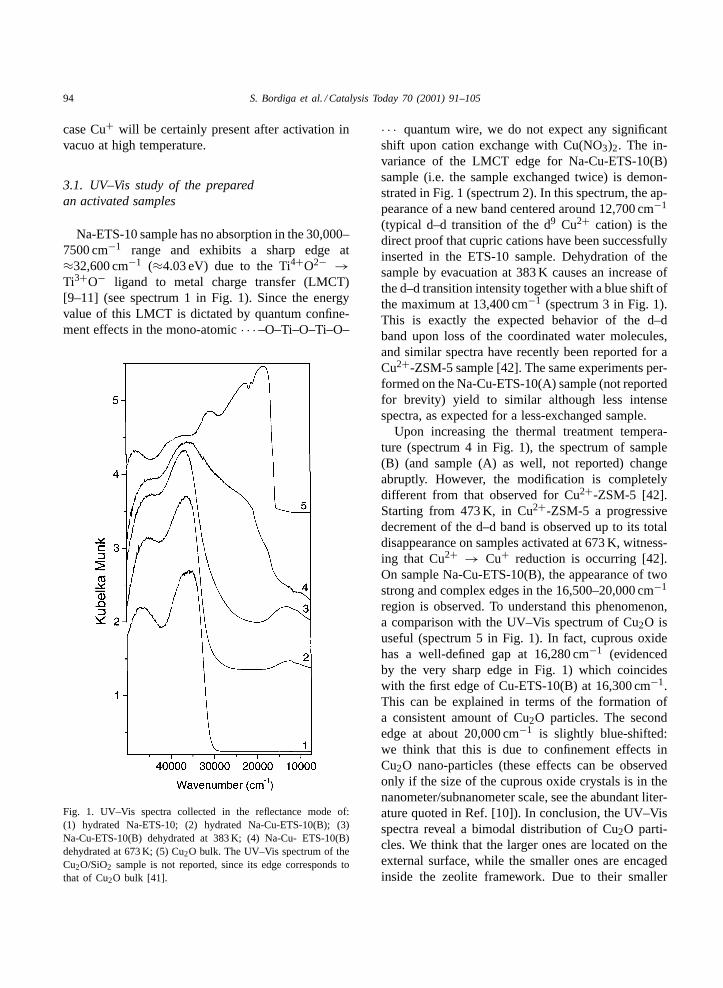
Fig. 2 reports the IR spectra of di-nitrogen dosedat increasing equilibrium pressures on Na-ETS-10,
Table 1N–N stretching frequencies of di-nitrogen adducts in zeolites,zeotypes, and on supported Cu2O
Sample ν(NN)
(cm−1)Reference
Na-ETS-10 2333 This work and [21]K-ETS-10 2331.5 [21]Na-Cu-ETS-10(A) Na site 2331 This workNa-Cu-ETS-10(A) Cu+ site 2281 This workNa-Cu-ETS-10(B) Na site 2329 This workNa-Cu-ETS-10(B) Cu+ site 2285 This workCu2O/SiO2 2283 This workCu+-mordenite 2299 [54]Cu+-ZSM-5 2295 [36]
Na-Cu-ETS-10(A) and Na-Cu-ETS-10(B), parts (a),(b) and (c), respectively. Part (a) reports the al-ready known sharp and well-definedν(NN) band ofNa+· · · N2 adducts in ETS-10, at 2333 cm−1 [21]. Thespectra reported in part (b) show the same band, nowreduced at about 50%, and a new broader absorptionin the 2300–2275 cm−1 range. The fact that the for-mer component is further reduced, while the latter isfurther increased after a second cation exchange (partc), allows the straightforward assignment of the lowfrequency band to Cu+· · · N2 adducts. By measuringthe intensity decrement of the 2333 cm−1 band, it isinferred that about 50 and 70% of the original Na+accessible cations have been substituted after the firstand the second copper exchange. Nothing can be saidfor inaccessible cations.
It is worth noticing that the 2285 cm−1 band is moreresistant to degassing than that at 2333 cm−1. Thisreflects the higher interaction energy of the Cu+· · · N2adduct with respect to the Na+· · · N2 one.
The band ascribed to Cu+· · · N2 adducts is ratherbroad (FWHM = 17 cm−1), especially when com-pared with that of the 2333 cm−1 band (FWHM =2.5 cm−1), or with the width of the band observedfor Cu+· · · N2 adducts in a Cu+-ZSM-5 preparedfrom CuCl (FWHM = 6 cm−1 [36]). This observa-tion proves that the Cu+ cations in an ETS-10 sampleobtained after thermal activation of the correspond-ing cupric sample have heterogeneous structures.The value of the frequency maximum merits fewcomments. In fact, in sample (B), it is located at2285 cm−1 (at P(N2) = 5 Torr): this frequency isdefinitively lower than those obtained by Kuroda et al.
96 S. Bordiga et al. / Catalysis Today 70 (2001) 91–105
Fig. 2. Liquid nitrogen IR spectra of N2 dosed at increasing equilibrium pressures (from 10−2 to 5 Torr; 1 Torr≈ 133.3 Pa) on Na-ETS-10,Na-Cu-ETS-10(A) and Na-Cu-ETS-10(B) samples, parts (a), (b) and (c), respectively. The inset in part (c) reports the same experimentperformed on the Cu2O/SiO2 sample. The inset in part (b) reports a magnification of the highest coverage spectrum in the 2310–2265 cm−1
range; the vertical arrow indicates the high frequency shoulder attributed to the N–N stretching frequency of N2 adsorbed on isolated Cu+counterions inside the ETS-10 channels.
Fig. 3. (a) IR spectra of CO dosed on Na-Cu-ETS-10(B) sample at about 77 K; (b) IR spectra of CO dosed on Na-Cu-ETS-10(B) sampleat RT; (c) IR spectra of CO dosed on Cu2O/SiO2 (pressures between 10−2 and 10 Torr).

S. Bordiga et al. / Catalysis Today 70 (2001) 91–105 97
[54] on Cu+-mordenite (2299 cm−1) or by Bordigaand co-workers [36] on Cu+-ZSM-5 (2295 cm−1).
To advance a reasonable explanation of thisobservation, we have performed the same experimenton the Cu2O/SiO2 sample (see Fig. 3c). N2 dosedon Cu2O/SiO2 gives rise to a very weak absorptionat 2283 cm−1 (FWHM = 10 cm−1), together with ahigh frequency shoulder developing only at the highN2 pressures. On the basis of a previous SEM andTEM study on pure and silica-supported Cu2O [41],we ascribe the 2283 cm−1 band to Cu+· · · N2 adductsformed on Cu+ sites of the unpolar Cu2O(1 1 1)facelet or terrace. The high frequency band is tenta-tively ascribed to Cu+· · · N2 adducts formed, eitheron less dominant facelets, or on the less coordi-natively unsaturated cuprous cation of the (1 1 1)face [41].
From these considerations, we conclude that thebroad absorption in the 2300–2275 cm−1 range, on(A) and (B) samples is due to the simultaneous pres-ence of a dominant band at 2285 cm−1 (due to N2adsorbed on Cu2O nano-crystals) and to a less intensecomponent at about 2295 cm−1 (due to N2 adsorbedon Cu+ counterions). The latter component can bebetter appreciated in the inset of Fig. 2b, where amagnification of the highest coverage spectrum isreported in the 2310–2265 cm−1 range.
By comparing the intensity of the band due toCu+· · · N2 adducts on Cu2O/SiO2 and that measuredon Na-Cu-ETS-10(B), we infer that Cu2O is underhighly dispersed form. This observation agrees withthe observed energy gap of the Cu2O particles hostedin ETS-10 (20,000 cm−1), blue-shifted with respectto that of bulk Cu2O, due to confinement effects (seeFig. 1).
The minor IR absorption at 2315 cm−1 observed atthe highest pressures in Fig. 2c is of difficult attribu-tion. We just mention that it has not been detected inthe sample Na-Cu-ETS-10(A).
3.3. IR spectroscopy of adsorbed CO
The IR spectra (recorded at nominal 77 K tem-perature and at RT) of increasing doses of CO onthe Na-Cu-ETS-10(B) sample are reported in Fig. 3aand b, respectively. As CO does not interact withNa+ cations at RT, the spectra reported in Fig. 3bconcern only copper carbonyl adducts. As far as
low-temperature spectra are concerned, the band ofthe Na+· · · CO adducts formed on the fraction ofunexchanged sodium cations cannot be observed aswell, since it is totally overshadowed by the muchstrong spectral features of Cu+ carbonyls (whichappear in the same spectroscopic region, but havea considerably higher extinction coefficient due tothe relevant role played by�-back donation in theCu+· · · CO bond [46]).
The spectroscopy of CO interacting with cuprousions in ETS-10 is rather complex: the spectra recordedat RT and the low coverage spectra of the low-temperature experiment show the presence of twovery broad bands (in the 2160–2120 cm−1 and in the2200–2170 cm−1 intervals). The broad nature of thesebands well agrees with the heterogeneity of Cu+cations already monitored by N2 (vide supra, Fig. 2).At the highestPCO, the low-temperature spectra (inFig. 3a) show two new, and rather narrow, bands at2191 and 2162 cm−1. This fact contrasts with thebroad character of the precursors described before. Inspite of the evident complexity of the spectra reportedin Fig. 3 (a and b), their interpretation can be madein a straightforward manner on the basis of a detailedcomparison with the results obtained on Cu2O/SiO2and on Cu+-ZSM-5, Cu+-�, Cu+-mordenite andCu+-Y (Figs. 3c and 4, respectively).
Of special utility is the comparison with the spec-tra of CO on Cu2O/SiO2 (Fig. 3c). According toRef. [41], the band at 2132 cm−1 (lowest dosage)progressively shifting to 2127 cm−1 upon increasingthe CO pressure, is assigned to Cu+· · · CO adductsformed on mono-coordinated Cu+ sites of the unpo-lar Cu2O(1 1 1) facelets of Cu2O microcrystals andthe bathochromic shift is ascribed to the progressivebuilding up of lateral interactions among adjacent ad-sorbates. Upon increasing thePCO, two componentsat 2162 and 2127 cm−1 show up, which are assignedto the asymmetric and symmetric stretching modesof the complex Cu+· · · (CO)2 [41]. Both bands un-dergo a red shift (from 2162 to 2154 and 2127 to2120 cm−1, respectively, Table 2) with CO coverage.Also in this case, the shift is ascribed to lateral in-teractions among adsorbates. The spectra of CO onpure Cu2O polycrystals are similar and the frequen-cies of the relevant bands are reported in Table 2. Inno cases, the formation of Cu+· · · (CO)3 adducts hasbeen observed on Cu2O.

98 S. Bordiga et al. / Catalysis Today 70 (2001) 91–105
Fig. 4. IR spectra of CO dosed, at liquid nitrogen temperature, on Cu+-ZSM-5 (bottom dotted lines), Cu+-mordenite (bottom full lines),Cu+-� (top dotted lines), and Cu+-Y (top full lines) zeolites. Parts (a), (b) and (c) reports low, medium and high CO equilibrium pressurespectra, respectively, approximately corresponding to mono-, di- and tri-carbonyl complexes.
Coming now to the spectra of CO on Cu+-zeolites(ZSM-5,� and mordenite), it is worth recalling that atlow CO equilibrium pressures (Fig. 4a), a single bandis observed for the monocarbonylic complex (see
Table 2C–O, νa(CO)m (m = 1, 2, 3), stretching frequencies of carbonyl adducts in Cu+-zeolites, Cu2O/silica and Cu2Oa
Sample ν(CO)
(cm−1)νl(CO)2
(cm−1)νh(CO)2
(cm−1)νl(CO)3
(cm−1)νm(CO)3
(cm−1)νh(CO)3
(cm−1)Reference
Cu+-ZSM-5 2157 2151 2178 ∼=2138 2167 2192 [36]Cu+-� 2157 2152 2180 2146 2167 2193 [39]Cu+-mordenite 2159 2150 2180 ∼=2145 ∼=2165 2190 [38]Cu+-Y Site II 2159 2148 2178 ∼=2138 2165 2188 [37]Cu+-Y Site II∗ 2143 2135 2168 ∼=2138 2165 2188 [37]Cu+-MCM-41 2159 2152 2180 2138 2171 2194 [40]Na-Cu-ETS-10(B)
isolated Cu+ site
∼=2155 ∼=2150 ∼=2180 ∼=2135 2162 2191 This work
Na-Cu-ETS-10(B)Cu2O site
2141 ∼=2130 ∼=2165 Not observed Not observed Not observed This work
Cu2O/SiO2 2132–2127 2127–2120 2162–2154 Not observed Not observed Not observed [41] andthis work
Bulk Cu2O 2127–2121 2121–2113 2158–2145 Not observed Not observed Not observed [41]Cu2O/MCM-41 ∼=2141 ∼=2133 ∼=2155 Not observed Not observed Not observed [40]Na-ETS-10 2178 Not observed Not observed Not observed Not observed Not observed [21]
a When needed, label “a” (a: l, m, h) refers to low, medium and high frequency components of the adduct. For comparison, also theν(CO) observed on Na-ETS-10 is reported. For Cu2O/SiO2 and bulk Cu2O samples, an interval of frequencies has been reported forν(CO), νl(CO)2 and νh(CO)2, since the frequency position of the band was pressure dependent [41]. Very recently, the assignment of theband here labeled asνl(CO)3 to a third, low frequency component of the Cu+(CO)3 complex inside zeolites has been questioned, and thealternative hypothesis that it could be due to liquid-like CO physisorbed on the zeolitic walls has been put forward [55].
ν(CO) in Table 2). Contrarily to what observed forboth Cu2O/SiO2 and pure Cu2O, the position of thesebands is not affected by the CO equilibrium pressure,since adsorbate–adsorbate interactions are not present.
S. Bordiga et al. / Catalysis Today 70 (2001) 91–105 99
On Y zeolite, the situation is slightly more complexsince two different Cu+· · · CO adducts characterizedby ν(CO) = 2159 and 2143 cm−1 are observed. ThisIR evidence is supported by Rietveld refinement ofXRPD data collected at the BM16 beamline at theESRF, where two different cationic sites have been de-termined in the supercage [37]. These sites have beenlabeled as II and II∗: the second lies in a more shieldedposition and is responsible of the band at 2143 cm−1.On all zeolites, by increasing the CO equilibrium pres-sure (Fig. 4b), the formation of Cu+· · · (CO)2 adductsis observed, as proved by the formation of two newbands at 2135–2151 and 2168–2178 cm−1 (Table 2)assigned to the asymmetric and symmetric stretchingmodes of the complex [36,38,39]. According to thepresence of two different sites (II and II∗) in Y zeolite,two doublets have been observed.
A further increase of the equilibrium pressure(Fig. 4a), causes a total (ZSM-5 [43],� [39]) or anearly total (Y [37]) Cu+ · · · (CO)2 → Cu+ · · · (CO)3transformation, accompanied by the appearance ofa new triplet of IR active bands at 2138–2146,2165–2167, and 2188–2193 cm−1 (Table 2). Thistriplet has been interpreted as the IR manifestationof Cu+· · · (CO)3 complexes with a symmetry ratherlower than C3v [36,38,39,43] (only two IR active bandare in fact expected in the case of a C3v symmetry). Itis, however, worth recalling that the assignment of theband at lower frequencies to the third, low frequency,component of the Cu+(CO)3 complex has been re-cently questioned [55]. It is a matter of fact that thelow frequency band lies in the 2135–2146 cm−1 in-terval, i.e. very close to the absorption of physicallyadsorbed CO (2138 cm−1) [56]. We shall not enterin this debate here, since the problem of the localsymmetry of Cu+(CO)3 complexes hosted in zeo-lites is not relevant for the present work. As far asCu-mordenite is concerned, the additional presenceof cations in the less accessible side pocket sitesleads to the simultaneous presence of mono-, di- andtri-carbonyl adducts even at the higher equilibriumpressures [38], a fact which is originating a broaderand rather unresolved IR spectrum (Fig. 4c). An in-teresting property of the Cu+· · · (CO)3 adducts isrepresented by the small half-width of the IR bands,which is not influenced by the heterogeneity characterof the sites. This relevant fact is explained in termsof the high complexing power of the CO molecules,
which are able to extract the Cu+ cations from theoriginal positions. In other words, the Cu+(CO)3complexes do not have “memory” of the structureof the original Cu+ sites. This last statement hasbeen supported by independent EXAFS [46,55] andsynchrotron radiation XRPD [37] experiments.
Coming to Cu2O supported on MCM-41 [40], wejust underline that samples with low copper content(like sample Cu-MCM-41, Cu/Si = 1 wt.%) show CObands very similar to those observed in zeolites,while samples with high Cu content (sample Cu2O/MCM-41, Cu/Si = 10 wt.%) show additional compo-nents similar to those of CO on Cu2O (see Table 2).These observations led to the conclusion that the im-pregnation with copper nitrate is a good method forgrafting isolated Cu+ cations in the MCM-41 innersurface when low copper loading are used, and thatthe method gives preferentially Cu2O microparticlesat high Cu loading [40].
After this essential comparison with already under-stood systems, we can discuss the IR spectra of COdosed on Na-Cu-ETS-10(B) sample. The broadcomponent with a distinct maximum at 2141 cm−1
appearing at the lowest dosage can be ascribed toCu+· · · (CO) complexes formed on Cu2O nano-crys-tals. On the basis of the data concerning Cu+ on ze-olites, the shoulder around 2155 cm−1 is assigned toCO adsorbed on atomically dispersed cuprous coun-terions in ETS-10. Upon increasingPCO, both speciesare transformed into Cu+· · · (CO)2 complexes. Thetwo ν(CO)2 frequencies of Cu+(CO)2 complexes (seeTable 2) do not shift with coverage: this is the proofthat the size of the Cu2O nano-crystals on ETS-10 isso small that the lateral interactions among adsorbedCO molecules in ordered bi-dimensional layers can-not build up.
The narrow bands at 2191 and 2162 cm−1 (highPCO) occur at frequencies very close to those reportedfor Cu+· · · (CO)3 adducts hosted in Cu+-zeolites(see Table 2): they are consequently assigned totri-carbonyl complexes formed on Cu+ counterionsinside ETS-10. The narrow character of the Cu+(CO)3bands is also typical of tricarbonylic complexes.
The spectroscopy of CO dosed on Na-Cu-ETS-10(A) sample (not reported for brevity) is similar tothat reported in Fig. 3a and b, the only difference con-sisting in the relative intensity of the bands ascribedto CO adsorbed on Cu2O microcrystals.

100 S. Bordiga et al. / Catalysis Today 70 (2001) 91–105
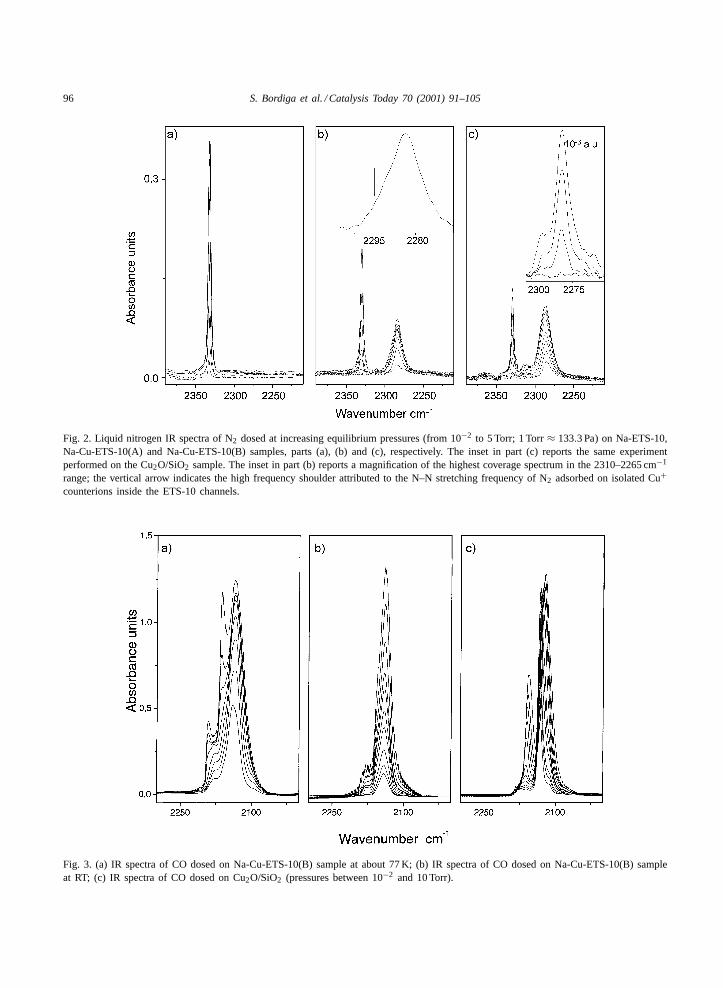
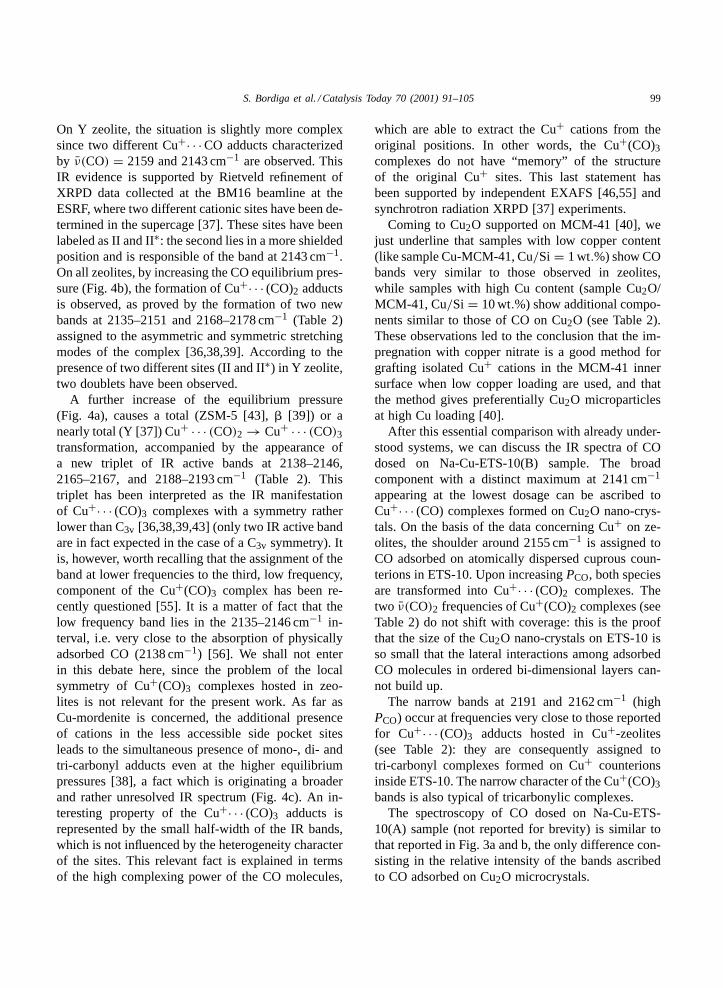
Fig. 5. IR spectra of NO dosed on Na-Cu-ETS-10(B) sample as a function of the temperature increase from liquid nitrogen temperature toRT. (a) First stage; (b) final stages. During stage (a), thePNO increases from about 10−1 (at T < 150 K, line 1) to 10 Torr (atT ∼= 150 K,line 3). During stage (b), the pressure is constant (about 10 Torr), and the temperature is between 150 (line 4) and 273 K (line 15). Theinsets report the 2380–2190 cm−1 region, where some products of the NO decomposition reaction are expected.
3.4. IR spectroscopy of adsorbed NO
Like N2 and CO at 77 K, NO is a probe of cationicsites in Cu-exchanged zeolites. However, unlike theN2 and CO probes, when the temperature increasesup to RT, NO can yield a complex redox chemistryrelated to nitric oxide decomposition. This is shownin the experiment reported in Fig. 5, where the spectraof NO initially dosed at low temperature on sampleNa-Cu-ETS-10(B), and the spectra obtained duringthe successive gradual warming to RT are reported.During the warming procedure, thePNO changesabruptly from 7× 10⁻² to 10 Torr (at about 150 K).
The bottom curve of Fig. 5a is the IR spectrum(curve 1) of adsorbed NO at the nominal liquid ni-trogen temperature (PNO = 7 × 10⁻² Torr NO). Thisspectrum is rather complex, showing two dominantpeaks at 1708 and 1809 cm−1 and two less intensepeaks at 1743 and 1775 cm−1 and a shoulder around1885 cm−1. The absence of any significant band inthe 1915–1880 cm−1 range, where the N–O stretch-ing frequency of Cu2+· · · (NO) adducts is expected[32,36,57], implies that nearly all cupric ions inaccessible positions have been reduced to cuprous
ions during the thermal activation and that the ob-served band must be ascribed to Cu+(NO)n (n = 1, 2)
complexes.The doublets at 1708–1809 and 1743–1885 cm−1
initially increase (Fig. 5a, curves 2 and 3) and then de-crease (Fig. 5b, curves 4–15). The peak at 1775 cm−1
increases slightly with temperature and does notdisappear even at RT (Fig. 5b). The increase withtemperature of the absorption in the 1915–1880 cm−1
range (Fig. 5a) is indicative of the formation of stableCu2+(NO) complexes as a consequence of redox reac-tions occurring on the surface. Simultaneously (see in-sets), bands typical of adsorbed N2 (about 2350 cm−1)and of adsorbed N2O (about 2250 cm−1) appears(Fig. 5a) (vide infra). The intensities of the peaks as-sociated with the weakly adsorbed species decline asthe temperature increases and tends to disappear at RT.
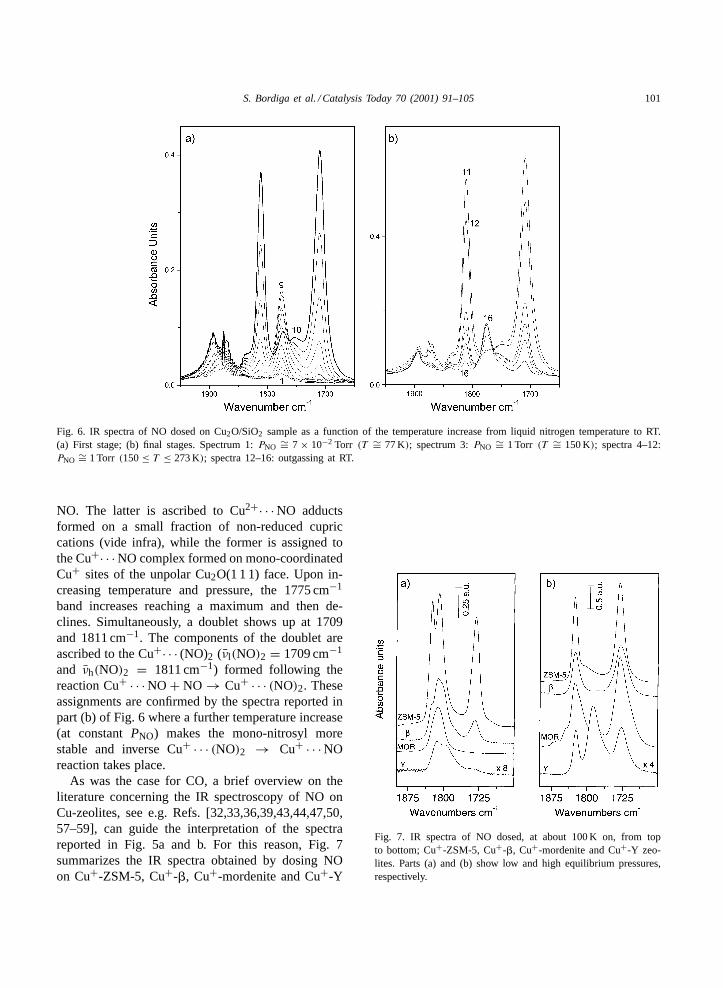
To facilitate a detailed assignment of the bands illus-trated in Fig. 5a, an identical temperature-dependentexperiment has been ad hoc repeated on Cu2O/SiO2.The spectra resulting from this experiment are reportedin Fig. 6a and b.
At the lowest temperatures (Fig. 6a), two bandsare observed at 1775 and 1881 cm−1 due to adsorbed
S. Bordiga et al. / Catalysis Today 70 (2001) 91–105 101
Fig. 6. IR spectra of NO dosed on Cu2O/SiO2 sample as a function of the temperature increase from liquid nitrogen temperature to RT.(a) First stage; (b) final stages. Spectrum 1:PNO ∼= 7 × 10⁻² Torr (T ∼= 77 K); spectrum 3:PNO ∼= 1 Torr (T ∼= 150 K); spectra 4–12:PNO ∼= 1 Torr (150≤ T ≤ 273 K); spectra 12–16: outgassing at RT.
NO. The latter is ascribed to Cu2+· · · NO adductsformed on a small fraction of non-reduced cupriccations (vide infra), while the former is assigned tothe Cu+· · · NO complex formed on mono-coordinatedCu+ sites of the unpolar Cu2O(1 1 1) face. Upon in-creasing temperature and pressure, the 1775 cm−1
band increases reaching a maximum and then de-clines. Simultaneously, a doublet shows up at 1709and 1811 cm−1. The components of the doublet areascribed to the Cu+· · · (NO)2 (νl(NO)2 = 1709 cm−1
and νh(NO)2 = 1811 cm−1) formed following thereaction Cu+ · · · NO + NO → Cu+ · · · (NO)2. Theseassignments are confirmed by the spectra reported inpart (b) of Fig. 6 where a further temperature increase(at constantPNO) makes the mono-nitrosyl morestable and inverse Cu+ · · · (NO)2 → Cu+ · · · NOreaction takes place.
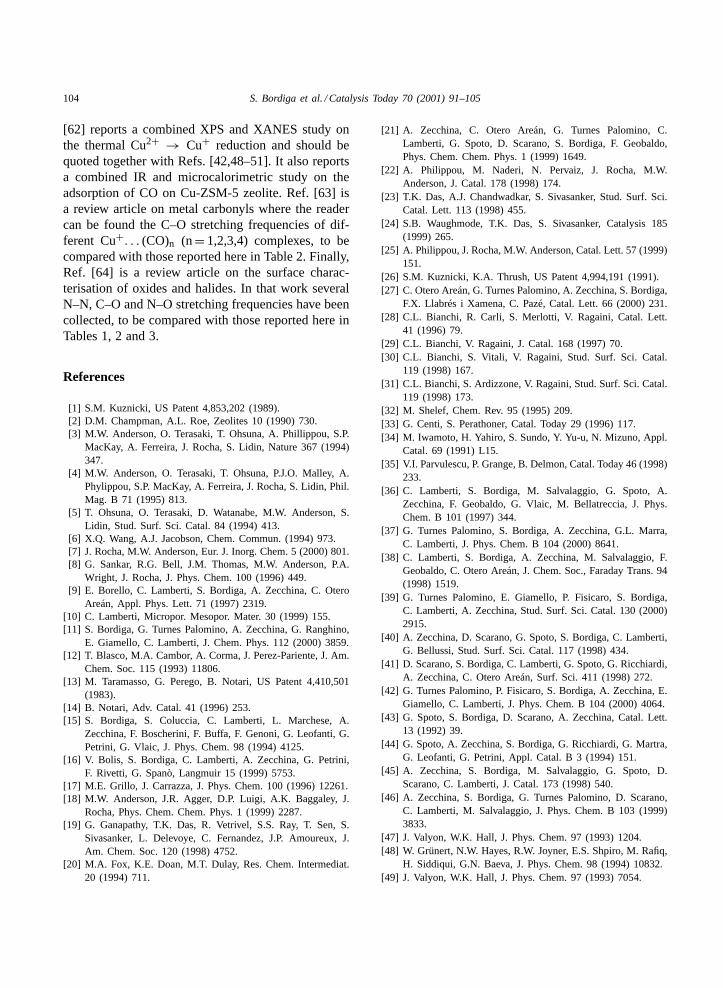
As was the case for CO, a brief overview on theliterature concerning the IR spectroscopy of NO onCu-zeolites, see e.g. Refs. [32,33,36,39,43,44,47,50,57–59], can guide the interpretation of the spectrareported in Fig. 5a and b. For this reason, Fig. 7summarizes the IR spectra obtained by dosing NOon Cu+-ZSM-5, Cu+-�, Cu+-mordenite and Cu+-Y
Fig. 7. IR spectra of NO dosed, at about 100 K on, from topto bottom; Cu+-ZSM-5, Cu+-�, Cu+-mordenite and Cu+-Y zeo-lites. Parts (a) and (b) show low and high equilibrium pressures,respectively.

102 S. Bordiga et al. / Catalysis Today 70 (2001) 91–105
zeolites: low and high equilibrium pressures (parts(a) and (b), respectively).
The IR spectroscopy of nitrosyl complexes formedat low temperature on Cu+ sites in zeolites shows apoly-addition similar to that observed for carbonyls,however, Cu+· · · (NO)3 complexes have not been ob-served. At low equilibrium pressure, the formation ofCu+· · · NO adducts gives a single N–O band in the1811–1814 cm−1 range (seeν(NO) in Table 1), withthe only exception of Cu+-Y, where NO adsorbed onthe more shielded II∗ position results in a second com-ponent atν(NO) = 1788 cm−1 [37]. This result isanalogous to what was obtained with CO.
The increase of NO equilibrium pressure causesthe splitting of the mono-nitrosyl band into theasymmetric and symmetric stretching modes of theCu+· · · (NO)2 complex (νl(NO)2 and νh(NO)2 in the1728–1734 and 1824–1827 cm−1 range, respectively,see Table 3). For ZSM-5 and�, even at the lowestNO equilibrium pressure, we observe the presenceof the two Cu+· · · (NO)2 bands superimposed to thatof the mono-nitrosyl. The increase of the NO equi-librium pressure yields to the total Cu+ · · · NO →Cu+ · · · (NO)2 transformation (Fig. 7b). This doesnot hold for MOR and Y, where the transformation isonly partial.
At this point, the interpretation of the IR spectraobtained by dosing NO on Na-Cu-ETS-10(B) sample(Fig. 5a) is straightforward: the five components
Table 3N–O, νa(NO)m (m = 1, 2), stretching frequencies of nitrosylic adducts in Cu+-zeolites and in Cu2O (pure and supported)a
Sample ν(NO) (cm−1) νl(NO)2 (cm−1) νh(NO)2 (cm−1) Reference
Cu+-ZSM-5 1812 1734 1827 [36]Cu+-� 1811 1730 1826 [39]Cu+-mordenite 1812 1731 1826 [39]Cu+-Y Site II 1814 1728 1824 [37]Cu+-Y Site II∗ 1788 Not observed Not observed [37]Na-Cu-ETS-10(B) isolated Cu+ site ∼=1787 1740 1830 This workNa-Cu-ETS-10(B) Cu2O site ∼=1778 1708 1810 This workCu2O/SiO2 1775 1709 1811 This workCu2+-ZSM-5 1890 Not observed Not observed [36]Na-Cu2+-ETS-10(B) 1880 Not observed Not observed This workCu2+ on Cu2O/SiO2 1894 Not observed Not observed This workNa-ETS-10 1898 Not observed Not observed [21]
a Label “a” (a: l, h) refers to low and high frequency components of the di-nitrosylic adducts. For ZSM-5, Na-Cu-ETS-10(B) andCu2O/SiO2 samples, also the IR frequency of the Cu2+· · · (NO) adduct formed upon oxidation of Cu+ by NO have been reported.For comparison also the most intense IR component obtained upon dosing NO on the Na-ETS-10 sample, before cation exchange withCu(NO3)2, has also been reported.
observed in the low-temperature spectra are in facttwo doublets due to Cu+· · · (NO)2 adducts formedon Cu2O (νl(NO)2 = 1708 cm−1 and νh(NO)2 =1810 cm−1, strong) and on Cu+ counterions (νl(NO)2= 1740 cm−1 andνh(NO)2 = 1830 cm−1, weak) andtwo unresolved bands in the 1790–1770 cm−1 regiondue to the corresponding Cu+· · · NO complexes. Asexpected, both doublets increase during the first stagesof the experiment (Fig. 5a) and then decrease at highertemperatures (Fig. 5b), where the absorption due tothe two mono-nitrosyl complexes dominates. Thesymmetric and asymmetric stretching frequencies ofdi-nitrosyl complexes formed on Cu2O nano-crystalsis very close to those observed on Cu2O/Si2O sample,while the corresponding doublet ascribed to adductsformed on Cu+ counterions lies at frequencies about10 cm−1 higher with respect to those measured for thesame adducts in the other Cu+-zeolites (see Table 3).The exact location of mono-nitrosyl complexes is notfeasible, due to the strong overlap between the bandsdue to the complexes formed on the two cuproussites. As a consequence, the corresponding wavenum-bers reported in Table 3 are only indicative. However,the fact that the broad band in the 1790–1770 cm−1
region is due to the superimposition of more thanone component is supported by the evidence that theabsorption is broad and its maximum (Fig. 5b) shiftsfrom 1778 to 1787 cm−1 by increasing the tempera-ture. The shift can be ascribed to a variation of the

S. Bordiga et al. / Catalysis Today 70 (2001) 91–105 103
relative ratio between mono-nitrosyl adducts formedon the two Cu+ sites. It is now worth noticing thatthe 1778 cm−1 frequency is very close (3 cm−1) tothat found for the Cu+· · · NO complexes formed onCu2O/Si2O sample (see Fig. 6 and Table 3). As aconsequence, the assignment of the 1778 cm−1 com-ponent to mono-nitrosyl complexes formed on Cu2Onano-particles is rather safe. The same does not holdfor the frequency of the Cu+· · · NO complexes formedon the less abundant Cu+ counterions.
Once the discussion and the assignments of thecomponents due to NO adsorbed on cuprous sites hasbeen made (1850–1650 cm−1 region in Figs. 5 and 6),we can discuss the 1950–1850 cm−1 region, i.e. theregion where Cu2+· · · NO complexes are expected[32,36,57]. This band is virtually absent in the spec-tra taken at lowest temperature on Na-Cu-ETS-10(B)sample (Fig. 5a) and in Cu2O/Si2O sample (Fig. 6a).Upon increasing the temperature, in both cases, acontinuous increase of this band is observed; thisindicates that NO begins to oxidize Cu+ cations toCu2+. In other words, both samples become activecatalyst in the decomposition of NO. This conclusionis based on the analogy with the results obtained onCu+-ZSM-5 [36]. This statement is supported by theevolution of the IR bands in the 2380–2190 cm−1
region (see inset in Fig. 5a and b), where someproducts of the NO decomposition reaction (N2 andN2O) are expected. The most intense band lies in the2260–2230 cm−1 range and is ascribed to the pres-ence of weakly bonded N2O species [36]. In the sameinset, a composite absorption at 2370–2345 cm−1 isalso evident; following Ref. [36], we attribute thelatter band to N2 molecules adsorbed on Cu2+ sites.The complexity of both bands can be ascribed to theheterogeneity of Cu sites in the Na-Cu-ETS-10(B)sample. As far as the 2370–2345 cm−1 band is con-cerned, a contribution of NO+ species cannot be ex-cluded [60]. These species could be formed in a sideprocess through disproportionation of liquid-like NOinto NO+ + (N2O2)
− or into NO+ + N2O + NO2−
ionic species [61]. The absence of the band in the2300–2275 cm−1 region upon direct adsorption ofN2 rules out any assignment based on di-nitrogenmolecules adsorbed on Cu+ sites. Of course, the for-mation of N2 indicates that the NO decomposition intoN2 and O2 is already initiating following the plausiblescheme:
2NO → N2 + O2
The spectroscopy of NO dosed on Na-Cu-ETS-10(A)sample does not show new relevant bands, conse-quently these spectra are not discussed in detail. Weonly notice that the bands due to nitrosyl complexeson Cu2O have smaller (relative) intensity.
4. Conclusion
A complete IR study of N2, CO and NO adsorbedon a Cu-exchanged ETS-10 activated at 673 K underdynamic vacuum is reported. In spite of the com-plexity of the IR spectra, an exhaustive assignment ofthe observed components has been made on the basisof an accurate comparison with similar experimentscarried on several Cu+-zeolites and Cu2O particlesdispersed on silica and on MCM-41. Two differ-ent families of cuprous sites are evidenced: (i) Cu+sites of Cu2O nano-crystals formed during sampleactivation; (ii) Cu+ counterions, balancing the nega-tive charge of the framework. The size of the Cu2Onano-crystals entrapped in the channels and cavitiesmust be very small, as evidenced by: (i) the blue shiftof the adsorption edge, with respect to bulk Cu2O,observed by UV–Vis; (ii) the absence of CO–COinteractions (which are on the contrary present onextended facelets and terraces of well-shaped micro-crystals). For these reasons, the hypothesis that partof the Cu2O nano-particles are trapped inside theETS-10 channels is reasonable. The cuprous sites areactive in the decomposition of NO, as demonstratedby a temperature-dependent IR study.
Acknowledgements
This project has been supported by MURST (Cofin98, Area 03). We are indebted to J. Rocha and M.W.Anderson for having supplied a copy of manuscript[7] prior publication.
Note added in proof
After the submission of this work some importantpapers have appeared in the literature [62–64]. Ref.
104 S. Bordiga et al. / Catalysis Today 70 (2001) 91–105
[62] reports a combined XPS and XANES study onthe thermal Cu2+ → Cu+ reduction and should bequoted together with Refs. [42,48–51]. It also reportsa combined IR and microcalorimetric study on theadsorption of CO on Cu-ZSM-5 zeolite. Ref. [63] isa review article on metal carbonyls where the readercan be found the C–O stretching frequencies of dif-ferent Cu+. . . (CO)n (n= 1,2,3,4) complexes, to becompared with those reported here in Table 2. Finally,Ref. [64] is a review article on the surface charac-terisation of oxides and halides. In that work severalN–N, C–O and N–O stretching frequencies have beencollected, to be compared with those reported here inTables 1, 2 and 3.
References
[1] S.M. Kuznicki, US Patent 4,853,202 (1989).[2] D.M. Champman, A.L. Roe, Zeolites 10 (1990) 730.[3] M.W. Anderson, O. Terasaki, T. Ohsuna, A. Phillippou, S.P.
MacKay, A. Ferreira, J. Rocha, S. Lidin, Nature 367 (1994)347.
[4] M.W. Anderson, O. Terasaki, T. Ohsuna, P.J.O. Malley, A.Phylippou, S.P. MacKay, A. Ferreira, J. Rocha, S. Lidin, Phil.Mag. B 71 (1995) 813.
[5] T. Ohsuna, O. Terasaki, D. Watanabe, M.W. Anderson, S.Lidin, Stud. Surf. Sci. Catal. 84 (1994) 413.
[6] X.Q. Wang, A.J. Jacobson, Chem. Commun. (1994) 973.[7] J. Rocha, M.W. Anderson, Eur. J. Inorg. Chem. 5 (2000) 801.[8] G. Sankar, R.G. Bell, J.M. Thomas, M.W. Anderson, P.A.
Wright, J. Rocha, J. Phys. Chem. 100 (1996) 449.[9] E. Borello, C. Lamberti, S. Bordiga, A. Zecchina, C. Otero
Areán, Appl. Phys. Lett. 71 (1997) 2319.[10] C. Lamberti, Micropor. Mesopor. Mater. 30 (1999) 155.[11] S. Bordiga, G. Turnes Palomino, A. Zecchina, G. Ranghino,
E. Giamello, C. Lamberti, J. Chem. Phys. 112 (2000) 3859.[12] T. Blasco, M.A. Cambor, A. Corma, J. Perez-Pariente, J. Am.
Chem. Soc. 115 (1993) 11806.[13] M. Taramasso, G. Perego, B. Notari, US Patent 4,410,501
(1983).[14] B. Notari, Adv. Catal. 41 (1996) 253.[15] S. Bordiga, S. Coluccia, C. Lamberti, L. Marchese, A.
Zecchina, F. Boscherini, F. Buffa, F. Genoni, G. Leofanti, G.Petrini, G. Vlaic, J. Phys. Chem. 98 (1994) 4125.
[16] V. Bolis, S. Bordiga, C. Lamberti, A. Zecchina, G. Petrini,F. Rivetti, G. Spanò, Langmuir 15 (1999) 5753.
[17] M.E. Grillo, J. Carrazza, J. Phys. Chem. 100 (1996) 12261.[18] M.W. Anderson, J.R. Agger, D.P. Luigi, A.K. Baggaley, J.
Rocha, Phys. Chem. Chem. Phys. 1 (1999) 2287.[19] G. Ganapathy, T.K. Das, R. Vetrivel, S.S. Ray, T. Sen, S.
Sivasanker, L. Delevoye, C. Fernandez, J.P. Amoureux, J.Am. Chem. Soc. 120 (1998) 4752.
[20] M.A. Fox, K.E. Doan, M.T. Dulay, Res. Chem. Intermediat.20 (1994) 711.
[21] A. Zecchina, C. Otero Areán, G. Turnes Palomino, C.Lamberti, G. Spoto, D. Scarano, S. Bordiga, F. Geobaldo,Phys. Chem. Chem. Phys. 1 (1999) 1649.
[22] A. Philippou, M. Naderi, N. Pervaiz, J. Rocha, M.W.Anderson, J. Catal. 178 (1998) 174.
[23] T.K. Das, A.J. Chandwadkar, S. Sivasanker, Stud. Surf. Sci.Catal. Lett. 113 (1998) 455.
[24] S.B. Waughmode, T.K. Das, S. Sivasanker, Catalysis 185(1999) 265.
[25] A. Philippou, J. Rocha, M.W. Anderson, Catal. Lett. 57 (1999)151.
[26] S.M. Kuznicki, K.A. Thrush, US Patent 4,994,191 (1991).[27] C. Otero Areán, G. Turnes Palomino, A. Zecchina, S. Bordiga,
F.X. Llabrés i Xamena, C. Pazé, Catal. Lett. 66 (2000) 231.[28] C.L. Bianchi, R. Carli, S. Merlotti, V. Ragaini, Catal. Lett.
41 (1996) 79.[29] C.L. Bianchi, V. Ragaini, J. Catal. 168 (1997) 70.[30] C.L. Bianchi, S. Vitali, V. Ragaini, Stud. Surf. Sci. Catal.
119 (1998) 167.[31] C.L. Bianchi, S. Ardizzone, V. Ragaini, Stud. Surf. Sci. Catal.
119 (1998) 173.[32] M. Shelef, Chem. Rev. 95 (1995) 209.[33] G. Centi, S. Perathoner, Catal. Today 29 (1996) 117.[34] M. Iwamoto, H. Yahiro, S. Sundo, Y. Yu-u, N. Mizuno, Appl.
Catal. 69 (1991) L15.[35] V.I. Parvulescu, P. Grange, B. Delmon, Catal. Today 46 (1998)
233.[36] C. Lamberti, S. Bordiga, M. Salvalaggio, G. Spoto, A.
Zecchina, F. Geobaldo, G. Vlaic, M. Bellatreccia, J. Phys.Chem. B 101 (1997) 344.
[37] G. Turnes Palomino, S. Bordiga, A. Zecchina, G.L. Marra,C. Lamberti, J. Phys. Chem. B 104 (2000) 8641.
[38] C. Lamberti, S. Bordiga, A. Zecchina, M. Salvalaggio, F.Geobaldo, C. Otero Areán, J. Chem. Soc., Faraday Trans. 94(1998) 1519.
[39] G. Turnes Palomino, E. Giamello, P. Fisicaro, S. Bordiga,C. Lamberti, A. Zecchina, Stud. Surf. Sci. Catal. 130 (2000)2915.
[40] A. Zecchina, D. Scarano, G. Spoto, S. Bordiga, C. Lamberti,G. Bellussi, Stud. Surf. Sci. Catal. 117 (1998) 434.
[41] D. Scarano, S. Bordiga, C. Lamberti, G. Spoto, G. Ricchiardi,A. Zecchina, C. Otero Areán, Surf. Sci. 411 (1998) 272.
[42] G. Turnes Palomino, P. Fisicaro, S. Bordiga, A. Zecchina, E.Giamello, C. Lamberti, J. Phys. Chem. B 104 (2000) 4064.
[43] G. Spoto, S. Bordiga, D. Scarano, A. Zecchina, Catal. Lett.13 (1992) 39.
[44] G. Spoto, A. Zecchina, S. Bordiga, G. Ricchiardi, G. Martra,G. Leofanti, G. Petrini, Appl. Catal. B 3 (1994) 151.
[45] A. Zecchina, S. Bordiga, M. Salvalaggio, G. Spoto, D.Scarano, C. Lamberti, J. Catal. 173 (1998) 540.
[46] A. Zecchina, S. Bordiga, G. Turnes Palomino, D. Scarano,C. Lamberti, M. Salvalaggio, J. Phys. Chem. B 103 (1999)3833.
[47] J. Valyon, W.K. Hall, J. Phys. Chem. 97 (1993) 1204.[48] W. Grünert, N.W. Hayes, R.W. Joyner, E.S. Shpiro, M. Rafiq,
H. Siddiqui, G.N. Baeva, J. Phys. Chem. 98 (1994) 10832.[49] J. Valyon, W.K. Hall, J. Phys. Chem. 97 (1993) 7054.
S. Bordiga et al. / Catalysis Today 70 (2001) 91–105 105
[50] H.J. Jong, W.K. Hall, J.L. d’Itri, J. Phys. Chem. 100 (1996)9416.
[51] C. Dossi, A. Fusi, G. Moretti, S. Recchia, R. Psaro, Appl.Catal. A 188 (1999) 107.
[52] F. Geobaldo, C. Lamberti, G. Ricchiardi, S. Bordiga, A.Zecchina, G. Turnes Palomino, C. Otero Areán, J. Phys.Chem. 99 (1995) 11167.
[53] A. Zecchina, C. Otero Areán, Chem. Soc. Rev. 25 (1996)187.
[54] Y. Kuroda, Y. Yoshikawa, S. Konno, H. Hamano, H. Maeda,R. Kumashiro, M. Nagao, J. Phys. Chem. 99 (1995) 10621.
[55] C. Lamberti, G. Turnes Palomino, S. Bordiga, G. Berlier, F.D’Acapito, A. Zecchina, Angew. Chem. Int. Ed. Engl. 39(2000) 2138.
[56] S. Bordiga, D. Scarano, G. Spoto, A. Zecchina, C. Lamberti,C. Otero Areán, Vib. Spectrosc. 5 (1993) 69.
[57] E. Giamello, D. Murphy, G. Magnacca, C. Morterra, Y.Shioya, T. Nomura, M. Anpo, J. Catal. 136 (1992) 510.
[58] C. Henriques, M.F. Ribeiro, C. Abreu, D.M. Murphy, F.Poignant, J. Saussey, J.C. Lavalley, Appl. Catal. B 16 (1998)79.
[59] M. Ziólek, I. Sobczak, I. Nowak, M. Daturi, J.C. Lavalley,Topics Catal. 11/12 (2000) 343.
[60] J. Laane, J.R. Ohlsen, Prog. Inorg. Chem. 27 (1980) 645.[61] P.H. Kasai, R.J. Bishop, J. Am. Chem. Soc. 94 (1972) 5560.[62] V. Bolis, S. Maggiorin, L. Meda, F. D’Acapito, G. Turnes
Palomino, S. Bordiga, C. Lamberti, J. Chem. Phys. 113 (2000)9248.
[63] A.J. Lupinetti, S.H. Strauss, G. Frenking, Prog. Inorg. Chem.49 (2001) 1.
[64] A. Zecchina, D. Scarano, S. Bordiga, G. Spoto, C. Lamberti,Adv. Catal. 46 (2001) 265.
Copyright © 2022 FDOKUMEN