Interaction of a potential chloride channel blocker with a model transport protein: a spectroscopic...
11
This journal is © the Owner Societies 2014 Phys. Chem. Chem. Phys., 2014, 16, 8465--8475 | 8465 Cite this: Phys. Chem. Chem. Phys., 2014, 16, 8465 Interaction of a potential chloride channel blocker with a model transport protein: a spectroscopic and molecular docking investigation Aniruddha Ganguly, Bijan Kumar Paul,† Soumen Ghosh, Sasanka Dalapati‡ and Nikhil Guchhait* The present work demonstrates a detailed characterization of the interaction of a potential chloride channel blocker, 9-methyl anthroate (9-MA), with a model transport protein, Bovine Serum Albumin (BSA). The modulated photophysical properties of the emissive drug molecule within the microheterogeneous bio- environment of the protein have been exploited spectroscopically to monitor the probe–protein binding interaction. Apart from evaluating the binding constant, the probable location of the neutral molecule within the protein cavity (subdomain IB) is explored by an AutoDock-based blind docking simulation. The absence of the Red-Edge Effect has been corroborated by the enhanced lifetime of the probe, being substantially greater than the solvent reorientation time. A dip-and-rise characteristic of the rotational relaxation profile of the drug within the protein has been argued to originate from a significant difference in the lifetime as well as amplitude of the free and protein-bound drug molecule. Unfolding of the protein in the presence of the drug molecule has been probed by the decrease of the a-helical content, obtained via circular dichroism (CD) spectroscopy, which is also supported by the gradual loss of the esterase activity of the protein in the presence of the drug molecule. Introduction Photophysical processes, preferentially within organized media, have been a theme of burgeoning research interests for the last few decades. The spatial orientation and altered properties of chemical entities entrapped within both biological and biomimicking assemblies have garnered enormous attention compared to those in pure homogeneous media. 1–5 Likewise, knowledge of the nature and mechanism of interactions between small molecules and proteins and the dynamics of the involved processes have paramount relevance for the understanding of biochemical consequences of drug–protein interactions and their importance in pharmacology and pharmacodynamics. 4–6 Serum albumins are the most abundant circulatory proteins in blood plasma (comprising nearly 52–60% of it) and play a pivotal role in the transport and disposition of various exogenous and endogenous compounds to the target sites. Their presence in the circulatory system helps the metabolic modification of some ligands, reduces the activity of toxins, affects the pharmaco- kinetics of many drugs, controls the anti-oxidant properties of the plasma and sometimes displays pseudo-enzymatic properties. 6–9 The structure of the single chain transport protein Bovine Serum Albumin (BSA), which is largely a-helical (B67%), is composed of 583 amino acid residues and is characterized by a low tryptophan content along with a high content of cystine, stabilizing a series of nine loops. While both charged amino acid residues and apolar patches cover the interface, the interior of the protein is almost hydrophobic in nature. The tertiary structure is composed of three structurally homologous domains, I, II and III, and each domain is a product of two subdomains, A and B, which are cross-linked by several disulfide bridges. The protein BSA contains two tryptophan residues, Trp-134 and Trp-212, the former of which is located in the hydrophilic subdomain IB, and is proposed to be situated near the surface of the albumin molecule in the second helix of the first domain, while Trp-212 is located in the hydrophobic subdomain IIA. 6–9 BSA is known to exhibit a very high conformational adaptability to a large variety of ligands. 9–11 According to the conventional view based on Sudlow’s classification, the principal regions of ligand interactions are located in the hydrophobic pockets at subdomains IIA and IIIA, the latter having the highest affinity. A third binding pocket within the large crevice of subdomain IB (characterized by a net negative charge in physiological pH), Department of Chemistry, University of Calcutta, 92 A. P. C. Road, Calcutta-700009, India. E-mail: [email protected]; Fax: +91-33-2351-9755; Tel: +91-33-2350-8386 † Present address: Department of Chemistry, Indian Institute of Science Educa- tion and Research Bhopal, Bhopal 462 023, Madhya Pradesh, India. ‡ Present address: Institute for Molecular Science, National Institute of Natural Sciences, 5-1 Higashiyama, Myodaiji, Okazaki 444-8787, Japan. Received 10th September 2013, Accepted 10th February 2014 DOI: 10.1039/c3cp53843e www.rsc.org/pccp PCCP PAPER Published on 10 February 2014. Downloaded by Calcutta University on 09/04/2014 16:09:45. View Article Online View Journal | View Issue
Transcript of Interaction of a potential chloride channel blocker with a model transport protein: a spectroscopic...
This journal is© the Owner Societies 2014 Phys. Chem. Chem. Phys., 2014, 16, 8465--8475 | 8465
Cite this:Phys.Chem.Chem.Phys.,
2014, 16, 8465
Interaction of a potential chloride channel blockerwith a model transport protein: a spectroscopicand molecular docking investigation
Aniruddha Ganguly, Bijan Kumar Paul,† Soumen Ghosh, Sasanka Dalapati‡ andNikhil Guchhait*
The present work demonstrates a detailed characterization of the interaction of a potential chloride
channel blocker, 9-methyl anthroate (9-MA), with a model transport protein, Bovine Serum Albumin (BSA).
The modulated photophysical properties of the emissive drug molecule within the microheterogeneous bio-
environment of the protein have been exploited spectroscopically to monitor the probe–protein binding
interaction. Apart from evaluating the binding constant, the probable location of the neutral molecule within
the protein cavity (subdomain IB) is explored by an AutoDock-based blind docking simulation. The absence
of the Red-Edge Effect has been corroborated by the enhanced lifetime of the probe, being substantially
greater than the solvent reorientation time. A dip-and-rise characteristic of the rotational relaxation
profile of the drug within the protein has been argued to originate from a significant difference in the
lifetime as well as amplitude of the free and protein-bound drug molecule. Unfolding of the protein in
the presence of the drug molecule has been probed by the decrease of the a-helical content, obtained
via circular dichroism (CD) spectroscopy, which is also supported by the gradual loss of the esterase
activity of the protein in the presence of the drug molecule.
Introduction
Photophysical processes, preferentially within organized media,have been a theme of burgeoning research interests for the last fewdecades. The spatial orientation and altered properties of chemicalentities entrapped within both biological and biomimickingassemblies have garnered enormous attention compared to thosein pure homogeneous media.1–5 Likewise, knowledge of the natureand mechanism of interactions between small molecules andproteins and the dynamics of the involved processes haveparamount relevance for the understanding of biochemicalconsequences of drug–protein interactions and their importancein pharmacology and pharmacodynamics.4–6
Serum albumins are the most abundant circulatory proteinsin blood plasma (comprising nearly 52–60% of it) and play apivotal role in the transport and disposition of various exogenousand endogenous compounds to the target sites. Their presencein the circulatory system helps the metabolic modification of
some ligands, reduces the activity of toxins, affects the pharmaco-kinetics of many drugs, controls the anti-oxidant properties of theplasma and sometimes displays pseudo-enzymatic properties.6–9
The structure of the single chain transport protein BovineSerum Albumin (BSA), which is largely a-helical (B67%), iscomposed of 583 amino acid residues and is characterized by alow tryptophan content along with a high content of cystine,stabilizing a series of nine loops. While both charged aminoacid residues and apolar patches cover the interface, the interiorof the protein is almost hydrophobic in nature. The tertiarystructure is composed of three structurally homologous domains,I, II and III, and each domain is a product of two subdomains,A and B, which are cross-linked by several disulfide bridges.The protein BSA contains two tryptophan residues, Trp-134 andTrp-212, the former of which is located in the hydrophilicsubdomain IB, and is proposed to be situated near the surfaceof the albumin molecule in the second helix of the first domain,while Trp-212 is located in the hydrophobic subdomain IIA.6–9
BSA is known to exhibit a very high conformational adaptabilityto a large variety of ligands.9–11 According to the conventionalview based on Sudlow’s classification, the principal regions ofligand interactions are located in the hydrophobic pockets atsubdomains IIA and IIIA, the latter having the highest affinity.A third binding pocket within the large crevice of subdomain IB(characterized by a net negative charge in physiological pH),
Department of Chemistry, University of Calcutta, 92 A. P. C. Road,
Calcutta-700009, India. E-mail: [email protected]; Fax: +91-33-2351-9755;
Tel: +91-33-2350-8386
† Present address: Department of Chemistry, Indian Institute of Science Educa-tion and Research Bhopal, Bhopal 462 023, Madhya Pradesh, India.‡ Present address: Institute for Molecular Science, National Institute of NaturalSciences, 5-1 Higashiyama, Myodaiji, Okazaki 444-8787, Japan.
Received 10th September 2013,Accepted 10th February 2014
DOI: 10.1039/c3cp53843e
www.rsc.org/pccp
PCCP
PAPER
Publ
ishe
d on
10
Febr
uary
201
4. D
ownl
oade
d by
Cal
cutta
Uni
vers
ity o
n 09
/04/
2014
16:
09:4
5.
View Article OnlineView Journal | View Issue

8466 | Phys. Chem. Chem. Phys., 2014, 16, 8465--8475 This journal is© the Owner Societies 2014
which in general is a recognized binding site for cationicprobes, has recently been identified as the primary bindingsite for a few biologically important hydrophobic ligands.10–14
Keeping in mind the significance of drug–protein interac-tions, the present program delineates the binding interactionof a drug, 9-methyl anthroate (9-MA), belonging to the eminentchloride channel blocker family with the model transportprotein BSA via modulation of the excited-state photophysicsof the drug within the constrained bio-assembly. The detailedphotophysics of 9-MA have been previously reported from ourlaboratory.15 In the present study, the remarkably modifiedphotophysics of 9-MA upon confinement within the microheter-ogeneous protein environment have been adopted for spectralinterpretation of the drug–protein interaction process. Themodulated emission of the probe upon binding to the proteinhas been used to determine the drug–protein binding strength.The effect of the binding of the drug on the conformation of thenative protein has been explored by various techniques e.g.,dynamic light scattering and circular dichroism (CD) spectro-scopy, to yield consensus results. The probable binding locationof the drug within the proteinous cavity has been unveiled froman Auto-Dock-based blind docking simulation.
ExperimentalMaterials
The detailed synthesis and purification procedure of 9-MA(Scheme 1) has been described elsewhere.15 BSA from SigmaChemical Co., USA was used as received. Tris–HCl buffer waspurchased from SRL, India, and a 0.01 M Tris–HCl buffer ofpH 7.4 was prepared in triply distilled deionized water from aMilli-Q water purification system (Millipore). The solventappeared visually transparent and the purity was also testedby running the fluorescence spectra in the studied wavelengthrange. Guanidine hydrochloride (GuHCl) was purchased fromE-Merck and used as received. p-Nitrophenylacetate (PNPA) ofanalytical grade was obtained from SRL, India and used withoutfurther purification.
Steady-state spectral measurements
The absorption and emission spectra were recorded on aHitachi UV-Vis U-3501 spectrophotometer and a Perkin-ElmerLS55 fluorimeter, respectively, with appropriate corrections forinstrumental response. The backgrounds of the recorded spectra
were appropriately subtracted with a blank aqueous buffersolution in order to eliminate any spectral interference. Theexperiments have been carried out at an ambient temperature of298 K unless otherwise specified. Only freshly prepared solutionswere used for the spectroscopic measurements.
Time-resolved fluorescence decay measurements
Fluorescence lifetimes were obtained by the method of TimeCorrelated Single-Photon counting (TCSPC) on a FluoroCube-01-NL spectrometer (Horiba Jobin Yvon) using a Laser-Diodewith an output of 375 nm and the signals were collected at themagic angle of 54.71 to eliminate any considerable contributionfrom fluorescence anisotropy decay.4,6,13–15 The decays weredeconvoluted on DAS-6 decay analysis software. The accept-ability of the fits was judged by w2 criteria and visual inspectionof the residuals of the fitted function to the data. Mean(average) fluorescence lifetimes (htfi) were calculated usingthe following equation:4,6,13–15
tfh i ¼P
aiti2Paiti
(1)
in which ai is the pre-exponential factor corresponding to theith decay time constant, ti.
For the time-resolved fluorescence anisotropy decay mea-surements, the polarized fluorescence decays for the parallel[IVV] and perpendicular [IVH] emission polarizations withrespect to the vertical excitation polarization were first collectedat the emission maxima of the probe. The anisotropy decayfunction, r(t), was constructed from these IVV and IVH decaysusing the following equation:4,6,14
rðtÞ ¼ IVV � G:IVHð ÞIVV þ 2G:IVH
(2)
in which G is the correction factor for the detector sensitivity ofthe instrument.
Circular dichroism spectroscopy
Circular dichroism (CD) spectra were recorded on a JASCO J-815spectropolarimeter using a cylindrical cuvette with a 0.1 cmpath-length at 25 1C. The reported CD profiles are an average offour successive scans obtained at a 20 nm min�1 scan rate withan appropriately corrected baseline. The concentrations of BSAand the drug during the CD measurements are mentioned inthe relevant discussion.
Dynamic light scattering
Dynamic light scattering (DLS) measurements were carried outon a Malvern Nano-ZS instrument employing a 4 mW He–Nelaser (l = 632.8 nm) and equipped with a thermostated samplechamber. The sample was poured into a DTS0112 low volumedisposal sizing cuvette of 1.5 mL (path-length of 1 cm). Theoperating procedure was programmed by the DTS software insuch a fashion that there was an average of 25 runs, each runbeing averaged for 15 s, and then a particular hydrodynamicdiameter and a size distribution was evaluated.Scheme 1 Structure of 9-methyl anthroate (9-MA).
Paper PCCP
Publ
ishe
d on
10
Febr
uary
201
4. D
ownl
oade
d by
Cal
cutta
Uni
vers
ity o
n 09
/04/
2014
16:
09:4
5.
View Article Online
This journal is© the Owner Societies 2014 Phys. Chem. Chem. Phys., 2014, 16, 8465--8475 | 8467
Esterase activity assay
The effect of the drug on the esterase activity of BSA was assayedwith the synthetic substrate p-nitrophenyl acetate (PNPA) byfollowing the formation of p-nitrophenol13,14 at 37 1C.
Molecular modeling: docking study
The native structure of BSA was taken from the Protein DataBank having PDB ID: 3V03.16 Docking studies were performedwith the AutoDock 4.2 suite of programs, which utilizes theLamarckian Genetic Algorithm (LGA) implemented therein. For thedocking of the drug with BSA, the required file for the ligand(corresponding to the three-dimensional structure of the drug 9-MA)was created through the combined use of the Gaussian 03W17 andAutoDock 4.218 software packages. The geometry of 9-MA was firstoptimized at the DFT//B3LYP/6-311++G(d,p) level of theory using theGaussian 03W suite of programs and the resultant geometry wasread in the AutoDock 4.2 software in a compatible file format, fromwhich the required file was generated in AutoDock 4.2. The grid sizewas set to 126, 126, and 126 Å along the X-, Y-, and Z-axis with a0.419 Å grid spacing, i.e. in order to recognize the binding siteof 9-MA in BSA the strategy of a blind docking simulation wasadopted. The AutoDocking parameters used were as follows: GApopulation size = 150; maximum number of energy evaluations =250 000; GA crossover mode = two points. The lowest bindingenergy conformer was taken from 10 different conformations foreach docking simulation and the resultant minimum energyconformation was applied for further analysis. The PyMOL softwarepackage was used for visualization of the docked conformations.19
Results and discussion
The detailed photophysical properties of the drug 9-MA inbulk homogeneous fluids has been previously reported by ourgroup.15 The absorption profile of 9-MA shows a broad struc-tured band with a maximum near 360 nm, which is assigned tothe S1 ’ S0 transition (p–p* type) of the anthracene chromo-phore. The emission profile of the probe is characterized by alarge Stokes shifted, broad, unstructured band, which exhibitssubstantial solvent polarity dependence (from B440 nm inn-hexane to B480 nm in water) owing to an increased polarityof the emissive state. Interestingly, the fluorescence intensity,quantum yield and lifetime of this emission band are found tobe amply modified by the nature of the surrounding environ-ment. Hence, this emission band can be used as an externalprobe to study the internal microenvironment of the protein.
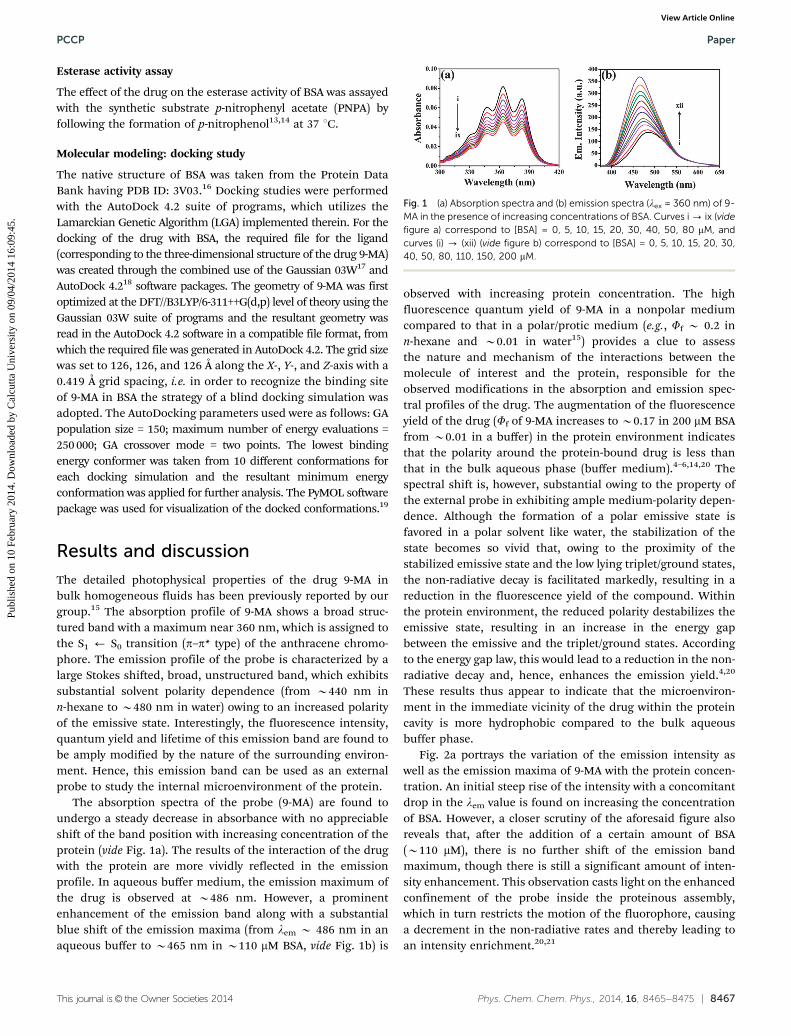
The absorption spectra of the probe (9-MA) are found toundergo a steady decrease in absorbance with no appreciableshift of the band position with increasing concentration of theprotein (vide Fig. 1a). The results of the interaction of the drugwith the protein are more vividly reflected in the emissionprofile. In aqueous buffer medium, the emission maximum ofthe drug is observed at B486 nm. However, a prominentenhancement of the emission band along with a substantialblue shift of the emission maxima (from lem B 486 nm in anaqueous buffer to B465 nm in B110 mM BSA, vide Fig. 1b) is
observed with increasing protein concentration. The highfluorescence quantum yield of 9-MA in a nonpolar mediumcompared to that in a polar/protic medium (e.g., Ff B 0.2 inn-hexane and B0.01 in water15) provides a clue to assessthe nature and mechanism of the interactions between themolecule of interest and the protein, responsible for theobserved modifications in the absorption and emission spec-tral profiles of the drug. The augmentation of the fluorescenceyield of the drug (Ff of 9-MA increases to B0.17 in 200 mM BSAfrom B0.01 in a buffer) in the protein environment indicatesthat the polarity around the protein-bound drug is less thanthat in the bulk aqueous phase (buffer medium).4–6,14,20 Thespectral shift is, however, substantial owing to the property ofthe external probe in exhibiting ample medium-polarity depen-dence. Although the formation of a polar emissive state isfavored in a polar solvent like water, the stabilization of thestate becomes so vivid that, owing to the proximity of thestabilized emissive state and the low lying triplet/ground states,the non-radiative decay is facilitated markedly, resulting in areduction in the fluorescence yield of the compound. Withinthe protein environment, the reduced polarity destabilizes theemissive state, resulting in an increase in the energy gapbetween the emissive and the triplet/ground states. Accordingto the energy gap law, this would lead to a reduction in the non-radiative decay and, hence, enhances the emission yield.4,20
These results thus appear to indicate that the microenviron-ment in the immediate vicinity of the drug within the proteincavity is more hydrophobic compared to the bulk aqueousbuffer phase.
Fig. 2a portrays the variation of the emission intensity aswell as the emission maxima of 9-MA with the protein concen-tration. An initial steep rise of the intensity with a concomitantdrop in the lem value is found on increasing the concentrationof BSA. However, a closer scrutiny of the aforesaid figure alsoreveals that, after the addition of a certain amount of BSA(B110 mM), there is no further shift of the emission bandmaximum, though there is still a significant amount of inten-sity enhancement. This observation casts light on the enhancedconfinement of the probe inside the proteinous assembly,which in turn restricts the motion of the fluorophore, causinga decrement in the non-radiative rates and thereby leading toan intensity enrichment.20,21
Fig. 1 (a) Absorption spectra and (b) emission spectra (lex = 360 nm) of 9-MA in the presence of increasing concentrations of BSA. Curves i - ix (videfigure a) correspond to [BSA] = 0, 5, 10, 15, 20, 30, 40, 50, 80 mM, andcurves (i) - (xii) (vide figure b) correspond to [BSA] = 0, 5, 10, 15, 20, 30,40, 50, 80, 110, 150, 200 mM.
PCCP Paper
Publ
ishe
d on
10
Febr
uary
201
4. D
ownl
oade
d by
Cal
cutta
Uni
vers
ity o
n 09
/04/
2014
16:
09:4
5.
View Article Online

8468 | Phys. Chem. Chem. Phys., 2014, 16, 8465--8475 This journal is© the Owner Societies 2014
Probe–protein complexation equilibrium and micropolarityaround the fluorophore
A quantitative estimate of the extent of the binding of 9-MA tothe hydrophobic cavity of the protein is obtained from anexamination of the emission data using the Benesi–Hildebrandrelation. A detailed discussion on the Benesi–Hildebrand equationis avoided here, since it is routine and profusely available in theliterature.22,23 We thus use the following equation,
1
I � I0ð Þ ¼1
I1 � I0ð Þ þ1
I1 � I0ð ÞK BSA½ � (3)
in which I0, I and I1 are the emission intensities, respectively, inthe absence of, at the intermediate and infinite concentration(indicating saturation of the interaction) of BSA. Thus, ananalysis of the fluorescence data on eqn (3) paves the way forsimplistic mapping of the spectroscopic modulations on aquantitative scale through the estimation of the binding para-meters and stoichiometry of the 9-MA:BSA complex. As seen inFig. 2b, the plot of 1/[I � I0] vs. 1/[BSA] (mM�1) produces astraight line, indicating the formation of a 1 : 1 complex betweenthe probe and BSA.22,23 The excellence of this linear fit can bejustified from the correlation factor R = 0.9989 and standarddeviation (SD) = 4.39 � 10�4. A quantitative estimate of the extentof the binding, i.e. the binding constant (K), is determined fromthe intercept to slope ratio of the Benesi–Hildebrand plot and thecomputed value is K = (9.43 � 0.4) � 103 M�1 at the experimentaltemperature (298 K). Using this value of K, the free energy changefor this process of complexation is determined to be DG =�22.67 kJ mol�1, which dictates a favorable complexation process.
In the present context, we have also made an attempt toestimate the micropolarity of the proteinous environment aroundthe fluorophore. As the proteinous medium is heterogeneous, theprobe molecules experience varied polarity depending on theirprecise location inside the protein.4,14,20 As mentioned earlier, theblue shift of the emission band of 9-MA in the protein solutionreflects the lower polarity of the probe-binding site in the protein.To find out the polarity experienced by our probe molecules insidethe protein solution, we have employed the sensitivity of theemission band towards the polarity of the medium, by takingthe probe in different percentages of water and dioxane mixtures.The standard ET(30) values of the dioxane–water mixtures weredetermined on the basis of the intramolecular charge transfertransition of the betaine dye 2,6-diphenyl-4(2,4,6-triphenyl-1-pyridino)phenolate.24 The polarity, in terms of ET(30), of theproteinous microenvironment surrounding the fluorophorecan hence be determined based on the position of the emissionmaxima of the emission band in these environments. Themicropolarity of the binding region is thus determined to be52.44 on the ET(30) scale (vide the inset of Fig. 2b), which isconsiderably low compared to that of bulk water (ET(30) = 63.1),indicating the significant hydrophobic character of the proteincore.4,14,20 Interestingly, literature reports, including a preced-ing work from our group,4 suggest a considerably smaller valueof the ET(30) parameter (typically B40–48, even o40 in a fewcases4,25,26) for the hydrophobic binding regions, i.e. subdomains IIAand IIIA of BSA. Thus, the obtained value of the ET(30) parameterin the present context possibly indicates intercalation of the drugin a comparatively hydrophilic region or the presence of polar orcharged residues in the immediate vicinity of the drug. Thispostulate also bears good agreement with another work from ourgroup involving a cationic biological photosensitizer Harmane(HM), yielding an ET(30) value of 51.23, which is known to bindin the comparatively hydrophilic IB region of BSA.14
In an endeavor to externally modify the fluorescence ofprotein-bound 9-MA, we adopted the strategy of quenching thefluorescence of the probe by acrylamide in different environ-ments. This is a simple but efficient strategy for assessing thelocation of the probe within the protein.4,14 The fluorescencequenching of 9-MA with the addition of the quencher has beenfollowed using the prototype Stern–Volmer equation,4,14 i.e.
I0
I¼ KSV½Q� ¼ kqt0½Q� (4)
in which I0 is the original fluorescence intensity; I is the quenchedintensity of the fluorophore (9-MA); Q is the quencher (hereacrylamide); and KSV is the Stern–Volmer quenching constant.The higher the magnitude of KSV, the more efficient the quenching,ensuring a greater degree of exposure of the probe to the quencher.The Stern–Volmer plots for the acrylamide-induced quenchingof 9-MA in various experimental conditions are displayed inFig. 2c. Acrylamide is found to be an efficient quencher for9-MA (vide Fig. 2c), corresponding to KSV = (29.44 � 0.55) M�1.However, on performing the same quenching experiment onthe protein-bound probe with all the experimental conditionsand instrumental settings conserved ([BSA] = 100 mM), the
Fig. 2 (a) Variation of the intensity at the emission maxima and lem max(nm) of 9-MA as a function of BSA concentration. (b) Benesi–Hildebrandplot of 1/[I � I0] vs. 1/[BSA] (mM�1) for the binding of 9-MA with BSA. Theinset shows a plot of the variation of the emission maxima of 9-MA in adioxane–water mixture against ET(30) values. The polarity of the bindingsite of 9-MA in a proteinous medium (BSA) is indicated by the red point.(c) Stern–Volmer plots for the fluorescence quenching of 9-MA byacrylamide in various conditions, as indicated in the figure legends. Eachdata point is an average of 5 individual measurements. The error bars arewithin the marker symbols if not apparent.
Paper PCCP
Publ
ishe
d on
10
Febr
uary
201
4. D
ownl
oade
d by
Cal
cutta
Uni
vers
ity o
n 09
/04/
2014
16:
09:4
5.
View Article Online

This journal is© the Owner Societies 2014 Phys. Chem. Chem. Phys., 2014, 16, 8465--8475 | 8469
extent of the quenching is found to be significantly reduced toKSV = (1.83 � 0.2) M�1, which corresponds to negligiblequenching. Since it is known that acrylamide does not bindto the protein, which might lead to a reduced efficacy of themolecule to serve as a quencher,4,27 the present scenario readilyindicates the possibility that the probe molecules are deeplyembedded in the hydrophobic pocket of the protein. Further-more, the linearity obtained in the analysis of the observedfluorescence quenching on the Stern–Volmer equation impliesthe absence of heterogeneity in the observed quenching phe-nomenon within the experimental conditions employed.27
The upper limit of the bimolecular quenching constant (kq)for the diffusion-controlled quenching phenomenon has beenfound to be of the order of 1010 M�1 s�1.4,27 Values of kq smallerthan the diffusion-controlled value can result from steric shield-ing of the fluorophore or a low quenching efficiency, while largervalues of kq than the diffusion-controlled limit usually indicatesome type of ground-state complex formation interaction.Herein, we avoid a detailed discussion on this approach sinceit is widely accepted and discussed in sufficient detail in thestandard literature.4,27 On the basis of this approach, the value ofkq for the acrylamide-induced quenching of 9-MA in an aqueousbuffer medium is estimated to be B(5.88 � 1.1) � 1010 M�1 s�1,which therefore suggests a diffusion-controlled quenchingmechanism, while for BSA-bound 9-MA under the presentlyemployed experimental conditions, the bimolecular quenchingconstant is considerably reduced to B(2.17� 0.02)� 108 M�1 s�1,conforming a significant reduction of quenching.
It is also pertinent to mention here that the drug moleculehas an overall neutral character, which seems to promote itsprobable location in a hydrophobic binding zone of BSA,though the presence of two electronegative heteroatoms mightimpart some creditable asymmetry in the electronic chargedistribution over the entire molecular framework. However, itis too early to predict the location of the extrinsic probe. Thisissue will be authenticated in forthcoming discussions.
Steady-state fluorescence anisotropy study
A steady-state fluorescence anisotropy study provides valuableinformation about the environment in the immediate vicinityof the fluorophore. The so-called environment inducedmotional restriction on the mobility of the probe in a confinedenvironment is manifested through anisotropy variation,thereby furnishing clues to assess the location of the probewithin the complex biological environments.4,14,20,27 In thepresent case, the steady-state fluorescence anisotropy (r) ofthe drug exhibits a specific variation as a function of theprotein concentration, as displayed in Fig. 3a. An initial steeprise in the anisotropy value indicates an increasing degree ofmotional restriction on the probe imparted by the confinedenvironment within the protein, which is then followed by theattainment of a plateau region, probably marking the satura-tion of the interaction between the two parties. A substantialincrease of the anisotropy value in the saturation level of theinteraction reflects that the drug molecules are experiencingconsiderable motional restriction in their encapsulated state
within the protein environment compared with those in thebulk aqueous buffer phase.4,14,20,27
Though the variation of the anisotropy of a fluorophoreinside a biological assembly is often invoked to be the conse-quence of enhanced microviscosity of the medium, actually it isgoverned by the simultaneous operation of several other factorstoo. We have extended the anisotropy measurements of thedrug 9-MA in glycerol–water mixtures of different compositionsand compared the values with the anisotropy values of theprotein-bound situations (vide the inset of Fig. 3a). Surpris-ingly, we have noticed that the anisotropy value of the probe ina 90% glycerol–water mixture is similar to that in the proteinenvironment at the saturation level. However, it is evident thatthe viscosity within the BSA environment cannot be high enoughto exceed the viscosity of a 90% glycerol–water mixture.20,28 Thisfallacy can be rationalized by considering some specific inter-actions, such as hydrogen bonding or electrostatic bindingbetween the residues of the protein and the heteroatoms presentin the probe molecule, leading to an amplified motional restric-tion on the molecule, which possibly infers that althoughhydrophobic interactions are said to play a major role in con-trolling the drug binding to proteins, specific interactions (suchas hydrogen bonding or electrostatic binding) might also have asubstantial effect on the binding phenomenon.20 However, it isquite natural that the overall dimension of the probe–proteincomplex will be significantly larger compared to the unboundfluorophore per se, and will in turn ascertain a significantreduction in the overall tumbling motion of the former, leadingto an increase in anisotropy.13,26,27
The applicability of the anisotropy measurements has beenextended in this section to determine the probe–protein bind-ing constant independently according to the method proposedby Ingersoll and Strollo,29 the details of which have beenavoided in the present context. The following equations formthe actuating basis for the determination of the binding constantfrom the steady-state fluorescence anisotropy (r):
1
fB¼ 1þ 1
Ka½BSA�(5)
Fig. 3 (a) Variation of the steady-state fluorescence anisotropy (r) of thedrug as a function of protein (BSA) concentration. The inset shows thevariation of the steady-state fluorescence anisotropy of 9-MA as a functionof the composition of the glycerol–water mixture. Each data point is anaverage of 15 individual measurements. The error bars are within themarker symbols if not apparent. (b) Plot of 1/fB vs. 1/[BSA] (mM�1) for thedetermination of the drug (9-MA)–protein (BSA) binding constant fromthe steady-state fluorescence anisotropy measurement.
PCCP Paper
Publ
ishe
d on
10
Febr
uary
201
4. D
ownl
oade
d by
Cal
cutta
Uni
vers
ity o
n 09
/04/
2014
16:
09:4
5.
View Article Online
8470 | Phys. Chem. Chem. Phys., 2014, 16, 8465--8475 This journal is© the Owner Societies 2014
where,
fB ¼r� rF
R rB � rð Þ þ r� rFð Þ (6)
in which fB is the fractional fluorescence contribution from theprotein-bound probe, and rF and rB are the anisotropy valuescorresponding to the free (or unbound) and protein-boundprobe, respectively. R is a correction factor (R = IB/IF, the ratioof the fluorescence intensities of the drug in the absence of theprotein and in the presence of the protein respectively, measuredunder the same experimental conditions and instrumentalsettings as those during the anisotropy measurements), whichis introduced to take care of the fact that the drug undergoesemission intensity modulation upon interaction with BSA (videFig. 1b). The plot of 1/fB vs. 1/[BSA] (vide Fig. 3b) complies with alinear regression (correlation factor R = 0.9979), yielding Ka =(5.85 � 0.11) � 103 M�1. A commendable agreement with thevalue determined from the emission intensity data thus notonly establishes the reliability of the results, but also substanti-ates the practical applicability and feasibility of both themethods employed for estimating the binding constant.
Chaotrope induced protein unfolding studies
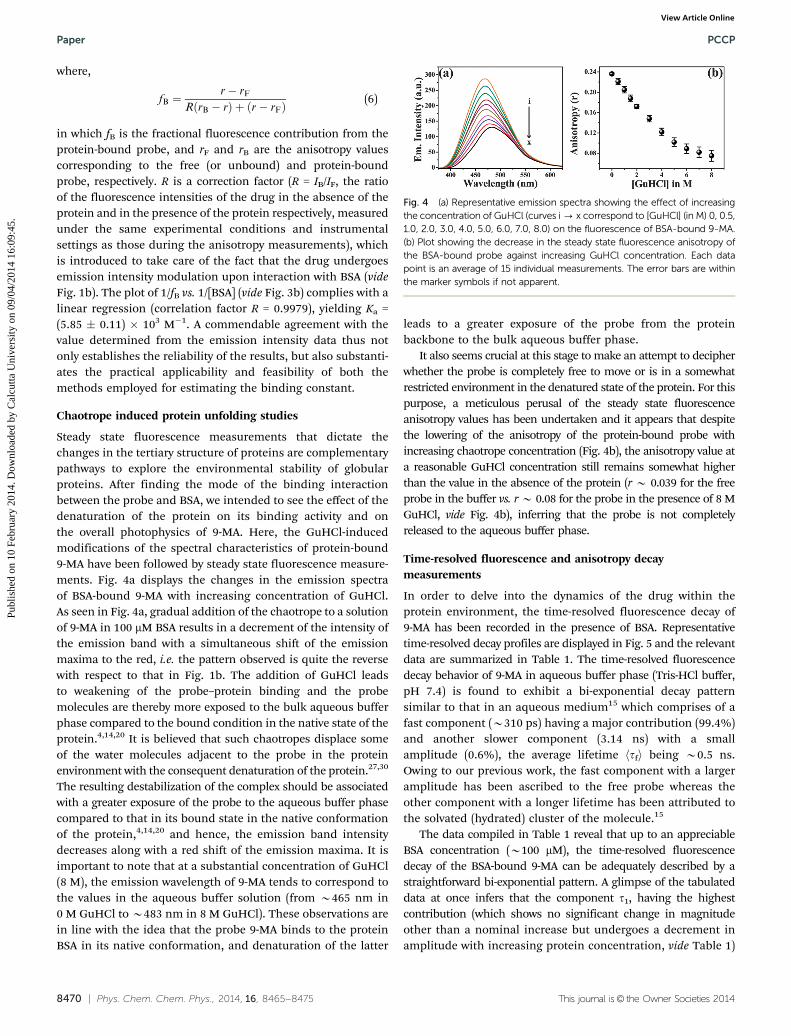
Steady state fluorescence measurements that dictate thechanges in the tertiary structure of proteins are complementarypathways to explore the environmental stability of globularproteins. After finding the mode of the binding interactionbetween the probe and BSA, we intended to see the effect of thedenaturation of the protein on its binding activity and onthe overall photophysics of 9-MA. Here, the GuHCl-inducedmodifications of the spectral characteristics of protein-bound9-MA have been followed by steady state fluorescence measure-ments. Fig. 4a displays the changes in the emission spectraof BSA-bound 9-MA with increasing concentration of GuHCl.As seen in Fig. 4a, gradual addition of the chaotrope to a solutionof 9-MA in 100 mM BSA results in a decrement of the intensity ofthe emission band with a simultaneous shift of the emissionmaxima to the red, i.e. the pattern observed is quite the reversewith respect to that in Fig. 1b. The addition of GuHCl leadsto weakening of the probe–protein binding and the probemolecules are thereby more exposed to the bulk aqueous bufferphase compared to the bound condition in the native state of theprotein.4,14,20 It is believed that such chaotropes displace someof the water molecules adjacent to the probe in the proteinenvironment with the consequent denaturation of the protein.27,30
The resulting destabilization of the complex should be associatedwith a greater exposure of the probe to the aqueous buffer phasecompared to that in its bound state in the native conformationof the protein,4,14,20 and hence, the emission band intensitydecreases along with a red shift of the emission maxima. It isimportant to note that at a substantial concentration of GuHCl(8 M), the emission wavelength of 9-MA tends to correspond tothe values in the aqueous buffer solution (from B465 nm in0 M GuHCl to B483 nm in 8 M GuHCl). These observations arein line with the idea that the probe 9-MA binds to the proteinBSA in its native conformation, and denaturation of the latter
leads to a greater exposure of the probe from the proteinbackbone to the bulk aqueous buffer phase.
It also seems crucial at this stage to make an attempt to decipherwhether the probe is completely free to move or is in a somewhatrestricted environment in the denatured state of the protein. For thispurpose, a meticulous perusal of the steady state fluorescenceanisotropy values has been undertaken and it appears that despitethe lowering of the anisotropy of the protein-bound probe withincreasing chaotrope concentration (Fig. 4b), the anisotropy value ata reasonable GuHCl concentration still remains somewhat higherthan the value in the absence of the protein (r B 0.039 for the freeprobe in the buffer vs. r B 0.08 for the probe in the presence of 8 MGuHCl, vide Fig. 4b), inferring that the probe is not completelyreleased to the aqueous buffer phase.
Time-resolved fluorescence and anisotropy decaymeasurements
In order to delve into the dynamics of the drug within theprotein environment, the time-resolved fluorescence decay of9-MA has been recorded in the presence of BSA. Representativetime-resolved decay profiles are displayed in Fig. 5 and the relevantdata are summarized in Table 1. The time-resolved fluorescencedecay behavior of 9-MA in aqueous buffer phase (Tris-HCl buffer,pH 7.4) is found to exhibit a bi-exponential decay patternsimilar to that in an aqueous medium15 which comprises of afast component (B310 ps) having a major contribution (99.4%)and another slower component (3.14 ns) with a smallamplitude (0.6%), the average lifetime htfi being B0.5 ns.Owing to our previous work, the fast component with a largeramplitude has been ascribed to the free probe whereas theother component with a longer lifetime has been attributed tothe solvated (hydrated) cluster of the molecule.15
The data compiled in Table 1 reveal that up to an appreciableBSA concentration (B100 mM), the time-resolved fluorescencedecay of the BSA-bound 9-MA can be adequately described by astraightforward bi-exponential pattern. A glimpse of the tabulateddata at once infers that the component t1, having the highestcontribution (which shows no significant change in magnitudeother than a nominal increase but undergoes a decrement inamplitude with increasing protein concentration, vide Table 1)
Fig. 4 (a) Representative emission spectra showing the effect of increasingthe concentration of GuHCl (curves i - x correspond to [GuHCl] (in M) 0, 0.5,1.0, 2.0, 3.0, 4.0, 5.0, 6.0, 7.0, 8.0) on the fluorescence of BSA-bound 9-MA.(b) Plot showing the decrease in the steady state fluorescence anisotropy ofthe BSA-bound probe against increasing GuHCl concentration. Each datapoint is an average of 15 individual measurements. The error bars are withinthe marker symbols if not apparent.
Paper PCCP
Publ
ishe
d on
10
Febr
uary
201
4. D
ownl
oade
d by
Cal
cutta
Uni
vers
ity o
n 09
/04/
2014
16:
09:4
5.
View Article Online

This journal is© the Owner Societies 2014 Phys. Chem. Chem. Phys., 2014, 16, 8465--8475 | 8471
belongs to the free (i.e. unbound) probe. The other lifetimecomponent t2, showing an increment in both the magnitude aswell as the amplitude with increasing protein concentrationtherefore ought to be a signature of probe–protein binding. Yet,owing to the difficulty in assigning individual decay compo-nents in the microheterogeneous protein environment, whichcould even be misleading in cases, it is cogent to use the mean(average) fluorescence lifetime of 9-MA to explore its behaviorwithin the BSA environments rather than putting an emphasison individual decay time constants and such analyses areabundantly available in the literature.4,14,31,32 As seen in Table 2,the average lifetime (htfi) of 9-MA progressively increases withincreasing BSA concentration and thus, a significant differencebetween the lifetime values of the free probe in an aqueous bufferand the BSA-bound probe indicates the occurrence of a bindinginteraction.4,14,31,32
However, it is worth mentioning that a change in therefractive index of the medium during lifetime analysis mightsometimes lead to a substantial change in the excited statelifetime.33 To counter this problem, a low concentration of theprotein (a maximum of 100 mM) has been maintained duringthe course of the present lifetime study. As has been shown bySchmidt,34 the change in the refractive index from water to asolution of protein in water is directly proportional to the concen-tration of the protein, and as such a change is only appreciableat a comparatively higher concentration range (mM or above), it
is likely that such a modulation in the refractive index wouldnot be significant enough to modulate the lifetime in thepresent case.
A more critical analysis of the data has been undertakenwith a view to mark out the contributions from the radiative (kr)and non-radiative (knr) decay rate constants of the drug inthe aqueous buffer and BSA environments according to thefollowing equations:4,14,15
kr ¼Ff
tfh i(7)
kr + knr = htfi�1 (8)
The calculated values are tabulated in Table 2. Scrutiny ofthe data in Table 2 confirms that in the protein environment, thenon-radiative decay constants, knr, are reasonably reduced fromthose in the aqueous buffer medium (whereas the radiative decayrates are only slightly perturbed) so that the enhanced lifetime of thefluorophore in the protein environment seems attributable to thediminution of radiationless decay. As was observed previously,15
the nature of the solvent (polarity and hydrogen bonding ability) hasa marked effect on the photophysics of the molecule in terms ofnon-radiative decay. Here also, the change of the surroundingenvironment upon the binding with the protein imparts someinfluence on the non-radiative decay process. The molecule, havingflexible sites, has a pronounced effect on the non-radiative decaychannels through large-amplitude low-frequency motion and thesemotions can be hindered through binding.
In this regard, it is pertinent to discuss the result of the Red-Edge Effect (REE) study. REE is a wavelength sensitive tool fordirectly monitoring the environment and dynamics around afluorophore in complex biological systems, which results in theshifting of the emission maxima of the probe to the red end ofthe spectrum upon the shifting of the excitation wavelength tothe red end of the corresponding absorption spectra.4,14,35–37
Surprisingly, we did not observe any wavelength dependentemission property of the probe within the proteinous environ-ment. To account for this observation, we explored the under-lying principle of REE. The occurrence of excitation-wavelengthdependence is connected to the presence of an ensemble ofmolecules in the ground state differing in their solvation sitesdue to the inherent heterogeneity of the environment andhence, energies. However, this condition alone does not ensure
Fig. 5 Representative time-resolved fluorescence decay profiles (lex =375 nm, lmonitored = lmax (em)) of the drug (9-MA) in the presence ofincreasing protein (BSA) concentrations, as indicated in the figure legend.The sharp black profile on the extreme left represents the instrumentresponse function (IRF). Curves i - vi correspond to [BSA] = 0, 10, 20, 30,40, 50 mM.
Table 1 Time-resolved fluorescence decay parameters of 9-MA withincreasing concentrations of BSA
[BSA] in (mM) a1 (%) a2 (%) t1 (ps) t2 (ns) htfi (ns) w2
0 99.35 0.66 310 3.14 0.51 0.9810 98.46 1.54 327 9.58 3.23 1.1120 97.36 2.64 342 10.73 5.11 1.0930 96.22 3.78 347 11.27 6.47 1.1340 95.09 4.91 351 11.56 7.41 1.1250 93.62 6.41 370 11.61 8.03 1.15100 92.36 7.63 375 11.63 8.47 1.16
Table 2 Fluorescence quantum yield (Ff) and kinetic fluorometric para-meters for 9-MA with increasing concentrations of BSA
[BSA] in(mM)
htfi(ns)
Quantum yield(Ff)
kr (s�1) �10�7
knr (s�1) �10�7
0 0.51 0.010 1.961 194.11810 3.23 0.025 0.774 30.18620 5.11 0.038 0.743 18.82630 6.47 0.051 0.788 14.66840 7.41 0.066 0.891 12.60550 8.03 0.082 1.021 11.432100 8.47 0.102 1.204 10.602
PCCP Paper
Publ
ishe
d on
10
Febr
uary
201
4. D
ownl
oade
d by
Cal
cutta
Uni
vers
ity o
n 09
/04/
2014
16:
09:4
5.
View Article Online

8472 | Phys. Chem. Chem. Phys., 2014, 16, 8465--8475 This journal is© the Owner Societies 2014
the occurrence of REE because of rapid relaxation (in the formof rapid solvation of the fluorescent state or energy transferbetween energetically different excited states or conformers) ofthe excited state. Thus, apart from the condition of selectiveexcitation of energetically different species, REE is also subjectto slow (and hence incomplete) relaxation of the excited state.Precisely, the operation of REE is subject to the followingconditions: (a) the molecule should be polar with a dipolemoment higher in the excited state than that in the groundstate (which is satisfied for 9-MA) and (b) the solvent moleculesaround the fluorophore must be polar and the solventreorientation time (htsolventi) should be slower or comparableto the fluorescence life-time (htfi) of the fluorophore so thatunrelaxed fluorescence can give rise to excitation-wavelength-dependent-emission behaviour.4,14,35–37 Therefore, in the pre-sent case, we can conclude that the average fluorescence lifetimeof the probe 9-MA in the BSA environment (B8 ns in 50 mM BSA)is appreciably slower than the reorientation time of the watermolecules attached to the protein. Thus, solvent relaxation isessentially complete within the excited state lifetime of theprobe, denying any opportunity for emission from an unrelaxedstate, which suggests that the binding of the probe to BSA offersno considerable restriction to the rotation of solvent dipolesaround the excited fluorophore.
To obtain further insight into the microenvironment aroundthe probe, a time-resolved fluorescence anisotropy decay studyof 9-MA in the aqueous buffer and in the protein environmenthas been performed. The time-dependent decay of fluorescenceanisotropy is a sensitive tool for gathering information aboutthe rotational motion and rotational relaxation of the fluoro-phore embedded within an organized assembly.4,14,38,39 Thetypical anisotropy decay profiles of the drug in the aqueousbuffer as well as in the protein environment are presented inFig. 6. The fluorophore is seen to exhibit single exponentialanisotropy decay (with a reorientation time of B100 ps) inthe aqueous buffer. Interestingly, the probe is found to demon-strate an unusual ‘‘dip-and-rise’’ pattern in the protein environ-ment, with the prominence of the aforesaid pattern beingprogressively exposed with increasing protein concentration.Such a dip-and-rise type of profile is a signature for the concurrenceof at least two populations, one with a short fluorescence lifetimeand a short rotational correlation time and another with boththe time constants longer compared to those of the firstpopulation.31,40,41 This sort of anisotropy decay behavior hasbeen described as associated anisotropy by Lakowicz27 and hasbeen previously observed for a few fluorophores in confinedenvironments in which the faster motion is attributed to thesolvent exposed groups/moieties of the fluorophore and theslower motion to the bound counterpart, with the usual trendthat the appearance of the ‘‘dip-and-rise’’ pattern is renderedmore prominent with increasing degree of confinement. Now,as we endeavor to rationalize the origin of the present findings,we find that this kind of slightly unusual time-resolved aniso-tropy decay behavior has been interpreted according to anassociated exponential model proposed by Ludescher et al.,42
in which the fluorescence lifetime and amplitude of the total
intensity decay components are linked specifically with indivi-dual anisotropy parameters as follows:
rðtÞ ¼ rð0ÞXni¼1
fiðtÞ exp�tyi
� �(9)
where,
fiðtÞ ¼ai expð�t=tiÞ
ITðtÞ; (10)
and
ITðtÞ ¼Xni¼1
ai exp �t=tið Þ (11)
in which yi is the ith rotational correlation time, ai and ti are theith fluorescence amplitude and lifetime, respectively, and r(0) isthe initial pre-rotational anisotropy. Several attempts in theliterature have rightly emphasized the time-dependent weight-ing factor, fi(t), in accounting for the dip-and-rise nature of theanisotropy decay profile, and as mentioned earlier, it is arguedthat this type of anisotropy decay profile is best obtained whenthe two lifetime values are significantly different.31,40–42
Now, at this stage it is not unlikely if we consider the origin of thedip-and-rise pattern of the fluorescence anisotropy decay of 9-MA inthe protein environment to be emanating from the contributionsfrom both the free and the protein bound drug molecule. It isobvious that the population of the protein bound form of the probewill be progressively encouraged with increasing BSA concentration,thereby resulting in the prominent appearance of the dip-and-risepattern in the anisotropy decay profiles (Fig. 6). Clearly, interplay
Fig. 6 Fluorescence depolarization profile of the drug 9-MA in thepresence of varying BSA concentrations, e.g., [BSA] = 0.0 mM (a), 15.0 mM(b) and 30.0 mM (c).
Paper PCCP
Publ
ishe
d on
10
Febr
uary
201
4. D
ownl
oade
d by
Cal
cutta
Uni
vers
ity o
n 09
/04/
2014
16:
09:4
5.
View Article Online

This journal is© the Owner Societies 2014 Phys. Chem. Chem. Phys., 2014, 16, 8465--8475 | 8473
between different intramolecular and intermolecular motions isbeing invoked here to account for the observed anisotropy decayprofile. Therefore, modulations of these motions upon interactionwith the proteinous assembly should naturally contribute in govern-ing the overall motional dynamics of the probe within the hydro-phobic environments.40–42 However, with a view to the enhancementof the average fluorescence lifetime of 9-MA upon binding to theprotein and the possibility of the coupling of the motions of theprobe with the global tumbling motion of the BSA units, the internalmotions of the probe can not be considered as the sole criterion forgenerating the dip-and-rise anisotropy profile.
In general, with an increasing degree of confinement, thevalue of the initial anisotropy is found to increase (up to thelimiting value of 0.4, the so-called limiting anisotropy).However, in the present case, as evident from the lifetime data,only B10% molecules bind to the protein and the rest remainunbound. Thus, the effect of confinement is scarcely observedon the initial anisotropy value and it is found to remain almostconstant with increasing protein concentration.
Modeling of the drug binding site in BSA: blind docking study
In order to understand the efficacy of a biologically active moleculeto function as a therapeutic agent, knowledge of its binding locationin the model transport protein is very crucial and important. Herein,the drug (9-MA) binding site in BSA has been explored on the basisof a blind docking simulation performed according to the protocoldescribed in the computational section. The strategy of AutoDock-based blind docking includes a search over the entire surface of theprotein for binding sites (and simultaneously optimizes the con-formations of the peptides43,44), thereby indulging in an unbiasedresult, and hence has rightfully been described as ‘‘very encoura-ging’’ in a recent review44 and has also been receiving enormousattention from various research groups.43–45
The docked pose displayed in Fig. 7 reveals the subdomainIB of the protein to be the favorable binding site for the drug.The principal hydrophobic binding sites in BSA are located indomains II and III, while domain I, characterized by a netnegative charge, generally serves as an appropriate binding sitefor cationic probe molecules. The lowest binding energy
conformer was obtained from 10 different conformers foreach docking simulation and the resultant minimum energyconformation was used for further analysis.
As is usual in a blind docking simulation protocol, we obtained anumber of binding sites and the corresponding binding constantsand free energies. Compelling evidence for the probable-bindinglocation of the drug in subdomain IB of BSA was derived from theobservation that the binding of 9-MA in the IB region was found tobe characterized by a favorable binding energy of �4.24 kcal mol�1
and a very low inhibition constant (319.94 mM). The right panel ofFig. 7 marks the protein residues in the near vicinity (within 4 Å) ofthe probe, which shows the presence of both hydrophobic residues(Val-118, Phe-130, Pro-114 and Ala-122), as well as charged/polarresidues (Met-119 and Lys-133), which evinces the binding pheno-menon to be mainly governed by hydrophobic forces with asignificant contribution from electrostatic interactions. Asymmetriccharge distribution over the molecule because of the presence ofheteroatoms might have been responsible for such type of binding,but at this stage, we cannot totally confirm the origin of the reasonfor such anomalous binding.
Conformation investigation: circular dichroism spectroscopy
Circular dichroism (CD) spectroscopy has long been recognizedas a powerful tool to investigate the secondary structure of avariety of biomolecular systems, including proteins. The far-UVCD spectra of BSA exhibits a typical shape corresponding to ana-helix-rich secondary structure revealing two minima atB208 nm and B222 nm (Fig. 8a), corresponding to thesignature CD signal for the native BSA conformation.4,13,14,26
Fig. 7 Stereo view of the docked conformation of the drug 9-MA withBSA. The site of the interaction of the drug is magnified on the right panelalong with labeling of the protein residues in the near vicinity (within 4.0 Å)of the drug at the interaction site.
Fig. 8 (a) Circular dichroic spectral profile of BSA (5.0 mM) with increasing9-MA concentration. The inset shows the calculated change in % a-helicity(�3%) of the protein with increasing drug concentration. (b) Size distributionprofile of the protein (BSA) in the presence and absence of 9-MA, as obtainedfrom the dynamic light scattering (DLS) measurement. (c) Relative variation inthe esterase activity of BSA with increasing concentration of the drug (9-MA).The represented profile shows the effect of the increasing concentration of thedrug on the release of p-nitrophenol in the reaction between BSA andp-nitrophenyl acetate (PNPA), as monitored by following the absorbance ofliberated p-nitrophenol ([BSA] = 25 mM, [PNPA] = 50 mM, T = 310 K, pH = 7.4).
PCCP Paper
Publ
ishe
d on
10
Febr
uary
201
4. D
ownl
oade
d by
Cal
cutta
Uni
vers
ity o
n 09
/04/
2014
16:
09:4
5.
View Article Online
8474 | Phys. Chem. Chem. Phys., 2014, 16, 8465--8475 This journal is© the Owner Societies 2014
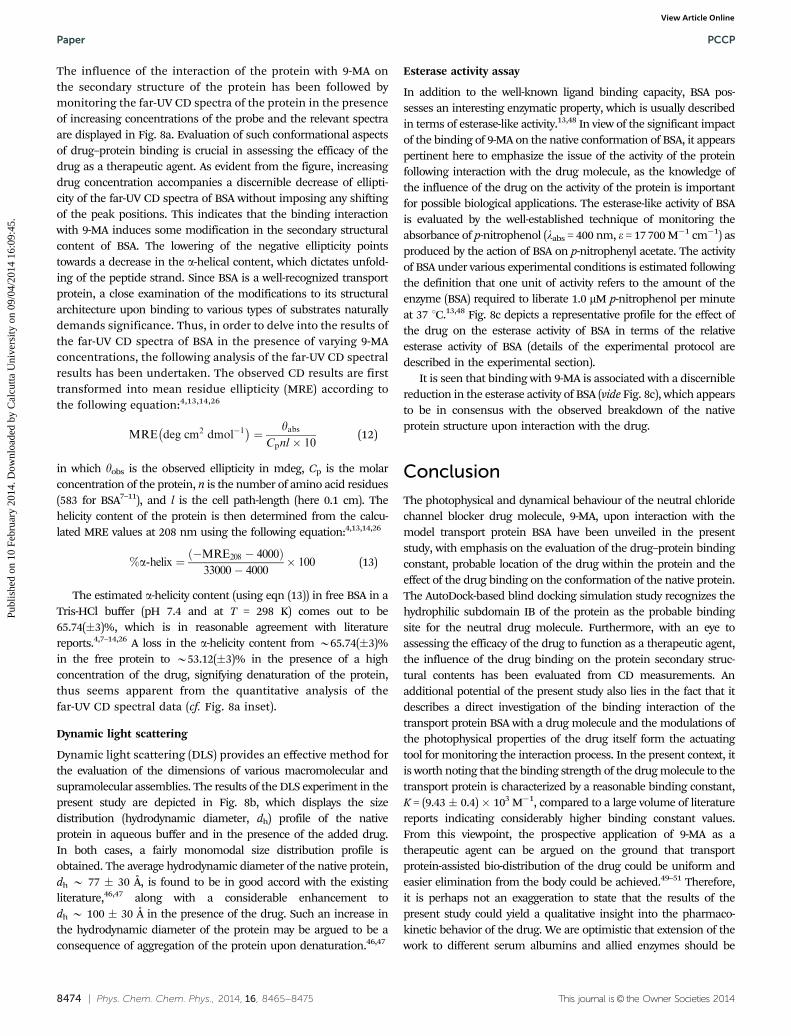
The influence of the interaction of the protein with 9-MA onthe secondary structure of the protein has been followed bymonitoring the far-UV CD spectra of the protein in the presenceof increasing concentrations of the probe and the relevant spectraare displayed in Fig. 8a. Evaluation of such conformational aspectsof drug–protein binding is crucial in assessing the efficacy of thedrug as a therapeutic agent. As evident from the figure, increasingdrug concentration accompanies a discernible decrease of ellipti-city of the far-UV CD spectra of BSA without imposing any shiftingof the peak positions. This indicates that the binding interactionwith 9-MA induces some modification in the secondary structuralcontent of BSA. The lowering of the negative ellipticity pointstowards a decrease in the a-helical content, which dictates unfold-ing of the peptide strand. Since BSA is a well-recognized transportprotein, a close examination of the modifications to its structuralarchitecture upon binding to various types of substrates naturallydemands significance. Thus, in order to delve into the results ofthe far-UV CD spectra of BSA in the presence of varying 9-MAconcentrations, the following analysis of the far-UV CD spectralresults has been undertaken. The observed CD results are firsttransformed into mean residue ellipticity (MRE) according tothe following equation:4,13,14,26
MRE deg cm2 dmol�1� �
¼ yabsCpnl � 10
(12)
in which yobs is the observed ellipticity in mdeg, Cp is the molarconcentration of the protein, n is the number of amino acid residues(583 for BSA7–11), and l is the cell path-length (here 0.1 cm). Thehelicity content of the protein is then determined from the calcu-lated MRE values at 208 nm using the following equation:4,13,14,26
%a-helix ¼ �MRE208 � 4000ð Þ33000� 4000
� 100 (13)
The estimated a-helicity content (using eqn (13)) in free BSA in aTris-HCl buffer (pH 7.4 and at T = 298 K) comes out to be65.74(�3)%, which is in reasonable agreement with literaturereports.4,7–14,26 A loss in the a-helicity content from B65.74(�3)%in the free protein to B53.12(�3)% in the presence of a highconcentration of the drug, signifying denaturation of the protein,thus seems apparent from the quantitative analysis of thefar-UV CD spectral data (cf. Fig. 8a inset).
Dynamic light scattering
Dynamic light scattering (DLS) provides an effective method forthe evaluation of the dimensions of various macromolecular andsupramolecular assemblies. The results of the DLS experiment in thepresent study are depicted in Fig. 8b, which displays the sizedistribution (hydrodynamic diameter, dh) profile of the nativeprotein in aqueous buffer and in the presence of the added drug.In both cases, a fairly monomodal size distribution profile isobtained. The average hydrodynamic diameter of the native protein,dh B 77 � 30 Å, is found to be in good accord with the existingliterature,46,47 along with a considerable enhancement todh B 100 � 30 Å in the presence of the drug. Such an increase inthe hydrodynamic diameter of the protein may be argued to be aconsequence of aggregation of the protein upon denaturation.46,47
Esterase activity assay
In addition to the well-known ligand binding capacity, BSA pos-sesses an interesting enzymatic property, which is usually describedin terms of esterase-like activity.13,48 In view of the significant impactof the binding of 9-MA on the native conformation of BSA, it appearspertinent here to emphasize the issue of the activity of the proteinfollowing interaction with the drug molecule, as the knowledge ofthe influence of the drug on the activity of the protein is importantfor possible biological applications. The esterase-like activity of BSAis evaluated by the well-established technique of monitoring theabsorbance of p-nitrophenol (labs = 400 nm, e = 17 700 M�1 cm�1) asproduced by the action of BSA on p-nitrophenyl acetate. The activityof BSA under various experimental conditions is estimated followingthe definition that one unit of activity refers to the amount of theenzyme (BSA) required to liberate 1.0 mM p-nitrophenol per minuteat 37 1C.13,48 Fig. 8c depicts a representative profile for the effect ofthe drug on the esterase activity of BSA in terms of the relativeesterase activity of BSA (details of the experimental protocol aredescribed in the experimental section).
It is seen that binding with 9-MA is associated with a discerniblereduction in the esterase activity of BSA (vide Fig. 8c), which appearsto be in consensus with the observed breakdown of the nativeprotein structure upon interaction with the drug.
Conclusion
The photophysical and dynamical behaviour of the neutral chloridechannel blocker drug molecule, 9-MA, upon interaction with themodel transport protein BSA have been unveiled in the presentstudy, with emphasis on the evaluation of the drug–protein bindingconstant, probable location of the drug within the protein and theeffect of the drug binding on the conformation of the native protein.The AutoDock-based blind docking simulation study recognizes thehydrophilic subdomain IB of the protein as the probable bindingsite for the neutral drug molecule. Furthermore, with an eye toassessing the efficacy of the drug to function as a therapeutic agent,the influence of the drug binding on the protein secondary struc-tural contents has been evaluated from CD measurements. Anadditional potential of the present study also lies in the fact that itdescribes a direct investigation of the binding interaction of thetransport protein BSA with a drug molecule and the modulations ofthe photophysical properties of the drug itself form the actuatingtool for monitoring the interaction process. In the present context, itis worth noting that the binding strength of the drug molecule to thetransport protein is characterized by a reasonable binding constant,K = (9.43� 0.4)� 103 M�1, compared to a large volume of literaturereports indicating considerably higher binding constant values.From this viewpoint, the prospective application of 9-MA as atherapeutic agent can be argued on the ground that transportprotein-assisted bio-distribution of the drug could be uniform andeasier elimination from the body could be achieved.49–51 Therefore,it is perhaps not an exaggeration to state that the results of thepresent study could yield a qualitative insight into the pharmaco-kinetic behavior of the drug. We are optimistic that extension of thework to different serum albumins and allied enzymes should be
Paper PCCP
Publ
ishe
d on
10
Febr
uary
201
4. D
ownl
oade
d by
Cal
cutta
Uni
vers
ity o
n 09
/04/
2014
16:
09:4
5.
View Article Online
This journal is© the Owner Societies 2014 Phys. Chem. Chem. Phys., 2014, 16, 8465--8475 | 8475
important from the point of understanding the biological applica-tions of the aforesaid drug.
Acknowledgements
AG and SG gratefully acknowledge Junior Research Fellowshipsrespectively from CSIR and UGC, New Delhi, Govt. of India. NGwould like to acknowledge UPE and CRNN, CU and DST, Indiafor financial assistance. We acknowledge the instrumental facilitiesof the Indian Association for the Cultivation of Science, India, forproviding access to CD measurements.
References
1 K. Bhattacharyya, Acc. Chem. Res., 2003, 36, 95–101.2 D. P. Zhong, S. K. Pal, C. Wang and A. H. Zewail, Proc. Natl.
Acad. Sci. U. S. A., 2001, 98, 11873–11878.3 A. Douhal, Acc. Chem. Res., 2004, 37, 349–355.4 B. K. Paul, A. Samanta and N. Guchhait, J. Phys. Chem. B,
2010, 114, 6183–6196.5 J. Hodgson, Nat. Biotechnol., 2001, 19, 722–726.6 B. K. Paul, D. Ray and N. Guchhait, Phys. Chem. Chem. Phys.,
2012, 14, 8892–8902.7 T. Peters, All About Albumin: Biochemistry, Genetics and
Medical Applications, Academic Press, SanDiego, 1995.8 X. He and D. C. Carter, Nature, 1992, 358, 209–215.9 U. Anand and S. Mukherjee, Biochim. Biophys. Acta, Gen.
Subj., 2013, 1830, 5394–5404.10 M. J. Berg, J. L. Tymoczko and L. Stryer, in Biochemistry, ed.
T. M. Devlin and W. H. Freeman, Company, New York, 5thedn, 2002.
11 R. Chowdhury, S. Chattoraj, S. S. Mojumdar and K.Bhattacharyya, Phys. Chem. Chem. Phys., 2013, 15, 16286–16293.
12 F. Zsila, Mol. Pharmaceutics, 2013, 10, 1668–1682.13 B. K. Paul, D. Ray and N. Guchhait, Phys. Chem. Chem. Phys.,
2013, 15, 1275–1287.14 B. K. Paul and N. Guchhait, J. Phys. Chem. B, 2011, 115,
10322–10334.15 A. Ganguly, S. Jana, S. Ghosh, S. Dalapati and N. Guchhait,
Spectrochim. Acta, Part A, 2013, 112, 237–244.16 K. A. Majorek, P. J. Porebski, A. Dayal, M. D. Zimmerman,
K. Jablonska, A. J. Stewart, M. Chruszcz and W. Minor, Mol.Immunol., 2012, 52, 172–182.
17 M. J. Frisch, et al. Gaussian 03, Revision B.03, Gaussian,Inc., Pittsburgh, PA, 2003.
18 G. M. Morris, D. S. Goodsell, R. S. Halliday, R. Huey,W. E. Hart, R. K. Belew and A. J. Olson, J. Comput. Chem.,1998, 19, 1639–1662.
19 W. L. De Lano, The PyMOL Molecular Graphics System, DeLano Scientific, San Carlos, CA, USA, 2002.
20 A. Mallick, B. Haldar and N. Chattopadhyay, J. Phys. Chem.B, 2005, 109, 14683–14690.
21 C. Martin, M. Gil, B. Cohen and A. Douhal, Langmuir, 2012,28, 6746–6759.
22 H. A. Benesi and J. H. Hildebrand, J. Am. Chem. Soc., 1949,71, 2703–2707.
23 A. Ganguly, B. K. Paul, S. Ghosh, S. Kar and N. Guchhait,Analyst, 2013, 138, 6532–6541.
24 C. Reichardt, Chem. Rev., 1994, 94, 2319–2358.25 A. K. Singh and A. Asefa, Luminescence, 2009, 24, 123–130.26 S. Mahanta, R. B. Singh, A. Bagchi, D. Nath and
N. Guchhait, J. Lumin., 2010, 130, 917–926.27 J. R. Lakowicz, Principles of Fluorescence Spectroscopy,
Plenum, New York, 1999.28 R. Wetzel, M. Becker, J. Behlke, H. Billwitz, S. Bohm,
B. Ebert, H. Hamann, J. Krumbiegel and G. Lasmann, Eur.J. Biochem., 1980, 104, 469–478.
29 C. M. Ingersoll and C. M. Strollo, J. Chem. Educ., 2007, 84,1313–1315.
30 R. Breslow and T. Guo, Proc. Natl. Acad. Sci. U. S. A., 1990,87, 167–169.
31 B. Bhattacharya, S. Nakka, L. Guruprasad and A. Samanta,J. Phys. Chem. B, 2009, 113, 2143–2150.
32 F. S. Ariola, D. J. Mudaliar, R. P. Walvick and A. A. Heikal,Phys. Chem. Chem. Phys., 2006, 8, 4517–4529.
33 S. J. Strickler and R. A. Berg, J. Chem. Phys., 1962, 37, 814–822.34 C. L. A. Schmidt, J. Biol. Chem., 1915, 23, 487–493.35 A. P. Demchenko, Luminescence, 2002, 17, 19–42.36 A. Samanta, J. Phys. Chem. B, 2006, 110, 13704–13716 and
references therein.37 Reviews in Fluorescence, ed. C. D. Geddes and J. R. Lakowicz,
Kluwer-Plenum, New York, 2004.38 I. X. Garcia-Zubiri, H. D. Burrows, J. S. S. de Melo, J. Pina,
M. Monteserin and M. J. Tapia, Photochem. Photobiol., 2007,83, 1455–1464.
39 A. Chakraborty, D. Seth, P. Setua and N. Sarkar, J. Chem.Phys., 2008, 128, 204510–204519.
40 A. Jha, J. B. Udgaonkar and G. Krishnamoorthy, J. Mol. Biol.,2009, 393, 735–752.
41 D. Banerjee, S. K. Srivastava and S. K. Pal, J. Phys. Chem. B,2008, 112, 1828–1833.
42 R. D. Ludescher, L. Peting, S. Hudson and B. Hudson,Biophys. Chem., 1987, 28, 59–75.
43 M. Chiku, J. Nakamura, A. Fujishima and Y. Einaga, Anal.Chem., 2008, 80, 5783–5787.
44 S. J. Campbell, N. D. Gold, R. M. Jackson andD. R. Westhead, Curr. Opin. Struct. Biol., 2003, 13, 389–395.
45 S. Monti, I. Manet, F. Manoli and G. Marconi, Phys. Chem.Chem. Phys., 2008, 10, 6597–6606.
46 J. K. A. Kamal and D. V. Behere, JBIC, J. Biol. Inorg. Chem.,2002, 7, 273–283.
47 A. Gayen, C. Chatterjee and C. Mukhopadhyay, Biomacro-molecules, 2008, 9, 974–983.
48 J. Cordova, J. D. Ryan, B. B. Boonyaratanakornkit andD. S. Clark, Enzyme Microb. Technol., 2008, 42(3), 278–283.
49 G. Ascoli, C. Bertucci and P. Salvadoris, J. Pharm. Sci., 1995,84, 737–741.
50 Y. Sugiyama, Adv. Drug Delivery Rev., 1996, 19, 333–334.51 H. Mao, P. J. Hajduk, R. Craig, R. Bell, T. Borre and
S. W. Fesik, J. Am. Chem. Soc., 2001, 123, 10429–10435.
PCCP Paper
Publ
ishe
d on
10
Febr
uary
201
4. D
ownl
oade
d by
Cal
cutta
Uni
vers
ity o
n 09
/04/
2014
16:
09:4
5.
View Article Online