СУЧАСНИЙ СТАН КОЛЕКЦІЇ ROSACEAE JUSS. НАЦІОНАЛЬНОГО БОТАНІЧНОГО САДУ ІМ. М.М. ГРИШКА НАН УКРАЇНИ
Upload
independentCategory
view
2download
0
Plant, Cell and Environment
(2005)
28
, 800–812
800
© 2005 Blackwell Publishing Ltd
Blackwell Science, LtdOxford, UKPCEPlant, Cell and Environment0016-8025Blackwell Science Ltd 2005? 2005
28?800812Original Article
Safety versus efficiency trade-off in xylem transportJ. K. Wheeler
et al.
Correspondence. John S. Sperry. Fax:
+
1 801 581 4668; e-mail:[email protected]
Inter-vessel pitting and cavitation in woody Rosaceae and other vesselled plants: a basis for a safety versus efficiency trade-off in xylem transport
JAMES K. WHEELER, JOHN S. SPERRY, UWE G. HACKE & NGUYEN HOANG
Department of Biology, University of Utah, Salt Lake City UT 84112, USA
ABSTRACT
The hypothesis that greater safety from cavitation by air-seeding through inter-vessel pits comes at the cost of lessporous pit membranes with greater flow resistance wastested . Sixteen vessel-bearing species were compared: 11from the Rosaceae, four from other angiosperm families,and one fern. Unexpectedly, there was no relationshipbetween pit resistance (and hence the prevailing membraneporosity) and cavitation pressure. There was, however, aninverse relationship between pit area per vessel and vulner-ability to cavitation (
r
2
====
0.75). This suggests that cavitationis caused by the rare largest membrane pore per vessel, theaverage size of which increases with total pit area per vessel.If safety from cavitation constrains pit membrane surfacearea, it also limits vessel surface area and the minimumvessel resistivity. This trade-off was consistent with anapproximately three-fold increase in vessel resistivity withcavitation pressure dropping from ----
0.8 to ----
6.6 MPa. Thetrade-off was compensated for by a reduction in the per-centage of vessel wall pitted: from 10–16% in vulnerablespecies to 2–4% in resistant species. Across species, end-wall pitting accounted for 53 ±±±±
3% of the total xylem resis-tivity. This corresponded to vessels achieving on average94 ±±±±
2% of their maximum possible conductivity if vesselsurface area is constrained.
Key-words
: air-seeding; cavitation resistance; pit resistance;vessel length; water transport; xylem flow resistance; xylemstructure and function.
INTRODUCTION
‘Safe’ xylem transport means sufficient protection againstconduit blockage, primarily from cavitation and embolism.‘Efficient’ transport means low flow resistance for a giveninvestment in vascular tissue. It has long been thought thatthere is a structural trade-off between these two traits: thatefficient xylem comes at the cost of being vulnerable tofailure (Zimmermann 1983; Tyree, Davis & Cochard 1994;
Martinez-Vilalta
et al
. 2002). Two observations suggest thetrade-off. For one, there is a tendency for plants that expe-rience more cavitation-inducing stress to possess more cav-itation-resistant xylem, and vice-versa (Davis
et al
. 1999;Hacke, Sperry & Pittermann 2000; Pockman & Sperry2000). Minimum safety margins from cavitation are simi-larly small across the spectrum (Sperry 1995). If cavitationresistance came at no cost to the plant, safety marginswould seemingly be huge and cavitation rare. Second, thereis a tendency for the hydraulic resistivity of xylem on across-sectional area basis (pressure gradient divided by fluxdensity) to increase with increasing cavitation resistance.This is mirrored by a trend of narrower xylem conduits insafer xylem (Martinez-Vilalta
et al
. 2002). ‘Trend’ is theappropriate term because the relationship is noisy and mayor may not be statistically significant depending on thespecies sampled (Tyree
et al
. 1994; Hacke & Sperry 2001).What could be the cause of a trade-off? The answer is
simple for resistance to freezing-induced cavitation. Widerconduits, whether tracheids or vessels, appear to be morevulnerable to freezing-induced cavitation than narrowerones (Ewers 1985; Pittermann & Sperry 2003). This is con-sistent with wider conduits containing more air in solutionper length of conduit, and hence forming larger air bubblesduring ice formation. Larger air bubbles nucleate cavitationat less negative pressures during thaw. Narrower conduitsare thus safer from freezing-induced cavitation, but alsoless efficient in transporting water per cross-sectional area.
This paper concerns the more complex question of anefficiency trade-off with safety from water-stress inducedcavitation. There is considerable evidence that the cause ofcavitation by negative pressure is the failure of the pit‘valves’ between conduits (Crombie, Hipkins & Milburn1985; Cochard, Cruiziat & Tyree 1992; Salleo
et al
. 1996;Sperry
et al
. 1996). These pits prevent air in already dam-aged conduits from entering functional ones and ‘air-seeding’ cavitation. Accordingly, any trade-off betweensafety and efficiency should depend on the functioning ofthese valves.
Based on a modelling study of the valve action of pits weproposed that an air-tight pit comes at the cost of high flowresistance through the pit (Sperry & Hacke 2004). For auniformly porous (‘homogenous’) pit membrane typical of
Safety versus efficiency trade-off in xylem transport
801
© 2005 Blackwell Publishing Ltd,
Plant, Cell and Environment,
28,
800–812
angiosperms and many seedless vascular plants (as opposedto the torus-margo organization of many conifer pits), theair-seeding pressure (
P
) through pre-existing pores can bepredicted by the capillary equation:
P
=
-
4
T
/
d
, where
T
isthe surface tension of water and
d
is the diameter of thelargest membrane pore in the conduit. Greater safety fromair-seeding requires a smaller maximum pore diameter perconduit. If the average porosity of the membrane is corre-lated with the maximum pore diameter, the flow resistancethrough the membrane should increase with increasing air-seeding protection, because flow resistance through poresin a thin membrane is inversely proportional to the porediameter raised to the third power (equation 15 in Sperry& Hacke 2004).
Here we test this hypothesis by estimating the flow resis-tance through pits of species with widely varying resistanceto cavitation by water stress. We limited our study to inter-vessel pits with homogenous pit membranes and to pitswithout vestures, recognizing that vestures, torus-margomembranes, or other modifications may represent qualita-tively different solutions to a trade-off. We sampled inten-sively within a single family (Rosaceae) to minimizequalitative differences that might occur even within thehomogenous type of pit membrane between diverse clades.For broader representation we also sampled a smaller num-ber of disparate angiosperm families as well as a vessel-bearing fern. Many of the necessary measurements hadalready been made on these species from a related study(Sperry, Hacke & Wheeler, 2005), making it natural toinclude them.
A trade-off at the pit level does not necessarily translateto a trade-off at the whole conduit or xylem level. If the
diameter and length of a vessel is uncoupled from the air-seeding properties of its pits, safe xylem does not necessar-ily have to be inefficient. High-resistance pits can be placedin wide and long conduits that render any pit bottlenecknegligible (Sperry & Hacke 2004). However, our recentwork suggests that this does not happen. Across verydiverse xylem types we found that approximately 50% ofthe xylem flow resistivity is attributable to interconduit pits(Sperry
et al
. 2005). For an unknown reason, vessels are notlong enough to compensate for their end wall resistance. Alarge end wall resistivity is consistent with a linkagebetween air-seeding pressure and conduit size, an issue weconsider in detail in this investigation.
MATERIALS AND METHODS
Plant material
Eleven species of native Rosaceae of diverse habitat andgrowth form (Table 1) were collected from a variety oflocales in the Wasatch Mountains near Salt Lake City,Utah. Each species was collected from a single limited pop-ulation to minimize variation. Stems were cut, wrapped inplastic bags, and brought to the laboratory. Five other spe-cies from the related study (Table 1) included native andcultivated species of diverse families that were collectedlocally as described elsewhere (Sperry
et al
. 2005).
Vulnerability curves
The centrifuge method was used for measuring vulnerabil-ity to water-stress induced cavitation. Stems 14.2 cm long
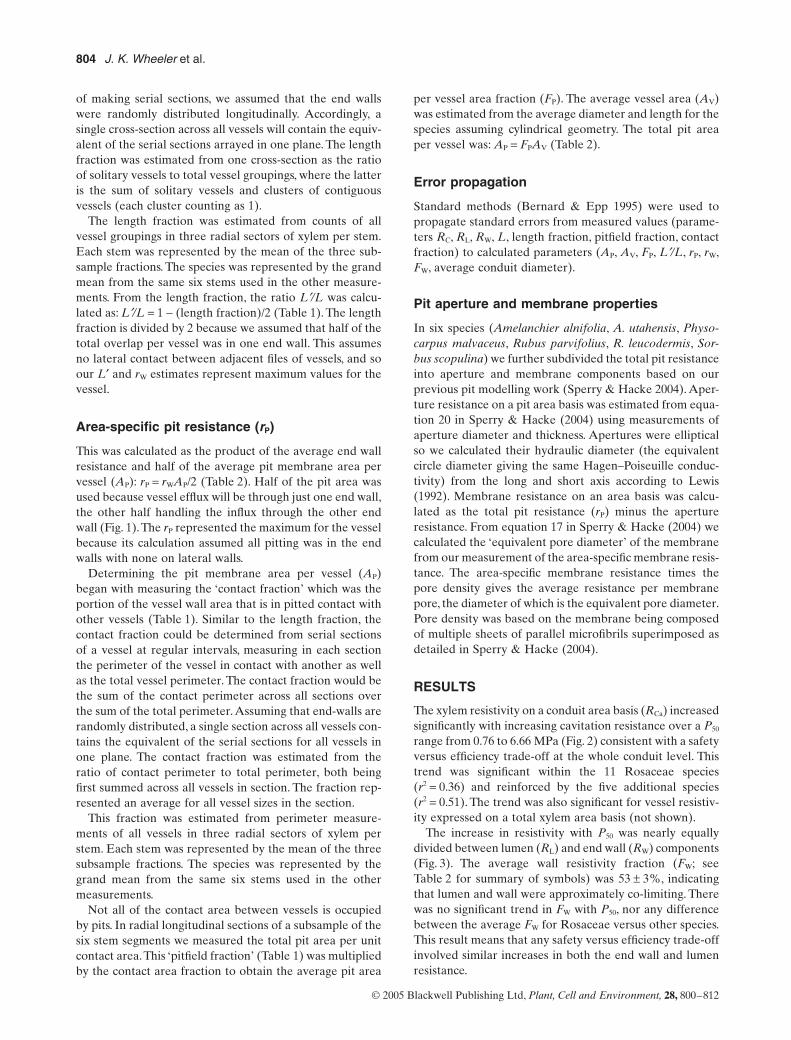
Table 1.
Study species, their symbols used in figures, and associated measurements not in figures
Species and figure symbolContact fraction
Pitfield fraction
Lengthfraction
L
¢/
Lr
P
(MPa s m
-
1
)
Amelanchier alnifolia
M. Roemer Aa 0.14
±
0.018 0.37
±
0.020 0.41
±
0.11 0.80
±
0.09 626
±
183
A. utahensis
Koehne Au 0.13
±
0.008 0.33
±
0.020 0.40
±
0.05 0.80
±
0.04 112
±
35
Cercocarpus ledifolius
Torr. & Gray Cl 0.05
±
0.008 0.44
±
0.018 0.16
±
0.06 0.92
±
0.14 39
±
14
C. montanus
Raf. Cm 0.06
±
0.002 0.26
±
0.009 0.18
±
0.05 0.91
±
0.10 60
±
12
Holodiscus dumosus
(Hook.) Heller. Hd 0.07
±
0.006 0.44
±
0.063 0.19
±
0.06 0.91
±
0.11 328
±
84
Physocarpus malvaceus
(Greene) Kuntze Pm 0.08
±
0.008 0.50
±
0.036 0.23
±
0.09 0.89
±
0.14 337
±
104
Purshia tridentata
(Pursh) DC. Pt 0.08
±
0.007 0.28
±
0.012 0.21
±
0.04 0.89
±
0.08 84
±
24
Rosa nutkana
C. Presl Rn 0.10
±
0.013 0.46
±
0.025 0.25
±
0.09 0.88
±
0.13 276
±
75
Rubus leucodermis
Torr. & Gray Rl 0.15
±
0.011 0.53
±
0.008 0.37
±
0.06 0.81
±
0.05 285
±
120
R. parviflorus
Nutt. Rp 0.19
±
0.006 0.43
±
0.018 0.42
±
0.05 0.79
±
0.04 78
±
15
Sorbus scopulina
Greene Ss 0.10
±
0.011 0.39
±
0.033 0.30
±
0.13 0.85
±
0.16 205
±
73
Vitis vinifera
L. (Vitaceae) VV 0.14
±
0.015 0.75
±
0.111 0.33
±
0.13 0.83
±
0.13 168
±
63
Sambucus caerulea
Raf. (Adoxaceae) SC 0.25
±
0.024 0.56
±
0.025 0.54
±
0.08 0.73
±
0.05 371
±
92
Acer negundo
L. (Aceraceae) AN 0.15
±
0.011 0.63
±
0.018 0.42
±
0.06 0.79
±
0.06 66
±
15
Salix exigua
Nutt. (Salicaceae) SE 0.22
±
0.006 0.73
±
0.013 0.44
±
0.04 0.78
±
0.05 72
±
19
Pteridium aquilinum
(L) Kuhn (Polypodiaceae) PA 0.35
±
0.013 0.22
±
0.017 1.0
±
0.0 0.5
±
0 31
±
7
The five species from families other than the Rosaceae are listed last. Double capital symbols distinguish these non-Rosaceae species infigures. ‘Contact fraction’ is the portion of the vessel wall area in contact with an adjacent vessel. ‘Pitfield fraction’ is the portion of theinterconduit pitfield occupied by pits. The product of these two fractions gives the ‘pit fraction’ (FP), the total pit area per vessel area.‘Length fraction’ is the fraction of the total vessel length contacting adjacent vessels. The ratio L¢/L (Fig. 1) was calculated from the lengthfraction and average vessel length. Grand means from four to six stems per species ± SE.

802 J. K. Wheeler et al.
© 2005 Blackwell Publishing Ltd, Plant, Cell and Environment, 28, 800–812
and 1–5 years of age were flushed with a filtered (0.2 mm)20 mM KCl at approximately 0.1 MPa to remove nativeembolism. The 20 mM KCl solution was used to controlfor any ion effect on pit membrane conductivity (Ieperen,Meeteren & Gelder 2000; Zwieniecki, Melcher & Hol-brook 2001b). Flushed stems were spun on a custom-builtrotor (Alder et al. 1997) to progressively more negativepressure, with their hydraulic conductivity (flow rate perpressure gradient) being measured between spins to assessthe loss in conductivity from cavitation. A Weibull func-tion (Neufeld et al. 1992) was fitted to the conductivityversus negative pressure relationship for each stem, andthe pressure inducing 50% loss of conductivity calculated.We refer to the absolute value of this pressure as the ‘P50’and use it to represent the safety of the xylem from water-stress-induced cavitation. A minimum of six stems perspecies were used to obtain the average P50 for eachspecies.
The conductivity was measured by fitting the stem totubing filled with the filtered KCl solution. A gravity-induced pressure difference across the stem drove flow intoa reservoir on an electronic balance. Stems generallyabsorbed a small amount of water in the absence of appliedpressure. This negative flow was subtracted from the flowunder pressure to obtain the net pressure-driven flow rate.The net flow rate was divided by the pressure gradient toobtain the conductivity.
Methodology of determining area-specific pit resistance (rP)
We estimated inter-vessel pit resistance using an approachsimilar to Schulte & Gibson’s (1988) study on tracheids (seealso Lancashire & Ennos 2002). The pit resistance wasdetermined from flow measurements through stem seg-ments and the dimensions of the vessels and pits in thesegments. The method assumes the xylem of a stem can berepresented by longitudinal files of overlapping vessels ofaverage size (Fig. 1). Lumen and end-wall are arranged inseries with a unit length of L¢ (Fig. 1), which is shorter thanthe vessel length (L) by one end wall. The average vesselresistivity (RC, pressure gradient divided by volume flowrate) is the sum of the lumen (RL) and end wall (RW) resis-tivity for the average-sized vessel. The end-wall resistivity(like any resistivity) is a length-independent measure thatequals the end wall resistance (rW, pressure divided by vol-ume flow rate) divided by the length L¢ between successiveend walls. Measuring L¢ thus yields the end wall resistance:rW = RWL¢. The end wall resistance itself is a function of theextent of the end wall – more specifically the number andarea of pits it contains. From measurements of the area ofpits in one end wall, the end wall resistance can be con-verted to a pit resistance on an area basis (rP = rW ¥ pitarea). The cavitation pressure of the average vessel corre-sponding to the resistance measurements was assumed tobe near the P50, allowing safety from cavitation to be com-pared with flow resistances. Tables 1 and 2 summarize themajor variables used in the analysis.
Anatomical measurements were made using IMAGE PRO
PLUS (Media Cybernetics Inc., Silver Springs, MD,USA) and IMAGEJ software (free-ware available fromhttp://rsb.info.nih.gov/ij/). An overview of calculations isprovided in the Appendix. The parameters RC, RL, RW, andFW (below) were already available for the non-Rosaceaespecies using an analogous methodology (Sperry et al.2005).
Vessel lengths (L)
Stems were flushed to remove native embolism andinjected with silicone (Rhodorsil RTV-141; Rhodia USA,Cranbury, NJ, USA; imported by Walco Materials, Escon-dido, CA, USA) coloured with red pigment (SilasticLSPRD11; Dow Corning, Kendallville, IN, USA) at0.5 MPa for 1 h before curing in an oven for approximately1 h at 70 ∞C. Earlier work indicated that this silicone doesnot penetrate pit membranes (André 2002) and fills thevessels completely, making them easier to recognize thanthe traditional paint pigment injection (Sperry et al. 2005).The cured stems were cut at several distances from theinjection surface, and the average number of silcone-filledvessels per xylem area was counted. Most vessels wereshort (Zimmermann & Jeje 1981), so we used an exponen-tial scale to concentrate the vessel counts near the injectionsurface
Li = Lmin(Lmin/Lmax)(i-1)/(N-1) (1)
where Li is the ith distance counted starting at i = 1 at Lmin,which was the shortest non-zero distance (0.005 m) andending at i = N for Lmax, which was the longest lengthcounted. The Lmin was constant at 0.005 m, whereas Lmax
was varied according the vessel length of the species.Rather than using the double-difference algorithm (Zim-
mermann 1983) for calculating vessel lengths we extendedthe approach originated by Cohen, Bennick & Tyree(2003). An exponential decay function was fitted to thedecrease in density of silicone-filled vessels (NL) with dis-tance L from the injection surface:
NL = N0 e(-kL) (2)
Figure 1. Vessel geometry assumed for calculation of end wall and pit resistances. Stem xylem of each species was represented by longitudinal files of vessels of average length, diameter, and end-wall overlap. A portion of one of many parallel files is shown. The length L¢ is the length of the longitudinally repeating unit of lumen plus end wall. It is shorter than the total vessel length by one end wall. The end wall resistance (rW) is the end wall resistivity multiplied by L¢. The area-specific pit resistance (rP) is the rW divided by the pit area in one end-wall, which was assumed to be half of the total pit area per vessel. End wall and pit resistances represent maximum values because the calculation does not account for any lateral pitting between parallel files of vessels.
lumen
end-wall end-wall
LL'

Safety versus efficiency trade-off in xylem transport 803
© 2005 Blackwell Publishing Ltd, Plant, Cell and Environment, 28, 800–812
where N0 is the total vessel density and k the best fit extinc-tion coefficient. The fraction of conduits of length L (PL) isgiven by L/N0 times the second derivative of Eqn 2
PL = Lk2 e(-kL) (3)
Integrating the product of PL and L over the length distri-bution (ÚPLL dL from L = 0 to infinity) gives the mean vessellength. As the length distributions were short-skewed, themean of the log-transformed length distribution was usedto represent the average-sized vessel (Fig. 1, L). Each spe-cies was represented by the grand mean of three to sevenstems. Vessel lengths were already available for the five non-Rosaceae species using similar methods (Sperry et al. 2005).(Note: Eqn 3 incorrect in Sperry et al. 2005 as Eqn 2.)
Conduit (RC), lumen (RL), and end wall (RW) resistivities
The RC was measured on stems that were longer than thevast majority of the vessels. Measured stems were 14 cmand longer than 96% of the vessels for all species exceptHolodiscus dumosus. Open vessels in stem segments willcause RC to be under-estimated, but by less than 7% (evenin H. dumosus) assuming the linear relationship between Rand open vessel percentage observed in the related study(Sperry et al. 2005). Stems were flushed to remove nativeembolism and their resistivity measured with the sameapparatus that was used for vulnerability curve measure-ment. The stem was then perfused with basic fuchsin (0.1%w/w) or safranin (0.1% w/w) to mark the functional xylem.The resistivity was multiplied by the stained xylem area toobtain the xylem area-specific resistivity. This was multi-plied by the vessel density of the same stem to obtain theRC of the average vessel. To assess the conducting efficiencyof vessels across species, RC was also expressed on the basisof the cross-sectional area of a lumen of average diameteras calculated in the following paragraph (Rca; Table 2).
The same stem was sectioned and the lumen resistivity(RL) estimated from vessel diameter measurements. Thearea of each vessel lumen in a radial sector of functionalxylem was measured, and the equivalent circle diametercalculated before summing the Hagen–Poiseuille conduc-tivities to obtain the total conductivity per area of the radialsector. Several sectors per stem (2–4) were measured toobtain an average, and the value expressed as the averagexylem area-specific lumen resistivity. This was multiplied bythe vessel density to obtain the RL of the average vessel.Previous work indicated the Hagen–Poiseuille value accu-rately estimates the actual lumen resistivity (Zwieniecki,Melcher & Holbrook 2001a; Sperry et al. 2005). The diam-eter of the average vessel was calculated from the averageRL according to the Hagen–Poiseuille equation.
The average end wall resistivity on a vessel basis (RW)was calculated for each stem as the total resistivity minusthe lumen resistivity (RW = RC - RL). The fraction of thetotal resistivity in the end wall (FW) was FW = RW/RC
(Table 2). Each value (RC, RL, RW, FW) was determined forfive to six stems per species, with the species being repre-sented by the grand mean of each parameter.
End wall resistance (rW)
According to the assumed vessel geometry (Fig. 1),rW = RW L¢. To obtain L¢ we estimated the L¢/L ratio andmultiplied this by the average length L. To get L¢/L wemeasured the ‘length fraction’ (Table 1), which was thelength of a vessel in contact with other vessels relative tothe total vessel length. One way to estimate this lengthfraction would be to serially section a vessel from end-to-end at regular length intervals, and note the fraction of thetotal number of sections that the vessel is not in contactwith another one. This would approximate the fraction ofthe vessel length that was not in contact with adjacent ves-sels. One minus this quantity is the length fraction. Instead
Table 2. List of major variables with definition and units employed
Symbol Definition Units employed
AP surface area of inter-vessel pit membranes mm2
AV total surface area of vessel wall mm2
FP ‘pit fraction’ = AP/AV –FW ‘end wall fraction’ = RW/RC –L vessel length (Fig. 1) mL¢ length between vessel end walls (Fig. 1) mP50 absolute value of xylem pressure causing 50% loss of hydraulic conductivity MPaRC vessel resistivity MPa s mm-4
RL lumen resistivity MPa s mm-4
RW end wall resistivity MPa s mm-4
RCa vessel resistivity on lumen area basis MPa s m-2
rW resistance of one vessel end wall MPa s mm-3
rP resistance of inter-vessel pits on pit area basis MPa s m-1
A ‘resistivity’ (R) is length-independent (pressure gradient per volume flow rate) and may be further standardized by cross-sectional areaof flow as in the RCa term. A ‘resistance’ (r) is length-dependent (pressure difference per volume flow rate) but may be standardized bycross-sectional area of flow as in the rP term.
804 J. K. Wheeler et al.
© 2005 Blackwell Publishing Ltd, Plant, Cell and Environment, 28, 800–812
of making serial sections, we assumed that the end wallswere randomly distributed longitudinally. Accordingly, asingle cross-section across all vessels will contain the equiv-alent of the serial sections arrayed in one plane. The lengthfraction was estimated from one cross-section as the ratioof solitary vessels to total vessel groupings, where the latteris the sum of solitary vessels and clusters of contiguousvessels (each cluster counting as 1).
The length fraction was estimated from counts of allvessel groupings in three radial sectors of xylem per stem.Each stem was represented by the mean of the three sub-sample fractions. The species was represented by the grandmean from the same six stems used in the other measure-ments. From the length fraction, the ratio L¢/L was calcu-lated as: L¢/L = 1 - (length fraction)/2 (Table 1). The lengthfraction is divided by 2 because we assumed that half of thetotal overlap per vessel was in one end wall. This assumesno lateral contact between adjacent files of vessels, and soour L¢ and rW estimates represent maximum values for thevessel.
Area-specific pit resistance (rP)
This was calculated as the product of the average end wallresistance and half of the average pit membrane area pervessel (AP): rP = rWAP/2 (Table 2). Half of the pit area wasused because vessel efflux will be through just one end wall,the other half handling the influx through the other endwall (Fig. 1). The rP represented the maximum for the vesselbecause its calculation assumed all pitting was in the endwalls with none on lateral walls.
Determining the pit membrane area per vessel (AP)began with measuring the ‘contact fraction’ which was theportion of the vessel wall area that is in pitted contact withother vessels (Table 1). Similar to the length fraction, thecontact fraction could be determined from serial sectionsof a vessel at regular intervals, measuring in each sectionthe perimeter of the vessel in contact with another as wellas the total vessel perimeter. The contact fraction would bethe sum of the contact perimeter across all sections overthe sum of the total perimeter. Assuming that end-walls arerandomly distributed, a single section across all vessels con-tains the equivalent of the serial sections for all vessels inone plane. The contact fraction was estimated from theratio of contact perimeter to total perimeter, both beingfirst summed across all vessels in section. The fraction rep-resented an average for all vessel sizes in the section.
This fraction was estimated from perimeter measure-ments of all vessels in three radial sectors of xylem perstem. Each stem was represented by the mean of the threesubsample fractions. The species was represented by thegrand mean from the same six stems used in the othermeasurements.
Not all of the contact area between vessels is occupiedby pits. In radial longitudinal sections of a subsample of thesix stem segments we measured the total pit area per unitcontact area. This ‘pitfield fraction’ (Table 1) was multipliedby the contact area fraction to obtain the average pit area
per vessel area fraction (FP). The average vessel area (AV)was estimated from the average diameter and length for thespecies assuming cylindrical geometry. The total pit areaper vessel was: AP = FPAV (Table 2).
Error propagation
Standard methods (Bernard & Epp 1995) were used topropagate standard errors from measured values (parame-ters RC, RL, RW, L, length fraction, pitfield fraction, contactfraction) to calculated parameters (AP, AV, FP, L¢/L, rP, rW,FW, average conduit diameter).
Pit aperture and membrane properties
In six species (Amelanchier alnifolia, A. utahensis, Physo-carpus malvaceus, Rubus parvifolius, R. leucodermis, Sor-bus scopulina) we further subdivided the total pit resistanceinto aperture and membrane components based on ourprevious pit modelling work (Sperry & Hacke 2004). Aper-ture resistance on a pit area basis was estimated from equa-tion 20 in Sperry & Hacke (2004) using measurements ofaperture diameter and thickness. Apertures were ellipticalso we calculated their hydraulic diameter (the equivalentcircle diameter giving the same Hagen–Poiseuille conduc-tivity) from the long and short axis according to Lewis(1992). Membrane resistance on an area basis was calcu-lated as the total pit resistance (rP) minus the apertureresistance. From equation 17 in Sperry & Hacke (2004) wecalculated the ‘equivalent pore diameter’ of the membranefrom our measurement of the area-specific membrane resis-tance. The area-specific membrane resistance times thepore density gives the average resistance per membranepore, the diameter of which is the equivalent pore diameter.Pore density was based on the membrane being composedof multiple sheets of parallel microfibrils superimposed asdetailed in Sperry & Hacke (2004).
RESULTS
The xylem resistivity on a conduit area basis (RCa) increasedsignificantly with increasing cavitation resistance over a P50
range from 0.76 to 6.66 MPa (Fig. 2) consistent with a safetyversus efficiency trade-off at the whole conduit level. Thistrend was significant within the 11 Rosaceae species(r2 = 0.36) and reinforced by the five additional species(r2 = 0.51). The trend was also significant for vessel resistiv-ity expressed on a total xylem area basis (not shown).
The increase in resistivity with P50 was nearly equallydivided between lumen (RL) and end wall (RW) components(Fig. 3). The average wall resistivity fraction (FW; seeTable 2 for summary of symbols) was 53 ± 3%, indicatingthat lumen and wall were approximately co-limiting. Therewas no significant trend in FW with P50, nor any differencebetween the average FW for Rosaceae versus other species.This result means that any safety versus efficiency trade-offinvolved similar increases in both the end wall and lumenresistance.

Safety versus efficiency trade-off in xylem transport 805
© 2005 Blackwell Publishing Ltd, Plant, Cell and Environment, 28, 800–812
The increase in RL with P50 resulted from a decline inaverage conduit diameter with P50 (Fig. 4a; symbols). Whatcaused the increase in RW with P50? The RW is the wallresistance (rW) divided by the length L¢ (Fig. 1), so itsincrease could result from shorter length and/or higher rW
with P50. There was no significant relationship betweeneither L¢/L (Table 1) or total vessel length (L) and P50
(Fig. 4b; symbols). There was, however, a significantincrease in rW with P50 (Fig. 5).
The increase in rW could result from higher area-specificpit resistance (rP) and/or lower pit area per vessel (AP). Wehad hypothesized that rP should increase with P50 becauseof the less porous pit membranes required to suppress cav-
itation by air-seeding. Although there was considerablevariation in rP, contrary to our expectations, a regressionagainst P50 showed no relationship (see Table 1 for rP val-ues). The rP was also just as variable in the Rosaceae asacross the diversity of other families (Table 1). Instead, theincrease in rW was a result of dramatically less pit area pervessel with increased P50 (Fig. 6; solid regression). Pit sur-face area per vessel (AP) declined in inverse proportion toincreasing P50 both within the 11 Rosaceae (r2 = 0.62) andfor all species combined (r2 = 0.75).
Total vessel surface area (AV) also declined with increas-ing P50, but not as steeply as pit area (Fig. 6; dashed regres-sion). This was because the pit fraction (FP; pit area per
Figure 2. Vessel resistivity on a lumen cross-sectional area basis (RCa) versus P50. The P50 is the absolute value of the negative pressure reducing 50% of the hydraulic conductivity. Greater resistance to cavitation (higher P50) was associated with higher resistivity consistent with a safety versus efficiency trade-off. Mean values from five to six stems per species are shown without error bars for clarity. The average standard error as percentage of the mean was 10% for P50 and 15% for RCa. Symbols refer to species as listed in Table 1.P50 (MPa)
0 1 2 3 4 5 6 7
Ves
sel r
esis
tivity
,RC
a(M
Pa
s m
–2)
0
20
40
60
80
100
120
140
160
180
AuAa
Cl
Cm
Hd
Pt
Ss
Pm
Rp
Rl
Rn
PA
AN
SE
SC
VV r 2= 0.51
Figure 3. Lumen resistivity (RL) versus end wall resistivity (RW). Values are expressed on a vessel basis and the wide range reflects the variation in lumen size across the species. The data was close to the 1 : 1 line indicating that on average both resistivity components contribute equally to their sum, the total vessel resistivity (RC). The average wall fraction (FW = RW/RC) was 0.53 ± 0.03 across all species with no differences between Rosaceae versus others. Means of five to six stems per species are shown without error bars for readability. Average standard error as percentage of mean was 13% for RL and 19% for RW.Lumen resistivity,RL (MPa s mm–4)
0.00 0.05 0.10 0.15 0.20 0.25 0.30
Wal
l res
istiv
ity, R
W (
MP
a s
mm
–4)
0.00
0.05
0.10
0.15
0.20
0.25
0.30
Au
Aa
Cl
Cm
Hd
Pt
Ss
Pm
RpRl
Rn
PAAN
SESC
VV
1:1
r 2 = 0.82
Mean FW = 0.53 (0.03)

806 J. K. Wheeler et al.
© 2005 Blackwell Publishing Ltd, Plant, Cell and Environment, 28, 800–812
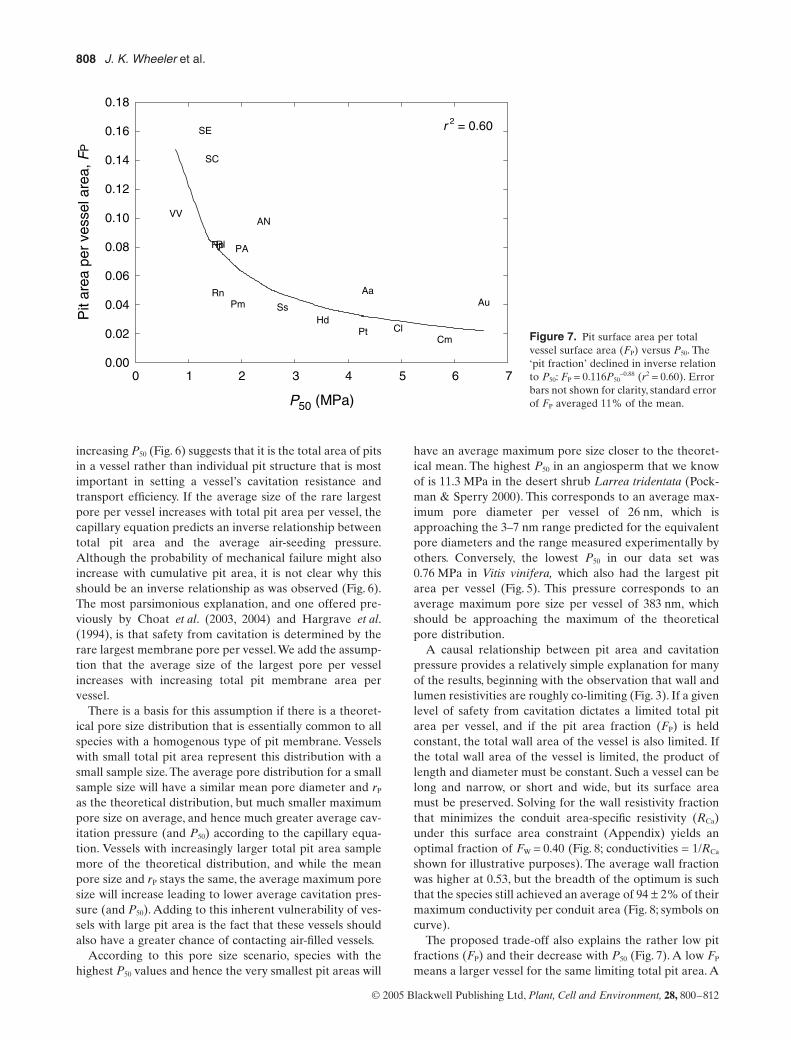
vessel area) decreased significantly with increasing cavita-tion resistance (Fig. 7). All pit fractions were very low, thehighest being 15% declining to less than 2% for the mostcavitation-resistant species. The low pit fractions weremostly a result of limited overlap between vessels (i.e. lowcontact fractions in Table 1) rather than sparse pitting atareas of overlap (i.e. relatively high pitfield fractions inTable 1).
The area-specific pit resistances were much higher thanestimated from our pit model (Sperry & Hacke 2004). Themodel predicted a range from 0.2 to 20 MPa s m-1 (Fig. 9 inSperry & Hacke 2004) whereas measured values averaged167 MPa s m-1 excluding an extreme value for Amelanchieralnifolia (Table 1). Although the rP estimates were the max-
imum in the absence of any lateral pitting and the error inits determination was relatively high because of the numberof calculations required (average standard error was 29% ofthe mean, Table 1), it is unlikely that these factorsaccounted for the order-of-magnitude discrepancy. Aper-ture resistance accounted for 1% or less of the total pit resis-tance in the six species subsampled, indicating the modelwas under-estimating the membrane resistance. Mem-branes were much less porous than the model predicted.Equivalent pore diameters based on the measured mem-brane resistance ranged from 3.5 to 7.6 nm (mean = 5.3 nm).In contrast, the pore diameter expected to air-seed at the P50
values of these species ranged from 44 to 383 nm from thecapillary equation (surface tension =0.073 Pa m).
Figure 4. (a) Average vessel lumen diameter versus P50. Symbols show means of five to six stems per species with the average diameter calculated from the average lumen resistivity (RL). Error bars not shown for clarity, standard error averaged 7% of the mean for diameters. An inverse relationship between diameter and P50 (not shown) was significant (diameter = 44.6 P50 -0.47, r2 = 0.72). Curve is calculated assuming that P50 is controlled by total pit area per vessel according to the relationship in Fig. 6 with other parameters averaged except for the pit fraction (FP) which declines with P50 as seen in Fig. 6 (see Appendix for summary calculations). (b) Average vessel length versus P50. Symbols are log transformed means from three to seven stems per species, error bars not shown for clarity but the standard error averaged 7% of the mean for lengths. A linear relationship with P50 was not significant. Curve is calculated on same basis as in (a).
0 1 2 3 4 5 6 7
Ves
sel d
iam
eter
(mm
)
10
20
30
40
50
60
70
80
AuAaCl
CmHdPt
SsPm
RpRl
Rn
PA
ANSE
SC
VV
(a)
P50 (MPa)
0 1 2 3 4 5 6 7
Ves
sel l
engt
h (m
)
0.00
0.02
0.04
0.06
0.08
0.10
0.12
0.14
Au
Aa
Cl
Cm
Hd
Pt
SsPm
Rp
RlRn
PA ANSE
SC
VV (b)
Safety versus efficiency trade-off in xylem transport 807
© 2005 Blackwell Publishing Ltd, Plant, Cell and Environment, 28, 800–812
DISCUSSION
A proposed basis for a safety versus efficiency trade-off
The results did not support the expected trade-off betweenarea-specific pit resistance and P50. Although our measure-ment of rP was an indirect and maximum estimate withinevitably high error (Table 1), the pit model predicted a10-fold increase over the 6 MPa range in P50 in our studyspecies (Sperry & Hacke 2004) whereas we observed noP50-related variation. Apparently the majority of mem-
brane pores were of similar size in all species and this sizewas not correlated with the largest pore causing air-seedingof cavitation. This was the same conclusion drawn by Choatand others from experimental estimates of membraneporosity (Choat et al. 2003, 2004). Either the air-seeding iscaused by yielding or rupture of the pit membrane, or thelargest pore that causes the air-seeding is relatively rare andnot related to the prevailing porosity that determines mem-brane resistance.
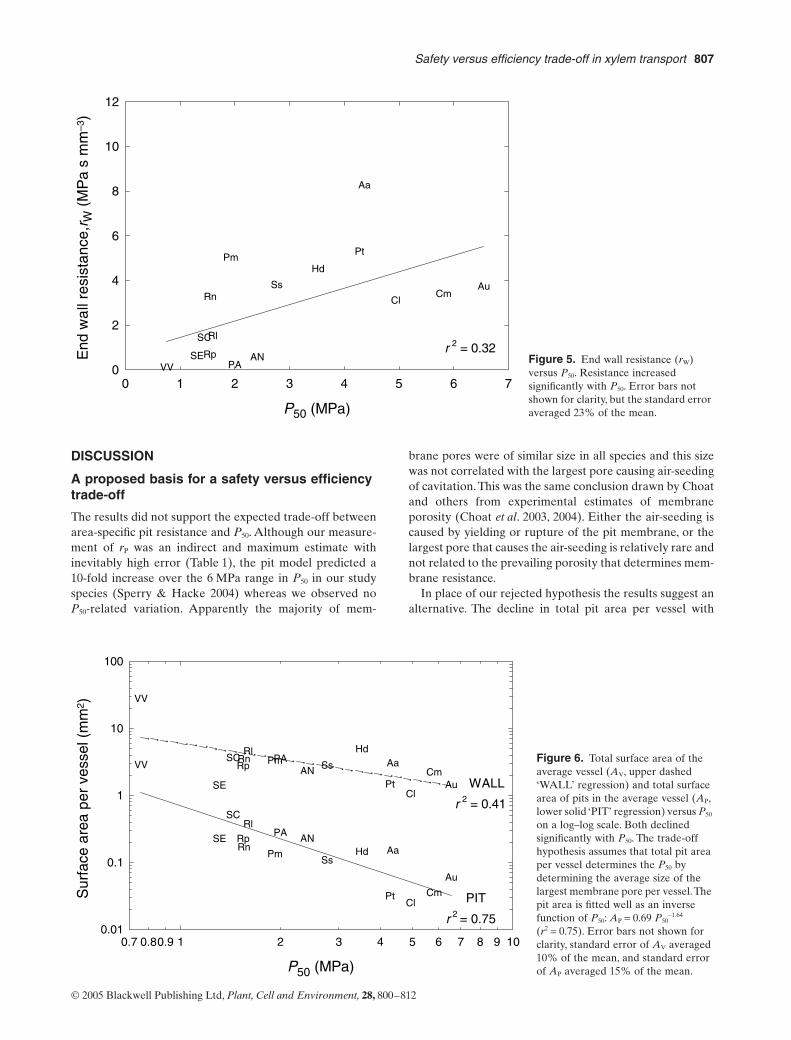
In place of our rejected hypothesis the results suggest analternative. The decline in total pit area per vessel with
Figure 5. End wall resistance (rW) versus P50. Resistance increased significantly with P50. Error bars not shown for clarity, but the standard error averaged 23% of the mean.P50 (MPa)
0 1 2 3 4 5 6 7
End
wal
l res
ista
nce,
r W (
MP
a s
mm
–3)
0
2
4
6
8
10
12
Au
Aa
ClCm
Hd
Pt
Ss
Pm
Rp
Rl
Rn
PAANSE
SC
VV
r 2 = 0.32
Figure 6. Total surface area of the average vessel (AV, upper dashed ‘WALL’ regression) and total surface area of pits in the average vessel (AP, lower solid ‘PIT’ regression) versus P50 on a log–log scale. Both declined significantly with P50. The trade-off hypothesis assumes that total pit area per vessel determines the P50 by determining the average size of the largest membrane pore per vessel. The pit area is fitted well as an inverse function of P50: AP = 0.69 P50
-1.64 (r2 = 0.75). Error bars not shown for clarity, standard error of AV averaged 10% of the mean, and standard error of AP averaged 15% of the mean.P50 (MPa)
0.7 0.80.9 2 3 4 5 6 7 8 91 10
Sur
face
are
a pe
r ve
ssel
(m
m2 )
0.01
0.1
1
10
100
Au
Aa
ClCm
Hd
Pt
SsPm
Rp
Rl
RnPA
ANSE
SC
VV
Au
Aa
Cl
Cm
Hd
Pt
SsPmRp
RlRn PA
ANSE
SC
VV
WALL
PIT
r 2 = 0.75
r 2 = 0.41
808 J. K. Wheeler et al.
© 2005 Blackwell Publishing Ltd, Plant, Cell and Environment, 28, 800–812
increasing P50 (Fig. 6) suggests that it is the total area of pitsin a vessel rather than individual pit structure that is mostimportant in setting a vessel’s cavitation resistance andtransport efficiency. If the average size of the rare largestpore per vessel increases with total pit area per vessel, thecapillary equation predicts an inverse relationship betweentotal pit area and the average air-seeding pressure.Although the probability of mechanical failure might alsoincrease with cumulative pit area, it is not clear why thisshould be an inverse relationship as was observed (Fig. 6).The most parsimonious explanation, and one offered pre-viously by Choat et al. (2003, 2004) and Hargrave et al.(1994), is that safety from cavitation is determined by therare largest membrane pore per vessel. We add the assump-tion that the average size of the largest pore per vesselincreases with increasing total pit membrane area pervessel.
There is a basis for this assumption if there is a theoret-ical pore size distribution that is essentially common to allspecies with a homogenous type of pit membrane. Vesselswith small total pit area represent this distribution with asmall sample size. The average pore distribution for a smallsample size will have a similar mean pore diameter and rP
as the theoretical distribution, but much smaller maximumpore size on average, and hence much greater average cav-itation pressure (and P50) according to the capillary equa-tion. Vessels with increasingly larger total pit area samplemore of the theoretical distribution, and while the meanpore size and rP stays the same, the average maximum poresize will increase leading to lower average cavitation pres-sure (and P50). Adding to this inherent vulnerability of ves-sels with large pit area is the fact that these vessels shouldalso have a greater chance of contacting air-filled vessels.
According to this pore size scenario, species with thehighest P50 values and hence the very smallest pit areas will
have an average maximum pore size closer to the theoret-ical mean. The highest P50 in an angiosperm that we knowof is 11.3 MPa in the desert shrub Larrea tridentata (Pock-man & Sperry 2000). This corresponds to an average max-imum pore diameter per vessel of 26 nm, which isapproaching the 3–7 nm range predicted for the equivalentpore diameters and the range measured experimentally byothers. Conversely, the lowest P50 in our data set was0.76 MPa in Vitis vinifera, which also had the largest pitarea per vessel (Fig. 5). This pressure corresponds to anaverage maximum pore size per vessel of 383 nm, whichshould be approaching the maximum of the theoreticalpore distribution.
A causal relationship between pit area and cavitationpressure provides a relatively simple explanation for manyof the results, beginning with the observation that wall andlumen resistivities are roughly co-limiting (Fig. 3). If a givenlevel of safety from cavitation dictates a limited total pitarea per vessel, and if the pit area fraction (FP) is heldconstant, the total wall area of the vessel is also limited. Ifthe total wall area of the vessel is limited, the product oflength and diameter must be constant. Such a vessel can belong and narrow, or short and wide, but its surface areamust be preserved. Solving for the wall resistivity fractionthat minimizes the conduit area-specific resistivity (RCa)under this surface area constraint (Appendix) yields anoptimal fraction of FW = 0.40 (Fig. 8; conductivities = 1/RCa
shown for illustrative purposes). The average wall fractionwas higher at 0.53, but the breadth of the optimum is suchthat the species still achieved an average of 94 ± 2% of theirmaximum conductivity per conduit area (Fig. 8; symbols oncurve).
The proposed trade-off also explains the rather low pitfractions (FP) and their decrease with P50 (Fig. 7). A low FP
means a larger vessel for the same limiting total pit area. A
Figure 7. Pit surface area per total vessel surface area (FP) versus P50. The ‘pit fraction’ declined in inverse relation to P50: FP = 0.116P50
-0.88 (r2 = 0.60). Error bars not shown for clarity, standard error of FP averaged 11% of the mean.P50 (MPa)
0 1 2 3 4 5 6 7
Pit
area
per
ves
sel a
rea,
FP
0.00
0.02
0.04
0.06
0.08
0.10
0.12
0.14
0.16
0.18
AuAa
ClCm
HdPt
SsPm
RpRl
Rn
PA
AN
SE
SC
VV
r 2 = 0.60

Safety versus efficiency trade-off in xylem transport 809
© 2005 Blackwell Publishing Ltd, Plant, Cell and Environment, 28, 800–812
larger vessel means a lower RCa (with the minimum still atFW = 0.4). The decline in FP with increasing P50 preventstotal vessel size from decreasing as much as total pit area(Fig. 6) and keeps the conduit resistivity from increasingwith P50 as much as it would if FP were constant.
Most importantly, a pit area versus cavitation linkageexplains the tendency for conduit resistivity to increasewith P50 (Fig. 2). Assuming the inverse relationshipbetween total pit area and P50 (Fig. 6), incorporating theobserved relationship between pit fraction (FP) with P50
(Fig. 7), and using average values for area-specific pit resis-tance (rP = 167 MPa s m-1), wall fraction (Fw = 0.53), and L¢/L (0.82), the total conduit resistivity increases with P50
much as observed (Fig. 9; ‘observed FP trend’ line versusdata regression, see Appendix for calculations). Theremaining discrepancies are owing to variation in the actualvalues of FP, FW, L¢/L, and rP around their average. Thecompensating effect of decreased pit fraction (FP) in moreresistant species is demonstrated by holding this value con-stant at its maximum (0.15) and observing how much moresteeply the conduit resistivity increases with P50 (Fig. 9;‘constant FP’ line). Theoretically, a reduction in FP withincreasing P50 can completely eliminate the safety versusefficiency trade-off, but this requires FP to drop drasticallyto below 0.05%. The disadvantage of extremely low pitfractions would be much higher lateral flow resistance (Ori-ans et al. 2004), a problem that probably limits how muchFP can drop and still benefit the plant.
The trade-off is also consistent with vessel diameterbeing more sensitive to P50 than length (Fig. 4). The solidcurves in Fig. 4 are the diameter and length of the vesselshaving resistivities plotted in Fig. 9 assuming the observedtrend in pit fraction and setting other parameters to theiraverages (Fig. 9; ‘observed FP trend’ line, Appendix). Diam-
eter drops by almost three-fold over the P50 range whereaslength drops by just over 1.5-fold.
Finally, the variable relationship between diameter,length and overall resistivity with P50 (Figs 2 & 4) is accom-modated by the trade-off hypothesis. The variation is pri-marily a result of variation in FP, FW, L¢/L, and rP – none ofwhich are mechanistically linked to P50, which is set only bytotal pit area. The greater scatter in the insignificant lengthversus P50 data (Fig. 4b) versus the significant diameter ver-sus P50 relationship (Fig. 4a) is because length is more sen-sitive to variation in FP than diameter (Appendix). As aresult of these interactions, there was no prevailing allom-etry between length and diameter across the 16 species asopposed to our earlier more limited survey that suggestedthat length scaled with the square of the diameter (Sperryet al. 2005). In summary, a single P50 can be associated witha number of different vessel sizes and resistivities depend-ing on variation in FP, FW, L¢/L, and rP. Nevertheless, theneed to reduce pit area per vessel to achieve greater safetyfrom cavitation is proposed to drive the general trendtoward less efficient xylem transport seen over broadranges in P50.
General discussion
The safety versus efficiency trade-off that we propose isquite different from what we expected. We had thought thatplants acquired greater safety from cavitation by makingdenser pit membranes that were less porous on average andso with higher flow resistance. Instead, the results show thataverage pit membrane porosity and flow resistance doesnot vary systematically with cavitation resistance in thestudy species. These plants may be achieving greater safetyby reducing the pit area per conduit and thus by chance
Figure 8. Conduit conductivity per cross-sectional lumen area relative to its maximum versus end wall resistivity fraction (FW = RW/RC) calculated according to Eqn A8 (Appendix). Conductivities are shown rather than the reciprocal RCa to avoid infinite values at FW extremes. The curve assumes a fixed vessel surface area so that diameter varies inversely with length. High FW corresponds to a wide but short vessel, low FW is a long but narrow vessel. Maximum conductivity per cross-sectional area occurs at FW = 0.4. Observed wall fractions are indicated by symbols, and achieved an average of 94 ± 2% of the theoretical maximum.Wall resistivity fraction,RW/RC
0.0 0.1 0.2 0.3 0.4 0.5 0.6 0.7 0.8 0.9 1.0
Con
duct
ivity
/ m
axim
um c
ondu
ctiv
ity
0.0
0.2
0.4
0.6
0.8
1.0

810 J. K. Wheeler et al.
© 2005 Blackwell Publishing Ltd, Plant, Cell and Environment, 28, 800–812
reducing the average size of the largest pore per conduit,which sets the air-seed pressure. Although the plant cannotcontrol the cavitation pressure of a single conduit in thisway, it can control the average response of the typicallylarge population of conduits on which it depends. Thetrade-off with decreased transport efficiency results fromthe higher resistance of having less total pit area, and fromthe fact that a limited total pit area ultimately tends to limitthe total size of the conduit.
The relatively small size of the majority of pores appearsto be controlled by the hemicelluloses and pectins andother matrix components that constitute the ‘filler’ betweenthe strength-providing cellulose microfibrils of the mem-brane (Dickson 2000; Choat et al. 2003). Because of thisfiller, membrane strength is not necessarily coupled toporosity as assumed in our model of homogenous pit mem-branes. The large variation in area-specific pit resistancethat we measured (Table 1) and that was nevertheless notrelated to cavitation resistance may result from variation inthe state of the matrix filler between species. Variation inxylem conductivity with ionic strength of the sap has beenattributed to change in hydration of the matrix and hencepore size (Zimmermann 1983; Zwieniecki et al. 2001b).Based on limited observations with one species (Acernegundo), sap ionic strength does not alter the P50 (V.Stiller, J. Sperry, unpubl. data). Perhaps the treatmentaffects the majority of small pores more than the largestpore, leaving cavitation pressure unaltered.
The tendency for lumen and end wall resistivity to be co-limiting in plants (Fig. 3) was difficult to account for underour original hypothesis because it put no limit on vessel sizewith P50. Large, safe vessels with large total pit area wouldbe possible if the pit membrane porosity was as tightlycontrolled as we had originally assumed. Such vessels couldbe sufficiently long to reduce wall resistivity to a small
percentage (Sperry & Hacke 2004; Sperry et al. 2005). Thenew trade-off hypothesis does limit vessel size to within thebounds of the minimum permissible pit area per vessel areafraction (FP). A limit on vessel size results in the minimumresistivity being a compromise between reducing lumenresistivity with wide but short vessels versus reducing wallresistivity with long but narrow ones (Fig. 8).
The hydraulic trade-off we propose here is reinforced bya mechanical trade-off. The mechanical problem of achiev-ing greater safety from cavitation is that it requires a thickerwall for a given diameter to withstand compressive forcesand implosion. A greater wall thickness per diameter cantranslate to higher wood density, particularly where con-duits make up a significant portion of the wood volume(Hacke et al. 2001). Higher density represents greater costof wood growth per volume. A thicker wall per diameteralso increases the hydraulic resistivity on an area basis evenif there is no change in lumen diameter. A limitation onmaximum wall thickness can potentially limit maximumdiameter independently of purely hydraulic considerations.
Trade-offs result in a strong selective advantage to mech-anisms that at least partially circumvent or resolve the con-flict. We have already drawn attention to the advantage ofminimizing the pit area per vessel area fraction (FP), par-ticularly as the P50 is increased in safer xylem (Figs 7 and9). Variation in FP provides an explanation for why there isno 1 : 1 relationship between vessel size and vulnerability –big vessels can be safe from cavitation, but only by reducingtheir FP to keep their pit area small. There are other candi-date mechanisms. The pit area that is presumably influenc-ing the cavitation pressure is the pit area responsible forthe capillary sealing of the pit membrane. Any mechanismthat reduces the actual sealing area of the membrane rela-tive to the total conducting area will mitigate the trade-off.Pit aspiration is a simple mechanism – if capillary forces are
Figure 9. Vessel resistivity on a cross-sectional lumen area basis (RCa) versus P50. The dashed data regression with 95% confidence limits is from the data in Fig. 2. The solid curves are all calculated assuming that P50 is determined by the total pit area per vessel according to the relationship in Fig. 6 and in Eqn A8 (Appendix). The ‘observed FP trend’ line assumes the pit fraction (FP) curve from Fig. 7. The ‘constant FP’ line assumes FP is constant at its maximum of 0.15. Other parameters were held constant at the average for the data set.P50 (MPa)
0 1 2 3 4 5 6 7
Ves
sel r
esis
tivity
,RC
a (M
Pa
s m
–2)
0
50
100
150
200
250
Con
stan
t F P
Observe
d F P tre
nd
data
Safety versus efficiency trade-off in xylem transport 811
© 2005 Blackwell Publishing Ltd, Plant, Cell and Environment, 28, 800–812
sufficient to displace the membrane against the chamberwall, only the part of the membrane spanning the apertureis responsible for bearing the full brunt of the air–waterpressure difference in a sealed pit. Vestured pits could workin the same way – water could be flowing through the entiremembrane, but in the sealing position much of the mem-brane would be deflected against the vestures, reducing thearea involved in sealing off air.
Tighter control over membrane pore size and distribu-tion would have a tremendous advantage, as we had ini-tially hypothesized, because total pit area could becomeless tightly coupled with vulnerability to cavitation.Although we did not see evidence for this in our limitedsample, not all angiosperm pit membranes need be thesame. Although the membrane porosity studies cited above(Choat et al. 2003, 2004) show no relationship with air-seeding pressure, similar methods applied to different spe-cies have shown correspondence between membrane poresize and cavitation (Jarbeau, Ewers & Davis 1995). Cer-tainly some angiosperm pits are quite different in having atorus that may function like a conifer pit (Wheeler 1983;Jansen et al. 2004). In conifers, the dense torus seals the pit,allowing the pores of the surrounding margo to be quitelarge and conductive without sacrificing safety. Air-seedingoccurs by slippage of the torus, and in theory is a functionof individual pit membrane strength and structure (Hacke,Sperry & Pittermann 2004) rather than total pit area. Giventhe potential diversity in pit function it is unlikely that therewill be a single structural basis for cavitation pressureacross vascular plants.
ACKNOWLEDGMENTS
Funding was provided from National Science Foundationgrants IBN-0112213 and IBN-0416297. The authors thanktwo anonymous reviewers whose thoughtful commentshelped to improve the manuscript.
REFERENCES
Alder N.N., Pockman W.T., Sperry J.S. & Nuismer S. (1997) Useof centrifugal force in the study of xylem cavitation. Journal ofExperimental Botany 48, 665–674.
André J.-P. (2002) Organisation Vasculaire Des Angiospermes: uneVision Nouvelle. INRA, Paris, France.
Bernard C. & Epp C. (1995) Laboratory Experiments in CollegePhysics. John Wiley & Sons, New York, USA.
Choat B., Ball M., Luly J. & Holtum J. (2003) Pit membraneporosity and water stress-induced cavitation in four co-existingdry rainforest tree species. Plant Physiology 131, 41–48.
Choat B., Jansen S., Zwieniecki M.A., Smets E. & Holbrook N.M.(2004) Changes in pit membrane porosity due to deflection andstretching: the role of vestured pits. Journal of ExperimentalBotany 55, 1569–1575.
Cochard H., Cruiziat P. & Tyree M.T. (1992) Use of positive pres-sures to establish vulnerability curves: Further support for theair-seeding hypothesis and implications for pressure-volumeanalysis. Plant Physiology 100, 205–209.
Cohen S., Bennink J.P. & Tyree M.T. (2003) Air method measure-ments of apple vessel length distributions with improved
apparatus and theory. Journal of Experimental Botany 54, 1889–1897.
Crombie D.S., Hipkins M.F. & Milburn J.A. (1985) Gas penetra-tion of pit membranes in the xylem of Rhododendron as thecause of acoustically detectable sap cavitation. Australian Jour-nal of Plant Physiology 12, 445–454.
Davis S.D., Ewers F.W., Wood J., Reeves J.J. & Kolb K.J. (1999)Differential susceptibility to xylem cavitation among three pairsof Ceanothus species in the Transverse Mountain ranges ofSouthern California. Ecoscience 6, 180–186.
Dickson W. (2000) Integrative Plant Anatomy. Academic Press,San Diego, CA, USA.
Ewers F.W. (1985) Xylem structure and water conduction in coni-fer trees, dicot trees, and lianas. International Association ofWood Anatomists Bulletin 6, 309–317.
Hacke U.G. & Sperry J.S. (2001) Functional and ecological xylemanatomy. Perspectives in Plant Ecology, Evolution and System-atics 4, 97–115.
Hacke U.G., Sperry J.S. & Pittermann J. (2000) Drought experi-ence and cavitation resistance in six desert shrubs of the GreatBasin, Utah. Basic and Applied Ecology 1, 31–41.
Hacke U.G., Sperry J.S. & Pittermann J. (2004) Analysis ofcircular bordered pit function. II. Gymnosperm tracheids withtorus-margo pit membranes. American Journal of Botany 91,386–400.
Hacke U.G., Sperry J.S., Pockman W.P., Davis S.D. & McCullohK.A. (2001) Trends in wood density and structure are linked toprevention of xylem implosion by negative pressure. Oecologia126, 457–461.
Hargrave K.R., Kolb K.J., Ewers F.W. & Davis S.D. (1994) Con-duit diameter and drought-induced embolism in Salvia melliferaGreene (Labiatae). New Phytologist 126, 695–705.
Ieperen W.V., Meeteren U.V. & Gelder H.V. (2000) Fluid ioniccomposition influences hydraulic conductance of xylem con-duits. Journal of Experimental Botany 51, 769–776.
Jansen S., Choat B., Vinckier S., Lens F., Schols P. & Smets E.(2004) Intervascular pit membranes with a torus in the wood ofUlmus (Ulmaceae) and related genera. New Phytologist 163, 51–59.
Jarbeau J.A., Ewers F.W. & Davis S.D. (1995) The mechanism ofwater-stress-induced embolism in two species of chaparralshrubs. Plant, Cell and Environment 18, 189–196.
Lancashire J.R. & Ennos A.R. (2002) Modelling the hydrody-namic resistance of bordered pits. Journal of Experimental Bot-any 53, 1485–1493.
Lewis A.M. (1992) Measuring the hydraulic diameter of a pore orconduit. American Journal of Botany 79, 1158–1161.
Martinez-Vilalta J., Prat E., Oliveras I. & Pinol J. (2002) Xylemhydraulic properties of roots and stems of nine Mediterraneanwoody species. Oecologia 133, 19–29.
Neufeld H.S., Grantz D.A., Meinzer F.C., Goldstein G., CrisostoG.M. & Crisosto C. (1992) Genotypic variability in vulnerabilityof leaf xylem to cavitation in water-stressed and well-irrigatedsugarcane. Plant Physiology 100, 1020–1028.
Orians C., van Vuuren M., Harris N., Babst B. & Ellmore G. (2004)Differential sectoriality in long-distance transport in temperatetree species: evidence from dye flow, 15N transport, and vesselelement pitting. Trees – Structure and Function 18, 501–509.
Pittermann J. & Sperry J.S. (2003) Tracheid diameter determinesthe extent of freeze-thaw induced cavitation in conifers. TreePhysiology 23, 907–914.
Pockman W.T. & Sperry J.S. (2000) Vulnerability to xylem cavita-tion and the distribution of Sonoran Desert vegetation. Ameri-can Journal of Botany 87, 1287–1299.
Salleo S., Lo Gullo M.A., De Paoli D. & Zippo M. (1996) Xylemrecovery from cavitation-induced embolism in young plants of

812 J. K. Wheeler et al.
© 2005 Blackwell Publishing Ltd, Plant, Cell and Environment, 28, 800–812
Laurus nobilis: a possible mechanism. New Phytologist 132, 47–56.
Schulte P.J. & Gibson A.C. (1988) Hydraulic conductance andtracheid anatomy in six species of extant seed plants. CanadianJournal of Botany 66, 1073–1079.
Sperry J.S. (1995) Limitations on stem water transport and theirconsequences. In: Plant Stems: Physiology and Functional Mor-phology (ed. B.L. Gartner), pp. 105–124. Academic Press.
Sperry J.S. & Hacke U.G. (2004) Analysis of circular bordered pitfunction. I. Angiosperm vessels with homogenous pit mem-branes. American Journal of Botany 91, 369–385.
Sperry J.S., Hacke U.G. & Wheeler J.K. (2005) Comparative anal-ysis of end wall resistance in xylem conduits. Plant, Cell andEnvironment doi: 10.1111/j.1365-3040.2005.01287.
Sperry J.S., Saliendra N.Z., Pockman W.T., Cochard H., CruiziatP., Davis S.D., Ewers F.W. & Tyree M.T. (1996) New evidencefor large negative xylem pressures and their measurement bythe pressure chamber method. Plant, Cell and Environment 19,427–436.
Tyree M., Davis S. & Cochard H. (1994) Biophysical perspec-tives of xylem evolution – is there a tradeoff of hydraulicefficiency for vulnerability to dysfunction? IAWA Journal 15,335–360.
Wheeler E.A. (1983) Intervascular pit membranes in Ulmus andCeltis native to the USA. IAWA Bulletin 4, 79–88.
Zimmermann M.H. (1983) Xylem Structure and the Ascent of Sap.Springer-Verlag, Berlin, Germany.
Zimmermann M.H. & Jeje A.A. (1981) Vessel length distributionof some American woody plants. Canadian Journal of Botany59, 1882–1892.
Zwieniecki M.A., Melcher P.J. & Holbrook N.M. (2001a) Hydrau-lic properties of individual xylem vessels of Fraxinus americana.Journal of Experimental Botany 52, 257–264.
Zwieniecki M.A., Melcher P.J. & Holbrook N.M. (2001b) Hydro-gel control of xylem hydraulic resistance in plants. Science 291,1059–1062.
Received 15 November 2004; received in revised form 6 January2005; accepted for publication 13 January 2005
APPENDIX
Calculation of end wall and pit resistances
Assuming the vessel geometry diagrammed in Fig. 1 withlumen and wall components in series, vessel RC = RL + RW.In terms of vessel diameter and length (D, L)
RC = 128 h/(pD4) + rW/(LFL) (A1)
where h is viscosity, rW is the resistance of one end-wall, andFL is the ratio L¢/L (Fig. 1). By measuring RC, D, L, and FL
for the average-sized vessel as described in Materials andMethods we solved Eqn A1 for rW. The pit resistance on apit membrane area basis (rP) was calculated as
rP = rWAP/2 (A2)
where AP is the total pit membrane area per vessel. Thisassumes all pit area is located on vessel end walls as
opposed to side walls, and that one end wall contains halfof the total pit area. The AP was calculated from
AP = pDLFP (A3)
where FP is the fraction of the vessel surface area occupiedby pit membranes measured from wood sections asdescribed.
Vessel resistivity (RC) as a function of AP
The proposed safety versus efficiency trade-off assumesthat P50 is determined by AP (Fig. 6). The ramifications forRC can be explored by expressing Eqn A1 in terms of AP
rather than D and L. Efficiency is best expressed as RC ona cross-sectional area basis (RCa), so each resistivity in EqnA1 was multiplied by the lumen cross-sectional area. Toeliminate D in this version of Eqn A1 we solved Eqn A3for D [D = AP/(FPpL)] and substituted. This gives
RL = 32h(pLFP/AP)2 (A4)
RW = rPAP/(2pL3FLFP2) (A5).
To eliminate L we make use of the wall fraction (FW) interms of RL and RW
RL/RW = (1/Fw - 1) (A6)
Substituting Eqns A4 and A5 for RL and RW in Eqn (A6)and solving for L yields
L = [(1/FW - 1)rP/(64hFL)]1/5 (AP/p)3/5 FP-4/5 (A7).
Plugging Eqn A7 into Eqns A4 and A5 and summing to getRCa results in the following summary equation for RCa on across-sectional area basis
RCa = 6.06(p/AP)4/5h3/5(FPrP/FL)2/5[(1/FW - 1)2/5 + (FW/(1 - FW))3/5] (A8).
This equation is graphed with respect to FW in Fig. 8, show-ing that the minimum RCa (maximum conductivity per area)occurs at FW = 0.40 when other parameters are constant.Figure 9 shows RCa calculated from Eqn A8 using meanvalues of rP, FL, FW and assuming AP varies with P50 as inFig. 6. The FP was assumed either to vary with P50 as in Fig. 7(Fig. 9, observed FP trend), or to remain constant (Fig. 9,constant FP).
A final equation gives D as a function of AP by substitut-ing Eqn A7 for L into Eqn A3 and solving for D
D = [((FW - 1)/FW) 64hFL/(rPFP)]1/5 (AP/p)2/5 (A9).
The curves in Fig. 4 show that for the observed decline inAP and FP with P50, D decreases more than L (calculatedfrom Eqns. A7 and A9 using mean values for the otherparameters). Length is more sensitive to variation in FP
than D (compare Eqns. A7 and A9), consistent with thegreater scatter in the L versus P50 relationship in Fig. 4b.
Copyright © 2022 FDOKUMEN