Inter- and intra-firm effects in the diffusion of new process technology
27
1 THE INTRA-FIRM DIFFUSION OF NEW PROCESS TECHNOLOGIES Giuliana Battisti 1 Aston Business School University of Aston and Paul Stoneman Warwick Business School University of Warwick December 2004 Abstract: The study of intra firm diffusion has largely been neglected and the limited extant literature overwhelmingly relies upon uncertainty reduction via information spreading or epidemic learning as the main driver. In this paper, an alternative approach is taken whereby the intra firm diffusion of new process technologies reflects the profitability of new technology adoption as proxied by firm characteristics. The approach is tested using data relating to the diffusion of Computer Numerically Controlled Machine tools within firms in the UK engineering and metalworking sectors. The empirical analysis does not reject the hypothesis that profitability considerations are important with a number of firm characteristics being isolated as of special relevance, including firm size and the use of complementary technologies and managerial techniques. However there is little support for the traditional epidemic effect. Keywords: Intra firm diffusion, technological change, innovation, CNC JEL Classification: O.3 1 Corresponding author: G.Battisti, OIM Group, Aston Business School, Aston University, Birmingham B4 7AL, UK; tel. 0044 (0) 121 204 3028; fax. +44 (0) 121 359 5271; email address [email protected] ,
-
Upload
independent -
Category
Documents
-
view
0 -
download
0
Transcript of Inter- and intra-firm effects in the diffusion of new process technology

1
THE INTRA-FIRM DIFFUSION OF NEW PROCESS TECHNOLOGIES
Giuliana Battisti1
Aston Business School
University of Aston
and
Paul Stoneman
Warwick Business School
University of Warwick
December 2004
Abstract: The study of intra firm diffusion has largely been neglected and the limited extant literature overwhelmingly relies upon uncertainty reduction via information spreading or epidemic learning as the main driver. In this paper, an alternative approach is taken whereby the intra firm diffusion of new process technologies reflects the profitability of new technology adoption as proxied by firm characteristics. The approach is tested using data relating to the diffusion of Computer Numerically Controlled Machine tools within firms in the UK engineering and metalworking sectors. The empirical analysis does not reject the hypothesis that profitability considerations are important with a number of firm characteristics being isolated as of special relevance, including firm size and the use of complementary technologies and managerial techniques. However there is little support for the traditional epidemic effect. Keywords: Intra firm diffusion, technological change, innovation, CNC
JEL Classification: O.3
1 Corresponding author: G.Battisti, OIM Group, Aston Business School, Aston University, Birmingham B4 7AL, UK; tel. 0044 (0) 121 204 3028; fax. +44 (0) 121 359 5271; email address [email protected],

2
1. INTRODUCTION
Technological change is the main driver of increasing output, productivity and welfare. It
is however only as new technology is used that such benefits arise. The analysis of
technological diffusion addresses issues relating to the nature and determinants of the time
profile of the use of new technologies. This time profile (within an industry or an
economy) can conceptually be considered as made up of two parts – the time profile of the
number of firms using the technology (inter firm diffusion) and the time profile of the
extent of use by individual firms (intra firm diffusion). Battisti 2000 and Battisti and
Stoneman (2003) show empirically that the inter firm effect is more important in the early
stages, the intra firm effect more important in the later stages of the whole diffusion
process. The majority of the extant diffusion literature (see Stoneman, 2001) is concerned
solely with inter firm diffusion and intra firm diffusion has been largely ignored, despite
its importance. The objective of this paper is to go some way towards redressing that
balance2 by offering a new approach to modelling intra firm diffusion and testing that
approach using a rare data set (a single 1993 cross section) on the intra-firm diffusion of
CNC technology in the UK engineering and metalworking industry.
The limited existing literature on intra firm diffusion has largely relied upon learning based
models. In the seminal Mansfield (1963a) approach it is assumed that as use of a specific
new technology increases, the risk attached to further adoption is reduced through
learning, either within or across firms, leading to further increases in use, which as a result
follows an S-shaped, logistic, diffusion path over time. Much of the existing empirical
work also relies upon learning and/or epidemic frameworks (for example, Mansfield
1963a\b, Romeo 1975, Nabseth and Ray 1974, Schenk 1974, Globerman 1976, Antonelli
1985 and Levin et. al. 1992). However, as pointed out by Stoneman and Battisti (1997), for
some technologies the Mansfield type epidemic explains relatively little of the intra firm
diffusion process or, at least, the model is not robust across different technologies.
The Mansfield type epidemic learning model predicts in particular that the extent of use of a
2 This paper is developed from a work first published as a Ph.D. thesis from the University of Warwick, (Battisti, 2000). We wish to thank the examiners of that thesis and participants in the 2003 European Association for Research in Industrial Economics (EARIE) conference, the 2002 Royal Statistical Society Annual Conference, the April 2002 One Day Research Workshop at the Technological Innovation Research Unit at Warwick Business School for their useful comments. We also wish to thank two referees of this journal for their useful comments on earlier drafts, but of course all errors that remain are the responsibility of the authors alone.

3
new technology within the firm will increase with the number of years since first adoption.
We plot in Figure 1 the extent of use of CNC in 1993 against years since first adoption for
the firms in our sample. Although there is an upward sloping trend to the data, in line with
the more formalised study of Stoneman and Battisti (1997), time since adoption alone can
only explain a minimal proportion (about 10%) of the total variability of the level of
ownership of the new technology. Therefore, it cannot be just learning about the technology
that determines the heterogeneity of observed use.
Figure 1. Proportion of CNC ownership by time since first adoption
0102030405060708090
100
1 3 5 7 9 11 13 15 17 19 21 23
Years since first adoption
Firm
's ow
ners
hip
of th
e ne
w
tech
nolo
gy (%
)
Source: CURDS data set
More recent theoretical literature also suggests that technology usage may not increase
monotonically from the date of first adoption until the end of the diffusion process. In an
uncertain world a firm might immediately adopt the optimal level of the new technology
(which is not necessarily 100%) or choose a temporary or permanent suspension of the
within firm adoption process implying that the intra-firm diffusion pattern, if there is one,
can be discontinuous and not necessarily monotonic (see for example Weiss (1994) and
Grenadier and Weiss (1997)). Stoneman (1981) constructs a more explicitly decision
theoretic, means variance model with Bayesian learning that will generate similar results.
These observations and other well known weaknesses of the learning based model (see for
example Davies, 1979), indicate that an alternative approach to modelling intra firm
diffusion is required. This observation becomes even more pointed when one observes the
contrast to the inter-firm literature which has now recognised the importance of, for
example, profitability considerations, game theoretic strategies, and technological
complementarities to the decision to adopt.

4
The inter firm literature has been summarised by Karshenas and Stoneman (1993 and
1995) as involving rank, stock, order and epidemic effects. In this paper, we develop a new
approach to intra firm diffusion that mirrors such effects within firms rather than across
firms by allowing the firm’s decision on how much to invest in a ‘new’ or advanced
process technology to be based upon the expected profit gain resulting from cost
reductions (as a result of adoption). This approach is also taken in the recent work of
Forman, Goldfarb and Greenstein (2003) on the intensity of internet usage (which study
also employs a single cross section of data)
In section two we present the new approach in detail. The nature of CNC technology, the
data set and sample selection issues are discussed in section three. The application of the
model is developed and empirical estimates presented in section four. In section five we
discuss the findings and in section six conclude.
2. A PROFIT DRIVEN FRAMEWORK
2.1 Introduction
The essence of a profit driven model of technological diffusion is that technology use in
time t will only extend to the point where the marginal expected profit gain from further
adoption equals the cost of adoption (appropriately defined) of the new technology. Over
time either the marginal gain and/or the cost of adoption may change and as they do so the
level of use will change. The key component of the model concerns the determinants of
the profit gain from adoption. The inter firm literature indicates three basic approaches in
which the profit from adoption is either determined by rank effects, stock effects or order
effects (Karshenas and Stoneman, 1993). Carrying this approach over to the intra firm
context it is difficult to see relevance for an order effect (any order effects will anyway be
internalised) however the rank and stock effects transfer naturally and easily.
The rank effect states basically that firms are different and as such will get different (net or
gross) gains from extending use of new technology. For a given cost of acquisition the
level of intra firm diffusion may thus differ across firms. The stock effect approach argues
that the profit gain to the firm from the use of one extra unit of the new technology in time
t is dependent upon the existing level of use by the firm. Given the cost of acquisition at
time t, it will then only be profitable for the firm to extend use to a certain point thus
5
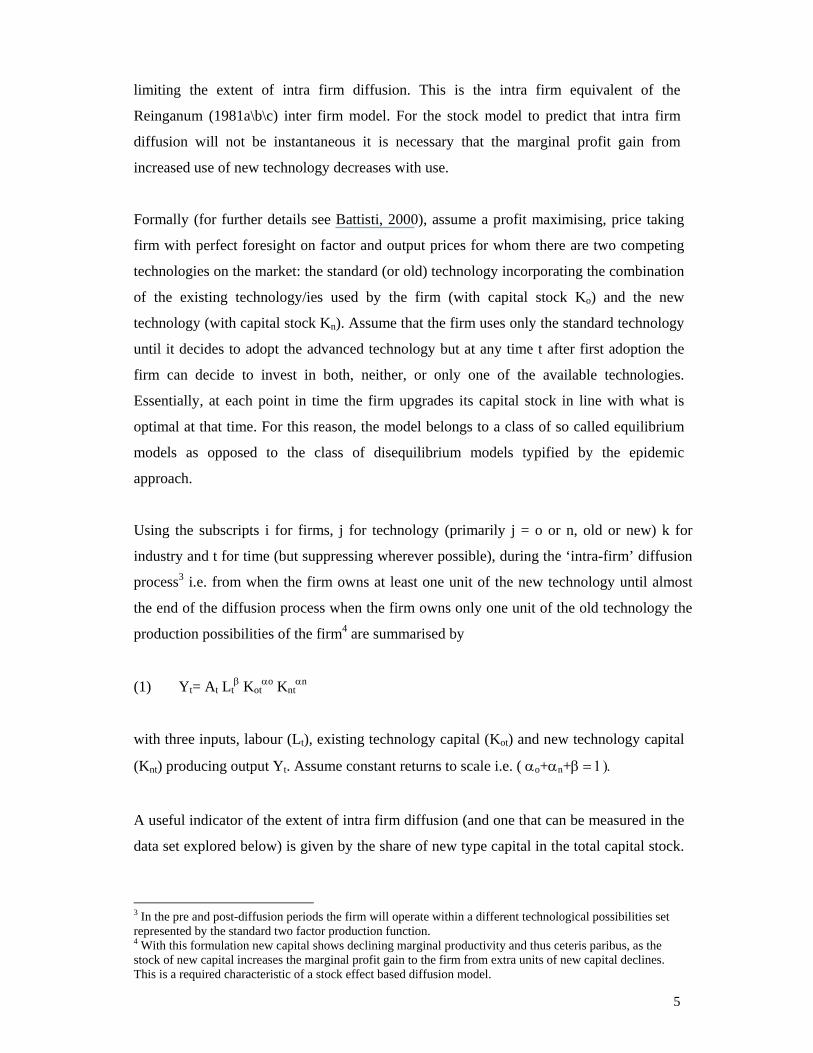
limiting the extent of intra firm diffusion. This is the intra firm equivalent of the
Reinganum (1981a\b\c) inter firm model. For the stock model to predict that intra firm
diffusion will not be instantaneous it is necessary that the marginal profit gain from
increased use of new technology decreases with use.
Formally (for further details see Battisti, 2000), assume a profit maximising, price taking
firm with perfect foresight on factor and output prices for whom there are two competing
technologies on the market: the standard (or old) technology incorporating the combination
of the existing technology/ies used by the firm (with capital stock Ko) and the new
technology (with capital stock Kn). Assume that the firm uses only the standard technology
until it decides to adopt the advanced technology but at any time t after first adoption the
firm can decide to invest in both, neither, or only one of the available technologies.
Essentially, at each point in time the firm upgrades its capital stock in line with what is
optimal at that time. For this reason, the model belongs to a class of so called equilibrium
models as opposed to the class of disequilibrium models typified by the epidemic
approach.
Using the subscripts i for firms, j for technology (primarily j = o or n, old or new) k for
industry and t for time (but suppressing wherever possible), during the ‘intra-firm’ diffusion
process3 i.e. from when the firm owns at least one unit of the new technology until almost
the end of the diffusion process when the firm owns only one unit of the old technology the
production possibilities of the firm4 are summarised by
(1) Yt= At Ltβ Kot
αo Kntαn
with three inputs, labour (Lt), existing technology capital (Kot) and new technology capital
(Knt) producing output Yt. Assume constant returns to scale i.e. ( αo+αn+β = 1).
A useful indicator of the extent of intra firm diffusion (and one that can be measured in the
data set explored below) is given by the share of new type capital in the total capital stock.
3 In the pre and post-diffusion periods the firm will operate within a different technological possibilities set represented by the standard two factor production function. 4 With this formulation new capital shows declining marginal productivity and thus ceteris paribus, as the stock of new capital increases the marginal profit gain to the firm from extra units of new capital declines. This is a required characteristic of a stock effect based diffusion model.

6
Pursuing a standard neoclassical model of investment (see Jorgenson, 1963) the extent of
intra firm diffusion in time t is given by (2)
(2) Knt / (Knt+Kot) = 1/ (1+ (αo/ αn) (cnt/cot))
where cnt and cot are the user costs of capital for new and old technologies. As (2) is
inherently non linear and thus difficult to handle econometrically, applying a logarithmic
transformation and expressing Kj in terms of percentages (kjt) of the total capital stock, so
that knt+ kot=100%, may be rewritten as:
(3) log[knt/ 100-knt] = log (αn / αo) + log (cot /cnt )
where the lhs is the log of the ratio of new to old in the machine tool stock of the firm in
time t.
Equation (3) essentially arises from taking a ratio of the demand for the new and old
technologies and thus factors that affect both equally have no effect on the intra firm
diffusion path. This immediately allows us to argue that, under not too restrictive
assumptions, firm specific adjustment costs and firm specific taxes will not affect the
diffusion path. Similarly, if output markets and factor markets are not perfectly competitive
then the demand for both new and old technologies will be equally affected and thus the
diffusion path will be unaffected by the structure of the industry in which the firm is
located. It has been suggested to us by commentators that the level of intra firm diffusion
could however be affected by the wage rate. This would only be so if the firm pays
different wages to workers operating different technologies (which is of course possible if
skill requirements are different), otherwise the wage variable drops out when the ratio of
the optimal ownership of new to old is considered. Unfortunately our data does not allow
us to explore this further.
We also allow the investment decision to be affected by general revenue or market
uncertainty a la Bertola (1998) so that profits are expected to grow at a constant mean rate
but the realised growth rate is random, normally distributed and independent over time.
Within a Dixit and Pindyck (1994) framework such future profits can be approximated by

7
geometric Brownian motion with drift where the future values are lognormally distributed
with a variance that grows linearly with the time horizon i.e.
(4) δπτ = ϖ πt dt + σ πtdz
where πτ is profit in time t, z is a standard Wiener process equalling εt (dt)1/2 and εt is a
normally distributed random variable with mean zero and a standard deviation of one. (ϖ)
is the growth rate, (σ) the standard deviation of profits, and β is the largest root of the
Bellman quadratic (differential) equation (6), i.e.
(5) β=1/2−ϖ/σ2 +√ {[ϖ / σ2 − 1/2]2 + 2 (ρ+δ) /σ2}.
With such uncertainty, the firm might find it more profitable to exercise an option to wait
before investing in (more) capital goods whereas in the absence of uncertainty (σ =0) the
standard neo-classical investment rule will still hold. Thus the user cost of capital is
defined to include a term in β as in (6).
(6) cjt = (r + δ + 1/2 σ2 β) qjt -dqjt
where r is the discount rate, δ the rate of depreciation (which could differ across
technologies but as we do not have data to pursue this option, is not here allowed to do
so), qjt the price of capital good j, and dqjt the one period ahead expectation of the change
in qjt.
There is also the possibility of alternative forms of uncertainty, for example, possible
technological uncertainty about the timing and the significance of future technological
improvements, see Rosenberg (1976), Weiss (1994) and Grenadier and Weiss (1997). With
such uncertainty the firm may exercise the ‘option’ to wait or to terminate the adoption of
advanced technology. Consequently it sits well in the real options framework specified
above and can be assumed to be covered by that approach. A final type of uncertainty
arises due to the lack of knowledge about the performance characteristics of new
technologies on the part of potential buyers a la Mansfield (1968). As discussed above this
type of uncertainty has formed the basis of the epidemic model reasoning. To incorporate
such uncertainty and also to have a more encompassing model, we introduce an extra term

8
in to (3) to reflect epidemic effects or technological uncertainty a la Mansfield. We argue
however that as the old technology will have been in existence for some time, its
performance characteristics are known. Such uncertainty thus only relates to the new
technology. We thus define a variable E (to be empirically specified below) that represents
such learning and post multiply the rhs of (3) by a function of E, f(E).
Bringing these arguments together yields the diffusion curve (7)
(7) log[knt/ 100-knt] = log (αn / αo) + log (cot /cnt ) + Log f(E)
which essentially states that intra firm diffusion at a moment in time will reflect αn /
αo, the productivity of the old technology with respect to the new (i.e. rank effects), cot /cnt
the relative user costs of the technologies and f(E), an epidemic effect.
3. CNC TECHNOLOGY, DATA SOURCES AND DIFFUSION PATTERNS
Our data is a cross section relating to the use of CNC technology in the UK engineering
and metalworking sector in 1993 collected by the Centre for Urban and Regional Studies
(CURDS) at the University of Newcastle upon Tyne. CNC first appeared in the early
1970’s and by incorporating microcomputer technology into numerically controlled
machines provided the capability of automatic and flexible machining. The CURDS data
set provides information upon the use of CNC for a sample of 343 establishments (plants
in US usage). It also contains information on whether each establishment is a stand-alone
organisation (defined in the questionnaire as an independent firm) or whether it is part of a
multi establishment firm/organisation that, following the practice used in the survey source
we label a group (although we do not know whether any of the responding establishments
belong to the same groups). In order to focus on the capital configuration and the
technological constraints of the replacement process we keep the establishment as the unit
of analysis but to relate more closely to the existing literature we continue to talk
throughout of intra firm and inter firm diffusion. It is also assumed that each establishment
is an autonomous decision making unit5, which we label the firm, although it might be part
5 This is in line with several empirical inter firm studies that have underlined the role played by establishment characteristics in the diffusion of a new technology (Rose and Joskow (1990), Oster (1982), Colombo and Mosconi (1995) Astebro (2002), etc.).

9
of a group, but later test whether group membership affects the extent of intra firm
diffusion.
Although intra firm data is only available for 1993, the CURDS survey was undertaken on
the same sample of firms in 1981, 1986 and 1993 and contains information on the inter
firm pattern of ownership and use over time of five technologies including CNC machine
tools. It contains longitudinal data on establishment characteristics, such as employment in
1970-1975, 1981, 1985 and 1993, year of start-up, financial position, information on R&D,
whether the firm is export oriented, as well as on other managerial and technological
characteristics of the firm. In particular it contains information on the date at which each
firm in the sample first adopted CNC (and the other four technologies). By 1993 the
proportion of potential users (excluding 59 of the 343 who consider that the technology is
not appropriate to their production activities) that have adopted CNC is about 80%, 222
having adopted CNC at or before 1993, of whom 212 were still users in 1993 (i.e. 10 were
no longer users by 1993).
The CURDS survey measures intra firm diffusion by the percentage of the machine tool
stock of the firm that in 1993 incorporated CNC. Of the 212 users in 1993, only 1 was
using the technology at the 100% level. In Figure 2 we illustrate the full pattern of intra
firm diffusion in 1993 by plotting the extent of diffusion (where 0 represents that the firm
is no longer a user) against the share of adopters over the 222 adopters. The proportion of
the machine tool stock of the establishment that incorporates CNC is less than 20 per cent
for 52 per cent of the adopting firms and only 7 per cent have a proportion in excess of 70
per cent.
Figure 2. The intra-firm diffusion of CNC in 1993
Source: CURDS data set
02
46
810
1214
16
0 1-5
6-10
11-15
16-20
21-25
26-30
31-35
36-40
41-45
46-50
51-55
56-60
61-65
66-70
71-75
76-80
81-85
86-90
91-95
96-99
100
Level of ow nership (%)
Prop
ortio
n of
use
rs (%
)

10
This data shows that (i) even though many of the sample firms have been using CNC for a
number of years only a very small proportion have attained intra firm diffusion
approaching 100% by 1993; (ii) there are considerable differences across firms in the
extent to which the new technology has been diffused by 1993; (iii) despite CNC having
been on the market for more than twenty years and about 80% of the firms having already
adopted it, in 1993 new users, ex- users and non adopters still co-exist.
The sample that is available to test our model is restricted to the single cross section of
firms for whom we have data upon the extent of intra firm diffusion in 1993. Of these the
model only applies to the current users defined as those adopters that are currently
undertaking the process of intra firm technology transfer, using both new and old
technology to some extent at that date, and have thus started but not “completed” the
diffusion process. However, to use only that part of our data that relates to such firms can
cause bias in the estimates because, (i) for a firm to be involved in intra firm diffusion is
conditional on having become an adopter sometimes in the past (in or by 1993), (ii) it
would ignore the truncation of the adoption probability distribution in 1993 and, (iii) it
would exclude information relating to those adopting firms in the sample that are currently
using technology at ‘extreme levels’ 0 or 100%. After experimentation with different
model specifications to account for the possible bias generated by truncation, censoring
and sample selection, we decided to econometrically eliminate the potential bias by using
the two-stage Heckman (1979) procedure but with some modifications (see for further
details Battisti, 2000 and 2003). The first stage models the adoption decision and the
characteristics of the adopters in or by 1993. The resulting inverse Mills ratio (see Greene,
1993 and Maddala, 1994) is then included to correct for the sample selection bias due to
the selection of current users in a second stage model of the extent of firm usage by those
firms still diffusing in or by 1993. The two stage model was estimated using for the first
stage the whole sample of eligible firms for which data was available (max 149)6 and
selecting at the second stage only the sample of current users. Clearly, the selection
criterion equation is essentially inter firm diffusion modelling while the technology
replacement equation in the second step is intra firm diffusion modelling.
6 We included among the explanatory variables in the first stage estimates indicators, the firm’s date of adoption, the price of CNC, the share of firms in the industry using CNC, firm size, management characteristics, and characteristics of the firm’s production system. Further details on the first stage modeling are available on the journal's supplementary material web site: http://www.mgmt.purdue.edu/centers/ijio/eo/eosup.htm

11
4. THE INTRA FIRM DIFFUSION EQUATION
Allowing for sample selection issues the second stage ‘corrected’ intra firm diffusion
equation becomes:
(8) log[knt/ 100-knt] = log(αnt / αot ) + log (cot /cnt ) + log f(Et) + IMRt + vit
where IMRt is the inverse Mills ratio and vit is a stochastic error. Equation (8) has been
estimated using the sample of adopting firms for whom 0 <kn<100 in 1993. In Table 1 we
provide the summary definitions of the remaining variables included in the model
specification. In Table 2 we present our preferred estimates of the intra firm diffusion
equation. Such estimates, including the correction for Logit sample selection have
reasonable explanatory power (R2 = 0.68 ; R2 corrected = 0.40) and the residuals are well
behaved. The sample size, after removing observations with missing data (from both steps
of the model) and excluding non adopters and extreme users, comprised 82 firms. In this
section we discuss in more detail the variables included in the estimating equation, the
coefficients estimates pertaining thereto and their significance.
4. 1 Sample selection
The inverse Mills ratio (IMRt) has been included to compensate for sample selection bias
generated from the selection of the set of current users form the eligible firms. Its effects
is not significant and thus although the sample selection correction was important on
conceptual grounds it is not found to be of statistical significance. Moreover, as the
selection criterion equation was essentially inter firm diffusion modelling, this would
suggest that the decision to first adopt a new technology is a necessary but not a sufficient
condition for extensively using such technology (see Battisti 2000, 2003 and Battisti and
Stoneman 2003).
4.2. User costs of capital
The user cost of capital for technology j may be written as (9).
(9) log( cjt ) = log [(r + δ + 1/2 σ2 β)qjt - dqjt)] j = old, new

12
Taking (-dqjt) outside the square bracket7 and making use of the approximation log(1+ x)=
x, this can be rewritten as (10) :
(10) log cjt = log (-dqjt ) + [(r + δ + 1/2 σ2 β)qit /(-dqjt)]
Using (10) yields (11)
(11) log (cot/cnt) = log (-dqot ) - log (-dqnt ) - (r +δ +1/2 σ2 β) [qnt /(-dqnt)-qot /(-dqot)]
where qjt is the price of technology j in time t and dqjt is the expected change in the price
of technology j between t and t + 1. As all firms will face the same capital good prices,
cross sectional variation in log cot -log cnt can only arise from differences across firms in
r, δ ,σ2 and β (but as we are unable to measure any of these indicators we do not pursue
this line of argument) or from differences across firms in dqjt, the expected change in the
price of capital good j.
There is no obvious guide as to how to model price expectations formation although there
is some presumption that rational expectations are to be preferred. We therefore use a
slight modification of the naïve extrapolative expectation models (e.g. Ferber 1953,
Maddala, 1992) and test the hypothesis of rationality against the hypothesis of imperfect
information assuming that the relationship between expected price (dqejt) and observed
prices (dqjt) could be written as:
(12) dqejt = γj dqjt
According to equation (11) γj=1. This means that, at each moment in time, the change in
the expected price equals the observed change (dqejt=dqjt) and that the firm operates under
perfect foresight with perfect information about future prices (rational expectations). We
leave the empirics to determine whether γj is equal to 1 and therefore whether the rational
expectation hypothesis can be accepted. In order to introduce some cross sectional
variation we assume that expected changes between t and t+1 in the price of technology j
by the firm i will equal the annual average realised change in the price of technology j
since the date of first acquisition by the firm i of the new technology (t0i). It is thus being
assumed that price expectations are based upon the firm specific experience of price
7 In (14) it is useful to remember that the real price of new technology tends to fall over time and thus as logs
13
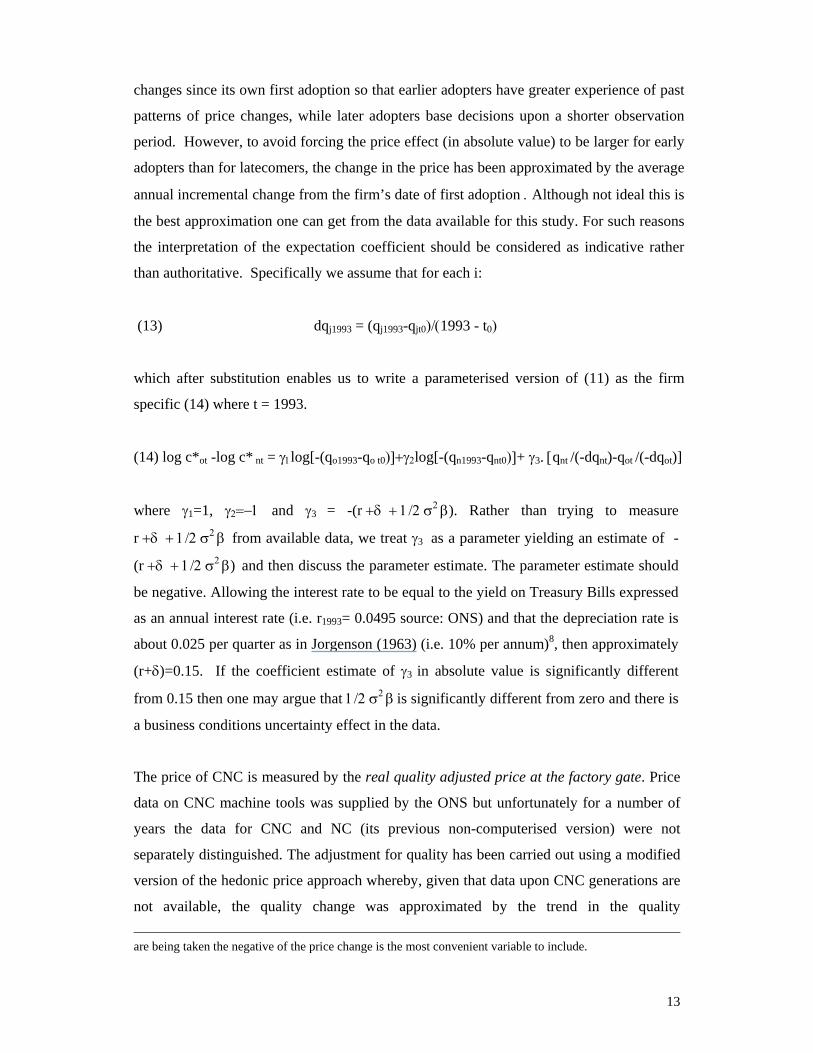
changes since its own first adoption so that earlier adopters have greater experience of past
patterns of price changes, while later adopters base decisions upon a shorter observation
period. However, to avoid forcing the price effect (in absolute value) to be larger for early
adopters than for latecomers, the change in the price has been approximated by the average
annual incremental change from the firm’s date of first adoption . Although not ideal this is
the best approximation one can get from the data available for this study. For such reasons
the interpretation of the expectation coefficient should be considered as indicative rather
than authoritative. Specifically we assume that for each i:
(13) dqj1993 = (qj1993-qjt0)/(1993 - t0)
which after substitution enables us to write a parameterised version of (11) as the firm
specific (14) where t = 1993.
(14) log c*ot -log c* nt = γ1log[-(qo1993-qo t0)]+γ2log[-(qn1993-qnt0)]+ γ3. [qnt /(-dqnt)-qot /(-dqot)]
where γ1=1, γ2=−1 and γ3 = -(r +δ + 1/2 σ2 β). Rather than trying to measure
r +δ + 1/2 σ2 β from available data, we treat γ3 as a parameter yielding an estimate of -
(r +δ + 1/2 σ2 β) and then discuss the parameter estimate. The parameter estimate should
be negative. Allowing the interest rate to be equal to the yield on Treasury Bills expressed
as an annual interest rate (i.e. r1993= 0.0495 source: ONS) and that the depreciation rate is
about 0.025 per quarter as in Jorgenson (1963) (i.e. 10% per annum)8, then approximately
(r+δ)=0.15. If the coefficient estimate of γ3 in absolute value is significantly different
from 0.15 then one may argue that 1/2 σ2 β is significantly different from zero and there is
a business conditions uncertainty effect in the data.
The price of CNC is measured by the real quality adjusted price at the factory gate. Price
data on CNC machine tools was supplied by the ONS but unfortunately for a number of
years the data for CNC and NC (its previous non-computerised version) were not
separately distinguished. The adjustment for quality has been carried out using a modified
version of the hedonic price approach whereby, given that data upon CNC generations are
not available, the quality change was approximated by the trend in the quality
are being taken the negative of the price change is the most convenient variable to include.

14
improvements of computers outsourced from the study of Triplett (1989) and Stoneman et
al. (1992). Further details can be found in Battisti, 2000. The price of old technology, here
defined as the set of all non-CNC technologies in use by the firm, is measured by the real
price index of Gross Domestic Fixed Capital Formation sourced from the National
Accounts. Both prices are measured as indices.
Table 1. Determinants of intra-firm technology diffusion: variable definitions and
expected sign DEPENDENT Variable Log[knit/100-knit ] • Log ratio of the percentage of new technology (knit) over the old technology (100-knit)
(Expected Sign) PRICE Effects
LDQCNC t
• Log [-(qo1993-qot0) ]. Log of negative of change in real price of CNC between 1993 and date of first adoption. ( - )
LDQTOT t
• Log [-(qn1993-qnt0)]: Log of negative of change in real price of old capital, measured by real price of Gross Domestic Fixed Capital Formation, between 1993 and date of first adoption (+)
GQCNCTOTt • qnt/(-dqnt)-qot/(-dqot) Difference between inverse growth of prices of CNC and old capital between 1993 and date of first adoption ( - )
RANK EFFECTS Employment LEMPzt • Log number of employees times size class dummy, z =small (<50) , medium ( 50 – 200), large (>200)
weighted average 1986-1993 (+) Age LAget • Log years from start-up (1993-startup year) ( +/- ) R&D R&Dt • In House R&D dummy (yes=1, no=0) (+) Ownership
GROUPt • Dummy (1 =Group establishment ; 0 = Independent) (+) Export
Ex20/50t • Dummies on Exports (1 if >20% of output ; 0=otherwise) ( +/- ) Managerial Innovation
USERMIJt • Dummy (1=Yes; 0= No), user 1993 of managerial innovation J , J=CAPM, JIT,TQM;BS5750-ISO900 (Tech specific) Complementary and/or substitute technologies
USERTJt • Dummy for user of technology J (1=Yes ; 0= No ) of J=CAD; Microprocessors in products (MProd); Microprocessors in Processes (Micro); CoT; NC; etc in/by 1993-1 (Tech specific)
Production System Characteristics
USERPSIi • Dummy for Firm Prod. System (Yes=1; 0= otherwise) (+/-) i = 1 (Engineering to order); 2 (Make to order), 3 (Make to stock), 4 (Job shop), 5 (Mixed) LBATCH • Log average batch size (Tech specific)
EPIDEMIC EFFECTS LTIMEt • Log years from firm first adoption of CNC up to 1993 (‘93-date of first adoption) ( +)
LSHi • Log Within Industry i (i=1,2,...) share of adopters at time of the firm first adoption (+/-)
SAMPLE SELECTION FACTOR IMR • Inverse Mills ratio
Astebro (1995 and 2000) argues that in some cases these “hardware” prices are not the
most relevant. He shows that in the case of soft technologies such as spreadsheets it is the
8 This figure is also very similar to that used by Shapiro (1986) in his empirical study on investment and the cost of capital. Specifically he uses an average depreciation rate of 0.024 a quarter.

15
employees’ opportunity cost of switching, rather than the acquisition cost that is
important. In his inter firm study on the adoption of CNC and CAD specifically separates
out capital and non capital costs of adoption. We are in some sympathy with that approach
however our data does not allow us to pursue it. We would also argue that for some
technologies (such as CNC) the non-capital costs can be seen as switching costs that the
firm has to face at the time of first adoption but do not necessarily impact upon the
decision to further invest in a new technology and are thus not especially relevant to intra
firm diffusion.
Table 2. The intra firm diffusion equation Variable Coefficient Standard Error t-test P-value LDQCNC -1.5935 0.6713 -2.374 0.0176 LDQTOT 0.3684 0.8300 0.444 0.6571 GQCNCTOT -0.4567 0.1366 -3.342 0.0008 LEMPSMALL 0.4536 0.2075 2.186 0.0288 LEMPMEDIUM 0.3215 0.1267 2.538 0.0112 LEMPLARGE 0.2496 0.1081 2.308 0.0210 LAGE -0.1926 0.2624 -0.734 0.4629 R&D 1.1135 0.3525 3.159 0.0016 EX20 -0.6674 0.2908 -2.295 0.0218 GROUP 0.6042 0.2295 2.632 0.0085 USERCAPM 0.0657 0.2681 0.245 0.8064 USERJIT -0.1989 0.2612 -0.762 0.4462 USERTQM 0.0765 0.2850 0.269 0.7883 USERBS5750 0.3260 0.2702 1.206 0.2278 USERCAD 1.1337 0.2996 3.784 0.0002 USERMPROD -0.8521 0.2825 -3.017 0.0026 USERMICRO 0.6343 0.3214 1.973 0.0485 USERCOT -0.2497 0.3938 -0.634 0.5261 USERNC 0.1512 0.3360 0.450 0.6526 LBATCH 0.0418 0.0665 0.628 0.5297 USERPS5 0.9882 1.002 0.987 0.3238 USERPS2 0.4958 0.3008 1.648 0.0993 USERPS3 -0.4394 0.4039 -1.088 0.2766 USERPS4 0.6153 0.5144 1.196 0.2317 LTIME -0.0698 0.6677 -0.104 0.9168 LSH2 -1.8426 2.8232 -0.653 0.5140 LSH3 3.4411 5.9581 0.578 0.5636 LSH5 1.5143 1.5149 1.000 0.3175 LSH678 -3.3421 2.0936 -1.596 0.1104 LSH10 3.4941 2.3016 1.518 0.1290 LSH12 -2.4173 4.1918 -0.577 0.5642 LSHGROUP -1.7018 2.3578 -0.722 0.4704 IMR 0.5972 0.6184 0.966 0.3341
Number of Observations = 82 Degr of freedom = 49 R-squared = 0.68 Adjusted R-squared = 0.40 F[ 32,49] = 2.48 ; Prob value = 0.002 Log-L = -74.11 ; Restr. Log-L = -134.72 Amemiya Pr. Crt.= 0.84 ; Akaike Info. Crt.=2.61 Standard error corrected for selection 0.69

16
The results indicate that the expected change in the price of CNC (LDQCNC = log [-
(qo1993-qot0)]) as predicted, carries a significant and negative coefficient. However, the
expected change in the price of old technologies (LDQTOT = log[-(qn1993-qnt0)]) although
carrying a coefficient of the expected positive sign is not significant. Measuring this
variable by the price of GDFCF is not ideal and thus we also experimented using the price
index of Plant and Machinery, but the results did not change significantly. The model
predicts that the coefficients on these variables should be plus and minus unity
respectively, and Wald tests do not reject these hypotheses at 5% significance (χ2LDQTOT =
0.57903; p=0.45 ; χ2LDQCNC = 0.781758; p=0.38).
The third price variable (GQCNCTOT = qnt /(-dqnt)-qot /(-dqot)) measures the differences in
the inverse growth rates of the prices of new and old technology and is expected to carry a
negative coefficient equal to -(r +δ + 1/2 σ2 β). The estimated coefficient is negative as
expected and also significant. We have argued that if the coefficient differs in value from
– 0.15 then there may be a quantitatively significant impact of revenue uncertainty upon
intra firm diffusion. The coefficient estimate is -0.457 which is more than two standard
errors different from –0.15 (t GQCNCTOT = -2.244 see also the Wald test χ2GQCNCTOT
=5.0355; p= 0.029) and thus one may safely conclude that revenue uncertainty has slowed
the intra firm diffusion of CNC machine tools.
4.3. Rank effects
In the diffusion equation the term in log (αn/αo) captures differences in the “productivity”
of new and old technologies across firms i.e. rank effects, and may be considered as firm
and (old) technology specific. As our data is a single cross section sample such rank effects
are of the essence in the empirical analysis. The choice of variables that we include as
determinants of (αn/αo) is largely based on the findings in the literature on inter firm
diffusion, but also partly by a priori reasoning and partly by data availability.
Early work of Mansfield (1968), as well as Hannah and MacDowell (1984), Karshenas
and Stoneman (1993), Saloner and Shephard (1995), Noteboom (1993), Colombo and
Mosconi (1995), Oster (1982) and more recently Astebro (2002) finds that size of the
establishment shows a significant and usually positive impact upon inter-firm technology
adoption. After experimentation, in order to account for possible non-linearities we
include firm size represented by a set of size class specific variables (LEMPsmall,
LEMPmedium, LEMPlarge). Moreover, to account for possible endogeneity we define

17
them as the log of the weighted smoothing average number of employees between 1986
and 1993 if the firm is in the size class (i.e. small medium or large) and zero otherwise.
The three size variables all carry positive coefficients and are significant. The coefficients
decline with size (βLEMPsmall = 0.454; βLEMPmedium = 0.321, βLEMPlarge = 0.250) therefore the
elasticity is lower the larger the firm, but it should be noted that these variables are defined
as firm size (in log number of employees) times a size class dummy. Thus the estimates
indicate that that within each size class, diffusion is greater for larger firms (diffusion
increases with firm size in a size class). Therefore, using the data on the average firm size
in the sample for each size class (0.4377, 1.4977 and 2.7538) at these averages the
predicted contributions to the dependent variables are 0.198, 0.48 and 0.688 for small
medium and large firms and thus on average larger firms will diffuse faster.
The Schumpeterian hypothesis that formalised R&D exerts a positive impact upon the use
of a technology is in line with a later study by Cohen and Levinthal (1989) who illustrate
that firms which spend upon R&D are more easily able to assimilate new technology. Due
to the high number of missing values in the data set on the R&D spending, this variable is
introduced as a dummy that takes the value 1 if in 1993 firms do in house R&D and zero
otherwise It is found that doing R&D in house impacts positively and significantly on
intra firm diffusion (βR&D=1.11).
The age of the establishment in logs (LAGE) is also included on the basis that older firms
generally have accumulated knowledge that allows them to assess new technologies better
than younger firms do. However, the opposite might also be true. Earlier studies of inter
firm effects of age are Baldwin et al. (1998), Dunne (1994), Little and Triest (1996) and
Noteboom (1993). We find that (LAGE) is not significant as a determinant of intra firm
diffusion.
In addition we consider variables that reflect: (i) whether in 1993 the firm is export
intensive, i.e. exports >20% of its output (EX20) and find that Export intensity carries a
negative coefficient indicating that those firms exporting more than 20% of their output
use CNC less extensively than those exporting less (βEX20= -0.667); (ii) whether the firm,
as an establishment, belongs to an industrial group in 1993 (dummy: GROUP) reflecting
the possible impact of both internally sourced information relating to technology
performance and technological competencies (and will also pick up whether there are

18
different degrees of autonomy for firms that are independent as opposed to being part of a
group) (see Cainarca et al., 1990), Dunne 1994, and Astebro, 2002): the estimated
coefficient is positive and significant.
Characteristics of the production system may also affect the adoption of a new
technology. For example, Colombo and Mosconi (1995), suggest that plants with no job
shop are more likely to pioneer adoption of flexible manufacturing and assembling
systems, while plants with a job shop will perform better as regards the introduction of
NC or CNC and also computer aided and engineering equipment. Data on the type of
production organisation available in the CURDS data set has been specified as a series of
dummy variables such as: engineer to order (USERPS1), make to order (USERPS2),
make to stock (USERPS3), job shop (USERPS4), and mixed (USERPS5). The log of
average batch size (LBATCH) is also included as an explanatory variable.
Interdependencies and complementarities between technologies are also believed to play a
relevant role in diffusion, based upon the principle that the firm’s capabilities reflect its
stock of knowledge and technical and managerial skills, all of which are enhanced by the
use of previous technologies (Baldwin et al., 1998, Astebro, 2002, Stoneman and
Toivanen, 1997, Stoneman and Kwon, 1994, Colombo and Mosconi, 1995).
Consequently, a series of dummy variables sourced from the CURDS data set is here used
to indicate previous adoption of complementary and substitute technologies such as
numerical control (USERNC), carbide tools (USERCOT), microprocessors in processes
(USERMICRO), computer aided design (USERCAD), and microprocessors incorporated
in products (USERMPROD).
As emphasised by the managerial literature, managerial as well as organisational
innovation can generate complementarities from the use of other existing technologies and
speed up the use of the advanced technology (see for example Jaikumar, 1986, Colombo
and Mariotti 1987, Cainarca et al. 1990, Colombo and Mosconi 1995, Caroli and Van
Reenen, 2001 for empirical evidence in support of this hypothesis). This is tested via the
inclusion of dummy variables indicating whether, by 1993, the firm has adopted:
Computer Aided Production Management systems (USERCAPM); Total Quality
Management principles (USERTQM) and Just in Time principles (USERJIT) and whether
the firm has been awarded the BS5750/ISO9000 accreditation (USERBS5750). Of these
variables representing use of other advanced technologies and managerial innovations, the
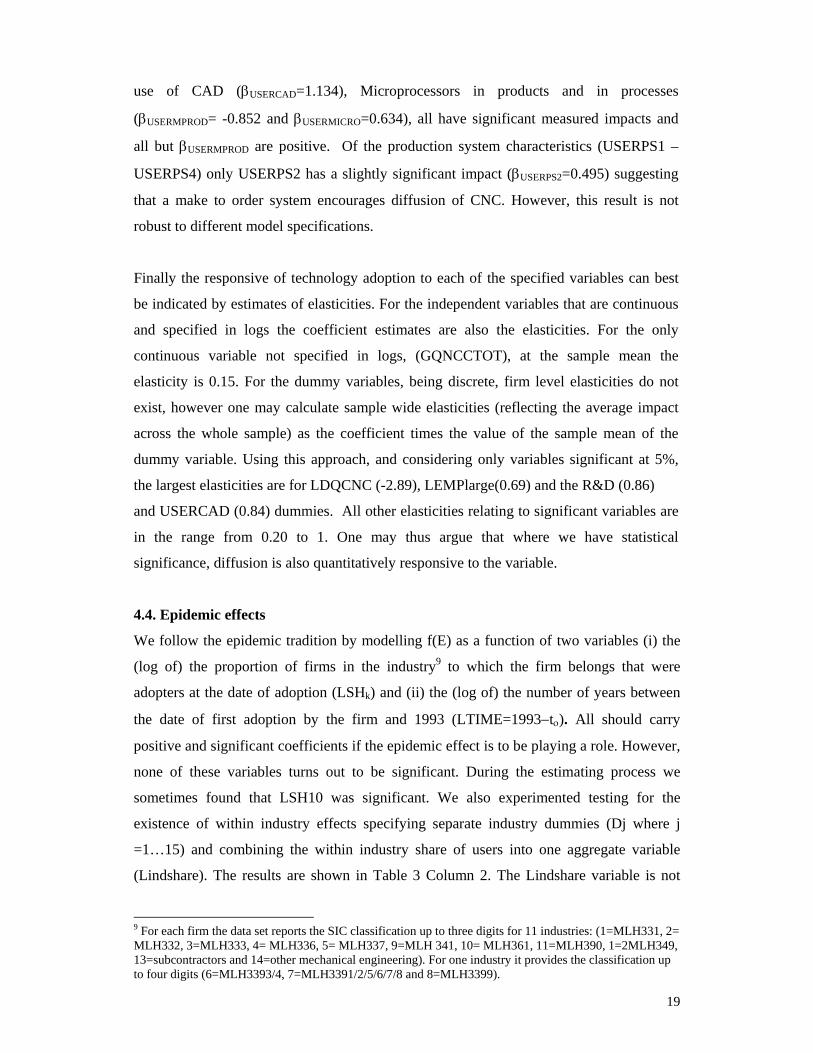
19
use of CAD (βUSERCAD=1.134), Microprocessors in products and in processes
(βUSERMPROD= -0.852 and βUSERMICRO=0.634), all have significant measured impacts and
all but βUSERMPROD are positive. Of the production system characteristics (USERPS1 –
USERPS4) only USERPS2 has a slightly significant impact (βUSERPS2=0.495) suggesting
that a make to order system encourages diffusion of CNC. However, this result is not
robust to different model specifications.
Finally the responsive of technology adoption to each of the specified variables can best
be indicated by estimates of elasticities. For the independent variables that are continuous
and specified in logs the coefficient estimates are also the elasticities. For the only
continuous variable not specified in logs, (GQNCCTOT), at the sample mean the
elasticity is 0.15. For the dummy variables, being discrete, firm level elasticities do not
exist, however one may calculate sample wide elasticities (reflecting the average impact
across the whole sample) as the coefficient times the value of the sample mean of the
dummy variable. Using this approach, and considering only variables significant at 5%,
the largest elasticities are for LDQCNC (-2.89), LEMPlarge(0.69) and the R&D (0.86)
and USERCAD (0.84) dummies. All other elasticities relating to significant variables are
in the range from 0.20 to 1. One may thus argue that where we have statistical
significance, diffusion is also quantitatively responsive to the variable.
4.4. Epidemic effects
We follow the epidemic tradition by modelling f(E) as a function of two variables (i) the
(log of) the proportion of firms in the industry9 to which the firm belongs that were
adopters at the date of adoption (LSHk) and (ii) the (log of) the number of years between
the date of first adoption by the firm and 1993 (LTIME=1993−tο). All should carry
positive and significant coefficients if the epidemic effect is to be playing a role. However,
none of these variables turns out to be significant. During the estimating process we
sometimes found that LSH10 was significant. We also experimented testing for the
existence of within industry effects specifying separate industry dummies (Dj where j
=1…15) and combining the within industry share of users into one aggregate variable
(Lindshare). The results are shown in Table 3 Column 2. The Lindshare variable is not
9 For each firm the data set reports the SIC classification up to three digits for 11 industries: (1=MLH331, 2= MLH332, 3=MLH333, 4= MLH336, 5= MLH337, 9=MLH 341, 10= MLH361, 11=MLH390, 1=2MLH349, 13=subcontractors and 14=other mechanical engineering). For one industry it provides the classification up to four digits (6=MLH3393/4, 7=MLH3391/2/5/6/7/8 and 8=MLH3399).

20
significant and of the industry dummy variables only that for industry 10 shows
significance. As it is possible that epidemic effects are insignificant because their true
impact is captured by other time-based variables, a previous commentator suggested that
we might include both industry specific effects and industry specific epidemic effects.
Table 3. The intra firm diffusion equation, further estimates (1) (2) (3) Coefficient (s.e.) Coefficient (s.e.) Coefficient (s.e.) LDQCNC -2.213 (0.648) -1.668 (0.708) -1.655 (0.698) LDQTOT 0.741 (0.798) 0.443 (0.895) - GQCNCTOT -0.497 (0.130) -0.458 (0.142) -0.369 (0.149) LEMPSMALL 0.561 (0.213) 0.426 (0.222) 0.421 (0.188) LEMPMEDIUM 0.246 (0.132) 0.306 (0.129) 0.350 (0.127) LEMPLARGE 0.185 (0.128) 0.234 (0.111) 0.248 (0.107) LAGE -0.032 (0.266) -0.109 (0.293) - R&D 1.551 (0.362) 1.255 (0.366) 1.095 (0.319) EX20 -0.711 (0.292) -0.667 (0.318) -0.607 (0.276) GROUP 0.577 (0.262) 0.568 (0.236) 0.314 (0.228) USERCAPM 0.160 (0.270) 0.058 (0.294) - USERJIT -0.196 (0.318) -0.094 (0.285) - USERTQM 0.348 (0.316) -0.010 (0.302) - USERBS5750 0.663 (0.333) 0.259 (.295) - USERCAD 1.319 (0.310) 1.087 (0.320) 0.845 (0.294) USERMPROD -0.707 (0.295) -0.829 (0.285) -1.026 (0.249) USERMICRO 0.732 (0.354) 0.635 (0.322) 0.605 (0.274) USERCOT -0.597 (0.451) -0.258 (0.462) - USERNC -0.069 (0.359) 0.252 (0.379) - LBATCH 0.007 (0.072) 0.040 (0.070) - USERPS5 0.236 (0.982) 0.858 (1.017) - USERPS2 0.859 (0.316) 0.445 (0.307) - USERPS3 -0.404 (0.399) -0.452 (0.412) - USERPS4 0.621 (0.545) 0.644 (0.529) - LTIME 0.070 (0.651) 0.063 (0.709) - LSH2 -0.618 (3.007) - - LSH3 3.923 (6.494) - - LSH5 1.082 (1.466) - - LSH678 -2.098 (2.255) - - LSH10 5.843 (2.268) - - LSH12 -6.405 (4.251) - - LSHGROUP -0.815 (2.357) - - LAVGRT -0.0637(0.191) - - USERROBOT 0.838 (0.482) - - D1 - -0.359 (0.222) - D2 - -0.190 (0.668) - D3 - -0.680 (0.910) - D5 - -1.137 (1.966) - D6 - 0.331 (0.847) - D7 - -0.301 (0.670) - D8 - 0.118 (0.562) - D9 - -0.486 (0.960) - D10 - -1.168 (0.562) - D11 - -0.329 (0.708) - D13 - -0.717 (1.217) - D15 - -0.683 (1.379) - LIndshare - 0.394 (6.779) - IMR -0.205 (0.647) 0.673 (0.670) 0.188 (0.549) Observations 68 82 101 Degr of freedom 33 43 89 R-squared 0.71 0.63 0.52 Adj. R-squared 0.41 0.30 0.40 F,[Prob value] 2.37 [0.007] 1.91 [0.020] 3.05 [0.001] Log-L -46.74 -67.72 -121.4 Restr. Log-L -113.38 -134.72 -159.79 Amemiya Pr. Crt. 0.722 0.859 1.087 Akaike Info. Crt. 2.404 2.603 2.915 S.e.corrected for selection
0.69 0.79 0.95

21
We thus estimated the model with separate industry dummies and a variable accounting for the
within industry shares of users in aggregate. While the latter variable was never significant, one of
the industry dummies was significant (all the other estimates remaining significantly unchanged).
Despite the industry samples being small, this provides little evidence that there exist within
industry effects or within industry epidemic effect. Overall these results suggest to us that there are
no significant epidemic effects a la Mansfield.
We also experimented with the inclusion of a number of other variables available in the
CURDS dataset . We report one such estimate in Table 3 column 1 where the information
on the real firm average turnover (AVGTURN= Log weighted average of real turnover
1990-93 per employee) as well as the adoption status of Robots (USEROBOT) have been
included. However, AVGTURN, similar to the other financial indicators did not work at all
well. Moreover, AVGTURN (as well as ROBOT) was characterised by a high number of
missing values that further reduced the sample size to 68. These findings have led us to
omit further discussion of such results. Finally, we observe that our initial estimates have a
smaller small sample size than we would wish, due to the high number of missing values.
To overcome this to some degree and to check the robustness of our parameters estimates,
we have generated some more parsimonious estimates with a smaller range of independent
variables and as a result a larger sample size. The parsimonious version of model (9) is
reported in table 4 column 3. In the reduced model the sample size increases to 101
however the parameter estimates do not change significantly. We have preferred to focus
our presentation on the unrestricted model, it being more informative than its reduced
version.
5. DISCUSSION
A prime objective of this paper has been to develop and test an approach to modelling
intra firm diffusion based upon differences across firms (and potentially) changes over
time in the profitability of adoption. This approach indicates that rank effects will be
important in determining the use of technology at a point in time. The modelling explicitly
incorporates uncertainty (about future innovations as well as future financial and market
conditions) and attempts have been made to introduce some price effects. To be
encompassing an epidemic effect has also been introduced. The findings generally support
a profitability based model of intra firm diffusion.
22
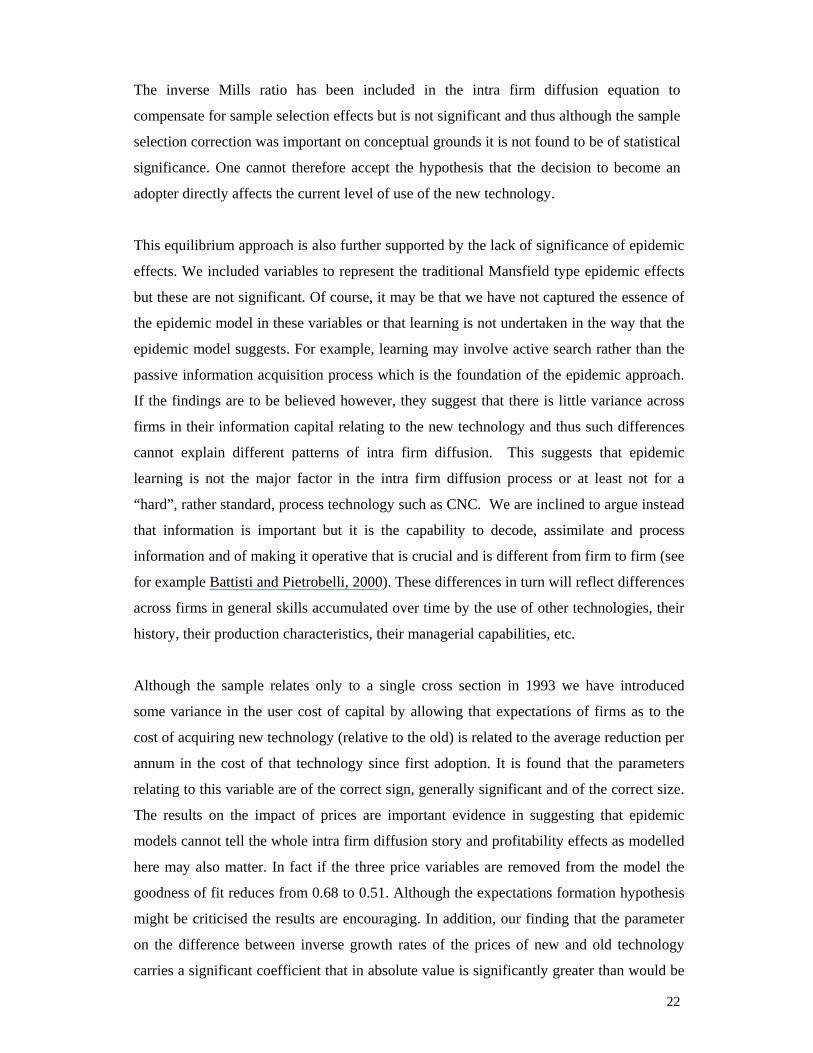
The inverse Mills ratio has been included in the intra firm diffusion equation to
compensate for sample selection effects but is not significant and thus although the sample
selection correction was important on conceptual grounds it is not found to be of statistical
significance. One cannot therefore accept the hypothesis that the decision to become an
adopter directly affects the current level of use of the new technology.
This equilibrium approach is also further supported by the lack of significance of epidemic
effects. We included variables to represent the traditional Mansfield type epidemic effects
but these are not significant. Of course, it may be that we have not captured the essence of
the epidemic model in these variables or that learning is not undertaken in the way that the
epidemic model suggests. For example, learning may involve active search rather than the
passive information acquisition process which is the foundation of the epidemic approach.
If the findings are to be believed however, they suggest that there is little variance across
firms in their information capital relating to the new technology and thus such differences
cannot explain different patterns of intra firm diffusion. This suggests that epidemic
learning is not the major factor in the intra firm diffusion process or at least not for a
“hard”, rather standard, process technology such as CNC. We are inclined to argue instead
that information is important but it is the capability to decode, assimilate and process
information and of making it operative that is crucial and is different from firm to firm (see
for example Battisti and Pietrobelli, 2000). These differences in turn will reflect differences
across firms in general skills accumulated over time by the use of other technologies, their
history, their production characteristics, their managerial capabilities, etc.
Although the sample relates only to a single cross section in 1993 we have introduced
some variance in the user cost of capital by allowing that expectations of firms as to the
cost of acquiring new technology (relative to the old) is related to the average reduction per
annum in the cost of that technology since first adoption. It is found that the parameters
relating to this variable are of the correct sign, generally significant and of the correct size.
The results on the impact of prices are important evidence in suggesting that epidemic
models cannot tell the whole intra firm diffusion story and profitability effects as modelled
here may also matter. In fact if the three price variables are removed from the model the
goodness of fit reduces from 0.68 to 0.51. Although the expectations formation hypothesis
might be criticised the results are encouraging. In addition, our finding that the parameter
on the difference between inverse growth rates of the prices of new and old technology
carries a significant coefficient that in absolute value is significantly greater than would be

23
expected if revenue uncertainty did not impact upon intra firm diffusion, indicates that such
uncertainty does play a role in the intra firm diffusion process. It has long been
hypothesised that uncertainty affects the diffusion process but rarely is the effect explicitly
incorporated as here and even more rarely is the effect quantified.
The profitability based approach indicates that the firm characteristics (rank effects) will
impact upon intra firm diffusion. The importance of rank effects is a common property of
the recent inter firm literature. Firm size matters and export intensity also impacts
significantly, albeit negatively (although there is always the danger that there are problems
with directions of causality in such findings). If the firm does R&D it is also likely to have
higher levels of intra firm diffusion. This suggests that a faster diffusing firm may be
innovative in several dimensions. This is perhaps reinforced by the findings that the
adoption of several other technologies and management techniques also impacts positively,
in most cases when significant, on the diffusion process. This effect may reflect
technological complementarities but is just as likely to suggest again that innovative firms
are innovative in all dimensions and not just some, and that the higher are the core
competencies (and not just the knowledge about the new technologies) of the firm in
processing information and in making it operative, the faster diffusion will be.
6. CONCLUSION
In the overall diffusion of new technology intra firm diffusion is as important as inter firm
diffusion. We have illustrated above that the intra firm process of technology transfer is a
long one, with new and old technologies co- existing for a long period of time and very
heterogeneous across the sample. However, the study of intra firm diffusion has been
relatively ignored in the past and the literature that does exist tends to over rely upon
information spreading or epidemic type models.
In this paper an alternative profitability based approach to modelling intra firm diffusion is
proposed and tested upon data relating to the intra firm diffusion of CNC machine tools in
the UK engineering and manufacturing sector. The model predicts that for an individual
firm the replacement process of an old with a new technology is driven by the relative
(new vs. old) user costs of capital (allowing for price expectations and uncertainty) with
differences across firms reflecting their characteristics (rank effects), know-how and firm
specific skills in efficiently combining and using their production inputs. An epidemic

24
element has also been incorporated to both enable model comparison and to test whether
epidemic learning as suggested by Mansfield still has a role to play.
The empirical analysis, accounting for sample selection bias, truncation and censoring,
does not reject the hypothesis that different user costs are a driving force or that rank
effects matter. A number of firm characteristics are isolated as of special importance
including whether R&D is undertaken, firm size, export intensity and the use of
complimentary technologies and managerial techniques. It is apparent that generally firms
that are innovative in other directions also diffuse faster. There is little support for any
additional epidemic effects as specified by the Mansfield model.
There is further need to analyse intra firm diffusion as it has been much neglected. A basic
reason for this neglect is data availability. Here for example we have used a single 1993
cross section. Panel data would be much preferred and would enable much more realistic
testing of price effects. However, in any analysis of new data sets, the results here suggest
that the epidemic model should no longer be considered the natural approach. A greater
emphasis upon profitability, its changes over time and differences across firms would
seem more appropriate.
REFERENCES
Antonelli, C. (1985), ‘The Diffusion of an Organisational Innovation’, International Journal of Industrial Organization, n.3, 1, 109 –18.
Astebro T. (1995), ‘The Effect of Management and Social Interaction on the Intra-firm Diffusion of Electronic Mail Systems’ IEEE Transactions on Engineering Management, 42: 319-331.
Astebro T. (2002) ‘Non-capital Investment Costs and the Adoption of CAD and CNC in US Metalworking Industries’, RAND Journal of Economics, Winter 2002, Vol.33, No.4, pp.672-688.
Baldwin J R. and M. Rafiquizzaman (1998), ‘The Determinants of the Replacement of Manufacturing Technologies: The Role of Information Acquisition’, manuscript, Micro-Economic Policy Directorate, Industry Canada, pp.1-53.
Battisti G. (2000), ‘The Intra-Firm Diffusion of New Technologies’, PhD Thesis, Warwick University.
Battisti G. and C. Pietrobelli (2000) ‘Intra-Industry Gaps in Technology and Investments in Technological Capabilities: New Firm-Level Evidence’, International Review of Applied Economics, Vol.14, n.2, pp.254-69
Battisti G. (2003) ‘Modelling the Current Outcome of an Irreversible Choice Made Sometimes in the Past. An Application to the Conditional Decision to Further Invest in a New Technology’, American Statistical Association Conference- proceeding, New York, Aug 2002

25
Battisti G. and Stoneman P. (2003) ‘Inter Firm and Intra Firm Effects in the Diffusion of New Process Technologies’, Research Policy, 1622, pp.1-15.
Bertola G. (1998), ‘Irreversible Investment’, Research in Economics, Vol.52, pp. 3-37 Cainarca G., Colombo M. G. and S. Mariotti (1990), ‘Firm Size and the Adoption of
Flexible Automation’, Small Business Economics, Vol.2, pp.129-140. Caroli E. and J. Van Reenen (2001) ‘Skill Biased Organizational Change? Evidence from
a Panel data of British and French Establishments’ Quarterly Journal of Economics, 116, pp 1447 – 1492.
Cohen W. and D. Levinthal (1989), ‘Innovation and Learning: the Two faces of R&D, Economic Journal, Vol.99, pp.569-96.
Colombo M. and R. Mosconi (1995), ‘Complementarity and Cumulative Learning Effects in the Early Diffusion of Multiple Technologies’, The Journal of Industrial Economics, Vol.63, n.11, pp. 13-48.
Colombo M. and S. Mariotti (1987), ‘L’Innovazione di Processo nell’industria Italiana’, L’Industria, Vol.1.
Davies S. (1979), The Diffusion of Process Innovations, Cambridge: Cambridge University Press.
Dixit K. and R. S. Pindyck (1994), Investment under Uncertainty, Princeton University Press, Princeton.
Dunne T. (1994), ‘Plant Age and Technology Use in the U.S. Manufacturing Industries’, RAND Journal of Economics, Vol.25 (Autumn), n.3, pp.488-499.
Ferber R. (1953), The Railroad Shipper’s Forecast, Urbana III: Bureau of Economic Research, University of Illinois.
Farman C., Goldfarb A and Greenstein S (2003), ‘How Did Location Affect Adoption of the Commercial Internet?’, NBER Working Paper, 9979, Cambridge Ma.
Globerman S. (1976), ‘New Technology Adoption in the Canadian Paper Industry’, Industrial Organization Review, vol. 4, pp.5-12.
Greene W. (1993), Econometric Analysis, New York :Macmillan IPG. Grenadier S. R. and A. M. Weiss (1997) ‘Investment in Technological Innovations: An
Option Pricing Approach’ Journal of Financial Economics, Vol. 44, 397-416. Hannah T. H. and J. M. McDowell (1984), ‘The Determinants of Technology Adoption:
the Case of the Banking Firm’, RAND Journal of Economics, Vol.15, pp.328-335. Heckman J. (1979), ’Sample Selection Bias as a Specification Error’, Econometrica,
Vol.47, pp. 153-161. Jaikumar R. (1986), ‘Post-industrial Manufacturing’, Harvard Business Review, Nov-Dec,
pp.69-76. Jorgenson D. W. (1963), ‘Capital Theory and Investment Behaviour’, American Economic
Review, Vol.53, pp.247-59. Karshenas M. and P. Stoneman (1993), ‘Rank, Stock, Order and Epidemic Effects in the
diffusion of new process technologies: an Empirical Model’, RAND Journal of Economics, Vol. 24, n.4, pp. 503-28.
Karshenas M. and P. Stoneman (1995), ‘Technological Diffusion’ in P. Stoneman (ed.) Handbook of the Economics of Innovation and Technological Change, Blackwell, Cambridge.
Levin S. G. , Levin S. L. and Meisel J. B. (1992), ‘Market Structure, Uncertainty and Intra firm Diffusion: The case of Optical Scanners’, Review of Economics and Statistics, Vol. 74, pp.345-350.

26
Little J. S. and R. K. Triest (1996), ‘Technology Diffusion in U.S. Manufacturing: The Geographic Dimension’ in Fuhrer J.C. and J. S. Little (Ed), Technology and Growth. Conference proceedings, Federal Reserve Bank of Boston.
Maddala G. S. (1992), Introduction to Econometrics, Maxwell-Macmillan, Oxford. Maddala G.S. (1994), Limited Dependent and Qualitative Variables in Econometrics,
Econometric Society Monographs, n.3, Cambridge University Press, Cambridge. Mansfield E. (1963a), ‘Intrafirm Rates of Diffusion of an Innovation’, The Review of
Economics and Statistics, Vol. XLV, pp348-359. Mansfield E. (1963b), ‘The Speed of Response of Firms to New Techniques’, Quarterly
Journal of Economics, Vol. 77, n.2, pp. 290-309. Mansfield E. (1968), Industrial Research and Technological Innovation, W.W. Norton,
New York. Nabseth L and Ray G F (1974), ‘Special Presses in Paper-making’ in Nabseth L and Ray
G. F. ed. The Diffusion of new Industrial Processes. An International Study, Cambridge University Press, London.
Noteboom B. (1993), ‘Adoption, Firm Size and Risk of Implementation’, The Economics of Innovation and New Technology, Vol. 2, pp. 203-216.
Oster S. (1982), ‘The Diffusion of Innovation Among Steel Firms: the Basic Oxygen Furnace, The Bell Journal of Economics, Vol.13, pp.45-56.
Reinganum J. (1981a), ‘Market Structure and the Diffusion of New Technology’ Bell Journal of Economics, Vol.14, pp.57-69.
Reinganum J. (1981b), ‘On the Diffusion of New Technology: a Game Theoretic Approach’, Review of Economic Studies, Vol.48, pp.395-405.
Reinganum J. (1981c), ‘Dynamic Games of Innovation’, Journal of Economic Theory, Vol.25, pp.21-41
Romeo A. A. (1975), ‘Interindustry and Interfirm Differences in the Rate of Diffusion of an Innovation’, Review of Economics and Statistics, Vol. 57, pp. 311-19.
Rose N. L. and Joskow P. L. (1990), ‘The Diffusion of New Technologies: Evidence from the Electric Utility Industry’, RAND Journal of Economics, Vol.21, No. 3, pp.354-373.
Rosenberg (1976) ‘On Technological Expectations’, The Economic Journal, 86,pp.523-35. Saloner G. and Shephard A. (1995), ‘Adoption of Technologies with Network Effects: an
Empirical Examination of the Adoption of Automated Teller Machines’, Rand Journal of Economics, Vol. 26, (3), 479-501.
Schenk W (1974), ‘Continuous Casting of Steel’ in Nabseth L and Ray G. F. ed., The Diffusion of new Industrial Processes. An International Study’, Cambridge University Press. London.
Shapiro M. (1986), ‘Investment, Output and the Cost of Capital’, Brookings Papers on Economic Activity, Vol.1, pp.111-164.
Stoneman P. (1981), 'Intra Firm Diffusion, Bayesian Learning and Profitability', Economic Journal, Vol. 91, pp.375-388.
Stoneman P. (2001), The Economics of Technological Diffusion, Oxford, Blackwell. Stoneman P. and G. Battisti (1997), ‘Intra-firm Diffusion of New Technologies: the
Neglected Part of Technology Transfer’ International Journal of Industrial Engineering, Vol. 4, n.2, pp. 270-82.
Stoneman, P., Bosworth, D., Leech, D. and McCausland (1992) “Quality adjusting the producer price index for computers in the UK”, Report to the Central Statistical Office, pp. 1-45.

27
Stoneman P. and M. Kwon (1994), ‘The Diffusion of Multiple Process Technologies’, The Economic Journal, Vol. 104, pp.420-431.
Stoneman P. and O. Toivanen (1997), ‘The Diffusion of Multiple Technologies: An Empirical Study’, Economics of Innovation and New Technology, Vol. 5, n.1, pp.1-18.
Triplett (1989) “Price and technological change in a capital good. A survey on computers” in D. Jorgenson and R. Landau (Eds.) Technology and Capital Formation, Cambridge, Mass.: MIT Press.
Weiss A. M. (1994) ‘The Effects of Expectations on Technology Adoption: Some Empirical Evidence’, Journal of Industrial Economics, Vol. XLII, pp.341-36.