The effects of foot position and orientation on inter- and intra-foot coordination in standing...
15
1 23 Experimental Brain Research ISSN 0014-4819 Exp Brain Res DOI 10.1007/s00221-013-3627-9 The effects of foot position and orientation on inter- and intra-foot coordination in standing postures: a frequency domain PCA analysis Zheng Wang, Peter M. C. Molenaar & Karl M. Newell
-
Upload
personal-psu -
Category
Documents
-
view
0 -
download
0
Transcript of The effects of foot position and orientation on inter- and intra-foot coordination in standing...
1 23
Experimental Brain Research ISSN 0014-4819 Exp Brain ResDOI 10.1007/s00221-013-3627-9
The effects of foot position and orientationon inter- and intra-foot coordination instanding postures: a frequency domainPCA analysis
Zheng Wang, Peter M. C. Molenaar &Karl M. Newell

1 23
Your article is protected by copyright and
all rights are held exclusively by Springer-
Verlag Berlin Heidelberg. This e-offprint is
for personal use only and shall not be self-
archived in electronic repositories. If you wish
to self-archive your article, please use the
accepted manuscript version for posting on
your own website. You may further deposit
the accepted manuscript version in any
repository, provided it is only made publicly
available 12 months after official publication
or later and provided acknowledgement is
given to the original source of publication
and a link is inserted to the published article
on Springer's website. The link must be
accompanied by the following text: "The final
publication is available at link.springer.com”.
1 3
Exp Brain ResDOI 10.1007/s00221-013-3627-9
REsEaRch aRtIclE
The effects of foot position and orientation on inter‑ and intra‑foot coordination in standing postures: a frequency domain PCA analysis
Zheng Wang · Peter M. C. Molenaar · Karl M. Newell
Received: 20 February 2013 / accepted: 15 June 2013 © springer-Verlag Berlin heidelberg 2013
Keywords Postural control · Foot position · Foot orientation · center of pressure · coordination
Introduction
In postural control, a destabilizing torque due to gravity must be counter-balanced by a corrective torque exerted by the feet against the base of support (Winter et al. 1998; Massion 1992). as such, postural sway is typically described as the motion of the center of mass (cOM) while the center of pressure (cOPNEt) that represents the position of the weighted average of the collective pressure over the support surface indicates the location of the ground reaction force (Winter et al. 1998). the collective cOPNEt incorpo-rates the contributions of the ground reaction force and the cOP of each foot (Winter 1995). however, the effects of the body weight distribution and the left and right foot cOP (cOPl and cOPR) coordination cannot be isolated through the investigation of the cOPNEt pattern. Moreover, loading over the feet and the cOPl and cOPR patterns might not be similar when humans adapt to different foot positions and orientation while standing (Mizrahi and susak 1989; lac-quaniti and Maioli 1994; Wang et al. 2012). consequently, understanding postural control requires an examination of the inter- and intra-foot coordination dynamics along with the body weight loading in different quiet stances.
Previous studies have shown the independence of the sagittal and frontal plane cOPNEt in the side-by-side stance (Kapteyn 1973). Indeed, most postural studies have examined the cOPNEt motion only in the sagittal plane probably because it has been viewed as less stable or due to the assumption that postural control strategies in these two planes are identical (e.g., inverted pendulum model—Winter et al. 1998). Evidence exists, however, that there
Abstract We investigated the effect of foot position and foot orientation on asymmetrical body weight loading and the inter- and intra-foot coordination dynamics of stand-ing postures. the participants were instructed to stand with the feet side-by-side and in staggered and tandem positions with the right foot oriented at different angles (30, 60 and 90°). the results showed that the participants naturally loaded more on their left foot when positioned with their right foot forward. as the orientation of the right foot was changed from 90 to 30°, they loaded a significantly large proportion of their body weight on their left foot and the degree of coordination of the 4 cOP time series increased. Foot position, constrains both the area of the base of sup-port and the loading of the feet, played an important role differentiating the contribution of each cOP to the pos-tural control system. In particular, when postural stance was challenged by the limitation of the base of support, the cOPs in the unstable plane (inter-foot coordination) showed larger factor weightings. In contrast, when standing posture was not challenged by the base of support bound-ary, the cOPs of the more loaded foot (intra-foot coordi-nation) dominated foot coordination in postural control. these findings show that the mechanical constraints of foot position and orientation interact to channel different patterns of inter- and intra-foot coordination dynamics of standing postures.
Z. Wang (*) · K. M. Newell Department of Kinesiology, the Pennsylvania state University, 23 Rec Building, University Park, Pa 16802, Usae-mail: [email protected]
P. M. c. Molenaar Department of human Development and Family studies, the Pennsylvania state University, University Park, Usa
Author's personal copy

Exp Brain Res
1 3
is inter-dependence of the spontaneous cOPNEt motion in both planes, particularly when postural stability is chal-lenged by reducing the area of the base of support (aruin et al. 1998; Mochizuki et al. 1999, 2006; Freitas et al. 2006). at the muscular–articular level, it has been shown that there is a direct linkage between the cOPNEt patterns and the lower limb muscle activations (Winter et al 1998; casadio et al. 2005; loram and lakie 2002). however, recent investigations indicate that the high firing rate of the lower limb muscle occurs when the upper body is lean-ing or moving in directions other than the anterior–poste-rior (aP) and medial–lateral (Ml) of the transverse plane (henry et al. 1998; Imagawa et al. 2012). Nevertheless, how the coordination of the cOPs under each individual foot (i.e., cOPl-aP, cOPR-aP, cOPl-Ml and cOPR-Ml) assists balance has not yet been fully explored.
the asymmetrical body weight loading serves not only as an independent mechanical factor in postural control (i.e., by requiring the participants intentionally load une-venly on the feet) but also can be a dependent variable that covaries with other mechanical factors or task con-straints (Jonsson et al. 2005; Genthon and Rougier 2005; anker et al. 2008; Wang and Newell 2012a, b). anker et al. (2008) reported an overall cOP velocity increase when par-ticipants are required to load most of their body weight on one side of the body when standing in a side-by-side man-ner. Evidence also exists that people prefer to load evenly in the side-by-side stance, whereas they load more on the rear foot in the staggered or tandem foot positions (Jons-son et al. 2005; King et al. 2012). the asymmetrical body weight loading channels the sensitivity of the cutaneous receptors under the sole of the more loaded foot and thus could increase muscle stiffness of the limb (Genthon and Rougier 2005; Reynolds 2010; sozzi et al. 2013).
Varying foot position has been hypothesized to selec-tively activate specific lower limb muscles so that different foot positions can be applied to strengthen the knee joint after injury (signorile et al. 1995). clinically, physicians have required patients adapt to the Romberg tandem stance to provoke instability (hu and Woollacott 1994). however, when required to stand in a self-preferred comfortable man-ner, a high degree of between-subject variability is present as a function of both standing foot width and foot angle for healthy individuals (Mcllroy and Maki 1997). By gradu-ally increasing the distance between the feet in the frontal plane, it has been observed that cOPNEt variation decreases in the Ml direction along with the compensated increase in its orthogonal aP direction (Kollegger et al. 1989; Day et al. 1993). Other studies, however, have shown that the most cOPNEt variation is in the extreme stances, such as the feet together or 45 cm apart in the lateral direction in comparison with a position of the feet being 15 cm apart (Kirby et al. 1987; holbein and chaffin 1997). Watanabe
et al. (1979) observed that the mean value of cOP path in both aP and Ml directions is identical when the feet are positioned in a 30° fan shape.
the focus of the current study was to investigate the role of foot position and orientation on the inter- and intra-foot coordination dynamics and body weight loading of the feet in quiet standing. We investigated three standard postural foot positions (i.e., side-by-side, staggered and tandem stances) with the manipulation of the participants’ right foot orientation (i.e., 30, 60 and 90°). therefore, the body weight distribution in this study was a dependent variable that could be influenced by the interactive effects of foot position and orientation.
Previous studies have shown the pairwise coordina-tion of two cOP time series evolves across several time scales and involves sequential time-lagged covariations (Kinsella-shaw et al. 2011; Wang and Newell 2012b; King et al. 2012). however, it is the instantaneous dynamics of the four cOPs together (cOPl-aP, cOPR-aP, cOPl-Ml and cOPR-Ml) that create and channel the cOPNEt pat-terns in quiet stance to accommodate different mechani-cal constraints. the sequential time scales exist not only within each cOP time series but also between these 4 cOPs. Given the aforementioned properties of the data set (including 4 time invariant cOPs), we used a multivariate approach (a frequency domain Pca analysis—f Pca) to reveal the inter- and intra-foot coordination as a function of foot position and orientation (for a brief introduction on the f Pca, see appendix for details, and Brillinger 1975, Molenaar 1987, Molenaar et al 2013).
as a result, the analyses of the coordination of the foot dynamics were not isolated as they typically have been to a single dimension (aP or Ml) or the aP and Ml being con-sidered independently (Kapteyn 1973). the f Pca allows the examination of the coordination of movement degrees of freedom beyond the standard approaches of the bivariate case (cross-correlation, coherence, cross-approximate entropy, etc.) to the multivariate case as reflected in the study of whole body movement. the degree of coordination of the 4 cOPs is reflected by the percentage of total variance accommodated by each principal component (Pc). For example, if the 4 cOPs are independent, the total variance explained by each Pc will be close to 25 %. On the other hand, however, if the 4 cOPs are tightly coordinated, the first Pc can explain a sig-nificant proportion of the total amount of variance.
again, the f Pca compresses the dimension of the multi-variate data set in determining the number of principal com-ponents while accommodating the problem of sequential lead/lags in the time series (anderson 1963; Brillinger 1975, Molenaar 1987; Molenaar et al. 2013). this contrasts with the time domain Pca analysis (Daffertshofer et al. 2004), where determination of the principal components does not take into account the time relations and, thus, can induce a
Author's personal copy

Exp Brain Res
1 3
biased estimate of the number of components. the f Pca technique also affords, at each individual principal com-ponent, an estimate of the contribution of each cOP to the multivariate data set (that represented by the factor weight-ing of each cOP time series) across certain frequency range.
For example, if the factor weightings of the 4 cOPs are equivalent at the first principal component, then the conclu-sion can be made that the 4 cOPs displayed an equal contri-bution to the total variance interpreted by Pc1. If the factor weighting of the cOPl-Ml is the smallest whereas that of the cOPR-aP is the largest, the interpretation would be that these two cOP time series had the least and the most contribution to the first Pc, respectively. It should be noted that the factor weighting of each cOP time series is not a fixed or an aver-aged parameter as it can change as a function of frequency.
thus, in this study, we investigated the effects of foot position and orientation on inter- and intra-foot coordination dynamics in quiet postural stances. It was hypothesized that: (1) the body weight distributions over the feet would be more asymmetrical when the participant has positioned one foot in front of the other (Jonsson et al 2005; King et al 2012); (2) the participant would load more on his/her left foot when the right foot oriented from 90 to 30° due to the hip loading–unloading effect (Winter 1995); (3) the foot cOP dynamics in the aP and Ml directions are not independent, rather the inter- and intra-foot coordination together maintain pos-tural stability; and (4) the inter- and intra-foot coordination dynamics is mediated by the different mechanical constraints induced by foot position and orientation.
Methods
subjects and apparatus
twelve right-footed healthy subjects (foot preference determined by the Waterloo Footedness Questionnaire, see
Elias et al. 1998), four females and eight males [mean age 29 years (range 25–35 years); mean height 169.3 m (range 155.5–183.0 m); mean weight 65.6 kg (range 45–85 kg)], participated in this study. all subjects provided informed consent for the present study that was approved by the Institutional Review Board (IRB) of Pennsylvania state University. the foot kinetic data were collected by two adjacent aMtI force platforms (advanced Mechanical technology Inc., OR6-5-1000) at a sample rate of 100 hz. the platforms were calibrated and synchronized for data collection.
tasks and procedures
there were 3 foot positions tested in this experiment: feet side-by-side standing about hip width apart (side-by-side) and staggered (staggered-R) and tandem (tandem-R) stances each with the right foot forward. the participants were allowed to choose their own comfortable distance for the feet to be apart. In the tandem stance, the partici-pants were instructed to position their right foot directly in front of the left foot. In addition, the orientation of the right foot was restricted to 90, 60 and 30°, whereas the left foot was instructed to face forward throughout all conditions (Fig. 1). During the testing, the participants were required to hang their arms beside the trunk and keep their knees straight. the task requirement was to stand as still as pos-sible. the participants were free to adjust their body weight distribution on the feet in a preferable manner before the data collection. Once the data collection started, the partici-pants were instructed not to shift their body weight distri-bution any more.
there were 2 trials at each of the postural stances (foot position × foot orientation). Each trial was 60 s in dura-tion. Data recording was initiated 5 s after the participants were positioned comfortably in the respective posture on the force platforms. the postural conditions were randomly
Fig. 1 schematic representation of the experimental standing conditions of the side-by-side (a), staggered-R (b) and tandem-R (c) foot posi-tions with the right foot oriented at 30, 60 and 90°, respectively
Author's personal copy
Exp Brain Res
1 3
assigned to the participants, and the 2 trials at each postural condition were blocked. a 10-s break was given between each trial of a condition.
Data analysis
the raw kinetic data were filtered with a fourth-order 6-hz low-pass zero-lag Butterworth filter. the cOP time series for each foot in both aP and Ml directions were derived and centered independently.1
Ground reaction force ratio
the ground reaction force ratio (Fz ratio) of the left to the right foot was calculated:
where Fzleft and FzRight represent the ground reaction force of the left and right foot, respectively. the ratio will have a value range from −1 to 1. Note that when the body weight is evenly distributed on the feet, the ratio will be 0; when the body weight is asymmetrically distributed on the left foot, the ratio will be larger than 0; otherwise, the ratio will be less than 0.
Frequency domain principal component analysis (fPCA)
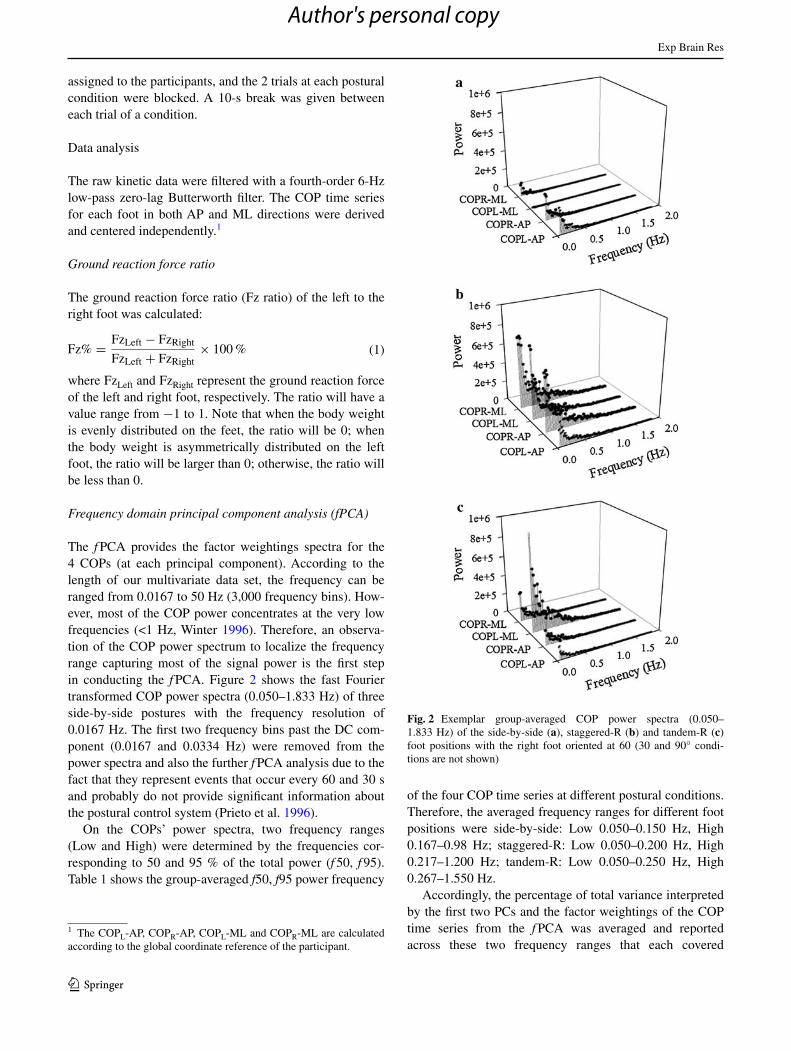
the f Pca provides the factor weightings spectra for the 4 cOPs (at each principal component). according to the length of our multivariate data set, the frequency can be ranged from 0.0167 to 50 hz (3,000 frequency bins). how-ever, most of the cOP power concentrates at the very low frequencies (<1 hz, Winter 1996). therefore, an observa-tion of the cOP power spectrum to localize the frequency range capturing most of the signal power is the first step in conducting the f Pca. Figure 2 shows the fast Fourier transformed cOP power spectra (0.050–1.833 hz) of three side-by-side postures with the frequency resolution of 0.0167 hz. the first two frequency bins past the Dc com-ponent (0.0167 and 0.0334 hz) were removed from the power spectra and also the further f Pca analysis due to the fact that they represent events that occur every 60 and 30 s and probably do not provide significant information about the postural control system (Prieto et al. 1996).
On the cOPs’ power spectra, two frequency ranges (low and high) were determined by the frequencies cor-responding to 50 and 95 % of the total power (f 50, f 95). table 1 shows the group-averaged f50, f95 power frequency
1 the cOPl-aP, cOPR-aP, cOPl-Ml and cOPR-Ml are calculated according to the global coordinate reference of the participant.
(1)Fz% =FzLeft − FzRight
FzLeft + FzRight
× 100 %
of the four cOP time series at different postural conditions. therefore, the averaged frequency ranges for different foot positions were side-by-side: low 0.050–0.150 hz, high 0.167–0.98 hz; staggered-R: low 0.050–0.200 hz, high 0.217–1.200 hz; tandem-R: low 0.050–0.250 hz, high 0.267–1.550 hz.
accordingly, the percentage of total variance interpreted by the first two Pcs and the factor weightings of the cOP time series from the f Pca was averaged and reported across these two frequency ranges that each covered
Fig. 2 Exemplar group-averaged cOP power spectra (0.050–1.833 hz) of the side-by-side (a), staggered-R (b) and tandem-R (c) foot positions with the right foot oriented at 60 (30 and 90° condi-tions are not shown)
Author's personal copy

Exp Brain Res
1 3
roughly 50 % of the total power spectrum of a particular foot position. table 2 shows the mean percentage of the total variance explained by Pc1 and Pc2 as a function of postural stance at both low and high frequency ranges. Pc1 represented the largest proportion of the total variance of
the multivariate data set (i.e., 72.45–87.43 %). as a result, statistical analyses on the percentage of total variance and the 4 cOP factor weightings were conducted only for Pc1.
statistical analyses
a3 (foot position) × 3 (foot orientation) fixed effect repeated measures aNOVa was conducted for Fz ratio, and the percentage of total variance explained by Pc1 at low and high frequency range, respectively. a series of multi-variate aNOVa (MaNOVa) was conducted with the cOP factor weightings of Pc1 as the dependent variables and with postural stance and foot orientation as the independ-ent variables at each frequency range, respectively. a two-way univariate test was then performed to determine the foot position × cOP and foot orientation × cOP interac-tion effects, individually, at both low and high frequencies. the lsD post-hoc analysis was used to determine the dif-ferences on all pairs of levels of independent variables. In all analyses, only effects that were statistically significant at p < 0.05 are reported (a Bonferoni adjustment was con-ducted on the significant level for pairwise comparisons). In the case that homogeneity of the covariance matrices was violated, Pillai’s trace estimate was used to provide a conservative test of MaNOVa main and interaction effects.
Results
low and high frequency ranges
table 1 shows that f 50 and f 95 power were dominated in the side-by-side stance by the slow time scale. changing the position of the feet from the side-by-side to tandem stance, f 50 and f 95 progressively shifted as additional
Table 1 Group-averaged four cOP f50, f95 power frequency (mean ± sE hz ) as a function of foot position and foot orientation
50 % power frequency 95 % power frequency
cOPl-aP cOPR-aP cOPl-Ml cOPR-Ml cOPl-aP cOPR-aP cOPl-Ml cOPR-Ml
Side-by-side
90° 0.123 ± 0.012 0.139 ± 0.015 0.145 ± 0.017 0.159 ± 0.017 0.840 ± 0.052 0.848 ± 0.056 1.270 ± 0.164 1.200 ± 0.124
60° 0.153 ± 0.013 0.132 ± 0.012 0.160 ± 0.018 0.140 ± 0.013 0.919 ± 0.051 0.812 ± 0.051 1.153 ± 0.083 0.890 ± 0.057
30° 0.165 ± 0.013 0.158 ± 0.014 0.178 ± 0.019 0.160 ± 0.015 0.853 ± 0.054 0.833 ± 0.052 1.133 ± 0.065 0.915 ± 0.051
Staggered-R
90° 0.200 ± 0.013 0.206 ± 0.014 0.197 ± 0.012 0.187 ± 0.018 1.076 ± 0.061 1.291 ± 0.065 1.076 ± 0.054 1.343 ± 0.086
60° 0.201 ± 0.022 0.157 ± 0.017 0.213 ± 0.021 0.154 ± 0.013 1.138 ± 0.049 1.283 ± 0.080 1.162 ± 0.054 1.103 ± 0.063
30° 0.212 ± 0.018 0.194 ± 0.017 0.187 ± 0.016 0.185 ± 0.016 1.219 ± 0.052 1.395 ± 0.073 1.140 ± 0.064 1.203 ± 0.065
Tandem-R
90° 0.172 ± 0.013 0.331 ± 0.034 0.271 ± 0.021 0.319 ± 0.029 1.531 ± 0.101 1.856 ± 0.127 1.662 ± 0.095 1.838 ± 0.128
60° 0.197 ± 0.021 0.263 ± 0.028 0.258 ± 0.024 0.257 ± 0.026 1.415 ± 0.059 1.604 ± 0.083 1.665 ± 0.078 1.547 ± 0.070
30° 0.155 ± 0.019 0.238 ± 0.026 0.221 ± 0.025 0.226 ± 0.025 1.231 ± 0.064 1.438 ± 0.074 1.422 ± 0.068 1.372 ± 0.071
Table 2 Mean percentage of variance (mean ± sE %) interpreted by Pc1 and Pc2 as a function of foot position and foot orientation at the low and high frequency ranges
low freq. range high freq. range
Side-by-side
90° Pc1 83.05 ± 2.33 81.28 ± 2.10
Pc2 14.21 ± 1.91 15.19 ± 1.83
60° Pc1 84.70 ± 1.62 82.37 ± 2.61
Pc2 12.74 ± 1.59 13.70 ± 2.00
30° Pc1 87.21 ± 2.93 82.39 ± 2.80
Pc2 10.17 ± 2.27 13.95 ± 2.04
Staggered-R
90° Pc1 74.91 ± 3.84 79.25 ± 3.17
Pc2 17.68 ± 2.68 14.27 ± 2.38
60° Pc1 78.63 ± 2.35 78.51 ± 2.23
Pc2 18.19 ± 1.71 18.55 ± 2.15
30° Pc1 82.81 ± 2.32 84.44 ± 2.22
Pc2 14.98 ± 2.07 13.13 ± 1.76
Tandem-R
90° Pc1 72.45 ± 2.72 77.62 ± 2.06
Pc2 17.69 ± 1.83 15.41 ± 1.59
60° Pc1 78.87 ± 2.94 83.55 ± 1.86
Pc2 16.84 ± 2.21 11.94 ± 1.28
30° Pc1 86.78 ± 1.48 87.43 ± 1.16
Pc2 10.14 ± 1.20 8.89 ± 0.64
Right foot orientation levels that are significantly different from 30° at each foot position (p < 0.05)
Author's personal copy
Exp Brain Res
1 3
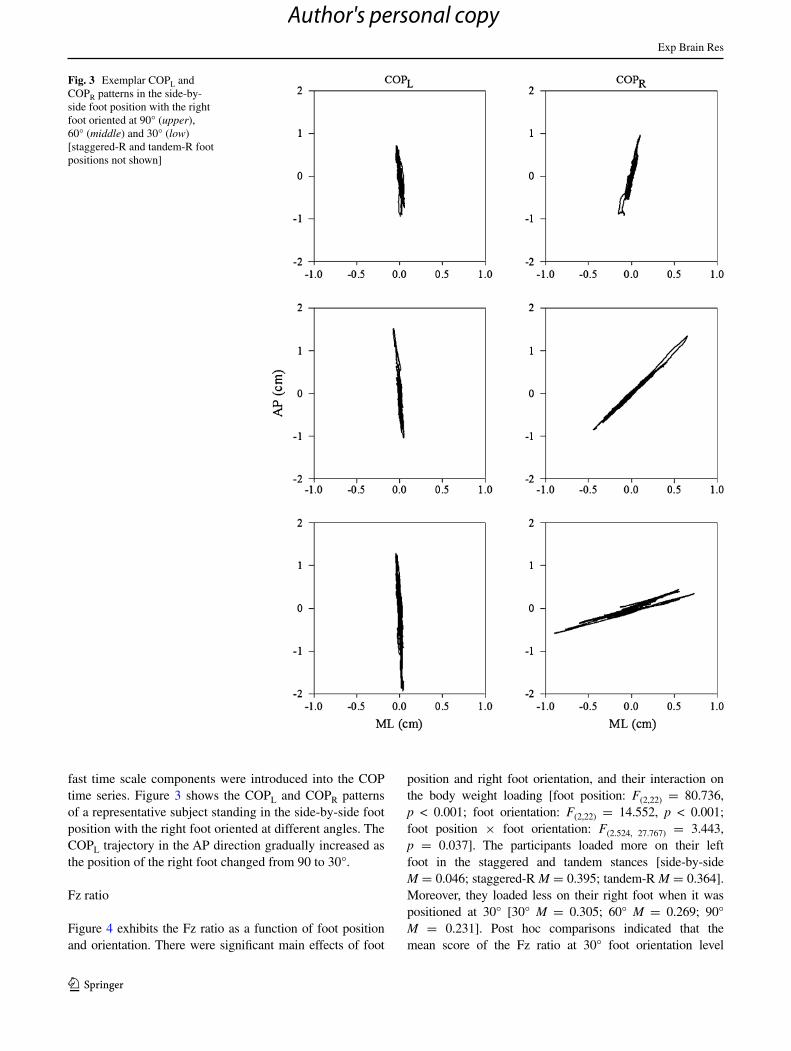
fast time scale components were introduced into the cOP time series. Figure 3 shows the cOPl and cOPR patterns of a representative subject standing in the side-by-side foot position with the right foot oriented at different angles. the cOPl trajectory in the aP direction gradually increased as the position of the right foot changed from 90 to 30°.
Fz ratio
Figure 4 exhibits the Fz ratio as a function of foot position and orientation. there were significant main effects of foot
position and right foot orientation, and their interaction on the body weight loading [foot position: F(2,22) = 80.736, p < 0.001; foot orientation: F(2,22) = 14.552, p < 0.001; foot position × foot orientation: F(2.524, 27.767) = 3.443, p = 0.037]. the participants loaded more on their left foot in the staggered and tandem stances [side-by-side M = 0.046; staggered-R M = 0.395; tandem-R M = 0.364]. Moreover, they loaded less on their right foot when it was positioned at 30° [30° M = 0.305; 60° M = 0.269; 90° M = 0.231]. Post hoc comparisons indicated that the mean score of the Fz ratio at 30° foot orientation level
Fig. 3 Exemplar cOPl and cOPR patterns in the side-by-side foot position with the right foot oriented at 90° (upper), 60° (middle) and 30° (low) [staggered-R and tandem-R foot positions not shown]
Author's personal copy

Exp Brain Res
1 3
[30° M = 0.456] was the largest followed by 60° and then 90° in the staggered stance [60° M = 0.408; 90° M = 0.320].
cOP coordination and factor weightings
table 2 shows that the percentage of variance explained by Pc1 increased as a function of right foot orientation for each level of foot position. the aNOVa showed a signifi-cant foot orientation main effect for both frequency ranges [low: F(2, 22) = 13.644, p < 0.001; high: F(2, 22) = 5.067, p = 0.015]. More specifically, when the right foot was ori-ented at 30°, the total variance explained by Pc1 was sig-nificantly larger than that of the 60 and 90° conditions at the low frequency range [30° M = 84.5 %; 60° M = 78.8 %; 90° M = 75.0 %] and was significantly larger than the 90° foot orientation in the high frequency range [30° M = 85.1 %; 60° M = 82.1 %; 90° M = 80.3 %]. as a result, the degree of coordination of the 4 cOP time series was gradually increased when the right foot shifted from 90 to 30°.
Figure 5 shows the factor weighting of each cOP time series to the first principal component as a function of foot position and orientation at each frequency range. the MaNOVa analyses showed that there were significant main effects of foot position and orientation together with an interaction between these two factors on the four cOP weightings at both frequency ranges [low: foot position F(8, 194) = 16.382, p < 0.01; orientation F(8,194) = 0.847, p < 0.05; foot position × orientation F(16, 396) = 3.072, p < 0.01; high: foot position F(8, 194) = 17.946, p < 0.01; orientation F(8, 194) = 2.894, p < 0.01; foot position × ori-entation F(16, 396) = 2.649, p < 0.01]. all cOP weightings interacted with foot position. although the foot orientation was only manipulated for the right foot, it also influenced
the cOP weightings of the left foot. the interaction effect was significant only for the right foot cOPs with the cOPl-Ml an exception at high frequencies.
Posture × COP univariate test (Fig. 5 read by column)
When the right foot was positioned at 90°, the cOP main effect and foot position × cOP interaction were signifi-cant at both frequency ranges [low: cOP F(3,132) = 3.039, p < 0.05; foot position × cOP F(6, 132) = 13.923, p < 0.01; high: cOP F(3,132) = 5.152, p < 0.05; foot position × cOP F(6, 132) = 11.251, p < 0.01]. Post hoc analyses showed that the cOPl-Ml had a larger weighting than the cOPR-aP at low frequencies [cOPl-aP M = 0.506, cOPR-aP M = 0.470, cOPl-Ml M = 0.511 and cOPR-Ml M = 0.479], whereas the cOPl-aP had the least weight-ing at high frequencies [cOPl-aP M = 0.427, cOPR-aP M = 0.507, cOPl-Ml M = 0.492 and cOPR-Ml M = 0.503]. In the side-by-side stance, the weighting of the cOPl-Ml was smaller than that of the cOP-aP at low fre-quencies and was smaller than that of the right foot cOPs at high frequencies. In the staggered position, the cOPR-Ml was smaller than that of the left foot cOPs at low fre-quencies and was smaller than the cOPR-aP at the high frequency range. In the tandem foot position, the cOPs in the aP direction showed the lowest weightings for both fre-quency ranges.
When the right foot was oriented at 60°, the cOP main effect and foot position × cOP interaction effects were significant only at the high frequency range [high: cOP F(3, 132) = 3.689, p < 0.05; foot position × cOP F(6, 132) = 15.821, p < 0.01]. Post hoc analyses showed that the cOPl-Ml had the least weighting in the side-by-side stance. the right foot cOPs had smaller weightings as compared with the left foot in the staggered foot position. In the tandem stance, the weighting of the cOPl-aP was smaller than that of the cOPs in the Ml direction.
In the 30° foot orientation condition, there was a signifi-cant cOP main effect and foot position × cOP interaction for both frequency ranges [low: cOP F(3, 132) = 5.041, p < 0.01; foot position × cOP F(6, 132) = 6.4841, p < 0.01; high: cOP F(3, 132) = 5.552, p < 0.01; foot position × cOP F(6, 132) = 5.824 p < 0.01]. Post hoc analyses showed that the weighting of the cOPl-Ml was the smallest as com-pared with other cOP time series in the side-by-side stance at both frequency ranges. at high frequencies, the cOPl-aP had the smallest weighting in the tandem foot position.
Foot orientation × COP univariate test (Fig. 5 read by row)
For the side-by-side stance, there was a significant cOP main effect and foot orientation × cOP interaction at low
0
0.1
0.2
0.3
0.4
0.5
0.6
Side-by-side Staggered-R Tandem-R
Fz
rati
o
30° 60° 90°
Fig. 4 the Fz ratio (Fz% = FzLeft−FzRight
FzLeft+FzRight× 100 %) of the left and
right foot as a function of foot position and orientation (Fz ratio >0 indicates an asymmetrical body weight distribution to the left foot)
Author's personal copy

Exp Brain Res
1 3
frequencies [cOP: F(3,132) = 48.956, p < 0.01; foot orienta-tion × cOP: F(6, 132) = 2.935, p < 0.05]. however, only the cOP main effect was significant at high frequencies [cOP: F(3, 132) = 20.979, p < 0.01]. Post hoc analyses revealed that weighting of the cOPl-Ml was significantly lower than other cOP signals in all foot orientation levels at both frequency ranges [low: cOPl-aP M = 0.494, cOPR-aP M = 0.553, cOPl-Ml M = 0.396, cOPR-Ml M = 0.528; high: cOPl-aP M = 0.490, cOPR-aP M = 0.521, cOPl-Ml M = 0.408 and cOPR-Ml M = 0.539]. When the right foot was positioned at 60°, weighting of the cOPl-Ml was significantly smaller than the right foot cOP at low frequencies.
For the staggered foot position, the effects of cOP and foot orientation × cOP interaction were significant at both frequency ranges [low: cOP F(3, 132) = 8.392, p < 0.01; foot orientation × cOP F(6, 132) = 4.187, p < 0.01; high: cOP F(3, 132) = 8.279, p < 0.01; foot orientation × cOP F(6, 132) = 7.161, p < 0.01]. Post hoc analyses revealed that the weightings of the left foot cOPs were significantly larger than that of the right foot cOPs in both 60 and 90° conditions at both frequency ranges.
For the tandem stance, there was a significant main effect of cOP and an interaction between foot orientation and cOP at both frequencies [low: cOP F(3, 132) = 13.513, p < 0.01; foot orientation × cOP F(6, 132) = 3.539, p < 0.01; high: cOP F(3, 132) = 35.293, p < 0.01; foot orienta-tion × cOP F(6, 132) = 2.255 p < 0.05]. Post hoc analyses
showed that the weighting of the cOPl-aP was the small-est in all foot orientation levels at both frequency ranges. When the right foot was positioned at 90°, the cOPR-aP had smaller weighting as compared with that of the cOP signals in the Ml direction.
Discussion
the present experiment was setup to investigate the effect of different foot positions and orientations on the body weight loading and foot coordination dynamics in quiet standing postures. to address these issues, the participants stood quietly in 3 different postural stances while the right foot was oriented at different angles. the ground reaction forces and cOP time series were recorded and derived, respectively, from two synchronized force platforms. the use of two platforms allowed the determination of the cOP motions for each foot and their coordination dynam-ics (Kinsella-shaw et al. 2011; Wang and Newell 2012a, b)—properties that are not possible to obtain with the pre-dominantly used single force platform for postural control. the findings support the position that the mechanical con-straints of foot position and orientation interact to channel the inter- and intra-foot coordination dynamics of stand-ing postures. thus, foot position and orientation not only change the amount of cOP motion in aP and Ml and its respective variability (Mcllroy and Maki 1997; Watanabe
0.3
0.4
0.5
0.6
Stag
gere
d-R
0.3
0.4
0.5
0.6
0.3
0.4
0.5
0.6
COPL-ap COPR-apCOPL-ml COPR-ml
0.3
0.4
0.5
0.6Si
de-b
y-si
de90°
0.3
0.4
0.5
0.6 60°
0.3
0.4
0.5
0.6 30°
0.3
0.4
0.5
0.6
Low freq.range High freq.range
Tan
dem
-R
0.3
0.4
0.5
0.6
Low freq.range High freq.range0.3
0.4
0.5
0.6
Low freq.range High freq.range
Fig. 5 Group-averaged factor weightings of the four cOP time series for Pc1 as a function of foot position, foot orientation at the low and high frequency ranges
Author's personal copy
Exp Brain Res
1 3
et al. 1979) but influence the coordination of the foot cOP dynamics in the control of posture.
the Fz ratio showed that the participants loaded more on their left foot when they positioned their right foot forward (Fig. 4). consistent with previous studies, the participants loaded 65–75 % of their body weight on the rear foot when they positioned one foot in front of the other (Jonsson et al. 2005; King et al. 2012). In the current study, we did not request our participants voluntarily load more on one side of their body so that the asymmetrical body weight loading reflects the interactive effect of the mechanical constraints. a related finding was that the participants gradually shifted their body weight to the left side when their right foot was oriented from 90 to 30°. the body weight shifting could be due to the fact that the participants utilize their left foot for stabilization and the right foot for flexibility of adaptation (for reviews, see Peters 1988; sadeghi et al. 2000).
By progressively increasing the difficulty of the standing posture, as reflected here in the different foot positions and orientations, the power of the slow time scale components, in particular, of the 4 cOP time series increased (Fig. 2). the increased frequency power can be a consequence of increased lower limb muscle activation. In EMG studies of the side-by-side stance, it has been shown that the tonic co-activation of the ankle flexors is in-phase with forward body sway and the rectus femoris activity is in-phase with backward body lean at 0.05 hz (Winter 1996; saffer et al. 2007). In the tandem foot position, the more loaded left limb shows enhanced tonic soleus muscle activation than that of the right leg. high correlations between peroneus longus and tibialis bursts and the cOPNEt motion in the frontal plane have also been observed (sozzi et al. 2013).
table 2 reveals that more than 95 % total variance of the multivariate cOP data set was accommodated by Pc1 (72.45–87.43 %) and Pc2 (8.89–18.55 %) whereby pos-tural control has been simplified to approximately two “dynamical” dimensions (Daffertshofer et al. 2004; hong and Newell 2006). this finding is consistent with our pre-vious nonlinear analysis of quiet standing posture in which the correlation dimension of healthy young adult partici-pants’ cOPNEt trajectory is about 2 indicating an approxi-mately two-dimensional attractor dynamic (Newell et al. 1993). and, as an addition to our previous bivariate analysis of inter-foot cOP couplings (Wang and Newell 2012a, b), the f Pca on the 4 cOPs shows that the collective multivari-ate coordination is influenced by the frequency properties examined with the slow frequency range reflecting the low-dimensional cOP coordination patterns that are typically interpreted as the act of maintaining a posture. thus, the Pca also reveals that the 4 cOP time series are not inde-pendent as previous research has implied (Kapteyn 1973).
the findings showed that the contributions of the 4 cOPs (indexed as the factor weighting in the f Pca) in
quiet stance are significantly influenced by the manipula-tion of the mechanical constraints arising from foot posi-tion (Fig. 5). Indeed, the MaNOVa findings revealed that, as compared with foot orientation, foot position had a stronger influence on the cOP factor weightings. although foot orientation plays an important role chan-neling the body weight distribution, foot position directly induces postural instability/stability and weight asymme-try by changing the area of the base of support (Jonsson et al. 2005; King et al. 2012). Nevertheless, foot orientation significantly influenced the degree of the inter- and intra-foot coordination dynamics represented by the gradually increased percentage of total variance explained by Pc1 with the change of the right foot orientation from 90 to 30°.
In the side-by-side stance, the factor weightings of the cOPs in the aP direction were significantly larger than that of the cOPs in the Ml direction at both frequency ranges. the asymmetries can be attributed to the limited base of support dimension in the sagittal plane and the geometry of the lower limb. the anatomical structure of the ankle is that of a hinge joint introducing more substantial instability in the sagittal plane (Winter 1996). therefore, consistent with the findings of Kinsella-shaw et al. (2011), the inter-foot coordination in the sagittal plane dominated postural stabil-ity in the side-by-side foot position.
In the tandem stance, however, the foot coordination dynamics is in contrast to that of the side-by-side standing in that the weightings of the cOPs in the Ml direction were significantly larger than the cOPs in the aP direction. Due to the narrowed base of support in the frontal plane, more internal instability is generated laterally (Day et al. 1993; Genthon and Rougier 2005; Reynolds 2010; sozzi et al. 2013). Previous investigations have shown that narrow standing width of foot position decreased the role of ankle mechanisms in the sagittal plane and increased the role of ankle and hip mechanisms in the frontal plane (Gatev et al. 1999). the homogeneous muscles of the lower limbs are active in a mutual push–pull manner in order to generate the alternative impulses for postural stability in the frontal plane (sozzi et al. 2013).
In the staggered stance, however, cOP of the left foot revealed larger factor weightings at both frequency ranges than the right foot cOP time series. the foot coordination difference between the staggered and the other foot posi-tions arises when the postural stability is not challenged by the reduced area of the base of support so that the body weight loading tends to be an important factor influence the foot coordination dynamics. Further, the asymmetri-cal body weight distribution is a by-product of the inter-active effect of foot position and orientation (Fig. 4). the “load receptors” (e.g., Gogi tendon organs) located within the extensor muscles activate postural reflex directly (Berger et al. 1992). the decrease in afferent feedback
Author's personal copy
Exp Brain Res
1 3
of the cutaneous mechanoreceptors under the sole of the less loaded foot introduces sensory information re-weight-ing of the postural control system (Genthon and Rougier 2005).
a striking finding was that the 4 cOP weightings of the staggered stance were essentially identical when the right foot was oriented at 30° indicating an equal contribution of the 4 cOPs to Pc1. Previous studies have shown that indi-ces capturing the cOPNEt variability changed according to foot distance and orientation (Watanabe et al. 1979; Mcll-roy and Maki 1997; chiari et al. 2002). In an early observa-tion, Watanabe et al. (1979) reported that the cOM motions in both sagittal and frontal planes are identical in a 30° fan-shaped foot position (i.e., heels close together with the toes open at 30°) implying a “regular squared” body sway area. Our findings revealed that this change is not only related to the characteristics of cOPNEt but also to the inter- and intra-foot cOP coordination dynamics. Given the fact that the self-chosen preferred foot angle between the long axes of the feet is 14°, whether a self-chosen foot position or a “regular squared” base of support facilitates postural stabil-ity is an open question. Future investigations can examine the impact of the required and self-chosen foot position and orientation on the inter- and intra-foot coordination dynamics.
In summary, the present experiment has shown that the asymmetrical body weight loading and foot coordination dynamics are differentially modulated by mechanical con-straints derived from the interactive effects of foot position and orientation. Previously, we found that postural control is mediated through the compensatory “stable” (indexed by the relatively low cOPl-cOPR relative phase standard deviation) and “flexible” (indexed by the relatively large cOPl-cOPR relative phase standard deviation) inter-foot couplings of the two orthogonal directions (Wang et al. 2012). the current study showed that, in the side-by-side and tandem foot positions, the “stable” properties reflect the mechanical constraints of the base of support and also played a significant role (factor weightings) in maintaining postural stability.
Appendix
Pca is a multivariate data transformation technique that is a form of factor analysis (anderson 1963; Morrison 2004) and has its origins with Pearson (1901). the data are con-sidered to be vector-valued random variables, where the entries of the vectors are mutually correlated. Pca trans-forms p-variate data vectors with correlated entries into p-variate data vectors with uncorrelated entries. here we provide a brief outline of the f Pca and its relation to the more standard tPca.
let yi = [yi1, yi2,…,yip]T be a p-variate data vector asso-
ciated with the ith subject (replication) in a homogeneous population of subjects (the superscript T denotes transposi-tion).2 to ease the presentation, it is supposed that y is cen-tered, i.e., the probability distribution across subjects of each yik, k = 1, 2,…,p, has mean zero. let V denote the (p, p)-dimensional covariance matrix associated with yi, i = 1, 2,… . then the spectral theorem for finite-dimensional symmetric matrices (halmos 1974) implies that V can be uniquely decomposed as follows:
where E represents a (p, p)-dimensional ortho-normal matrix. that is, EET = ETE = Ip [Ip is the (p, p)-dimen-sional identity matrix]. In addition, D is a (p, p)-dimen-sional diagonal matrix. the spectral theorem implies the important result that the decomposition given by (a1) is unique. Each particular covariance matrix V yields unique matrices E and D. the p-variate columns of E are called the eigenvectors. the entries along the diagonal of D are called the eigenvalues. If V is a positive-definite covariance matrix, then all eigenvalues are strictly larger than zero.
the Pca transformation of vectors with correlated entries into vectors with uncorrelated entries is defined as follows:
In (a2) zj = [zj1, zj2,…,zjp]T denotes the transformed
p-variate vector of subject j. It is called the vector of prin-cipal component scores, where the principal component scores are zjk, k = 1, 2,…,p. It can be shown, using simple matrix algebra, that the covariance matrix of zj is D, hence the entries zjk of zj are mutually uncorrelated.
Pca can be used for data reduction with minimal loss of information. let the eigenvalues dkk, k = 1, 2,…,p, along the diagonal of D in (a1) be ordered in decreasing amplitude. that is, d11 ≥ d22 ≥ ··· ≥ dpp. this can always be achieved by means of suitable permutation. let s be the sum of the p eigenvalues dkk, k = 1, 2,…,p, and suppose that the sum of the first q eigenvalues d11 + ··· + dqq equals 0.8s. then it is said that the first q eigenvectors “explain 80 % of the variance of V”. this implies that the remaining (p − q) eigenvectors together explain 20 % of the variance. One, therefore, can consider a dimension reduction by defining the (p, q)-dimension matrix E(q) consisting of the first q eigenvectors of E (the ones explaining 80 % of the variance of V). In addition, the remaining (p − q) eigen-vectors are collected in the (p, p − q)-dimensional matrix E(p−q). hence E is decomposed as E = E(q) + E(p−q). also,
2 For equations listed below, boldface uppercase letters denote matri-ces and boldface lowercase letters denote column vectors.
(a1)V = EDET
(a2)zj = ET yj, j = 1, 2, . . .
Author's personal copy

Exp Brain Res
1 3
analogously, decompose zj as zj = [zj(q), zj
(p−q)]T. Pre-multiply (a2) by E:
hence, pre-multiplication of zi by E yields back the original data vectors yj. Next, substitute the decomposition E = E(q) + E(p−q) into Ezj = yj:
In (a3) denote E(q) as Λ, denote zj(q) as ηj, and E(p−q)zj
(p−q) as εj. accordingly (a3) can be rewritten as:
that resembles a q-factor model (anderson 2003; Morrison 2004).
Denote the (p, p)-dimensional covariance matrix of Ληj = E(q)zi
(q) by V(q) and the (p, p)-dimensional covari-ance matrix of εj = E(p−q)zi
(p−q) by V(p−q). then it holds that:
and the choice of Ληj = E(q)zj(q) minimizes V(p−q) =
V − V(q). In this sense, dimension reduction by means of Pca is optimal (ahmed and Rao 1975).
tPca in the time domain
Pca in the time domain of a p-variate time series y(t), t = 0, 1,…, proceeds in the same way as described above. again, it is assumed, without affecting generality, that y(t) is centered in that the mean of y(t) is zero. In addi-tion, it is assumed that y(t) is weakly stationary (Brillinger 1975), which implies that the sequential covariance of y(t1) and y(t2) for all times t1 and t2 only depends upon the lag u = t1 − t2. consequently, the sequential covariance struc-ture of y(t) is given by:
accordingly, V(0) = cov[y(t), y(t)T] is the (p, p)-dimen-sional covariance matrix of y(t) at lag u = 0. then Pca in the time domain (tPca) proceeds as described above by substituting V(0) for V, yielding the analogue of (a3′):
In psychometrics, tPca is known as P-technique (cattell 1952, 1963). anderson (1963) and holzman (1963) presented a critique of P-technique because it neglects the sequential covariance structure at lags u ≠ 0. Molenaar and Nesselroade (2009) showed that
zj = ET yj → Ezj = EET yj → Ezj = yj
(a3)yj = Ezj = E(q)z(q)
j + E(p−q)z(p−q)
j
(a3′)yj = �ηj + εj
(a4)V = V(q) + V(p−q)
(a5)cov[
y (t) , y (t − u)T]
= V (u) , u = 0, ±1, . . .
(a6)y (t) = �η (t) + ε (t)
neglecting the sequential covariance structure at lags u ≠ 0 in tPca yields invalid results if the relation-ship between the q-variate component series η(t) and the p-variate observed series y(t) is not given by (a6) but by
according to (a7), the regression of the observed series on the component series is characterized by differential lead–lag relationships. If the observed series y(t) obeys (a7), then determination of the dimension q of the compo-nent series η(t) by means of tPca is biased upwards. that is, the estimated value of the dimension q of component series η(t) will tend to be too high.
fPca in the frequency domain (the MatlaB program is available from the authors upon request)
a version of Pca that is valid for any weakly stationary time series is fPca in the frequency domain (Brillinger 1975). Denote by y(fk) the discrete Fourier transform (DFt) of y(t), t = 0, 1, …, T − 1:
i =√
−1 is the imaginary unit and e−i2π fk t =
cos(2π fkt) − i sin(2π fkt). the DFt given by (a8) is a one-to-one invertible transformation from the time domain (indexed by t) to the frequency domain (indexed by fk). the inverse discrete fourier transformation (IDFt) is given by
It is apparent that the DFt does not affect the informa-tion content of a time series y(t), but only represents it in a different (frequency) domain. a very useful characteristic of the DFt is that application to (a7) yields (ahmed and Rao 1975):
hence, the DFt transforms (a7) in which the regression of the observed series on the component series is character-ized by arbitrary differential lead–lag relationships into a complex-valued analogue of (a6) which is valid for appli-cation of Pca.
(a7)
y (t) = � (0) η (t) + � (1) η (t − 1) + · · · + ε (t)
=∑
u
� (u) η (t − u) + ε (t) , u = 0, 1, . . .
(a8)
y(fk) = T−1/2T−1∑
t=0
y(t)e−i2π fk t
fk =k
T, k = 0, 1, . . . , T − 1
(a9)y (t) = T−1/2T−1∑
k=0
y (fk) ei2π fk t; t = 0, 1, . . . , T − 1
(a10)y (fk) = � (fk) η (fk) + ε (fk)
Author's personal copy
Exp Brain Res
1 3
f Pca proceeds by carrying out the complex-valued ana-logue of standard Pca to the (p, p)-dimensional complex-valued covariance matrices of y(fk), k = 0, 1,…,T − 1. these covariance matrices are called the spectral density matrices and will be denoted by V(fk), k = 0, 1,…,T − 1. analogous to (a4) each V (fk) is decomposed as:
based on the analogue of (a3):
the nth entry of the jth column of E(fk) is enj(fk) = Re enj(fk) − iIm enj(fk). this so-called Euclidean representation of the elements of the complex-valued eigenvectors in E(fk) can be changed into polar representation as follows:
the absolute value |enj(fk)| is called the amplitude or fac-tor weightings of the (n, j)th entry of E(fk) and ϕnj(fk) is called its phase. If the amplitude of enj(fk) is high, then the jth component explains a considerable amount of the vari-ance of the nth observed series at frequency fk. the informa-tion about complex-valued eigenvectors will be presented in the form of amplitude and phase difference spectra.
to sum up, the main steps in f Pca of a given p-variate time series y(t), t = 0, 1,…,T − 1 are (a) estimation of the V(fk), k = 0, 1,…,T − 1; (b) determining the eigenvalue decomposition of each V(fk) = E(fk)*D(fk)E(fk), where the superscript * denotes the conjugate transpose; (c) carrying out the unitary rotation to minimum phase described in the appendix and determining the number of important com-ponents z(fk)
(q); and (d) taking the IDFt of z(fk)(q), k = 0,
1,…,T − 1, to obtain the time domain q-variate component series z(t)(q), t = 0, 1,…,T − 1. Because each V(fk) is a (p, p)-dimensional hermitian covariance matrix, it follows that the eigenvalues along the diagonal of D(fk) are real-valued. Estimation of the spectral density matrices V(fk), k = 0, 1,…,T − 1 can be accomplished in several distinct ways (Brillinger 1975). here, we use the simplest approach pos-sible by taking the DFt of y(t) defined by (a8), construct-ing the (p, p)-dimensional so-called periodogram matrices H(fk) = y(fk)y(fk)* and estimating each spectral density matrix by
(a11)V (fk) = V (fk)(q) + V (fk)
(p−q)
(a12)
y (fk) = E (fk) z (fk)
= E (fk)(q) z (fk)
(q) + E (fk)(p−q) z (fk)
(p−q)
(a13)
enj(fk) =∣
∣enj(fk)∣
∣ e−iϕnjfk ; n, j = 1, 2, . . . , p
enj(fk) =√
Re(
enj(fk))2 + Im
(
enj(fk))2
and
ϕnj(fk) = tan−1[
−Im(enj(fk))/Re(enj(fk))]
(a14)
Vest(fk) = (2M + 1)−1M+k∑
m=M−k
H (fm) , k = 0, 1, . . . , T − 1
References
ahmed N, Rao KR (1975) Orthogonal transforms for digital signal processing. springer, heidelberg
anderson tW (1963) the use of factor analysis in statistical analysis of multiple time series. Psychometrika 28:1–25
anderson tW (2003) an introduction to multivariate statistical analy-sis, 3rd edn. Wiley, chichester
anker lc, Weerdesteyn V, van Nes IJW, Nienhuis B, straatman h, Geurts ach (2008) the relation between postural stability and weight distribution in healthy subjects. Gait Posture 27:471–477
aruin as, Forrest WR, latash Ml (1998) anticipatory postural adjustments in conditions of postural instability. Electroencepha-logr clin Neurophysiol 109:350–359
Berger W, Discher M, trippel M, Ibrahim IK, Dietz V (1992) Devel-opmental aspects of stance regulation, compensation and adapta-tion. Exp Brain Res 90:610–619
Brillinger DR (1975) time series: data analysis and theory. holt, Rinehart and Winston, New York
casadio M, Morasso PG, sanguineti V (2005) Direct measurement of ankle stiffness during quiet standing: implications for control modelling and clinical application. Gait Posture 21:410–424
cattell RB (1952) Factor analysis. harper, New Yorkcattell RB (1963) the structuring of change by P-technique and
incremental R technique. In: harris cW (ed) Problems in meas-uring change. the University of Wisconsin Press, Madison, pp 167–198
chiari l, Rocchi l, cappello a (2002) stabilometric parameters are affected by anthropometry and foot placement. clin Biomech 17:666–677
Daffertshofer a, lamoth cJc, Meijer OG, Beek PJ (2004) Pca in studying coordination and variability: a tutorial. clin Biomech 19:415–428
Day Bl, steiger MJ, thompson PD, Marsden cD (1993) Effect of vision and stance width on human body motion when stand-ing: implications for afferent control of lateral sway. J Physiol 469:479–499
Elias lJ, Bryden MP, Bulman-Fleming MB (1998) Footedness is a better predictor than is handedness of emotional lateralization. Neuropsychologia 36:37–43
Freitas sM, Duarte M, latash Ml (2006) two kinematic synergies in voluntary whole-body movements during standing. J Neuro-physiol 95:636–645
Gatev P, thomas s, Kepple t, hallett M (1999) Feedforward ankle strategy of balance during quiet stance in adults. J Physiol 514:915–928
Genthon N, Rougier P (2005) Influence of an asymmetrical body weight distribution on the control of undisturbed upright stance. J Biomech 38:2037–2049
halmos PR (1974) Finite-dimensional vector spaces. springer, New York
henry sM, Fung J, horak FB (1998) EMG responses to maintain stance during multidirectional surface translations. J Neurophys-iol 80:1939–1950
holbein Ma, chaffin DB (1997) stability limits in extreme postures: effects of load positioning, foot placement, and strength. hum Factors 39:456–468
holtzman Wh (1963) statistical methods for the study of change in the single case. In: harris cW (ed) Problems in measuring change. the University of Wisconsin Press, Madison, pp 60–84
hong sl, Newell KM (2006) Practice effects on local and global dynamics of the ski-simulator task. Exp Brain Res 169:350–360
hu Mh, Woollacott Mh (1994) Multisensory training of standing bal-ance in older adults: I. Postural stability and one-leg stance bal-ance. J Gerontol Med sci 49:52–61
Author's personal copy

Exp Brain Res
1 3
Imagawa h, hagio s, Kouzaki M (2013) synergistic co-activation in multi-directional postural control in humans. J Electromyogr Kinesiol 23:430–437
Jonsson E, seiger Å, hirschfeld h (2005) Postural steadiness and weight distribution during tandem stance in healthy young and elderly adults. J clin Biomech 20:202–208
Kapteyn ts (1973) afterthought about the physics and mechanics of the postural sway. agressologie 14:27–35
King ac, Wang Z, Newell KM (2012) asymmetry of recurrent dynamics as a function of postural stance. Exp Brain Res 220:239–250
Kinsella-shaw JM, harrison sJ, turvey Mt (2011) Interleg coordina-tion in quiet standing: influence of age and visual environment on noise and stability. J Mot Behav 43:285–294
Kirby Rl, Price Na, Macleod Da (1987) the influence of foot posi-tion on standing balance. J Biomech 20:423–427
Kollegger h, Wober c, Baumgartner c, Deecke l (1989) stabilizing and destabilizing effects of vision and foot position on body sway of healthy young subjects: a posturographic study. Eur Neurol 29:241–245
lacquaniti F, Maioli c (1994) Independent control of limb position and contact forces in cat posture. J Neurophysiol 72:1476–1495
loram ID, lakie M (2002) human balancing of an inverted pendu-lum: position control by small, ballistic-like, throw and catch movements. J Physiol 540:1111–1124
Massion J (1992) Movement, posture and equilibrium: interaction and coordination. Pro Neurobiol 38:35–56
Mcllroy WE, Maki BE (1997) Preferred placement of the feet during quiet stance: development of a standardized foot placement for balance testing. J clin Biomech 12:66–w70
Mizrahi J, susak Z (1989) Bi-lateral reactive force patterns in postural sway activity of normal subjects. Biol cybern 60:297–305
Mochizuki l, Duarte M, Zatsiorsky VM, amadio ac, latash Ml (1999) Effects of different bases of support on postural sway. abstract on 23rd annual Meeting. american society of Biome-chanics, pp 260–261
Mochizuki l, Duarte M, amadio ac, Zatsiorsky VM, latash Ml (2006) changes in postural sway and its fractions in conditions of postural instability. J appl Biomech 22:51–60
Molenaar PcM (1987) Dynamic factor analysis in the frequency domain: causal modeling of multivariate psychophysiological time series. Multivar Behav Res 22:329–353
Molenaar PcM, Nesselroade JR (2009) the recoverability of P-tech-nique factor analysis. Multiv Behav Res 44:130–141
Molenaar PMc, Wang Z, Newell KM (2013) compressing movement information via principal components analysis (Pca): contrast-ing outcomes from the time and frequency domain. Manuscript under review
Morrison DF (2004) Multivariate statistical methods. Duxbury Press, Pacific Grove
Newell KM, van Emmerik REa, lee D, sprague Rl (1993) On pos-tural stability and variability. Gait Posture 4:225–230
Pearson K (1901) On lines and planes of closest fit to systems of points in space. Philos Mag 6:559–572
Peters M (1988) Footedness: asymmetries in foot preference and skill and neuropsychological assessment of foot movement. Psychol Bull 103:179
Prieto tE, Myklebust JB, hoffmann RG, lovett EG, Myklebust BM (1996) Measures of postural steadiness: differences between healthy young and elderly adults. IEEE trans Biomed Eng 43:956–966
Reynolds RF (2010) the ability to voluntarily control sway reflects the difficulty of the standing task. Gait Posture 31:78–81
sadeghi h, allard P, Prince F, labelle h (2000) symmetry and limb dominance in able-bodied gait: a review. Gait Posture 12:34–45
saffer M, Kiemel t, Jeka J (2007) coherence analysis of muscle activity during quiet stance. Exp Brain Res 185:215–226
signorile JF, Kacsik D, Perry a, Robertson B, Williams R (1995) the effect of knee and foot position on the electromyographical activity of the superficial quadriceps. J Orthop sports Phys ther 22:2–9
sozzi s, honeine Jl, Do Mc, schieppati M (2013) leg muscle activity during tandem stance and the control of body bal-ance in the frontal plane. clin Neurophysiol. doi: 10.1016/j.clinph.2012.12.001
Wang Z, Newell KM (2012a) asymmetry of foot position and weight distribution channels the inter-leg coordination dynamics of standing. Exp Brain Res 222:333–344
Wang Z, Newell KM (2012b) Phase synchronization of foot dynamics in quiet standing. Neurosci lett 507:47–51
Wang Z, Jordan K, Newell KM (2012) coordination patterns of foot dynamics in the control of upright standing. Mot control 16:425–443
Watanabe JO, takeya t, Baratto lB (1979) Influence of foot posi-tion and visual field condition in the examination for equilibrium function and sway of the center of gravity in normal person. agressologie 20:127–132
Winter Da (1995) human balance and posture control during stand-ing and walking. Gait Posture 3:193–214
Winter Da (1996) a. B. c. anatomy, biomechanics and control) of balance during standing and walking. Waterloo Biomechanics, Waterloo
Winter Da, Patla aE, Prince F, Ishac M, Gielo-Perczak K (1998) stiffness control of balance in quiet standing. J Neurophysiol 80:1211–1221
Author's personal copy