The effect of high‐tech services offshoring on skilled employment: intra‐firm evidence
29
THE EFFECT OF HIGH‐TECH SERVICES OFFSHORING ON SKILLED EMPLOYMENT: INTRA‐FIRM EVIDENCE Mery Patricia Tamayo Elena Huergo No. 13‐01 2013
Transcript of The effect of high‐tech services offshoring on skilled employment: intra‐firm evidence

THE EFFECT OF HIGH‐TECH SERVICES OFFSHORING ON SKILLED EMPLOYMENT: INTRA‐FIRM EVIDENCE
Mery Patricia Tamayo
Elena Huergo
No. 13‐01
2013
1
THEEFFECTOFHIGH‐TECHSERVICESOFFSHORINGON
SKILLEDEMPLOYMENT:INTRA‐FIRMEVIDENCE
MeryPatriciaTamayo*UniversidadEAFITandGRIPICO‐UniversidadComplutensedeMadrid
ElenaHuergo**
GRIPICO‐UniversidadComplutensedeMadrid
January,2013
Abstract
The offshoring of high‐tech services has greatly increased in recent years, withconsequencesforfirmsdemandforskilledemploymentinfirms.ThispaperspecificallyanalyzestherelationshipbetweenR&DoffshoringandthedemandforR&Demploymentusing firm‐level data for Spanish manufacturing and services companies during theperiod 2004‐2009. Estimating different specifications with panel data techniques, wefind that this association is statistically positive. In particular, for services firms a 1percentagepointincreaseinR&Doffshoringraisesthedemandforresearchersbyabout11%.Thissuggeststheexistenceofcomplementarityamongthemasproductiveinputs.Keywords:R&Doffshoring;wages;skilledemployment.JELClassification:F16;L24;03_____________________This research has been partially funded by the CICYT project ECO2010‐19847. The authors areparticularlygratefultoMaríaGarcía‐Vegaforusefulcomments.*Correspondingautor:GrupodeEconomíayEmpresa,DepartamentodeEconomía,UniversidadEAFIT,carrera49No7sur–50,Medellín,Colombia.E‐mail:[email protected].** GRIPICO (Group for Research in Productivity, Innovation and Competition). Dpto. Fundamentos delAnálisis Económico I. Facultad de CC. Económicas y Empresariales. Universidad Complutense deMadrid.Campus de Somosaguas. 28223 Madrid. España. Tel.: +34 913942408. Fax: +34 913942561. E‐mail:[email protected].
2
1.Introduction
Thefrequencywithwhichcompanieshavemadeuseofoffshoringstrategieshasgreatly
increasedinrecentyears(OECD,2010).Althoughinitiallyoffshoringreferredmainlyto
intermediatemanufacturinggoods,overthelastdecade,theoffshoringofmanufacturing
goods has taken a back seat to the offshoring of services, since the demand formore
advancedservicesintechnicalandadministrativeareashassubstantiallygrown(Jensen,
2009;MettersandVerma,2008).
As a consequence, standardized activities of unskilled workers in manufacturing
industries have ceased to be the only subject of offshoring and, nowadays, the
comparative advantageof countries isnotonlybe associatedwithnatural orphysical
capital, but also with human capital. Some countries are specializing in technological
jobs and in the development of computational concepts, making offshoring a way to
contract thenecessary services fordomesticproduction inother countries, improving
delivery times and the capacity for interaction, andwithout having inmany cases to
transportanyphysicalgoods.
However, the increase in the offshoring of highly technological services has not
happenedwithout problems.When awhite‐collar worker, who is usually better paid
becauseofherexperience inICTsandherabilityto learn, is“relocated”,somespecific
knowledgeof thecompany isdestroyed.Asa resultof theabsenceofvaluablehuman
capital,theincentivesofadministratorsandemployeestoinvestingainingsuchspecific
knowledgediminish(Trefler,2005).
Offshoringofhigh‐techtasksleadstomorefrequentseparationsbetweenworkersand
companies,destroying importantdimensionsofhumancapital. It isnot clearwhether
thelossofknowledgethatarisesfromtheseparationofthecompanyandtheworkersis
anissueofequity,giventhatitcanbeharmfulforworkersdisplacedbyoffshoring,ora
matterofefficiency,sinceitdestroysvaluablehumancapital.
Inthiscontext,manyresearcheshavefocusedonanalyzinghowmaterialsandservices
offshoring affect the demand for skilled and unskilledworkers, or on their impact on
3
wagesandwelfare.Althoughthemajorityofthesestudiesaredoneonaper‐countryand
industrybasis,recentstudieshaveattemptedtodistinguishbetweendifferentlevelsof
education and occupations, suggesting in general that services offshoring generates a
positive effect on employment and wages for skilled workers and the opposite for
unskilledworkers(Crinò,2010).
The objective of our study is to contribute to the debate by analyzing the intra‐firm
impactofoffshoringonthedemandforoneofthemostqualifiedworkers:researchers
involved in R&D activities. For this purpose,we use the information of Spanish firms
available for theperiod2004‐2009 fromthePanelofTechnological InnovationPITEC,
createdbytheINE(theSpanishInstituteofStatistics)onthebasisoftheannualSpanish
responses to theCommunity Innovation Survey (CIS).Due to rising unemployment in
Spaininrecentyears,nowitisessentialtoemphasizethediscussionaboutthechanges
needed to achieve sustained long – term growth. According the OECD (2011), Spain
needs to create policies to increase productivity, encourage greater investment in
innovative sectors, and channel investment into human capital. This is important in
ordertocontinuediversifyingproductionandmaintainingsupportforprocessessuchas
theinternationalizationofSpanishenterprises.
Thespecificcontributionofourstudyistwofold:Firstly,weanalyzeaparticulartypeof
offshoring: the purchases of R&D services1 that domestic firms contract from foreign
providers. These highly technological activities may have a stronger effect on the
demandforskilledlabor.JustasMarkusen(2005)states,white‐collarservicesthatare
marketedarecrucialcomplementsfordifferentelementsoftheproductionchain,such
as between skilled labor and the telecommunications and infrastructure teams.
Furthermore,Crinò(2010)emphasizesthatwhite‐collarworkersemployedinservices
activitiesusuallydogoodworkandreceivehighwages.Thisworkrequiresahighlevel
ofknowledge,andalthough inthepast theywereprotectedfromoffshoring,currently
theyaremoreexposedtoit.
Secondly,weuse individual firm‐level data and therefore the effects of offshoring are
1 R&D services are defined in our database as: “Creative work to increase the volume of knowledge and to create new or improved products and processes (including the development of software)”. They include, among others, engineering services, clinical tests or designs.
4
quantifiedwithinthefirmsthatundertakethisoffshoring.Thisdiffersfrommanyother
studies in this field thatuse aggregatedata for countriesor industriesor information
about occupations. In addition, the panel structure of our database allows the use of
suitableeconometricmethodstocontrolfortheheterogeneityoffirms.
Our results suggest the existence of a positive relation between R&D offshoring and
skilled employment for Spanish firms, providing evidence in favor of their
complementarity. In addition,we find that this association is stronger in the services
sectorthaninthemanufacturingsector.
The study has the following structure. In Section 2, we summarize the previous
literatureabouttherelationsbetweenoutsourcing,offshoringandskilledlabor.Section
3includesadescriptionoftheempiricalmodel,thedatabaseandthemainvariables.In
Section4,wepresenttheresultsand,finally,inSection5,weconclude.
2.Outsourcing,offshoringandskilledlabor:Stateoftheart
Literature analyzing the impact of international outsourcing on labor markets has
increasedparallel to theprocessof globalization. Froma theoreticalpointof view, an
important group of papers follow a Helpman and Krugman (1985) style two‐sector
general equilibriummodel of trading countries to identify the forces that can lead to
increased outsourcing. These studies are a usual theoretical reference in the field of
internationaleconomics.
An example is themodel of two countries, North and South, developed by Glass and
Saggi (2001). They assume that international outsourcing in basic production is
developed in low‐incomecountries,whilenorthern firms import components that are
usedtofinishtheproductioninthenorthwithnorthernworkers.Amanufacturedgood
is produced (by international outsourcing in the south)with continuous intermediate
goods that differ in the use of skilled and unskilled workers. All other goods are
produced in the north. In themodel, southern firms perform outsourcing only in the
basic production of old designs, but new developments and designs are produced in
5
northerncountries.Outsourcingiscarriedoutbecauseoftechnologicaldifferencesand
notdifferencesinfactorendowment(asinFeenstraandHanson,1996a).
Inasimilarcontextoftwocountries,AntrásandHelpman’smodel(2004)assumesthe
existenceofheterogeneousfinal‐goodproducersthatchooseownershipstructuresand
locations for the production of intermediate inputs. The equilibrium depends on the
wagedifferentialbetweentheNorthandSouth,ontheownershipadvantageineachof
thecountries,onthedistributionofthebargainingpowerbetweenfinalgoodproducers
andsuppliersofcomponents,andontheheadquarterintensityoftechnology.
Also from amacroeconomic perspective, Grossman and Rossi‐Hansberg (2008) argue
thatcountrieswithdifferentstagesofdevelopment,differenttechnologiesanddifferent
factorendowmentsgeneratedifferentfactorprices.Theywonderabouthowoffshoring
opportunitiesaffectwagesofdifferenttypesoflabor(unskilledlaborandskilledlabor).
Productiontechnologyisspecifiedintermsoftasksandeachtaskrequirestheinputof
some single factor of production. The decision to perform tasks through offshoring
depends on the difference between internal and external prices and communications
technology. The model assumes that tasks can be performed remotely, so that the
productionofagoodcanbeinternationalized.2
Against the above‐mentioned models, which allow for explaining the impact of
offshoring on labor markets frommacroeconomic models, a second group of studies
tries to analyze the same problem from amicroeconomic perspective. These studies
usually include empirical approximationsmadewith data fromamuch larger level of
disaggregation(firm,sector,occupation).
Manyoftheseworkshavecenteredinanalyzingwhetherthe impactofoutsourcingor
offshoringisdifferentforskilledworkers(Hijzenetal.,2005;Canals,2006;Ekholmand
Hakkala, 2006; Geishecker and Görg, 2008 and forthcoming). Although these studies
showdifferentanalyticstructuresand levelsofdisaggregationofdata, ingeneral they
find that highly skilled workers obtain a wage premium due to international
2 Offshoring iscostlyinthesensethatperformingataskatadistancerequiresagreaterfactorinputthanifthetaskisperformednearby,andtasksdifferintheircostsofremoteperformance.

6
outsourcing, which has raised the gap between the wages of skilled workers with
respecttothewagesofunskilledworkersinrecentperiods.Thissuggeststheexistence
of a complementary relationship between international outsourcing and skilled
employment, although its significance depends on aspects such as the inter‐industrial
labormobilityand laborrigidity,whicharealso influencedbypublicpolicieson labor
markets.
Within this second group of studies we want to emphasize the ones that include a
microeconomic foundation. This is the case of the studies by Amiti and Wei (2006),
Criscuolo andGaricano (2010), and Crino (2010),whobeginwith the existence of an
enlarged production function in which offshoring or outsourcing is incorporated.
Assumingthatfirmsmaintainanoptimizingbehavior,theseauthorsreachafunctionof
labordemandthatwillbetheequationtobeestimatedintheempiricalpart. Thiswill
betheapproachinourstudy,giventhetypeofempiricalapproximationthatweintend
todo.3However,wefollowafirmlevelperspectiveinsteadofanindustryperspective,
andweaimtoreachagreaterspecificity in theanalysisof therelationbetween labor
demandandoffshoring,usingtheinformationaboutoffshoreR&DactivitiesofSpanish
firms.Thesectortowhichcompaniesbelongandthetypeoftechnologytheyusewillbe
taken intoaccount,distinguishingbetweenskilledandunskilledworkersand focusing
specificallyonthefirms’demandforresearcherstoperforminsideR&Dactivities.
3.Modelanddata
3.1.Themodel
GiventhetypeofinformationavailableinthePITECdatabase,ourmethodologyconsists
oftheestimationofaconditionallabordemandfunctioninwhichtheoffshoringappears
as a key determinant. This approach is in linewithmany papers that, since Griliches
(1979,1995),estimatetheimpactofR&Dactivitiesonproductivitywithfirm‐leveldata
starting from a standard production function that is augmented with a kind of
3 A more detailed exposition of the model is done in the next section.
7
technological input.4 Inourcase, the firm‐levelproduction function isaugmentedwith
offshoringand internal innovationactivities. Inparticular, theproduction function for
firmiinindustryjiswrittenasfollows:
, & , , , , [1]
whereYrepresentstheoutputthatisafunctionoflabor, & ,physicalcapital,
K, materials,M, and services used as inputs, S. Notice that, as we are interested in
analyzing the impact of R&D offshoring on skilled labor, we distinguish between the
researchers devoted to R&D activities, & , which by definition are highly qualified
workers,andotheremployees, .Astandsforthetechnicalchange,whichisafunction
oftheoffshoringofservices,ossandalsoofinnovationactivitiesdevelopeddomestically
bythefirm,inn.
As was previously mentioned, in this article our concept of service offshoring refers
specifically to thoseactivities inresearchanddevelopmentcarriedoutabroad, that is,
purchases of R&D services from foreign providers, which can be firms of the same
group,firmsoutsidethegroup,publicinstitutions,universities,etc.Wecallthisconcept
R&Doffshoring,whichisdifferentfromtheinnovationactivitiesdevelopeddomestically
bythefirm5,whichwedenoteby inequation(1).
AsinAmitiandWei(2006),weassumethattheprocessofminimizingcostshappensin
twostages:inthefirststage,thefirmchoosesthequantityoftraditionalinputs,whilein
a second stage it chooses the proportion inwhich itwill importmaterial and service
inputs.6Wealsosupposethatall firmsinthesameindustryfaceidenticalinputprices,
including imported inputs and physical capital. In this context, the conditional labor
demandfunctionforR&Demployeescanbeexpressedas:
& , , ,
, [2]
4 Griffith et al. (2006) follow this approach to provide evidence for technology sourcing from the U.S.. The OECD (2007) also uses a similar model to measure the impact on the demand for labour of outsourcing production abroad. The model is estimated using sectoral data for 12 OECD countries for years 1995 and 2000. 5 In particular, this concept includes internal R&D activities (regardless of the remuneration to researchers to avoid double accounting), domestic R&D outsourcing and other innovation expenditures. 6 In addition, the fixed cost of importing services and material inputs may vary by industry. As Amiti and Wei (2006) justify, the level of the sophistication of the inputs are different for each industry, and hence will involve different amounts of search costs to be imported.
8
where , ,, , is the vector of input prices that correspond,
respectively, to thewages of researchers, thewages of the rest of the employees, the
rentalrateoncapital,andthepricesformaterialsandserviceinputs.
As is common in the empirical literature (Hamermesh, 1993; Criscuolo and Garicano,
2010;Crinò,2010), thisequationof conditional labordemandwillbeestimatedusing
thefollowinglog‐linearspecification:
ln & n ln ln ln [3]
whereXstandsforavectorofothercontrolvariablesthatwillbeexplainedafterwards
and istheresidualwiththeusualproperties.Inthisconditionaldemandfunction,
if R&D offshoring increases productivity, we would expect the offshoring to have a
negativeeffecton thedemand forR&Demployment, since fewer inputsareneededto
producethesameamountofoutput.
Alternatively, ifwe substitute in equation [2] for the firm’s profitmaximizing level of
output,which is also a functionof offshoring, the followingdemand function forR&D
laborwouldbeobtained:
& , , ,
, [4]
whichintermsofthelog‐linearspecificationwillbeequivalentto:
ln &ln ln ln ln [5]
The way in which offshoring affects labor demand in this equation is not easily
identifiable, and, furthermore, is one of themain questionswe seek to answer in this
study.InlinewithAmityandWei’s(2006)arguments,R&Doffshoringcouldaffectthe
demandforresearchersthroughthreemainchannels:
1) Asubstitutioneffectthroughthepriceofimportedservices.Afallinthatpricewould
lead to a reduction in the demand for researchers if R&D labor and R&D services
weresubstitutes.However,theeffectcouldbetheoppositeiftheyarecomplements.
9
2) A productivity effect if R&D offshoring leads to improvements in efficiency. Firms
may produce the same quantity of a product with fewer inputs, reducing their
demandforlaborinputs.
3) A scale effect if, as R&D offshoring makes the company more efficient and
competitive, the demand for its product increases and, as a consecuence, the firm
alsohiresmoreemployees.
The net effect of R&D offshoring through these three channels will be captured in
coefficient .Inourfirm‐levelcontext,itisnoteasytopredictwhicheffectwillbethe
predominant effect and in fact this is one of the main questions we want to answer
empiricallyinthestudy.
3.2.Descriptionofthedatabaseandmainvariables
TheempiricalanalysisisdonewiththeinformationprovidedinthePanelofInnovation
Technology (PITEC), from2004 to2009.Thisdatabase is carriedoutby the INE (The
Spanish Statistics Institute) and encloses micro‐data on Spanish firms’ innovation
activities and their conditions for scientific research. Although the PITEC includes a
sampleoffirmsthatdonotundertaketechnologicalactivities,giventheobjectiveofthis
study,we focus theanalysis in the sampleof innovative firms, that is, firms thathave
positiveinnovationexpendituresduringtheperiod.
This database allows us to study offshoring activities for the highest knowledge
intensiveinput:ResearchandDevelopment(R&D).Thedatabaseprovidesinformation
about the R&D done within the firm (in‐house R&D) or outside the firm through a
contractor anagreement (externalR&D).Also,purchasing servicesmay takeplace in
Spainor abroad, and the suppliersmaybe firmsof the samegroup, firmsoutside the
group, public institutions, universities, etc.With this inmind, we use the termR&D
outsourcing for the purchases of R&D services (without taxes) from firms or other
organizationsoutsidethegroup(ifthecompanybelongstoagroup)andthetermR&D
offshoring (oss) forthepurchasesofR&Dservicesabroad,regardlessof the locationof
theprovider.Internationaloutsourcingwillbepartofbothconcepts.

10
In our database, around 7% of firms engaged in offshore R&D activities during the
period. In the manufacturing sector R&D offshoring is greater than in the services
sector: 8% of manufacturing firms purchase R&D services abroad, while for service
firms this percentage is 5%. Among R&D offshorers, around 74% belong to the
manufacturing sector, while 26% belong to the services sector. These percentages
remainratherconstantovertime.
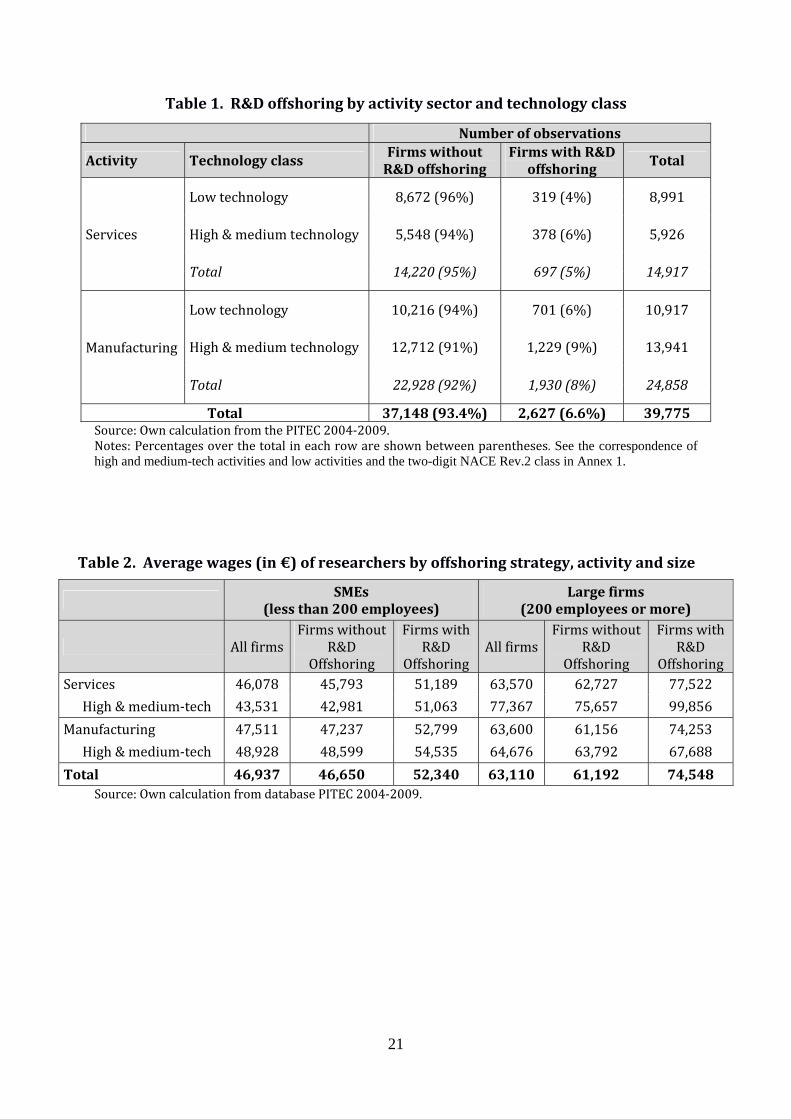
Inaddition, thepresenceofR&Doffshorers ishigher inhighandmediumtechsectors
(seeTable1).AsAñónetal.(2010)pointout,unlikelowtechnologysectors,firmswith
high levels of capital intensity or large firms are more likely to offshore high‐tech
activities because of their ability to manage capital flows, cash flow, and benefits
throughothercountries.
InsertTable1abouthere
TheinformationincludedinthePITECalsoallowsfordistinguishingwhichpartoftotal
employmentinthefirmcorrespondstoresearchersdevotedtoR&Dactivities.Theterm
researcherrefersspecificallytoprofessionalswhoworkonthecreationofnewconcepts,
products or processes, methods and systems, and on the management of respective
projects.7ThisR&Demployment(LR&D) isourmeasureofhigh‐skilledlabordemand.In
our sample, the demand for researchers from the years 2004 to 2009 is half in
manufacturingfirmshalf(3.6)ofwhatitisinservicesfirms(7.1).
Asforwages,theaveragewageforresearchers(wR)hasbeenobtainedfromthePITEC
asthequotientbetweentotalremunerationstoresearchersandR&Demployment.8As
canbeseeninTable2,regardlessoftheactivitysector,theaveragewageofresearchers
is higher in firms with more than 200 employees that offshore R&D activities. In
particular,thehighestsalariesareobtainedbyresearchersthatworkinlargefirmsthat
offshore R&D and operate in high & medium‐tech services sectors. In this case, the
average wage is 47.5% higher when compared with workers in firms with similar
featuresinthemanufacturingsector.
7 We exclude technicians or assistants in administrative tasks associated with R&D activities from this concept technicians or assistants in administrative tasks associated with R&D activities. 8 We have used sectoral price indexes to homogenize the monetary magnitudes of different years. The year 2007 is considered the base year. In the case of wages, we use harmonized labor cost indexes by activity class provided by the Spanish Institute of Statistics.
11
InsertTable2abouthere
The definitions of the rest of the variables included in the theoretical model are as
follows.Domesticinnovationexpenditures(inn)areobtainedasthesumofin‐houseR&D
expenditures (excluding the remunerations to R&D employment), domestic R&D
outsourcing and other innovation expenditures (on acquisition of machines, services,
and equipment, acquisition of external knowledge, preparation for production and
distribution, training, and introduction of innovations). Formanufacturing firms, total
output (Y) is obtained as sales deflated using sectoral price indexes published by the
Spanish Institute of Statistics9. Because there is no data in our database about total
laborcosts,asaproxyofthewagesofotheremployees(wO),weusetheaveragewageof
techniciansandassistantsinadministrativetasksassociatedwithR&Dactivities.These
jobshavealowerlevelofqualification.Itisassumedthatproductpricesandtherestof
theinputpricesarethesameforallthefirmsinthesameindustry.Thisisequivalentto
introducingsectorialdummiesinthemodel.10
Additionally, as control variableswe include dummy variables reflectingwhether the
firmisanexporter,belongstoahighormedium‐techactivitysector,hasmorethan50%
of foreign capital or is a large firm.AsBernand et al. (2007) point out, exporters are
larger, more productive, more capital and skill‐intensive and pay higher wages than
non‐exporters,andMayerandOttaviano(2008)suggestthatFDI‐makersperformbetter
thanexporters.Inaddition,inmanycountriesthereisacorrelationbetweenfirmsthat
importintermediateinputsandthosethatexport(Bernandetal.,2007).Therefore,the
exportingcharacterofafirmwillbeindirectlyreflectingtheoffshoringofintermediate
manufacturing inputs, which is an omitted variable in our model since there is no
informationaboutitinthedatabase.
Asforfirmsize,followingthetheoryofhumancapital(Hamermesh,1980,1993;Kremer
1993;DunneandSchmitz,1992),themostskilledworkerswouldbeemployedbylarge
firmsduetoaspectssuchasthecomplementaritybetweenphysicalandhumancapital,
theadvantagesofmatchingskilledworkerswithotherskilledworkers,andthebetter 9 There are not any series of sectoral price indexes for services activities with the level of sectoral disaggregation needed for the analysis. 10 When the model is estimated as a fixed effects model in panel data using a within-groups estimator, these dummies disappear.
12
capacity to amortize fixed costs associated with the hiring of skilled employees.
Furthermore,asefficiencywagemodelsshow,giventhatmonitoringcostsarehigherin
largefirms,itwouldbepreferableforthemtohireskilledworkers,paygoodwages,and
creategoodworkingconditionsasawaytoavoidtheconstantsearchforworkersandas
anincentiveforemployeestoremaininthefirm(BulowandSummers,1986).
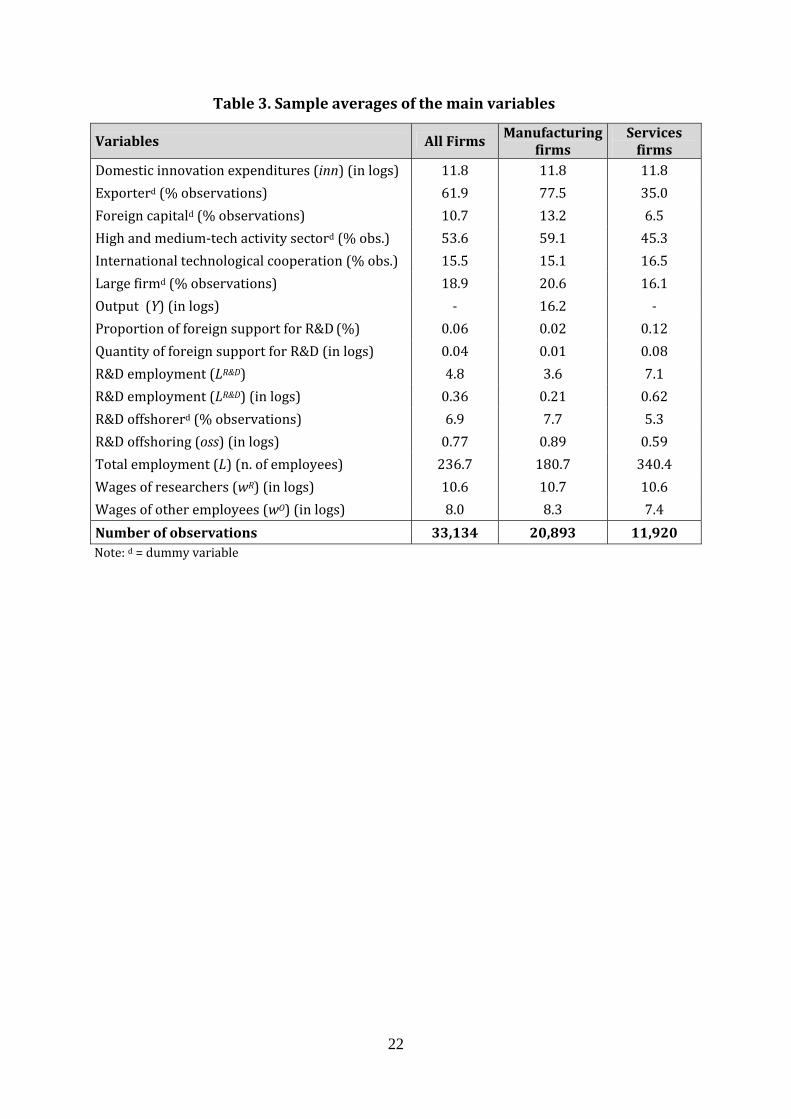
In Table 3, the descriptives of themain variables used in the estimations are shown.
Near62%offirmsareexporters,withthepercentagehigherinthemanufacturingsector
higher than in theservices sector. Inaddition, inalmost10%of firms thepresenceof
foreigncapitalexceeds50%ofownership.
InsertTable3abouthere
4.Results
In this section, we present the evidence obtained from the estimation of the labor
demandfunctioninequation[5].Becauseofthe log‐linearspecificationofthedemand
function,estimatedcoefficientsofcontinuousexplanatoryvariablescanbe interpreted
aselasticities.
Given the panel structure of the data, we have estimated the model, alternatively
assumingalternativelyafixedeffects(FE)modelandarandomeffects(RE)model,and
weuseaHausmanspecificationtesttochooseamongthem.Asitiswellknown,inthe
FEmodelthedistributionofunobservedheterogeneityisnotrestricted,andnothingis
assumed regarding the correlation structure between the individual effects and the
explanatory variables, as the formers are treated as parameters to be estimated
differently for each firm. However, in a random effects model assumptions must be
made about the distribution of unobserved heterogeneity, and this is difficult to
establish especially when the unobservable effects are correlated with other
explanatoryvariables
In our estimates, the coefficients of the FEmodel have been obtained using awithin‐
groupsestimator,whilethecoefficientsoftheREmodelcomefromaGeneralizedLeast
Squares(GLS)estimator.Inbothcases,wepreviouslytestthenormalityassumptionof
13
errors,so that thereexistheteroskedasticand firstorderautocorrelation.11Tocorrect
theseproblemswecalculatepanel‐correctedstandarderror(PCSE)estimates.12
Inaddition,noticethattodevelopthetheoreticalmodelwehaveassumedthatthefirm
minimizes costs in two stages: first, it chooses the quantity of traditional inputs, and
afterwardschoosestheproportion inwhich itwill importmaterialandservice inputs.
However, these decisions could be simultaneous. To control for the potential
endogeneityofR&Doffshoring,wealsoestimatethemodelusinginstrumentalvariables
approaches. Inparticular,we consider two supplementaryvariablesas instruments: a
dummy variable capturing the existence of technological agreements with foreign
partners (international technologicalcooperation), and thepercentageof internalR&D
expenditures financed by foreign companies (proportion of foreign support for R&D).
Sarganoveridentificationtestsareusedtoseethevalidityoftheseinstrumentsineach
specification.
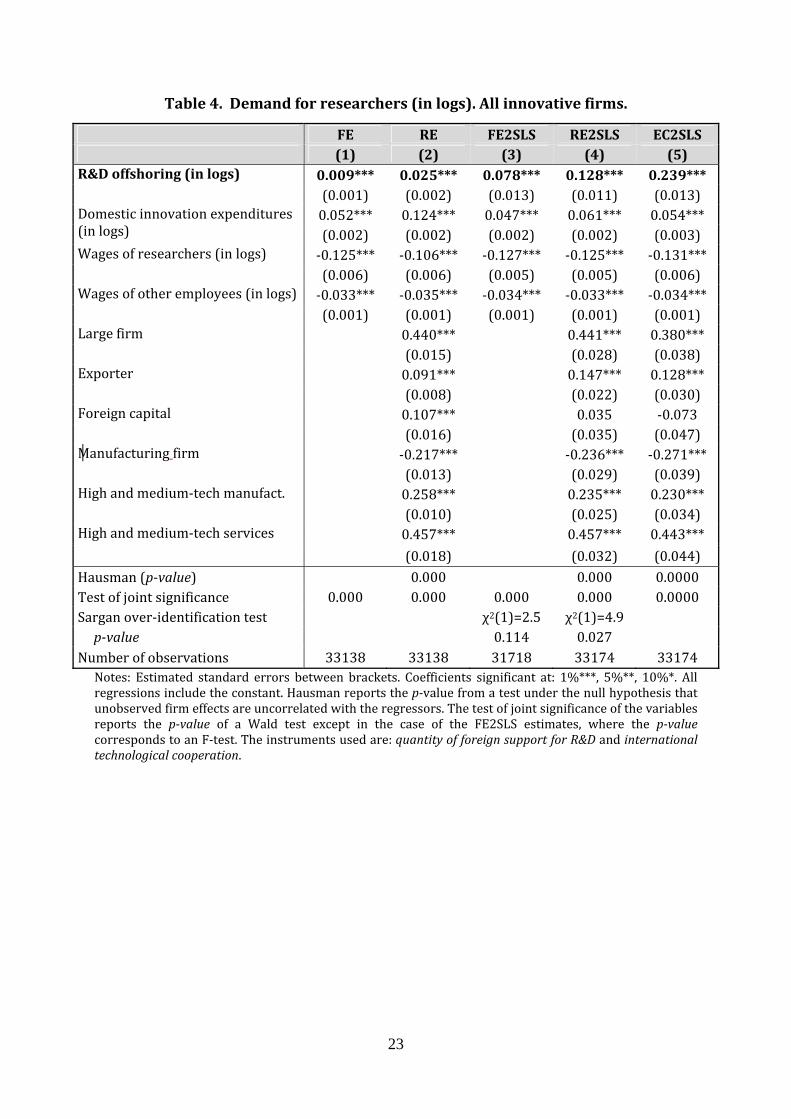
Table4reportstheresultsoftheFEandREmodelswithoutinstruments,aswellasthe
estimationswithinstrumentalvariablesbyFEtwostageleastsquares(FE2SLS),byRE
two stage least squares (RE2SLS), and by Baltagi’s error component two‐stage least
squares(EC2SLS)13,respectively,forallinnovativefirms.
InsertTable4abouthere
Whenmodelswithoutinstrumentalvariablesareconsidered(columns(1)and(2)),the
Hausman test confirms theexistenceof a correlationbetweenobservableexplanatory
variables and individual firm effects, so the coefficients from the FE model are the
consistent ones under the assumption of strict exogeneity of independent variables.
However, as most control variables are time‐invariant and disappear in the within
11 In all cases, a modified Wald test is used to assess whether there exist is heteroskedasticity, as being the null hypothesis of constant variance is rejected. Additionally, a Wooldridge test confirms the presence of first order autocorrelation. These tests are available from the authors upon request. 12 We use the “xtpcse” command in Stata. 13 Baltagi’s EC2SLS, is a matrix- weighted average between 2SLS and FE2SLS, and therefore provides estimates for time invariant variables. See Baltagi (2008), chapter 7, section 7.1.
14
estimator,wekeeptheresultsfromtheREmodeltohaveanintuitionabouttheirimpact
onlabordemandforresearchers.14
In both cases, R&D offshoring has a positive effect on the demand for researchers.
However,aswehavementionedpreviously,wemustbecautiouswheninterpretingthis
resultasacausalrelationshipbetweenR&DoffshoringandthedemandforR&Dlabor:
the estimated coefficient could be biased upward if they were simultaneously
determined by the firm. Nevertheless, the estimates by instrumental variables
procedures(columns(3)to(5))confirmtheexistenceofapositiverelationship,withthe
elasticitybeingbetween0.08and0.24dependingontheassumptionabouttheerrors.In
particular,thecoefficientoftheFE2SLSmodelimpliesthata1percentagepointincrease
inR&Doffshoringraisesthedemandforresearchersbyabout8%.
Therefore,forthisspecifictypeofhighlyqualifiedemployment,theevidenceaboutthe
impact of R&D offshoring seems to suggest the existence of a positive association
betweenR&DemploymentandimportedR&Dservices.Thisisconsistentwithboththe
hypothesisthattheyarestrategiccomplements,andtheprevalenceofascaleeffect:an
increase inoffshoringwouldmake the firmmoreefficientandcompetitive, increasing
thedemand for its product and for all types of employment. The result is also in line
with previous empirical evidence that, with other levels of aggregation in the data,
suggeststhatserviceoffshoringincreaseshighskilledemployment(Crinò,2010).
As for the rest of the variables, unsurprisingly the averagewage of researchers has a
negative impact on their demand, the elasticity near ‐0.13. The wages of other
employeesalsohaveanegativerelationwiththeemploymentofresearchers,although
the magnitude of this elasticity is lower. Domestic expenses on innovation have a
positive effect on R&D employment, which is coherent with Trefler’s (2005) views,
which indicates that in recent years there has been a rapid growth in services that
involve simultaneously involve innovation, intensive processes in technology, and
employmentforwhite‐collarworkers.
14 We have also performed RE2SLS including industry dummies for 2-digit NACE Rev. 2 classes, and the main results remain unchanged. These estimates are available from the authors upon request.
15
All the control variables behave in accordance to the predictions of economic theory.
Whentaking intoconsiderationthevariablesthatappear intheestimationsbyRE,we
observe that exporters, companies in high and medium‐tech sectors, especially in
servicesactivities,andmultinationaland large firmstendtohiremoreresearchers. In
addition,thedummyvariableformanufacturingfirmsreflectsthatthiskindofcompany
demandslessR&Demployment.
Ashasbeenpreviouslyargued,authorssuchasJensen(2009)statethatduringthelast
decade,offshoringhasbeenredirectedfrommanufacturingtoservices.Forthatreason,
inwhatfollowstheresultsareanalyzedseparatelyforthemanufacturingsectorandthe
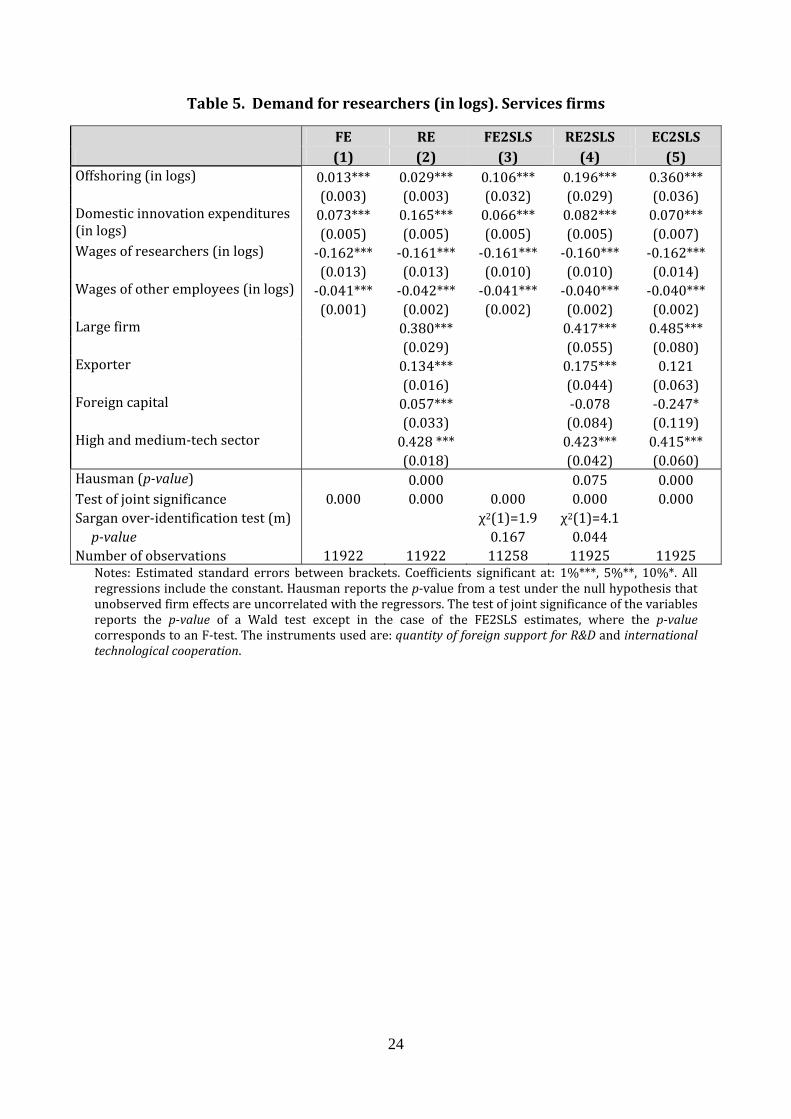
servicessector(seeTables5and6). Inbothsamplesallexplanatoryvariableskeep in
generaltheirsignsandsignificanceingeneralwithrespecttopreviousestimatesforall
innovativefirms.
InsertTable5and6abouthere
Inaddition,whenonlyfirmsintheservicessectorareanalyzed,R&Doffshoringshowsa
positiveassociationwiththedemandforresearchers,astheelasticityishigherthanin
thewholesample. In thiscase,a1percentagepoint increase inR&Doffshoringraises
thedemandforresearchersbyaround11%(seecolumn(3)inTable5).Onceagain,this
suggests that labordemandcanbeaffected through thescaleeffector thatR&D labor
andimportedR&Dservicesarecomplementsinsidethefirm.
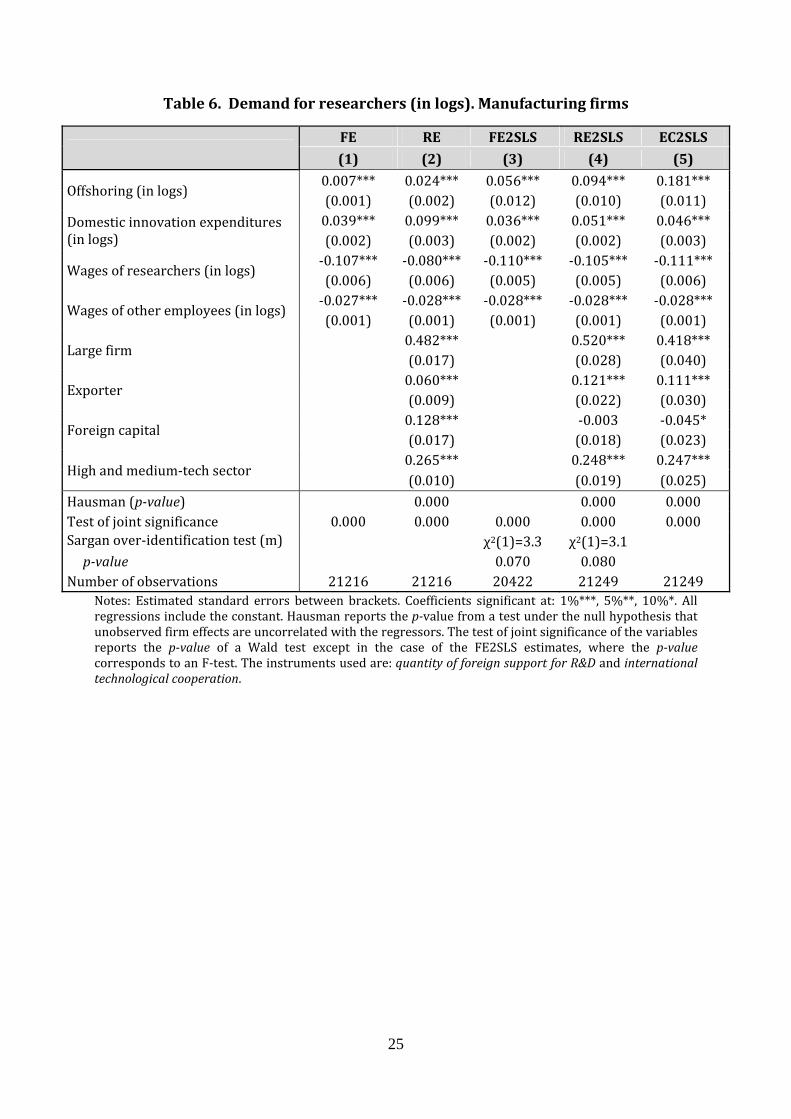
The samepositive relationship is obtained in the sampleofmanufacturing companies
(seeTable6).However,inthiscasetheelasticityofR&DemploymenttoR&Doffshoring
ishalfofwhatitisinservices,showingthatthedemandforhighlyskilledlaborismore
sensitive to changes in offshoring in the latter sector, which is probably due to the
natureofservicesoffshoringthatweareconsideringinthisstudy.
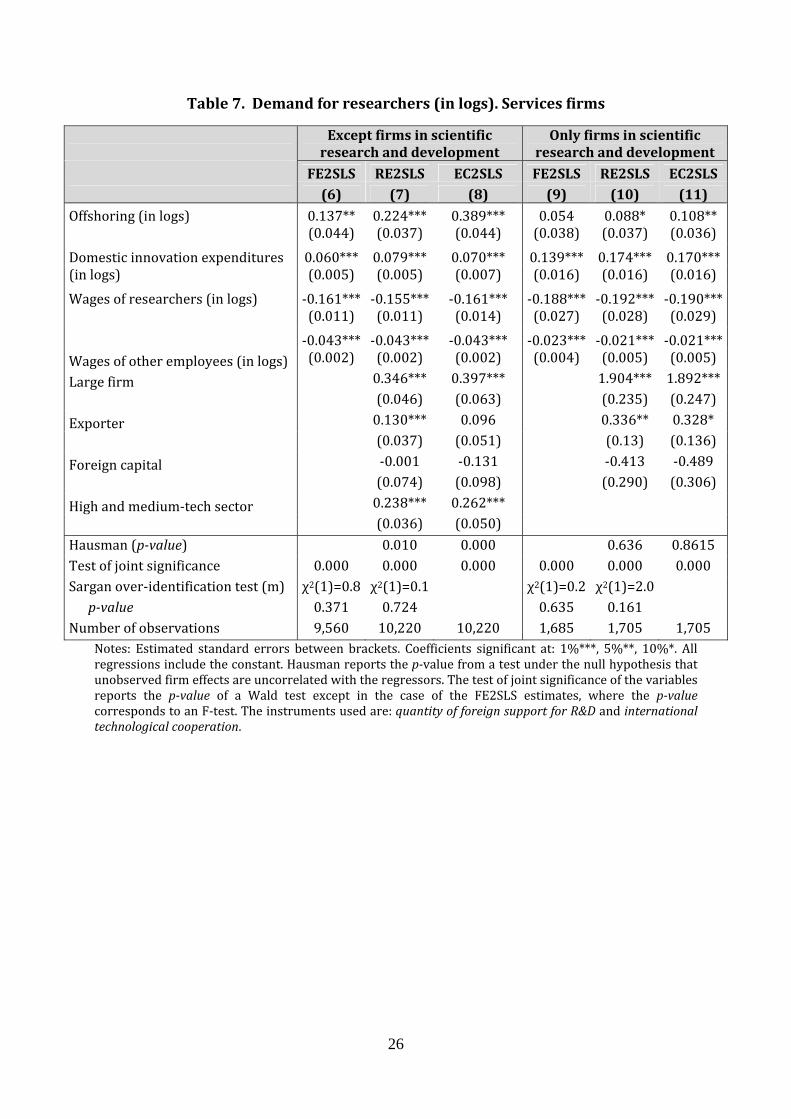
To study this questionmore deeply, estimates in Table 7 split the sample of services
firms in twosubsamples,one for firmsoperatingspecifically in thesectorofScientific
researchanddevelopment,andonefortherestoftheservicesfirms.15
15Forsimplicity,inthiscaseweonlyshowtheresultsobtainedwithIVprocedures.
16
Accordingtothiscriterion,theresultsestablishthattheelasticityofR&Demploymentto
importedR&DservicesislargerwhenweexcludethefirmsintheR&Dsectorfromthe
analysis. However, in this latter industry, the association is much weaker and even
disappearsintheFE2SLSmodel.ThissuggeststhatforfirmsinR&Dactivitiesthescale
effectcouldbepartiallycompensatedbyasubstitutionrelationbetweenbothinputs.
InsertTable7abouthere
Finally,inTable8weproceedtoestimatetheconditionallabordemandforresearchers
(equation[3]) inthemanufacturingsector,giventhat it istheonlysector inwhichwe
can take the firms’ real output into consideration. With this estimation we aim to
disentangle the presence of the scale effect previously mentioned from the potential
complementarityassociationbetweenR&DemploymentandimportedR&Dservices.As
can be seen inTable 8, after adding the output to the specification, the effect of R&D
offshoringonthedemandforresearchersremainspositiveandsignificant,althoughthe
elasticity is smaller. Thiswould confirm that they are complements tomanufacturing
firms.
InsertTable8abouthere
Tocheckrobustness,wehavere‐estimatedtheregressionspresented inTables4 to8
using alternative measures for wages and domestic innovation expenditures, but the
resultsremainbasicallythesame.16
5.Conclusions
Theprocessofoffshoringhasbeendoneindifferentwaysthroughouttheyears.Before
the 1990s, the objective of this strategy was mainly to reduce cost, especially in the
manufacturing sector. In the first decade of the new millennium, this phenomenon
expandedtoservicesactivities,especiallywiththedevelopmentofICTs,theexploitation
ofnewmarkets,andthedevelopmentofnewproducts.
16 In particular, we have considered the average wage for R&D employment relative to the average wage of workers in the sector in which the firm operates. We have also tried to define domestic innovation expenditures by excluding not only the remuneration of researchers, but also the remuneration of technicians and assistants in R&D activities. The results are available from the authors upon request.
17
Therefore, researches have worried about the causes, effects, and tendencies of this
phenomenon. With respect to the studies that seek to analyze the consequences of
offshoringonlabormarkets,oneofthemaindebateshasfocusedonhowmaterialsand
services offshoring affect the demand for skilled and unskilled workers, or on their
impactonwagesandwelfare.
The objective of our study is to contribute to this debate by analyzing the impact of
offshoringonthedemandforoneofthemostqualifiedworkers:researchersinvolvedin
R&D activities. We examine a particular type of offshoring: the purchases of R&D
servicesthatdomesticfirmscontractfromforeignproviders.Thesehighlytechnological
activitiesmayhaveastrongereffectonthedemandforskilledlabor.Fortheempirical
analysisweusefirm‐leveldataofSpanishcompaniesfortheperiod2004‐2009andwe
quantifytheeffectsofR&Doffshoringwithinfirmsthatundertakeinnovativeactivities.
WefindevidenceofapositiverelationbetweenR&Doffshoringandskilledemployment
for Spanish firms. In particular, the estimates by instrumental variables procedures
suggestthata1percentagepointincreaseinR&Doffshoringwillraisethedemandfor
researchersbyabout8%.Thisresultisconsistentwiththehypothesisthatbothinputs
arestrategiccomplements,andwiththeexistenceofascaleeffect:anincreaseinR&D
offshoringwouldmake the firmmore efficient, increasing thedemand for its product
andforalltypesofemployment.Thisconclusionisalsoinlinewithpreviousempirical
evidence with industry‐level data suggesting that service offshoring increases high
skilledemployment(Crinò,2010).
In addition, we find that the elasticity in services firms is double the elasticity in
manufacturingfirms.However,aswewouldexpectgiventhespecifictypeofoffshoring
considered in this study, themagnitude of the elasticity is lower in the subsample of
servicesfirmsperformingR&Dactivities.Inthiscase,thescaleeffectcouldbepartially
compensatedbyasubstitutionrelationbetweenbothinputs.
From our view, governments should be aware that R&D offshoring by services and
manufacturingfirmsisnotathreatbutanopportunity,becauseofitscomplementarity
with high skilled labor, which can be capitalized as long as public policies include
programstoretrainandqualifytheworkforcetoperformtherequiredtasks.
18
References
Amiti,M.andWei,S.‐J.(2005a):“Fearofserviceoutsourcing:Isit justified?”,Economicpolicy20(42),308‐347.
Amiti, M. and Wei, S.‐J. (2005b): “Service offshoring, productivity, and employment:
Evidence from the United States”, IMF Working Papers 05/238, InternationalMonetaryFund.Washington,DC.
Amiti, M. andWei, S.‐J. (2006): “Does service offshoring lead to job losses? Evidence
from theUnited States”,NBERChapters, in: InternationalTrade inServicesandIntangiblesintheEraofGlobalization,NationalBureauofEconomicResearch,Inc.
Antras, P. and Helpman, E. (2004): “Global Sourcing”, Journal of Political Economy
112(3),552‐80Añon,D.,Driffiel,NandTemouri,Y.(2010):“ThefuturesofOffshoringFDIinhigh‐tech
sectors”,Futures42,960‐970.Baltagi,B.H.(2008),EconometricAnalysisofPaneldata,FourthEdition,Chichester:John
Wiley.Bernand, A.J. et al. (2007): “Firms in International trade”, NBER Working paper No
13054.Bulow,J.andSummers,L.(1986):“ATheoryofDualLaborMarkets,withApplicationsto
Industrial Policy, Discrimination, and Keynesian Unemployment”, Journal ofLaborEconomics4,376‐414.
Canals, C. (2006): “Outsourcing and your Collar's Color”, Working Paper Series No.
03/2006,LaCaixa.Crinò,R.(2010):“Serviceoffshoringandwhite‐collaremployment”,ReviewofEconomic
Studies77(2),595–632.Criscuolo, C. and Garicano, L. (2010): “Offshoring and Wage Inequality: Using
Occupational Licensing as a Shifter of Offshoring Costs”, American EconomicReview,May(2),439‐443.
Ekholm,K.andHakkala,K.(2006):“Theeffectofoffshoringonlabordemand:Evidence
fromSweden”,CEPRDiscussionPapers5648,C.E.P.R.DiscussionPapers.Feenstra, R (2004):Advanced International Trade, Theory and Evidence, Ed Pricenton
UniversityPress.Feenstra,R.(2007):“Globalizationanditsimpactonlabour”,wiiwWorkingPaperSeries
No.44,TheViennaInstituteforInternationalEconomicStudies.
19
Feenstra, R. (2010): Offshoring in the Global Economy: Microeconomic Structure andMacroeconomicImplications,TheMITPress,Cambridge,Massachusetts.
Feenstra, R. andHanson, G. (1999): “The impact ofOutsourcing andHighTechnology
Capital on Wages: Estimates for the United States, 1979 – 1990”, QuarterlyJournalofEconomics114,907‐940.
Geishecker, I. (2006): “Does outsourcing to Central and Eastern Europe really threaten
manualworkers’jobsinGermany?”,TheWorldEconomy29(5),559‐583.Geishecker, I. and Görg, H. (2008): “Winners and losers: A micro‐level analysis of
international outsourcing andwages”, Canadian Journal ofEconomics 41(1), 243‐270.
Geishecker, I. andGörg,H. (forthcoming): “Servicesoffshoringandwages:Evidence from
microdata”,OxfordEconomicPapers,doi:10.1093/oep/gpr055.Glass,AandSaggi,K.(2001):“Innovationandwageeffectsofinternationaloutsourcing”,
EuropeanEconomicReview45,67‐86.Griffith, R., Harrison, R. and Van Reenen, J. (2006): “How special is the special
relationship?Using the impact of U.S. R&D spillovers onU.K. firms as a test oftechnologysourcing”,TheAmericanEconomicReview96(5),1859‐1875.
Griliches, Z. (1979): “Issues in assessing the contribution of R&D to productivity
growth”,BellJournalofEconomics10,92–116.Griliches, Z. (1995): “R&D and productivity: econometric results and measurement
issues”. In: Stoneman, P. (Ed.), Handbook of Economics of Innovation andTechnologicalChange.Blackwell,Oxford,pp.52–89.
Grossman,G. andHelpman, E. (1991): “Quality ladders and product cycles”,Quarterly
JournalofEconomics106,557‐586.Grossman, G. and Rossi‐Hansberg, E. (2008): “Trading Task: A Simple Theory of
offshoring”,TheAmericanEconomicReview98(5),1978‐1997.Hamermesh,D.S. (1980): “Commentary”, in J. J. Siegfried (ed.):TheEconomicsofFirm
Size,Market Structure and Social Performance. Washington D.C.: Federal TradeCommission.
Hamermesh,D.S.(1993):LaborDemand.Princeton,NJ:PrincetonUniversityPress.Helpman,E.andKrugman,P.R.(1985):MarketStructureandForeignTrade.Cambridge,
MA:TheMITPress.Hijzen, A., Görg, H. and Hine, R.C. (2005): “International Outsourcing and the Skill
StructureofLaborDemandintheUnitedKingdom”,EconomicJournal115,860‐78.
20
Jensen,P.(2009):“Alearningperspectiveontheoffshoringofadvanceservice”,JournalofinternationalManagement15,181–193.
Kremer, M. (1993): “The O‐Ring Theory of Economic Development”, The Quarterly
JournalofEconomics108,551‐75.Mayer, T. and Ottaviano, G. (2008): “The Happy Few: The internationalization of
European Firms”, Intereconomics: Review of European Economic Policy 43(3),135‐148.
Metters, R. and Verma, R. (2008): “History of offshoring knowledge services”, Journal of
OperationsManagement26,141‐147.OECD(2007):OffshoringandEmployment.TrendsandImpacts.OECD(2010):OECDEconomicGlobalisationIndicators.OECD(2011):OECDPerspectives:SpainPoliciesforasustainablerecovery.Trefler, D. (2005): “Service offshoring: Threats and opportunities”, Brookings Trade
Forum35‐60.
21
Table1.R&Doffshoringbyactivitysectorandtechnologyclass
Numberofobservations
Activity Technologyclass FirmswithoutR&Doffshoring
FirmswithR&Doffshoring Total
Services
Lowtechnology 8,672(96%) 319(4%) 8,991
High&mediumtechnology 5,548(94%) 378(6%) 5,926
Total 14,220(95%) 697(5%) 14,917
Manufacturing
Lowtechnology 10,216(94%) 701(6%) 10,917
High&mediumtechnology 12,712(91%) 1,229(9%) 13,941
Total 22,928(92%) 1,930(8%) 24,858
Total 37,148(93.4%) 2,627(6.6%) 39,775Source:OwncalculationfromthePITEC2004‐2009.Notes:Percentagesoverthetotalineachrowareshownbetweenparentheses. See the correspondence of high and medium-tech activities and low activities and the two-digit NACE Rev.2 class in Annex 1.
Table2.Averagewages(in€)ofresearchersbyoffshoringstrategy,activityandsize
SMEs(lessthan200employees)
Largefirms(200employeesormore)
AllfirmsFirmswithout
R&DOffshoring
FirmswithR&D
OffshoringAllfirms
FirmswithoutR&D
Offshoring
FirmswithR&D
OffshoringServices 46,078 45,793 51,189 63,570 62,727 77,522
High&medium‐tech 43,531 42,981 51,063 77,367 75,657 99,856Manufacturing 47,511 47,237 52,799 63,600 61,156 74,253
High&medium‐tech 48,928 48,599 54,535 64,676 63,792 67,688Total 46,937 46,650 52,340 63,110 61,192 74,548
Source:OwncalculationfromdatabasePITEC2004‐2009.
22
Table3.Sampleaveragesofthemainvariables
Variables AllFirms Manufacturingfirms
Servicesfirms
Domesticinnovationexpenditures(inn)(inlogs) 11.8 11.8 11.8Exporterd(%observations) 61.9 77.5 35.0Foreigncapitald(%observations) 10.7 13.2 6.5Highandmedium‐techactivitysectord(%obs.) 53.6 59.1 45.3Internationaltechnologicalcooperation(%obs.) 15.5 15.1 16.5Largefirmd(%observations) 18.9 20.6 16.1Output(Y)(inlogs) ‐ 16.2 ‐ProportionofforeignsupportforR&D(%) 0.06 0.02 0.12QuantityofforeignsupportforR&D(inlogs) 0.04 0.01 0.08R&Demployment(LR&D) 4.8 3.6 7.1R&Demployment(LR&D)(inlogs) 0.36 0.21 0.62R&Doffshorerd(%observations) 6.9 7.7 5.3R&Doffshoring(oss)(inlogs) 0.77 0.89 0.59Totalemployment(L)(n.ofemployees) 236.7 180.7 340.4Wagesofresearchers(wR)(inlogs) 10.6 10.7 10.6Wagesofotheremployees(wO)(inlogs) 8.0 8.3 7.4Numberofobservations 33,134 20,893 11,920Note:d=dummyvariable
23
Table4.Demandforresearchers(inlogs).Allinnovativefirms.
FE RE FE2SLS RE2SLS EC2SLS (1) (2) (3) (4) (5)R&Doffshoring(inlogs) 0.009*** 0.025*** 0.078*** 0.128*** 0.239***
(0.001) (0.002) (0.013) (0.011) (0.013)Domesticinnovationexpenditures(inlogs)
0.052*** 0.124*** 0.047*** 0.061*** 0.054***(0.002) (0.002) (0.002) (0.002) (0.003)
Wagesofresearchers(inlogs) ‐0.125*** ‐0.106*** ‐0.127*** ‐0.125*** ‐0.131***(0.006) (0.006) (0.005) (0.005) (0.006)
Wagesofotheremployees(inlogs) ‐0.033*** ‐0.035*** ‐0.034*** ‐0.033*** ‐0.034***(0.001) (0.001) (0.001) (0.001) (0.001)
Largefirm
0.440***
0.441*** 0.380***(0.015) (0.028) (0.038)
Exporter
0.091***
0.147*** 0.128***(0.008) (0.022) (0.030)
Foreigncapital
0.107***
0.035 ‐0.073(0.016) (0.035) (0.047)
Manufacturingfirm
‐0.217***
‐0.236*** ‐0.271***(0.013) (0.029) (0.039)
Highandmedium‐techmanufact.
0.258***
0.235*** 0.230***(0.010) (0.025) (0.034)
Highandmedium‐techservices
0.457***
0.457*** 0.443***(0.018) (0.032) (0.044)
Hausman(p‐value) 0.000 0.000 0.0000Testofjointsignificance 0.000 0.000 0.000 0.000 0.0000Sarganover‐identificationtest χ2(1)=2.5 χ2(1)=4.9 p‐value 0.114 0.027 Numberofobservations 33138 33138 31718 33174 33174Notes: Estimated standard errors between brackets. Coefficients significant at: 1%***, 5%**, 10%*. Allregressionsincludetheconstant.Hausmanreportsthep‐valuefromatestunderthenullhypothesisthatunobservedfirmeffectsareuncorrelatedwiththeregressors.Thetestofjointsignificanceofthevariablesreports the p‐value of a Wald test except in the case of the FE2SLS estimates, where the p‐valuecorrespondstoanF‐test.Theinstrumentsusedare:quantityofforeignsupportforR&Dandinternationaltechnologicalcooperation.
24
Table5.Demandforresearchers(inlogs).Servicesfirms
FE RE FE2SLS RE2SLS EC2SLS(1) (2) (3) (4) (5)
Offshoring(inlogs) 0.013*** 0.029*** 0.106*** 0.196*** 0.360***(0.003) (0.003) (0.032) (0.029) (0.036)
Domesticinnovationexpenditures(inlogs)
0.073*** 0.165*** 0.066*** 0.082*** 0.070***(0.005) (0.005) (0.005) (0.005) (0.007)
Wagesofresearchers(inlogs) ‐0.162*** ‐0.161*** ‐0.161*** ‐0.160*** ‐0.162***(0.013) (0.013) (0.010) (0.010) (0.014)
Wagesofotheremployees(inlogs) ‐0.041*** ‐0.042*** ‐0.041*** ‐0.040*** ‐0.040***(0.001) (0.002) (0.002) (0.002) (0.002)
Largefirm 0.380*** 0.417*** 0.485*** (0.029) (0.055) (0.080)Exporter 0.134*** 0.175*** 0.121 (0.016) (0.044) (0.063)Foreigncapital 0.057*** ‐0.078 ‐0.247* (0.033) (0.084) (0.119)Highandmedium‐techsector 0.428*** 0.423*** 0.415*** (0.018) (0.042) (0.060)Hausman(p‐value) 0.000 0.075 0.000Testofjointsignificance 0.000 0.000 0.000 0.000 0.000Sarganover‐identificationtest(m) χ2(1)=1.9 χ2(1)=4.1 p‐value 0.167 0.044 Numberofobservations 11922 11922 11258 11925 11925
Notes: Estimated standard errors between brackets. Coefficients significant at: 1%***, 5%**, 10%*. Allregressionsincludetheconstant.Hausmanreportsthep‐valuefromatestunderthenullhypothesisthatunobservedfirmeffectsareuncorrelatedwiththeregressors.Thetestofjointsignificanceofthevariablesreports the p‐value of a Wald test except in the case of the FE2SLS estimates, where the p‐valuecorrespondstoanF‐test.Theinstrumentsusedare:quantityofforeignsupportforR&Dandinternationaltechnologicalcooperation.
25
Table6.Demandforresearchers(inlogs).Manufacturingfirms
FE RE FE2SLS RE2SLS EC2SLS(1) (2) (3) (4) (5)
Offshoring(inlogs)0.007*** 0.024*** 0.056*** 0.094*** 0.181***(0.001) (0.002) (0.012) (0.010) (0.011)
Domesticinnovationexpenditures(inlogs)
0.039*** 0.099*** 0.036*** 0.051*** 0.046***(0.002) (0.003) (0.002) (0.002) (0.003)
Wagesofresearchers(inlogs)‐0.107*** ‐0.080*** ‐0.110*** ‐0.105*** ‐0.111***(0.006) (0.006) (0.005) (0.005) (0.006)
Wagesofotheremployees(inlogs)‐0.027*** ‐0.028*** ‐0.028*** ‐0.028*** ‐0.028***(0.001) (0.001) (0.001) (0.001) (0.001)
Largefirm0.482*** 0.520*** 0.418***(0.017) (0.028) (0.040)
Exporter0.060*** 0.121*** 0.111***(0.009) (0.022) (0.030)
Foreigncapital0.128*** ‐0.003 ‐0.045*(0.017) (0.018) (0.023)
Highandmedium‐techsector0.265*** 0.248*** 0.247***(0.010) (0.019) (0.025)
Hausman(p‐value) 0.000 0.000 0.000Testofjointsignificance 0.000 0.000 0.000 0.000 0.000Sarganover‐identificationtest(m) χ2(1)=3.3 χ2(1)=3.1 p‐value 0.070 0.080 Numberofobservations 21216 21216 20422 21249 21249
Notes: Estimated standard errors between brackets. Coefficients significant at: 1%***, 5%**, 10%*. Allregressionsincludetheconstant.Hausmanreportsthep‐valuefromatestunderthenullhypothesisthatunobservedfirmeffectsareuncorrelatedwiththeregressors.Thetestofjointsignificanceofthevariablesreports the p‐value of a Wald test except in the case of the FE2SLS estimates, where the p‐valuecorrespondstoanF‐test.Theinstrumentsusedare:quantityofforeignsupportforR&Dandinternationaltechnologicalcooperation.
26
Table7.Demandforresearchers(inlogs).Servicesfirms
Exceptfirmsinscientificresearchanddevelopment
Onlyfirmsinscientificresearchanddevelopment
FE2SLS RE2SLS EC2SLS FE2SLS RE2SLS EC2SLS(6) (7) (8) (9) (10) (11)
Offshoring(inlogs) 0.137** 0.224*** 0.389*** 0.054 0.088* 0.108**(0.044) (0.037) (0.044) (0.038) (0.037) (0.036)
Domesticinnovationexpenditures 0.060*** 0.079*** 0.070*** 0.139*** 0.174*** 0.170***(inlogs) (0.005) (0.005) (0.007) (0.016) (0.016) (0.016)
Wagesofresearchers(inlogs) ‐0.161*** ‐0.155*** ‐0.161*** ‐0.188*** ‐0.192*** ‐0.190***(0.011) (0.011) (0.014) (0.027) (0.028) (0.029)
Wagesofotheremployees(inlogs)‐0.043*** ‐0.043*** ‐0.043*** ‐0.023*** ‐0.021*** ‐0.021***(0.002) (0.002) (0.002) (0.004) (0.005) (0.005)
Largefirm 0.346*** 0.397*** 1.904*** 1.892***
(0.046) (0.063) (0.235) (0.247)
Exporter 0.130*** 0.096 0.336** 0.328*
(0.037) (0.051) (0.13) (0.136)
Foreigncapital ‐0.001 ‐0.131 ‐0.413 ‐0.489
(0.074) (0.098) (0.290) (0.306)
Highandmedium‐techsector 0.238*** 0.262*** (0.036) (0.050) Hausman(p‐value) 0.010 0.000 0.636 0.8615Testofjointsignificance 0.000 0.000 0.000 0.000 0.000 0.000Sarganover‐identificationtest(m) χ2(1)=0.8 χ2(1)=0.1 χ2(1)=0.2 χ2(1)=2.0 p‐value 0.371 0.724 0.635 0.161 Numberofobservations 9,560 10,220 10,220 1,685 1,705 1,705
Notes: Estimated standard errors between brackets. Coefficients significant at: 1%***, 5%**, 10%*. Allregressionsincludetheconstant.Hausmanreportsthep‐valuefromatestunderthenullhypothesisthatunobservedfirmeffectsareuncorrelatedwiththeregressors.Thetestofjointsignificanceofthevariablesreports the p‐value of a Wald test except in the case of the FE2SLS estimates, where the p‐valuecorrespondstoanF‐test.Theinstrumentsusedare:quantityofforeignsupportforR&Dandinternationaltechnologicalcooperation.

27
Table8.Conditionaldemandforresearchers(inlogs).Manufacturingfirms
FE RE FE2SLS RE2SLS EC2SLS
(1) (2) (3) (4) (5)Offshoring(inlogs) 0.006*** 0.022*** 0.054*** 0.089*** 0.166***
(0.001) (0.002) (0.012) (0.010) (0.011)Domesticinnovationexpenditures(inlogs)
0.038*** 0.087*** 0.035*** 0.048*** 0.043***(0.002) (0.003) (0.002) (0.002) (0.003)
Wagesofresearchers(inlogs) ‐0.109*** ‐0.095*** ‐0.112*** ‐0.110*** ‐0.115***(0.006) (0.006) (0.005) (0.005) (0.007)
Wagesofotheremployees(inlogs) ‐0.028*** ‐0.030*** ‐0.028*** ‐0.028*** ‐0.029***(0.001) (0.001) (0.001) (0.001) (0.001)
Largefirms 0.289*** 0.346*** 0.271***(0.018) (0.030) (0.042)
Exporter 0.016 0.065** 0.062*(0.010) (0.022) (0.029)
Foreigncapital 0.059** ‐0.023 ‐0.059**(0.017) (0.018) (0.022)
Highandmedium‐techsector 0.297*** 0.266*** 0.270***(0.010) (0.019) (0.024)
Output(inlogs) 0.048*** 0.097*** 0.047*** 0.073*** 0.068***(0.008) (0.004) (0.007) (0.005) (0.008)
Hausman(p‐value) 0.000 0.000 0.000Testofjointsignificance 0.000 0.000 0.000 0.000 0.000Sargan overidentificationtest(m) χ2(1)=2.5 χ2(1)=2.0 p‐value 0.111 0.158 Numberofobservations 20,895 20,895 20,112 20,926 20,926
Notes: Estimated standard errors between brackets. Coefficients significant at: 1%***, 5%**, 10%*. Allregressionsincludetheconstant.Hausmanreportsthep‐valuefromatestunderthenullhypothesisthatunobservedfirmeffectsareuncorrelatedwiththeregressors.Thetestofjointsignificanceofthevariablesreports the p‐value of a Wald test except in the case of the FE2SLS estimates, where the p‐valuecorrespondstoanF‐test.Theinstrumentsusedare:quantityofforeignsupportforR&Dandinternationaltechnologicalcooperation.
28
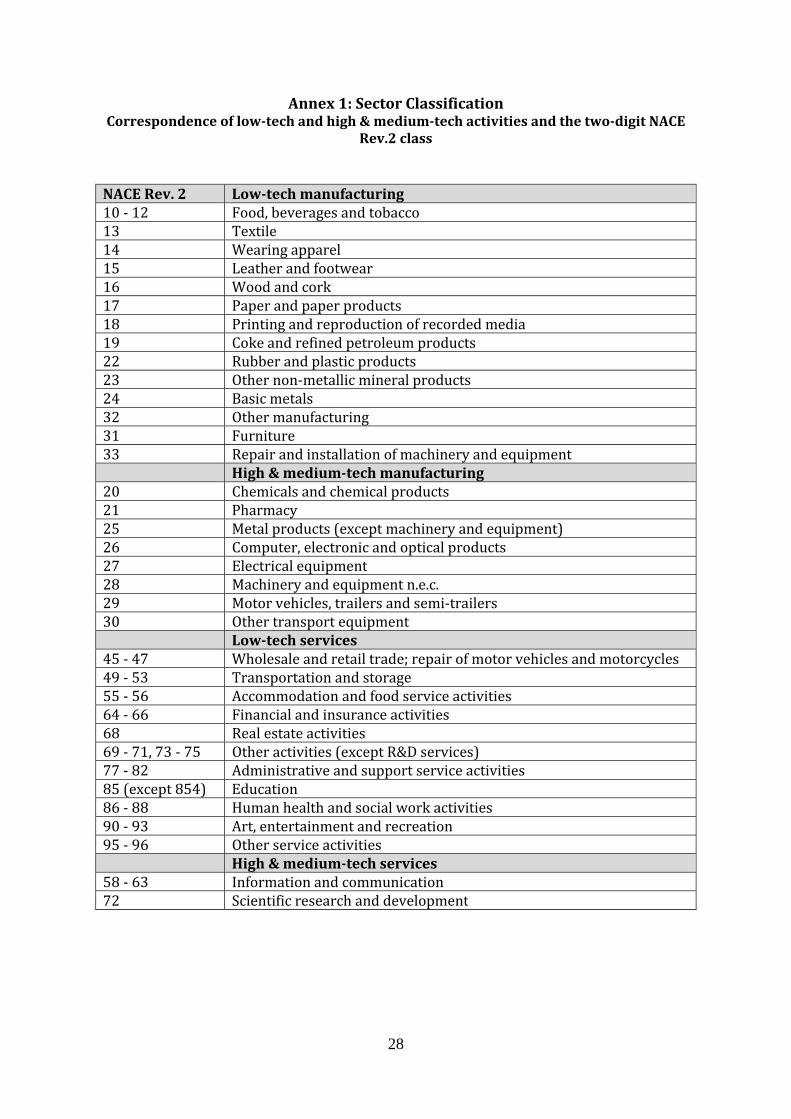
Annex1:SectorClassificationCorrespondenceoflow‐techandhigh&medium‐techactivitiesandthetwo‐digitNACE
Rev.2classNACERev.2 Low‐techmanufacturing10‐12 Food,beverages andtobacco13 Textile14 Wearingapparel15 Leatherandfootwear16 Woodandcork17 Paperandpaperproducts18 Printingandreproduction ofrecordedmedia19 Cokeandrefinedpetroleumproducts22 Rubberandplastic products23 Othernon‐metallicmineralproducts24 Basicmetals32 Othermanufacturing31 Furniture33 Repairandinstallationofmachineryandequipment High&medium‐techmanufacturing20 Chemicalsandchemicalproducts21 Pharmacy25 Metalproducts(exceptmachineryandequipment)26 Computer,electronicandopticalproducts27 Electricalequipment28 Machineryandequipmentn.e.c.29 Motorvehicles,trailersandsemi‐trailers30 Othertransportequipment Low‐techservices45‐47 Wholesaleandretailtrade;repairofmotorvehiclesandmotorcycles49‐53 Transportation andstorage55‐56 Accommodationandfoodserviceactivities64‐66 Financialandinsurance activities68 Realestateactivities69‐71,73‐75 Otheractivities (exceptR&Dservices)77‐82 Administrativeandsupportserviceactivities85(except854) Education86‐88 Humanhealthandsocialworkactivities90‐93 Art,entertainmentandrecreation95‐96 Otherserviceactivities High&medium‐techservices58‐63 Informationandcommunication72 Scientificresearchanddevelopment