Allocation of scarce water resources using deficit irrigation in rotational systems
Upload
khangminh22Category
view
1download
0
THE DEVELOPMENT OF A RETENTION MODEL FOR SCARCE-
SKILLED PROFESSIONALS IN THE HEALTH SECTOR
by
SHIKSHA REDDY
submitted in accordance with the requirements
for the degree of
DOCTORATE IN BUSINESS LEADERSHIP
in the subject of
Business Leadership
at the
UNIVERSITY OF SOUTH ARICA
Supervisor: Prof Renier Steyn
November 2015

i
ACKNOWLEDGEMENTS
Firstly, I would like to thank the Almighty God for giving me the strength, courage and
good health to complete my PhD. Secondly, I would like to thank my parents and
family for being my pillars of strength and for all the support. Thirdly, I would like to
thank UNISA grants division for the bursary I received for my final year of my studies.
Lastly, I would like to acknowledge my supervisor Prof Renier Steyn for the
encouragement, guidance and support.
ii
ABSTRACT
The shortage of skilled professionals in the health sector has been an ongoing
problem. This has resulted in poor service delivery and ultimately increased patient
deaths. The primary objective of this study was to develop a conceptual model to
retain scarce skilled professional workers in the health sector. An exploratory study
was conducted which included both professionals and non-professionals in the
pathology sector. Recruitment was done from a population of 207 employees. In total
188 employees responded, of which 116 were professionals and a comparator group
of 72 being the non-professionals. The study was conducted in three phases. In the
first phase, quantitative data collection methods such as the job diagnostic survey,
career orientation inventory, organisational commitment questionnaire and intention
to quit questionnaire were used to assess the characteristics of the groups of
interest. The relationship between the independent and dependent variables were
calculated. The results revealed that only a few of the traditional predictors influenced
retention in the professional group. The predictors worked much better for the non-
professional group. It was concluded that traditional retention strategies are not
suitable to retain professionals in the health sector. The second and third phases
utilised qualitative methods. The second part of the study related to identifying factors
which retain professional staff. Following interviews with 15 professionals, ten
themes were identified which relate to the retention of professionals. The third phase
of the study consisted of interviews with 3 managers, and this was to determine what
the managers can do to influence retention. A retention model for the professionals
was then developed. This model not only contributes to the body of knowledge, but is
also a useful managerial tool to manage professionals in the health sector.
iii
TABLE OF CONTENT
ACKNOWLEDGEMENTS ............................................................................................ i
ABSTRACT ................................................................................................................. ii
LIST OF TABLES ...................................................................................................... xi
LIST OF FIGURES ................................................................................................... xiii
CHAPTER ONE: INTRODUCTION ............................................................................. 1
1.1 Problem review ............................................................................................. 1
1.2 Overview ....................................................................................................... 2
1.3 Empirical investigations ................................................................................ 3
1.4 Aim ............................................................................................................... 4
1.5 The problem in context ................................................................................. 4
1.6 Problem statement ...................................................................................... 20
1.7 Definitions ................................................................................................... 21
1.8 Objectives ................................................................................................... 21
1.9 Research questions .................................................................................... 22
1.10 Hypotheses ................................................................................................. 23
iv
1.11 Proposition .................................................................................................. 24
1.12 Rationale..................................................................................................... 25
1.13 Significance and contribution by the study .................................................. 26
1.14 Limitations ................................................................................................... 27
1.15 Summary .................................................................................................... 27
CHAPTER TWO: LITERATURE REVIEW ................................................................ 28
2.1 Introduction ................................................................................................. 28
2.2 Retention theories linked to motivation, human resource practices and
culture ......................................................................................................... 28
2.3 Theories on Job Characteristics ................................................................. 35
2.3.1 Phase 1 of the job characteristics model: Job characteristics ...... 36
2.3.2 Phase 2 of the job characteristics model: Psychological states .... 37
2.3.3 Moderating variables of the job characteristics model .................. 39
2.3.4 Phase 3 of the job characteristics model: Job outcomes .............. 40
2.3.5 Application of the job characteristics model .................................. 41
2.3.6 Empirical evidence of the usefulness of the job characteristics
model ........................................................................................... 43
2.4 Theories on career anchors ........................................................................ 48
v
2.4.1 Autonomy/ independence ............................................................. 50
2.4.2 Security/stability............................................................................ 51
2.4.3 Technical/function ......................................................................... 52
2.4.4 General managerial ...................................................................... 53
2.4.5 Entrepreneurial creativity .............................................................. 54
2.4.6 Service/dedication to a cause ....................................................... 55
2.4.7 Pure challenge.............................................................................. 56
2.4.8 Life style ....................................................................................... 57
2.4.9 Major changes that have occurred in the world, affecting work and
career anchors ............................................................................. 58
2.4.10 Related research on career anchors ............................................ 62
2.5 Theories on job satisfaction ........................................................................ 65
2.6 Theories on Organisational commitment .................................................... 75
2.7 Theories on intention to quit........................................................................ 79
2.8 Summary .................................................................................................... 80
CHAPTER THREE: RESEARCH METHODS ........................................................... 82
3.1 Introduction ................................................................................................. 82
vi
3.2 Research design ......................................................................................... 82
3.2.1 Type of study ................................................................................ 83
3.2.2 Data collection .............................................................................. 85
3.2.3 Control of variables ....................................................................... 85
3.2.4 Purpose of the study ..................................................................... 86
3.2.5 Time dimension ............................................................................ 86
3.2.6 Topical scope and depth of study ................................................. 86
3.2.7 Research environment ................................................................. 87
3.2.8 Participants’ perceptions of the study ........................................... 87
3.2.9 Description of plan of research ..................................................... 87
3.2.9.1 Procedure for data collection ................................................. 89
3.2.9.2 Pre-testing the method and instrument .................................. 91
3.3 Sampling strategies .................................................................................... 92
3.3.1 Unit of analysis ............................................................................. 93
3.3.2 Target population .......................................................................... 93
3.3.3 Sampling design ........................................................................... 94
3.3.4 Sample size .................................................................................. 97
vii
3.4 Components of measuring instrument ........................................................ 99
3.4.1 Job diagnostic survey ................................................................... 99
3.4.2 Job satisfaction ........................................................................... 104
3.4.3 Career anchor questionnaire ...................................................... 106
3.4.4 Organisational commitment questionnaire ................................. 110
3.4.5 Intention to quit questionnaire .................................................... 112
3.5 Data analysis and statistical techniques ................................................... 113
3.5.1 Quantitative analysis .................................................................. 114
3.5.2 Qualitative analysis ..................................................................... 117
3.6 Bias ........................................................................................................... 118
3.7 Validity ...................................................................................................... 121
3.8 Reliability .................................................................................................. 123
3.9 Generalisability ......................................................................................... 123
3.10 Ethical considerations ............................................................................... 124
3.11 Summary .................................................................................................. 125
CHAPTER FOUR: RESULTS AND FINDINGS ...................................................... 126
4.1 Introduction ............................................................................................... 126

viii
4.2 Results pertaining to the quantitative study .............................................. 126
4.2.1 Demographic information ........................................................... 127
4.2.2 Descriptive statistics pertaining to questionnaires ...................... 128
4.2.2.1 Descriptive statistics pertaining to career anchors ............... 128
4.2.2.2 Descriptive statistics pertaining to job characteristics .......... 130
4.2.2.3 Descriptive statistics pertaining to intention to quit ............... 133
4.2.2.4 Descriptive statistics pertaining to organisational
commitment ......................................................................... 136
4.2.2.5 Descriptive statistics pertaining to satisfaction ..................... 137
4.2.3 Correlation between predictor variables and intention to quit ..... 139
4.2.4 Correlation between predictor variables and organisational
commitment ............................................................................... 148
4.3 Results pertaining to the qualitative study ................................................ 157
4.3.1 Results of phase two of the study ............................................... 158
4.3.1.1 Thematic analysis of the responses to questions relating to the
retention of professional staff in the pathology
environment ......................................................................... 160
4.3.1.2 Professional employees’ viewpoints on retention in the
pathology industry ................................................................ 160
ix
4.3.1.3 Commonality of themes across questions: Professional
employees on retention in the pathology industry ................ 177
4.3.2 Managers’ viewpoints on retention in the pathology industry ..... 180
4.3.2.1 Commonality of themes across questions: managers of
professional employees on retention in the pathology
industry ................................................................................ 184
4.4 Summary .................................................................................................. 185
CHAPTER FIVE: DISCUSSION .............................................................................. 187
5.1 Introduction ............................................................................................... 187
5.2 Discussion in respect of the objectives of the research study ................... 187
5.2.1 Conclusions pertaining to objective one ..................................... 188
5.2.2 Conclusions pertaining to objective two ...................................... 190
5.2.3 Conclusions pertaining to objective three ................................... 193
5.2.4 Conclusions pertaining to objective four ..................................... 196
5.2.5 Conclusions pertaining to objective five ...................................... 202
5.2.6 Conclusions pertaining to objective six ....................................... 204
5.2.7 Conclusions pertaining to objective seven .................................. 206
5.3 Proposed retention model for scarce-skilled professionals in pathology ... 207
x
5.3.1 Description of the retention model .............................................. 208
5.3.2 Application of the retention model .............................................. 209
5.4 Contribution to the body of knowledge ...................................................... 214
5.5 Limitations and recommendations ............................................................ 214
5.6 Summary .................................................................................................. 215
REFERENCES ........................................................................................................ 216
APPENDIX ONE: COMBINED QUESTIONNAIRE ................................................. 234
APPENDIX TWO: TABLE SHOWING QUESTIONS USED IN THE CAREER
ORIENTATION INVENTORY FOR EACH CAREER ANCHOR .............................. 253
APPENDIX THREE: TABLE SHOWING SAMPLE SIZE AND RESPONSES OF
POPULATION AND AREAS ................................................................................... 254

xi
LIST OF TABLES
Table 3.1 Descriptors of research design ................................................................. 83
Table 3.2 Summary of research questions and research techniques used ............. 89
Table 4.1 Descriptive statistics pertaining to career anchors (N = 188) .................. 128
Table 4.2 Means, standard deviations and ANOVA’s: Career anchors (professional
and administrative staff) ......................................................................................... 129
Table 4.3 Descriptive statistics pertaining to job characteristics (N = 188) ............. 131
Table 4.4 Means, standard deviations and ANOVA’s: Job characteristics
(professional and administrative staff) .................................................................... 132
Table 4.5 Descriptive statistics pertaining to intention to quit (N = 188) ................. 134
Table 4.6 Means, standard deviations and ANOVAS: Total intention to quit
(professional and administrative staff) .................................................................... 134
Table 4.7 Descriptive statistics pertaining to organisational commitment (N = 188) 136
Table 4.8 Means, standard deviations and ANOVA’s: Organisational commitment
(professional and administrative staff) .................................................................... 137
Table 4.9 Descriptive statistics pertaining to satisfaction (N = 188) ........................ 137
Table 4.10 Means, standard deviations and ANOVA’s: Satisfaction (professional and
administrative staff) ................................................................................................ 138
xii
Table 4.11 Correlation between career anchors and intention to quit per staff status
............................................................................................................................... 140
Table 4.12 Correlation between job characteristics and intention to quit per staff
status ...................................................................................................................... 143
Table 4.13 Correlation between satisfaction and intention to quit per staff status .. 145
Table 4.14 Correlation between organisational commitment and intention to quit per
staff status .............................................................................................................. 147
Table 4.15 Correlation between career anchors and organisational commitment per
staff status .............................................................................................................. 149
Table 4.16 Correlation between job characteristics and organisational commitment
............................................................................................................................... 152
Table 4.17(ii) Correlation between satisfaction and organisational commitment per
staff status .............................................................................................................. 156
Table 4.18 Summary of theme per questions ......................................................... 179
Table 4.19 Summary of themes .............................................................................. 179
xiii
LIST OF FIGURES
Figure 2.1: Maslow’s hierarchy of needs (Maslow, 1943) .......................................... 30
Figure 2.2: Human resource management health care framework (Neil & Reimann,
2010) ......................................................................................................................... 33
Figure 2.3: Job characteristics model (Hackman and Oldham, 1975) ....................... 35
Figure 2.4: Vroom’s expectancy theory (Vroom, 1964) ............................................. 44
Figure 2.5: Job satisfaction in context (Morrison et al., 2007).................................... 72
Figure 2.6: Job satisfiers linked to organisational commitment (Dunn et al., 2012). .. 78
Figure 4.1: Correlation between predictor variables to intention to quit and
organisational commitment ...................................................................................... 157
Figure 5.1: Retention model for professionals in the pathology sector. ................... 207
1
CHAPTER ONE: INTRODUCTION
1.1 Problem review
The shortage of scarce-skilled professionals in both South Africa and the global
context has led to a serious crisis, especially in the South African health sector.
These scarce-skilled professionals are difficult to retain, which results in a high
turnover of medical professionals, with severe consequences. These include the
inferior quality of the health services, deteriorating patient care, and ultimately more
patient deaths (Department of Health Annual Report, 2014).
Effective employee retention is a systematic effort by employers to create an
environment that encourages employees to remain in the organisation by having
systems, policies and practices in place to accommodate their diverse needs (Jain,
2011). Staff turnover can have vast financial implications for an organisation, such as
the loss of clients, low morale, the added costs of the recruiting process and then
training the new employees. It is not only the cost incurred by a company that
emphasizes the need for retaining employees but also the prevention of these
talented, skilled employees from being head-hunted (Jain, 2011).
According to Thomas, Venter and Boninelli (2010), it is difficult to quantify the
contribution of the human resource function to the bottom line profitability of any
company. Staff shortages impact indirectly on company profitability by decreasing the
known costs associated with the following: “the recruitment and training of new staff,
the impact of negative morale of existing staff that may carry excessive workloads
and the mistakes and poor quality of work that may occur while new staff are being
trained” (Thomas et al., 2010: 60).
2
Implementing an effective retention strategy can significantly reduce the high costs of
increased turnover, prevent the loss of company knowledge and protect the
intellectual property of the organisation, diminish the interruption of customer service
and maintain the good will of the company, which in turn will regain the efficiency and
effectiveness of the services (Jain, 2011). Staff turnover can lead to a vicious cycle if
it is not corrected; hence retention strategies are of high importance in all
organisations, especially the health sector, which is responsible for patients’ lives.
1.2 Overview
While a wide range of retention strategies has been introduced in various settings to
reduce unnecessary staff turnover and increase their length of stay, only a few of
these have been rigorously evaluated. Little evidence demonstrating the
effectiveness of any specific strategy is currently available, with the possible
exception of health worker obligation (Buykx, Humphreys, Wakerman & Pashen,
2010). The health profession suffers from the lack of skilled professionals, resulting in
poor service delivery, which is detrimental to patients’ health and welfare.
This study is specific to pathology laboratories, as no previous studies on retention
have been conducted in the pathology environment. Pathology is important in
diagnostics, and, should a breakdown occur at this level, the doctor cannot diagnose
the patient, resulting in incorrect or delayed treatment. This can be detrimental to the
patient’s life and can have disastrous consequences. Furthermore, no previous
studies have been conducted to investigate the development of a conceptual
retention model for professional scarce-skilled employees. Three private laboratories
linked to hospitals were used in this study. Two of the laboratories were private and
the third was an academic private laboratory which collaborates with a public
3
laboratory. The geographical areas covered were Gauteng, KwaZulu Natal and
Eastern Cape areas. There were no previous studies evaluating a combination of
theoretical models, such as career anchors, job characteristics, job satisfaction
organisational commitment and intention to quit in relation to the retention of scarce-
skilled employees. This study is therefore of critical significance and will add value to
the body of knowledge.
1.3 Empirical investigations
An extensive literature review was conducted, and a gap was revealed, as there is no
effective retention strategy for professionals in the health sector to date. The existing
literature was evaluated, concepts were integrated holistically to fill the gap and a
retention model was developed. Further, the research focused only on variables
relating to the retention of the individual and to voluntary migration. The wider social,
economic and political issues were seen as beyond the scope of the thesis.
None of the previous research conducted used a combination of four important,
widely-researched theoretical models. The job characteristics model and job
satisfaction by Hackman and Oldham (1975) and the career anchors by Schein
(1985) were used as the basis of the study. The sample size used was 207, 129 of
whom were professionals in the health sector, while the other 78 were non-
professionals also in the health sector. However, a total of only 188 participants
responded, with 116 comprised of professional staff, while 72 were the non-
professional staff. The research methods followed were the job diagnostic survey by
Hackman and Oldham (1975), Schein’s (1985) career orientations survey, the
intention to quit questionnaire by Arnold and Feldman (1982) and the organisational
commitment questionnaire by Allen and Meyer (1990). All these research tools have
4
been validated and have produced strong research instruments, hence providing
valid results. The job diagnostic survey was selected for this research because it was
developed specifically from the job characteristics model of work motivation and has
been used in all the basic research conducted with this model (Hackman & Oldham,
1976).
The research was conducted in three phases. In the first phase of the study, the
employees had to complete all five of the questionnaires, which involved the
quantitative basis. This determined the first three objectives. On the basis of the
results of the first phase of the study, the second and third phases were added. The
second phase included interviews with 15 of the professionals. Five participants from
each of the provinces were asked structured questions pertaining to what would
make them leave their job and what would induce them to stay. The third phase of
the study was based on interviews with the general manager to determine the
possibility of amending the working conditions to accommodate changes to job
characteristics in order to facilitate retention. A retention model was then designed
based on the results of the three phases of the study.
1.4 Aim
The aim of the research was to develop a conceptual model for the retention of
scarce-skilled professional employees in the health sector.
1.5 The problem in context
There is a serious shortage of trained personnel in the South African health sector.
Both the private and public hospitals have also had their share of problems with the
shortage of skilled labour. According to Stanz and Greyling (2010: 75), “professionals
5
are seeking alternative employment in the form of lucrative work overseas which will
in turn have a catastrophic effect on the delivery of health care over the next
decade”. According to the Human Sciences Research Council, it is estimated that
South Africa will have a shortage of 19 000 nurses within eight years. The Faculty of
Health Sciences at the University of Cape Town has also reported increased
pressure on remaining staff brought about by critical staff shortages (Stanz &
Greyling, 2010).
Shipalana and Phago (2014) go on to state that the turnover among health care
professionals is a major global challenge, of which the developing countries have
largely borne the brunt. In particular, South Africa has also experienced this problem
of turnover in its hospitals, with dire consequences, such as high vacancy rates, as it
has become increasingly difficult to fill posts sustainably. Staff turnover in the public
health care institutions is a major concern because it affects the quality of health care
services, the stability of the services and the morale of the remaining employees.
To add to this, Mokoka, Oosthuizen and Ehlers (2010) maintain that, in order to
prevent crisis in the South African health care services, the shortage of nurses has to
be remedied. Previous studies have found that nurses change their work
environment because of dissatisfaction with their job situations. The author then
concludes that if the working environment were conducive to the employees’
satisfaction this could help to retain these nurses. He also states that retention
strategies would be effective if the correct retention strategies were implemented.
Ehlers (2006) stated that a number of international studies confirm that the ratio of
nurses to patients influences patient-related outcomes. A review of 22 international
studies indicates that the lower ratios of patients to nurses were associated with
6
improved patient outcomes.
Burch and Reid (2008: 25) stated that, in 2008, there was a shortage of about
80 000 doctors in the public sector and vacancy rates for doctors in excess of 50% in several provinces. Of the 70% of all doctors who work in the private sector approximately only 10 600 doctors were left to provide a service for the 85% of South Africans who do not have private health insurance.
The author further reiterates the problem of the public-private battle, by stating that
the public-private health care situation is far from equitable and the situation in the
rural areas of South Africa is appalling. Burch and Reid (2008: 25) stated that:
At least 46% of South Africa’s 49 million rural residents are served by only 12% of our doctors, mostly from the public sector, and 19% of our nurses. Not only are the public health services grossly insufficient and inequitable, but some of our medical schools have the greatest proportion of emigrating health care professionals in the world.
According to Velaphi and Rhoda (2012), it was noted in the 6th perinatal care survey
reported for 2011 that 46% and 39% of early neonatal deaths occurred in district and
regional hospitals respectively. The author stated that the main reason for these
deaths was the shortage of skilled, trained personnel, which leads to poor service
delivery. Bradshaw, Van Wyk, Laubscher, Nojilana, Groenewald, Nannan and
Metcalf (2010) went on to state that hospital-acquired infections of patients admitted
to public and private hospitals had increased, as had the number of patient deaths in
many of the surrounding hospitals. The annual number of registered deaths
increased from about 320 000 in 1997 to just over 612 000 in 2006, dropping slightly
in 2007. The statistics from 2007 to 2010 show an increase of 43.9% in the deaths in
hospital. On investigation, it was found that the root cause of increased nosocomial
infections was the shortage of skilled professionals (Bradshaw et al., 2010).
The HIV/AIDS and TB epidemics in South Africa and other African countries since
7
2012 have resulted in more patients becoming ill, and requiring hospitalisation and
monitoring (Department of Health Annual Report, 2013-2014). This also increased
the number of patients requiring health care treatment. The problem is enormous, as,
with the existing number of patients, the hospitals cannot cope with the workload.
Now that more patients are being admitted and developing secondary and
opportunistic infections, both the private and the public hospitals are experiencing an
influx of patients. The snowball effect renders the problem uncontrollable.
Furthermore, more doctors, nurses and scientists will be required to perform research
into the major HIV/AIDS and TB epidemics, depleting the professionals in the health
sector even further.
Stodel and Steward-Smith (2011) commented on the HIV and AIDS burden on the
health care system by stating that AIDS has resulted in increasing numbers of patient
deaths, and a higher burden of disease. This has added to the workload, and, in
many cases, also to the complexity of the decisions to be made. All the above factors
have increased the burnout rate among the majority of the doctors. At the same time
there has been a significant exodus of doctors from South Africa. This results in an
increased workload for those remaining.
The seriousness of the problem is clear. Although posts are advertised and made
available, there is no interest among health care professionals in applying for these
posts. There is also no successful strategy for retaining the remaining health care
professionals who still have to work under these unpleasant conditions. However, the
report did state that a total of 612,118 new patients had been placed on antiretroviral
treatment (ART) and the department was on track to reach the target of 3 million
patients on antiretroviral treatment by 2015/16 (Department of Health Annual Report,
8
2013-2014). The rapid increase of patients on antiretroviral treatment is supported by
the number of nurses trained and certified to initiate antiretroviral treatment. The
trained nurses increased from 10,000 in the 2011/12 financial year to 23,000 nurses
by the end of the 2012/13 financial year (Department of Health Annual Report, 2013-
2014). However, there was no mention in the report of how these trained nurses
would be retained in the health sector, which brings one back to the importance of
this study.
Strachan, Zabow and van der Spuy (2011: 523) express the seriousness of the
problem in the context of other countries, stating that: “South Africa compares
unfavourably with middle income countries on the ratios of medical and dental
professionals; as many districts have limited access to specialists”. The ratio of
doctors, dentists and other health professionals to the public is seen as highly
unacceptable per capita and needs to be remedied as soon as possible before the
situation worsens (Strachan et al., 2011).
The shortage of scarce-skilled professionals in the health sector is not unique to
South Africa, but is a global problem. Multinational companies (MNCs), many of
which are by now veterans of the global business environment, suffer from a
common problem, which is that of retaining professional employees (Strachan et al.,
2011). The death rate in hospitals globally is not as high as it is in South Africa, but
the problem of the shortage of scarce-skilled health workers remains a challenge.
Research was conducted comparing the job satisfaction and intention to leave
among different categories of health workers in Tanzania, Malawi and South Africa
and revealed that approximately 52.1% of the health workers in South Africa were
satisfied with their jobs compared to 71% from Malawi and 82.6% from Tanzania.
9
18.8% of the health workers in Tanzania and 26.5% in Malawi indicated that they
were actively seeking employment elsewhere, compared to 41.4% in South Africa
(Blaauw, Ditlopo, Maseko, Chirwa, Mwisongo, Bidwell, Thomas & Norman, 2013). A
number of small-scale surveys have measured the job satisfaction and intention to
leave of individual health workers in different settings, but there are few multi-country
and multi-cadre comparative studies (Blaauw et al., 2013).
French, Du Plessis and Scrooby (2011) stated that nurses had to be multi-skilled and
able to work under challenging conditions. These challenges are the shortage of
skilled personnel, lack of resources and training, patient overload in hospitals and
clinics and poor supervision and support from managers. The research focused on
the wellbeing and satisfaction of the nursing staff. The study shows that nurses do
not have complete job satisfaction and some see the multi-skilled workforce as
suffering work overload, while others feel they can gain more organisational learning
from performing different tasks. However, the study does not link satisfaction to the
intention to quit or to organisational commitment.
The global shortage of healthcare workers, especially nurses and midwives, has led
to crisis in many sub-Saharan African (SSA) countries (Awases, Gbary, Nyoni &
Chatora, 2004). According to the World Health Organisation, 36 SSA countries are
experiencing extreme shortages of healthcare workers (Awases et al., 2004). George
and Quinlan (2007) shared similar views by stating, in terms of the human resource
capacity, that South Africa faces major crisis, especially with the uneven distribution
between the provinces and between the public and private sectors. Producing,
recruiting and retaining health professionals remain key challenges facing the
country, but these are not confined to South Africa. They have in fact been
10
documented as challenges for the entire Southern African region and globally
(George & Quinlan, 2007).
In a lose labour market, employees have many choices. This is also true of the health
sector, as staff have the choice of moving within the sector. Suadicani, Bonde,
Olesen and Gyntelberg (2013) confirmed this by evaluating the reasons why staff
leave their employment by conducting a cross-sectional questionnaire study of
hospital employees. The questionnaire provided information on elements of the
psychosocial work environment (job demands, job influence, job support,
management quality, exposure to bullying), general health status, sick-leave during
the preceding year, lifestyle (leisure time physical activity, alcohol intake and smoking
habits), age, sex and profession. About a quarter (26%) reported that they would quit
their job if it were economically possible; this rose to 40% among the 17% who
considered their health mediocre or bad. In a final logistical regression model, six
factors were identified as being independently associated with the wish to quit or not:
self-assessed health status, the meaningfulness of the job, the quality of
collaboration among colleagues, age, the trustworthiness of the closest superior(s)
and exposure to bullying (Suadicani et al., 2013).
Based on these factors, it was possible to identify groups with fewer than 15%
wishing to quit, and groups in which 50% or more would quit if it were economically
possible. Psychosocial work conditions, in particular the meaningfulness of the job,
were independently associated with the intention to quit the job if it were
economically possible and relevant within different job categories (Suadicana et al.,
2013). According to Scroggins (2008), it was suggested that creating meaningful
work experiences and increased work engagement for employees is necessary for
11
employee retention, motivation and improved performance.
Never before in the history of nursing has the shortage of professional nurses been
so severe (Ehlers, 2003). Such a shortage has drastic consequences, like the
closure of hospital wards and/or clinics, which in turn reduces the available health
care services, resulting in long waiting lists and/or periods at health care facilities
(Ehlers, 2003). “The major indirect result of such a shortage revolves around the
increased workloads experienced by the remaining nurses, leading to perceptions of
being overburdened, overstretched, and ineffective” (Ehlers, 2003: 65). The authors
argue that, even though those employees who stay in the organisation can provide
important information to guide retention policies, the reasons for staying are an
almost untouched research topic (Loan-Clarke, Arnold, Coombs, Hartley & Basley,
2010). The researcher concluded that the “reasons for leaving were more to do with
perceived pressure of national health sector work relative to alternatives and issues
to do with the flexibility of employment conditions, especially regarding working hours
fitting with child care” (Loan-Clarke et al., 2010: 401).
The lack of trained personnel, inter alia, results in poor service delivery (in the public
sector) and low profits (in the private sector). According to Horwitz and Pundit (2008),
there is a paucity of research on job satisfaction among nurses and the factors that
lead to the retention of nurses in both the public and the private sectors in South
Africa. South Africa has always experienced problems in the health sector, be it in
the public or private sector. Upon further investigation it was found that the reasons
for the ongoing problem were the staff shortages at these health care facilities
together with insufficient training resources. As there is one nurse to 15-20 patients,
doctors have to work for 24 hours to cover shifts owing to the shortage of doctors.
12
Employees cannot cope with the workload and pressures, which leads to low staff
morale, burnout and employees seeking other employment (Department of Health
Annual Report, 2013-2014).
Horwitz and Pundit (2008) conclude that the public healthcare sector in South Africa
is under-resourced and, although it contributes 40 percent of the total spent on
healthcare in South Africa, it is responsible for the wellbeing of approximately 82
percent of the population. “The private sector, which is run for the most part along
commercial lines, absorbs the bulk of the healthcare resources and contributes 60
percent of the total spent on healthcare in South Africa, while caring for some 18
percent of the patients” (Horwitz & Pundit, 2008: 23). This discrepancy was
highlighted in the Public and Private Mix South African Health Review. The scarcity
of nurses in South Africa has impacted on both the public and the private health
sectors but the public sector bears the brunt of the shortage (Horwitz & Pundit,
2008).
Furthermore, laboratories, which are essential in the hospitals, also suffer a shortage
of skilled scientists, pathologists and laboratory technologists/technicians, which in
turn affects patient diagnosis. On further investigation it has been shown that
between both the private and public sector turnover rates have been extremely high,
and there has been no successful retention strategy to date (Department of Health
Annual Report, 2013-2014).
George and Quinlan (2007) speak of the challenges that are posed to both the
private and public sectors owing to the shortage of health care professionals. The
authors state that the public sector needs to explore ways of tapping into private
sector resources and to curbing the exodus of these professionals from the public to

13
the private sector, as the shortage of the professionals in the private sector is viewed
as a potential cost-driver.
Horwitz and Pundit (2008) point out the important fact that a larger number of public
sector nurses (44%) intend leaving the public sector to work in the private sector
within the next five years, which is highlighted in this study. This finding emphasises
the inadequacies of working conditions in the public sector and the overall
dissatisfaction of nurses in that sector. Public sector employees were found to be
less satisfied with their careers and working environment than their private sector
counterparts. Horwitz and Pundit (2008: 40) stated that: “over 40 million South
Africans are dependent on public health services, which are staffed primarily by
unsatisfied nurses”. The author feels it is time for the current retention strategies to
be re-evaluated. The conclusion drawn by Horwitz and Pundit (2008) for both the
private and especially the public sector was that the development of appropriate
recruitment strategies is vastly important and South Africa cannot afford to lose any
more nurses from its public sector. The country ought to pay attention to the plight of
nurses, who form the backbone of the health service.
According to Keane, Smith, Lincoln and Fisher (2011), retention also requires
affirmative action, with strenuous workloads and high levels of potential ‘burnout’
evident. Future models of care should take into account the need for flexible
employment conditions and the maintenance of healthy work/life balance.
Meanwhile, the variety and autonomy that appear to be valued in rural practice
should be supported and positively reflected in both recruitment and retention efforts
(Keane et al., 2011).
Doherty (2010: 819) stated that: “the public health system is under-resourced, there
14
is a shortage of skilled staff, and the system suffers from poor management and low
staff morale”. Furthermore, health care resources are distributed inequitably across
the socio-economic gradient. This is a result of the failure of the health system to
address health care priorities rather than inappropriate choices around specific health
care interventions (Doherty, 2010).
Strachan et al. (2011) stated that the ratio of doctors and dentists to the population is
extremely poor, and many districts, especially rural communities, have limited or no
access to these specialist services. The author suggested that the reason for the loss
of health workers in South Africa is emigration, and dynamic leadership and policy
interventions are required to advocate for and finance the planned growth of health
professionals. “This effort needs to accompany a strategy to retain doctors, a careful
assessment of working conditions, and active recruitment of doctors who have left
the country and of foreign doctors who can contribute to South African health care
development” (Strachan et al., 2011: 526).
Turnover has several consequences, one of which is the high cost that accompanies
it. This has highlighted the need for organisations to make the retention of staff their
number one priority (Mokoka, Oosthuizen & Ehlers, 2010). Furthermore, the high
turnover rates among South African nurses, coupled with the decreasing numbers of
nursing recruits, poses a threat to health care delivery (Mokoka et al., 2010). “It is
estimated that for each departing employee, an institution loses 1.5 times his or her
salary, mostly due to recruiting costs, training time, and lost productivity of colleagues
who need to fulfil another person’s tasks in addition to their own full workloads”
(Ehlers, 2003: 68).
Spinning a web that attracts and retains high performers decreases staff turnover,
15
reduces teaching costs, increases efficacy, improves service delivery, recruiting and
retention, increases both patient and employee referrals, expands productivity and
enhances the bottom line is what is needed in the health sector (Robbins, 2003).
However, according to Bueno (1990), the researcher states the valid point that,
should the wrong individuals be retained, it could obstruct the very changes essential
for an organisation’s survival. In today’s highly competitive labour market, there is
extensive evidence that organisations, regardless of size, technological advances,
market focus and other factors, are facing retention challenges (Robbins, 2003).
There is a significant economic impact when an organisation loses any of its critical
employees, especially given the knowledge that is lost with the employees’
departure. Retention strategies are therefore important to ensure that this knowledge
is not lost, as knowledge management is required to enhance performance of any
organisation and also adds economic value to organisations.
An investigation conducted by the Democratic Alliance (DA) into conditions in the
public health sector shows very clearly that health care is deteriorating on a broad
front (Adams, 2005). By highlighting a few of the worst examples, the Democratic
Alliance is attempting to demonstrate that the government’s hospital revitalization
plans are failing, and that a thorough review of the effectiveness of existing policies is
needed. The Democratic Alliance has identified that vacancy rates at hospitals are
virtually destroying its ability to provide care to the nearly half a million people whom
they serve. One of the hospitals in the Mpumalanga area shows the following: There
are 109 posts for doctors, but only 36 are filled (a 67% vacancy rate). The hospital
has fewer than 50% of the nurses it needs (356 out of 694). The hospital needs 12
pharmacists - it only has one. It has only four of the 20 specialists it needs.
16
An Eastern Cape hospital pointed out that the retention of staff is an enormous and
ongoing problem. Fourteen (14) doctors were needed to run the four medical wards
at this hospital but there were only four. There were only six nurses to run the 40-bed
male medical ward day and night, yet 14 were needed. In reply to a DA
Parliamentary question, it was established that 30% of doctors’ posts, 28% of nursing
posts, and an astonishing 80% of specialists’ posts were vacant. These percentages
represent the actual number of health professionals the hospitals were able to recruit
and retain (Adams, 2005). However, in many cases the increase in the number of
posts made absolutely no difference to the actual number of health care
professionals employed.
Turnover and retention are two sides of the same coin. Waldman and Arora (2010)
stated that most organisations make the mistake of looking at staff turnover, and feel
that this is the inverse of retention, which it is not. However, the article in question
states that the combination of the retention rate and turnover offers a more complex
view of the working environment than either offers alone. One should rather consider
why employees stay, how long they stay, how much knowledge they have and can
share, and, if they do leave, how much knowledge will be removed from the
organisation. The researcher argues that, rather than measuring what we do not
want, which is turnover, we should measure what we do want, which is retention
(Waldman & Arora, 2010). Retaining skilled professionals is crucial to sound clinical
and financial outcomes, as the situation in health care generalizes too many fields,
and more skilled and experienced people are required in pathology (Waldman &
Arora, 2010). This study fills the gap discerned by Waldman and Arora (2010) and
investigates measuring retention rather than turnover.
17
Research conducted on ‘Nurture a culture of retention’ evaluated recruitment versus
retention. The author states that the cost of turnover extends well beyond the fiscal
cost of losing an individual. High staff turnover leads to low morale and motivation
and a sense of rejection in those left behind (Manion, 2004). The research looked at
what successful nursing managers actually do to create a culture of retention in their
areas of responsibility. The researcher maintains that there are more simple types of
retention strategy, which include creating the correct environment and a culture of
retention. The researcher maintains that “the same support must be provided to
managers that they are expected to provide to their staff” (Manion, 2004: 39).
Several studies have been conducted in the health sector focusing on the retention of
nursing professionals. The field of nursing is already grappling with labour shortages
and a lack of diversity, so it may serve as a model for diversity-friendly recruitment
and retention initiatives (Myers, 1985). The article points out that there is a need for
more retention strategies and retention studies, especially when it comes to nursing
staff in the hospital setting. In connection with the gaps in information found by
Keane, Lincoln and Fisher (2010) they state that a retention model ought to be
developed which will support diversity and autonomy in rural practice as part of
retaining health workers. The researcher also maintains that further research is
required into the retention of health workers.
A more in-depth exploration of the influence of continuing professional development
should be considered regarding recruitment and retention (Keane et al., 2010).
Research has indicated that factors which attract and retain nurses are associated
with opportunities to develop professionally, autonomy in practice, participative
decision-making processes, and fair reward and remuneration for work undertaken
18
(Duffield & O’Brien-Pallas, 2004). Myers (1985) maintains that to mitigate the loss of
organisational memory and its concomitant impact on performance the healthcare
leaders must devise strategies for transferring knowledge to retain workers and
compete to fill vacancies.
Furthermore, the nurse turnover rates in South Africa influence the country’s nursing
shortages. This phenomenon appears to occur globally (Duffield & O’Brien-Pallas,
2004). Internal migration in the South African health care sector and emigration to
other countries are two major factors contributing to the high turnover rate of South
African professional nurses. South African nurses are attracted to more affluent
countries that have more to offer in terms of competitive incentives, better working
conditions and resources, safety, and a lower prevalence of HIV/AIDS (Mokoka et al.,
2010).
Lyons and Linda (2006) also maintain that more research is required to clarify the
differing perspectives in terms of priorities for nurse retention in a variety of practice
settings. Large numbers of health professionals, especially nurses, are leaving the
profession, large numbers are retiring, and there are too few people entering the
nursing profession to replace them. Preserving a viable workforce depends on
creating strategies for attracting and retaining workers, a field that requires more
studies on retention strategies (Blythe, 2008). The article states that there is
insufficient research on the retention of nurses in different age groups, and strategies
should be developed for retaining the professionals.
Loan-Clarke et al. (2010) argued that problems of retention and the turnover of allied
health professionals are under-researched, and the authors recommend that future
research should focus in particular on stayers and returners in order to enhance
19
retention strategies. Cottingham, DiaBartolo, Battistoni and Brown (2011) maintain
that substantial evidence supports the position that nurse turnover is costly. Not only
are there obvious consequences associated with turnover, such as the costs of
advertising and recruiting, retraining, and reliance on expensive agency and
travelling nurses, but there are also hidden costs of lost productivity and
organisational knowledge. This in turns affects the quality of patient care as well as
morale, which in turn shows that hospitals with high staff turnover rates experience
higher costs per discharge and lower profitability (Cottingham et al., 2011).
However, after critically analysing the research conducted by Mokoka et al. (2010), it
can be concluded that culture does indeed play an important role in retention.
Creating a fun-filled environment that rewards staff for hard work has seemed to
increase job satisfaction in many organisations (Mokoka et al., 2010). This has led to
both managers and the nursing staff working together and having autonomy once
they are empowered to carry out their functions. The author offers an alternative
viewpoint in comparison with other literature that there are simpler ways of retaining
nurses in the health sector environment. This controversy will enter when
researchers look at the health sector as a highly bureaucratic environment, and one
could ask how it would be possible to create a ‘fun’ working culture when hospital
settings are always such a serious business. Dealing with ill patients can create a
negative work environment for employees who work in it. Creating an exciting work
environment may not be that easy.
Pienaar and Bester (2012: 120) state that the available literature suggests that there
“will be an ever increasing pressure placed on the South African public health care
service and the nursing personnel, as they are seen to constitute the largest human
20
component in this system”. The high incidence of burnout among staff revealed in
their study and the intentions to quit/change among nursing personnel support
previous research findings and literature. The high level of burnout among
professional nurses should be attended to urgently. Professional nurses should be
trained to identify and manage the causes of burnout in their work environment more
effectively. They should, for example, be taught to manage a heavy workload with the
limited resources that are available to them (Pienaar & Bester, 2012).
Within the world of pathology, there is also a shortage of health care professionals.
The shortage of staff in the pathology environment also grants pathology
professionals the opportunity of moving among companies via turnover (Badrick & St
John, 2012). The attraction and retention of appropriate staff is thus important for
sustainability. Bukyx et al. (2010) affirm that, although retention strategies have been
introduced in various settings, few of them have been evaluated. Little evidence
demonstrating the effectiveness of any specific strategy is currently available. As
mentioned, studies have been conducted on nursing, but not specifically on the
pathology domain. Insufficient studies have been conducted on retention strategies
specifically within the health sector. There have been limitations in previous studies
and the literature also shows that most retention strategies have been ineffective.
This points back to the aim of this study, which is to develop a retention model for
scarce-skilled professional employees in the health sector.
1.6 Problem statement
The shortage of scarce-skilled professionals in the health sector has led to poor
service delivery and increased patient deaths.
21
1.7 Definitions
Scarce skills: In many occupations there is a scarcity of qualified and experienced
people, currently or anticipated in the future, because either:
(a) Such skilled people are not available, or
(b) They are available but do not meet employment criteria (MQA scarce skills
guide, 2010).
Professional: This is a person formally certified by a professional body of those
belonging to a specific profession by virtue of having completed a required course of
study and/or practice, and whose competence can usually be measured against an
established set of standards. For this study the scarce-skilled professionals used are:
pathologists, registered nurses, medical scientists and technologist/ technicians.
1.8 Objectives
The primary objective of this study was to develop a retention strategy for
professional workers in the health sector.
In order to achieve this objective, secondary objectives were set. These were the
following:
To comprehensively analyse and report on literature regarding the factors that
influence individuals to leave their employers, with specific reference to
professional workers.
To empirically determine which categories of factors influence retention,
mostly in the health sector.
To empirically determine which elements within those categories of factors
influencing retention are most dominant.
22
To determine whether similar factors influence professionals and non-
professionals alike when they consider their own retention in an organisation.
To determine, through interviews, which factors will go towards retaining
scarce-skilled professionals in the health sector.
To determine, through interviews, which of the factors that managers control in
the health sector can influence the retention of professional staff.
To develop, based on empirical evidence and the input of the managers, a
model that will be useful for the retention of professional staff.
1.9 Research questions
Answering the following research questions allowed for the development of a
retention model for professionals in the health sector:
Question 1: What can we learn from literature regarding the factors that influence
individuals to leave their employers, with specific reference to professional workers?
Question 2: Which groups of factors mostly influence retention in the health sector?
Question 3: Which elements in the groups of factors that influence retention are most
dominant in doing so?
Question 4: Are similar factors responsible for the retention of professionals and non-
professionals in the health sector?
Question 5: What factors are responsible for retaining the professional staff?
Question 6: What can a manager do to influence retention?
Question 7: What do literature and empirical evidence convey that could assist in the
23
development of a retention model for professionals in the health sector?
1.10 Hypotheses
H1a: Job characteristics, career anchors and employee satisfaction equally affect
professional employees’ intention to quit.
H1b: Job characteristics, career anchors and employee satisfaction equally affect
professional employees’ organisational commitment.
H1a (i): All job characteristics equally influence professional employees’ intention to
quit.
H1a (ii): All career anchors equally influence professional employees’ intention to
quit.
H1a (iii): All employee satisfaction indicators equally influence professional
employees’ intention to quit.
H1b (i): All job characteristics equally influence professional employees’
organisational commitment.
H1b (ii): All career anchors equally influence professional employees’ organisational
commitment.
H1b (iii): All employee satisfaction indicators equally influence professional
employees’ organisational commitment.
H2a: Job characteristics, career anchors and employee satisfaction similarly affect
the intention to quit across occupational boundaries.
24
H2b: Job characteristics, career anchors and employee satisfaction similarly affect
organisational commitment across occupational boundaries
H2a (i): Job characteristics influence the intention to quit equally across occupational
boundaries.
H2a (ii): Career anchors influence the intention to quit equally across occupational
boundaries.
H2a (iii): Employee satisfaction influences the intention to quit equally across
occupational boundaries.
H2b (i): Job characteristics influence organisational commitment equally across
occupational boundaries.
H2b (ii): Career anchors influence organisational commitment equally across
occupational boundaries.
H2b (iii): Employee satisfaction influences organisational commitment equally across
occupational boundaries.
1.11 Proposition
One qualitative question had to be answered relating to the factors that managers
could control in an effort to retain professional employees.
The proposition read as follows:
Managers in the pathology sector are in relative consensus about the factors under
their control which influence the retention of professional employees.
25
This was the only proposition made.
1.12 Rationale
No previous retention strategy studies had been conducted in the pathology
environment. This study is therefore important, as it could add value to other fields. A
retention model was developed for retaining employees in the pathology
environment, which is part of the health sector. However, further research into this
model should be conducted in other sectors.
Scarce skills are essential in the pathology environment, as without registered
nurses, pathologists and medical technicians/technologists and scientists the
pathology field could not function, which would leave a massive gap in diagnostics
and patient treatment. This would mean that a doctor would not be able to perform
his job, which is to diagnose a patient. It would also mean that patients would not be
treated, which could lead to increased patient deaths. The study is therefore
essential from both the corporate social responsibility and ethical viewpoints, as it
would clearly increase the quality of life and improve the health care systems in
South Africa and other countries.
Scroggins (2008) conducted a study on the relationship between employee fit
perceptions, job performance, and retention, stating that future research was needed
to understand the variables that may affect turnover. A suggestion for future research
was to use more validated models, as the study mentioned only one, which was a
simplified single model. This study will fill the gaps by using a combination of
validated theories to arrive at a retention model.
Stanz and Greyling (2010) pointed out that a limitation to their study was the non-
26
inclusion of non-professional employees in the sample. Although different risk groups
are described, the sample does, to a certain extent, lack homogeneity. However, this
study fills the gap conducted by Stanz and Greyling (2010). The authors also
recommend more theoretical models with the antecedents, manifestations and
consequences of turnover to illuminate the concept should it be developed. This
study includes a combination of theoretical models and covers this gap as well.
1.13 Significance and contribution by the study
This study makes several contributions to the body of knowledge. First, there is no
existing retention strategy that has solved and impacted on the problem of retention,
especially in the health sector. Secondly, the study involves the development of a
retention model for professionals in the health sector and will bring new insights into
research. Thirdly, no previous retention studies have been conducted in the
pathology environment, but this study uses three laboratories geographically
dispersed through Gauteng, KwaZulu Natal and the Eastern Cape. Fourthly, no
previous studies have been conducted that compare professionals and non-
professionals when developing a retention strategy. Finally, no previous studies have
been conducted that used theoretical models, such as the career anchors model,
together with the job characteristics and job satisfaction models. Intention to quit and
organisational commitment are included for retention, which will bring new insight to
research and the problem of retention. Because so little research had been
conducted on retention strategies specifically in the health sector, and the previous
studies had limitations, there is a definite need for further research on retention
strategies, particularly when it comes to scarce-skilled professionals. The
development of a retention model in this study could be the breakthrough the health
27
sector has been looking for to ensure that the professional scarce-skilled employees
are retained.
1.14 Limitations
A limitation is the specificity of the sample, as the sample population used is
comprised of employees working in the pathology environment only. Further studies
are required, which would allow the results of the research to be generalised to other
professions. The research was conducted in the private sector, so further research
should be conducted to assess whether there would be a difference in findings from
the public sector. The model was developed in the pathology environment, and was
specific to retaining professionals in the pathology environment. Further research
should be conducted to test and apply the model to other sectors. The questionnaire
took the professionals approximately 30-45 minutes to complete, which they felt was
very time-consuming. The employees admitted to losing interest halfway through the
questionnaires. It would have affected the outcome, if they had completed it simply
for the sake of doing so.
1.15 Summary
The first chapter focused on the problem under consideration, which was poor
service delivery in the health care sector, leading to increased patient deaths. Further
investigation showed the root cause of the problem to be the retention of skilled
professionals in the health sector. The next chapter explores literature and theories
related to retention, together with relevant themes used to develop the retention
model to find a solution to the ongoing problem of increased turnover in the health
sector.
28
CHAPTER TWO: LITERATURE REVIEW
2.1 Introduction
The literature review will unravel the complexity of the research problem by looking at
relevant underlying theory, in combination with literature that other researchers have
established dealing with the topic of retention strategies. The main objective of this
chapter was to comprehensively analyse and report on literature discussing the
factors that influence individuals to leave their employers, with specific reference to
professional workers. The theories related to retention are discussed below, including
the job characteristics model and the job redesign model, along with matters related
to career anchors, organisational commitment, job satisfaction and the intention to
quit.
2.2 Retention theories linked to motivation, human resource practices and culture
To gain a better understanding of the complexity of retention, theories linked to
motivation, human resource practice and culture were explored. Because the topic of
‘retention’ is so broad, these factors will be examined and the varying viewpoints of
the researchers will be taken into consideration. However, the main focus of the
study will be that of refining a retention model that is linked to job characteristics, job
satisfaction, career anchors, organisational commitment and the intention to quit.
Many researchers have analysed retention theories and have found that motivation
plays an important role in retaining employees. Steers and Porter (1983) maintain
that managers should be responsible enough to create a proper climate where
employees can develop and perform to their full potential. If this climate was not

29
created, it would theoretically decrease job satisfaction, and could result in poor work
performance and declining standards. It could even result in employees wanting to
leave the organisation. The author maintains that motivation plays a vital role in
retaining employees in an organisation, as it is directly linked to job satisfaction. The
author used Maslow’s (1943) hierarchy of needs as an indication of what would
constitute employee satisfaction in the job situation.
According to Ramlall (2004), as an employee reaches the next level of motivation per
Maslow’s (1943) model, the organisation would be able to retain them. However, the
article by Ramlall (2004) has not been tested to prove that, if Maslow’s (1943)
hierarchy of needs was fulfilled, it would secure employee retention; it is seen merely
as a possible retention theory linked to job satisfaction.
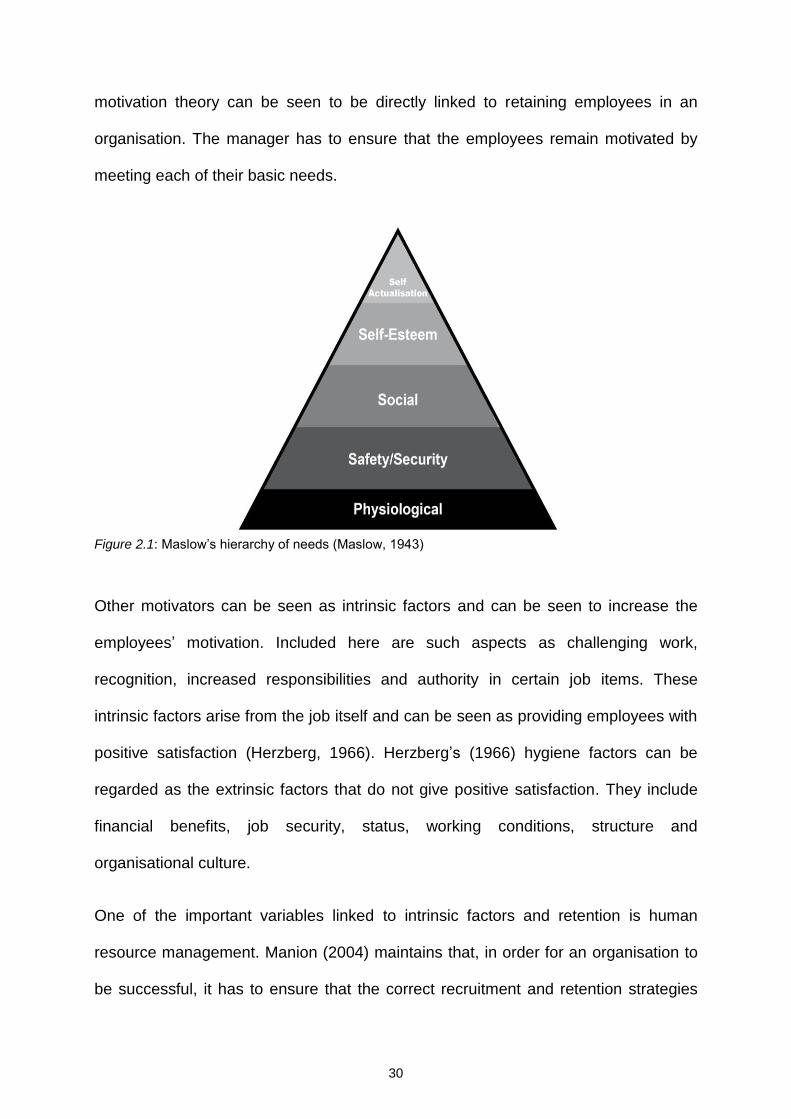
Maslow’s (1943) model is depicted in Figure 2.1 below. The model is based on the
understanding that as a person fulfils one need they will move up the hierarchy to
achieve the next level of motivation, which in turn could result in job satisfaction. As
depicted in the model, the basic needs are physical. They are the primary needs for
food, shelter and clothing that can be directly satisfied by compensation. Once the
physiological needs have been satisfied, safety or security needs become a
motivational factor. For many employees the most important security need is job
security. Once employees achieve this stage of motivation, they need to move further
up the hierarchy to the self-esteem and the self-actualization level. Once they are at
the higher levels of Maslow’s (1943) hierarchy, employees will feel motivated to
remain in their existing employment. When the need hierarchy concept is applied to
work organisations, the implications for managerial actions become obvious. The
authors Ramlall (2004) and Steers and Porters (1983) maintain that Maslow’s (1943)
30
motivation theory can be seen to be directly linked to retaining employees in an
organisation. The manager has to ensure that the employees remain motivated by
meeting each of their basic needs.
Figure 2.1: Maslow’s hierarchy of needs (Maslow, 1943)
Other motivators can be seen as intrinsic factors and can be seen to increase the
employees’ motivation. Included here are such aspects as challenging work,
recognition, increased responsibilities and authority in certain job items. These
intrinsic factors arise from the job itself and can be seen as providing employees with
positive satisfaction (Herzberg, 1966). Herzberg’s (1966) hygiene factors can be
regarded as the extrinsic factors that do not give positive satisfaction. They include
financial benefits, job security, status, working conditions, structure and
organisational culture.
One of the important variables linked to intrinsic factors and retention is human
resource management. Manion (2004) maintains that, in order for an organisation to
be successful, it has to ensure that the correct recruitment and retention strategies
31
have been implemented. Once an organisation has selected the right people, it is
important to retain their talent. A good hiring process goes hand-in-hand with
employee retention. The two are complementary in nature, and, if executed properly,
they create the most desirable mix in the organisation (Dey, 2009). Ramlall (2004)
evaluated the most commonly-used retention strategies and stated that training and
development were important, as, if there is no systematic approach to training and
development, employees demonstrate lack of commitment. In turn, the managers
show no commitment to the employees’ long-term development, which results in their
wanting to leave the organisation. Career planning and development are also
important, as employees must understand what skills are necessary to grow
professionally. Employees need to be given more responsibilities and to be rewarded
according to their performance. Managers should ensure that career planning and
development efforts are related to the organisation’s business objectives and are
included as part of the human resource management functions (Ramlall, 2004).
Most research to date has assumed that employees all react favourably to
organisational human resource practices and can be retained should there be
adequate practices in their organisation (Thomas & Butts, 2009). Literature maintains
that the four work environment characteristics examined are the key human resource
practices for promoting power, information, rewards and knowledge. Increasing job
significance is a power-related human resource practice, while enhancing information
sharing is an information-related practice. Increasing the availability of rewards for
performance is rewards-related, and providing opportunity for learning is a
knowledge-related human resource practice (Thomas & Butts, 2009). Figure 2.2
depicts the human resources for a health action framework, which charts a pathway
for developing a comprehensive national strategy for helping managers sustain a

32
supply of adequately-trained health staff. This framework could be used to appreciate
the management of human resources and how the scarce-skilled professionals could
be retained by evaluating human resource systems and policies. The framework
suggests actions that policy-makers and managers could take to address issues in
each of the six areas. The human resource management systems are in the centre
because of their importance in integrating all the other components. This framework
was developed in 2005 by a consortium from the US Agency for International
Development (USAID), the World Health Organisation (WHO), the Global Health
Workforce Alliance, partner countries, NGOs’ donors and the academic community
(Neil & Reimann, 2010).
The model differs from the proposed retention model, as it includes only the human
resource element and the human resource policies. The model does not compare
these factors with the intention to quit or organisational commitment, neither does it
link the human resource policies to retention. However, the model could be useful, as
it covers the human resource aspect and policies that organisations should
implement to provide direction for their employees, and the model focuses on
improved health outcomes. The model developed in this study can be seen to
complement human resource practice for retention.
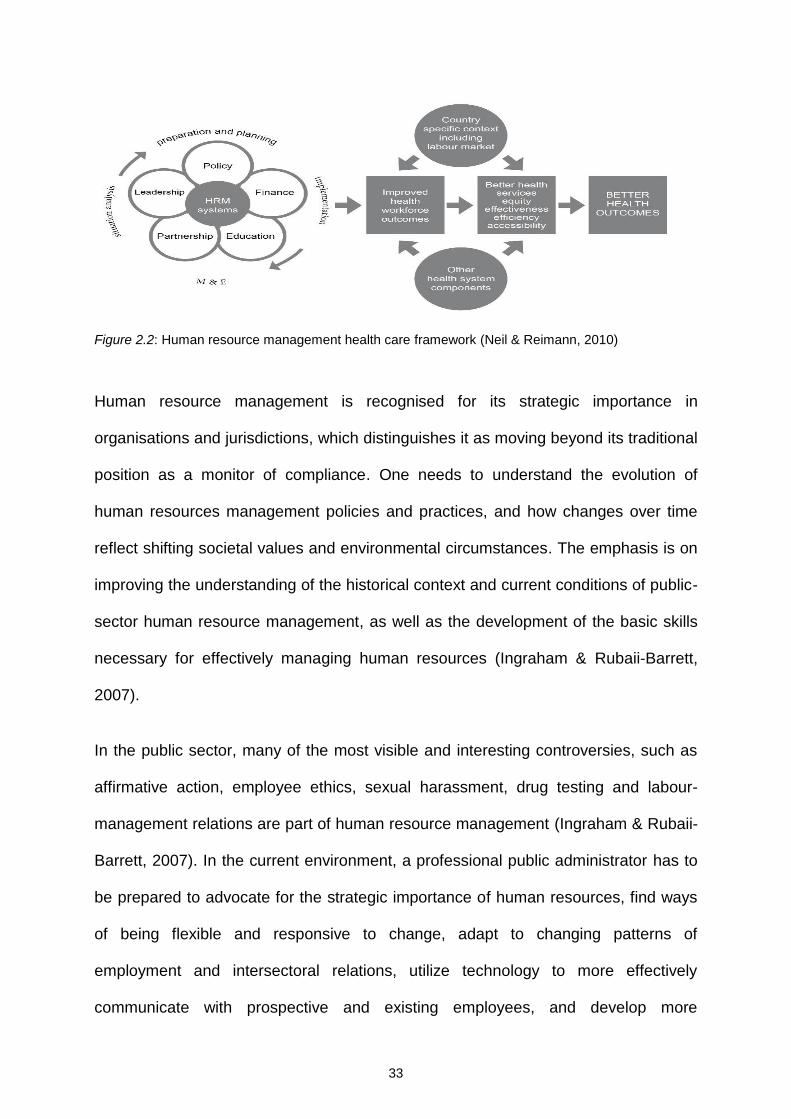
33
Figure 2.2: Human resource management health care framework (Neil & Reimann, 2010)
Human resource management is recognised for its strategic importance in
organisations and jurisdictions, which distinguishes it as moving beyond its traditional
position as a monitor of compliance. One needs to understand the evolution of
human resources management policies and practices, and how changes over time
reflect shifting societal values and environmental circumstances. The emphasis is on
improving the understanding of the historical context and current conditions of public-
sector human resource management, as well as the development of the basic skills
necessary for effectively managing human resources (Ingraham & Rubaii-Barrett,
2007).
In the public sector, many of the most visible and interesting controversies, such as
affirmative action, employee ethics, sexual harassment, drug testing and labour-
management relations are part of human resource management (Ingraham & Rubaii-
Barrett, 2007). In the current environment, a professional public administrator has to
be prepared to advocate for the strategic importance of human resources, find ways
of being flexible and responsive to change, adapt to changing patterns of
employment and intersectoral relations, utilize technology to more effectively
communicate with prospective and existing employees, and develop more
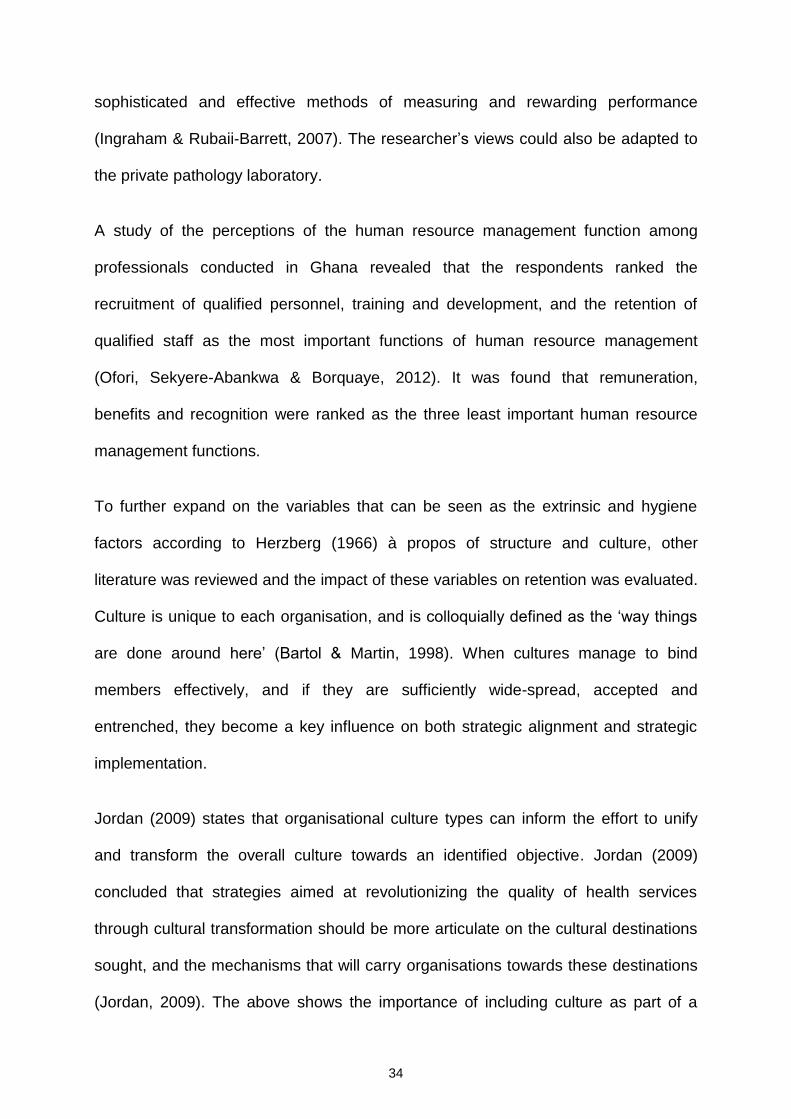
34
sophisticated and effective methods of measuring and rewarding performance
(Ingraham & Rubaii-Barrett, 2007). The researcher’s views could also be adapted to
the private pathology laboratory.
A study of the perceptions of the human resource management function among
professionals conducted in Ghana revealed that the respondents ranked the
recruitment of qualified personnel, training and development, and the retention of
qualified staff as the most important functions of human resource management
(Ofori, Sekyere-Abankwa & Borquaye, 2012). It was found that remuneration,
benefits and recognition were ranked as the three least important human resource
management functions.
To further expand on the variables that can be seen as the extrinsic and hygiene
factors according to Herzberg (1966) à propos of structure and culture, other
literature was reviewed and the impact of these variables on retention was evaluated.
Culture is unique to each organisation, and is colloquially defined as the ‘way things
are done around here’ (Bartol & Martin, 1998). When cultures manage to bind
members effectively, and if they are sufficiently wide-spread, accepted and
entrenched, they become a key influence on both strategic alignment and strategic
implementation.
Jordan (2009) states that organisational culture types can inform the effort to unify
and transform the overall culture towards an identified objective. Jordan (2009)
concluded that strategies aimed at revolutionizing the quality of health services
through cultural transformation should be more articulate on the cultural destinations
sought, and the mechanisms that will carry organisations towards these destinations
(Jordan, 2009). The above shows the importance of including culture as part of a
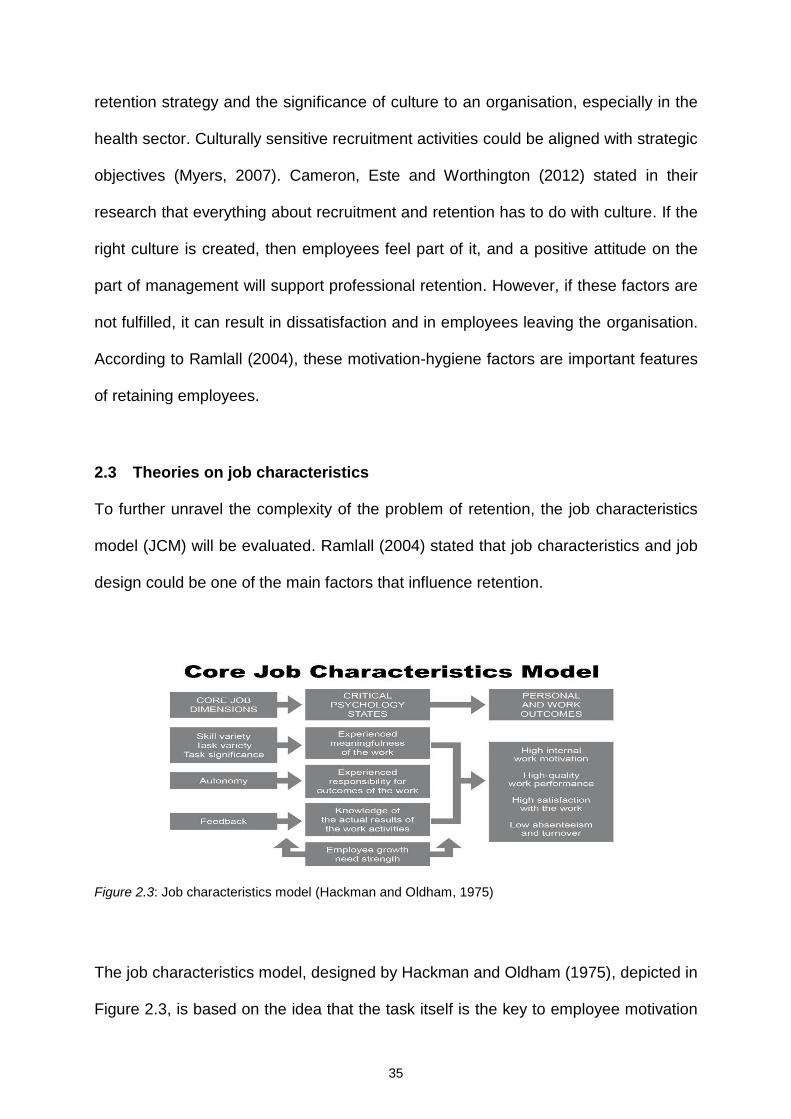
35
retention strategy and the significance of culture to an organisation, especially in the
health sector. Culturally sensitive recruitment activities could be aligned with strategic
objectives (Myers, 2007). Cameron, Este and Worthington (2012) stated in their
research that everything about recruitment and retention has to do with culture. If the
right culture is created, then employees feel part of it, and a positive attitude on the
part of management will support professional retention. However, if these factors are
not fulfilled, it can result in dissatisfaction and in employees leaving the organisation.
According to Ramlall (2004), these motivation-hygiene factors are important features
of retaining employees.
2.3 Theories on job characteristics
To further unravel the complexity of the problem of retention, the job characteristics
model (JCM) will be evaluated. Ramlall (2004) stated that job characteristics and job
design could be one of the main factors that influence retention.
Figure 2.3: Job characteristics model (Hackman and Oldham, 1975)
The job characteristics model, designed by Hackman and Oldham (1975), depicted in
Figure 2.3, is based on the idea that the task itself is the key to employee motivation
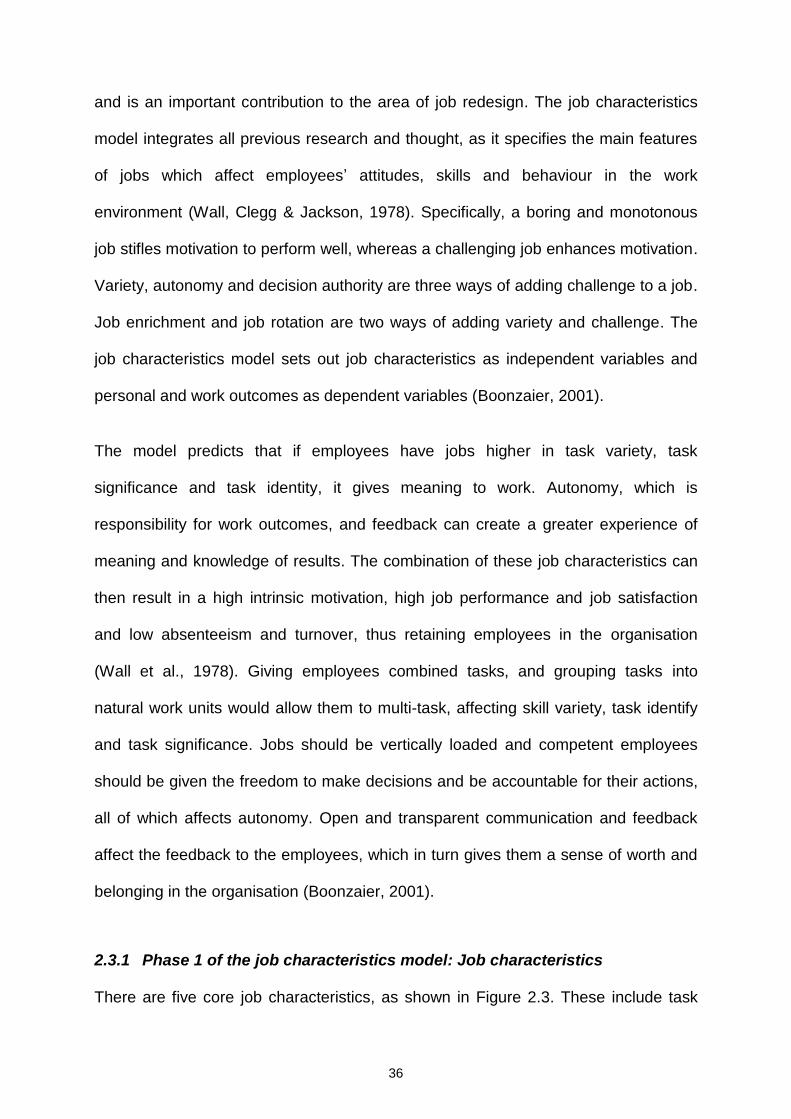
36
and is an important contribution to the area of job redesign. The job characteristics
model integrates all previous research and thought, as it specifies the main features
of jobs which affect employees’ attitudes, skills and behaviour in the work
environment (Wall, Clegg & Jackson, 1978). Specifically, a boring and monotonous
job stifles motivation to perform well, whereas a challenging job enhances motivation.
Variety, autonomy and decision authority are three ways of adding challenge to a job.
Job enrichment and job rotation are two ways of adding variety and challenge. The
job characteristics model sets out job characteristics as independent variables and
personal and work outcomes as dependent variables (Boonzaier, 2001).
The model predicts that if employees have jobs higher in task variety, task
significance and task identity, it gives meaning to work. Autonomy, which is
responsibility for work outcomes, and feedback can create a greater experience of
meaning and knowledge of results. The combination of these job characteristics can
then result in a high intrinsic motivation, high job performance and job satisfaction
and low absenteeism and turnover, thus retaining employees in the organisation
(Wall et al., 1978). Giving employees combined tasks, and grouping tasks into
natural work units would allow them to multi-task, affecting skill variety, task identify
and task significance. Jobs should be vertically loaded and competent employees
should be given the freedom to make decisions and be accountable for their actions,
all of which affects autonomy. Open and transparent communication and feedback
affect the feedback to the employees, which in turn gives them a sense of worth and
belonging in the organisation (Boonzaier, 2001).
2.3.1 Phase 1 of the job characteristics model: Job characteristics
There are five core job characteristics, as shown in Figure 2.3. These include task
37
variety, task identity, task significance, autonomy and feedback. Task variety refers to
a job in which the employee has a variety of different job activities or job functions to
perform and in which different skills and talents are required (Hackman & Oldham,
1975). In the pathology environment this is important, as a technologist/ laboratory
scientist must know how to perform phlebotomy on a patient as well as process the
laboratory samples to obtain a result. A single employee must therefore possess a
number of different skills. Task identity means that there is a ‘whole’ and identifiable
piece of work activity and the employee has to complete this task from the beginning
to the end (Hackman & Oldham, 1975). This means starting a job and ensuring it is
completed. As far as the laboratory technologists are concerned, they have to start
the process by obtaining blood from the patient, and the end result will be delivering
an actionable laboratory test result to the doctor. Task significance refers to the
significance of a job and the impact it has on the lives or work of other people. In the
pathology field, the task is significant, as it impacts on patients’ lives (Hackman &
Oldham, 1975). All of the incumbents in the pathology environment have an ethical
and legal obligation to ensure that their duties are performed according to the highest
quality, as their work impacts on ‘human life’. Autonomy is the employees’ freedom to
make decisions in their field of expertise, which gives them a sense of responsibility
for their jobs (Hackman & Oldham, 1975). Feedback refers to the employees
receiving direct communication on how they are performing their jobs and the effect
of this; the feedback could be from their supervisor, clients or other working
colleagues.
2.3.2 Phase 2 of the job characteristics model: Psychological states
The three psychological states (the experienced meaningfulness of the work, the

38
experience of responsibility for the outcomes of the work and knowledge of the
results of the work activities) are the causal core of the job characteristics model
(Hackman & Oldham, 1976). Following Hackman and Lawler (1971), the model
states that an individual experiences positive effect to the extent that they learn
(knowledge of results) that they personally (experienced responsibility) performed
well on a specific task that they cared about (experienced meaningfulness)
(Hackman & Oldham, 1976). To experience the meaningfulness of the work is the
extent to which an employee feels that the job is worthwhile, has meaning and adds
value to their life. The job is valuable to them. Experienced responsibility for work
outcomes is the extent to which an employee feels personally responsible and
accountable for their actions and the results of the work they produce. For instance in
the pathology laboratory environment, the pathologist is held accountable for
releasing a patient’s results and the doctor treats the patient according to the result
received. This means that, should that laboratory result be incorrect and the patient
was to die, the pathologist would be held accountable for that patient’s death.
Knowledge of results is the extent to which the employee understands the job and its
content, and understands how effectively and efficiently they are performing the job
functions on a continuous basis (Hackman & Oldham, 1976). In the laboratory
environment this is imperative, as the employees must have knowledge of the
relevant processes. If an employee is motivated and performs well, it will serve as an
incentive for the individual to continually strive to be a high performer, because this
will be an incentive for the future. If the person does not perform well, she/he will then
be motivated to try in order to achieve the internal rewards. If an individual feels fully
responsible for the job outcomes, but is not given any feedback on how they are
performing, this could result in a lack of motivation. Similarly, if the person is given
39
feedback on their performance results but has experienced the job as a task for
which he felt no responsibility, this could also result in low motivation.
Hence the assumption made by Hackman and Oldham (1976) is that self-generated
motivation should be highest when all three of the psychological states are present.
As observed in Figure 2.3, “of the five core job characteristics fostering the
emergence of the psychological states, three are seen to contribute to the
experienced meaningfulness of the work, and one each contributes to experienced
responsibility and to knowledge of results” (Hackman & Oldham, 1976: 257). Skill
variety, task identity and task significance combine additively to determine the
psychological meaningfulness of a job. Autonomy is the job characteristic that makes
an individual feel personally responsible for a piece of work, and feedback is the job
characteristic that fosters knowledge of results.
2.3.3 Moderating variables of the job characteristics model
The moderating variables for the job characteristics model are: growth need strength,
pay satisfaction, security satisfaction, co-worker satisfaction, supervision satisfaction,
knowledge and skill. Growth need strength suggests that a person’s job is there for
personal growth, the feeling of pride, and the sense of achievement and success.
Individuals with strong growth need strength want a high degree of the particular job
characteristics to be present in their jobs and they will constantly seek opportunities
to grow within their job environment.
The basic prediction is that people who have a high need for personal growth and development respond more positively to a job high in motivating potential than people with low growth need strength (Hackman & Oldham, 1976: 258).
In keeping with Maslow’s (1985) hierarchy of needs, higher needs are satisfied, i.e.
the self-esteem and self-actualization stages are reached when the jobs possess a
40
high degree of the job characteristics, and workers deliver a quality performance.
This can be seen as motivating the employees. Pay satisfaction refers to the
compensation an employee receives. It can also be in the form of incentives based
on the achievement/contribution an employee makes to the organisation. In
instances when a bonus or a merit is too low, or when there are non-existent links
between pay and performance, poorly-done performance appraisals, and adaptation
problems, pay fails to motivate the employees.
Reward systems need to be effective, and should set high, achievable goals for
employees, develop accurate ways of measuring performance, ensure that
supervisors are competent to conduct performance appraisals, link pay to
performance, and ensure that increases are noticeable and meaningful to the
employees. Security satisfaction is the degree of satisfaction an employee has with
general safety and security. Co-worker satisfaction is the degree of satisfaction
employees have with other members of the team, and the ability to get to know and
assist other co-workers and work together. Supervision satisfaction refers to the
degree of satisfaction employees have with treatment, support, and the guidance
received from supervisors, as well as the general quality of supervision in the
organisation (Boonzaier et al., 2001). Knowledge and skill variables relate to specific
types of jobs and job settings.
2.3.4 Phase 3 of the job characteristics model: Job outcomes
Hackman and Oldham (1975) stated that, if the job characteristics were taken into
account together with the critical psychological states of the employees, the
outcomes would be a highly internally motivated workforce, an employee who was
satisfied with their job, and growth satisfaction for all the employees, such as in the
41
form of promotions and career pathing. Organisations would have lower absenteeism
rates, and the quality of work performance by individuals would be much higher.
These are outcomes that every organisation would like to achieve, as, in turn, it
would result in a lower staff turnover rate, and the right employees would be retained
in the organisation. All the job outcomes, as seen in Figure 2.3, are expected to be
more positive for jobs with high motivating potential than for jobs that are low in
motivating potential (Hackman & Oldham, 1976).
2.3.5 Application of the job characteristics model
According to Hackman and Oldham (1976), the job characteristics model was
designed so that each of the three focal classes of variable, such as the objective job
characteristics, mediating psychological states, and individual growth need strength
could be directly measured in real work situations, using the job diagnostic survey.
The job diagnostic survey was utilised, and directly measured all the variables in the
job characteristics model, as displayed in Figure 2.3 above. The job diagnostic
survey excludes work effectiveness and knowledge and skill, as these are job
specific. The job diagnostic survey also measures two additional job characteristics
which are not included in Hackman and Oldham’s (1975) model. These are feedback
from agents and dealing with others (Boonzaier, 2001). Based on the factors in the
job characteristic model the job diagnostic survey computes a score called the
motivating potential score (MPS):
[(Skill Variety + Task Identity + Task Significance) / 3] x Autonomy x Feedback
The motivating potential score index provides an indication of how complex jobs are
and the extent of this complexity. Based on available research results, the simple
42
additive index is recommended for use in job redesign intervention (Boonzaier,
2001). According to the job characteristics model, the overall potential of a job to
prompt internal work motivation on the part of job incumbents should be highest
when the job is high on at least one of the three job dimensions that lead to
experienced meaningfulness when the job is high on autonomy and on feedback
(Hackman & Oldham, 1976: 258).
The model specifies the conditions under which workers display motivation,
satisfaction and productive behaviour, whereas the job diagnostic survey in turn can
be used to diagnose jobs considered for redesign. They can also identify specific job
characteristics that are most in need of enrichment, and assess the ‘readiness’ of
employees to respond positively to improved jobs (Boonzaier, 2001). The advantage
of the motivating potential score is that it derives directly from the motivational theory
on which the job diagnostic survey was based.
The disadvantage is that the computation of the score involves multiplying the job characteristics, which is generally a dubious proposition with measures that are less than perfectly reliable, especially so when those measures tend to be intercorrelated (Casey & Robbins, 2012: 47).
The motivating potential score, together with the job diagnostic survey, was used for
both professionals and non-professionals to determine the retention factors for
employees in the health sector. The differences in the motivating potential score
between the professional and non-professionals were evaluated, and dominant job
characteristic factors for each group were explored. Once the dominant factors had
been found, they were used to determine whether managers could amend work
conditions in the health sector. The measuring tool used was the job diagnostic
survey, which is a measuring instrument developed by Hackman and Oldham (1976)
to validate their model.
43
2.3.6 Empirical evidence of the usefulness of the job characteristics model
Vroom’s (1964) expectancy theory discusses the core job dimensions and shows
how they contribute to employee motivation. These include skill variety, task identity
and task significance (Cameron, 2006). The expectancy theory states that people are
motivated to behave in ways that produce the desired combination of expected
outcomes (Kreitne & Kinicki, 1999). The theory links with the job characteristics
model employee motivation as depicted in Figure 2.4, and will be discussed in more
detail below.
Vroom (1964) defines motivation as a process governing choices among alternative
forms of voluntary activities, a process controlled by the individual. Vroom (1964)
maintained that an employee's performance is based on individual factors like
personality, skills, knowledge, experience and abilities. He stated that effort,
performance and motivation are linked to a person's motivation (Droar, 2006).
Expectancy is an individual’s perception of the belief that, if they work harder,
rewards will be increased. In order to achieve this, individuals must be provided with
the tools to perform their functions. Individuals also have to be competent and skilled
enough to perform their duties so they also require the correct support structures,
such as leadership and correct information.
Crucially, Vroom's (1964) expectancy theory works according to perceptions, so even
if an employer thinks they have provided everything appropriate for motivation, and
even if this works for most people in that organisation, it does not mean that
someone will not perceive that it will not work for them. Ramlall (2004) stated that
Vroom (1964) described expectancy beliefs as an action-outcome association held in
individuals’ minds, and stated that a variety of factors contribute to an employee’s
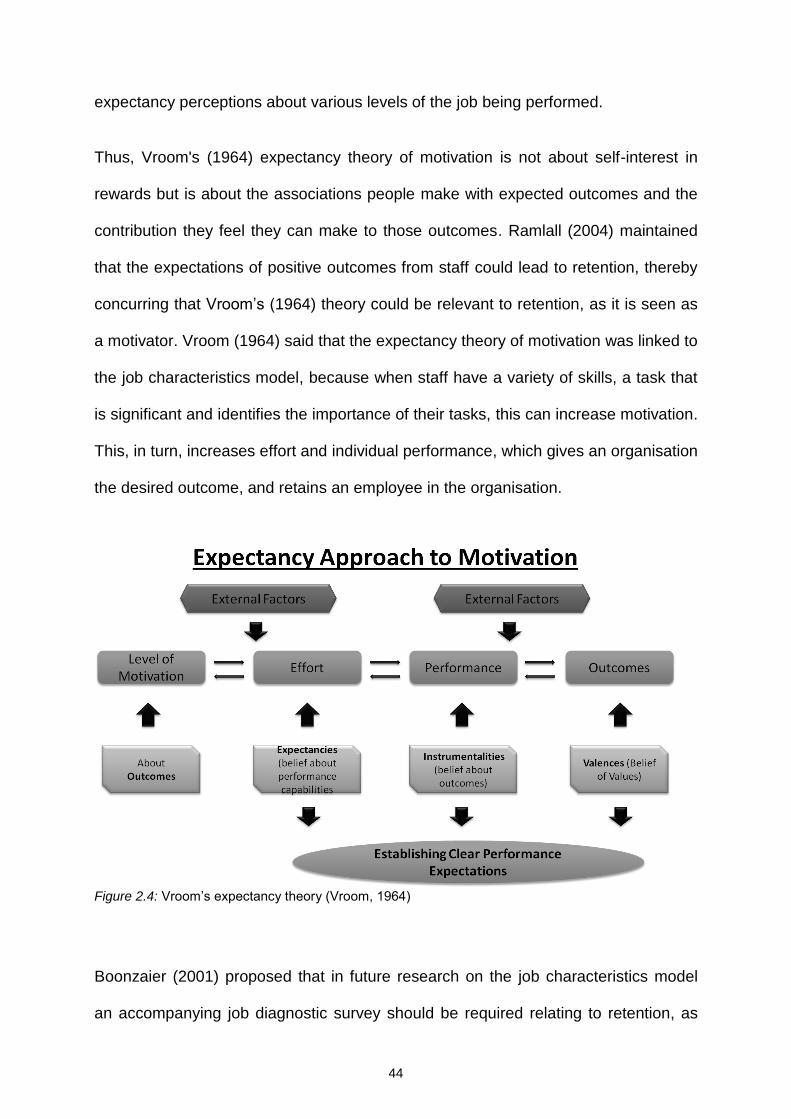
44
expectancy perceptions about various levels of the job being performed.
Thus, Vroom's (1964) expectancy theory of motivation is not about self-interest in
rewards but is about the associations people make with expected outcomes and the
contribution they feel they can make to those outcomes. Ramlall (2004) maintained
that the expectations of positive outcomes from staff could lead to retention, thereby
concurring that Vroom’s (1964) theory could be relevant to retention, as it is seen as
a motivator. Vroom (1964) said that the expectancy theory of motivation was linked to
the job characteristics model, because when staff have a variety of skills, a task that
is significant and identifies the importance of their tasks, this can increase motivation.
This, in turn, increases effort and individual performance, which gives an organisation
the desired outcome, and retains an employee in the organisation.
Figure 2.4: Vroom’s expectancy theory (Vroom, 1964)
Boonzaier (2001) proposed that in future research on the job characteristics model
an accompanying job diagnostic survey should be required relating to retention, as
45
minimal studies have been conducted on this. The study by Fried and Ferris (1985)
pointed out that, although in the overall number of studies that have investigated the
job diagnostic survey, the absenteeism relationship is relatively small, the results
obtained by the study seem to support the linkage proposed by the job
characteristics model.
A meta-analysis conducted by McEvoy and Cascio (1985) on the effects of realistic
job previews versus job enrichment indicates that job enrichment interventions have
“modest but meaningful effects on turnover and that they are about twice as effective
at reducing turnover as realistic job previews” (Fried & Ferris, 1985: 310). Stepin and
Brand (1986) and Wall and Clegg (1982) appear to provide additional support for job
enrichment influences on turnover (Fried & Ferris, 1985).
When they conducted a study on the job characteristics model in relation to
absenteeism, Fried and Ferris (1985) concluded that absenteeism may be reduced
through the development of skill variety, autonomy and job feedback. Pierce, Jussila
and Cummings (2009) explored the psychology of work in general and the role of
psychological ownership in job design. They suggested, as a result of the job design-
psychological ownership relationship, that there are several emergent effects. The
negative effects include stress, the burden of responsibility, unwillingness to share,
resistance to change and isolation. However, there are also a number of positive
effects, which are quality in-role performance, citizenship behaviour, stewardship,
nurturance, and self-sacrificing and protective behaviours (Pierce et al., 2011).
According to Pierce et al. (2011), most attention has been given to the moderating
effects of growth need strength in the job characteristics model, and while their
results are supportive of this, the evidence also suggests that the results of the job
46
redesign in accordance with the job characteristics model is positive for virtually all
the employees, some respond more positively than others. Pierce et al. (2011: 315)
propose revisions to the job characteristics model, calling for “a) continued
examination of the moderating effects of growth need strength, b) an examination of
the conditions that lead to positive and negative effects, and c) consideration of the
cultural values that promote the development of personal sense of ownership”.
A study conducted by Casey, Hilton and Robbins (2012) used the job characteristics
model to evaluate motivation in a service manufacturing retail company in the USA.
The study evaluated several of the dimensions of the model, and examined the
possible impact of culture on the model, or the possible impact of gender on the
results. The study found the core job characteristics in the model higher in the USA
than those found in studies in Nicaragua and Guatemala. The researchers suggested
that the possible reasons for the variances might be culture and possibly gender. In
the article the researchers raise the issue that culture may play a very important part
on the model and make a substantial impact on motivation.
DeVaro, Li and Brookshire (2007) evaluated the empirical relevance of the job
characteristics model in the modern organisational environment, using unique,
nationally representative data from a survey of British establishments. The results of
the study generally supported the job characteristics model predictions that task
variety and worker autonomy are positively associated with labour productivity and
product quality and that autonomy is positively associated with worker satisfaction
(DeVaro et al., 2007). Gostautaite and Buciuniene (2010) propose that the person-
environment fit can be seen as a general multidimensional framework obtaining
content constructs from existing theoretical models such as the job characteristics
47
model. The study shows that this model complements the person-environment fit
theory. There is a recommendation that future research should focus more on the
individual differences that affect job characteristics outcome relationships.
Hackman, Oldham, Jansen and Purdy (1975) confirm that the job enrichment theory
is correct, as the job diagnostic survey instrument has been taken by more than 1000
employees working on about 100 diverse jobs in more than a dozen organisations
over the last two years, and the findings are in keeping with the job characteristics
model. The results summarised by their study on job enrichment suggest that both
the job characteristics model and the diagnostic instrument are effective when used
with real people in real organisations (Hackman et al., 1975). The study focuses on
jobs which are near the lower end of the scale, and which could potentially be
improved with job enrichment. Hackman et al. (1975) believe that the effectiveness of
job enrichment could be enhanced when the tasks diagnosing and changing jobs are
undertaken in a collaborative relationship between management and the employees
whose work could be affected.
Champoux (1980) looked at some extensions to the job characteristics model of work
motivation. The second extension viewed growth need strength as an important
moderator affecting the “curvilinear relationship between job scope and psychological
response” (Champoux, 1980: 467). The findings showed that individuals with strong
growth need strengths responded more positively to jobs with greater scope. The job
scope growth need strength interactions predicted by the basic job characteristics
model were found in two of the three samples. Positive responses to jobs that were
broad in scope were found more among people with strong growth needs than
among people with weaker growth needs (Champoux, 1980). The results of the
48
research suggested that the curvilinear relationship between job scope and affective
response should be made a fundamental aspect of the job characteristics model
(Champoux, 1980).
Studies on how dissatisfaction drives employee turnover were carried out by Hom
and Kinicki (2001). These studies looked at Hom and Griffith’s (1991) model. The
study integrated job avoidance, inter-role conflict and employment conditions into this
framework. Using a survey of retail store personnel, it was found that inter-role
conflict and job avoidance indirectly influenced turnover, as the Hom and Griffith
(1991) model specified, and that unemployment rates directly affected turnover. It
was recommended that further research be conducted on conceptual development to
integrate this into extra work conflict and family structure and to look at how inter-role
conflict mediates the latter’s impact on employees quitting.
The literature review conducted on the theories of job characteristics explained the
job characteristics model by Hackman and Oldham (1975) and showed how the
theory is linked and relates to employee motivation. Further, it can be inferred from
the theories and other studies conducted that the job characteristics model is one of
the predictor variables that can be linked to the proxies of retention. Further studies
should be conducted to investigate this.
2.4 Theories on career anchors
According to Schein (1996), a career anchor is one’s self-concept, and consists of
one’s talents and abilities, including skills and competencies, basic values and
perceptions of motives and needs as they pertain to an individual’s career and
functions. Once the self-concept has been formed, it functions as a stabilizing force,
49
an anchor (Schein, 1996). Career anchors evolve as one gains occupational and life
experience. As individuals gain experience they become clearer about each of these
domains until they have a self-concept and know what their abilities are, and what
they want and value. This self-concept is the individual’s career anchor (Schein,
1996).
These anchors can enable people to recognise their preferences for certain areas in
their job which can help them plan their career. People are generally more fulfilled in
their careers when they can satisfy their career anchors and seek roles that are
aligned with these (Schein, 1996). As one accumulates work experience and
feedback, it provides a basis for more rational and empowered career decisions. This
process leads people to know what they really want, and can help them realise what
they would not give up if they were forced to make a choice (Schein, 2006). Schein
(1996) maintains that, if an individual’s career anchors are fulfilled, that person could
be retained in their organisation.
The career anchor as defined here is the element in a person’s self-concept that they
would not relinquish, even if they were faced with difficult career choices (Schein,
2006). Schein (1996) identified five possible career anchor constructs. Most people’s
self-concepts revolved around these give categories, reflecting basic values, motives
and needs: 1) Autonomy/independence; 2) Security/stability; 3) Technical-functional
competence; 4) General managerial competence, and 5) Entrepreneurial creativity.
Follow-up studies in the 1980s revealed three additional anchor categories; 6)
Service or dedication to a cause; 7) Pure challenge; and 8) Life style.
“It became evident that most people form a strong self-concept, a ‘career anchor’ that
holds their internal career together, even as they experience dramatic changes in
50
their external career” (Schein, 1996: 80). Owing to the turbulent and rapidly changing
work environment, career anchors have become extremely applicable as more
people are being retrenched. The economic situation means that businesses are
downsizing and adopting flat structures. Employees thus have to decide what to do
next if they are to sustain their future.
2.4.1 Autonomy/independence
People who have autonomy/independence as their career anchor would want the
freedom and independence to make their own decisions in the work environment.
They would like to define their own work in their own way, which means they would
want to work in jobs that allow them a high degree of flexibility and freedom.
“Regardless of what they work at, such people have an overriding need to perform
duties in their own way, at their own pace and according to their own standards”
(Schein, 2006: 16). These employees would assume accountability and take
responsibility for the work they do provided they have the independence to make
decisions. If forced to make a choice between a present job that permitted autonomy
and a much better job that required relinquishing it, the autonomy/independence
anchored person would remain in their present job.
The self-reliance needed in the future for someone anchored in this category is
already part of the psychological make-up of this group of people, who could become
role models for future career incumbents (Schein, 1996). The preferred type of work
for an autonomy-anchored person would agree to organisation-imposed goals or
targets but would want to be left alone after these goals had been set. It would be left
to them to accomplish the task (Schein, 2006). This person would prefer merit pay
performance, immediate payoffs, bonuses and other forms of compensation that
51
have no strings attached. They are terrified of ‘golden handcuffs’ and cannot abide
close supervision (Schein, 2006). When it comes to growth opportunities, this person
would prefer promotions that provide more autonomy.
2.4.2 Security/stability
If the career anchor is security/stability, employees would not give up employment
security or tenure in a job. This can be seen as financial stability in the form of
provident/pension funds, and retirement funds or even employment security to
secure their future. Security/ stability-anchored people welcome the ‘golden
handcuffs’ and are willing to give the responsibility for their career management to
their employers (Schein, 2006). These employees may trade loyalty and willingness
to do whatever the employer wants for some promise of job tenure (Schein, 1996).
People are less concerned with the content of the work or the position they could
achieve in their organisation.
The main concern here is for employees to have a sense of achievement and
success so that they can relax. This type of person prefers stable, predictable work
and is more concerned about the context than the nature of the work (Schein, 2006).
This person appreciates an organisation with a mechanistic, rigid structure that has
clear rules and guidelines for them to follow. This person prefers to be paid in
steadily predictable increments based on the length of service and would like to be
recognised for their length of service, their loyalty and their consistent performance
patterns. They need reassurance on further stability and continued employment
(Schein, 2006). “Internal to the career occupant is that the base of security and
stability has to shift from dependence on an organisation to dependence on oneself.
Self-management and self-reliance are dominating factors for future career
52
management” (Schein, 1996: 81).
2.4.3 Technical/function
Employees who have this as a career anchor prefer to use their technical skills. Like
the technologists/scientists and engineers, they have a strong talent, and are highly
motivated to do a particular kind of work and are experts in their field. They build a
sense of identity around the content of the work and the technical and functional
areas in which they are succeeding, and develop their skills to excel in these areas
(Schein, 2006). They want every opportunity to develop and apply their technical
skills until they have reached the highest level. Schein (1996: 83) maintains that
...this group is of necessity as the skill and knowledge can become rapidly obsolete due to the dynamically and turbulent changing technological world and it may not be clear if firms can guarantee continued education and retraining on the technical aspects...
A technical/functional career-anchored person prefers challenging work that tests
their abilities and skills. These people want to be paid for their skill level, which is
defined by their educational and work experience; Scientists in the pathology field
also prefer a definite remuneration level and social incentives like bonuses as forms
of recognition of their skills and abilities (Schein, 2006).
This type of person prefers professional or technical ladder that functions in parallel with the typical managerial ladder, and they want to be recognised by their professional peers’ more than uninformed rewards from management (Schein, 2006: 10).
They would prefer further learning and development in their specialist field, and
incentives for them would be press, awards, publicity, a number of published articles
and papers and acknowledgements, rather than an extra percentage in the pay
cheque, provided that their basic pay is within the industry norm for their specialist
qualification (Schein, 2006). For this group to remain technically/functionally
53
competent, they constantly have to undergo re-training, attend refresher courses,
and remain up to date with new technologies and knowledge. However, the question
is - do these individuals have to budget for their own learning, or will organisations
bear these costs and look at them as aspects of organisational learning and updating
the skills and competences of these skilled professionals? (Schein, 1996). If the
organisation were to assist the professionals by funding the improvement of their
technical competence, it would result in increased job satisfaction for the employees
and could go towards retaining them in their organisation.
2.4.4 General managerial
These career anchor employees would prefer to be in a management position where
they are responsible and accountable for a complete piece of work and they would
identify their own work with the success of the organisation for which they work. They
would want to continue climbing to a high enough level in their organisation to enable
them to integrate the efforts of others across functions and to be responsible for the
organisation’s output of work.
These career-anchor people have to be highly motivated to exist in this political
environment. They must also have financial, analytical and leadership skills in order
to make highly complex decisions with only partial information (Schein, 1996). The
career occupant with this as an anchor would be forced to examine what they really
wanted. “Is it power, glory, responsibility, accomplishment of a task, the ability to
build and manage a team, or a combination of these?” (Schein, 1996: 84).
Such people must have a range of competencies if they are to be general managers,
and they must be ambitious enough to rise to organisational levels where they are
54
accountable for policy decisions and where their own efforts will make the difference
between the success or failure of the organisation (Schein, 2006). To be successful
as a general manager, one requires analytical competence, interpersonal and
intergroup competence and emotional competence. “Analytical competence refers to
the ability to identify, analyse, synthesize ad solve problems with incomplete
information and uncertainty and make organisational decisions” (Schein, 2006: 11).
Interpersonal and intergroup competence is the manager’s ability to influence,
supervise, lead, handle and control people at all levels of the organisation in order to
achieve goals (Schein, 2006).
Schein (2006: 13) defines emotional competence as
the capacity to be stimulated by emotional and interpersonal issues and crises, rather than to be exhausted or deliberated by them; the capacity to bear high levels of responsibility without becoming paralyzed, and the ability to exercise power and make difficult decisions without guilt and shame...
This type of people prefers working in an environment where they have an effective
organisation to manage, and they are real ‘organisation people’. Managerially-
anchored people expect to be paid a very high income in comparison with that of
junior staff. They like short-term rewards, such as bonuses. Having a successful
organisation motivates them. Their preferred growth opportunities include being
promoted to a more senior position with greater responsibility based on merit,
measured performance and results (Schein, 2006).
2.4.5 Entrepreneurial creativity
People with this career anchor would like to create or build their own organisation or
enterprise, create new ventures, by developing new products or services, by building
new organisations through financial manipulation, or by taking over existing
55
businesses and reshaping them to their own specifications. They would like this to be
based on their own ability and competencies and would be willing to take risks and
overcome any obstacles that may arise (Schein, 2006). These people would want to
prove that the creation and success of the enterprise was a result of their own effort
and hard work, and would want the enterprise to be financially successful as proof of
their abilities.
As the world becomes more turbulent, dynamic and complex, the opportunities for
individuals with this anchor will increase dramatically (Schein, 1996). Creativity is
seen as core for this anchor, and individuals who opt for this route must ensure that
they have the skills to deal with the technological, social, economic, environmental,
cultural and political issues. Business and management schools should recognise the
importance of business training for both entrepreneurship and more autonomous
careers (Schein, 1996).
Entrepreneurially-anchored people are willing to sacrifice both autonomy and
stability, particularly in the early stages of a business before it becomes successful. If
they fail, they continue to try until they are successful. They prefer jobs in which they
can create new opportunities, as they easily become bored. They continually require
new, creative challenges and they like jobs with enough autonomy. They like to
accumulate wealth to show what they have achieved, as ownership is ultimately
important for them. They seek high personal visibility and public recognition by
building fortunes and sizeable enterprises (Schein, 2006).
2.4.6 Service/dedication to a cause
People with this career anchor want a meaningful job, as they choose to do

56
something that adds value, such as improving the quality of life, such as in the health
sector. They enter these occupations because of the central values they want to
embody in their work and careers.
Nurses/technologists/ scientists and pathologists choose to be in this profession
because of the value it adds to society. Saving people’s lives or working in medical
research has been a part of finding cures for diseases. People with this career
anchor pursue such opportunities even if they have to change organisations, and
they do not accept promotions that are going to take them out of the work that fulfils
those values. Values such as working with people, serving humanity, saving the
environment, and helping the nation can be powerful anchors in their career (Schein,
2006).
According to Schein (1996), organisations absorb a lot of the technologically
unemployed as well as attracting some of the best and brightest of the new
generation. People anchored in service/dedication want fair pay for their contribution
and portable benefits as they have no priori organisational loyalty (Schein, 2006).
These people want recognition and support from their professional peers and
managers, and want to know that their values are shared by higher levels of
management. More important than monetary rewards is a promotional system that
recognises the contribution that has been made. These people want to move into
higher positions where they can have more influence and freedom and can operate
more freely in their work space (Schein, 2006).
2.4.7 Pure challenge
People with this career anchor want a job that offers a daily challenge. They thrive on
57
finding solutions to difficult, unsolvable problems, to succeed over tough opponents,
or to overcome difficult obstacles. The only meaningful reason for pursuing such a
job would be to succeed in an impossible situation or to win over extremely tough
opponents. If the job becomes easy and monotonous, an employee like this becomes
bored and loses interest.
According to Schein (1996), there will be no shortage of challenges to be met, as
long as the individual is willing to become an active learner as well, since the nature
of these challenges evolves rapidly with technological change. The medical research
field is a good example of this, as medical scientists are continuously working in a
challenging environment, finding cures for diseases. As soon as a particular drug has
been developed, patients’ genes mutate and people start becoming resistant to the
drugs, so the challenge continues. For a person anchored in pure challenge, the area
of work, the kind of organisation, the pay and rewards system, the promotion system,
and forms of recognition are all important as to whether or not the job provides
constant opportunities for self-interest (Schein, 2006).
2.4.8 Life style
In this career anchor people look to have a balanced life. They would not give up a
situation that permits them to balance and integrate their personal needs, family
needs, and the requirements of their work. They would require a career that
accommodated and integrated all of these needs and was flexible enough to provide
a balance. These individuals consider how they live their total life and how their
family needs as well as job needs complement each other.
This can be broken into economic security and/or geographic stability. With
58
geographic stability, individuals refuse to move every few years, especially if they
would be moved away from their families. Social values shift owing to family
concerns, as people want more autonomy and are self-concerned, which results in a
preoccupation with their lifestyle in most of these career occupants. Especially now,
with more women in professional jobs, they need a balance to ensure that their family
is not neglected while they balance a family and a career. Organisations need to
ensure that they are more flexible and avoid red tape, as this has increasingly
become a career anchor for most people.
Lifestyle-anchored people look for an organisational attitude rather than a specific
program, an attitude that reflects respect for personal and family concerns and
enables the manager to renegotiate the terms of the contract (Schein, 2006).
According to Schein (1996: 82),
more individuals will begin dual career situations, they will think, plan, and act more as social units, and organisations will have to consider how to maintain support systems for such units in the form of child care, job sharing opportunities, sabbaticals, and other adaptive modifications of the traditional 9 to 5 job. Even the way work is defined will gradually change as the boundaries between jobs, between organisations and between work and family become more fluid and ambiguous...
2.4.9 Major changes that have occurred in the world, affecting work and career anchors
According to Schein (2006), the changes that have occurred in the world are shown
to affect the working environment as well as individuals’ career anchors. Schein
(2006) goes on to explain that organisations worldwide are continuing to re-examine
their structures and are engaging in various kinds of downsizing, rightsizing, joint
ventures, acquisitions and mergers. Because of the turbulent and competitive
environment, business is exposed to globalization. They have to ensure that they are
continually improving, but at the same time are being more creative and have more
59
innovative ways of conducting business. This has resulted in organisations re-
designing and re-structuring. This requires specific types of people to fulfil job roles
(Schein, 2006). Globalization and new technologies have loosened the boundaries of
organisations, jobs and roles.
Owing to changes and advancement in technology, someone with technical and
functional as a career anchor can be seen as positive for work processes, which in
turn can increase job satisfaction for such employees. As technological advancement
increases, work processes have become more automated, especially in the
pathology environment. An example of this advancement in medical science is to be
seen in the diagnosis of Tuberculosis (TB). Owing to enhanced technologies, a
patient can be diagnosed with TB, with the drug resistance status known within 48
hours, so treatment can start and patients can be isolated. The more ‘traditional’
methods of TB diagnosis allowed for a long turnaround time of six weeks. Managers
and their subordinates are now equally trained and informed about technological
processes, and these improvements have in turn motivated staff, and increased
patient care and service delivery.
As work becomes technically more complex, fewer people will work in operational
roles and more in knowledge-based service and in staff roles supporting the
operation. Owing to the increase of automated systems, as can be seen in pathology,
management has more co-ordinating and liaison functions and fewer monitoring and
control functions. Those who have ‘managerial’ as a career anchor will be aware that
they have more shared responsibilities. As conceptual work increases and job/role
boundaries loosen, anxiety levels show a vast increase (Schein, 2006). Because of
the changing nature of work, which now requires more flexibility and innovative
60
strategies, employees become more anxious as the stressful situations have
increased. Employees have a sense of ‘shared anxiety’, which is why, when working
in groups, work and stress factors are shared among the groups. It can be said that if
an individual’s career anchor is fulfilled, a certain amount of stress is relieved.
In the process of ‘rightsizing’, organisations are a) re-examining their hierarchal
structures, b) moving towards flatter organisations, c) relying more on co-ordination
mechanisms other than hierarchy, and d) ‘empowering’ their employees in various
ways (Schein, 2006). If an organisation moves to a flatter structure, employees would
be expected to be multi-skilled, and autonomy plays an important role. Because of
the complex roles, there may be some anxiety among team members. Although a
flatter structure can exist, there is still a need for strong leadership and empowerment
of the individual. In the political environment to which people are exposed, anxiety
may build up with the power struggles between individuals in the same team. This is
once again seen as the struggle between changes in organisations and globalisation
and existing work practices.
Organisations are becoming more differentiated and complex. With the growth of
technology, demands have become more complex and organisations are changing to
a matrix-type structure, as different specialists may be required in an organisation. In
the medical research field, there are doctors who are specialists in HIV management,
and there is the finance team who have to ensure that the funds are used wisely, so
that all the costs are covered. These individuals are important in the field but may
hardly ever see each other or work together. However, the integration of these
employees’ efforts is necessary if the organisation is to function optimally.
Development planning for these specialists by the leaders is also important to ensure
61
their own development.
Organisational subunits develop subcultures that will have increasing difficulty in
communicating with each other, even though they are increasingly interdependent.
Each subunit in an organisation may develop its own subculture. For instance, the
terminology doctors’ use may differ from that used by the finance people, but they
are interdependent in the organisation. Leadership is then responsible for ensuring
that each unit understands the others (Schein, 2006). Organisational climates are
becoming more collaborative/cooperative. Because different players work
interdependently in an organisation, the competition among these units is increasing.
Competition can be good if it is constructive and not destructive. People in different
units are therefore expected to work together through collaboration, which is on the
increase as far as teams are concerned. There ought to be more decentralization
and knowledge and information sharing so that units can co-ordinate their activities
and collaborate with other units to achieve the common goals of the organisation.
Organisations are becoming more dependent on lateral communication channels.
Because of the close collaboration between units, lateral structures such as project
teams, task teams, cross functional work groups and matrix management are
essential (Schein, 2006). The old ‘traditional’ hierarchal management may not work in
these collaborative settings, so lateral communication management should be
introduced.
Socio-cultural values relative to family, self and work are changing. Individual focus
where employees want to live a more balanced life has changed. People value the
conservation and protection of the environment in which they live more than they do
economic growth, promotions and being exclusively career oriented (Schein, 2006).
62
Employees also want to be sure that they are performing meaningful functions at
work, as well as being involved in decisions that affect them. ‘Success’ has been
redefined as people’s full use of their talents as well as their contribution to their
family, their work organisation, community and themselves. Corporate social
responsibility has also been increasing in organisations.
According to Schein (2006: 50),
as options and choices have opened up and as managers have begun to question the traditional success ethic, they have become more ready to refuse promotions or geographical moves, more willing to ‘retire on the job’ while pursuing family activities or off-the-job hobbies more actively, and have even resigned from high-potential careers to pursue various kinds of ‘second careers’ seen to be more challenging and/or rewarding by criteria other than formal hierarchical position or amount of pay....
Owing to the rapidly changing environment and the turbulent world we live in, job/role
planning will become an ever more critical task for everyone. Career pathing and
career development will have to be more of a negotiated process between the
individual and members of the project teams rather than a corporate, centralized
activity, as socialization and training will be required and individuals have to be self-
reliant and responsible in managing their own ‘learning’ (Schein, 1996).
2.4.10 Related research on career anchors
Nordvik (1996) evaluated the relationship between Holland’s (1966, 1985) vocational
typology, Schein’s (1996) career anchors and Myers-Briggs’ (1985) types. All three
theories share the common idea that people tend to have differential preferences for
certain modes of coping and developing, “which they have to exercise in order to
perform and feel well in their work and life experiences” (Nordvik, 1996: 23).
Holland (1966) assumes that, in accordance with people’s personalities, they would
63
find jobs that fit their own personality and would find satisfaction in this. He
considered six types of personalities: realistic, investigative, artistic, social,
enterprising and conventional, which he arranged in a hexagonal model. Myers-
Briggs (1985) added one dichotomy concept, which was judgement-perception, to
three theories: Jung’s (1941) theory of psychological types which are extraversion-
introversion, sensing-intuition and thinking-feeling. This developed into the Myers-
Briggs Type Indicator (MBRI) to measure these concepts.
The findings of the study by Nordvik (1996) showed that extroverted persons tended
to prefer enterprising work and to be stimulated, whereas introverted persons
preferred and wanted comfort in their position. Introverts also preferred technical skill
development and self-expression, as opposed to managerial competence and
assisting others. The intuitive person tended to prefer stimulation, management, self-
direction, and self-expression, while sensing people preferred comfort, skill
development, belongingness and helping others. Feeling persons were more socially
oriented and more concerned with comfort than were thinking persons. Perceptive
persons were oriented towards autonomy and freedom in their careers, while judging
people preferred a sense of security and belongingness (Nordvik, 1996).
The results showed that personality fit is important to the careers people choose. In
this study, career anchors will be used as a platform derived from Nordvik’s (1996)
and other studies. It shows that people’s personalities play a vital role in their career
anchor, which makes the career anchor the dominant factor in decision-making when
it comes to career decisions.
Wils, Wils, and Tremblay (2010) conducted a study proposing an original career
anchor structure that captures multiple dominant anchors, whereas Schein’s (1996)

64
theory of career anchors looks at the dominance of a single career anchor. Wils et al.
(2010) maintain that the characterization of dominance as a multidimensional rather
than a unidimensional phenomenon problem that had previously been explored. Wils
et al. (2010) argue that if an employee possessed several career anchors, it would
give them more options and flexibility in their career path management. However,
Schein (1996) maintains that there would be a dominant factor that an individual
would not relinquish if they had to make a career decision. According to Wils et al.
(2010) the reason why people choose a career in management is that they place
considerable importance on values such as social power, wealth and social
recognition.
The main weakness of the instrument used in the study by Wils et al. (2010) is that it
forces oppositions that are, in some cases, ‘artificial’, in that they did not rest on a
theoretical framework. The research instruments used in the study by Wils et al.
(2010) to measure career anchors do not possess robust psychometric qualities, and
need to be better measured.
However, in the present research, the original career anchor model by Schein (1975),
together with the career orientation inventory as the research instrument by Schein
(1975), was used. It is a validated instrument and provided valuable insight into how
the career anchors play a role in retaining individuals in the health sector.
A study by Denzinger and Valency (2006) was conducted in Israel, examining
Schein’s (1996) career anchor concept, which looked at the effect of career anchors
and their impact on job satisfaction. The study validates the fact that a person’s
dominant career anchor influences his/her career path, as proposed by Schein
(1996). The study also confirms the hypothesis that congruence between a person’s
65
career anchor and job setting leads to higher positive job satisfaction (Denzinger &
Valency, 2006).
Overall, the study affirms the main intention of the career anchor theory and reaffirms
the importance of the concept for individuals.
...to achieve a better match between the individual’s career orientation and job, career counsellors might find it advisable to identify the career anchor in order to gain a clearer insight into the individual’s talents, needs, inner motives and values. (Denzinger & Valency, 2006: 301).
Denzinger and Valency (2006) maintain that future research should be conducted to
evaluate job satisfaction and the career anchors, as it would add objective measures
of job effectiveness and would strengthen the validity of Schein’s (1996) theory. This
study provides further insight into the career anchors, together with the specific job
characteristics.
The literature review conducted on the theories of the individual characteristics
explained Schein’s (1996) career anchors and how the theory relates to the different
aspects of careers and employee motivation. The career anchors were further
discussed looking at globalisation and changes in working practices which affect the
way in which employees work. Further, it can be inferred from the theories and other
studies conducted that Schein’s (1996) career anchors can be seen as one of the
predictor variables that can be linked to the proxies of retention, which is intention to
quit and organisational commitment. Further studies should be conducted to
investigate this.
2.5 Theories on job satisfaction
Job satisfaction refers to how content employees are with their jobs. Ramlall (2004)
maintains that if employees are satisfied in their job they are more likely to remain in

66
their organisation. The different components of satisfaction are seen to be the job,
pay, security, social, growth, supervisory and total satisfaction (Hackman & Oldham,
1976). Job satisfaction can be differentiated as affective job satisfaction and cognitive
job satisfaction (Hackman & Lawler, 1971). Affective job satisfaction is the extent of
the gratifying emotional feelings employees have about their jobs as a whole. It is
different from cognitive job satisfaction, which is the extent of individuals’ satisfaction
with particular facets of their jobs, such as salary, pension or provident fund benefits,
working hours, and numerous other aspects of their jobs (Hackman & Lawler, 1971).
Pay satisfaction is linked to rewards like financial remuneration, bonuses and
incentives. Security satisfaction is experienced when someone has stability in an
organisation and feels secure (Hackman & Oldham, 1976). An employee has social
satisfaction when their working environment is encouraging and positive. This
includes interaction with peers and managers at the office, receiving emotional
support and guidance from other members of staff, and building relationships and
solid friendships (Hackman & Oldham, 1976). Supervisory satisfaction pertains to an
employee who is satisfied with the leadership style and behaviour in the organisation.
They have a leader who guides them and provides them with direction. Lastly, growth
satisfaction is linked to promotion opportunities and further employee growth and
development (Hackman & Oldham, 1976).
In a recent study, McDonald (2013: 212) maintained that “55% of American
employees were dissatisfied with their work and this included even those people who
were happy to have a job”. Employee satisfaction can have benefits not only for the
employees, but also for the company. One notes the influence of job satisfaction on
absenteeism and turnover, which impacts negatively on an organisation. It should be
67
noted that it is difficult to predict or determine the cause of these circumstances.
There are numerous job satisfaction models and theories. The model discussed
above was the job characteristics model, devised by Hackman and Oldham (1976).
The model is widely used as a framework for studying how particular job
characteristics impact on job outcomes, including job satisfaction. Different types of
satisfaction can be looked at to evaluate an employee’s total satisfaction in an
organisation. These include: job satisfaction, pay satisfaction, security satisfaction,
social satisfaction and growth satisfaction (Hackman & Oldham, 1976).
Supervisory factors can be seen as a variable that can influence retention, so
literature on leadership will be considered in more detail in an attempt to unravel the
complexity of the link between supervisory satisfaction and retention. Organisations
need strong leaders with direct responsibility for human resource management and
senior leaders in the organisation to support and integrate all the areas of human
resource management. Leaders can imbue the system with a positive, people-
centred philosophy and a set of values that view employees as human beings who
are entitled to equity, respect, appreciation, and support first and as organisational
assets second.
Transformational leadership can be seen as a more charismatic style and excludes
the micromanagement of employees, rather giving them the autonomy to carry out
their tasks once they have been empowered (Maritz, 2000). Transactional leadership
focuses more on managerial leadership, such as supervision, whereas organisation
and group performance can be seen as an ‘exchange’ between managers and
subordinates, rewards received for good performance and punishment for bad
performance (Maritz, 2000).

68
Transformational leadership has been found to produce improved employee
outcomes in many different types of organisations (Dubinsky, Yammarino & Jolson,
1995) and consists of what Bass and Avolio (1994) call the four I’s: idealised
influence, inspirational motivation, individualised consideration and intellectual
stimulation. Danie Maritz, managing director of Productivity Development, a South
African consultancy specialising in leadership development, for South African
leaders, argues that, “to become more competitive and effective, we must be
successful in developing the behaviour and characteristics of transformational
leadership” (Maritz, 2000). Hytter (2007) states that several studies report good
leadership as a reason for “staying in an organisation”.
According to Chen and Silverthorne (2005), the higher the leader’s leadership score,
the higher the willingness to perform a task and the higher the employee job
satisfaction. This also means that the lower the employees’ job stress, the lower their
turnover intention. A leadership style that values employee involvement and
participation can be seen as good from the point of view of retention, and
organisations that use numerous suggestions benefit financially. This also “helps to
foster their employees’ self-esteem and commitment to the organisation” (Hytter,
2007: 71). Hytter (2007) states that another approach to motivate employees is with
autonomy.
Research was conducted into the managerial competencies among hospital
managers in South Africa. It included a survey that evaluated the skills and
competency levels of these managers in both sectors. The results showed that
managers in the private sector perceived themselves to be significantly more
competent than their public sector colleagues in most of the management
69
requirements. Public sector managers were more likely than their private sector
colleagues to report that they required further development and training (Lyons &
Linda, 2006). However, the study was not linked directly to the intention to quit and
did not include the types of leadership styles used by public and private sector
managers, so the research could not assist the researcher in evaluating whether staff
would be retained by the leadership style of the managers in either the private or the
public sector. The researcher did conclude that the private sector managers were
more satisfied than their public counterparts (Lyons & Linda, 2006).
Leaders in health care organisations are becoming increasingly interested in ways of
attracting and retaining staff, and gaining their employees’ commitment (Morrison,
Burke & Greene, 2007). Leaders have to find solutions to the problem of the turnover
of skilled professionals to ensure that the quality of the health care sector is of a high
standard and that patients are receiving adequate care. This article reviews,
amplifies and extends work that has been done in the area of ‘meaningfulness of
work’ in the context of employee retention and commitment (Morrison et al., 2007).
Health care workers have looked at increasing employee morale and have
considered extrinsic motivational strategies that do not produce long-term results
(Morrison et al., 2007). Morrison et al. (2007) suggest that intrinsic motivation, such
as increasing job satisfaction and culture, as well as empowering individuals has
more long-term results when it comes to retention. Morrison et al. (2007) maintain
that if employees are to realize meaning in work they have to view work as being
something bigger than themselves. Healthcare work should be meaningful, as it is
about service to patients, their families and the community.
70
Employees should feel needed and valued as they are important to society, seeing
that they offer a service to sick patients and can assist in improving their quality of
life. This can be seen as a motivating factor that would retain nurses in the health
sector. Morrison et al. (2007) argue that helping employees find and understand the
meaning of work and how it can contribute to the meaning of life certainly has the
potential to increase commitment, reduce turnover and improve morale. “Since the
healthcare sector is experiencing tight budgets and challenges, motivation can be
approached from this viewpoint in addition to the traditional rewards-based systems”
(Morrison et al., 2007: 108).
Managers should empower their employees to take greater control over their work
environment and to solve problems immediately (Morrison et al., 2007). Bueno
(1990) points out that leaders hire adults and should treat them accordingly. Adults
are individuals who are responsible and accountable for the power and authority
extended to them. They think for themselves and question challenges rather than
depending on rules and regulations to guide them. Dunn, Dastoor and Sims (2012)
conducted research in the USA and Israel, and found that transformational
leadership had a positive impact on organisational commitment. It was found that,
when applying transformational leadership, leaders articulate a shared vision, set
high but realistic expectations, stimulate their employees intellectually, recognise
differences and demonstrate consideration and support for the employees (Dunn et
al., 2012).
O’Brien, Duffield and Hayes (2006) explored the research topic ‘Do we really
understand how to retain nurses?’ The researcher studied the critical issues for
retention. These factors indicated opportunities to develop professionally, autonomy
71
in practice, participative decision-making processes, and fair reward and
remuneration for work undertaken. The research method was firm, as factor analysis
was used as a statistical tool to achieve a multivariate perspective.
It was found that staff nurses’ perceptions of autonomy, control and physician
relationships influence trust, job satisfaction and the perceived quality of patient care.
Good leadership was also linked to nursing retention, while aggression and burn out
were linked to the increased number of hours worked and emotional exhaustion
(Morrison et al., 2007). The study explored the results from other studies, which can
be seen as a limitation, as more research is needed to clarify how perspectives differ
between nurses and nurse executives in terms of priorities for nurse retention in a
variety of practice settings. Leaders ought to examine intrinsic motivation, provide a
culture that encourages this level of exploration for all employees, and develop
methods that assess and sustain this approach (Morrison et al., 2007).
Figure 2.5 below is a model developed from the above research. The model
suggests that if employees are satisfied they will be productive and can be retained.
The model shows that staff competencies, technology infrastructure and the correct
working climate all play a vital role and are linked to job satisfaction and results or
objectives produced by an employee. The model differs from the one proposed, as it
excludes the proxies for retention, which are career anchors, satisfaction and job
characteristics. Organisational commitment and intention to quit were not analysed.
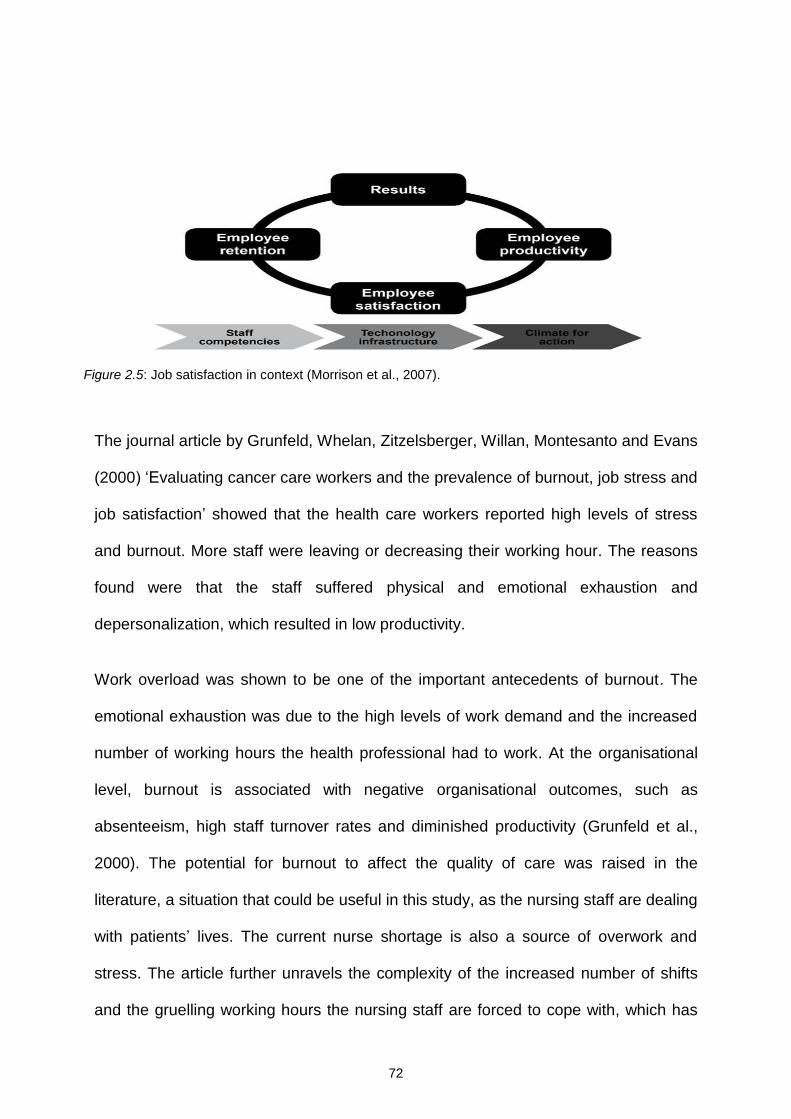
72
The journal article by Grunfeld, Whelan, Zitzelsberger, Willan, Montesanto and Evans
(2000) ‘Evaluating cancer care workers and the prevalence of burnout, job stress and
job satisfaction’ showed that the health care workers reported high levels of stress
and burnout. More staff were leaving or decreasing their working hour. The reasons
found were that the staff suffered physical and emotional exhaustion and
depersonalization, which resulted in low productivity.
Work overload was shown to be one of the important antecedents of burnout. The
emotional exhaustion was due to the high levels of work demand and the increased
number of working hours the health professional had to work. At the organisational
level, burnout is associated with negative organisational outcomes, such as
absenteeism, high staff turnover rates and diminished productivity (Grunfeld et al.,
2000). The potential for burnout to affect the quality of care was raised in the
literature, a situation that could be useful in this study, as the nursing staff are dealing
with patients’ lives. The current nurse shortage is also a source of overwork and
stress. The article further unravels the complexity of the increased number of shifts
and the gruelling working hours the nursing staff are forced to cope with, which has
Figure 2.5: Job satisfaction in context (Morrison et al., 2007).
73
resulted in burnout and decreased job satisfaction. This has led to these
professionals wanting to leave their organisation.
Hausknecht, Rodda and Howard (2009) evaluated a content model for retention
factors encouraging employees to remain in their organisation. The findings were that
high performing individuals remain if job satisfaction is high, while extrinsic rewards
were the reason for some of the low performing individuals remaining in the
organisation. The study had limitations, as not all the other retention factors were
considered. Also, the study did not specify what type of job satisfaction would retain
the employees. Grunfeld et al. (2000) also stated that job satisfaction could include
the structure, culture and flexibility of an organisation, which are linked to
organisational commitment. This study will cover some of the gaps found in the
above study, and different aspects of retention will be evaluated to detect whether
these reasons would go towards retaining employees.
Literature on stress and coping among nursing managers shows that stress in the
workplace is of concern, as it contributes to organisational inefficiency, high staff
turnover, sickness absenteeism, decreased quality and quantity of care, increased
costs of health care, and diminished job satisfaction (Shirey, 2006). The article
revealed that, through their leadership behaviours, nurse managers play an integral
role in creating the health care work environment and modelling the way for staff
nurses.
Research has identified the positive relationship between leadership behaviour and
staff nurse job satisfaction, productivity, and organisational commitment (Shirey,
2006). The conclusions drawn were that managers could significantly reduce stress
and increase communication to enhance elements of the work environment
74
conducive to job satisfaction and patient safety (Shirey, 2006). The literature shows
that the leadership style does impact on the functioning of the nursing department
and increased job satisfaction, as the cascading effect of leadership behaviours
extends beyond modelling to include challenging the process, inspiring a shared
vision and enabling others to act.
The article on job satisfaction among nursing staff in a military health care facility
investigated job satisfaction in the workplace. This has been proved to affect
absenteeism, turnover and performance (Allgood, O’Rourke, Van Derslice & Hardy,
2000). It was noted that autonomy, professional status and pay were the most
important factors leading to job satisfaction, while organisational policies were the
least important.
Other studies demonstrated that there was a relationship between nursing staff’s
dissatisfaction levels and decreased productivity and performance. The studies also
explained that nurses who are more empowered have a higher level of satisfaction
(Allgood et al., 2000). As noted by researchers in military hospitals, army nurses
generally want the same as their civilian counterparts: more support services, better
staffing, more flexible scheduling and better leadership at their immediate supervisor
level. In one study carried out at a military hospital, the most common stressors were
found to be lack of support from supervisors, high levels of responsibility, long
working hours, task overload, and physical and emotional demands on the nurses
(Allgood et al., 2000).
The literature review conducted on the theories of job satisfaction explained the
different types of satisfaction, which included: the job, the pay, security, and social,
supervisory and growth satisfaction. It was seen in most of the literature evaluated
75
that supervisory satisfaction was foremost for most of the employees. Furthermore, it
can be inferred from the theories and other studies conducted that satisfaction can
be seen as one of the predictor variables that are linked to the proxies of retention,
which is intention to quit and organisational commitment. Further studies should
investigate this.
2.6 Theories on organisational commitment
Organisational commitment means that an employee takes pride in the organisation
for which they work, identifies with the mission and objectives of the organisation,
and works to achieve the goals (Meyer & Allen, 1997). An employee who is
committed intends to remain in the long term and is loyal to that organisation,
defending the company whenever the occasion arises.
The employee behaves in a manner well beyond expectation, and excels in his or her
performance to ensure that the strategic goals of the organisation are met.
Commitment to the organisation is a proxy for a person’s intention to stay and has
the potential to predict organisational outcomes like performance, turnover,
absenteeism, tenure, and organisational goals (Meyer & Allen, 1997). If an employee
is particularly committed to their organisation they want to be retained.
Meyer and Allen (1991: 67) offer the following definition of their three types of
organisational commitment: “Affective commitment refers to the employee’s
emotional attachment to, identification with, and involvement with the organisation.
There is a sense of belonging and attachment to the organisation”. Employees with a
strong affective commitment continue employment with the organisation because
they want to do so. “Continuance commitment refers to an awareness of the costs
76
associated with leaving the organisation, both financial and non-financial” (Meyer &
Allen, 1991: 67). Employees whose primary link to the organisation is based on
continuance commitment remain because they need to do so. Finally, normative
commitment reflects a feeling of obligation to continue the employment. The extent to
which an organisation conveys its expectations may instil a sense of obligation
among the employees and may result in the duration of extra effort. Employees with
a high level of normative commitment feel that they ought to remain with the
organisation. Affective commitment results in better performance and more
meaningful contributions. This would be followed by normative commitment, and then
continuance commitment (Meyer & Allen, 1997).
Research conducted by Hartman and Bambacas (2000) revealed that both the three-
and the four-factor models of commitment are adequate. However, the four-factor
model demonstrated a better explanation of an employee’s intention to quit, which is
consistent with the employment circumstance of the sample. The study investigated
three types of organisational commitment among casual female professional staff
and the usefulness of the Meyer and Allen (1991) scales, (Hartman, 2000).
Research conducted by Johnston, Varadarajan, Futrell and Sager (1987: 36) shows
that “job satisfaction constructs are more strongly related to behavioural intention
measure of turnover than to actual turnover behaviour measures”. The results
indicate that organisational commitment is not an immediate precursor of turnover,
but is rather an antecedent in the turnover process. Recent research into turnover
shows that the intention to leave is a strong predictor of the actual turnover.
According to Johnston et al. (1987), further research should be conducted on
organisational commitment, job satisfaction, intention to quit and turnover.
77
A study conducted among Chinese companies looked at the predictability of
normative organisational commitment for turnover and revealed that normative
commitment has a greater impact on behaviour and the higher the normative
commitment the lower the turnover. “Affective commitment reflects the attitudes a
person holds towards the organisation and should be predictive of attitude variables
such as turnover intentions and job satisfaction” (Yao & Wang, 2006: 1060).
Research conducted by Alnajjar (1999) in the United Arab Emirates (UAE) indicated
that firms managed by local bosses demonstrated better discipline and more concern
from their employees than did non-national management. Female employees also
expressed higher organisational commitment than males did in relation to discipline.
This could be owing to women’s changing role, whereby females are now allowed to
be employed in larger organisations and build relationships with the external world.
Social status in the UAE was another variable that influenced organisational
commitment (Alnajjar, 1999).
The findings of a study conducted by Dunn et al. (2012) showed a consistently
positive relationship between all five transformational leadership practices and both
affective and normative commitment for all participants. The results also indicated
that the relationship between leader behaviour and employee commitment did not
differ according to the employing nation (Dunn et al., 2012). The study also takes into
account the cross-cultural differences between Israel and the United States regarding
transformational leadership and organisational commitment. Figure 2.6 below depicts
a model that links the job satisfiers discussed above to organisational commitment,
and describes the satisfiers as the job factors, organisational factors and social
factors that are linked to the individual and cultural factors, and results in

78
organisational commitment, which in turn is linked to a person’s intention to stay or
leave (Dunn et al., 2012).
Figure 2.6: Job satisfiers linked to organisational commitment (Dunn et al., 2012).
When comparing the model by Dunn et al. (2012) with the proposed model, it can be
noted that it does not include the differentiation between professional and non-
professional staff, nor does it measure the effect on retention. The model by Dunn et
al. (2012) only evaluated job factors, organisational factors and social factors. The
research also did not take into account the career anchors of individuals and how
they link to the intention to quit. The proposed model also includes the qualitative
data which formed the reasons for retaining professional staff. The main conclusion
drawn by Dunn et al. (2012) was that transformational leadership showed a positive
correlation with job satisfaction and organisational commitment by staff. The model
by Dunn et al. (2012) can be used in conjunction with the proposed model to provide
a holistic view of employees’ intention to leave their organisation.
79
The literature review conducted evaluated all the relevant theories and research
conducted on organisational commitment. In this study, organisational commitment is
used as a proxy for retention.
2.7 Theories on intention to quit
The intention to quit can be defined as an employee’s plan to quit their present job
and look for another job in the near future. Previous research has demonstrated that
the intention to quit is one of the strongest predictors and an immediate precursor of
employee turnover. A study by Elangovan (2001) indicates that there are strong
causal links between stress and satisfaction (higher stress leads to lower satisfaction)
and between satisfaction and commitment (lower satisfaction leads to lower
commitment), and a reciprocal relationship between commitment and turnover
intentions (lower commitment leads to greater intentions to quit which, in turn, further
lowers commitment).
Many researchers have attempted to answer the question as to what determines an
employee’s intention to quit, recognizing its importance for practitioners. However, to
date, there has been little consistency in researchers’ findings (Glissmayer, Bishop &
Fass, 2007). Firth, Mellor, Moore and Loqueot (2004) suggest that it may be owing to
the diversity of the constructs and consistency (or lack thereof) of the measurements.
Research conducted by Krishnan and Singh (2010) demonstrated the outcomes of
the intention to quit on the part of Indian information technology (IT) professionals.
The findings revealed that the intention to quit leads to less performance orientation,
and increased organisational deviance, and less organisational citizenship behaviour
(Krishnan & Singh, 2010). The findings also imply that employees who have a high
intention to quit can bring about increased costs for an organisation in various
80
dimensions. The researchers also state that further research should be conducted in
the field of intention to quit and job satisfaction.
The researchers demonstrate that employees who have the intention to quit may
indulge in actions that are not good for the organisation, such as showing less
interest in the wellbeing of their organisation, higher absenteeism rates, spreading
rumours, insubordination and general lack of initiatives (Glissmayer et al., 2007).
“Intention to quit can result from psychological contact violations, unmet expectations
and perceived lack of reciprocity in exchange” (Krishnan & Singh, 2010: 423).
Halbesleben and Wheeler (2008) concluded, in a study of the relative roles of
engagement and embeddedness in predicting job performance and intention to
leave, that only job embeddedness offered a unique prediction of intention to quit.
With both performance and turnover intention, the findings were beyond the effects of
job satisfaction and affective commitment.
The literature review conducted an evaluation of all the relevant theories and
research conducted on the intention to quit. It can be seen in this survey that limited
research has been conducted on the intention to quit and further research into this
field is necessary. In this study, intention to quit is used as a proxy for retention.
2.8 Summary
Reviewing all the relevant theory and literature has unravelled the complexity of the
problem of retention strategies for scarce-skilled professionals. The research
question posed in this chapter was: “What can we learn from literature regarding the
factors that influence individuals to leave their employers, with specific reference to
professional workers?” This research question was answered by evaluating the job
81
characteristics model and the career anchors model and the main reasons for
employees intending to quit was established. By aligning strategic direction with
goals under the people, service, quality, finance and growth pillars at every level of
the organisation, employees understand that, although tactics may change, the
organisation’s strategies remain the same. In order to retain employees, employers
look at both organisational and individual factors which have to be incorporated into
the organisation. These include motivational factors, job satisfaction and many other
variables such as the culture, human resource policies and organisational learning,
together with leadership and organisational commitment. The next chapter will give
an account of the research methodology used, incorporating the theories discussed.
These include the job diagnostic survey, the job satisfaction survey, the career
anchors questionnaire and the organisational commitment and intention to quit
questionnaires.
82
CHAPTER THREE: RESEARCH METHODS
3.1 Introduction
In this chapter, the research design is presented, followed by a discussion on the
research plan and its implementation. Attention was given to the research questions
and how these have been answered. The chapter then moves into a discussion of
the unit of analysis, describing the sampling strategies used. The procedure for data
collection is discussed. Details of the measuring instruments will be set out, together
with the validity of the instruments selected. The chapter concludes with an analysis
of the data and statistical techniques, bias, and finally the ethical considerations in
the study.
3.2 Research design
Blumberg, Cooper and Schindler (2005: 195) summarised different definitions of
what a research design is, and stated the following:
A research design is the plan and structure of investigation so conceived as to obtain answers to research questions. The plan is the overall scheme or program of the research. It includes an outline of what the investigator will do from writing hypotheses and their operational implications to the final analysis of data. A structure is the framework, organisation, or configuration of the relations among variables of a study...
Hence the research design expresses both the structure of the research problem and
the plan of investigation used to obtain empirical evidence on relations of the problem
(Blumberg et al., 2005). Coldwell and Herbst (2004: 35) present a similar definition
and describe the research design as the “glue that holds the entire research project
together and shows how all elements work together to address the research
questions”. Kothari (2004: 32) defines a research design as “the arrangement of
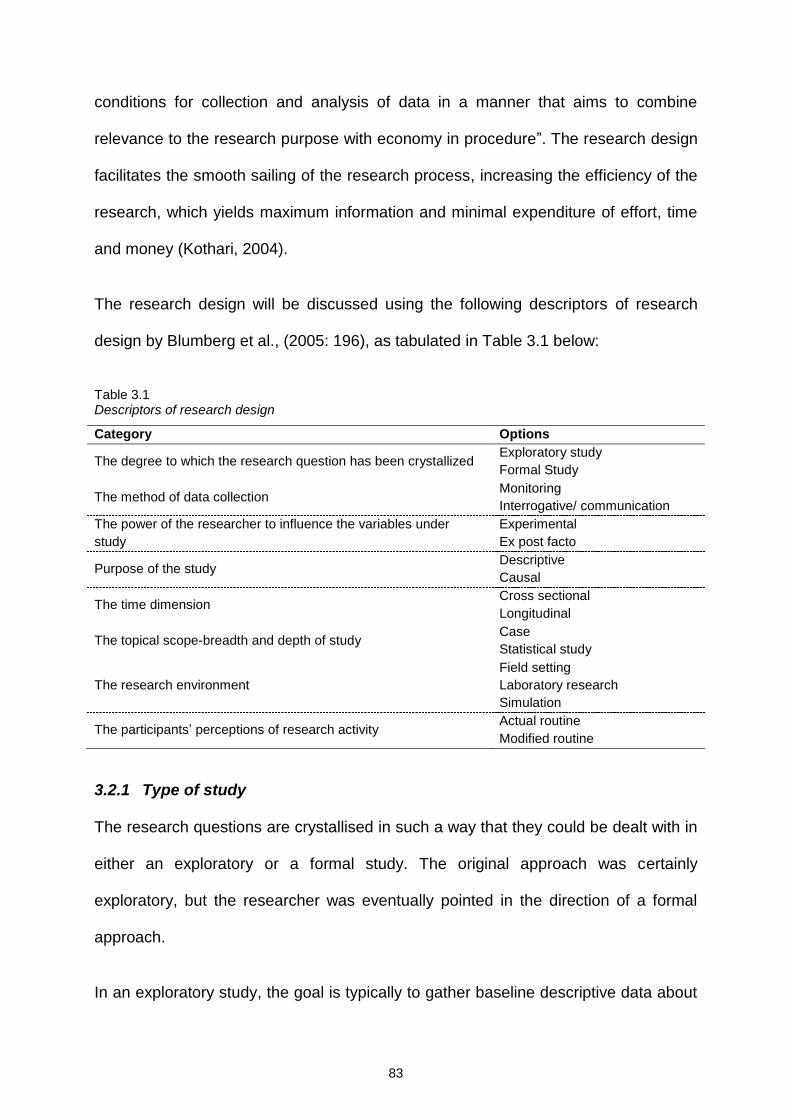
83
conditions for collection and analysis of data in a manner that aims to combine
relevance to the research purpose with economy in procedure”. The research design
facilitates the smooth sailing of the research process, increasing the efficiency of the
research, which yields maximum information and minimal expenditure of effort, time
and money (Kothari, 2004).
The research design will be discussed using the following descriptors of research
design by Blumberg et al., (2005: 196), as tabulated in Table 3.1 below:
Table 3.1 Descriptors of research design
Category Options
The degree to which the research question has been crystallized Exploratory study
Formal Study
The method of data collection Monitoring
Interrogative/ communication
The power of the researcher to influence the variables under
study
Experimental
Ex post facto
Purpose of the study Descriptive
Causal
The time dimension Cross sectional
Longitudinal
The topical scope-breadth and depth of study Case
Statistical study
The research environment
Field setting
Laboratory research
Simulation
The participants’ perceptions of research activity Actual routine
Modified routine
3.2.1 Type of study
The research questions are crystallised in such a way that they could be dealt with in
either an exploratory or a formal study. The original approach was certainly
exploratory, but the researcher was eventually pointed in the direction of a formal
approach.
In an exploratory study, the goal is typically to gather baseline descriptive data about
84
some phenomenon. Exploratory studies tend to lose structures with the objective of
discovering future research tasks (Blumberg et al., 2005). Exploratory research seeks
to generate a posteriori hypothesis by examining a data-set and looking for potential
relations between variables. It is there to develop hypotheses or questions for future
research (Coldwell & Herbst, 2004). The advantage of exploratory research is that it
is easier to make new discoveries owing to the less stringent methodological
restrictions (Coldwell & Herbst, 2004).
Formal studies serve a variety of research objectives, as they describe phenomena
or characteristics associated with a subject population (the who, what, when, where
and how of a topic). Such studies estimate the proportions of a population that have
these characteristics. They discover associations among different variables
(Blumberg et al., 2005). The ultimate goal of a formal research design is to provide a
valid representation of the problem and to test the hypotheses or answer the
research questions posed (Blumberg et al., 2005).
The two designs can be seen as interlinked, as the one starts where the other leaves
off. The reason for using an exploratory design is that the researcher is trying to
develop further understanding of the problem and offer solutions to the problem by
conducting the research in three phases. By conducting the study using this design,
clear concepts can be developed and priorities established. Operational definitions
can be developed and the final research design can be improved on.
The second part of the study was accomplished using different techniques, which
were the objectives of exploration, as both quantitative and qualitative techniques
were applicable, and both were utilised. Qualitative data can be described as an
approach, a method of collecting data using the human relations and items such as
85
interviews, case studies, document analysis, observation, audio and video taping and
using questionnaires. The disadvantage of using a qualitative approach is that the
data can be open to multiple interpretations or misinterpretations (Charlesworth,
Lawton, Lewis, Martin & Taylor, 2003). According to Charlesworth et al. (2003),
quantitative approach derives from scientific practice and uses scientific methods
such as statistical analysis. The advantage of quantitative analysis is that it uses the
power of the science of statistics to draw conclusions.
3.2.2 Data collection
The method of data collection can be either monitoring or interrogation /
communication processes. Interrogation/communication was chosen, as the
researcher questioned the subjects and collected their responses, using
questionnaires. In the second and third phases of the study, one-on-one interviews
were conducted and responses collected. Monitoring is the method whereby the
researcher inspects the activities of a subject or the nature of some material without
attempting to elicit a response from anyone (Blumberg et al., 2005).
3.2.3 Control of variables
The research control of variables can be experimental or ex post facto. Ex post facto
design was used in this study. The investigator in this study had no control over the
variables and was unable to manipulate them, thereby preventing bias. The
researcher could report only on the events that occurred. An experimental design
differs from the ex post facto design, as in an experiment the researcher attempts to
control and/or manipulate the variables in the study; this design is used when one
wishes to discover whether certain variables produce effects in other variables
(Blumberg et al., 2005).
86
3.2.4 Purpose of the study
The purpose of a study can be descriptive or causal. In this research the purpose
was causal, as the researcher wanted to find out what will retain the professionals
and why they are leaving the organisation. Causal studies are concerned with “why”
that is, how one variable brings about a change in another variable (Weathington,
Christopher & Cunningham, 2012). A causal study explains relationships among
variables.
3.2.5 Time dimension
The time dimension of a study can be either cross-sectional or longitudinal. In this
study, the time dimension was cross-sectional, as the study was carried out once and
represented a snapshot of one point in time, whereas a longitudinal study is repeated
over an extended period and the researcher may study the same people over time to
make comparisons and draw conclusions (Blumberg et al., 2005).
3.2.6 Topical scope and depth of study
The topical scope of a study can be statistical or be in the form of a case study. A
statistical study was developed here. Such a study is designed for breadth rather
than depth. The population characteristics are captured by making inferences from
sample characteristics. Hypotheses are tested quantitatively and the generalizations
of the findings are presented according to the representativeness of the sample and
the validity of the design and research instruments used (Blumberg et al., 2005).
Case studies differ from statistical studies in that they place more emphasis on a full
contextual analysis or fewer events or conditions and their interrelations. Although
hypotheses are often used, the reliance on qualitative data make support or rejection
more difficult (Good, 2012).
87
3.2.7 Research environment
The research environment can be field conditions, laboratory research or simulation.
In this study the research environment was field conditions, which were the actual
environmental condition, i.e. the employees’ actual workplace was used. Laboratory
conditions are understated or environments that are manipulated or controlled and
simulations replicate a system or a process, such as role-playing or behavioural
activities (Charlesworth et al., 2003).
3.2.8 Participants’ perceptions of the study
The participant’s perceptions of research activity can be actual or modified routine. In
this study, the participants’ perception was actual, that is, there were no deviations
from everyday routines. Participants’ perceptions influence the outcomes of research.
Modified routines mean that the participants believe that something out of the
ordinary is happening and they may tend to behave less naturally (Blumberg et al.,
2005).
3.2.9 Description of plan of research
The study was conducted in three phases. In the first phase, quantitative methods
were used: the job diagnostic survey, the career orientation inventory, the intention to
quit questionnaire and the organisational commitment scale. Both professional and
non-professional employees of the organisation from the health sector completed all
four of the scales. On completion of the questionnaires, all the data were analysed
and conclusions drawn to answer the research questions. The computer software
program SPSS was used to analyse the data.
The second phase of the study was a qualitative study, which included interviews
88
with the professional staff on their reasons for staying in their jobs or leaving them.
The researcher found it necessary to conduct the second and third phases of the
study owing to the results derived from the first phase. The third part of the study
included interviews with the general managers to ascertain whether the general
manager could accommodate the changes needed to ensure retention as per phase
one. All the information was kept confidential, and the employees would remain
anonymous to prevent bias in phase two. Once all three phases had been completed
and all the data had been analysed, a conceptual retention model was developed.
Table 3.2 below displays the research questions together with the research
techniques and data collection methods used in the study. The table is then further
discussed according to the relevant data collection procedures used. The table
shows that there is a total of six questions, each question showing whether the
research technique is quantitative or qualitative and which data collection instruments
were used to answer each of the research questions.
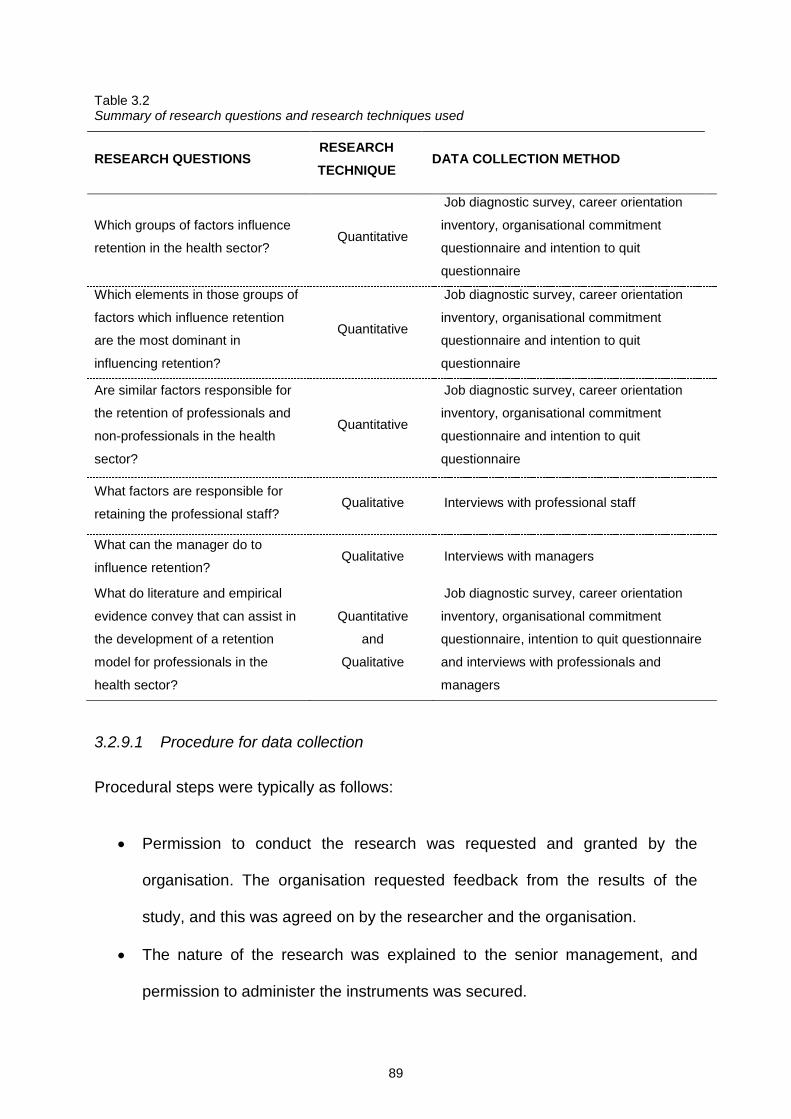
89
Table 3.2 Summary of research questions and research techniques used
RESEARCH QUESTIONS RESEARCH
TECHNIQUE DATA COLLECTION METHOD
Which groups of factors influence
retention in the health sector? Quantitative
Job diagnostic survey, career orientation
inventory, organisational commitment
questionnaire and intention to quit
questionnaire
Which elements in those groups of
factors which influence retention
are the most dominant in
influencing retention?
Quantitative
Job diagnostic survey, career orientation
inventory, organisational commitment
questionnaire and intention to quit
questionnaire
Are similar factors responsible for
the retention of professionals and
non-professionals in the health
sector?
Quantitative
Job diagnostic survey, career orientation
inventory, organisational commitment
questionnaire and intention to quit
questionnaire
What factors are responsible for
retaining the professional staff? Qualitative Interviews with professional staff
What can the manager do to
influence retention? Qualitative Interviews with managers
What do literature and empirical
evidence convey that can assist in
the development of a retention
model for professionals in the
health sector?
Quantitative
and
Qualitative
Job diagnostic survey, career orientation
inventory, organisational commitment
questionnaire, intention to quit questionnaire
and interviews with professionals and
managers
3.2.9.1 Procedure for data collection
Procedural steps were typically as follows:
Permission to conduct the research was requested and granted by the
organisation. The organisation requested feedback from the results of the
study, and this was agreed on by the researcher and the organisation.
The nature of the research was explained to the senior management, and
permission to administer the instruments was secured.
90
The managers were given the background to the study and were informed that
it would involve the collection of data from both professionals and non-
professionals. The managers were also informed that the results of the first
phase would be discussed with them, and that they would be required to
assist with interviews for phases two and three of the qualitative research.
The job diagnostic survey, the career orientation survey, the organisational
commitment questionnaire and the intention to quit questionnaire were
converted to an online instrument. The researcher entered all the questions
with the scales onto a computer software program (Survey Monkey), which
allowed the questionnaires to be administered electronically. Before sending
the questionnaires, the employees were notified by e-mail about the nature
and purpose of the research, and were given the option of not participating
(the e-mail addresses were acquired from the Human Resource Department).
The employees were told that it was desirable to write their names on
questionnaires for research purposes, but that this was voluntary.
Each questionnaire included a covering letter informing the participants about
the research and inviting them to participate in the study. The participants
were requested to complete the questionnaires and click on the link provided
to submit them once completed.
All the respondents were monitored using an excel spreadsheet, and a
reminder e-mail was sent to non-respondents asking them to complete the
questionnaires. This resulted in more responses than in the initial batch.
The researcher checked the completeness of the data to see if there was any
missing information. E-mail letters were sent to the respondents concerned
asking them to complete the missing information and make the necessary
91
corrections.
Sent and received e-mail responses were kept, and, if a response was not
received, the researcher sent the respondents an e-mail reminder. The
researcher offered to give the respondents feedback should they require it or if
they showed the necessary interest in the survey.
For the second phase of the study, semi-structured, in-depth interviews were
conducted. The answers to the questions were recorded along with notes that
had been made. Face-to-face interviews were conducted with 15
professionals, and all the managers were asked the same questions. The
interviews took about 30 to 45 minutes each.
Interview questions were based on the outcomes of the first phase and
questions included facts, beliefs, perspectives, feelings and motives, as well
as present and past behaviour and any historical assumptions.
The third phase of the study included interviews with three managers from
each of the provinces. Semi-structured interview questions were put to the
general managers.
3.2.9.2 Pre-testing the method and instrument
Before the data were collected, a pre-test of the method was carried out. Van
Telinjen and Hundley (2001: 296) state that “pilot studies are small scale preliminary
studies conducted before the main research in order to check the feasibility or to
improve the design of the research”. Pilot studies are frequently carried out before
large-scale quantitative research in an attempt to avoid wasting time and money on
an inadequately designed project. In the case of this study, for which established
instruments were used, only the following was done:
92
The e-mail link (described in the procedure section) was tested to check
whether mails were sent and received after clicking on the link.
The time taken to complete the questionnaire and then check the reasonable
nature of the questions was assessed.
Replies were checked in terms of the information required.
The researcher re-affirmed that all the questions had been answered.
The pilot study was used to test the operationalization of the measuring
instruments.
The pilot study assisted in verifying the challenges that may have arisen.
Completing a pilot study successfully is not a guarantee of the success of the
full-scale survey. Although pilot study findings may offer some indication of the
likely size of the response rate in the main survey, it cannot guarantee this
because it has no statistical foundation and pilot studies are nearly always
based on small numbers (Coldwell & Herbst, 2004). Furthermore, other
problems may not become obvious until the actual study is conducted.
The above design explored the plan of the entire research, and how the research
questions would be answered. The design served as a guide for the selection of
sources and types of information, as well as providing a framework for specifying the
relationships among the study variables. It also outlined the procedures for every
research activity.
3.3 Sampling strategies
Sampling strategies include the discussion of the unit of analysis, the target
population, the sampling design and the reasons for selecting a specific sampling
design and sample size. There are several reasons for sampling, which include lower
93
cost, greater accuracy of results, and greater speed of data collection and availability
of population elements (Blumberg et al., 2005).
A good sample is characterised by how well it represents the features of the
population it will represent. This means that the sample must be valid. Further, the
representivity of a sample depends on accuracy and precision (Weathington et al.,
2012). “Accuracy can be defined as the degree to which bias is absent from the
sample”; there must be enough elements in the sample and it should be drawn so
that it does not either overestimate or underestimate the population. “Precision is
measured by the standard error of estimate”; the smaller the error of estimate, the
greater the precision of the sample (Blumberg et al., 2005: 233).
3.3.1 Unit of analysis
According to Blumberg et al. (2005: 224), the “unit of analysis describes the level at
which the research is performed and which objects are researched”. The unit of
analysis is the major entity analysed in the study, which is the response by the
individuals in the health sector. The first unit of analysis was from both the
professional skilled and the non-professional or administration staff in the pathology
laboratory. The responses to the questionnaires by these individuals were measured
to ascertain which factors would retain these individuals. The second unit of analysis
was the responses from the professionals and the general managers to the interview
questions to ascertain whether the individuals could be retained by job redesign.
3.3.2 Target population
In the research process, setting the target population can be defined as the entire set
of units for which the survey data is to be used to make inferences (Thompson,
94
2012). The population can also be seen as the eligible population is included in
research work. The population is the study object and consists of individuals, groups,
organisations, human products and events, or the conditions to which they are
exposed (Cooper & Schindler, 2011). Blumberg et al. (2005) offer a similar definition,
stating that the population can also be seen as the “total collection of elements about
which one wishes to make inferences. The population element is the subject on
which the measurement is being taken” (Blumberg et al., 2005: 228).The population
is the full set of cases from which the sample will be taken (Cooper & Schindler,
2011). The research problem relates to a specific population which encompasses
both skilled professionals and non-professionals in the health sector in the pathology
environment.
The study was conducted using three private pathology laboratories, two of which are
private commercial laboratories, while the third is a private academic laboratory. The
areas covered are Gauteng, KwaZulu Natal and the Eastern Cape. Data were
collected in these areas only per the convenient sampling of the offices. The skilled
professionals include: pathologists, scientists, technologists, technicians and nurses.
All the managers included in the study are skilled professionals. The non-
professionals consist of the administrative staff.
3.3.3 Sampling design
There are several types of probability sampling designs, which include simple
random, systematic, stratified, cluster and double (sequential or multiphase) designs.
In this study, proportionate stratified sampling was used. Stratified sampling divides a
population into subpopulations or strata, and uses simple random on each stratum.
The results are weighted and combined. The advantage of this method is that the
95
researcher is in control of the sample size in each stratum. According to Blumberg et
al. (2005), stratification can be seen as more efficient statistically in comparison with
simple random sampling. Data is provided that represents and analyses the
subgroups, and different methods for strata can be used.
Stratified sampling design was used, as the target population had to be divided into
professionals and non-professionals. This was done by using their educational
qualifications and specific qualifications and subpopulations/strata were used. Using
stratified sampling allowed the research questions to be answered. The reason this
sampling method was chosen for this study was that a more representative sample
could be obtained. There are clearly more distinguishable strata than with simple
random sampling, as the members of the particular stratum were more homogeneous
than the population at large (Weathington et al., 2012).
With simple random samples, each population element has an equal chance of being
selected into the sample; the sample can be drawn by using a random number table.
Systematic sampling selects an element of the population at the beginning with a
random start, followed by sample fraction by selecting every kth element (Paul,
Gardner & Haeffele, 2012). One advantage is that it is easier to use than simple
random, simple to design, less expensive method and it is easy to determine the
sampling distribution. The disadvantages include skewness of the sample and the
results. Bias can occur if the population list has a monotonic trend.
Cluster sampling includes dividing the population into internally heterogeneous sub-
groups, and some are then randomly selected for further study. The advantages are
that it can provide an unbiased estimate of population parameters if it is carried out
correctly. It is financially more efficient than a simple random, low cost sample, and
96
can be easily implemented without a population list. The disadvantages are its lower
statistical efficiency owing to greater error, as sub-groups are homogeneous rather
than heterogeneous (Paul et al., 2012). A double (sequential or multiphase) process
includes collecting data from a sample using a previously defined technique, based
on the information gathered. A sub-sample is then selected for further study.
The following process for drawing the stratified sample was followed (Gary, 1990).
The variables for stratification and the proportions of the stratification variables
in the population were determined, as discussed below (refer to 3.3.4). A list of
employees was acquired from the Human Resource Department of the
organisation, and the educational qualifications and years of experience were
extracted from the spreadsheet. Professionals were selected according to
their educational level and consisted of random selection for qualified nurses,
scientists, pathologists, technicians and technologists. All the pathologists,
scientists, technicians and technologists also had to be registered with the
Health Professional Council of South Africa and the nursing staff with the
South African Nursing Council. The non-professional staff were the
administrative staff whose educational level was matric and/or an
administrative qualification.
Proportional stratification was selected, as each stratum was properly
represented so that the sample drawn from it was in proportion to the
stratum’s share of the total population. The sample frame was divided into
separate frames for each stratum, as the information was extracted and the
employees divided into professional and non-professional groups. However
the researcher decided, because of the low sample size, to use the entire
97
population from each stratum for the first phase of the study. For the second
phase of the study, only 15 professionals were used and systematic sampling
was used, selecting every fifth individual from the professional list to be
interviewed. This was done for each of the provinces, as five from each
province were selected for the interviews. For the third phase of the study
each of the general managers from the provinces was interviewed resulting in
a sample size of three. No sampling was necessary here.
3.3.4 Sample size
When deciding on sample size to be used, one must determine how precise one has
to be. Precision is measured by the interval range in which one would expect to find
the parameter estimate, and the degree of confidence one wishes to have in that
estimate (Urdan, 2010). The so-called finite adjustment enters the calculation for
sample size when the calculated sample is needed to achieve a given level of
precision (Blumberg et al., 2005).
The total population of the professionals and non-professionals working in the
pathology laboratories amounted to 207. Of the 207, 129 were professionals and 78
were non-professionals. The statistics were acquired from the Human Resource
Department, the Health Professional Council and the South African Nursing Council
registration. When considering the sample size, confidence intervals and confidence
levels were used (Urdan, 2010). The confidence interval is also known as the margin
of error, and a confidence interval of 5 was used. The confidence level informs
researchers how sure they can be of the selected sample size. It can be expressed
as a percentage representing how often the true percentage of the population lies
within the confidence interval (Urdan, 2010).
98
In this research, a 95% confidence level was used (Krejcie & Morgan, 1970). The
sample size for each of the professionals and non-professionals was used separately
and then added together to give the total number of the sample size. Sample size
can be calculated by using the sample size calculator by Smith (2013). The formula
used in the calculator was as follows:
Ss= Z2 (p) (1-p) / c2
Where Z = Z value (for confidence level of 95%, 1.95 was used).
P = percentage picking choice, expressed as a decimal (.5 was used).
c = confidence interval, expressed as decimal (.05 was used).
However, for this study, the entire population was used as the sample size.
In the second qualitative phase of the study, 15 professionals were interviewed, five
from each of the provinces. In phase three of the study, the three general managers
from each of the regions were interviewed.
The following principles that influence sample size were used (Blumberg et al.,
2005):
The sample needs to be larger to provide a precision estimate, if the variance
within the population is greater.
If the desired precision of the estimate is greater, it will require a larger
sample.
The greater number of sub-groups of interest within a sample, the greater the
sample must be, as each of the sub-groups has to meet the minimum sample
99
size requirements.
Should the sample size exceed 5 per cent of the population, the sample size
can be reduced without sacrificing precision.
3.4 Components of measuring instrument
3.4.1 Job diagnostic survey
Aim and development:
The job diagnostic survey is an instrument designed by Hackman and Oldham (1976)
to diagnose jobs and to evaluate job redesign projects (refer to Appendix One). It is
useful in both the diagnosis of the characteristics of jobs prior to their redesign, and
in research and evaluation activities aimed at assessing the effects of redesigned
jobs on employees (Hackman & Oldham, 1976). The job diagnostic survey has its
origins in previous methodologies developed by Turner and Lawrence (1965) and
Hackman and Lawler (1971). Many of the scales and items used by these
researchers are retained in their revised form in the job diagnostic survey. The
measurement instrument is based on the job characteristics model by Hackman and
Oldham (1976), which was discussed in Chapter Two.
Constructs:
The job diagnostic survey provides measures of a number of personal, affective
reactions or feelings someone experiences when performing the job. However, the
instrument does not measure actual work productivity or employee perceptions of
their productivity (Hackman & Oldham, 1976). General satisfaction, which is the
overall measure of the degree to which the employee is satisfied and happy in the
job, is measured. Internal work motivation is the degree to which the employee is
100
self- motivated to perform one’s functions effectively and efficiently, i.e. positive
internal feelings when performing effectively on the job and negative internal feelings
when performing poorly on the job (Hackman & Oldham, 1976).
The job diagnostic survey uses specific scales that provide separate measures of
satisfaction with job security, pay and other compensation, peers and co-workers
‘social satisfaction’, supervision and opportunities for personal growth and
development, and on the job ‘growth satisfaction’. Finally, the job diagnostic survey
measures the individual growth need strength which taps the strength of the
respondents’ desire to obtain ‘growth satisfaction’ from their work. “This measure is
viewed as a malleable individual difference characteristic which as per the job
characteristics model predicts to affect how positively an employee will respond to a
job with an objectively high motivating potential” (Hackman & Oldham, 1976: 6).
The job diagnostic survey is not a recommended instrument for a broad-based
diagnosis of employee activities at work. It is useful primarily for examining the
characteristics of jobs per se and employee reactions to those jobs (Hackman &
Oldham, 1976). The job diagnostic survey has undergone three major revisions over
the last few years, and revisions have been based on both psychometric and
substantive considerations. The job diagnostic survey is the basic instrument to be
taken by individuals whose jobs (and whose reactions to their jobs) are of focal
interest.
For the purpose of this study, the short version of the job diagnostic survey was
used. It is much quicker, as it takes only ten minutes to complete and does not create
excessive demands on the respondents. Some scales in the survey are not included
in the short form, and others are measured with fewer items. The scales measuring

101
the job dimensions themselves, however, are measured identically, as in the job
diagnostic survey. In the short version, the job dimension scores themselves are
directly comparable to those obtained using the job diagnostic survey (attached in
Appendix One). The short form of the job diagnostic survey consists of five sections:
section one is composed of seven questions, section two has 14 questions, section
three has seven questions, section four has 14 questions and section five has 11
questions.
Format:
Scores on the seven job dimensions measured are obtained from items in sections
one and two of the job diagnostic survey. In section one, a single item is provided for
each job dimension. The respondents chose the number which best reflected their
assessment of the variety in their jobs. In section two, two items were provided for
each of the seven job dimensions, one of which was phrased in direct or positive
terms, and one was phrased in a reversed or negative form.
The respondents were asked to indicate how accurate or inaccurate each statement
listed was in describing the objective characteristics of the job. A seven-point scale
was used, ranging from ‘Very inaccurate’ through ‘Uncertain’ to ‘Very accurate’.
Scores for experienced meaningfulness of the work, experienced responsibility for
work outcomes, and knowledge of results are obtained from sections three and five
of the job diagnostic survey.
In section three, respondents indicate their agreement or disagreement with a
number of statements about their work experience. A seven-point scale was used,
ranging from ‘Disagree strongly’ through ‘Neutral’ to ‘Agree strongly’. In section five,
a projective format was used. The scale was the same seven-point ‘Agree-Disagree’
102
scale used in section three. In all, there were four items tapping the experienced
meaningfulness of the work (two in section three and two in section five); six items for
the experienced responsibility for work outcomes (four in section three and two in
section five); and four items for knowledge of results (two in section three and two in
section five). Eight of the items were directly stated; six of the items were in reversed
format.
General satisfaction and internal work motivation were also assessed by items in
sections three and five. The items for these scales were intermixed with those for the
critical psychological states, as described above. There were five items tapping
general satisfaction (three in section three and two in section five), and six items for
internal work motivation (four in section three and two in section five). Two of the
general satisfaction items and one of the internal motivation items were in reversed
format. Scores for five specific satisfaction sub-scales were obtained from section
four of the job diagnostic survey. Subjects responded to the query ‘How satisfied are
you with this aspect of your job?’ Each time, using a seven-point scale which ranges
from ‘Extremely dissatisfied’ through ‘Neutral’ to ‘Extremely satisfied’. The
respondents’ growth need strength was measured in sections six and seven of the
job diagnostic survey (Hackman & Oldham, 1976).
Interpretation:
The scoring for the short form of the job diagnostic survey was done by measuring
each of the main variables of the job characteristics model. The job dimension skill
variety was interpreted by averaging section one, question 4, and questions 1 and 5
from section two. Question 5 had reversed scoring, so eight points had to be
subtracted from the respondents’ score. For the job dimension task identity question
103
3 from section one and questions 11 and 3 from section two. Question 3 had
reversed scoring.
For the task significance, question 5 from section one was used and questions 8 and
14 in section two. Question 14 had reversed scoring. For autonomy, there were
question 2 from section one and questions 13 and 9 from section two. Question 9
had reversed scoring. For the feedback from the job itself, question 7 from section
one was used, and questions 7 and 12 from section two. Question 12 had reversed
scoring. Feedback from agents used question 6 from section one and questions 10
and 7 from section two. Section seven had reversed scoring.
Dealing with others used question 1 from section one and questions 2 and 6 from
section two. Question 6 had reversed scoring. For general satisfaction, the average
of questions 2, 6 and 4 (reversed scoring) from section three were used. For internal
work motivation, items 1, 3, 5 and 7 (reversed) had to be averaged from section
three. The job diagnostic survey was then further divided into specific satisfaction. To
determine pay satisfaction the average of question 2 and question 9 from section four
was used.
For security satisfaction, items 1 and 11 from section four were averaged. To
determine social satisfaction, items 4, 7 and 12 from section four were averaged. For
items 5, 8 and 14 the averages were used from section four. To determine growth
satisfaction, items 3, 6, 10 and 13 were averaged from section four. For individual
growth need strength, items 2, 3, 6, 8, 10 and 11 from section five were averaged.
Before the averaging, three was subtracted from each item score, which resulted in a
summary scale ranging from one to seven. Lastly, the motivating potential score was
calculated using the formula:
104
[(Skill Variety + Task Identity + Task Significance) / 3] x Autonomy x Feedback
A high motivating potential score shows a positive internal work motivation.
Reliability and validity:
Hackman and Oldham (1976) report an internal consistency value of .76 and, with
regard to validity, report ‘adequate’ discriminant validity. They also point out that the
theory-specific relationships among the scales are in the predicted direction, which
points to construct validity.
Use in other projects:
The job diagnostic survey has been used in a number of studies; research conducted
by an independent researcher in the teaching sector found that the survey could be
useful to the teaching profession. The studies by Gibbons (1996) and Barnabe and
Burns (1974) showed that the job diagnostic survey appeared to discriminate
satisfactorily between job characteristics for the samples studies. A study by Van
Saane, Sluiter, Verbeek and Frings-Dresen (2003) was intended to select job
satisfaction instruments of adequate reliability and validity for use as evaluative tools
in hospital environments. Seven instruments were evaluated, of which one was the
job diagnostic survey and all of the instruments met the defined reliability and validity
criteria. Of the seven, the ‘measure of job satisfaction’ had an adequate content
validity. Only the ‘job in general scale’ provided data about ‘responsiveness’ to
change.
3.4.2 Job satisfaction
Aim and development:
The general satisfaction component was taken from the job diagnostic survey, and
105
aims to measure how satisfied employees are in their jobs. As described above, the
job diagnostic survey was a representation of the overall measure of the degree to
which the employee is satisfied and happy in their job (Hackman & Oldham, 1976:
162).
Constructs:
Section three of the job diagnostic survey reflects job satisfaction. It consists of seven
items in the short form and the questions read as follows: ‘Generally speaking, I am
very satisfied with this job’. Others include: ‘I frequently think of quitting this job’, and
‘I am generally satisfied with the kind of work I do in this job’.
Format:
The respondents were requested to indicate their views on this statement on a scale
ranging from one (disagree strongly) to seven (agree strongly). They had to indicate
a number in the blank space for each of the seven statements based on the seven-
point Likert scale.
Interpretation:
There is a minimum score of five and a maximum score of 35. A high score indicates
that employees are highly satisfied with their job, while a low score indicates that the
respondents are not satisfied with their job.
Reliability and validity:
Hackman and Oldham (1976) report an internal consistency value of .76 and for
validity they report ‘adequate discriminant validity’. The discriminant validity is defined
as the extent to which the score of a job satisfaction instrument differs from that of an
instrument that measures related but different concepts. They also point out that the
106
theory-specific relationships among the scales are in the predicted direction, which
points to construct validity.
Use in other projects:
A study by Merlyn (2003) looked at testing Hackman and Oldham’s (1976) model in a
post-secondary educational setting. The job diagnostic survey was distributed to 550
nurses in Ontario. The full job satisfaction section of the survey was used, and the
following Cronbach alphas were reported for the co-efficient of the variable of job
satisfaction: satisfaction with work = .81, overall job satisfaction = .68, satisfaction
with pay = .90, satisfaction with co-workers = .83 and satisfaction with supervision =
.82. For this study, both the job satisfaction component and the overall job
satisfaction (calculated by summarizing the ratings for the five categories and
dividing by five) were used. Hackman and Oldham (1976) demonstrated that the job
diagnostic survey is reliable and valid, so the previously demonstrated reliability for
the job satisfaction items, as well as other items from the job diagnostic, survey, were
accepted.
3.4.3 Career anchor questionnaire
Aim and development:
The measuring instrument used in this research was the career orientation inventory
(COI) (refer to Appendix One) survey which was developed by Schein (1996), in
collaboration with De Long (1982). The career orientation inventory was used for
data collection. The inventory has been refined and validated in several studies,
including those by Burke (1983), De Long (1982a, 1982b, 1982c) and Wood, Winston
and Polkosnik (1985). The career orientation inventory provides a pretested
instrument with demonstrated high internal validity and reliability. The career
107
orientation inventory is a self-report questionnaire which measures the preferences of
individuals, have a specific career preference and the importance of a set of career
factors that would enhance individuals’ career decisions (Coetzee & Schreuder,
2008). The instrument will be used for this study for the purpose mentioned above
and this will enable the organisation to see what can be done for the employee to
accommodate the dominant career anchors to retain the staff. This will ensure a
better fit for the employees to their job specifications as well as to reduce staff
turnover, increase the organisational commitment and decrease the intention to leave
the organisation. The dominant career anchors that was revealed was used as part
of the retention model.
Constructs:
The instrument contains 40 items that measure eight career anchors: technical/
functional competence, general managerial competence, autonomy, and
security/stability, and entrepreneurial creativity, service/dedication to a cause, pure
challenge and lifestyle.
Format:
Six-point Likert response scales for subject responses were designed to avoid
neutral answers: previous researchers have administered four-, five- and six-point
scales. All of the 40 items are considered to be of equal value. Subjects had to
respond in terms of how true the statements were. The career orientation inventory
took from 10 to 20 minutes to complete. The instructions were stipulated on the
response sheet. The career orientation inventory does not purport to measure career
anchors as such, but rather measures a central aspect of the concept of career
anchors, namely career orientation (De Long, 1981). Each of the eight subscales was
108
measured separately and reflected how the participants felt about the particular
dimensions, and their perceptions of each of these. An analysis was conducted to
rate which dimensions were perceived to be true for each participant and which were
not.
Interpretation:
The sub-scales that scored the highest reflected the respondents’ dominant career
anchor. Total scores for each of the eight categories of career anchors were summed
up and averaged, which yielded an individual score for each of the career anchors.
The category that yielded the highest total score was taken to be the respondent’s
dominant career anchor. Appendix Two shows a table extracted by Schein (1990),
summarising which questions were used for which career anchor.
Validity and reliability:
The Cronbach alpha of reliability for the career orientation inventory is .892 and
indicates a high internal consistency and reliability of the career orientation inventory
(De Long, 1983). The construct model has both convergent and discriminant validity
and unidimensionality. In terms of convergent validity, the Cronbach alpha scores
range from .601 to .887 and can be taken as acceptable (Danziger, Rachman-Moore
& Valency, 2008). Because none of the confidence intervals for the correlations in the
model contained the value of 1.0 (p < .001), it was concluded that the constructs also
possessed discriminate validity, as the size of the estimated correlations ranged from
.320 to .727 (Danziger et al., 2008).
Use in other projects:
Danziger et al. (2008) tested the construct validity of the measurement model of
Schein’s (1990) career orientation inventory, where entrepreneurship and creativity
109
constituted two separate constructs. The findings of the study supported Schein’s
(1990) career anchor theory. However, this used nine career anchors instead of the
eight Schein proposed. The study also confirmed that there is a clear distinction
between entrepreneurship and creativity, designating them as a separate construct.
The changes proposed by Danziger et al. (2008) stated that it would make the career
orientation inventory a more valid and reliable measuring instrument, for both theory
building and practical uses.
A study conducted by Beck and Lopa (2001) looked at an exploratory application of
Schein’s (1990) career orientation inventory to hotel executives. The researcher in
this case used five anchors, which were technical/functional, managerial, autonomy,
security and entrepreneurial activity. The scales were modified by the researcher to
apply to the hotel industry. The reliability of the modified scales was unknown
previous to the study, and assessing the reliability of the modified scales was an
objective of the study. It was established in the study that the reliability co-efficient for
the modified scales in the questionnaire were relatively low. This was because the
research used a combination of Schein’s (1990) and Ross’s (1992) work as a guide
for modifying the scales.
The results could have been compromised by a measurement error (Beck & Lopa,
2001). The limitations with the modified scales in this research were that the
standardised alpha co-efficient for the five scales of the career orientation inventory
should have ideally exceeded .70. Also both the technical and managerial anchor
scales consisted of only two items each. These scales should have had no fewer
than three items to make the case for internal consistency reliability. In the present
study the questionnaire will be used as is, and will not be modified, thereby
110
increasing the validity of the findings.
3.4.4 Organisational commitment questionnaire
Aim and development:
Organisational commitment is the relative strength of an individual’s identification
with their organisation, showing how involved and loyal they are. Their current
organisational commitment was measured using the three-dimensional
organisational commitment scale by Allen and Meyer (1990).
Construct:
The scale consists of 24 questions. The organisational commitment scale is
comprised of eight measures on a seven-point scale ranging from strongly disagree
(one) to strongly agree (seven). Six items measure each of the three components of
organisational commitment (affective, continuance, and normative).
Format:
The first item of the scale reads as follows: ‘I would be very happy to spend the rest
of my career with this organisation’. Respondents are requested to indicate their
views on this statement on a scale ranging from one (strongly disagree) to seven
(strongly agree).
Interpretation:
The minimum score is 24 and the maximum 168. A high score on the organisational
commitment indicates that employees are highly committed to working in the
organisation while low scores signify low commitment.
Validity and reliability:
111
According to Dunn et al. (2012), previous research reports an acceptable range of
internal reliability coefficients for affective (alpha = .85) continuous (alpha = .79), and
normative (alpha = .73) commitment (Allen & Meyer, 1990). Allen and Meyer (1990)
report an internal consistency of .86, .82 and .73 for the three subscales of the scale.
Further, Allen and Meyer (1990: 13) report evidence of construct validity, and also
write that the “relationship between commitment measures and the antecedent
variables was, for the most part, consistent with prediction”. This points to convergent
and discriminant validity.
Use in other projects:
Krishnaveli and Ramkumar (2008) revalidated Allen and Meyer’s (1990) organisation
commitment scale for application in India. Samples of 120 respondents from five auto
ancillary companies were used to revalidate the instruments. The initial alpha value
was .767, which proves the reliability of the construct. The conclusion drawn by the
researcher was that the reliability and validity of Allen and Meyer’s (1990) instrument
was established in the Indian context and the instrument could be used for future
research for their instruments in different organisational settings (Krishnaveli &
Ramkumar, 2008).
The study by Hartmann and Bambacas (2000) uses Allen and Meyer’s (1990)
organisational commitment scale with women who are casual academic employees
at an Australian tertiary institution. The study confirms the reliability and validity of the
instrument, and also concludes that both the three- and four-factor models of
commitment are adequate. However, the four-factor model provides a better
explanation of intention to quit. Dunn et al. (2012) use the same scale in their study,
examining the relationship between transformational leadership behaviour and
112
employee commitment to the organisation. The study confirms the validity and
reliability of the instrument and also shows that the results support the relationship
between leader behaviour and employee commitment to the organisation in the
United States and Israel.
3.4.5 Intention to quit questionnaire
Aim and development:
The shortened version of the Arnold and Feldman (1982) scale was used to measure
intention to quit (four items) in the current study.
Elements:
The questionnaire consists of four items.
Format:
A five-point Likert-type scale ranging from one (never) to five (always) measures both
the subjects’ intention to change organisations and their search for alternatives. The
questions include the respondents ‘Wanting to leave the institution’, ‘Searching for
another position’, ‘Planning to leave the institution’, and ‘Actually leaving the
institution within the next year’.
Interpretation:
The minimum score is four and the maximum 20. A high score indicates that
respondents are likely to leave the job, while a low score indicates that respondents
are likely to stay.
Validity and reliability:
Oehley (2007) reported an alpha coefficient of reliability of .85. Regarding the
113
construct validity for the four-item intention to quit scale Arnold and Feldman (1982)
were able to demonstrate that the intention to quit correlated well with other
constructs and it was therefore deemed acceptable for use in this study. The
questionnaire compared well with other constructs, so it can be seen as valid (Arnold
& Feldman, 1982).
Use in other projects:
A study by Darvish, Najafi and Zare (2012) evaluates the level of talent management
and its relationship with intention to quit the organisation. The study was conducted
in the Lorestan Province in Iran, and used 119 staff members. Arnold and Feldman’s
(1982) intention to quit questionnaire was used and a Cronbach’s alpha of .910 for
the four items was used after completion of all of the questionnaires. The validity and
reliability of the research instrument was confirmed by the researchers. The findings
of the study concluded that, by using talent management competencies, showing that
organisations could decrease the intention to quit the organisation among its
employees.
3.5 Data analysis and statistical techniques
According to Charlesworth, Lewis and Taylor (2003), the following procedure was
followed when analysing data:
The data was cleaned, then logged and checked for accuracy. It was then
entered onto a database and coded.
The data definition program used was able to identify the variables that are
coded in each column or range of columns. This attached meaningful labels to
the codes, and distinguished values representing missing data.
114
3.5.1 Quantitative analysis
First, descriptive statistics were calculated. The importance of reporting descriptive
statistics resides in their utility as tools for interpreting and analysing data. Descriptive
statistics include a statistical procedure used to describe the population one is
studying. The results from the data assisted in organizing and describing the data.
Descriptive statistics can be used only to describe the group under study. That is, the
results cannot be generalized to any larger group. Descriptive statistics can be useful
and serviceable if there is no need to extend the results to any larger group (Phillip,
2012).
Examples of descriptive statistics used in this study were frequency distributions,
measures of central tendency (mean, median and mode) as well as graphs that
describe all the data (Phillip, 2012). Differences between means of variables can be
evaluated using t tests or ANOVA’s (Analysis of variance). Advantages of using t
tests is to test a hypothesis for any given value of B1, not just for B1 = 0. T tests can
also be used for a one-tailed test. In many applications a regression coefficient is
useful only if the sign of the coefficient agrees with the underlying theory of the
model. In this case, the increased power of the resulting one-tailed test makes it
appropriate (Freund, Wilson & Mohr, 2010). Further the denominator of a t statistic is
the standard error of the estimated parameter in the numerator. It provides a
measure of the precision of the estimated regression coefficient (Freund et al., 2010).
For purposes of this study ANOVA’s were used, which enabled the researcher to
identify factors that are influencing a given data set. ANOVA is a statistical analysis
tool that separates the total variability found within a data set into two components:
random and systematic factors. The random factors do not have any statistical
influence on the given data set, while the systematic factors do. The ANOVA test was
115
used to determine the impact independent variables had on the dependent variable
in the regression analysis (Freund et al., 2010).
Secondly, correlations analysis was calculated to measure the covariance of two
random variables in a matched data set. Covariance is usually expressed as the
correlation coefficient of two variables and is used to reveal the degree of association
in a set of matched data (Blumberg et al., 2005). This information can provide
analyses of relationships between variables. In particular, correlation can indicate
possible factors that confound a relationship of interest. Pearson's product-moment
correlation coefficient, r, measures the degree of linear association between two
variables. Spearman's rank-order correlation coefficient (ρ) uses the ranks of the
data, and can provide a more robust estimate of the degree to which two variables
are associated (Phillip, 2012). Kendall's tau (τ) has the same underlying assumptions
as Spearman's (ρ), but represents the probability that the two variables are ordered
non-randomly (Phillip, 2012).
For the purpose of this study, only Pearson’s correlation was used. According to
Choc (2010), an advantage of Pearson’s correlation is that the Pearson's correlation
coefficient offers a substantial improvement in statistical power even for distributions
with moderate skewness or excess kurtosis over the other correlation factors. For the
strength of the correlation the following was used: a correlation larger than .5 was
reported as a strong correlation, a correlation between .49 and .25 was reported as
moderate correlation, and a correlation lower than .25 was reported as small
correlation. These were only reported on when the correlation was significant, so p is
smaller than .05 (Choc, 2010). In certain instances the practical significance of the
difference of the correlation was also calculated, which is the Cohen d value. This
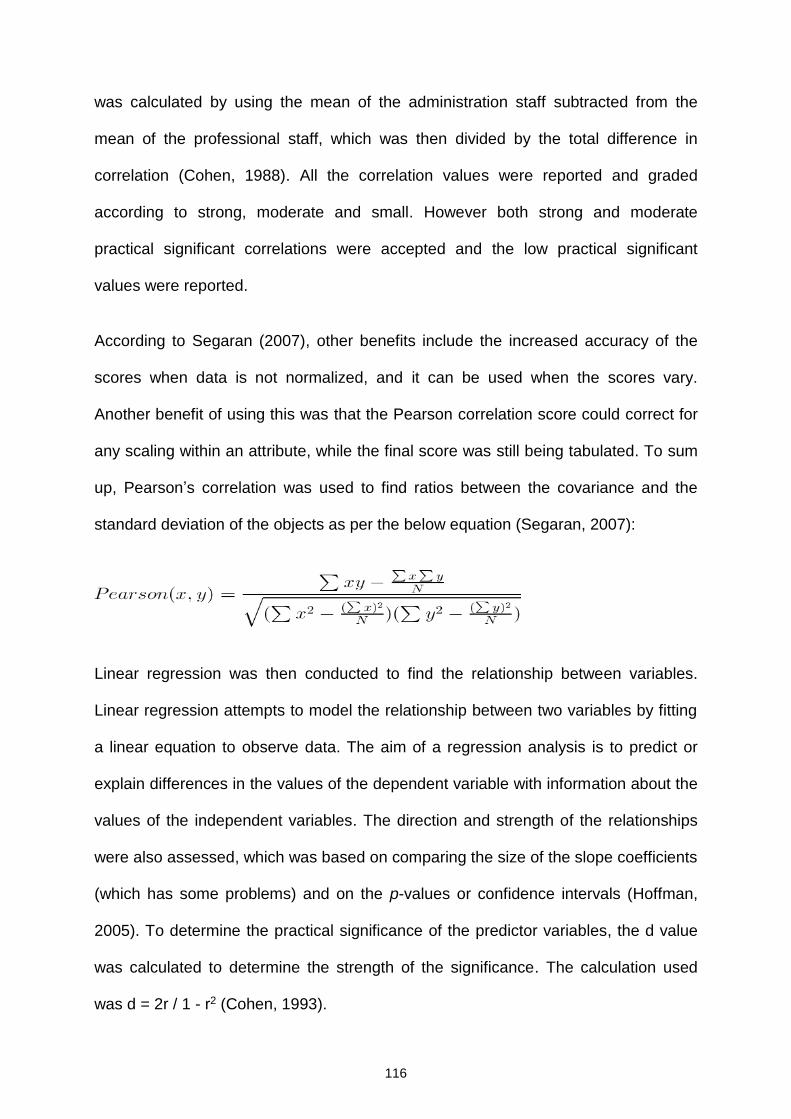
116
was calculated by using the mean of the administration staff subtracted from the
mean of the professional staff, which was then divided by the total difference in
correlation (Cohen, 1988). All the correlation values were reported and graded
according to strong, moderate and small. However both strong and moderate
practical significant correlations were accepted and the low practical significant
values were reported.
According to Segaran (2007), other benefits include the increased accuracy of the
scores when data is not normalized, and it can be used when the scores vary.
Another benefit of using this was that the Pearson correlation score could correct for
any scaling within an attribute, while the final score was still being tabulated. To sum
up, Pearson’s correlation was used to find ratios between the covariance and the
standard deviation of the objects as per the below equation (Segaran, 2007):
Linear regression was then conducted to find the relationship between variables.
Linear regression attempts to model the relationship between two variables by fitting
a linear equation to observe data. The aim of a regression analysis is to predict or
explain differences in the values of the dependent variable with information about the
values of the independent variables. The direction and strength of the relationships
were also assessed, which was based on comparing the size of the slope coefficients
(which has some problems) and on the p-values or confidence intervals (Hoffman,
2005). To determine the practical significance of the predictor variables, the d value
was calculated to determine the strength of the significance. The calculation used
was d = 2r / 1 - r2 (Cohen, 1993).
117
3.5.2 Qualitative analysis
Owing to the results derived from the first phase of the study, second and third
phases had to be added. For the second phase of the study, qualitative techniques
were used, which included interviews with the professionals in the pathology
laboratory in each province. The purpose of phase two was to determine what would
make the professional staff leave and what would encourage them to stay. The
purpose of the interviews was to ask the professionals the same set of questions in
order to uncover their experiences, thoughts, feelings, opinions and reflections
(Charlesworth et al., 2003). The interviews were conducted face-to-face with 15
professionals. All the interviewees were asked the same questions. The interviews
were recorded and notes made during the course of the interview. In this way, the
researcher was able to verify the data.
For the third phase of the study the same procedure was adopted, as structured
interview questions were put to three of the managers. These interviews were also
recorded and notes were taken. Interpretative analysis was used. According to
Geertz (1973), interpretative analysis provides a ‘thick description’, which includes a
more condensed version of all the data, and a thorough description of all the
processes, transactions and characteristics relating to the study (Terre Blanche et al.,
2009). It is also important to ensure that the researcher limits bias when looking at
the data for interviews by putting aside everything one already feels and knows, and
rather trying to listen to the phenomenon as it is. This is known as ‘bracketing’, which
was developed by Dreyer Kruger (Terre Blanche et al., 2009).
According to Terre Blanche et al. (2009), the following steps were followed when
beginning interpretative analysis:

118
Familiarisation and immersion: Observing data and going over all the notes
and recordings, to be familiar with the content.
Inducing themes: Observing all the data, and analysing common elements;
noting whether the interviewees repeated any details; putting all the data
together according to themes, and the questions asked. A discourse analysis
was conducted, which involved standing at a critical distance from the text to
identify discourses. If there were any, they had to be evaluated and the effects
noted. Discourse constructed particular realities about the interviews.
Lastly, the answers to the questions for the second phase of the study were coded
and correlations between the professionals’ answers were made. Coding involved
marking the segments of data with symbols, descriptive words, or category names.
Once a meaningful segment of text in a transcript was found, a code or category
name was assigned to signify that particular segment. This process continued until all
the segmented data were complete in the initial coding (Phillip, 2012). Themes from
each of the questions were used as part of the coding procedure. The answers given
in the interviews were then collated to evaluate whether the general managers could
redesign the jobs according to the findings from phase one of the study.
3.6 Bias
Bias has been defined as any force, tendency or procedural error in the collection,
analysis, or interpretation of data which provides distortion. Thus the presence of
bias in a research study will tend to create inaccurate and unrealizable results
(Coldwell & Herbst, 2004). Sampling bias is usually the result of a poor sampling
plan. The most notable is the bias of non-response when, for some reason, certain
units have no chance of appearing in the sample. Sampling bias is a tendency to
119
favour the selection of units with particular characteristics. If a questionnaire has the
‘not sure’ option, this could result in sample bias, as people would prefer to use this,
and there is the possibility that each question could be answered superficially, and
may not be answered honestly. To exclude this possible bias, the ‘not sure’ option in
any of the questionnaires was not used, and all the responses had to have a specific
answer.
There is a variety of ways in which research might be biased in design, data analysis,
and interpretation. One needs to consider the preferred approach to research, as
some people feel more comfortable with the quantitative approach, while others
prefer collecting qualitative data. The relationship with the research subject can
cause bias. If the researcher is interviewing colleagues, they may simply say what
they think the researcher wants to hear. If the interviewees feel nervous and fear for
their job security, this could be potential bias and the subjects will not answer the
questions honestly. To eliminate this bias, the researcher approached an external
representative from the Human Resource Department, who put the employees at
ease, and instructed them on human resource polices and confidentiality. The
researcher assured the employees that all the information from the research would
be kept confidential according to ethical considerations.
Other criteria which may cause bias (Coldwell & Herbst, 2004):
Poor selection criteria: the criteria the researcher is using to decide who would
be included in or excluded from the sample group. In this study both
professional and non-professional staff in the health sector were used. All
these individuals had a relatively high educational level.
Non-random selection: bias can creep in when the survey population is drawn
120
from one particular segment of the population, particularly if that segment is
not representative of the target. In this research, all the subjects represented
the target, although they were not from one population alone.
Study design: whether it is a web survey, an in-depth interview or something
like a focus group, the way in which the questions are asked could itself be the
problem, and might introduce bias. All of the four quantitative questionnaires
were valid, well-researched instruments and the questions did not pose any
potential bias. The second phase of the research included the interviews,
which were of qualitative design, so the researcher asked open-ended rather
than leading questions.
Data source: if the data source was manipulated to produce analysable data it
could cause bias. If the data source was selected by using an unusual
methodology, and if the data source was unusually small or narrow, or tightly
controlled by the researcher, it could cause bias. In the study, the data source
was not manipulated by the researcher, so this was eliminated as a bias.
Data analysis: if statistical methods were used to manipulate the data during
analysis, this could cause bias. Although the researcher had a great deal of
data, it was not clustered together, which could have caused bias All the data
analysed was prepared on the computer software program SPSS.
Analysis: one of the last hurdles and perhaps the most daunting is that of who
interprets the raw data to draw conclusions. The data analyst for the study did
not have a vested interest in the results. If s/he had done, there would have
been a strong possibility that the conclusions would be biased. To avoid this,
someone in the pathology environment who was more objective was used,
together with the researcher. However, objective outsiders could completely
121
misinterpret the answers because they were not familiar with what was being
discussed.
Evaluating the potential biases does not cast specific doubt on the quality of a
research study, but rather helps the researcher identify areas of concern. A checklist
developed by Coldwell and Herbst (2004) was used for the research project to
eliminate any biases. A large number of ‘yes’ responses on this list would indicate
that the researcher was concerned about the integrity of the research and worked to
protect the findings from claims of bias. There were no major concerns about bias in
this study, as the researcher tried to eliminate all the potential biases that could have
arisen.
3.7 Validity
Validity is the strength of the conclusions, inferences or propositions (Trochim, 2004).
The validity, the meaningfulness and the insights generated from the qualitative
inquiry have more to do with the richness of information on the cases selected and
the observational/analytical capabilities of the researcher than with sample size.
However, clearly, if the findings are to be useful for generalization, the cases should
be as far as possible representative of the population from which they are drawn
(Coldwell & Herbst, 2004). An effect or test is valid if it demonstrates or measures
what the researcher thinks or claims it does (Coldwell & Herbst, 2004).
There are four types of validity: conclusion validity, which asks if there is a
relationship between the program and the observed outcome; internal validity asks if
there is a relationship between the program and the outcome the researcher saw;
construct validity tries to generalize the conceptualized treatment and outcomes to
122
broader constructs of the same concepts; and external validity refers to the ability to
generalize the outcomes to broader constructs of the same concepts (Trochim,
2004).
Research errors, such as faulty research procedures, poor samples and inaccurate
or misleading measurements, can undermine validity (Coldwell & Herbst, 2004).
Validity may be investigated by comparing the rating results with the results obtained
by other measuring instruments for the same contract. As discussed under the
research instrumentation, the job diagnostic survey, the career orientation survey, the
organisational commitment questionnaire and the intention to quit questionnaire are
all validated instruments. Credibility focuses on the confidence in the truth of the
findings, including an accurate understanding of the context. All four of the research
papers discussed show the instruments to be highly credible. The research can be
seen as valid as it was free from the researcher’s biases, and reflected the real
meaning of the issues under investigation.
Different methods of data-collection and analysis allowed for cross-checks to validate
the findings, and the researcher invited another researcher to review the analysis
decisions made during the research process to verify that the interpretations were
well grounded in the data. By asking each respondent to fill in four of the
questionnaires gave the researcher an indication of the cross-checks to validate the
findings. In some of the questionnaires, such as the job diagnostic survey, certain
questions were asked in reverse. The job diagnostic survey, organisational
commitment questionnaire, the intention to quit questionnaire and the career
orientation inventory had all been validated by previous studies, as has been
discussed in depth above.
123
3.8 Reliability
Reliability is concerned with the dependability, consistency and repeatability of the
measurement. To determine whether the questionnaires and findings were reliable,
the question posed was meant to ensure that the evidence and conclusions stand up
to the closest scrutiny (Coldwell & Herbst, 2004). The answer is dependent on the
time when the questionnaire was completed. If it had been completed when
increases were given to staff, or if staff had been retrenched/dismissed, the answers
may have differed. The research can be seen as reliable, as the respondents knew
about the questions being asked and the problems, as the issue was relevant to both
the professional and non-professional staff working in the health environment. The
researcher was clear as to what was being asked, and misinterpretation was
prevented. The data gathering was consistent. Four valid research instruments were
used in the quantitative section of the study, which also showed reliability.
3.9 Generalisability
The required generalisability relates to the reliability of the scores obtained.
Generalisation is the consistency of the ranking of the scores assigned to individuals
or objects, irrespective of when the measuring instrument was applied, which form
was used and by whom it was administered or scored (Coldwell & Herbst, 2004).
Reliability therefore refers to the extent to which the scores obtained may be
generalised to different measuring occasions. This refers to scores assigned to
individuals or objects, irrespective of when the measuring instruments were applied,
which form was used and by whom it was administered and scored (Coldwell &
Herbst, 2004). In this study, all the scores assigned to individuals were consistent,
irrespective of the time of measurement, the test used, and the person administering
124
the test.
3.10 Ethical considerations
Participation in the study was voluntary and was based on the respondents’ ability to
give informed consent. All the data and information gathered were treated strictly
confidentially and could not be accessed by anyone without prior permission from the
participants. Moreover, the participants had the right to withdraw at any time if they
were unable to complete the questionnaire or attend the interviews.
The principles underlying research ethics are universal and concern issues such as
honesty and respect for the rights of individuals. Professional groups, such as market
researchers have established explicit codes of ethics to which members are obliged
to adhere (Coldwell & Herbst, 2004). The code of ethics has intrinsic value in
protecting the rights of humans who may become involved in research, as seen in
human resource initiatives, but they also serve a professional indemnity if they are
not seen to have adhered to the appropriate code of ethics.
When it comes to the research, the ethical considerations come into play at three
stages of the research project (Coldwell & Herbst, 2004): first, when the participants
are recruited, then during the intervention and/or the measurement procedure to
which they are subjected and finally in the release of the results obtained.
General principles usually invoked in codes of research ethics are firstly, that no
harm should befall the research subjects, and secondly that the subjects should take
part freely, based on informed consent (Shamoo & Resnik, 2010). The researcher
ensured that honesty was displayed at all times, and privacy should be maintained,
i.e. the respondents’ particulars should not be divulged. The researcher has also
125
ensured that confidentiality and fairness have been exercised. Ethical approval was
also applied for and granted by the UNISA SBL ethics committee for this study.
3.11 Summary
Chapter Three explored the research methods and data used in the research study.
Quantitative and qualitative methods were used, which included the job diagnostic
survey, the career anchor questionnaire, the organisational commitment scale, the
intention to quit questionnaire and interviews. A sample size of 207 was calculated.
However, only 188 responded, which included the population of both professionals
and non-professionals in the pathology laboratories. The data analysis techniques
included coding the data, which was then analysed to reach valid conclusions. The
pilot study was conducted to check the validity and feasibility of the questionnaires.
The next chapter consolidates all the data and methods used in this chapter, and
analyses these to develop suitable findings for the study. Chapter Four discusses the
results and findings from the study, based on the objectives of the research.
126
CHAPTER FOUR: RESULTS AND FINDINGS
4.1 Introduction
In this chapter, the results of the study are reported. First, the focus will be on the
quantitative results and then the attention will shift to the findings of the qualitative
section of the study.
The quantitative section of the results includes the descriptive statistics pertaining to
the questionnaires used. First, reliability is measured using Cronbach’s alpha.
Kurtosis and skewness are also taken into consideration for each of the
questionnaires. Secondly, the differences between the professionals and the non-
professionals are compared for career anchors, job characteristics, organisational
commitment and intention to quit, which is evaluated by using ANOVAs. Thirdly, the
correlation between predictor variables and intention to quit and organisational
commitment was conducted. Lastly, a linear regression analysis was conducted.
Conclusions were then drawn from each set of statistics.
The qualitative section of the results included coding the data from the responses of
the interview question. Each question was looked at independently. The themes
which emerged from each of these questions were collated for each question, and
then a summary of each theme was analysed. The percentage and the number of the
respondents were used to establish what the most important themes were per
question and in summary.
4.2 Results pertaining to the quantitative study
In this section, the results pertaining to the quantitative study are reported, starting
127
with a demographic report on those who completed the questionnaires.
4.2.1 Demographic information
In total, 188 respondents answered the questionnaires of the total, 53 (22.8 %) were
male and 135 (71.8%) were female. More than a third of the respondents were
female.
Apropos of age, the majority of respondents were in the age group 30-39 years which
was 48.9%. In total, 21.3% were in the age group 20-29 and 19.1% were in the age
group 40-49. The minority of respondents were over the age of 50, which was 10.6%.
Only about 11% of the employees were approaching retirement.
The ethnic composition of the population was comprised of 37.8% African, 23.9%
Caucasian, 20.7% Indian and 17.6% Coloured. Although the Africans were the
majority group, in proportion to the national population strata they were
underrepresented in the sample.
The geographic spread included 56.4% of the respondents from the Gauteng
Province, 22.9% from the Eastern Cape and 20.7% from KwaZulu Natal. The data
were collected in these areas only per the convenient sampling of the offices, as
discussed in Chapter Three.
In total, six job types were reported for the convenience of the respondents (see
Chapter Three). The job types were then divided into two groups, professional and
non-professionals. Pathologists, scientists, technologists, technicians and nurses
made up the professionals, and the administrative staff made up the non-
professionals. There were 116 (61.7%) professionals and 72 (38.3%) administrative
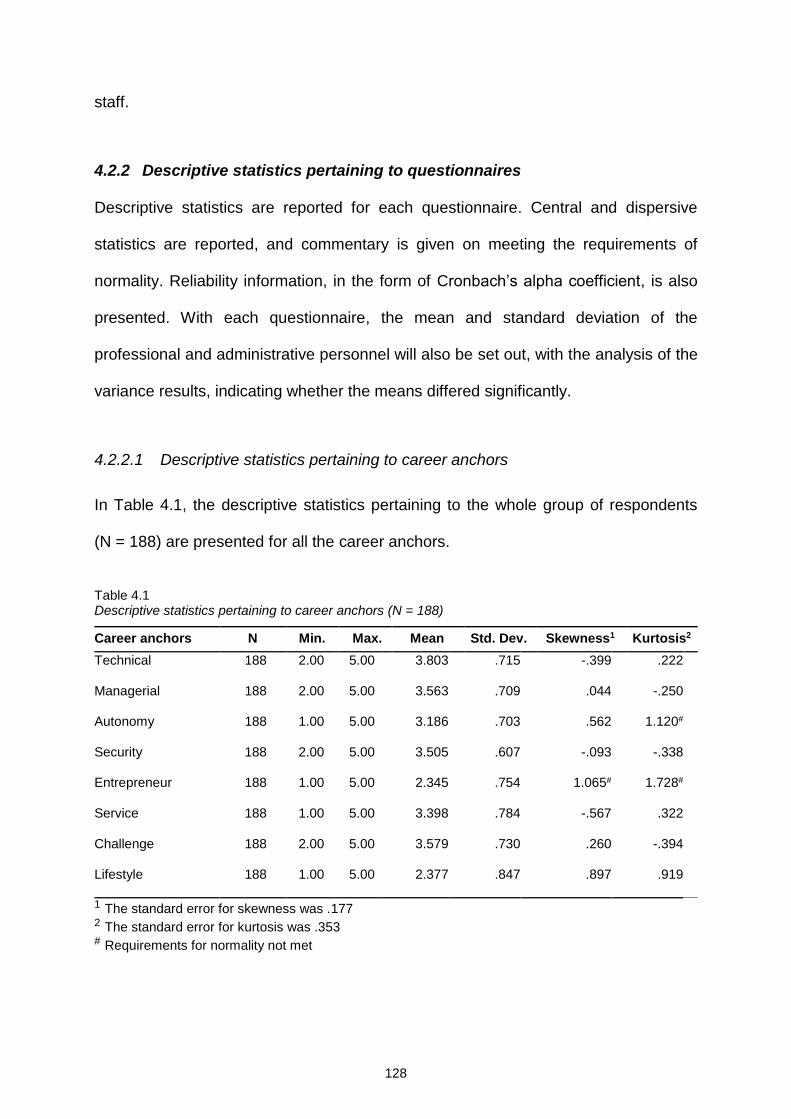
128
staff.
4.2.2 Descriptive statistics pertaining to questionnaires
Descriptive statistics are reported for each questionnaire. Central and dispersive
statistics are reported, and commentary is given on meeting the requirements of
normality. Reliability information, in the form of Cronbach’s alpha coefficient, is also
presented. With each questionnaire, the mean and standard deviation of the
professional and administrative personnel will also be set out, with the analysis of the
variance results, indicating whether the means differed significantly.
4.2.2.1 Descriptive statistics pertaining to career anchors
In Table 4.1, the descriptive statistics pertaining to the whole group of respondents
(N = 188) are presented for all the career anchors.
Table 4.1 Descriptive statistics pertaining to career anchors (N = 188)
Career anchors N Min. Max. Mean Std. Dev. Skewness1 Kurtosis2
Technical 188 2.00 5.00 3.803 .715 -.399 .222
Managerial 188 2.00 5.00 3.563 .709 .044 -.250
Autonomy 188 1.00 5.00 3.186 .703 .562 1.120#
Security 188 2.00 5.00 3.505 .607 -.093 -.338
Entrepreneur 188 1.00 5.00 2.345 .754 1.065# 1.728#
Service 188 1.00 5.00 3.398 .784 -.567 .322
Challenge 188 2.00 5.00 3.579 .730 .260 -.394
Lifestyle 188 1.00 5.00 2.377 .847 .897 .919
1 The standard error for skewness was .177 2 The standard error for kurtosis was .353 # Requirements for normality not met
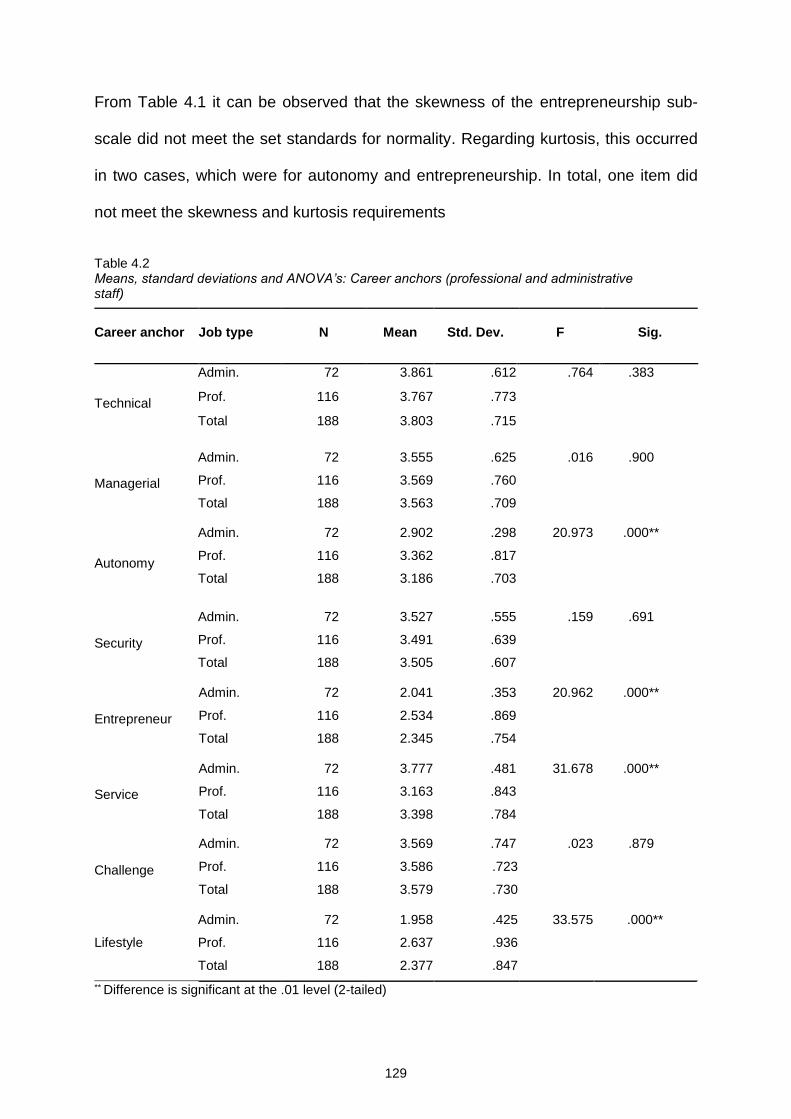
129
From Table 4.1 it can be observed that the skewness of the entrepreneurship sub-
scale did not meet the set standards for normality. Regarding kurtosis, this occurred
in two cases, which were for autonomy and entrepreneurship. In total, one item did
not meet the skewness and kurtosis requirements
Table 4.2 Means, standard deviations and ANOVA’s: Career anchors (professional and administrative staff)
Career anchor Job type N Mean Std. Dev. F Sig.
Technical
Admin. 72 3.861 .612 .764 .383
Prof. 116 3.767 .773
Total 188 3.803 .715
Managerial
Admin. 72 3.555 .625 .016 .900
Prof. 116 3.569 .760
Total 188 3.563 .709
Autonomy
Admin. 72 2.902 .298 20.973 .000**
Prof. 116 3.362 .817
Total 188 3.186 .703
Security
Admin. 72 3.527 .555 .159 .691
Prof. 116 3.491 .639
Total 188 3.505 .607
Entrepreneur
Admin. 72 2.041 .353 20.962 .000**
Prof. 116 2.534 .869
Total 188 2.345 .754
Service
Admin. 72 3.777 .481 31.678 .000**
Prof. 116 3.163 .843
Total 188 3.398 .784
Challenge
Admin. 72 3.569 .747 .023 .879
Prof. 116 3.586 .723
Total 188 3.579 .730
Lifestyle
Admin. 72 1.958 .425 33.575 .000**
Prof. 116 2.637 .936
Total 188 2.377 .847
** Difference is significant at the .01 level (2-tailed)
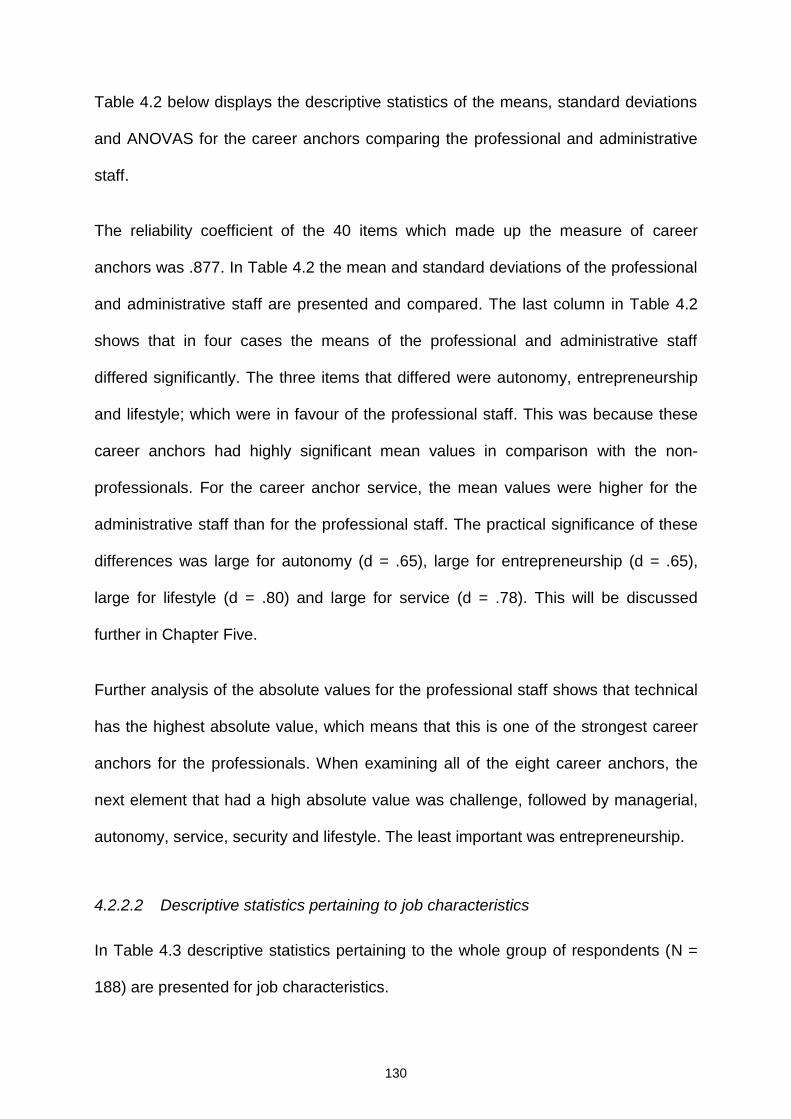
130
Table 4.2 below displays the descriptive statistics of the means, standard deviations
and ANOVAS for the career anchors comparing the professional and administrative
staff.
The reliability coefficient of the 40 items which made up the measure of career
anchors was .877. In Table 4.2 the mean and standard deviations of the professional
and administrative staff are presented and compared. The last column in Table 4.2
shows that in four cases the means of the professional and administrative staff
differed significantly. The three items that differed were autonomy, entrepreneurship
and lifestyle; which were in favour of the professional staff. This was because these
career anchors had highly significant mean values in comparison with the non-
professionals. For the career anchor service, the mean values were higher for the
administrative staff than for the professional staff. The practical significance of these
differences was large for autonomy (d = .65), large for entrepreneurship (d = .65),
large for lifestyle (d = .80) and large for service (d = .78). This will be discussed
further in Chapter Five.
Further analysis of the absolute values for the professional staff shows that technical
has the highest absolute value, which means that this is one of the strongest career
anchors for the professionals. When examining all of the eight career anchors, the
next element that had a high absolute value was challenge, followed by managerial,
autonomy, service, security and lifestyle. The least important was entrepreneurship.
4.2.2.2 Descriptive statistics pertaining to job characteristics
In Table 4.3 descriptive statistics pertaining to the whole group of respondents (N =
188) are presented for job characteristics.
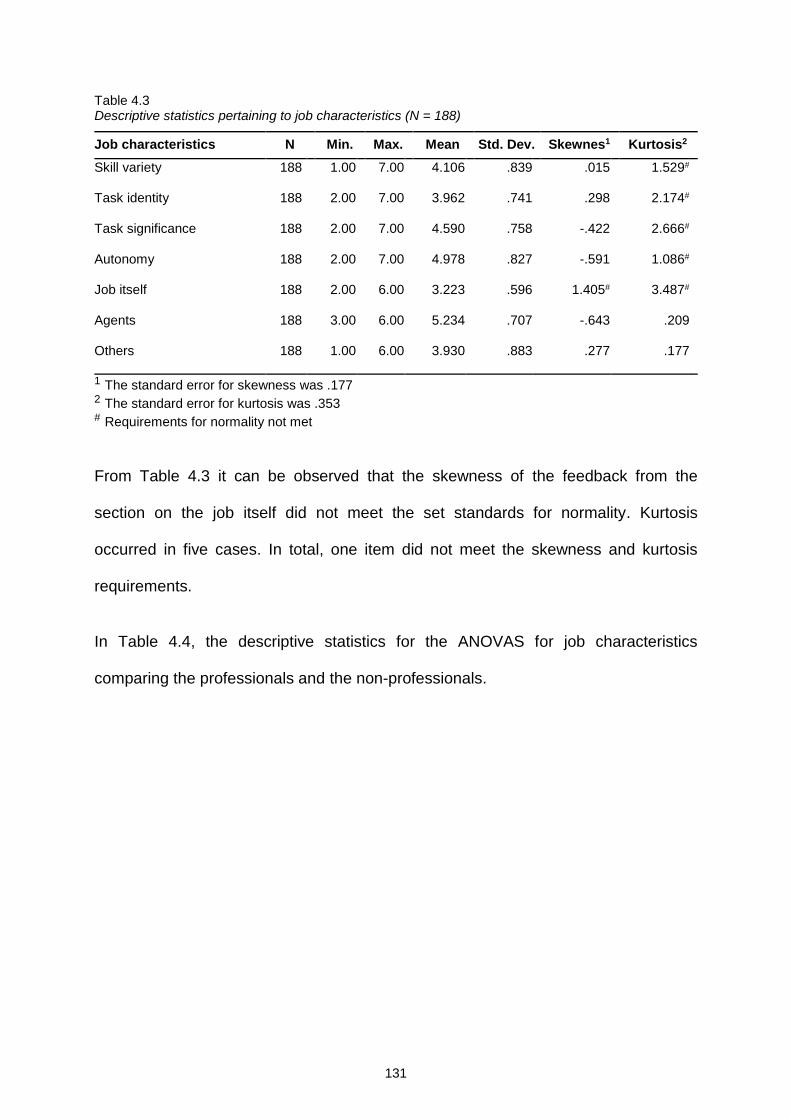
131
Table 4.3 Descriptive statistics pertaining to job characteristics (N = 188)
Job characteristics N Min. Max. Mean Std. Dev. Skewnes1 Kurtosis2
Skill variety 188 1.00 7.00 4.106 .839 .015 1.529#
Task identity 188 2.00 7.00 3.962 .741 .298 2.174#
Task significance 188 2.00 7.00 4.590 .758 -.422 2.666#
Autonomy 188 2.00 7.00 4.978 .827 -.591 1.086#
Job itself 188 2.00 6.00 3.223 .596 1.405# 3.487#
Agents 188 3.00 6.00 5.234 .707 -.643 .209
Others 188 1.00 6.00 3.930 .883 .277 .177
1 The standard error for skewness was .177 2 The standard error for kurtosis was .353 # Requirements for normality not met
From Table 4.3 it can be observed that the skewness of the feedback from the
section on the job itself did not meet the set standards for normality. Kurtosis
occurred in five cases. In total, one item did not meet the skewness and kurtosis
requirements.
In Table 4.4, the descriptive statistics for the ANOVAS for job characteristics
comparing the professionals and the non-professionals.
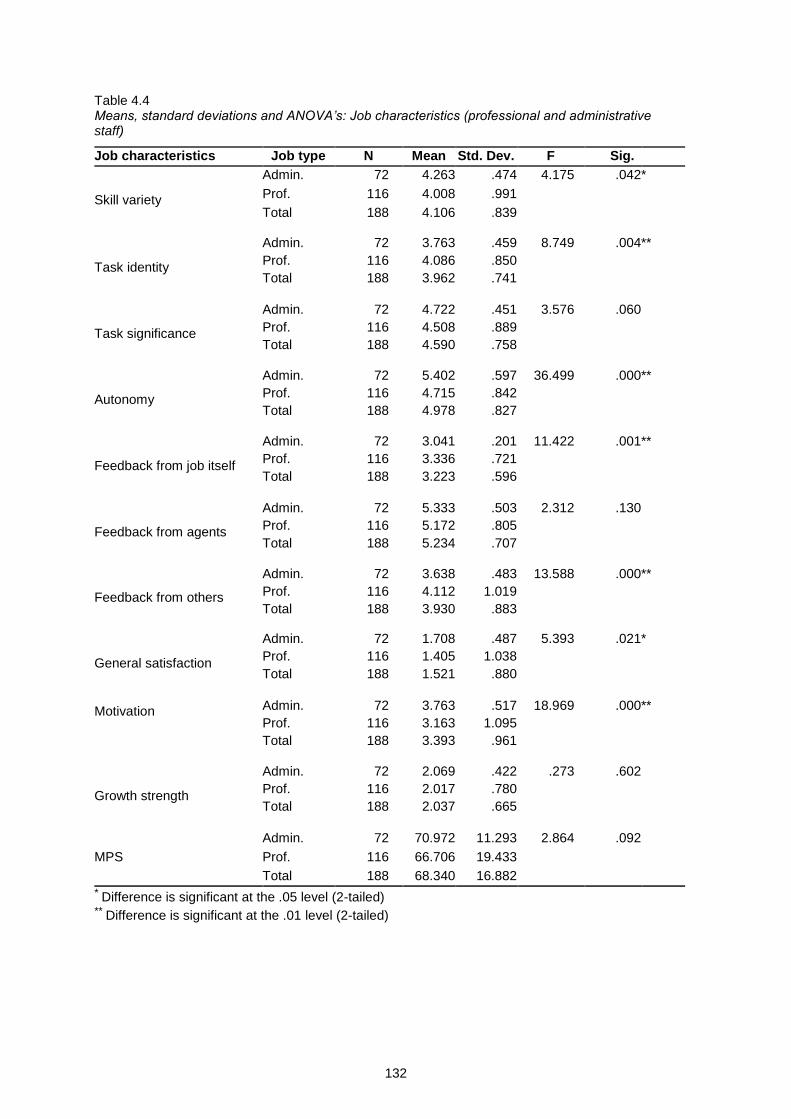
132
Table 4.4 Means, standard deviations and ANOVA’s: Job characteristics (professional and administrative staff)
Job characteristics Job type N Mean Std. Dev. F Sig.
Skill variety
Admin. 72 4.263 .474 4.175 .042 *
Prof. 116 4.008 .991
Total 188 4.106 .839
Task identity
Admin. 72 3.763 .459 8.749 .004 **
Prof. 116 4.086 .850
Total 188 3.962 .741
Task significance
Admin. 72 4.722 .451 3.576 .060
Prof. 116 4.508 .889
Total 188 4.590 .758
Autonomy
Admin. 72 5.402 .597 36.499 .000 **
Prof. 116 4.715 .842
Total 188 4.978 .827
Feedback from job itself
Admin. 72 3.041 .201 11.422 .001 **
Prof. 116 3.336 .721
Total 188 3.223 .596
Feedback from agents
Admin. 72 5.333 .503 2.312 .130
Prof. 116 5.172 .805
Total 188 5.234 .707
Feedback from others
Admin. 72 3.638 .483 13.588 .000 **
Prof. 116 4.112 1.019
Total 188 3.930 .883
General satisfaction
Admin. 72 1.708 .487 5.393 .021 *
Prof. 116 1.405 1.038
Total 188 1.521 .880
Motivation
Admin. 72 3.763 .517 18.969 .000 **
Prof. 116 3.163 1.095
Total 188 3.393 .961
Growth strength
Admin. 72 2.069 .422 .273 .602
Prof. 116 2.017 .780
Total 188 2.037 .665
MPS
Admin. 72 70.972 11.293 2.864 .092
Prof. 116 66.706 19.433
Total 188 68.340 16.882
* Difference is significant at the .05 level (2-tailed) ** Difference is significant at the .01 level (2-tailed)
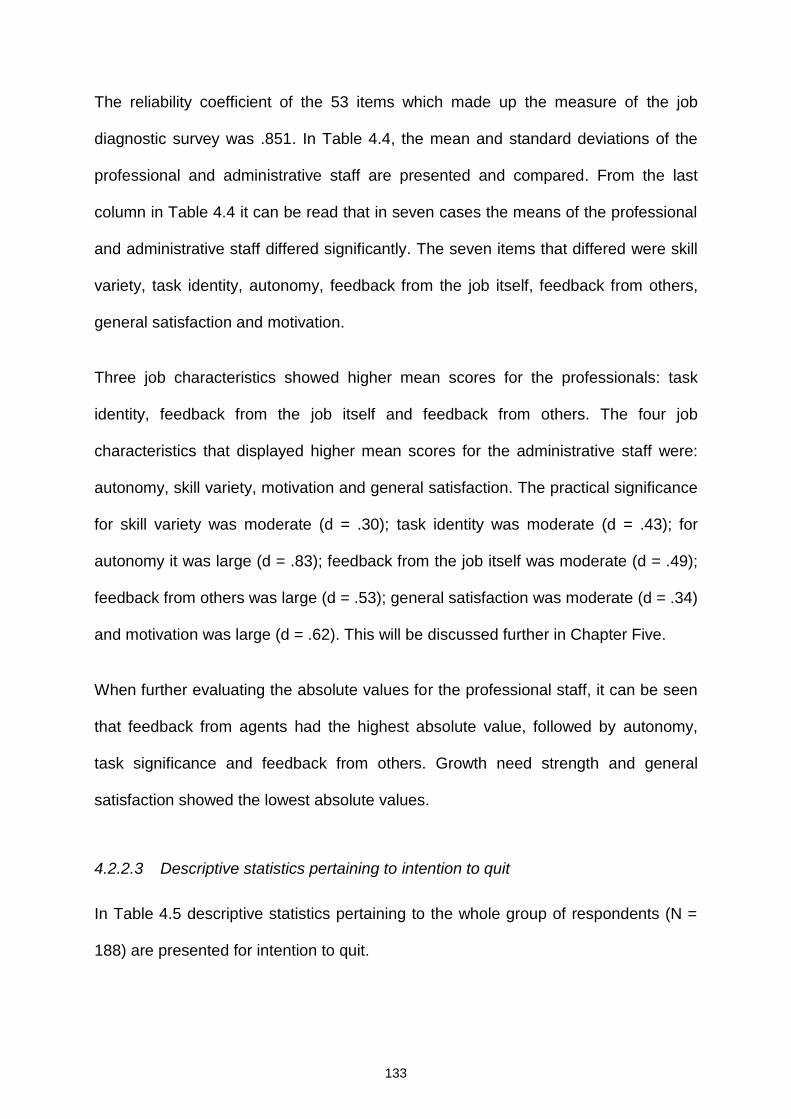
133
The reliability coefficient of the 53 items which made up the measure of the job
diagnostic survey was .851. In Table 4.4, the mean and standard deviations of the
professional and administrative staff are presented and compared. From the last
column in Table 4.4 it can be read that in seven cases the means of the professional
and administrative staff differed significantly. The seven items that differed were skill
variety, task identity, autonomy, feedback from the job itself, feedback from others,
general satisfaction and motivation.
Three job characteristics showed higher mean scores for the professionals: task
identity, feedback from the job itself and feedback from others. The four job
characteristics that displayed higher mean scores for the administrative staff were:
autonomy, skill variety, motivation and general satisfaction. The practical significance
for skill variety was moderate (d = .30); task identity was moderate (d = .43); for
autonomy it was large (d = .83); feedback from the job itself was moderate (d = .49);
feedback from others was large (d = .53); general satisfaction was moderate (d = .34)
and motivation was large (d = .62). This will be discussed further in Chapter Five.
When further evaluating the absolute values for the professional staff, it can be seen
that feedback from agents had the highest absolute value, followed by autonomy,
task significance and feedback from others. Growth need strength and general
satisfaction showed the lowest absolute values.
4.2.2.3 Descriptive statistics pertaining to intention to quit
In Table 4.5 descriptive statistics pertaining to the whole group of respondents (N =
188) are presented for intention to quit.
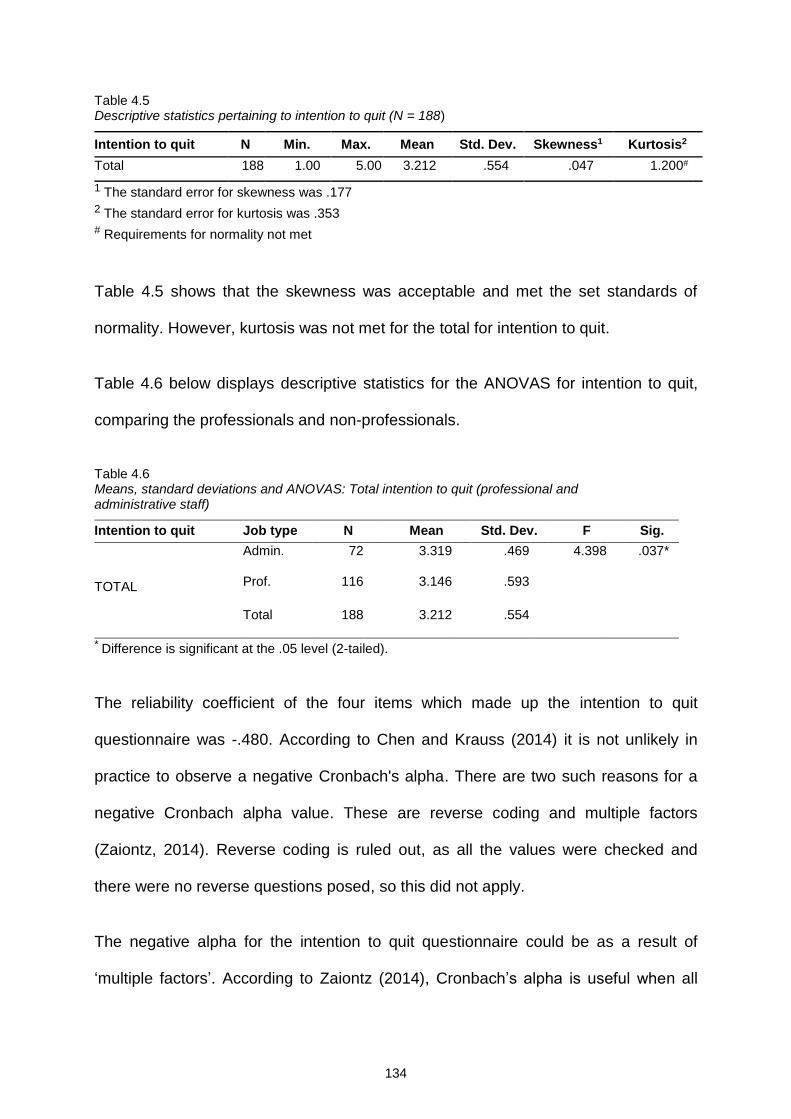
134
Table 4.5 Descriptive statistics pertaining to intention to quit (N = 188)
Intention to quit N Min. Max. Mean Std. Dev. Skewness1 Kurtosis2
Total 188 1.00 5.00 3.212 .554 .047 1.200#
1 The standard error for skewness was .177
2 The standard error for kurtosis was .353
# Requirements for normality not met
Table 4.5 shows that the skewness was acceptable and met the set standards of
normality. However, kurtosis was not met for the total for intention to quit.
Table 4.6 below displays descriptive statistics for the ANOVAS for intention to quit,
comparing the professionals and non-professionals.
Table 4.6 Means, standard deviations and ANOVAS: Total intention to quit (professional and administrative staff)
Intention to quit Job type N Mean Std. Dev. F Sig.
TOTAL
Admin. 72 3.319 .469 4.398 .037*
Prof. 116 3.146 .593
Total 188 3.212 .554
* Difference is significant at the .05 level (2-tailed).
The reliability coefficient of the four items which made up the intention to quit
questionnaire was -.480. According to Chen and Krauss (2014) it is not unlikely in
practice to observe a negative Cronbach's alpha. There are two such reasons for a
negative Cronbach alpha value. These are reverse coding and multiple factors
(Zaiontz, 2014). Reverse coding is ruled out, as all the values were checked and
there were no reverse questions posed, so this did not apply.
The negative alpha for the intention to quit questionnaire could be as a result of
‘multiple factors’. According to Zaiontz (2014), Cronbach’s alpha is useful when all
135
the questions are testing more or less the same thing called a ‘factor’. In the intention
to quit questionnaire, there are multiple factors, so it had to be determined which
questions were testing which factors. There are two factors in the intention to quit
questionnaire (e.g. wanting to leave, searching for another position). These factors
suggest different things, but they are similar in nature.
This meant that the questionnaire had to be split into two tests, one containing the
questions testing factor 1, the other with the questions testing factor 2. The
Cronbach’s alpha can be calculated for each of the tests and the process of
determining these ‘hidden’ factors and splitting the test by factor is referred to as a
‘factor analysis’ (Zaiontz, 2014). However, the factor analysis was not conducted for
the intention to quit questionnaire, because, first, the total number of questions in the
questionnaire was only four. A meta-analytic finding by Peterson (1994) suggests
that “Cronbach's alpha may underestimate the true reliability when the measure is
composed of four and less than four items with only two response categories” (Chen
& Krauss, 2014: 5). Cronbach's alpha can be affected by the characteristics of
respondents and components. Should the respondents be homogeneous (i.e., similar
in the characteristic assessed by a measure), s2 tends to decrease. As seen from the
Cronbach alpha formula, a small s2 leads to a small alpha coefficient (Chen &
Krauss, 2014). According to Chen and Krauss (2014), if the components on a
measure are heterogeneous, suggesting there is more than one factor or dimension
underlying the components, Cronbach's alpha will underestimate the true reliability. It
should be emphasized that a high Cronbach's alpha (e.g., .80) does not necessarily
suggest that there is only one factor or dimension underlying the components.
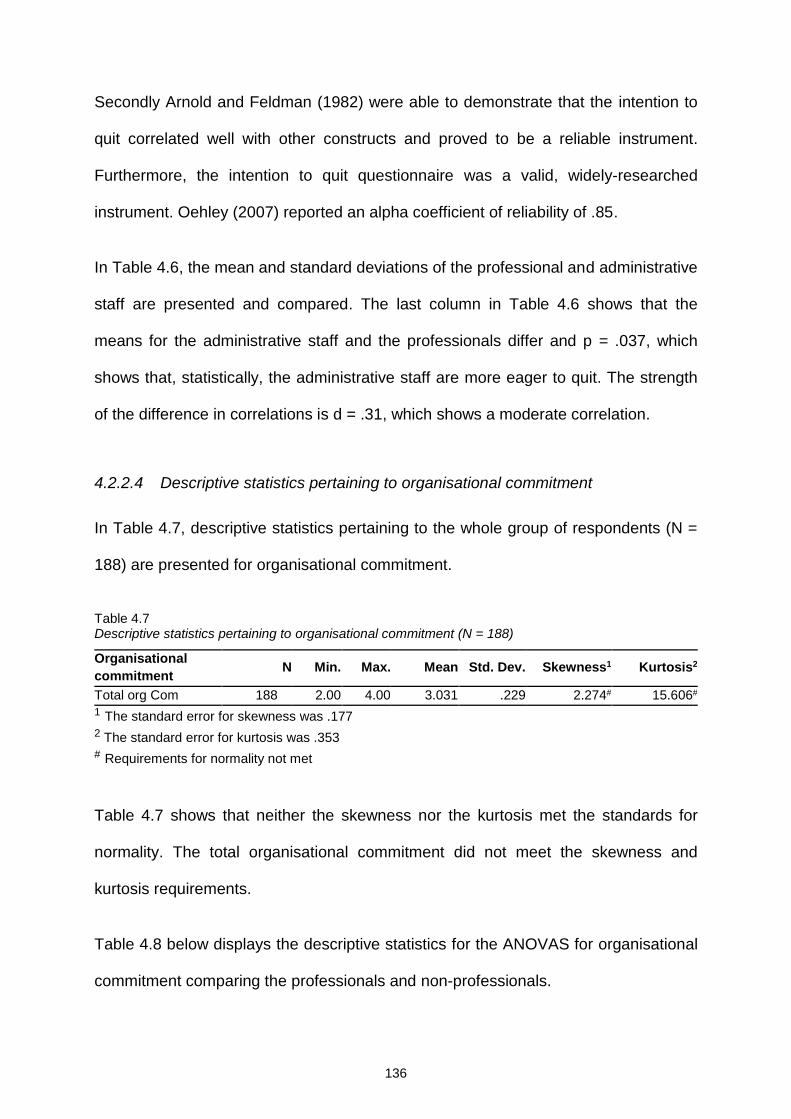
136
Secondly Arnold and Feldman (1982) were able to demonstrate that the intention to
quit correlated well with other constructs and proved to be a reliable instrument.
Furthermore, the intention to quit questionnaire was a valid, widely-researched
instrument. Oehley (2007) reported an alpha coefficient of reliability of .85.
In Table 4.6, the mean and standard deviations of the professional and administrative
staff are presented and compared. The last column in Table 4.6 shows that the
means for the administrative staff and the professionals differ and p = .037, which
shows that, statistically, the administrative staff are more eager to quit. The strength
of the difference in correlations is d = .31, which shows a moderate correlation.
4.2.2.4 Descriptive statistics pertaining to organisational commitment
In Table 4.7, descriptive statistics pertaining to the whole group of respondents (N =
188) are presented for organisational commitment.
Table 4.7 Descriptive statistics pertaining to organisational commitment (N = 188)
Organisational
commitment N Min. Max. Mean Std. Dev. Skewness1 Kurtosis2
Total org Com 188 2.00 4.00 3.031 .229 2.274# 15.606#
1 The standard error for skewness was .177
2 The standard error for kurtosis was .353
# Requirements for normality not met
Table 4.7 shows that neither the skewness nor the kurtosis met the standards for
normality. The total organisational commitment did not meet the skewness and
kurtosis requirements.
Table 4.8 below displays the descriptive statistics for the ANOVAS for organisational
commitment comparing the professionals and non-professionals.
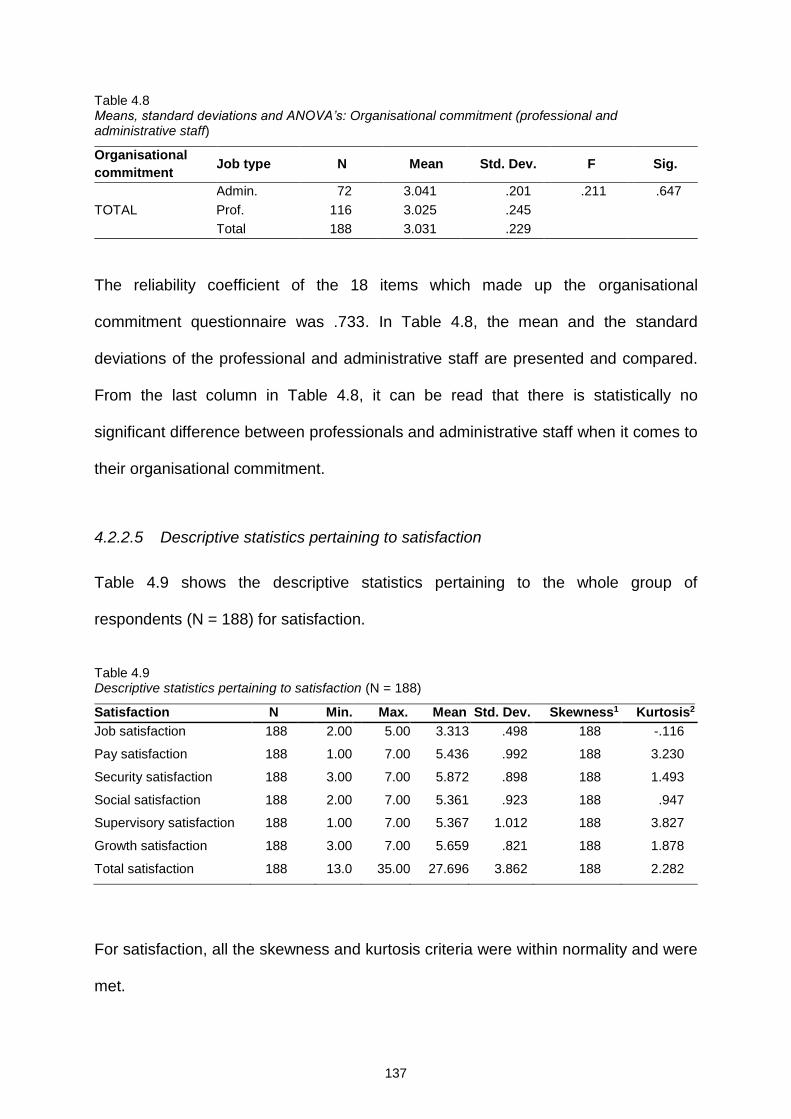
137
Table 4.8 Means, standard deviations and ANOVA’s: Organisational commitment (professional and administrative staff)
Organisational
commitment Job type N Mean Std. Dev. F Sig.
TOTAL
Admin. 72 3.041 .201 .211 .647
Prof. 116 3.025 .245
Total 188 3.031 .229
The reliability coefficient of the 18 items which made up the organisational
commitment questionnaire was .733. In Table 4.8, the mean and the standard
deviations of the professional and administrative staff are presented and compared.
From the last column in Table 4.8, it can be read that there is statistically no
significant difference between professionals and administrative staff when it comes to
their organisational commitment.
4.2.2.5 Descriptive statistics pertaining to satisfaction
Table 4.9 shows the descriptive statistics pertaining to the whole group of
respondents (N = 188) for satisfaction.
Table 4.9 Descriptive statistics pertaining to satisfaction (N = 188)
Satisfaction N Min. Max. Mean Std. Dev. Skewness1 Kurtosis2
Job satisfaction 188 2.00 5.00 3.313 .498 188 -.116
Pay satisfaction 188 1.00 7.00 5.436 .992 188 3.230
Security satisfaction 188 3.00 7.00 5.872 .898 188 1.493
Social satisfaction 188 2.00 7.00 5.361 .923 188 .947
Supervisory satisfaction 188 1.00 7.00 5.367 1.012 188 3.827
Growth satisfaction 188 3.00 7.00 5.659 .821 188 1.878
Total satisfaction 188 13.0 35.00 27.696 3.862 188 2.282
For satisfaction, all the skewness and kurtosis criteria were within normality and were
met.

138
The results of the comparisons between the professional and administration staff are
reported in Table 4.10
Table 4.10 Means, standard deviations and ANOVA’s: Satisfaction (professional and administrative staff)
Satisfaction Job type N Mean Std. Dev. F Sig.
Job satisfaction
Admin 72 3.222 .418 4.003 .047 *
Prof. 116 3.370 .536
Total 188 3.313 .498
Pay satisfaction
Admin 72 5.680 .526 7.313 .007 **
Prof. 116 5.284 1.170
Total 188 5.436 .992
Security satisfaction
Admin 72 6.208 .501 17.786 .000 **
Prof. 116 5.663 1.021
Total 188 5.872 .898
Social satisfaction
Admin 72 5.763 .568 24.982 .000 **
Prof. 116 5.112 1.011
Total 188 5.361 .923
Supervisory satisfaction
Admin 72 5.777 .610 21.292 .000 **
Prof. 116 5.112 1.124
Total 188 5.367 1.012
Growth satisfaction
Admin 72 6.055 .230 31.536 .000 **
Prof. 116 5.413 .951
Total 188 5.659 .821
Total satisfaction
Admin 72 29.486 2.096 28.760 .000 **
Prof. 116 26.586 4.277
Total 188 27.696 3.862
* Difference is significant at the .05 level (2-tailed) ** Difference is significant at the .01 level (2-tailed)
The reliability coefficient of the seven items which made up the measure of general
job satisfaction was .702, and the reliability coefficient of the seven items used for the
total satisfaction criteria was .886. In Table 4.10 the mean and standard deviations of
the professional and administrative staff are presented and compared. The last
column in Table 4.10 shows that, in all (seven) of the cases, the means of the
professional and administrative staff showed highly significant differences.
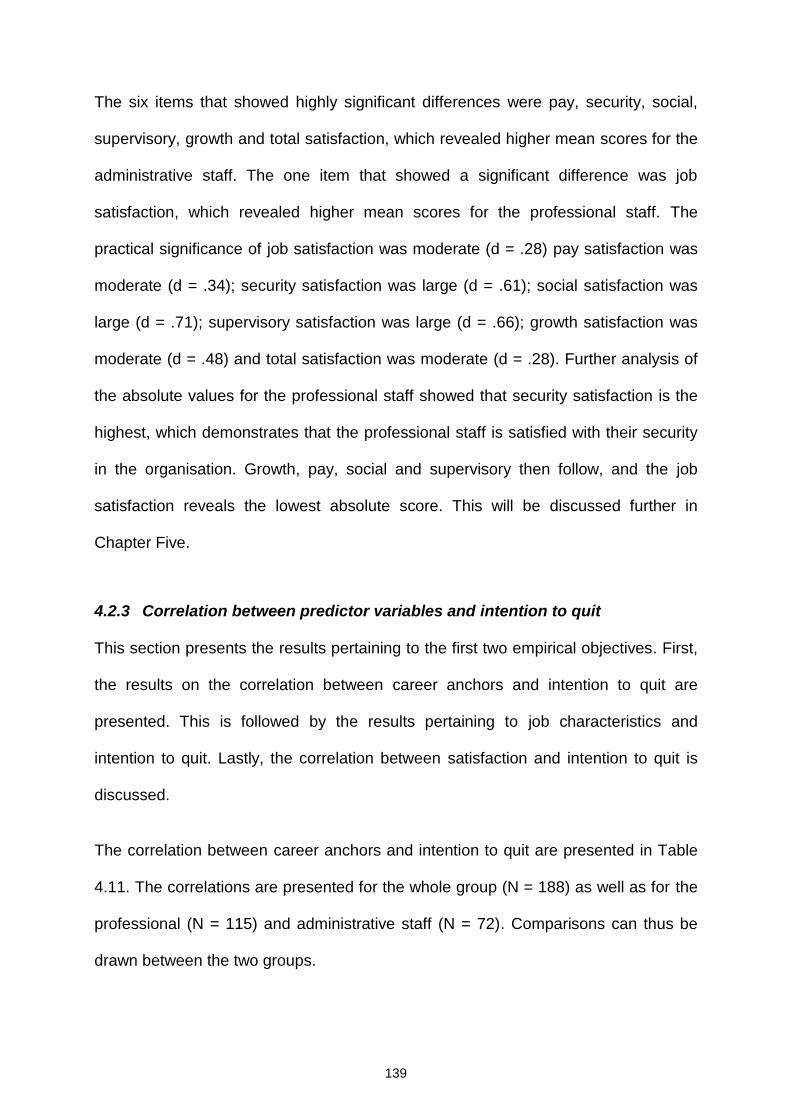
139
The six items that showed highly significant differences were pay, security, social,
supervisory, growth and total satisfaction, which revealed higher mean scores for the
administrative staff. The one item that showed a significant difference was job
satisfaction, which revealed higher mean scores for the professional staff. The
practical significance of job satisfaction was moderate (d = .28) pay satisfaction was
moderate (d = .34); security satisfaction was large (d = .61); social satisfaction was
large (d = .71); supervisory satisfaction was large (d = .66); growth satisfaction was
moderate (d = .48) and total satisfaction was moderate (d = .28). Further analysis of
the absolute values for the professional staff showed that security satisfaction is the
highest, which demonstrates that the professional staff is satisfied with their security
in the organisation. Growth, pay, social and supervisory then follow, and the job
satisfaction reveals the lowest absolute score. This will be discussed further in
Chapter Five.
4.2.3 Correlation between predictor variables and intention to quit
This section presents the results pertaining to the first two empirical objectives. First,
the results on the correlation between career anchors and intention to quit are
presented. This is followed by the results pertaining to job characteristics and
intention to quit. Lastly, the correlation between satisfaction and intention to quit is
discussed.
The correlation between career anchors and intention to quit are presented in Table
4.11. The correlations are presented for the whole group (N = 188) as well as for the
professional (N = 115) and administrative staff (N = 72). Comparisons can thus be
drawn between the two groups.
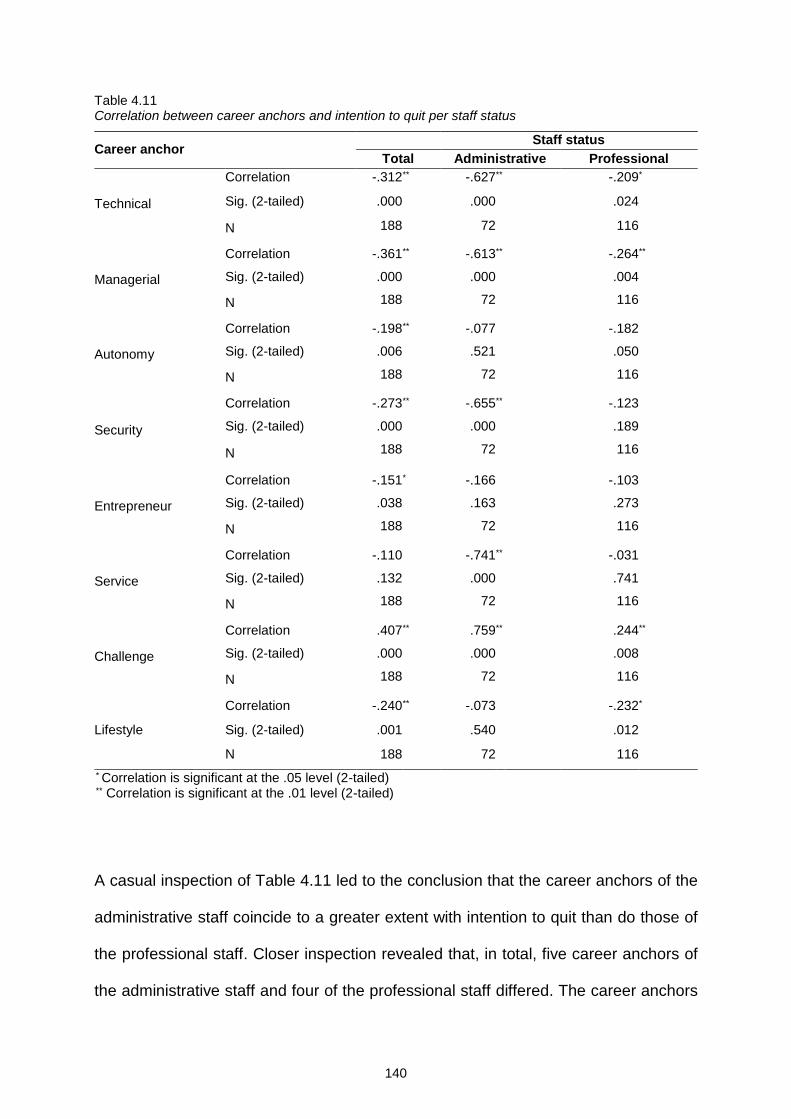
140
Table 4.11 Correlation between career anchors and intention to quit per staff status
Career anchor Staff status
Total Administrative Professional
Technical
Correlation -.312 ** -.627 ** -.209 *
Sig. (2-tailed) .000 .000 .024
N 188 72 116
Managerial
Correlation -.361 ** -.613 ** -.264 **
Sig. (2-tailed) .000 .000 .004
N 188 72 116
Autonomy
Correlation -.198 ** -.077 -.182
Sig. (2-tailed) .006 .521 .050
N 188 72 116
Security
Correlation -.273 ** -.655 ** -.123
Sig. (2-tailed) .000 .000 .189
N 188 72 116
Entrepreneur
Correlation -.151 * -.166 -.103
Sig. (2-tailed) .038 .163 .273
N 188 72 116
Service
Correlation -.110 -.741 ** -.031
Sig. (2-tailed) .132 .000 .741
N 188 72 116
Challenge
Correlation .407 ** .759 ** .244 **
Sig. (2-tailed) .000 .000 .008
N 188 72 116
Lifestyle
Correlation -.240 ** -.073 -.232 *
Sig. (2-tailed) .001 .540 .012
N 188 72 116
* Correlation is significant at the .05 level (2-tailed) ** Correlation is significant at the .01 level (2-tailed)
A casual inspection of Table 4.11 led to the conclusion that the career anchors of the
administrative staff coincide to a greater extent with intention to quit than do those of
the professional staff. Closer inspection revealed that, in total, five career anchors of
the administrative staff and four of the professional staff differed. The career anchors
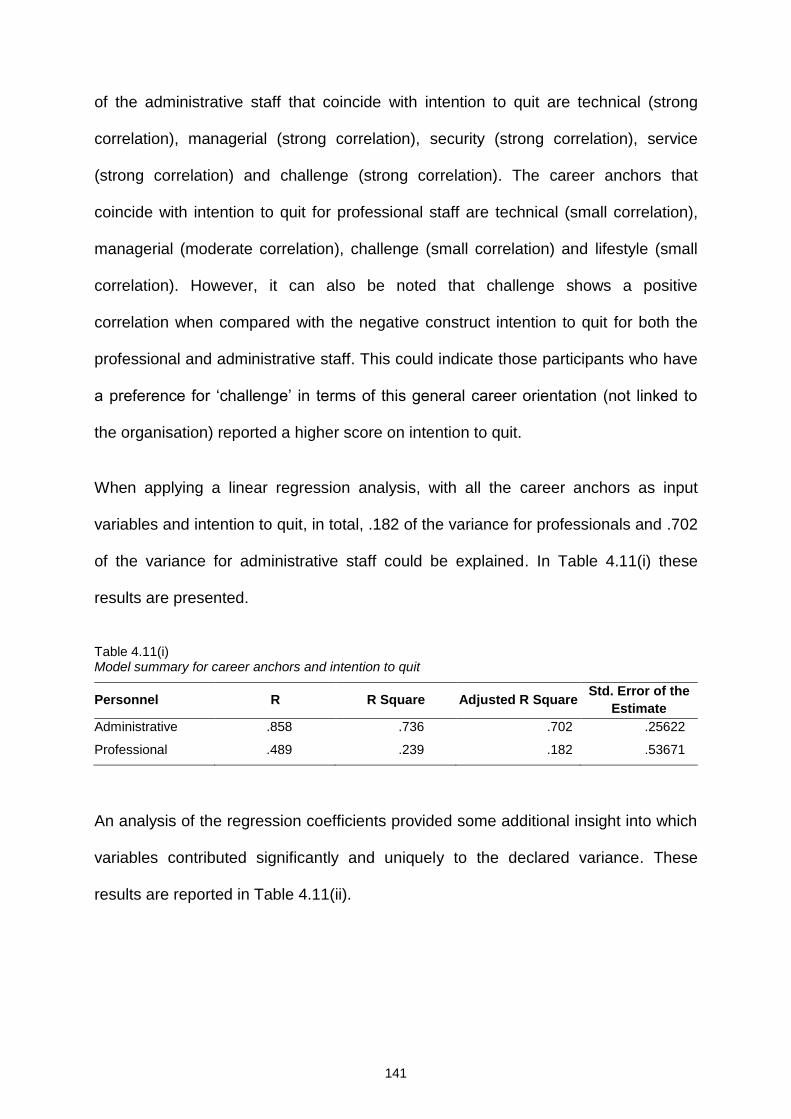
141
of the administrative staff that coincide with intention to quit are technical (strong
correlation), managerial (strong correlation), security (strong correlation), service
(strong correlation) and challenge (strong correlation). The career anchors that
coincide with intention to quit for professional staff are technical (small correlation),
managerial (moderate correlation), challenge (small correlation) and lifestyle (small
correlation). However, it can also be noted that challenge shows a positive
correlation when compared with the negative construct intention to quit for both the
professional and administrative staff. This could indicate those participants who have
a preference for ‘challenge’ in terms of this general career orientation (not linked to
the organisation) reported a higher score on intention to quit.
When applying a linear regression analysis, with all the career anchors as input
variables and intention to quit, in total, .182 of the variance for professionals and .702
of the variance for administrative staff could be explained. In Table 4.11(i) these
results are presented.
Table 4.11(i) Model summary for career anchors and intention to quit
Personnel R R Square Adjusted R Square Std. Error of the
Estimate
Administrative .858 .736 .702 .25622
Professional .489 .239 .182 .53671
An analysis of the regression coefficients provided some additional insight into which
variables contributed significantly and uniquely to the declared variance. These
results are reported in Table 4.11(ii).
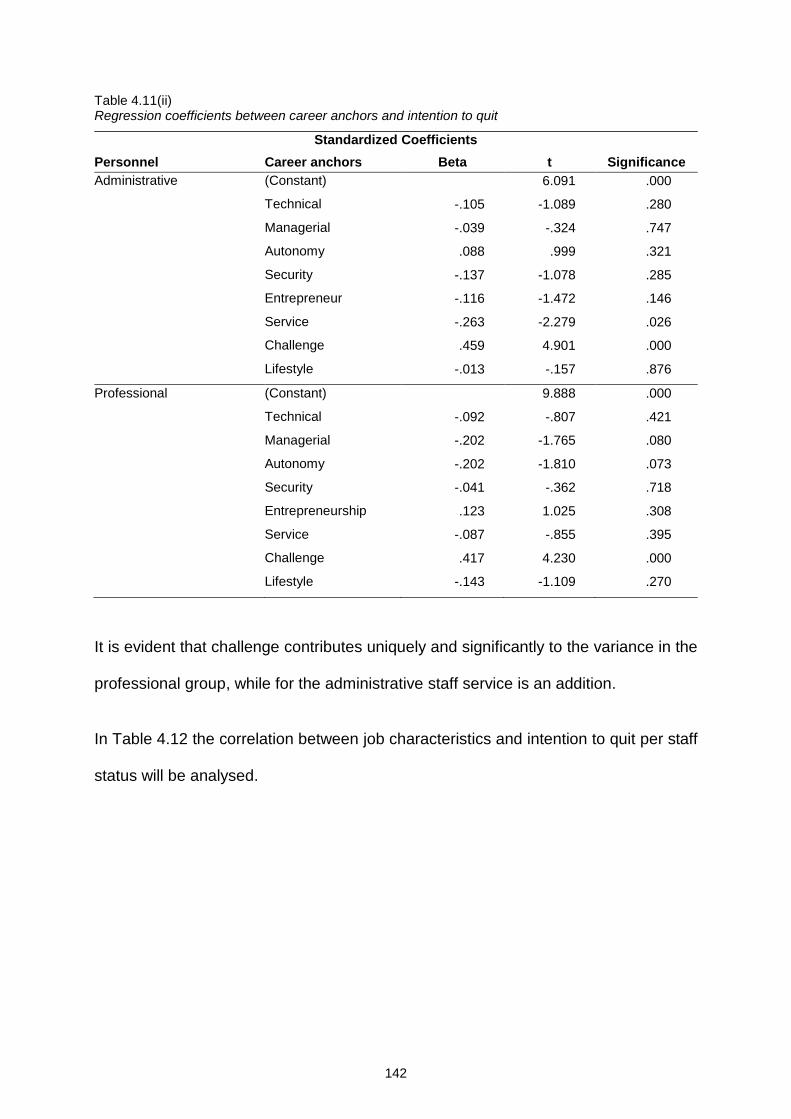
142
Table 4.11(ii) Regression coefficients between career anchors and intention to quit
Standardized Coefficients
Personnel Career anchors Beta t Significance
Administrative (Constant) 6.091 .000
Technical -.105 -1.089 .280
Managerial -.039 -.324 .747
Autonomy .088 .999 .321
Security -.137 -1.078 .285
Entrepreneur -.116 -1.472 .146
Service -.263 -2.279 .026
Challenge .459 4.901 .000
Lifestyle -.013 -.157 .876
Professional (Constant) 9.888 .000
Technical -.092 -.807 .421
Managerial -.202 -1.765 .080
Autonomy -.202 -1.810 .073
Security -.041 -.362 .718
Entrepreneurship .123 1.025 .308
Service -.087 -.855 .395
Challenge .417 4.230 .000
Lifestyle -.143 -1.109 .270
It is evident that challenge contributes uniquely and significantly to the variance in the
professional group, while for the administrative staff service is an addition.
In Table 4.12 the correlation between job characteristics and intention to quit per staff
status will be analysed.
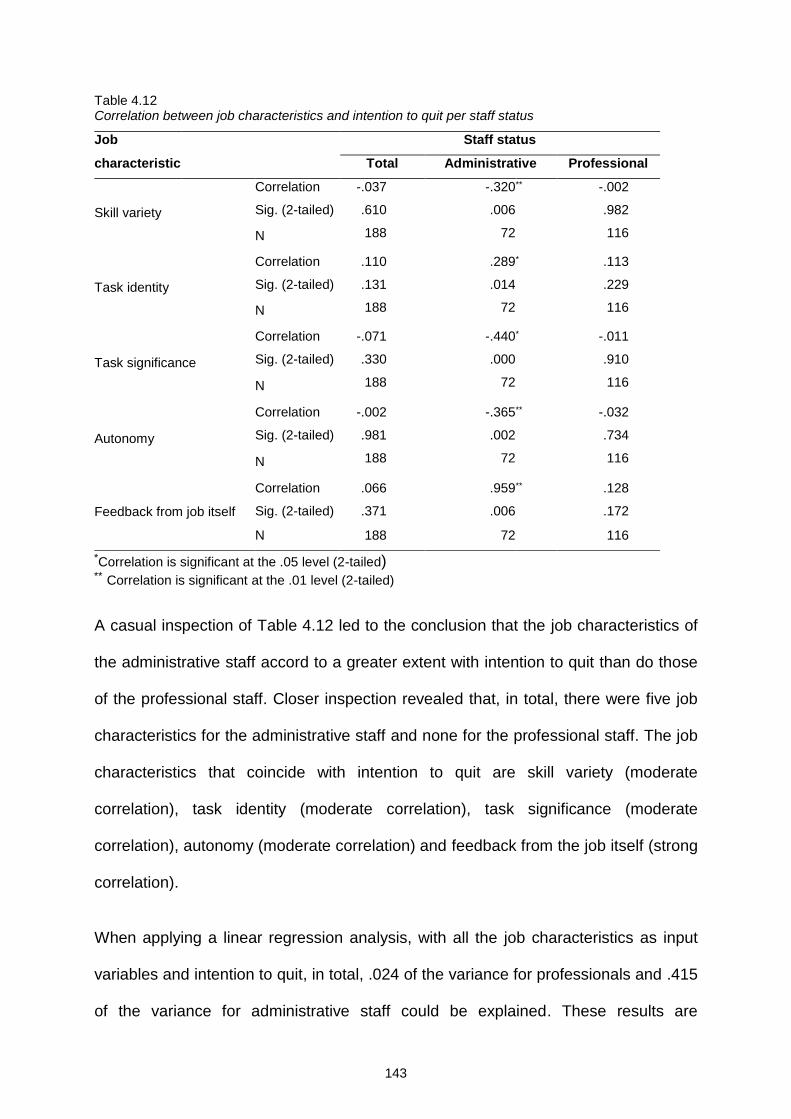
143
Table 4.12 Correlation between job characteristics and intention to quit per staff status
Job Staff status
characteristic Total Administrative Professional
Skill variety
Correlation -.037 -.320 ** -.002
Sig. (2-tailed) .610 .006 .982
N 188 72 116
Task identity
Correlation .110 .289 * .113
Sig. (2-tailed) .131 .014 .229
N 188 72 116
Task significance
Correlation -.071 -.440 * -.011
Sig. (2-tailed) .330 .000 .910
N 188 72 116
Autonomy
Correlation -.002 -.365 ** -.032
Sig. (2-tailed) .981 .002 .734
N 188 72 116
Feedback from job itself
Correlation .066 .959 ** .128
Sig. (2-tailed) .371 .006 .172
N 188 72 116
A casual inspection of Table 4.12 led to the conclusion that the job characteristics of
the administrative staff accord to a greater extent with intention to quit than do those
of the professional staff. Closer inspection revealed that, in total, there were five job
characteristics for the administrative staff and none for the professional staff. The job
characteristics that coincide with intention to quit are skill variety (moderate
correlation), task identity (moderate correlation), task significance (moderate
correlation), autonomy (moderate correlation) and feedback from the job itself (strong
correlation).
When applying a linear regression analysis, with all the job characteristics as input
variables and intention to quit, in total, .024 of the variance for professionals and .415
of the variance for administrative staff could be explained. These results are
*Correlation is significant at the .05 level (2-tailed) ** Correlation is significant at the .01 level (2-tailed)
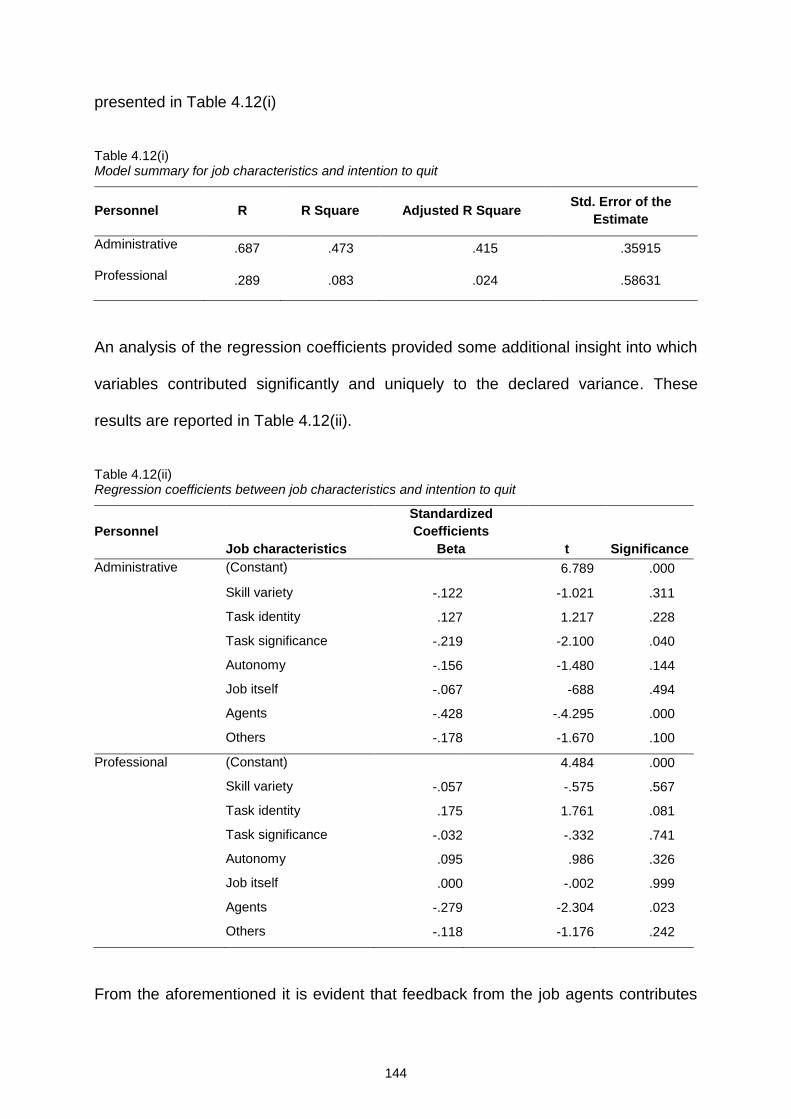
144
presented in Table 4.12(i)
Table 4.12(i) Model summary for job characteristics and intention to quit
Personnel R R Square Adjusted R Square Std. Error of the
Estimate
Administrative .687 .473 .415 .35915
Professional .289 .083 .024 .58631
An analysis of the regression coefficients provided some additional insight into which
variables contributed significantly and uniquely to the declared variance. These
results are reported in Table 4.12(ii).
Table 4.12(ii) Regression coefficients between job characteristics and intention to quit
Personnel
Standardized
Coefficients
Job characteristics Beta t Significance
Administrative (Constant) 6.789 .000
Skill variety -.122 -1.021 .311
Task identity .127 1.217 .228
Task significance -.219 -2.100 .040
Autonomy -.156 -1.480 .144
Job itself -.067 -688 .494
Agents -.428 -.4.295 .000
Others -.178 -1.670 .100
Professional (Constant) 4.484 .000
Skill variety -.057 -.575 .567
Task identity .175 1.761 .081
Task significance -.032 -.332 .741
Autonomy .095 .986 .326
Job itself .000 -.002 .999
Agents -.279 -2.304 .023
Others -.118 -1.176 .242
From the aforementioned it is evident that feedback from the job agents contributes
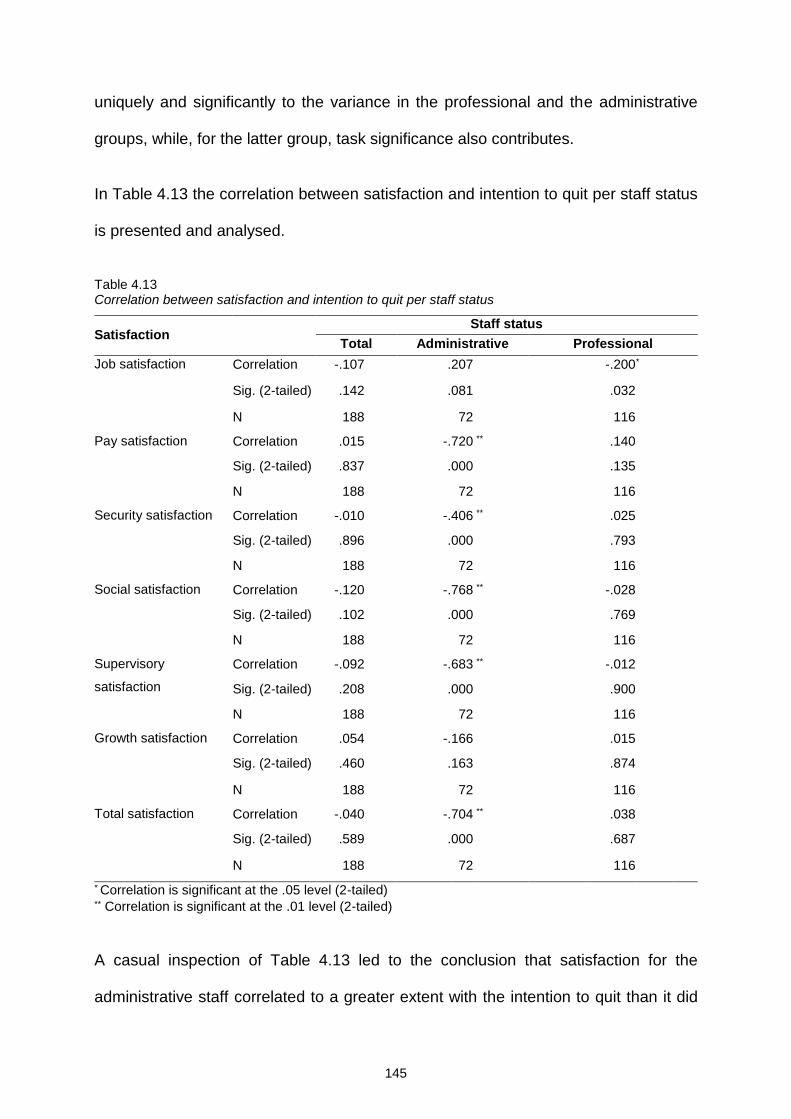
145
uniquely and significantly to the variance in the professional and the administrative
groups, while, for the latter group, task significance also contributes.
In Table 4.13 the correlation between satisfaction and intention to quit per staff status
is presented and analysed.
Table 4.13 Correlation between satisfaction and intention to quit per staff status
Satisfaction Staff status
Total Administrative Professional
Job satisfaction Correlation -.107 .207 -.200 *
Sig. (2-tailed) .142 .081 .032
N 188 72 116
Pay satisfaction Correlation .015 -.720 ** .140
Sig. (2-tailed) .837 .000 .135
N 188 72 116
Security satisfaction Correlation -.010 -.406 ** .025
Sig. (2-tailed) .896 .000 .793
N 188 72 116
Social satisfaction Correlation -.120 -.768 ** -.028
Sig. (2-tailed) .102 .000 .769
N 188 72 116
Supervisory
satisfaction
Correlation -.092 -.683 ** -.012
Sig. (2-tailed) .208 .000 .900
N 188 72 116
Growth satisfaction Correlation .054 -.166 .015
Sig. (2-tailed) .460 .163 .874
N 188 72 116
Total satisfaction Correlation -.040 -.704 ** .038
Sig. (2-tailed) .589 .000 .687
N 188 72 116
* Correlation is significant at the .05 level (2-tailed)
** Correlation is significant at the .01 level (2-tailed)
A casual inspection of Table 4.13 led to the conclusion that satisfaction for the
administrative staff correlated to a greater extent with the intention to quit than it did
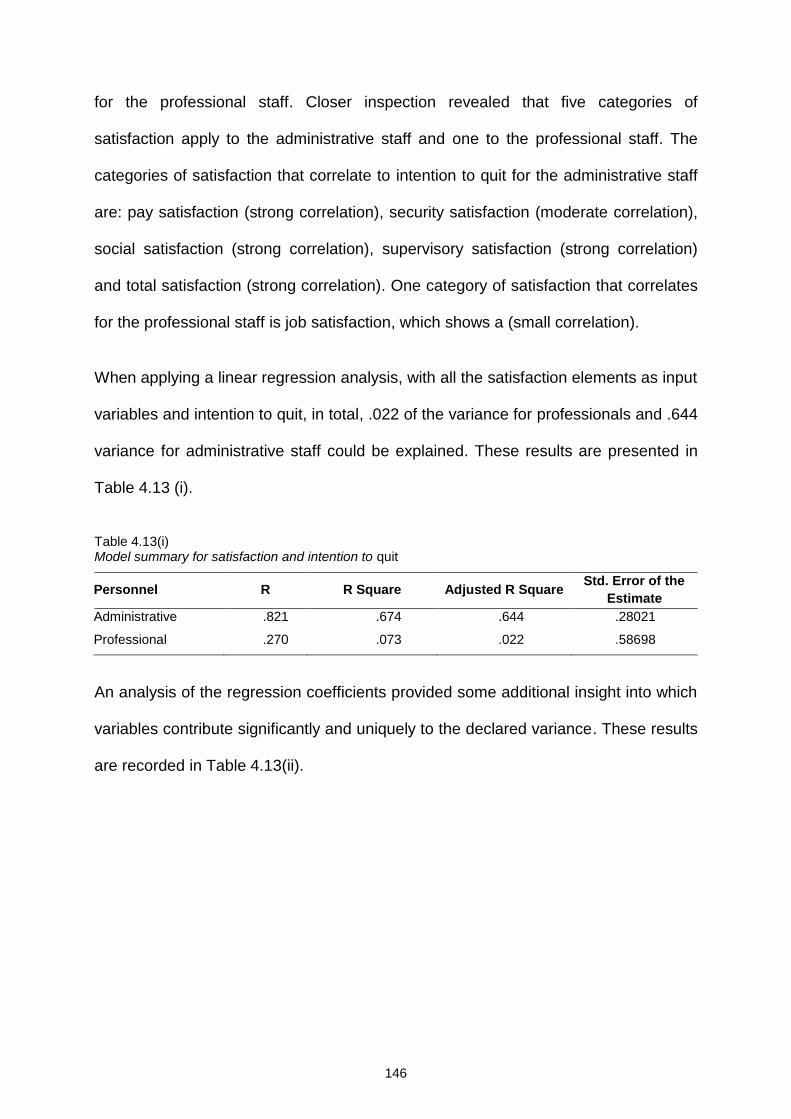
146
for the professional staff. Closer inspection revealed that five categories of
satisfaction apply to the administrative staff and one to the professional staff. The
categories of satisfaction that correlate to intention to quit for the administrative staff
are: pay satisfaction (strong correlation), security satisfaction (moderate correlation),
social satisfaction (strong correlation), supervisory satisfaction (strong correlation)
and total satisfaction (strong correlation). One category of satisfaction that correlates
for the professional staff is job satisfaction, which shows a (small correlation).
When applying a linear regression analysis, with all the satisfaction elements as input
variables and intention to quit, in total, .022 of the variance for professionals and .644
variance for administrative staff could be explained. These results are presented in
Table 4.13 (i).
Table 4.13(i) Model summary for satisfaction and intention to quit
Personnel R R Square Adjusted R Square Std. Error of the
Estimate
Administrative .821 .674 .644 .28021
Professional .270 .073 .022 .58698
An analysis of the regression coefficients provided some additional insight into which
variables contribute significantly and uniquely to the declared variance. These results
are recorded in Table 4.13(ii).
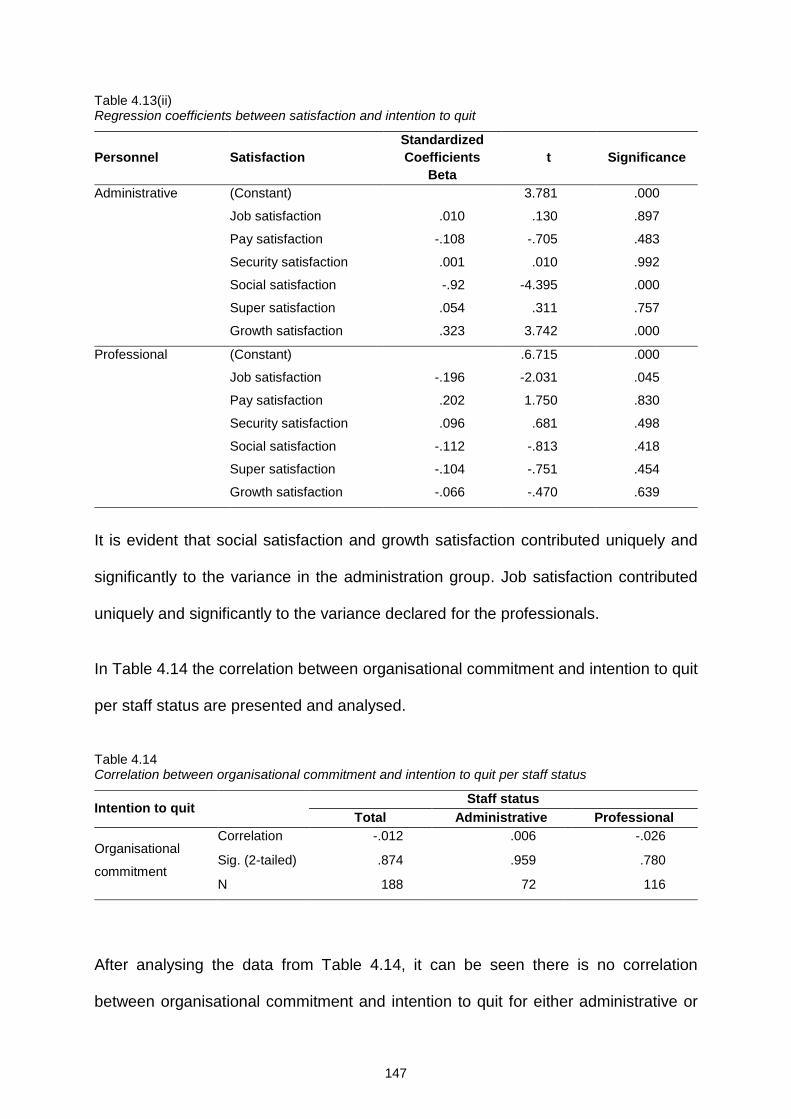
147
Table 4.13(ii) Regression coefficients between satisfaction and intention to quit
Personnel Satisfaction
Standardized
Coefficients t Significance
Beta
Administrative (Constant) 3.781 .000
Job satisfaction .010 .130 .897
Pay satisfaction -.108 -.705 .483
Security satisfaction .001 .010 .992
Social satisfaction -.92 -4.395 .000
Super satisfaction .054 .311 .757
Growth satisfaction .323 3.742 .000
Professional (Constant) .6.715 .000
Job satisfaction -.196 -2.031 .045
Pay satisfaction .202 1.750 .830
Security satisfaction .096 .681 .498
Social satisfaction -.112 -.813 .418
Super satisfaction -.104 -.751 .454
Growth satisfaction -.066 -.470 .639
It is evident that social satisfaction and growth satisfaction contributed uniquely and
significantly to the variance in the administration group. Job satisfaction contributed
uniquely and significantly to the variance declared for the professionals.
In Table 4.14 the correlation between organisational commitment and intention to quit
per staff status are presented and analysed.
Table 4.14 Correlation between organisational commitment and intention to quit per staff status
Intention to quit Staff status
Total Administrative Professional
Organisational
commitment
Correlation -.012 .006 -.026
Sig. (2-tailed) .874 .959 .780
N 188 72 116
After analysing the data from Table 4.14, it can be seen there is no correlation
between organisational commitment and intention to quit for either administrative or
148
professional staff.
4.2.4 Correlation between predictor variables and organisational commitment
In this section, the results pertaining to the first two empirical objectives are
presented. First, the results for the correlation between career anchors and
organisational commitment are presented. This is followed by the results pertaining
to job characteristics and, lastly the correlation between satisfaction and
organisational commitment is discussed.
In Table 4.15, the correlation between career anchors and organisational
commitment per staff status is presented and analysed.
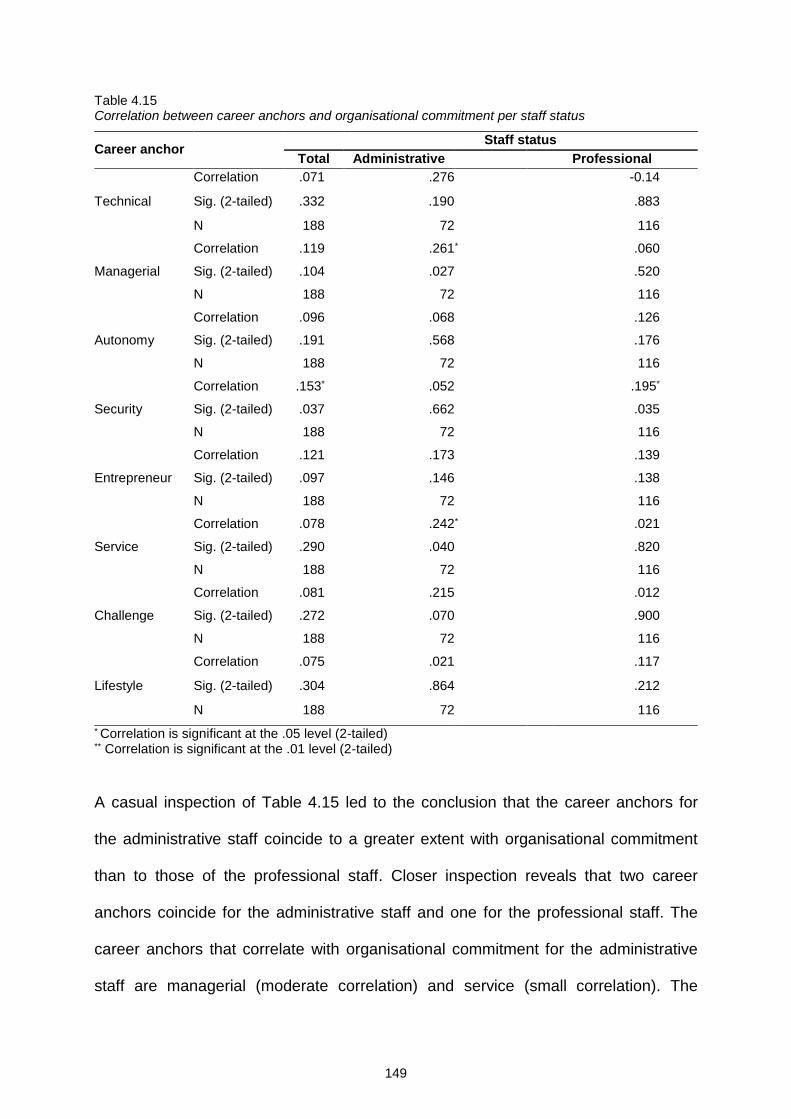
149
Table 4.15 Correlation between career anchors and organisational commitment per staff status
Career anchor Staff status
Total Administrative Professional
Technical
Correlation .071 .276 -0.14
Sig. (2-tailed) .332 .190 .883
N 188 72 116
Managerial
Correlation .119 .261 * .060
Sig. (2-tailed) .104 .027 .520
N 188 72 116
Autonomy
Correlation .096 .068 .126
Sig. (2-tailed) .191 .568 .176
N 188 72 116
Security
Correlation .153* .052 .195*
Sig. (2-tailed) .037 .662 .035
N 188 72 116
Entrepreneur
Correlation .121 .173 .139
Sig. (2-tailed) .097 .146 .138
N 188 72 116
Service
Correlation .078 .242 * .021
Sig. (2-tailed) .290 .040 .820
N 188 72 116
Challenge
Correlation .081 .215 .012
Sig. (2-tailed) .272 .070 .900
N 188 72 116
Lifestyle
Correlation .075 .021 .117
Sig. (2-tailed) .304 .864 .212
N 188 72 116
* Correlation is significant at the .05 level (2-tailed)
** Correlation is significant at the .01 level (2-tailed)
A casual inspection of Table 4.15 led to the conclusion that the career anchors for
the administrative staff coincide to a greater extent with organisational commitment
than to those of the professional staff. Closer inspection reveals that two career
anchors coincide for the administrative staff and one for the professional staff. The
career anchors that correlate with organisational commitment for the administrative
staff are managerial (moderate correlation) and service (small correlation). The
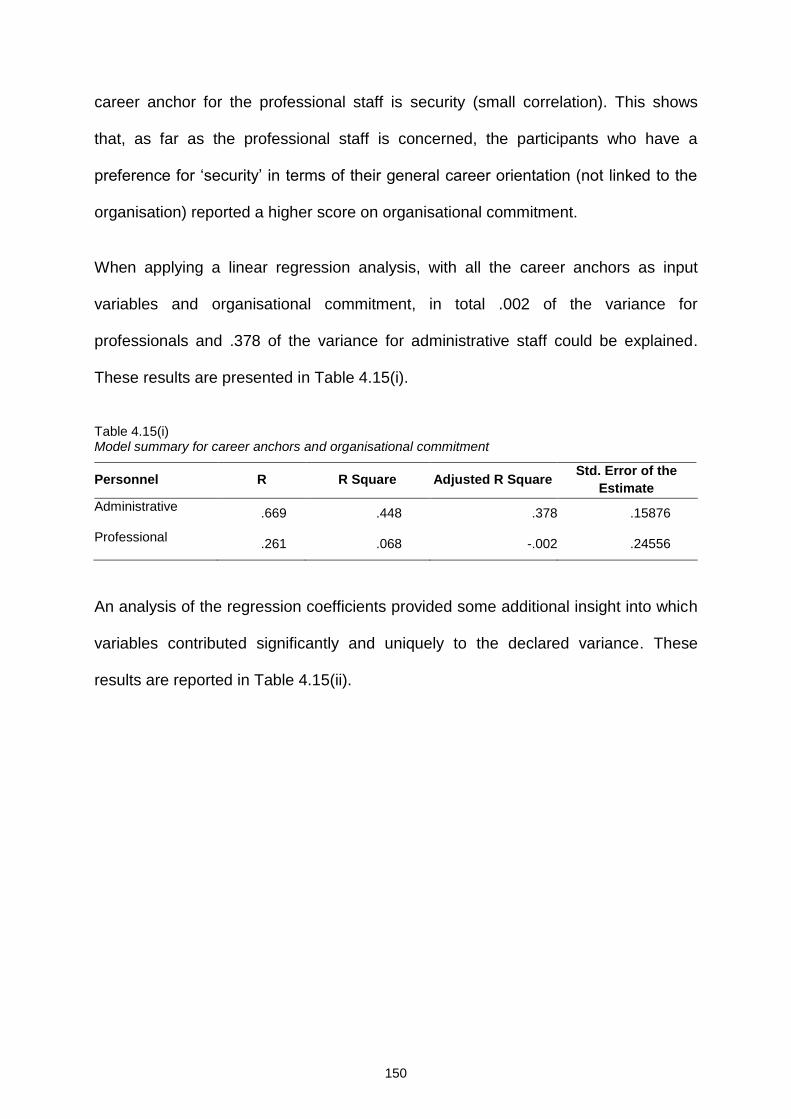
150
career anchor for the professional staff is security (small correlation). This shows
that, as far as the professional staff is concerned, the participants who have a
preference for ‘security’ in terms of their general career orientation (not linked to the
organisation) reported a higher score on organisational commitment.
When applying a linear regression analysis, with all the career anchors as input
variables and organisational commitment, in total .002 of the variance for
professionals and .378 of the variance for administrative staff could be explained.
These results are presented in Table 4.15(i).
Table 4.15(i) Model summary for career anchors and organisational commitment
Personnel R R Square Adjusted R Square Std. Error of the
Estimate
Administrative .669 .448 .378 .15876
Professional .261 .068 -.002 .24556
An analysis of the regression coefficients provided some additional insight into which
variables contributed significantly and uniquely to the declared variance. These
results are reported in Table 4.15(ii).
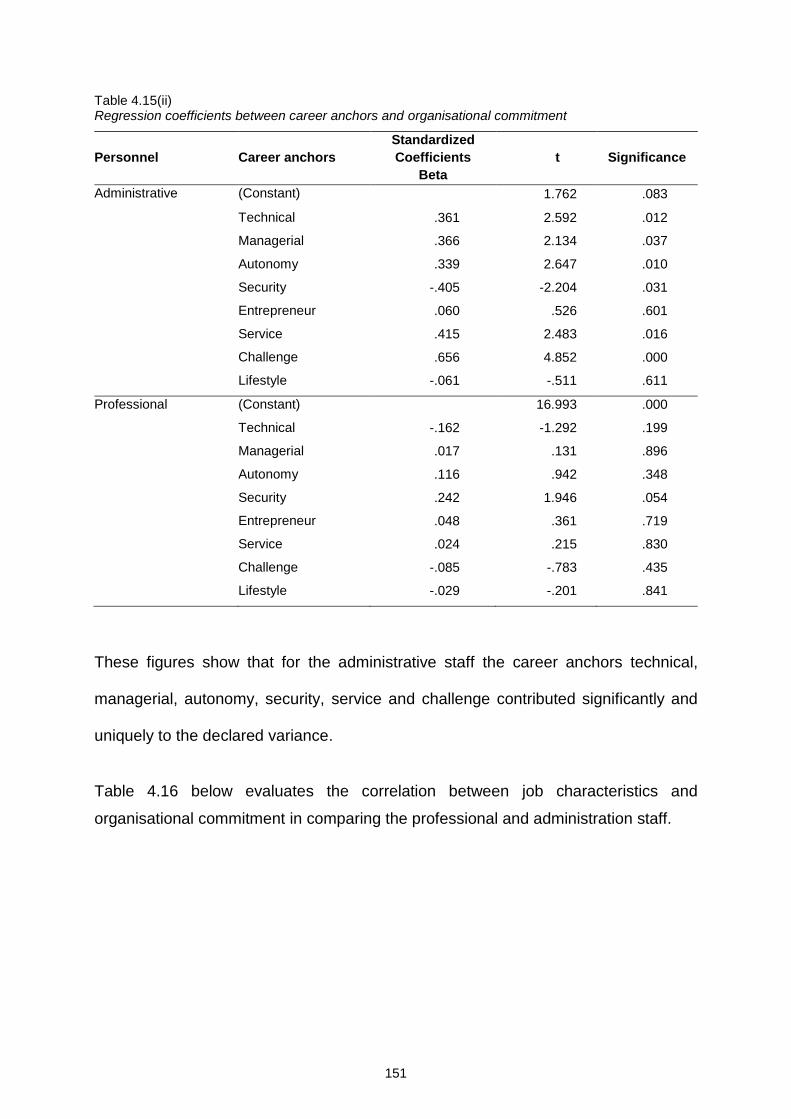
151
Table 4.15(ii) Regression coefficients between career anchors and organisational commitment
Personnel Career anchors
Standardized
Coefficients t Significance
Beta
Administrative (Constant) 1.762 .083
Technical .361 2.592 .012
Managerial .366 2.134 .037
Autonomy .339 2.647 .010
Security -.405 -2.204 .031
Entrepreneur .060 .526 .601
Service .415 2.483 .016
Challenge .656 4.852 .000
Lifestyle -.061 -.511 .611
Professional (Constant) 16.993 .000
Technical -.162 -1.292 .199
Managerial .017 .131 .896
Autonomy .116 .942 .348
Security .242 1.946 .054
Entrepreneur .048 .361 .719
Service .024 .215 .830
Challenge -.085 -.783 .435
Lifestyle -.029 -.201 .841
These figures show that for the administrative staff the career anchors technical,
managerial, autonomy, security, service and challenge contributed significantly and
uniquely to the declared variance.
Table 4.16 below evaluates the correlation between job characteristics and
organisational commitment in comparing the professional and administration staff.
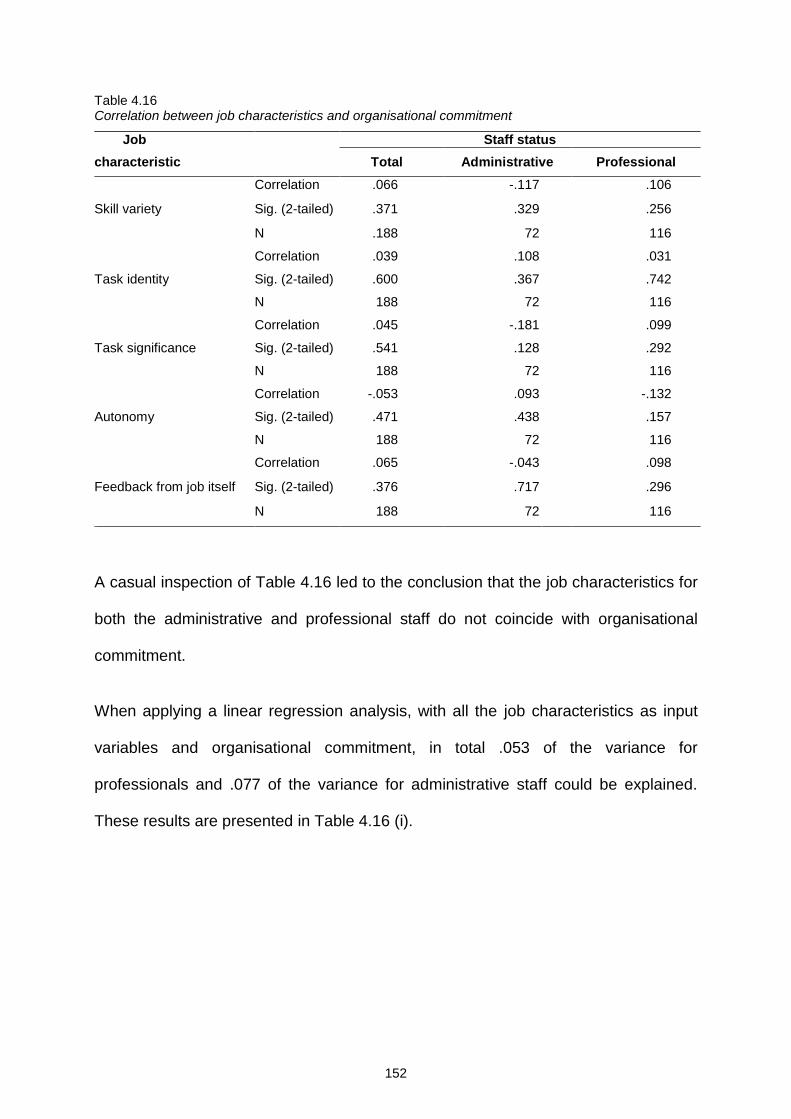
152
Table 4.16 Correlation between job characteristics and organisational commitment
Job Staff status
characteristic Total Administrative Professional
Skill variety
Correlation .066 -.117 .106
Sig. (2-tailed) .371 .329 .256
N .188 72 116
Task identity
Correlation .039 .108 .031
Sig. (2-tailed) .600 .367 .742
N 188 72 116
Task significance
Correlation .045 -.181 .099
Sig. (2-tailed) .541 .128 .292
N 188 72 116
Autonomy
Correlation -.053 .093 -.132
Sig. (2-tailed) .471 .438 .157
N 188 72 116
Feedback from job itself
Correlation .065 -.043 .098
Sig. (2-tailed) .376 .717 .296
N 188 72 116
A casual inspection of Table 4.16 led to the conclusion that the job characteristics for
both the administrative and professional staff do not coincide with organisational
commitment.
When applying a linear regression analysis, with all the job characteristics as input
variables and organisational commitment, in total .053 of the variance for
professionals and .077 of the variance for administrative staff could be explained.
These results are presented in Table 4.16 (i).
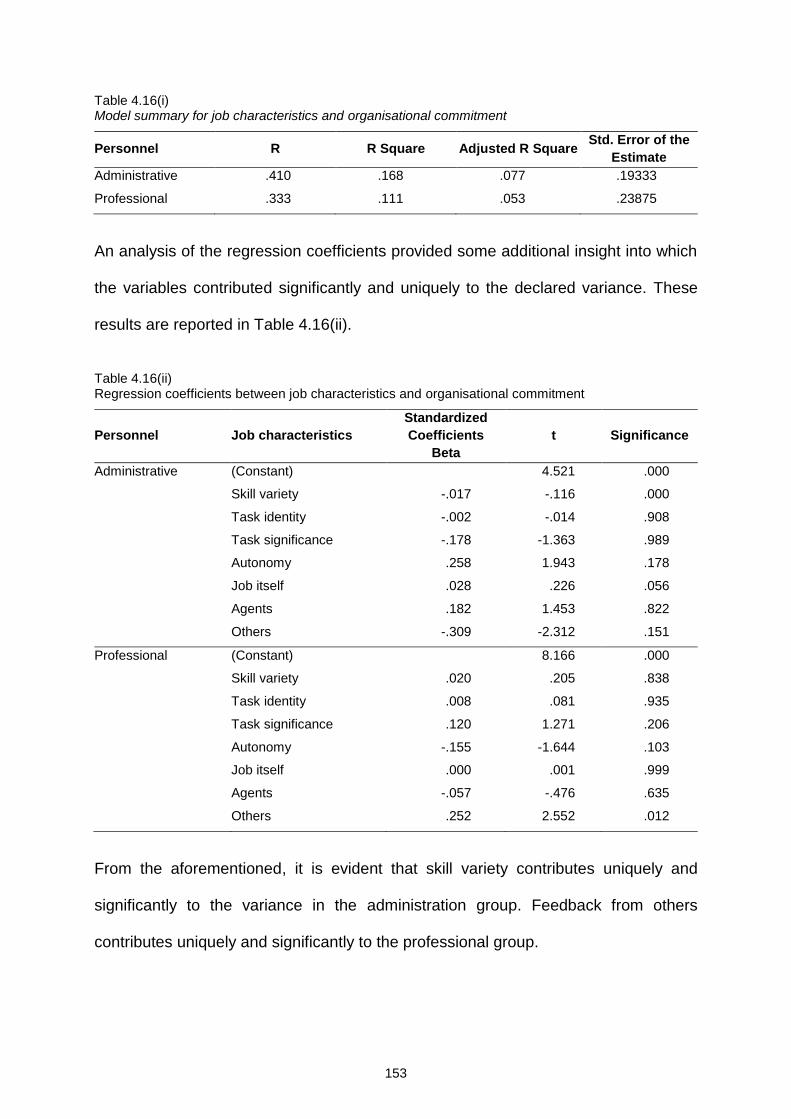
153
Table 4.16(i) Model summary for job characteristics and organisational commitment
Personnel R R Square Adjusted R Square Std. Error of the
Estimate
Administrative .410 .168 .077 .19333
Professional .333 .111 .053 .23875
An analysis of the regression coefficients provided some additional insight into which
the variables contributed significantly and uniquely to the declared variance. These
results are reported in Table 4.16(ii).
Table 4.16(ii) Regression coefficients between job characteristics and organisational commitment
Personnel Job characteristics
Standardized
Coefficients t Significance
Beta
Administrative (Constant) 4.521 .000
Skill variety -.017 -.116 .000
Task identity -.002 -.014 .908
Task significance -.178 -1.363 .989
Autonomy .258 1.943 .178
Job itself .028 .226 .056
Agents .182 1.453 .822
Others -.309 -2.312 .151
Professional (Constant) 8.166 .000
Skill variety .020 .205 .838
Task identity .008 .081 .935
Task significance .120 1.271 .206
Autonomy -.155 -1.644 .103
Job itself .000 .001 .999
Agents -.057 -.476 .635
Others .252 2.552 .012
From the aforementioned, it is evident that skill variety contributes uniquely and
significantly to the variance in the administration group. Feedback from others
contributes uniquely and significantly to the professional group.
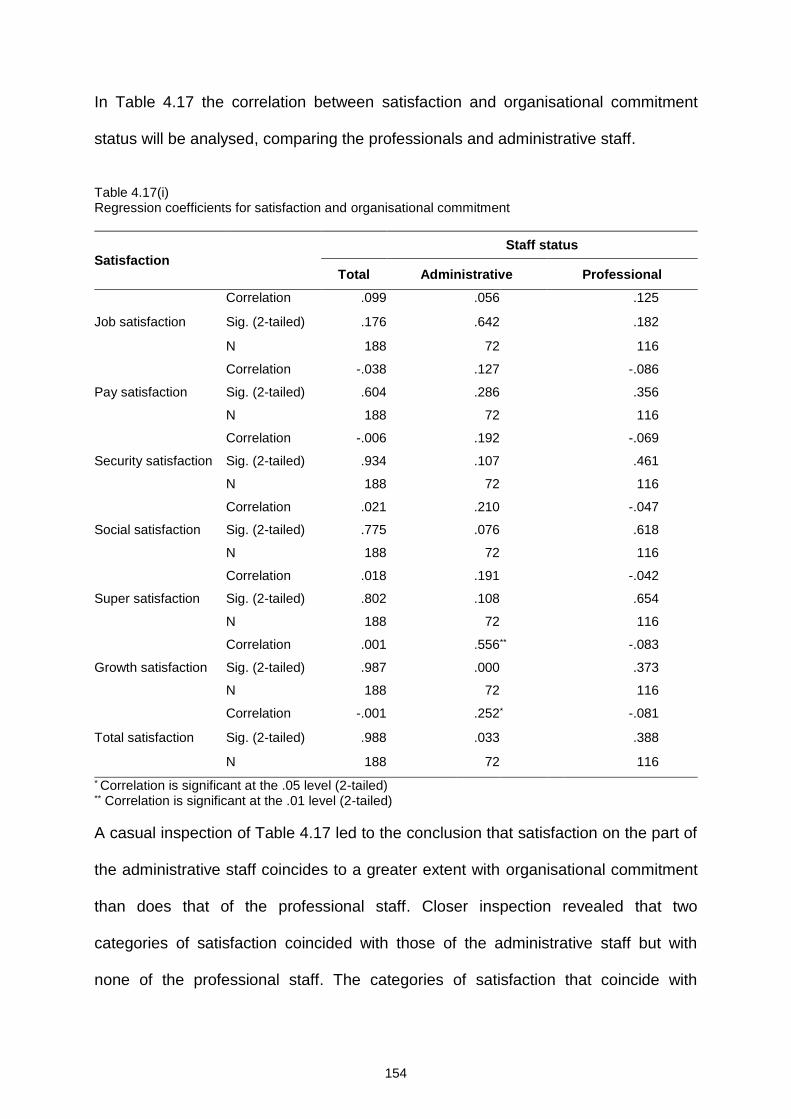
154
In Table 4.17 the correlation between satisfaction and organisational commitment
status will be analysed, comparing the professionals and administrative staff.
Table 4.17(i) Regression coefficients for satisfaction and organisational commitment
A casual inspection of Table 4.17 led to the conclusion that satisfaction on the part of
the administrative staff coincides to a greater extent with organisational commitment
than does that of the professional staff. Closer inspection revealed that two
categories of satisfaction coincided with those of the administrative staff but with
none of the professional staff. The categories of satisfaction that coincide with
Satisfaction Staff status
Total Administrative Professional
Job satisfaction
Correlation .099 .056 .125
Sig. (2-tailed) .176 .642 .182
N 188 72 116
Pay satisfaction
Correlation -.038 .127 -.086
Sig. (2-tailed) .604 .286 .356
N 188 72 116
Security satisfaction
Correlation -.006 .192 -.069
Sig. (2-tailed) .934 .107 .461
N 188 72 116
Social satisfaction
Correlation .021 .210 -.047
Sig. (2-tailed) .775 .076 .618
N 188 72 116
Super satisfaction
Correlation .018 .191 -.042
Sig. (2-tailed) .802 .108 .654
N 188 72 116
Growth satisfaction
Correlation .001 .556 ** -.083
Sig. (2-tailed) .987 .000 .373
N 188 72 116
Total satisfaction
Correlation -.001 .252 * -.081
Sig. (2-tailed) .988 .033 .388
N 188 72 116
* Correlation is significant at the .05 level (2-tailed)
** Correlation is significant at the .01 level (2-tailed)
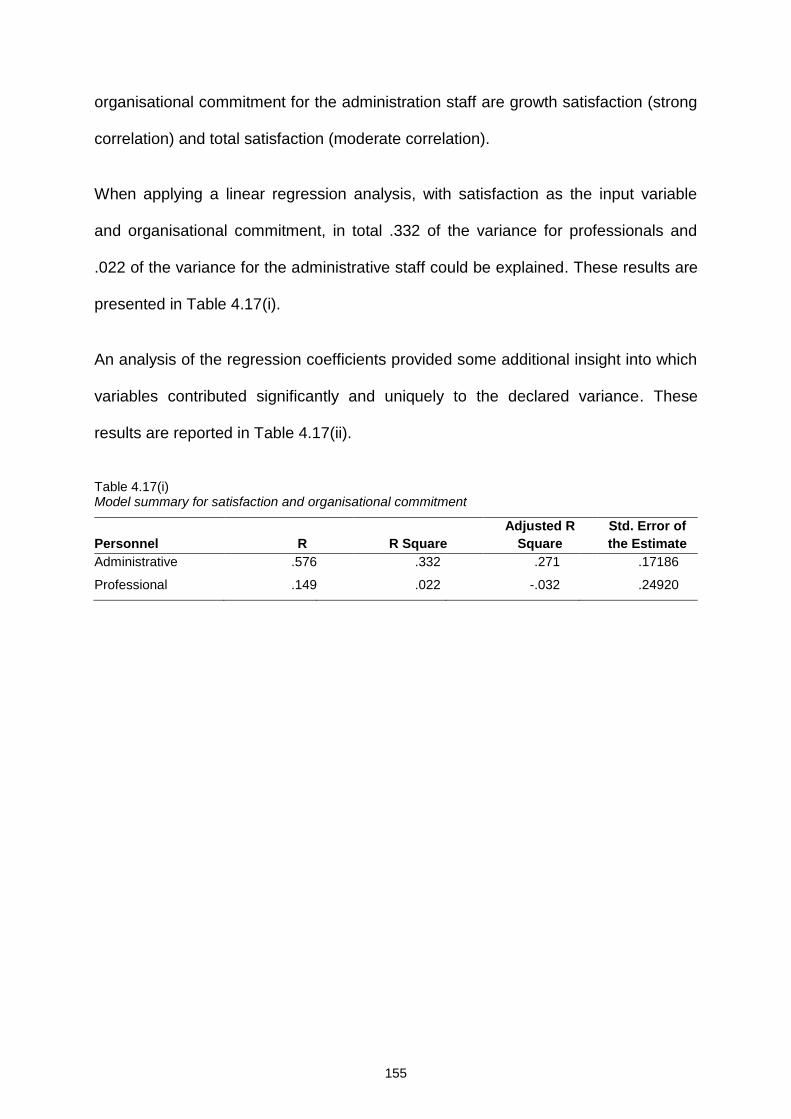
155
organisational commitment for the administration staff are growth satisfaction (strong
correlation) and total satisfaction (moderate correlation).
When applying a linear regression analysis, with satisfaction as the input variable
and organisational commitment, in total .332 of the variance for professionals and
.022 of the variance for the administrative staff could be explained. These results are
presented in Table 4.17(i).
An analysis of the regression coefficients provided some additional insight into which
variables contributed significantly and uniquely to the declared variance. These
results are reported in Table 4.17(ii).
Table 4.17(i) Model summary for satisfaction and organisational commitment
Personnel R R Square
Adjusted R
Square
Std. Error of
the Estimate
Administrative .576 .332 .271 .17186
Professional .149 .022 -.032 .24920
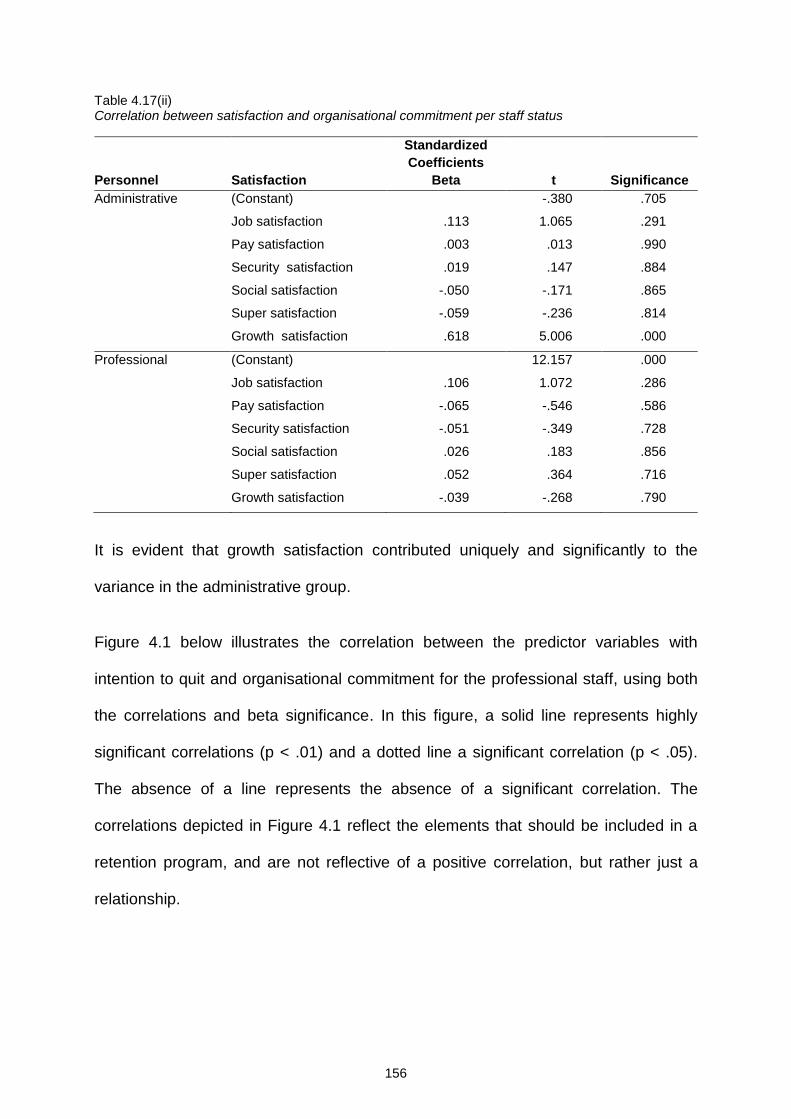
156
Table 4.17(ii) Correlation between satisfaction and organisational commitment per staff status
It is evident that growth satisfaction contributed uniquely and significantly to the
variance in the administrative group.
Figure 4.1 below illustrates the correlation between the predictor variables with
intention to quit and organisational commitment for the professional staff, using both
the correlations and beta significance. In this figure, a solid line represents highly
significant correlations (p < .01) and a dotted line a significant correlation (p < .05).
The absence of a line represents the absence of a significant correlation. The
correlations depicted in Figure 4.1 reflect the elements that should be included in a
retention program, and are not reflective of a positive correlation, but rather just a
relationship.
Standardized
Coefficients
Personnel Satisfaction Beta t Significance
Administrative (Constant) -.380 .705
Job satisfaction .113 1.065 .291
Pay satisfaction .003 .013 .990
Security satisfaction .019 .147 .884
Social satisfaction -.050 -.171 .865
Super satisfaction -.059 -.236 .814
Growth satisfaction .618 5.006 .000
Professional (Constant) 12.157 .000
Job satisfaction .106 1.072 .286
Pay satisfaction -.065 -.546 .586
Security satisfaction -.051 -.349 .728
Social satisfaction .026 .183 .856
Super satisfaction .052 .364 .716
Growth satisfaction -.039 -.268 .790
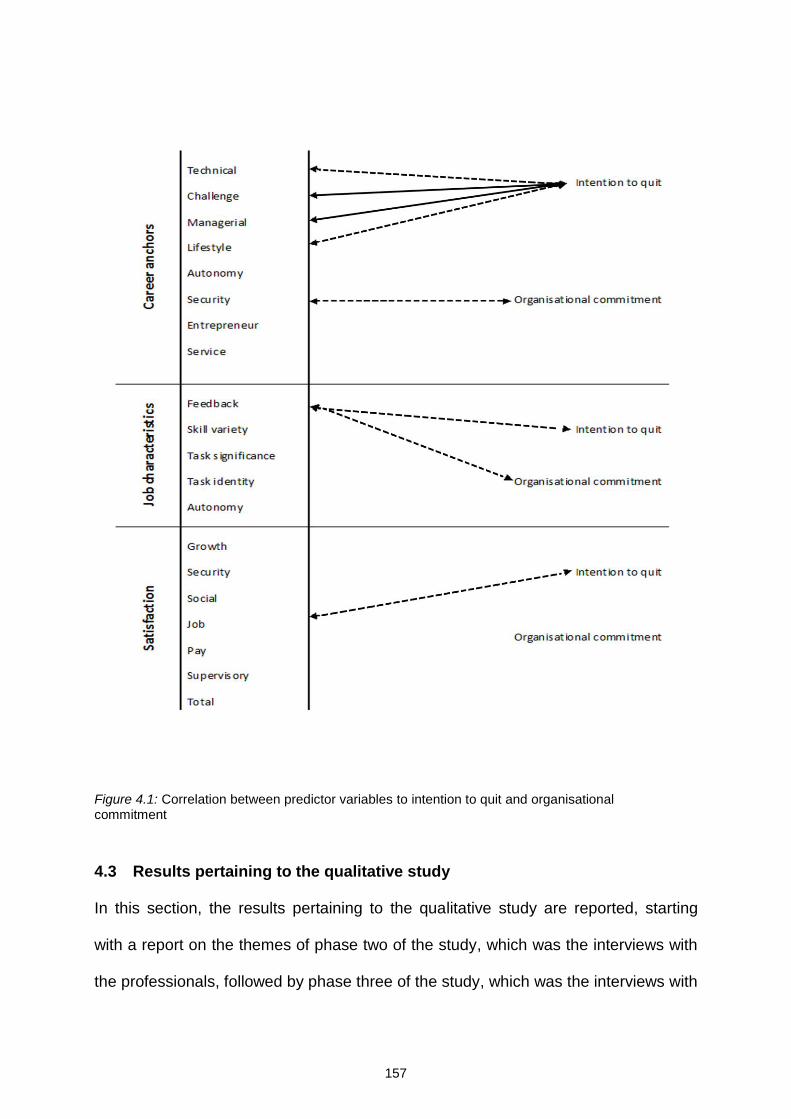
157
Figure 4.1: Correlation between predictor variables to intention to quit and organisational commitment
4.3 Results pertaining to the qualitative study
In this section, the results pertaining to the qualitative study are reported, starting
with a report on the themes of phase two of the study, which was the interviews with
the professionals, followed by phase three of the study, which was the interviews with
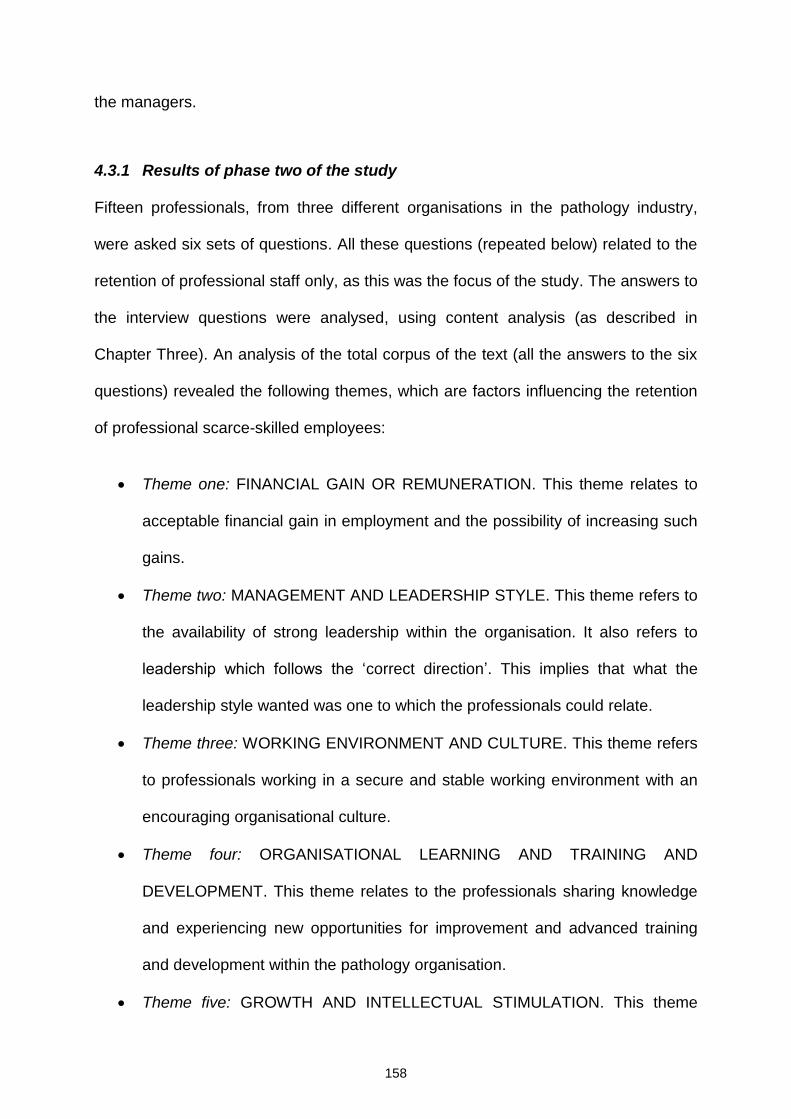
158
the managers.
4.3.1 Results of phase two of the study
Fifteen professionals, from three different organisations in the pathology industry,
were asked six sets of questions. All these questions (repeated below) related to the
retention of professional staff only, as this was the focus of the study. The answers to
the interview questions were analysed, using content analysis (as described in
Chapter Three). An analysis of the total corpus of the text (all the answers to the six
questions) revealed the following themes, which are factors influencing the retention
of professional scarce-skilled employees:
Theme one: FINANCIAL GAIN OR REMUNERATION. This theme relates to
acceptable financial gain in employment and the possibility of increasing such
gains.
Theme two: MANAGEMENT AND LEADERSHIP STYLE. This theme refers to
the availability of strong leadership within the organisation. It also refers to
leadership which follows the ‘correct direction’. This implies that what the
leadership style wanted was one to which the professionals could relate.
Theme three: WORKING ENVIRONMENT AND CULTURE. This theme refers
to professionals working in a secure and stable working environment with an
encouraging organisational culture.
Theme four: ORGANISATIONAL LEARNING AND TRAINING AND
DEVELOPMENT. This theme relates to the professionals sharing knowledge
and experiencing new opportunities for improvement and advanced training
and development within the pathology organisation.
Theme five: GROWTH AND INTELLECTUAL STIMULATION. This theme
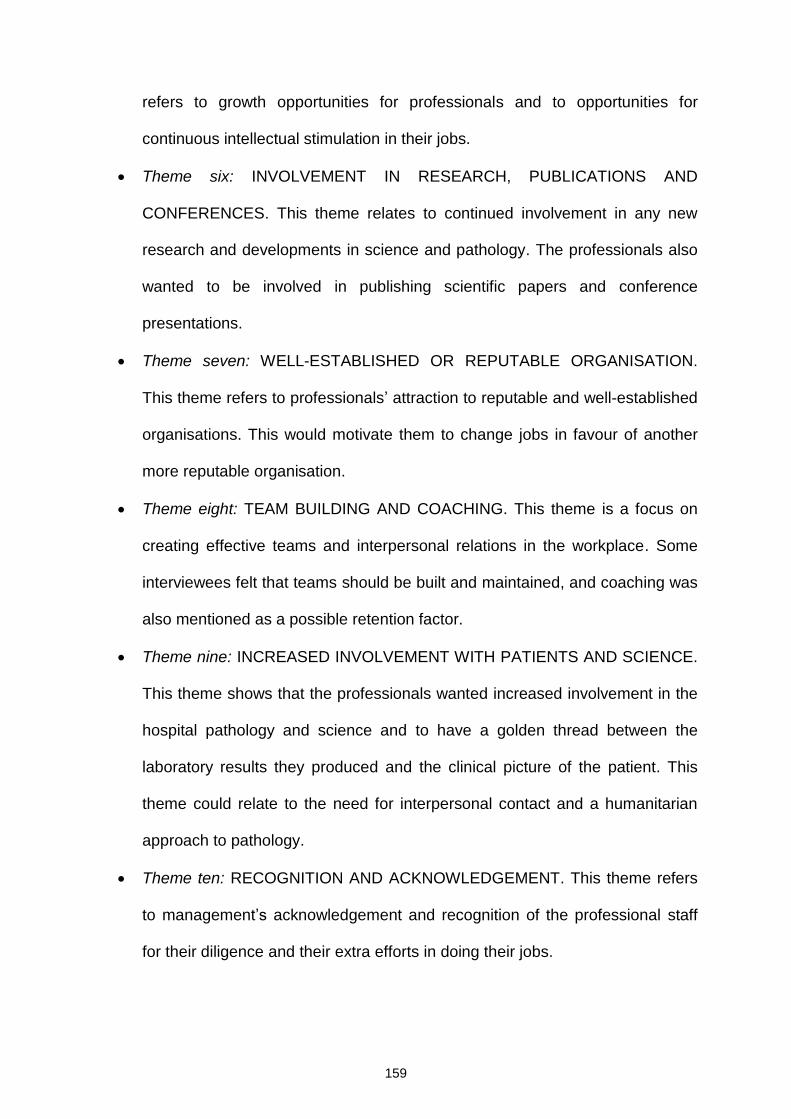
159
refers to growth opportunities for professionals and to opportunities for
continuous intellectual stimulation in their jobs.
Theme six: INVOLVEMENT IN RESEARCH, PUBLICATIONS AND
CONFERENCES. This theme relates to continued involvement in any new
research and developments in science and pathology. The professionals also
wanted to be involved in publishing scientific papers and conference
presentations.
Theme seven: WELL-ESTABLISHED OR REPUTABLE ORGANISATION.
This theme refers to professionals’ attraction to reputable and well-established
organisations. This would motivate them to change jobs in favour of another
more reputable organisation.
Theme eight: TEAM BUILDING AND COACHING. This theme is a focus on
creating effective teams and interpersonal relations in the workplace. Some
interviewees felt that teams should be built and maintained, and coaching was
also mentioned as a possible retention factor.
Theme nine: INCREASED INVOLVEMENT WITH PATIENTS AND SCIENCE.
This theme shows that the professionals wanted increased involvement in the
hospital pathology and science and to have a golden thread between the
laboratory results they produced and the clinical picture of the patient. This
theme could relate to the need for interpersonal contact and a humanitarian
approach to pathology.
Theme ten: RECOGNITION AND ACKNOWLEDGEMENT. This theme refers
to management’s acknowledgement and recognition of the professional staff
for their diligence and their extra efforts in doing their jobs.
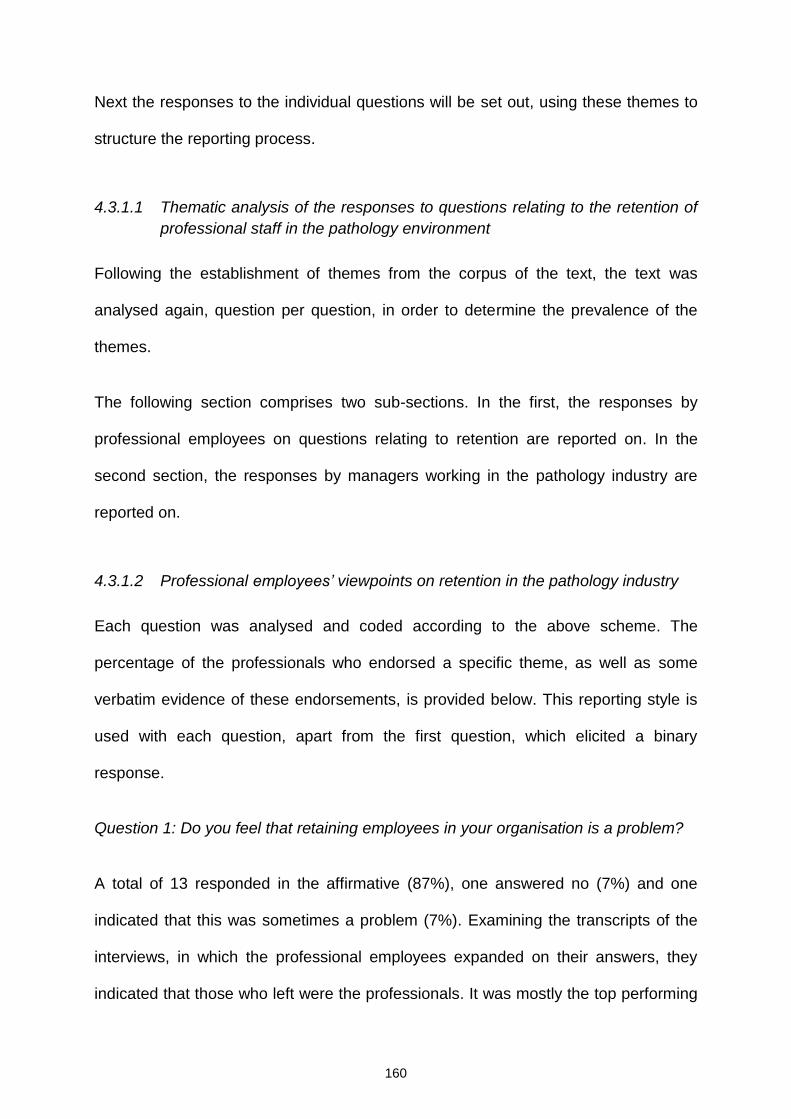
160
Next the responses to the individual questions will be set out, using these themes to
structure the reporting process.
4.3.1.1 Thematic analysis of the responses to questions relating to the retention of
professional staff in the pathology environment
Following the establishment of themes from the corpus of the text, the text was
analysed again, question per question, in order to determine the prevalence of the
themes.
The following section comprises two sub-sections. In the first, the responses by
professional employees on questions relating to retention are reported on. In the
second section, the responses by managers working in the pathology industry are
reported on.
4.3.1.2 Professional employees’ viewpoints on retention in the pathology industry
Each question was analysed and coded according to the above scheme. The
percentage of the professionals who endorsed a specific theme, as well as some
verbatim evidence of these endorsements, is provided below. This reporting style is
used with each question, apart from the first question, which elicited a binary
response.
Question 1: Do you feel that retaining employees in your organisation is a problem?
A total of 13 responded in the affirmative (87%), one answered no (7%) and one
indicated that this was sometimes a problem (7%). Examining the transcripts of the
interviews, in which the professional employees expanded on their answers, they
indicated that those who left were the professionals. It was mostly the top performing
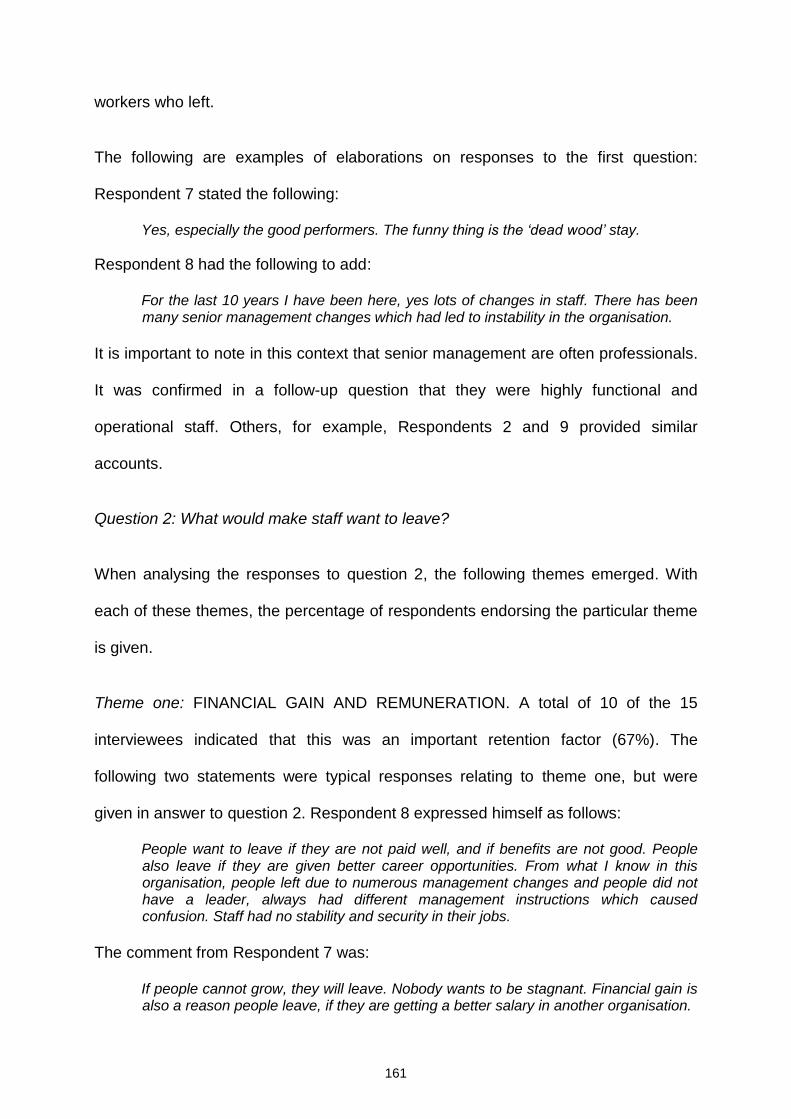
161
workers who left.
The following are examples of elaborations on responses to the first question:
Respondent 7 stated the following:
Yes, especially the good performers. The funny thing is the ‘dead wood’ stay.
Respondent 8 had the following to add:
For the last 10 years I have been here, yes lots of changes in staff. There has been many senior management changes which had led to instability in the organisation.
It is important to note in this context that senior management are often professionals.
It was confirmed in a follow-up question that they were highly functional and
operational staff. Others, for example, Respondents 2 and 9 provided similar
accounts.
Question 2: What would make staff want to leave?
When analysing the responses to question 2, the following themes emerged. With
each of these themes, the percentage of respondents endorsing the particular theme
is given.
Theme one: FINANCIAL GAIN AND REMUNERATION. A total of 10 of the 15
interviewees indicated that this was an important retention factor (67%). The
following two statements were typical responses relating to theme one, but were
given in answer to question 2. Respondent 8 expressed himself as follows:
People want to leave if they are not paid well, and if benefits are not good. People also leave if they are given better career opportunities. From what I know in this organisation, people left due to numerous management changes and people did not have a leader, always had different management instructions which caused confusion. Staff had no stability and security in their jobs.
The comment from Respondent 7 was:
If people cannot grow, they will leave. Nobody wants to be stagnant. Financial gain is also a reason people leave, if they are getting a better salary in another organisation.
162
Theme two: MANAGEMENT OR LEADERSHIP STYLE. A total of ten responded,
indicating that this was an important theme relating to the retention of professionals
(67%). In the context of question 2, the respondents expressed themselves on this
theme as follows: Respondent 1 stated it very clearly:
Another reason staff will want to leave, if leaders are not adequate in their jobs and do not give direction to the staff. Staff will leave if their working environment and culture is not a pleasant one. Lack of organisational development and training is another reason staff will leave. Staff will leave if there are no growth opportunities, intellectual stimulation and if they are not acknowledged and recognized for the work they perform.
Respondent 12 went on to say further:
You know people would leave for a variety of reasons, some being their own personal reasons such as they get bored and tired of monotony and lack of excitement in the work place, as we work in a very stressful environment as we deal with patients’ lives. Other reason may be salary and benefits, or if they not happy with management styles etc.
Theme three: WORKING ENVIRONMENT AND CULTURE. Six respondents (40%)
indicated that this was important for the retention of professional staff. Respondent
14 expressed this clearly:
Staff leave if they are unhappy with working conditions such as the culture at the work place, as well as the remuneration and benefits.
Respondent 5 elaborated on this theme:
The working environment needs to be a pleasant one. We as professional staff spend most of our days at work, so need to be happy to be productive. Managers can sometimes be tough and not listen to staff which can make them leave.
Theme four: ORGANISATIONAL LEARNING AND TRAINING AND
DEVELOPMENT. A total of three respondents (20%) replied to this. Respondent 15
expressed the view that:
The staff that left, I asked them why would they leave, and the main reason for most was ‘they get bought out’, that is, better pay and benefits that look attractive. Others left as they felt there was a lack of organisational learning and sharing of information. They felt that some staff with lots of knowledge are selfish and keep it to themselves,
163
and when they ask questions they get told they ‘stupid.
Respondent 13 stated:
People like to feel like they belong to an organisation and they need to be involved in training and they need to be developed. Training in the pathology field is of utmost importance as they are different processes etc. If they are not trained they can make errors and lose confidence, and then they will be reprimanded by management. They will leave if they do not feel part of the organisation.
Theme five: GROWTH AND INTELLECTUAL STIMULATION.
Three people responded (20%). Respondent 2 said:
Leadership is one of the reasons, and lack of intellectual stimulation and growth opportunities. We want to be able to get promoted and grow to become managers. We don’t want to be stagnant, as that is what happens in the laboratory environment.
Respondent 9 stated:
Staff will leave if not given growth opportunities. They want to be promoted and get a better salary, incentives, bonuses and good benefits. Also if they are not recognised in their field of expertise can make them feel unappreciated.
Theme ten: RECOGNITION AND ACKNOWLEDGEMENT. This was also found to be
significant for question 2, and four respondents agreed with this (27%). Respondent
3 said:
Unhappy with style of management, no acknowledgement of good work.
Respondent 1 stated:
Staff leave if working conditions, pay and fringe benefits are poor, if there is a bad manager, and lastly the managers need to at least acknowledge us as professionals.
The findings suggest that one of the primary reasons for staff leaving is that there is
insufficient financial gain and remuneration. Respondent 4 stated:
Should leaders have a poor leadership attitude and not value staff will make them want to leave. Also if they have less benefits and an unhappy environment.
164
The management and leadership style in the organisation is seen to be as important,
as financial gain and remuneration, with an equal number of endorsements. In
somewhat different words, Respondent 11 stated that:
From speaking to people that are unhappy, main reasons would be the working environment and the other staff that do not pull the weight. Also if the manager does not notice that some staff members are carrying others it can prove to be frustrating.
Of lesser importance, with 40% of respondents referring to the theme, was the role
the working environment and culture played in retention. Respondent 10 elaborated
on this by stating:
Staff would leave if they not happy with their work environment, and if they are unhappy with the way they are treated by management. Salary and benefits will also be a reason to leave. No intellectual stimulation will also make people leave.
Question 3: What would make you want to leave?
The following themes emerged from question 3. Each will be discussed in relation to
the responses.
Theme one: FINANCIAL GAIN AND REMUNERATION. Five interviewees responded
(33%). Respondent 9 stated concisely:
More money, better benefits I would leave for, and if I get growth opportunities.
Respondent 3 went on to add:
Style of management and lack of proper financial remuneration. We need to be remunerated for the type of work we do, if professionals have similar salaries to the administration staff it will upset them and they will leave.
Theme two: MANAGEMENT, LEADERSHIP STYLE. Seven respondents stated that
they would leave because of poor leadership (47%). In relation to this theme,
Respondents 10 and 12 gave feedback for the questions. Expressed differently in
straightforward terms, Respondent 12 said:
I would leave if my manager has an autocratic leadership style, and if my manager
165
does not reward me for the extra effort I put in. I need to be acknowledged for the stressful environment I work in. If I get a better salary offer with better benefits and opportunities for career advancement I will also leave.
Respondent 4 further elaborated on this theme by saying:
I would leave if I do not have a leader or manager that knows what they are doing. In this environment you must have a leader who knows their science and knows how to handle human resources as well, and treat staff like human beings. Other reason I will stay if the leader provides a positive and ethical working environment.
Theme three: WORKING ENVIRONMENT AND CULTURE. Six out of the 15
respondents felt that if the culture and environment were not conducive to their
satisfaction, they would leave (40%). Relating to this theme, Respondent 6 stated:
I would leave if I am not happy with the working environment and people around me. It is a very stressful line of work as it is and if others you work with are not friendly and hard working as well it can be annoying as you have to do all the work. Management will also be a reason I would leave, as sometimes I am not acknowledged and just treated like a ‘cog in the wheel’.
Respondent 4 shared similar thoughts on this theme as stated above.
Theme four: ORGANISATIONAL LEARNING AND TRAINING AND
DEVELOPMENT. Three professionals responded to this (20%), Respondent 2
expressed views on this theme quite intensely:
Managers also need to ensure there is training and development. I believe in organisational learning, I train my staff everyday with the external quality control results, and they learn and there is knowledge sharing. Other aspects are staff are not happy with the style of management and they sometimes get no acknowledgement.
Respondent 5 stated:
I would leave if there is no training and teaching in the organisation, as staff need to be able to grow in their positions and the only way to do so is if there is things such as mentoring coaching and knowledge sharing. I will also leave as stated above if I do not get a chance to grow and get promoted.
Theme five: GROWTH AND INTELLECTUAL STIMULATION. A total of three out of
15 respondents referred to this theme in answer to this question (20%). Referring to

166
this theme, Respondent 7 said:
I would leave if an offer must surpass my present gains with reasonable future prospects. If I have an opportunity to grow in a new organisation and learn new things will also make me want to leave.
Respondent 5 shared a similar view on this theme.
Theme six: INVOLVEMENT IN RESEARCH, PUBLICATIONS, AND
CONFERENCES. Three respondents felt this theme was important in retention
(20%). Respondent 8 stated the following:
I am a very dedicated employee, I would only leave if I’m offered a research post to learn and grow more and publish articles get involved with funders and the clinical trial sites etc.
Respondent 10 shared the same views about this theme.
Theme nine: INCREASED INVOLVEMENT WITH PATIENTS AND SCIENCE. Three
of the 15 respondents felt that these four themes were important (20%). To expand
on this theme, Respondent 15 stated:
I would leave if there are better perks, such as salary, benefits, learning opportunities; opportunities to be involved in research and train teach and learn all in one. The labs can’t be seen as just doing the testing, I would like to be involved in the hospital and case studies of very sick patients.
Respondent 10 added:
I would like being involved in the clinical aspect of pathology and not just the laboratory side. This includes involving science with the clinicians. This will also be involvement in research and interesting cases in the hospital.
Theme ten: RECOGNITION AND ACKNOWLEDGEMENT. Four respondents felt that
this was important to the retention of professionals (27%). Respondent 13
emphasized this theme by saying:
I would leave if I’m not treated fairly with regards to salary benefits as well as intrinsic and extrinsic rewards. I would leave if I’m treated as just another worker and not acknowledged by management as a specialist scarce skill.
167
Respondent 11 stated:
I would leave if I am not acknowledged in my job. I am the quality control manager, and so every day there is something different which I enjoy. I play a very important role in the lab, and sometimes just need to feel appreciated for the work that I do and extra effort I provide. I don’t mean monetary gains; I just want to feel valued as an employee sometimes. I would leave my job if it adds no value to the lab as well and to human kind.
It can be seen from the findings that professionals would leave if they had no
financial stability or if there was no leader to guide them with clear instructions.
Factors of lesser importance were the need for an encouraging working environment
in order to remain productive. Professionals would leave the organisation if it did not
provide organisational learning, training and development. Here again the importance
of management and leadership is mentioned and is very relevant to majority of the
respondents. Other themes mentioned were that the staff would leave if they did not
get growth and career opportunities.
It was stated that the lack of involvement in research, publication and conferences
would also mean that professionals would leave. Other reasons for leaving would be
the lack of involvement on the part of the laboratory with the patients’ clinical history
and with science. They would like to be involved with each patient’s case as a whole
and not just from the laboratory perspective. As a further indication of the
professionals’ reasons for leaving, Respondent 1 said briefly:
Attitude of staff, lack of communication from the manager, poor management, not getting scientifically involved with patients and results, and not feeling valued as an employee, these are common reasons I would leave. There are lots more but these will be the main ones.
Respondents 3 and 5 make similar comments on the reasons why professionals
want to leave the organisation.
Question 4: What would make staff want to stay?
168
A total of nine themes emerged from question four, including the following:
Theme one: FINANCIAL GAIN AND REMUNERATION. Four respondents agreed
that financial benefits made a difference to the retention of professionals (27%).
Respondent 9 stated:
I’m sure people will stay if the salary is good enough, and if they get great benefits.
Respondent 1 added:
Staff want to get paid well; they want medical aid benefits and scarce-skilled allowances. Financial remuneration and stability can be seen as a motivating factor for staff staying in the organisations. Other factors that will make them stay are good managers, good atmosphere and organisational learning.
Theme two: MANAGEMENT AND LEADERSHIP STYLE. This received a very high
response rate from the professionals. Twelve out of the 15 professionals felt that
strong leaders with direction and strategic input would help to retain staff (80%).
Respondent 6 expressed the following view:
Staff would want to stay if there is job satisfaction, and they are acknowledged for their efforts. Also stability in a job will make people stay. A brave and true leader is something that staff will also stay for as they will have loyalty for such a person.
Respondent 8 shared similar views and stated:
Staff would stay if there is management stability. Now we had a proper leader for the past two years, and staff have stayed. They have clear directions and feel more stable. Staff will also stay if benefits are attractive and if they have growth opportunities and learning opportunities.
Theme three: WORKING ENVIRONMENT AND CULTURE. Six respondents felt this
was important (40%). Respondent 10 stated:
Staff want a conducive working environment; they need all the tools to perform their job functions. Should this be fulfilled they will stay.
Responded 4 added:
Good leaders, stable organisation, and having a positive work ethic and environment,
169
in my department I introduced a ‘work hard play hard culture’. It proved to be positive and staff enjoyed the working environment, and I do feel staff stay because of this.
Theme four: ORGANISATIONAL LEARNING AND TRAINING AND
DEVELOPMENT. This drew three responses (20%). Respondent 15 stated:
They would stay as I mentioned above if they have good perks, and if they involved with research activities, training and development of all professionals as there is a lot to learn and this will then also link to training with the actual pathology of the patient.
Respondent 13 stated:
Staff will want to stay if they are given proper training and coaching especially regarding the scientific and clinical processes. They also need to be trained in other soft skills, time management, financial management etc. This will allow them to grow in the organisation and remain loyal. Staff also want to be recognised in the organisation and have a sense of belonging. Good salary benefits will be another reason they will stay.
Theme five: GROWTH AND INTELLECTUAL STIMULATION. Three interviewees
responded (20%). Respondent 5 stated:
Leadership is one of the reasons, and lack of intellectual stimulation and growth opportunities. We want to be able to get promoted and grow to become managers. We don’t want to be stagnant, as that is what happens in the laboratory environment.
Respondent 13 also stated similar views on this theme.
Theme six: INVOLVEMENT IN RESEARCH, PUBLICATIONS, AND
CONFERENCES. Two respondents felt it would encourage staff to stay in an
organisation (13%). Respondent 3 stated:
Staff will stay if they have clear direction by leader, incentives, if managers motivate staff by having team building sessions. Also getting involved with hospital and lab and involvement in conferences. I presented at a conference once and it made a huge difference to my morale and motivation. I actually presented a case study on the clinical link between the patient and lab and I felt it a very rewarding experience.
Theme eight: TEAM BUILDING AND COACHING. Two out of the 15 responded
(13%). Respondent 11 expressed this opinion on theme eight:
I would say staff will stay if they have fair treatment from management, are
170
recognized and have opportunities to grow. Building teams is also an important aspect to improve morale of staff.
Theme nine: INCREASED INVOLVEMENT WITH PATIENTS AND SCIENCE. There
were four responses (27%). Respondent 2 expanded on this theme by stating:
Getting involved with patients and results, knowledge base increased if they can get the chance to link the science of the patient to the clinical aspect of the patient. You know when I trained as a student I was in the hospital with the doctors when we had to do bone marrows on patients. It helped me learn so much more and enjoy my job knowing I can make a difference in that patients life. Leadership support is also imperative.
Theme ten: RECOGNITION AND ACKNOWLEDGEMENT. Four of the 15
respondents felt that these factors would help to retain staff (27%). Respondent 7
expanded on theme ten by stating:
Staff want to be treated fairly, listened to, appreciated and paid reasonably well. If management can fulfil this maybe turnover will not be so bad.
Respondent 13 stated similar views on this theme.
The findings for question 4 show that staff would stay in an organisation if they had
financial stability and good remuneration, and if they had managers and leaders who
could coach, mentor and guide them with clear strategic objectives and goals. The
management and leadership were striking in their responses, as this theme drew the
majority of the responses. Another theme mentioned that showed significance was
that the culture and working environment should remain a positive one and could
have an impact on retention. Professionals also wanted their organisation to support
continuous learning, training and development.
The other themes were mentioned but showed a lower significance. One was the
involvement in scientific research, and publications and attendance and presentation
at conferences. The other aspect was the patient management and involvement from
171
both the clinical and the laboratory perspectives. Appreciation by management and
recognition for the good work they do was also mentioned as a reason for staff
wanting to stay in an organisation. According to Respondent 12:
Staff will stay if they are acknowledged, if they have career opportunities in a department. If there is team building activities. If management can also teach and coach staff will motivate them to stay.
Respondent 14 stated:
Staff would stay if they are happy with remuneration and benefits, if they happy with managers, if they given a chance to grow in an organisation. If an organisation values an employee it will make the staff member want to stay, people are human beings with emotions and fears etc., so need to be valued and treated appropriately.
Respondents 7, 10, and 13 shared similar views, stated in different words.
Question 5: What would make you stay in the organisation?
Question 5 was asked specifically to ascertain what would make professionals stay,
and a total of eight themes were discussed.
Theme one: FINANCIAL GAIN. Three respondents stated that this would help to
retain professionals (20%). Respondent 9 said:
I would stay if my salary is a good one and I have financial perks, and if I have growth opportunities. I would also stay if I am recognised for the work I do, especially if I work a full night shift then have to still work the day when my night shift ends because someone else is off sick. Yes we get paid overtime, but a simple thank you will also be nice to hear.
Respondent 3 had a similar answer:
As I mentioned above the main thing is financial remuneration and incentives. I need to have a competitive salary and benefits for the work I perform and the shifts I work. Other factors for me are having some sort of direction by leader. As mentioned in one of the previous questions I did present at a conference, as my manager gave me the opportunity, and it did motivate me.
Theme two: MANAGEMENT AND LEADERSHIP STYLE. This yielded the majority of
the responses, eight (53%). Respondent 8 stated:
As I stated in the previous question management stability is imperative if there is management stability it makes people stay and that is why I have stayed in this
172
organisation, as we finally have a proper leader, as we have had change in management and no stability. For the first time I have been given clear leadership and strategic direction by our new manager and this has motivated me, as now I have someone that is accountable and I can go to the manager should I have any problems.
Respondent 2 commented on this theme by saying:
I would stay for two main reasons. The first is leadership as without an effective leader none of the other factors can get fulfilled. The leader will need to understand the reason that will retain staff and work with staff to keep them. The second reason as I stated in the question prior to this is to get involved with patients and results, and increasing my knowledge base with the clinical and lab aspect.
Theme three: WORKING ENVIRONMENT AND CULTURE. This drew two out of 15
responses (13%). Respondent 14 stated:
The environment that I work needs to be a productive one, were people work hard and smart. For me this is of utmost importance as we as professionals in the pathology field spend most of our time at work. I would want my working environment to be a positive one to counteract the negative, as we deal with sick and dying patients every day. Other factors I would stay for is if I am remunerated fairly, and if my benefits are good. I will also stay if I am treated as a valuable asset by my employer.
Theme four: ORGANISATIONAL LEARNING AND TRAINING AND
DEVELOPMENT. This drew seven responses (47%). Respondent 5 stated:
Good leadership and guidance, training and team building. Getting involved with the doctors and nurses together with lab- has cohesion in all departments.
Respondent 4 said:
Staff will stay if they are learning continuously and training and ensuring the staff are deemed competent. I normally train my staff on specific case studies of rare cases and diseases. Also having a good manager will make staff stay.
Respondent 15 shared similar views on training and development. Theme five: GROWTH AND INTELLECTUAL STIMULATION. This had five
responses (33%). Respondent 10 said:
Intellectual stimulation and growth opportunities. Opportunities to be a scientist and not a ‘robot’ to be appreciated in the work that I do, and to be able to present at other labs, conferences, schools, hospitals, and have organisational learning and sharing of scientific information.
Respondent 11 shared similar thoughts on this theme:
173
I would stay if I’m stimulated by my job, and if I can add value to society and my colleagues. I love to teach and train so I would also stay if my manager sees my potential to train staff and this will enable me to grow in my current position.
Theme six: INVOLVEMENT IN RESEARCH, PUBLICATIONS AND
CONFERENCES. This had seven responses stating that this would retain them
(47%). Respondent 1 stated:
Good managers, good benefits, publish articles and get involved with patients and results, publish papers will be important to me. I published a paper on a rare disorder we picked up in the hospital on a child. It did make a difference in making me stay in the organisation as I was given an opportunity to publish.
Respondent 6 had similar views and stated:
For me, I will want to stay in an organisation if I am acknowledged; a simple thank you sometimes will be nice. I would also like to be considered to present at conferences, conduct research and teach others what I have learnt.
Theme nine: INCREASED INVOLVEMENT WITH PATIENTS AND SCIENCE drew
the second highest response which was seven out of 15 respondents (47%).
Respondent 12 stated:
I would be happy to stay in my current organisation, as I have autonomy, I enjoy my co-workers, and I love looking out at the beach every day. I am involved with the patients in the hospital and writing up case studies. So all of that motivates me to stay. Progressing on my studies subsidised by the company will also retain me.
Respondents 4 and 15 shared similar views on this theme.
Theme ten: RECOGNITION AND ACKNOWLEDGEMENT. Five respondents stated
that these themes would make them stay in the organisation (33%). Respondent 7
said:
It will be the same as above, I want to be treated fair, and I want a manager to lead and appreciate and acknowledge my efforts. I want to be compensated if I go beyond my duties. I want to be given additional functions that can make me grow and learn more about pathology.
Respondent 13 shared similar views on this theme.
174
To summarise what would retain the professionals in their organisation, the main
requirement mentioned was having expert leaders who have the right management
style to guide the employees; this was found to be the highest response. The second
highest retaining factor was involvement in research and publications, being able to
attend conferences to broaden their horizons and scientific background. They also
wanted to be involved in the full clinical picture and science relative to the patients.
Recognition and acknowledgement for the good work they produce would also be a
retaining factor. Respondent 15 stated:
My answer is the same as above; I will stay if I am remunerated well, if I am involved in the hospital and the patients. If I can do ward rounds with the sick patients and link the pathology with the patients. Training is also important to me.
Other respondents made similar statements. Respondent 13 said:
I would stay if I’m compensated well for my extra duties. If I am appreciated and involved in strategic management and planning. I would stay if I’m involved with the patients on a scientific and clinical level. My leader plays a role in ensuring that I am trained well and have continued learning and growth opportunities.
Question 6: What would attract you to another organisation?
The following themes emerged from question 6:
Theme one: FINANCIAL GAIN/ REMUNERATION. Eight responses (53%) came
from this. Respondent 9 stated the following:
An attractive organisation will be one that is well established, have great salary and fringe benefits. Rewards employees with bonuses, incentives and pay initiatives.
Respondent 7 further commented by saying:
I would say it will be the same as above also any offer must outweigh my present gains. In this I mean the financial benefits must be attractive enough in compared to my current job. Also other benefits such as I must be offered an opportunity to broaden my horizons and learn new and exciting things.
Theme two: MANAGEMENT AND LEADERSHIP STYLE. Seven of the respondents
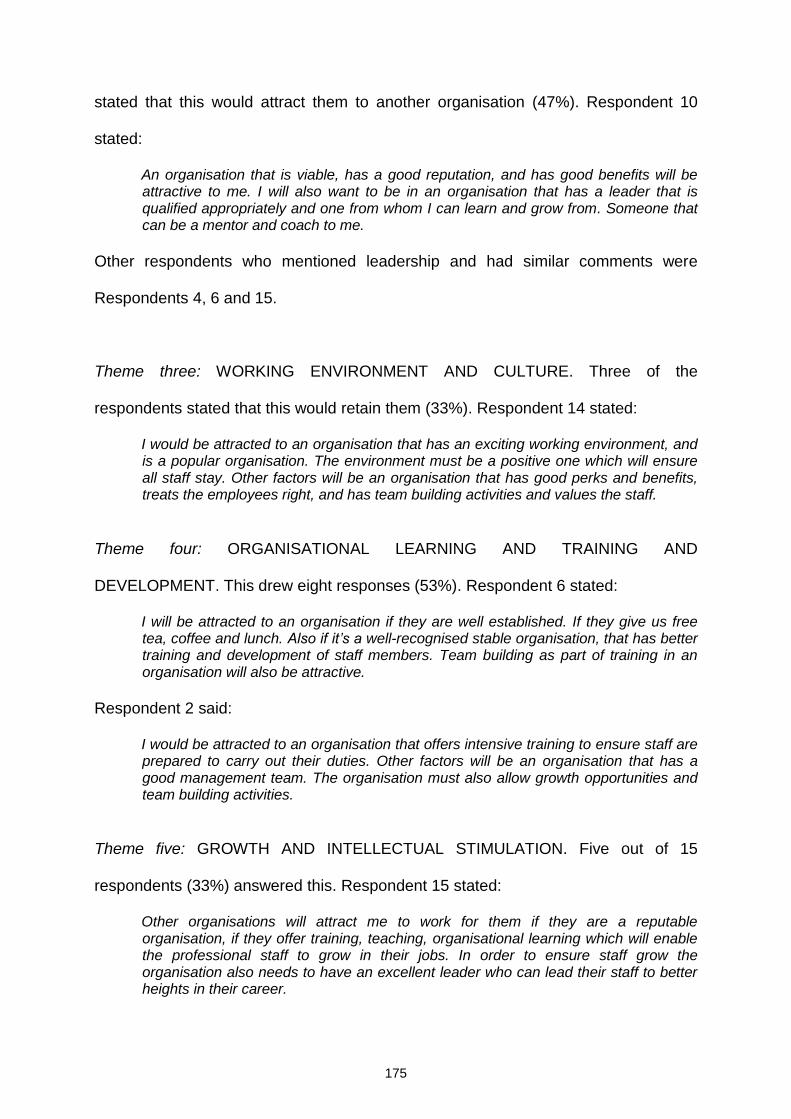
175
stated that this would attract them to another organisation (47%). Respondent 10
stated:
An organisation that is viable, has a good reputation, and has good benefits will be attractive to me. I will also want to be in an organisation that has a leader that is qualified appropriately and one from whom I can learn and grow from. Someone that can be a mentor and coach to me.
Other respondents who mentioned leadership and had similar comments were
Respondents 4, 6 and 15.
Theme three: WORKING ENVIRONMENT AND CULTURE. Three of the
respondents stated that this would retain them (33%). Respondent 14 stated:
I would be attracted to an organisation that has an exciting working environment, and is a popular organisation. The environment must be a positive one which will ensure all staff stay. Other factors will be an organisation that has good perks and benefits, treats the employees right, and has team building activities and values the staff.
Theme four: ORGANISATIONAL LEARNING AND TRAINING AND
DEVELOPMENT. This drew eight responses (53%). Respondent 6 stated:
I will be attracted to an organisation if they are well established. If they give us free tea, coffee and lunch. Also if it’s a well-recognised stable organisation, that has better training and development of staff members. Team building as part of training in an organisation will also be attractive.
Respondent 2 said:
I would be attracted to an organisation that offers intensive training to ensure staff are prepared to carry out their duties. Other factors will be an organisation that has a good management team. The organisation must also allow growth opportunities and team building activities.
Theme five: GROWTH AND INTELLECTUAL STIMULATION. Five out of 15
respondents (33%) answered this. Respondent 15 stated:
Other organisations will attract me to work for them if they are a reputable organisation, if they offer training, teaching, organisational learning which will enable the professional staff to grow in their jobs. In order to ensure staff grow the organisation also needs to have an excellent leader who can lead their staff to better heights in their career.
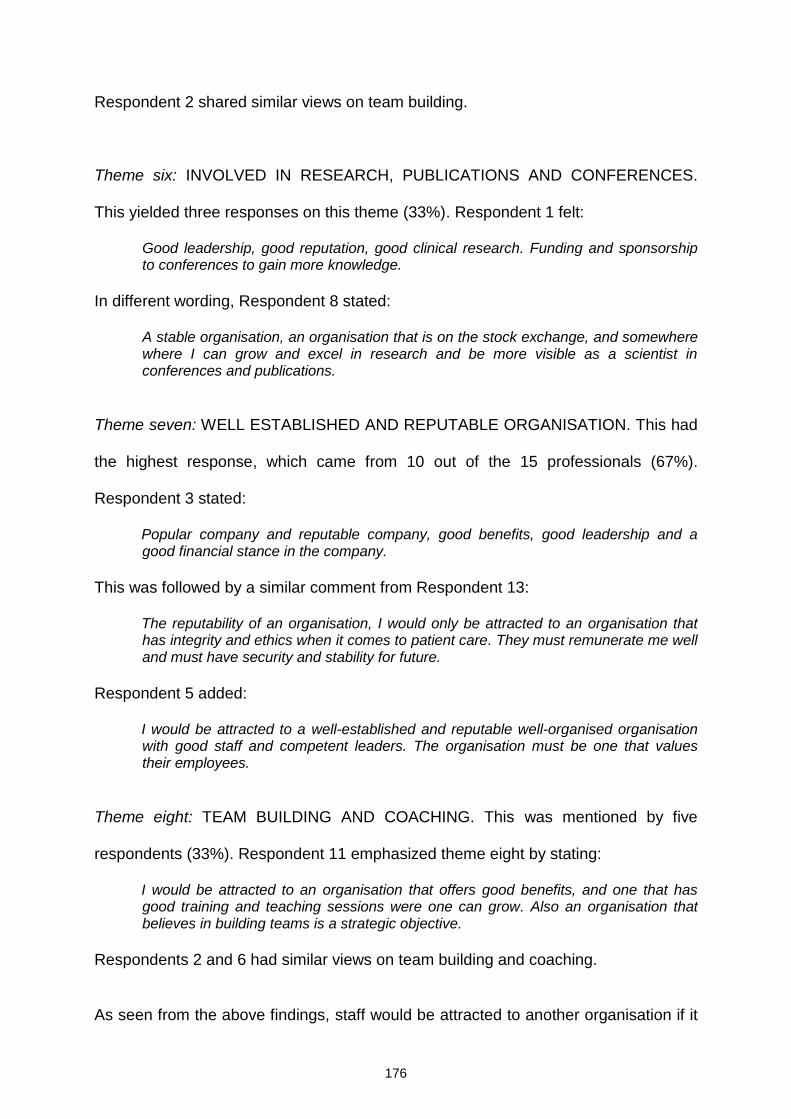
176
Respondent 2 shared similar views on team building.
Theme six: INVOLVED IN RESEARCH, PUBLICATIONS AND CONFERENCES.
This yielded three responses on this theme (33%). Respondent 1 felt:
Good leadership, good reputation, good clinical research. Funding and sponsorship to conferences to gain more knowledge.
In different wording, Respondent 8 stated:
A stable organisation, an organisation that is on the stock exchange, and somewhere where I can grow and excel in research and be more visible as a scientist in conferences and publications.
Theme seven: WELL ESTABLISHED AND REPUTABLE ORGANISATION. This had
the highest response, which came from 10 out of the 15 professionals (67%).
Respondent 3 stated:
Popular company and reputable company, good benefits, good leadership and a good financial stance in the company.
This was followed by a similar comment from Respondent 13:
The reputability of an organisation, I would only be attracted to an organisation that has integrity and ethics when it comes to patient care. They must remunerate me well and must have security and stability for future.
Respondent 5 added:
I would be attracted to a well-established and reputable well-organised organisation with good staff and competent leaders. The organisation must be one that values their employees.
Theme eight: TEAM BUILDING AND COACHING. This was mentioned by five
respondents (33%). Respondent 11 emphasized theme eight by stating:
I would be attracted to an organisation that offers good benefits, and one that has good training and teaching sessions were one can grow. Also an organisation that believes in building teams is a strategic objective.
Respondents 2 and 6 had similar views on team building and coaching.
As seen from the above findings, staff would be attracted to another organisation if it
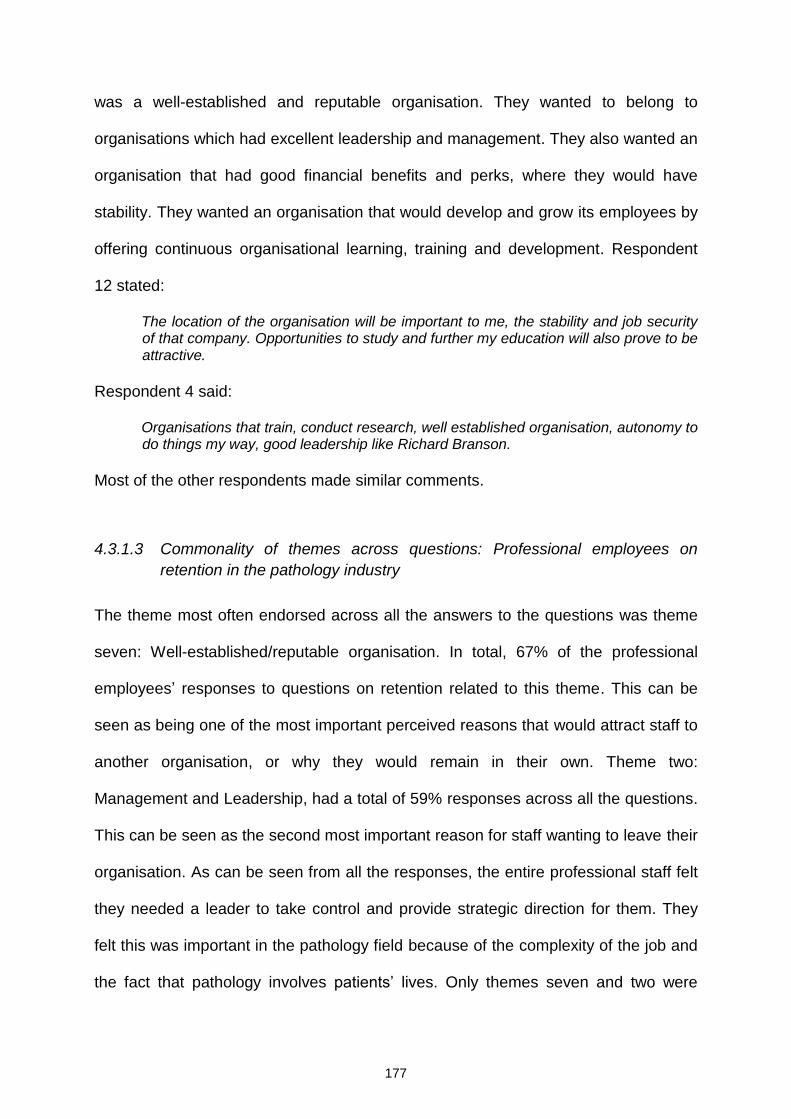
177
was a well-established and reputable organisation. They wanted to belong to
organisations which had excellent leadership and management. They also wanted an
organisation that had good financial benefits and perks, where they would have
stability. They wanted an organisation that would develop and grow its employees by
offering continuous organisational learning, training and development. Respondent
12 stated:
The location of the organisation will be important to me, the stability and job security of that company. Opportunities to study and further my education will also prove to be attractive.
Respondent 4 said:
Organisations that train, conduct research, well established organisation, autonomy to do things my way, good leadership like Richard Branson.
Most of the other respondents made similar comments.
4.3.1.3 Commonality of themes across questions: Professional employees on
retention in the pathology industry
The theme most often endorsed across all the answers to the questions was theme
seven: Well-established/reputable organisation. In total, 67% of the professional
employees’ responses to questions on retention related to this theme. This can be
seen as being one of the most important perceived reasons that would attract staff to
another organisation, or why they would remain in their own. Theme two:
Management and Leadership, had a total of 59% responses across all the questions.
This can be seen as the second most important reason for staff wanting to leave their
organisation. As can be seen from all the responses, the entire professional staff felt
they needed a leader to take control and provide strategic direction for them. They
felt this was important in the pathology field because of the complexity of the job and
the fact that pathology involves patients’ lives. Only themes seven and two were

178
endorsed in more than 50% of cases.
Themes with lower levels of endorsement were theme one: Financial gain and
remuneration (40%); theme three: Working environment and culture (31%); theme
six: Involvement in research, publications and conferences (31%); and theme nine:
Increased involvement in research (31%).
The lowest-scoring themes were theme ten: Recognition and acknowledgement
(29%) and theme four: Organisational and learning (25%). The lowest total score was
for theme eight: Team building and coaching (23%).
It is important to note that these themes were identified by the professionals as
drivers of retention. A low percentage of endorsements does not nullify the
importance of the theme. Those themes not mentioned here, for example, leaving the
company because of time needed for travelling, or to locate to be close to family and
friends, should be seen as possibly unimportant, rather than those with low levels of
endorsement.
Table 4.18 below summarises all the themes and the percentage endorsement
across texts per question put to the professionals. Question 1 read as follows:
Do you feel that retaining employees in your organisation is a problem?
Of the total respondents, 87% agreed, 7% responded no, and 7% said sometimes.
The rest of the questions are tabulated below.
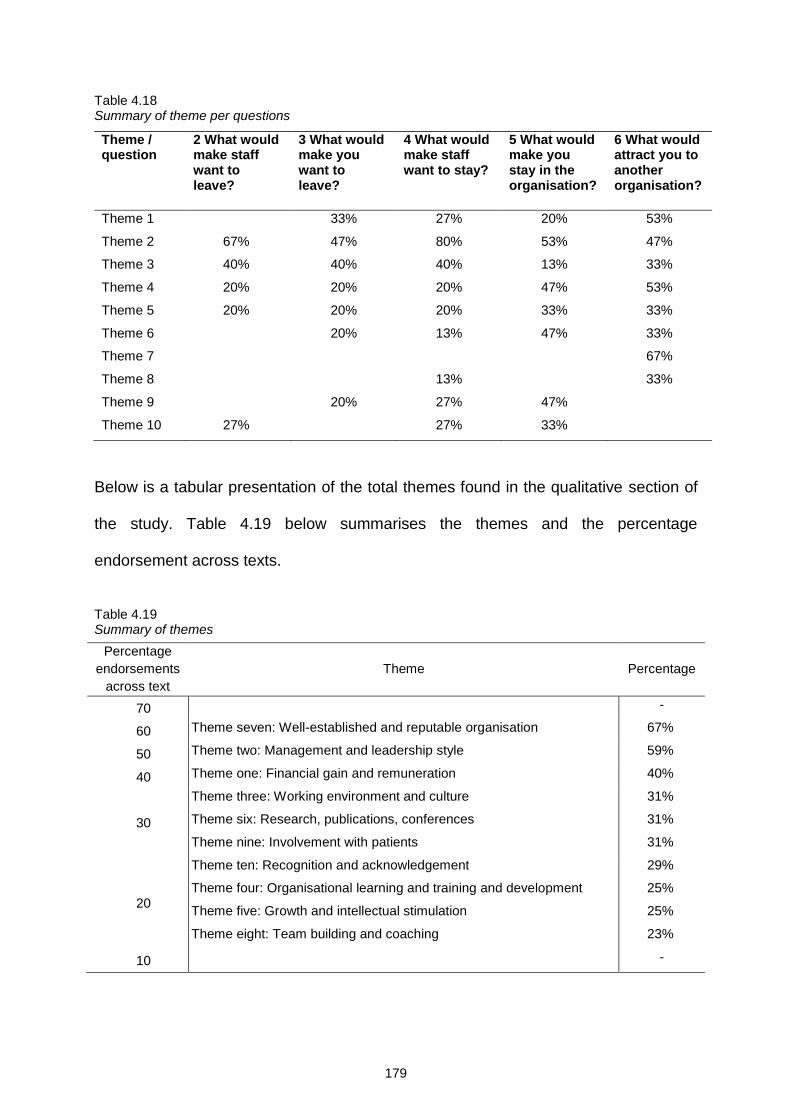
179
Table 4.18 Summary of theme per questions
Theme / question
2 What would make staff want to leave?
3 What would make you want to leave?
4 What would make staff want to stay?
5 What would make you stay in the organisation?
6 What would attract you to another organisation?
Theme 1 33% 27% 20% 53%
Theme 2 67% 47% 80% 53% 47%
Theme 3 40% 40% 40% 13% 33%
Theme 4 20% 20% 20% 47% 53%
Theme 5 20% 20% 20% 33% 33%
Theme 6 20% 13% 47% 33%
Theme 7 67%
Theme 8 13% 33%
Theme 9 20% 27% 47%
Theme 10 27% 27% 33%
Below is a tabular presentation of the total themes found in the qualitative section of
the study. Table 4.19 below summarises the themes and the percentage
endorsement across texts.
Table 4.19 Summary of themes
Percentage
endorsements
across text
Theme Percentage
70 -
60 Theme seven: Well-established and reputable organisation 67%
50 Theme two: Management and leadership style 59%
40 Theme one: Financial gain and remuneration 40%
30
Theme three: Working environment and culture
Theme six: Research, publications, conferences
Theme nine: Involvement with patients
31%
31%
31%
20
Theme ten: Recognition and acknowledgement
Theme four: Organisational learning and training and development
Theme five: Growth and intellectual stimulation
Theme eight: Team building and coaching
29%
25%
25%
23%
10 -
180
After coding the data and analysing the relevant themes from the responses by the
interviewees, it can be concluded that the retention factors for professionals are:
effective leadership and management styles with clear strategic directions, financial
stability and remuneration; the professionals wanted to remain part of a well-
established and reputable organisation. An important retention factor not picked up in
phase one of the study was that the professional staff wanted to be more involved
with the patients’ clinical concerns as well as the laboratory work. This would give
them the overall education and organisational learning they wanted. The
professionals also wanted to be involved in scientific research, publications and
conferences. Team building and team work was also important, as well as an
encouraging culture and working environment. The professionals wanted growth
opportunities and intellectual stimulation. They wanted recognition and
acknowledgement for the work they performed.
4.3.2 Managers’ viewpoints on retention in the pathology industry
The three managers from each of the provinces were interviewed. Semi-structured
interviews were held and all the managers were asked the same questions. The
purpose of the interviews with managers was to ascertain whether they would be
willing to align job redesign and career anchors to retain staff, and implement two
different retention strategies. The verbatim responses by each of the managers for
each of the questions are stated below as the findings. The questions were as
follows:
Question 1: Professionals can be defined as “Person formally certified by a
professional body of belonging to a specific profession by virtue of having completed
a required course of studies and/or practice. And whose competence can usually be
181
measured against an established set of standards.” Examples would be
technologists, scientists, nurses and pathologists. Would you agree with this
definition?
Area A: Yes, seems correct as to what I understand by the definition of professionals.
Area B: Yes, I would agree with that definition.
Area C: Yes I would agree with that long definition.
Question 2: Is retaining professional staff a problem in the organisation?
Area A: Yes. It’s a very difficult situation, as we as managers are just as stressed as we have to manage and work on the bench and try to keep these individuals within the organisation. It’s just one big nightmare.
Area B: In the health sector we always experience skill shortages, so yes this is a problem for us. We will just train staff deem them competent and then they will leave. It’s been a huge problem as well in Gauteng as there are so many jobs etc. available and people always look for better.
Area C: “In the Eastern Cape it’s a huge problem, we cannot find competent skilled staff and the moment we do the opposition organisations will buy them out. It has affected service delivery drastically and has caused staff to be stressed and burnt out.
Question 3: What are present strategies, if any, you would use to retain key
professional staff?
Area A: At present, there are no retention strategies that we utilise. What I do as a manager is to ensure staff have job satisfaction and I listen to what their problems are and try to assist them were I can. It’s not easy, as actually there are no present proper retention strategies that we are aware of and utilise and people leave and move between laboratories.
Area B: Presently I am working with the human resource department to ensure staff are trained and competent and performance managed. We also offer staff rotation in the hospitals recently which has shown staff enjoy multi-tasking and learning more. We can definitely require a proper retention strategy that does work in the health sector. However, currently in the human resource department, there is no effective retention implementation plan of any sort. I just try to be there for my staff as their manager, that’s the best I can do.
182
Area C: There are no current retention strategies I am aware of. We as health professionals do not have time to investigate this important matter of retaining staff, which is why we support researchers like you to assist us. I try my best to lead and offer direction to staff but there is only so much I can do. However, I cannot measure if what I do does retain them.
Question 4: In the first phase of the study the job characteristics ‘feedback’ showed a
relationship to organisational commitment for the professional staff. Should we
assume that the theory is valid, what you or the organisation would do, to design the
jobs of professionals in alignment with theory; and given this knowledge, what could
you do to achieve such an alignment.
Area A: We don’t have any strategies as I mentioned. We just try our best to ensure working conditions are acceptable and staff are trained. We as managers are so busy getting the work done we don’t have time to look at retention strategies. However, if I can realign the professionals’ job and give them more constructive feedback I would accommodate the theory. The truth of the matter is we don’t have time to give them any feedback. I have had complaints from the staff requesting proper feedback, and I do try my best at times. The work load is very vast and the environment is very stressful.
Area B: I would like to know about the theory and how staff can be retained. I would definitely align the jobs to the theory should it retain professionals. I think we as managers also need to be trained with regard to these retention theories as it will be useful to all. I am open to making a change to retain these professionals, but we as managers will need assistance from the human resource department or we will require more resources to assist with the implementation of a new retention strategy.
Area C: Never heard of the theory, but yes I would align the jobs of professionals to provide them with more feedback. Right now I do not give them any feedback as everybody is just working to get tasks completed. Well, I would redesign their jobs to retain them especially if they will become more valuable to the organisation.
Question 5: The career anchors that showed dominance with the professionals were
‘technical’, ‘managerial’, ‘security’, ‘lifestyle’ and ‘challenge’. The interesting fact was
the professionals who had ‘challenge’ in terms of their general career orientation
reported a higher score on their intention to quit. What would be your opinion on this
183
and would you be able to accommodate these career anchors to retain your
professional staff?
Area A: Yes, I do believe the more challenge they have they will leave, we are so busy with daily operations the last thing we need is a challenging work atmosphere. With regards to the second part of the question, I don’t understand the whole career anchors, but would like to learn more about it and if we have guidance on what will retain the professionals, I can accommodate these career anchors for the professionals if I have guidance and have a clear implementation plan.
Area B: Yes I do agree challenge would make the staff leave, as we work in a very challenging laboratory and that is why people actually resign. The staff just want to do the day to day laboratory work and complete their tasks. I would implement the career anchors that would retain them and I would start by removing challenges such as the staff working too hard which causes burnout.
Area C: Yes, I would be able to accommodate this, I would try anything to just keep my professional staff, as they are my largest asset. I do believe that staff will leave if they have a challenging job and environment, as every day is a challenge with us. I am aware some people do like a job that offers challenge, but having a challenge every day and working under the stressful conditions with limited resources which we work in can be a problem.
Question 6: What would your discretion as a manager be to retain staff?
Area A: Sometimes it’s beyond a manager’s control. Staff want new experiences in jobs. There is only so much managers can do, and we have our own challenges as well. It’s difficult to force people to remain in an organisation. I am excited about your study, as finally someone is trying to fix this crises, I would like to know the final outcome and implement your model in my organisation.
Area B: I would like to know what will retain them and the feedback from your research will help and I can implement it strategically. As I mentioned earlier we need to retain these professionals and try any new strategy to retain scarce-skilled staff as it has caused problems in the pathology field and we have had numerous complaints about our service delivery, and the main cause of this is the inability to retain these scarce skills.
Area C: I would ensure the staff have job satisfaction and enjoy working in the organisation. You know I have been trying to implement a pleasant working culture but it has been difficult with the shortage of staff, the professionals are not motivated anymore. I am glad some research is being done finally and will try to accommodate my professionals in any way to retain them.
184
Question 7: As seen in phase one of the study, there need to be different retention
strategies for professional staff, as traditional strategies seem to work only for the
administration staff. Would you as a manager see the possibility of implementing two
different retention strategies?
Area A: I would prefer to keep my professional staff, so, yes, I would have two different retention strategies. As I said earlier we are so busy to investigate this and come up with retention strategies, if you have found strategies that could work I will work with my team to implement these strategies.
Area B: With the help of senior management and training on what these strategies are, yes, I would think it is possible to do, and we can run the program as a pilot to evaluate if it does work.
Area C: This is a very interesting finding as I would not have thought we would need two different retention strategies. I think it will be good to implement and then evaluate if the turnover decreases. So yes, I would be willing to implement two different strategies one for professionals and one for non-professionals.
4.3.2.1 Commonality of themes across questions: Managers of professional
employees on retention in the pathology industry
As seen in the interviews with the three managers from the different provinces, they
all agreed that retaining professional skilled staff is an enormous problem, especially
in the health sector. One of the interesting facts that emerged from the interviews
was that all the managers stated that no retention strategy was currently being
followed to retain the professionals. The managers also reiterated that there was no
effective way of keeping these professionals, as the Human Resources Department
had not yet produced any research, neither had the senior leadership teams
evaluated ways of retaining employees in the health sector.
These managers are also professionals who have to manage and sometimes work
as scientists and technicians/technologists. After critically analysing the verbatim
185
responses by the respondents, it can also be seen that the managers themselves do
not have sufficient time to evaluate retention strategies and their effects, as they are
too busy working as actual technical staff. This means that they do not have sufficient
time to carry out their managerial functions. They also pointed out that, owing to the
increased workload, they were unable to invest in retention strategies. During the
interviews, it was also noted that the managers’ answers were short and to the point.
Before the interviews were conducted, they mentioned that time was at a premium on
account of their being busy dealing with the backlog of work.
It was also obvious from their body language and statements that the managers
were surprised to hear that two different retention strategies would be needed to
retain the professionals and the non-professionals. They had assumed that one
strategy would work for both. It was suggested that this could be the reason why
there was such an overwhelming problem with retaining professionals, as no proper
strategy had been investigated thus far. On a positive note, the managers thanked
the researcher for tapping into the retention problem, as it had become a vicious
circle, impacting on service delivery and causing extensive staff burnout. The
managers were keen to learn more about the retention strategies and the findings of
the studies, and were willing to align job redesign and accommodate career anchors
and related themes to the employees to ensure they retained the staff. The
managers were all willing to implement two different retention strategies in order to
retain their skilled staff.
4.4 Summary
Chapter Four discussed the findings of both the quantitative and qualitative data.
Phase one of the study showed that different retention strategies were required for

186
the professionals and non-professionals. The study was then amended to add in
phases two and three. The phase two findings detailed the factors that would retain
the professionals, and the phase three findings included discussions with the
managers and finding out whether they would amend the working conditions and
implement two different strategies for retaining staff. The next chapter will draw
conclusions from these findings and will discuss the retention model developed from
the findings of the study.
187
CHAPTER FIVE: DISCUSSION
5.1 Introduction
The aim of the research was to develop a retention model for scarce-skilled
professional employees in the health sector, owing to the shortage of these
professionals. The study was conducted in the private sector, and the pathology
environment was used, which was representative of the health sector.
In Chapter Four, the results of the quantitative data analysis and the findings
pertaining to the qualitative information were presented. The findings will be
discussed, with specific reference to the research objectives.
As the aim indicates, the focus of this research was the development of a retention
model for scarce-skilled professional staff. For this reason, reference to
administrative staff will be comparative only. No strategies aimed at retaining such
staff will be discussed, as they were not the main focus of this research.
This chapter will then reflect on how the results and findings relate to the research
objectives. The research problem and relevant conclusions will be drawn later.
5.2 Discussion in respect of the objectives of the research study
The primary objective of this study was to develop a retention model for scarce-
skilled professional staff. As discussed in the earlier chapters, seven secondary
objectives were set for this study. Each of these will be discussed together with the
hypotheses related to each.

188
5.2.1 Conclusions pertaining to objective one
The first objective was to comprehensively analyse and report on literature regarding
the factors which influence individuals to leave their employers, with specific
reference to professional workers.
Question 1: What can we learn from literature regarding the factors which influence
individuals to leave their employers, with specific reference to professional workers?
The literature was evaluated and discussed in detail in Chapter Two and the themes
that linked to intention to quit and organisational commitment (which are both proxies
for retention), these included the individual characteristics of the employees, the
characteristics of the job, and the overall satisfaction employees have in their jobs.
Schein’s (1996) career anchors were used as the basis for the individual
characteristics, and it was concluded from different literature studies that the make
up of an individual (career anchors) was seen as a predictor variable for retaining
professional employees. The findings from the research conducted by Nordvik (1996)
does display similarities to this research. It can be concluded from both studies that
the make up of the individual together with the personality fit is important to the
career they choose. Unfortunately not many studies have been conducted that used
career anchors as a reason for people to quit their jobs nor were there previous
studies that used career anchors as a retention strategy. The assumption has been
made by Schein (1996) and in this study, that people will not be satisfied if they do
not have their dominant career anchor fulfilled in their careers. Wils et al. (2010)
stated that people can have multiple dominant anchors. This study agrees with this,
as it was seen that individuals had shown more than one dominant career anchor.
This study also revealed that the make-up of the individual is the most potent
189
influencer on the intention to quit. For the purpose of this study, the dominant career
anchors of the professionals were used in the development of the retention model.
The job characteristics model by Hackman and Oldham (1976) was used as the
basis for an employee’s job characteristics. It can be concluded from the literature
evaluation that an employee’s job characteristic can be seen as a predictor variable
for retaining professional staff. Job satisfaction was another predictor variable for
this, and the satisfaction section of the job characteristics model by Hackman and
Oldham (1976) was used as the basis for total job satisfaction. Other theories found
to be related to retention were the motivation of employees and leadership and
human resource practices. These were seen to be linked to the job satisfaction of
professional employees. When comparing the outcome of the study by Fried and
Ferris (1985) it was concluded that absenteeism may be reduced through the
development of ‘skill variety’, ‘autonomy’ and ‘job feedback’, and this may in turn
reduce staff turnover. However, in this study it was found that only ‘feedback’ showed
a higher organisational commitment and lower intention to quit for the professionals.
Ramlall (2004) also mentioned that if employees are satisfied in their jobs they are
more likely to remain in the organisation. This study revealed a similar outcome as it
was concluded the more job satisfaction the professionals had the less likely they
were to quit their jobs. Phase two of the study was implemented as the job
characteristic proved that it was not enough to retain professional staff.
Literature on organisational commitment was evaluated using Allen and Meyer’s
(1990) research. This was the basis for an employee’s commitment to an
organisation and was seen as a proxy for retaining professionals. Meyer and Allan
(1997) stated that an employee who is committed in an organisation will be loyal and
190
remain long term in the organisation, and commitment to the organisation is a proxy
for a person intention to stay. Literature by Elangovan (2001) stated that lower
commitment leads to greater intentions to quit which in turn lowers commitment. This
study shared similar conclusions from the two articles above, as revealed from this
study, the more committed the employees are in the organisation the less likely they
are to quit the organisation. Findings from the study by Karantzas, Mellor, McCabe,
Davison, Beaton and Mrkic (2011) showed that job commitment, job satisfaction, and
work stressors and supervisor support demonstrated numerous indirect associations
on quitting intentions. This study drew similar conclusions for the job commitment and
job satisfaction. However, the study did not evaluate work stressors and supervisor
support, nevertheless when looking at the findings of the qualitative part of the study
it was noted that the professionals wanted a leader that they can count on to provide
direction, as ‘leadership’ was picked up as one of the themes.
It can be concluded, after evaluating all the relevant literature, that career anchors,
job characteristics and job satisfaction are predictor variables for retention, while
organisational commitment and intention to quit are proxies for retention. It can also
be concluded from the literature review that insufficient research has been conducted
on retention, especially in the health sector, and further research on this topic is
required. It can also be noted that no effective retention strategies or retention model
exists and that this is a gap that ought to be filled, especially in the health sector. The
retention of professionals is imperative, as this problem has been affecting service
delivery and it impacts on patients’ lives.
5.2.2 Conclusions pertaining to objective two
The second objective was to empirically determine which categories of factors
191
influence retention most in the health sector.
Question 2: Which categories of factors influence retention most in the health sector?
The relative influence of job characteristics, job satisfaction and the makeup of the
individual (career anchors) on retention was assessed, using a regression model. All
the job characteristics together and all kinds of satisfaction predict retention less
effectively than do all the career anchors together. Career anchors are thus the most
potent influencer on the intention to quit. When looking at the other proxy, which was
organisational commitment, the job characteristics and satisfaction from the job were
shown to be relevant. This is reported in more detail as per each of the hypotheses
related to this objective and the results are presented from Tables 4.11(i) to 4.17(i). A
detailed discussion will follow on the predictors of the intention to quit, followed by a
discussion on the factors that influence organisational commitment.
H1a: Job characteristics, career anchors and employee satisfaction equally affect the
intention to quit of professional employees.
When evaluating the numerical size of the three regression coefficients for job
characteristics, career anchors and employee satisfaction and the extent to which
these affect the intention to quit, it can be concluded that career anchors showed the
highest .182 coefficient of determination, followed by job characteristics, at .024. The
lowest was job satisfaction, which was .022. As described in Chapter Three, the
strength of the significance will be compared for each of the predictor variables and
expressed as d - values. Both strong and moderate practical significant strengths will
be accepted and low practical significance will just be reported. Career anchors have
a moderate practical significance (d = .38) effect on the intention to quit. Job
192
characteristics have a small practical significance (d = .05) for the intention to quit
and job satisfaction also showed a small practical significance (d = .04) effect on the
intention to quit.
These results suggest that the make-up of the individual (career anchors) should play
a more important role than that of job characteristics and satisfaction in the
development of a retention strategy for professionals in the pathology field. Hence
hypothesis H1a is rejected, as job characteristics, career anchors and employee
satisfaction do not equally affect the intention to quit on the part of professional staff.
H1b: Job characteristics, career anchors and employee satisfaction equally affect the
organisational commitment of professional employees.
When evaluating the size of the three regression coefficients for job characteristics,
career anchors and employee satisfaction and the extent to which these affect the
employees’ organisational commitment, it can be concluded that job characteristics
showed the highest value, which had a coefficient of determination of .053, followed
by job satisfaction which was .032. Lastly, career anchors was .022. Job
characteristics, job satisfaction and career anchors all showed a small practical
significance with d = .11, d = .06 and d = .04 respectively. The hypothesis H1b is
therefore accepted as job characteristics; career anchors and employee satisfaction
can be seen to equally affect the organisational commitment of professional
employees, owing to all the elements having a small practical significance.
It can thus be concluded that job characteristics, satisfaction from the job and the
makeup of the individual do not equally affect the intention to quit. However, all three
of the factors equally affect the organisational commitment of the professional staff. It
193
is also important to note that not all job characteristics and categories of satisfaction
or all career anchors (individual characteristics) influence retention. This matter will
be addressed in more detail with objectives three and four.
5.2.3 Conclusions pertaining to objective three
The third objective was to empirically determine which elements in those categories
of factors influencing retention are most dominant.
Question 3: Which elements within those categories of factors that influence retention
are most dominant in doing so?
It can be noted that not all the factors influence the retention of professionals. The
research question will be answered by further evaluating each of the hypotheses
pertaining to this objective. The focus will first be on the intention to quit, H1a (i-iii),
and then on organisational commitment, H1b (i-iii).
A two-tiered approach was followed to determine the influence of the individual
elements. First, the simple correlation between the element and the predicted
variable was considered, analysing the correlation matrix. Secondly, significant betas
from the regression analysis were considered. These were combined to make
decisions on the rejection of the hypotheses.
H1a (i): All job characteristics equally influence the professional employees’ intention
to quit.
When analysing the correlation data in Table 4.12 (correlation matrix), it was seen
that none of the job characteristics for the professional staff correlated significantly
with the intention to quit. When further analysing the regression analysis (Table
194
4.12i), comparing job characteristics with the intention to quit, it was evident that only
one job characteristic ‘feedback from agents’ contributed uniquely and significantly to
the variance in the professional group.
The above hypothesis H1a (i) is therefore rejected, as not all the job characteristics
equally influence the professional employees’ intention to quit.
H1a (ii): All the career anchors equally influence the professional employees’
intention to quit.
After analysing Table 4.11 (the correlation matrix), it can be concluded that the
career anchors that correlate negatively with the professional staff’s intention to quit
are ‘technical’, ‘managerial’ and ‘lifestyle’. ‘Challenge’ showed a positive correlation
for the professional staff with the negative construct intention to quit. When further
analysing the regressions in Table 4.11(ii), it can be concluded that ‘challenge’
contributed uniquely and significantly with the variance among the professional
group.
The above hypothesis H1a (ii) is therefore rejected, as only four of the eight career
anchors show dominance for the professionals and show an effect on their intention
to quit. It seems that those who have the managerial, autonomy and lifestyle as a
dominant career anchor are less likely to quit, while those who have challenge as a
dominant career anchor are more likely to leave. This last point is supported by the
correlation as well as by the regression analysis.
H1a (iii): All the employee satisfaction indicators equally influence the professional
employees’ intention to quit.
195
After analysing the data in Table 4.13 (correlation matrix), which shows the
correlations, it can be concluded that one of the categories for satisfaction which is
‘job satisfaction’ for the professional staff shows a correlation with the intention to
quit. When further evaluating the regression analysis, it can be seen ‘job satisfaction’
contributed uniquely and significantly to the variance declared for the professionals.
Hypothesis H1a (iii) is therefore rejected, as not all employee satisfaction indicators
equally influence the professional employees’ intention to quit.
H1b (i): All the job characteristics equally influence the professional employees’
organisational commitment.
Inspection of Table 4.16 (the correlation matrix) revealed that the job characteristics
for professional staff do not coincide significantly with organisational commitment.
When evaluating the regression analysis, it can be concluded that ‘feedback from
others’ contributed uniquely and significantly.
The above hypothesis H1b (i) is therefore rejected, as not all the job characteristics
equally influence organisational commitment.
H1b (ii): All the career anchors equally influence the professional employees’
organisational commitment.
An analysis of Table 4.15 (the correlation matrix) led to the conclusion that the career
anchors that correlate with organisational commitment on the part of the professional
staff is ‘security’, and it can be concluded that the professionals who have ‘security’
as their dominant career anchor have a higher commitment to the organisation.
When further analysing the regression analysis, it can be concluded that none of the
196
career anchors contributed uniquely and significantly to organisational commitment.
The above hypothesis H1b (ii) is therefore rejected, as not all the career anchors
equally influence the professionals’ organisational commitment.
H1b (iii): All the employee satisfaction indicators equally influence the professional
employees’ organisational commitment.
An analysis of Table 4.17 (the correlation matrix) led to the conclusion that none of
the elements of satisfaction showed correlations with organisational commitment for
the professional staff. When analysing the regression analysis, it is evident that none
of the satisfaction indicators contributed uniquely and significantly to the variance
among the professional group. This proves that employee satisfaction is not an
indication of the professionals’ commitment in the organisation.
The above hypothesis H1b (iii) is therefore accepted, as all the employee satisfaction
indicators equally influence the professional employees’ organisational commitment.
5.2.4 Conclusions pertaining to objective four
The fourth objective was to determine whether similar factors influenced both
professionals and non-professionals when they consider their retention within an
organisation.
Question 4: Are similar factors responsible for the retention of professionals and non-
professionals in the health sector?
The research question was answered by comparing the differences between the
absolute values of the descriptive statistics, followed by further analysis considering

197
the relationships between variables along group lines.
Considering differences in mean scores may be important in the development of a
retention strategy, as different occupational groups may respond and react
differently, seeing that they are not exposed to the same organisational environment.
Badrick and St John (2012) confirmed this, stating that the medical scientists working
in a laboratory environment may have needs different from those of the professionals
not working in such an environment.
Table 4.2 (which contains the career anchor data) revealed that in four cases the
means of the professional and administrative staff differed significantly. The
‘autonomy’, ‘entrepreneur’ and ‘lifestyle’ career anchors revealed higher mean scores
for the professional staff, while the career anchor ‘service’ revealed higher mean
scores for the administrative staff.
After analysing the last column in Table 4.4 (which contains the job characteristics
data), it can be read that in seven cases the means of the professional and
administrative staff differed significantly. The seven items that differed were ‘skill
variety’, ‘task identity’, ‘autonomy’, ‘feedback from the job itself’, ‘feedback from
others’, ‘general satisfaction and ‘motivation’. There were three job characteristics
that revealed higher mean scores for the professionals, which were: ‘task identity’,
‘feedback from the job itself’ and ‘feedback from others’. The four job characteristics
that displayed higher mean scores for the administrative staff were: ‘autonomy’, ‘skill
variety’, ‘motivation’ and ‘general satisfaction’.
Furthermore, having evaluated Table 4.10 (which contains the data on satisfaction), it
can be concluded that, in all (seven) of the cases, the means of the professional and

198
administrative staff differed significantly. The seven items that differed were ‘job’,
‘pay’, ‘security’, ‘social’, ‘supervisory’, ‘growth’ and ‘total satisfaction’, which revealed
higher mean scores for the administrative staff.
The mean values and standard deviations comparing the intention to quit on the part
of professional and administrative staff were presented in Table 4.6 (data on intention
to quit). It can be concluded that the administrative staff were just as ready to quit as
the professionals. Table 4.8 (data on organisational commitment) compares the
organisational commitment of the professional and administration staff, after
comparing the mean values, it can be concluded that the administrative staff have a
higher organisational commitment than that of the professional staff.
Hence, it can be concluded that the mean scores on the factors associated with the
retention of professional and non-professional staff in the health sector differ. To find
further clarity in answering the research questions comparing the predictor variables
to the proxies of retention between occupational boundaries, hypotheses H2a (i-iii)
and H2b (i-iii) will be answered.
H2a: Job characteristics, career anchors and employee satisfaction similarly affect
the intention to quit across occupational boundaries.
Hypothesis H2a and hypothesis H2a (i-iii) were answered individually.
H2a (i): Job characteristics influence the intention to quit equally across occupational
boundaries.
The job characteristics as a unit predict .024 of the variance in intention to quit for
professionals, compared with the .415 for non-professionals. Furthermore Table 4.12
199
compared the job characteristics for professionals and non-professionals, and
revealed there are no job characteristics that correlated significantly with the intention
to quit for the professionals, compared with the five for the administrative staff. When
further analysing and comparing the regression co-efficient from Table 4.12(ii) it was
evident that ‘feedback from the job agents’ contributed uniquely and significantly to
the variance in the professional and the administrative groups, while, for the latter
group, ‘task significance’ also contributed.
Hypothesis H2a (i) is therefore rejected, as the job characteristics do not influence
the intention to quit equally across occupational boundaries.
H2a (ii): Career anchors influence the intention to quit equally across occupational
boundaries.
Career anchors as a unit predict .182 of the variance in intention to quit for
professionals, compared with the .702 for non-professionals. Furthermore, four
career anchors correlated significantly with intention to quit for the professionals,
compared to the five for the administrative staff. The common career anchors for the
professional and non-professional groups are ‘technical’, ‘managerial’ and
‘challenge’.
Hypothesis H2a (ii) is therefore rejected, as the career anchors do not equally
influence the intention to quit across occupational boundaries.
H2a (iii): Employee satisfaction influences the intention to quit equally across
occupational boundaries.
Satisfaction as a unit predicts .022 of the variance in the professionals’ intention to
200
quit compared to the .644 for non-professionals. Furthermore, there was one
satisfaction criterion which correlated significantly with the intention to quit for the
professionals, compared with five for the administrative staff.
Hypothesis H2a (iii) is therefore rejected, as employee satisfaction does not influence
the intention to quit equally across occupational boundaries.
As stated in hypothesis H2a (i-iii), it can be concluded that job characteristics, career
anchors and employee satisfaction do not similarly affect the intention to quit across
occupational boundaries, hence hypothesis H2a is rejected.
H2b: Job characteristics, career anchors and employee satisfaction similarly affect
organisational commitment across occupational boundaries.
Hypothesis H2b and hypothesis H2b (i-iii) were answered individually.
H2b (i): Job characteristics influence organisational commitment equally across
occupational boundaries.
Job characteristics as a unit predict .053 of the variance in organisational
commitment in professionals, compared to the .077 in non-professionals.
Furthermore Table 4.16 compares the job characteristics for professionals and non-
professionals, and revealed there are no job characteristics that correlated
significantly with organisational commitment for the professionals and the
administrative staff. When further analysing and comparing the regression co-
efficient from Table 4.16(ii) it was evident that ‘skill variety’ contributed uniquely and
significantly to the variance in the administration group whereas ‘feedback from
others’ contributes uniquely and significantly to the professional group.
201
Hypothesis H2b is therefore rejected, as the job characteristics do not influence the
organisational commitment equally across occupational boundaries.
H2b (ii): Career anchors influence organisational commitment equally across
occupational boundaries.
Career anchors as a unit predict .002 of the variance in organisational commitment in
professionals, compared to the .378 in non-professionals. One career anchor
correlated significantly with organisational commitment for the professionals
compared to two for the administrative staff.
Hypothesis H2b (ii) is therefore rejected, as the career anchors do not influence the
intention to quit equally across occupational boundaries.
H2b (iii): Employee satisfaction influences employees’ organisational commitment
equally across occupational boundaries.
Satisfaction as a unit predicts .032 of the variance in organisational commitment in
professionals, compared to the .271 in non-professionals. Furthermore, there were
no satisfaction criteria that correlated significantly with organisational commitment for
the professionals, as opposed to two for the administrative staff.
Hypothesis H2b (iii) is therefore rejected, as the satisfaction criteria do not influence
the intention to quit equally across occupational boundaries
As stated in hypothesis H2b (i-iii), it can be concluded that job characteristics, career
anchors and employee satisfaction do not similarly affect organisational commitment
across occupational boundaries, hence hypothesis H2b is rejected.
202
Based on the above conclusions, it can be stated that two different retention
strategies are required for professionals and non-professionals, as different factors
are responsible for the retention of professionals and non-professionals in the health
sector.
5.2.5 Conclusions pertaining to objective five
To determine, by means of interviews, which factors are responsible for retaining the
professional staff in the health sector.
Question 5: What factors are responsible for retaining the professional staff?
Phase two of the study was implemented to determine which factors would retain
professional staff. This phase was added to the study on account of the results from
phase one of the quantitative study, which showed that the elements of the career
anchors, job characteristics and satisfaction, were not enough to retain professionals.
To get a deeper understanding of the problem and other possible retention factors,
the professionals were asked semi-structured interview questions to determine what
would make them leave and what would make them stay in their organisation.
The findings were discussed in-depth in Chapter Four, and it can be concluded that a
total of 10 major themes were uncovered, which were the factors that would retain
these professionals in the health sector. The themes were then analysed, and the
most effective theme was seen to be that of a ‘well-established and reputable
organisation’. It was noted that employees wanted to be part of an organisation that
had good financial standing, and was commendable and credible. Should they
receive an offer from an organisation that was better established and more reputable,
they would consider accepting this, as they would prefer to be employed by such an
203
organisation.
The next theme that was found to be relatively important was the ‘leadership style’.
After analysing the responses, it can be concluded that the professionals wanted
clear direction when it came to objectives and goals, which was in line with
organisational strategy. They wanted a leader who was genuine and who could guide
them in the organisation, give them constructive feedback on their performance and
offer ways of improving. The type of leadership style that the professionals
recommended was one of transformational leadership, whereby change can be
embraced and the leader is there to be a mentor and guide the team. If there was an
effective leader, the professionals maintained that staff would remain in that
organisation.
The next theme was that of ‘financial remuneration’, and it can be concluded that,
after evaluating the data from the interviews, the professionals felt they had studied
for a long time, they had scarce skills, and they had a stressful job. They felt they
deserved a job that remunerated them well and they needed financial stability.
‘Work environment and culture’ was seen as another factor that could help retain
staff, as the employees felt they need an encouraging working environment
characterised by a good work ethic and a positive work culture. It can be concluded
that the professionals felt they spent most of their time at work as they worked for
long, unpleasant hours, which included night shifts and weekends. They felt that a
good working environment and culture would help retain the staff.
The next three themes were extremely interesting: ‘research and conferences’,
‘involvement with patients’ and ‘recognition and acknowledgement’. The theme of
204
involvement in research can be seen as an important one for the professionals in
pathology, as they felt they should not be treated like ‘cogs in a wheel’, but should
rather be exposed to scientific matters like new diseases and new drugs that have
been clinically trialled and tested. It can be concluded the professionals would like to
be seen as ‘experts’ in their field, and wanted to be more in touch with the doctors,
who are clinically involved with the patients. They also wanted to do ward rounds, to
see ‘interesting case studies’. They would also like to present papers and attend
medical conferences where knowledge sharing in the field of science takes place.
The professionals also wanted to be recognised and acknowledged for their
involvement in the important work that they do for mankind and the inconvenient
hours they work.
The last three themes were ‘training and learning’, ‘growth and intellectual
stimulation’ and ‘team building’. It can be concluded that the professionals felt these
were also significant factors in retaining staff. Organisational learning and training are
imperative in the medical science industry. Professionals felt it was important for
them to grow in an organisation, whether be it in their career or simply personal
intellectual growth. The professionals felt the need for a culture of continuous
learning and intellectual stimulation, as they had to keep up with new research and
the health professional council continued professional development. Team building
activities were seen as necessary, as this would also contribute to a positive working
environment. Culture could be seen as an element that would go towards employee
retention.
5.2.6 Conclusions pertaining to objective six
To determine, by conducting interviews, the factors over which health sector
205
managers have control to influence the retention of professional staff.
Question 6: What can the manager do to influence retention?
This objective was to determine whether the general manager could improve working
conditions to influence retention. Phase three of the study was implemented to
answer this research question. This phase consisted of interviews with the
professional managers. Based on the findings of this phase, it was noted that the
managers did not have time to investigate and invest in retention strategies, as they
themselves were professionals and had to work ‘on the bench’, owing to the shortage
of scarce-skilled employees, which is the basis of the research problem. However,
the managers were very positive about the findings of the study once it was
discussed with them and they pointed out that they were willing to improve the
working conditions according to the findings of the study in order to retain staff.
All the managers were supportive of making any necessary changes to amend
working conditions and redesign the jobs to ensure the retention of their scarce-
skilled professionals. The managers also stated that they were unaware that they
would need to implement two different strategies for retaining administrative and
professional staff. They were very pleased with the findings, as they felt that they
could now see why their professional staff could not be retained. The wrong factors
for retention strategies may have been used in the past.
The general manager was willing to evaluate the employees’ job functions by
evaluating the data and feedback received from this study. The managers were
eager to accommodate their employees in terms of individual characteristics, job
characteristics and the themes that were indicated in the qualitative section of the

206
study for the professionals.
5.2.7 Conclusions pertaining to objective seven
The final objective was to develop, based on empirical evidence and the input of the
managers, a model which would be useful for the retention of professional staff.
Question 7: What do literature and empirical evidence convey which could assist in
the development of a retention model for professionals in the health sector?
To answer this objective the qualitative findings were evaluated, together with the
conclusions for the quantitative data, and a retention model for scarce-skilled
professionals in the health sector was developed. The themes extracted from
literature were incorporated into the quantitative findings, along with the themes
derived from the qualitative part of the study. These were used to develop the
retention model. The model developed was a conceptual model which integrated the
relationships between the variables of the quantitative and qualitative data. The
model is demonstrated below in Figure 5.1, and the basis of the model and its
application are discussed.
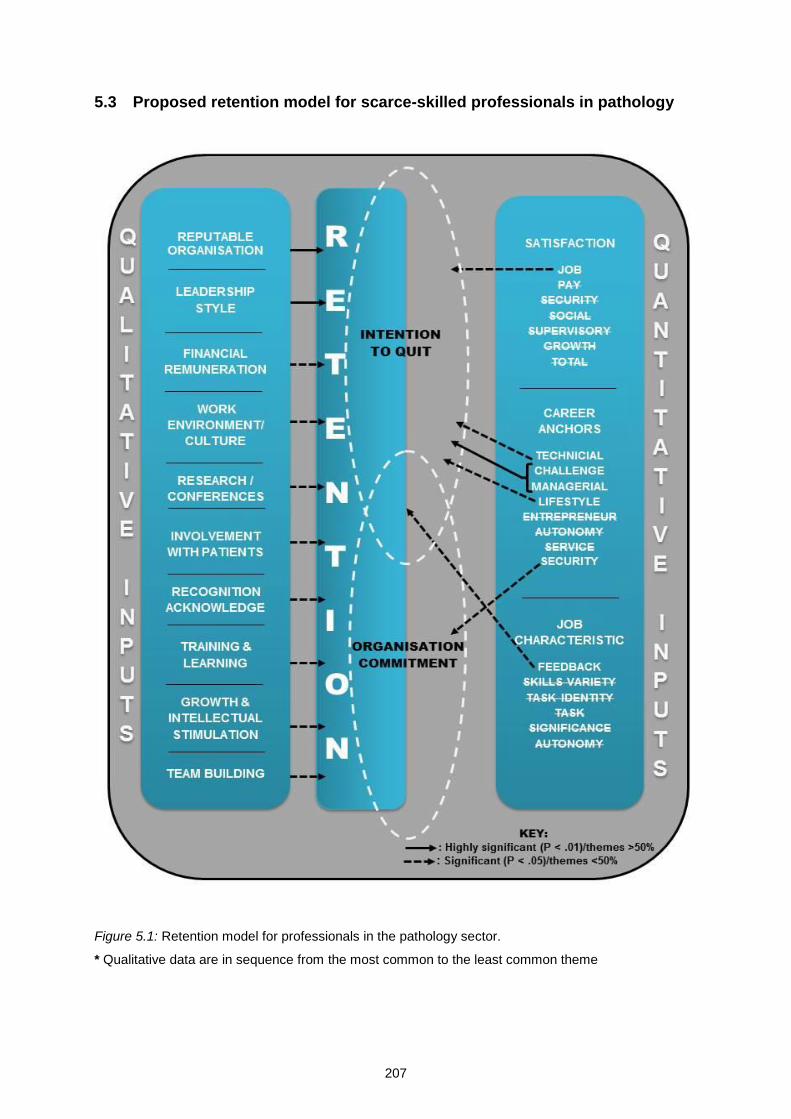
207
5.3 Proposed retention model for scarce-skilled professionals in pathology
Figure 5.1: Retention model for professionals in the pathology sector.
* Qualitative data are in sequence from the most common to the least common theme
208
5.3.1 Description of the retention model
The model was based on responses from professionals in the pathology field. The
conceptual model incorporates three different aspects, which have to be used in
combination. The model includes the relevant aspects of career anchors, job
satisfaction and job characteristics, which were collated in the first quantitative phase
of the study and themes for the professional staff, which were collated from the
second qualitative phase of the study. The predictor variables used in the model
included the variables that showed a small, moderate and large correlation, to ensure
that all the relevant predictor variables were incorporated holistically as part of the
retention model.
The model incorporates five career anchors for the professional staff: ‘challenge’,
‘managerial’, ‘lifestyle’, ‘technical’ and ‘security’. Two career anchors, ‘technical’ and
‘lifestyle’ showed a significant correlation to intention to quit and the other two career
anchors, ‘challenge’ and ‘managerial’ showed a highly significant correlation to
intention to quit. When it came to organisational commitment, ‘security’ showed a
significant correlation with organisational commitment. The model thus depicts the
strengths as well as the link of intention to quit and organisational commitment with
retention. This means that the general manager has to accommodate the dominant
career anchors for the professional staff in order to retain them in an organisation.
The second part of the model is the job characteristics. The element ‘feedback’
showed a significant link to intention to quit and organisational commitment.
Interestingly ‘feedback from the job agents’ showed a significant correlation to
intention to quit and ‘feedback from others’ showed a significant correlation to
organisational commitment. For the purpose of the study all three feedback elements
209
(feedback from job itself, feedback from job agents and feedback from others) will be
discussed as ‘feedback’ in general. An additional part of the model is ‘satisfaction’,
which shows the main elements of satisfaction that will result in employees intending
to quit the organisation. Only ‘job satisfaction’ was shown to have a significant
correlation with the professionals. When professionals have job satisfaction, they are
seen to be more committed to the organisation and this would mean they were less
likely to leave their jobs, and would be retained in the organisation.
The main framework of the model incorporates the ten themes derived from the
qualitative findings. The themes in the model were linked to retention, depending on
the strength of each of these themes. The ten themes were: ‘reputable organisation’
and ‘leadership style’, which showed a highly significant correlation to retention.
‘Financial remuneration’, ‘work environment and culture’, ‘research and conferences’,
‘involvement with patients’, ‘recognition and acknowledgement’, training and
learning’, ‘growth and intellectual stimulation’ and ‘team building’ showed a significant
correlation to retention. After reflecting on the responses from the professionals who
were interviewed, it can be re-iterated, as in the research problem, that there is a
major problem in retaining professional scarce-skilled staff in the laboratory
environment.
5.3.2 Application of the retention model
The application of the model will be discussed according to each factor of retention,
after which only the relevant elements will be discussed on application of the model.
The application of the five career anchors that showed correlations will be discussed.
The most noteworthy finding was the positive correlation of ‘challenge’ with the
negative construct of intention to quit. This could indicate that professionals who
210
have ‘challenge’ as their dominant career anchor are more likely to quit the
organisation. According to Schein (1996) if ‘challenge’ is ones dominant career
anchor people would not give up the opportunity to work on solutions to seemingly
unsolvable problems, to succeed over tough opponents, or to overcome difficult
obstacles. The medical professionals find such challenge in intellectual stimulation,
the clinical trials and finding cures for dreaded diseases, and finding solutions to save
patients’ lives. Innovation, diversity and striving to excellence become ends in those
who have ‘challenge’ as a dominant career anchor, and if something is easy and
stress-free, it becomes immediately boring (Schein, 1996)
When further reflecting on the ‘managerial’ aspect of the model, the professionals
wanted the job functions and the responsibility of being a general manager.
According to Schein (1996), this career anchor shows that professionals want to be
managers, as they like problem-solving and dealing with other people. They thrive on
responsibility, but if they are to be successful, they must also have emotional
competence.
The ‘technical’ career anchor included in the model showed that the professional staff
enjoyed doing something they were good at and would work to become a ‘guru’ or an
expert at that. This type prefers to specialise in their skill in medical science, and they
tend to pursue excellence and enjoy being in their area of expertise (Schein, 1996).
The next career anchor included in the model is ‘lifestyle’, which showed that the
professionals were focused first on lifestyle and their whole pattern of living. They
preferred to maintain a work/life balance (Schein, 1996). They tended to take their
vacational leave to indulge in their hobbies and live to enjoy their lives. In fulfilling this
career anchor, professionals would be satisfied and would remain in their jobs.
211
The last career anchor which showed a link to organisational commitment was
‘security’. This career anchor, according to Schein (1996), shows that professionals
want a secure job in which they are financially stable and professionally in the right
career. Once these professionals have security as an anchor, they are more
committed to their organisation and this will go towards retaining them.
Based on the findings, the main job characteristic for professionals is ‘feedback’ this
includes ‘feedback from the job itself’, ‘feedback from agents’ and ‘feedback from
others’. According to Hackman and Oldham (1976), job characteristic ‘feedback’
refers to the degree to which people learn how effective they are being at work. It
tells the individual doing a job the relevant information on the effectiveness of their
performance. ‘Feedback’ refers not only to supervisory feedback, but feedback from
peers and agents and also to the opportunity of observing the results of their work.
According to Hackman and Oldham (1976), ‘job satisfaction’ can incorporate all the
elements of satisfaction, which are security, pay, and growth, supervisory and social
satisfaction. The security satisfaction can be extremely important, especially in times
of economic uncertainty; job security is very high on the list in determining an
employee's job satisfaction. Giving an employee the assurance that their job is
secure would in all likelihood increase their job satisfaction (Hackman & Oldham,
1976). Social satisfaction allows employees to develop the social aspect of their job,
which may increase their satisfaction, as well as developing their sense of working in
a team. The social aspect could be beneficial to the organisation as a whole, given
that teamwork is a very important aspect of organisational productivity and success
(Hackman & Oldham, 1976). Growth satisfaction allows employees who show a high
level of performance and loyalty room to advance and grow in their careers. It would
212
give employees an added sense of responsibility and would contribute to overall job
satisfaction (Hackman & Oldham, 1976).
McDonald (2013) offered some views on job satisfaction, stating that if employees
were satisfied, they would be more committed and would probably remain in the
organisation. Satisfiers should therefore be incorporated into a retention strategy.
Schein (1985) also stated that the basic career anchors for staff, if fulfilled, could
retain staff in an organisation, as this would be linked to overall job satisfaction.
Horwitz and Pundit (2008) share similar views about nursing staff who have
satisfaction and do not intend to quit their organisation, even though they suffer
burnout.
The next part of the model consists of the themes derived from the qualitative section
of the study. The application of each of these themes will be grouped and discussed.
The main theme gathered from the responses was that of ‘management and
leadership style’. The majority of the professionals interviewed felt that they would
remain in their organisation if they had a leader who could provide them with clear
instructions, provide strategic support to the team and give feedback on their
performance. Linked to management could be the ‘recognition and
acknowledgement’ theme, whereby staff felt that they should receive
acknowledgement for the tasks they performed, whether it be in the form of intrinsic
or extrinsic rewards, as they wanted to feel valued by the organisation. This is what
would retain them.
Another relevant theme that emerged was that of working for a ‘well-established and
reputable organisation’. Professionals would like to work for a well-known and well-
established organisation. Linked to this theme was the theme of ‘financial gain and
213
remuneration’. Professionals want to be a part of an organisation that offers
rewarding financial perks. They also want to be part of a stable, secure organisation.
Themes that were not gathered in the first phase of the study were those of
‘increased involvement with patients and science’. This was involvement in the
clinical aspect of the patients, not only the laboratory perspective. The professionals
felt they would like to learn and be involved with the clinical aspect of the patient,
which included not only conducting the laboratory tests but also accompanying
specialists into the hospitals, liaising with the patient and doctors to experience full
involvement and linking the clinical, laboratory and diagnostic concerns of a patient.
This theme can be linked with another theme mentioned, which was ‘organisational
learning and training and development’.
Another important theme discerned was ‘involvement in research, publications and
conferences’. The professionals wanted knowledge transfer and sharing by being
involved in conferences and publications, writing research papers, undergoing more
research and linking the scientific aspects of the laboratory work. This theme could
also be linked to the ‘growth and intellectual stimulation’ of the professionals. The last
theme of lesser significance to the professionals was that of ‘team building and
coaching’. Some professionals felt it was an important aspect that could help retain
individuals.
It is important to note that the application of the retention model for the professionals
should be utilised by combining all the factors in the model to ensure effective
retention. No one aspect is more important than another, but rather it is important to
look at an integration of all the factors mentioned.
214
5.4 Contribution to the body of knowledge
The study makes numerous significant contributions to the body of knowledge. The
first and most important contribution is the development of a conceptual model for the
retention of the scarce-skilled professionals in pathology. No such model exists, but
this one takes into account the relationships and variables of factors that affect
retention in pathology and the proxies for retention, which were intention to quit and
organisational commitment. A second important finding of the study was the fact that
two different retention strategies are required separately for professionals and non-
professionals in pathology. This had not been realised earlier, and no previous
studies had been conducted in the pathology field, comparing the retention of
professionals and non-professionals. The findings of this study revealed this very
important point. Thirdly, no previous studies had been conducted in the pathology
context that investigated retention and included the four important theories, the job
characteristics model, the career anchors, organisational commitment and the
intention to quit. Lastly the study is seen to contribute to the theory as well as the
practices of human resources.
5.5 Limitations and recommendations
One limitation of the study was that it was conducted exclusively in the pathology
field in three provinces. The model ought to be tested and adapted in fields other
than pathology and in other geographical areas. Because of this, the results of the
study cannot be generalised to the entire population in different fields.
The study on pathology was conducted exclusively in the private sector, so results
may differ in the public sector, and further research should be conducted there. The
results therefore cannot be generalised. Due to the small sample size the
215
instruments in this study could not be analysed and explored, as this would have
enhanced the value of the study.
The respondents who answered the questionnaires stated that the questionnaires
were very long and extremely time-consuming, so prospective respondents may
have lost interest in answering them towards the end of the survey. Future studies
should take this into account. The study did not take into account the larger macro-
environmental factors such as the social, environmental, political and economic
factors of retention, as these were regarded as beyond the scope of this study. It is
therefore recommended that future studies take this into consideration.
5.6 Summary
Chapter Five analysed the findings and drew conclusions from this. The conclusions
were then used to answer the objectives of the study. The main points drawn from
this chapter were that two different retention strategies are required, one for
professionals and another for non-professionals. The chapter concluded with a
proposed retention model, which was developed after all the findings had been
analysed and conclusions had been drawn from both the quantitative and qualitative
analyses. However, the model has its limitation, as it is specific to professionals in the
private pathology environment only. The limitations of the study were also discussed,
and further research is recommended to test the applied model in the public sector
and to adapt the model to other fields of research.

216
REFERENCES
Adams, S. 2005. South Africa’s five worst hospitals. [online]. South Africa. Available
from: <http://www.iol.co.za/news/south-africa/da-names-the-country-s-five
worst-hospitals-1.255324> [Accessed 20 April 2013].
Allgood, C., O’Rourke, K., Van Derslice, J., & Hardy, M. A. 2000. Job satisfaction
among nursing staff in a military health care facility, Military Medicine, 165(10),
757-761.
Allen, D., Bryant, P., & Vardaman, J. 2010. Retaining talent: Replacing
misconceptions with evidence-based strategies, Academy of Management
Perspective, 24(2), 48-64.
Allen, N. J., & Meyer, J. P. 1990. The measurement and antecedents of affective,
continuance and normative commitment to the organization, Journal of
Occupational Psychology, 61(1), 1-8.
Alnajjar, A. 1999. The impact of selected psycho-social variables upon employees’
organizational commitment in the United Arab Emirates, Social Behaviour and
Personality, An International Journal, 27(5), 523-535.
Arnold, H., & Feldman, D. 1982. A multivariate analysis of the determinants of job
turnover, Journal of Applied Psychology, 67(3), 350-360.
Awases, M., Gbary, A., Nyoni, J., & Chatora, R. 2005. Migration of health
professionals in six countries: A synthesis report. World Health Organization.
[online]. Brazzaville. Available from
<https://www.afro.who.int/dsd/migration6countiesfinal> Accessed 11
November 2014.
Badrick, P., & St John, A. 2012. Time to redefine the requirements for a medical
laboratory scientist, Australian Journal of Medical Science, 33(3), 107-121.
Bartol, K. M., & Martin, D. C. 1998. Management. New York: Pearson/Prentice Hall.
217
Barnabe, C., & Burns, M. 1994. Teachers’ job characteristics and motivation,
Educational Research, 36(1), 171-185.
Bass, B. M., & Avolio, B. J. 1994. Improving organizational effectiveness through
transformational leadership. London: Sage Publications.
Beck, J., & La Lopa, J. M. 2001. An exploratory application of Schein's career
anchors inventory to hotel executive operating committee members,
International Journal of Hospitality Management, 20(1), 15-28.
Blaauw, D., Ditlopo, P., Maseko, F., Chirwa, M., Mwisongo, A., Bidwell, P., Thomas,
S., Normand, C., 2013. Comparing the job satisfaction and intention to leave
of different categories of health workers in Tanzania, Malawi, and South
Africa, Global Health Action, 6(1), 58-67.
Blumberg, B., Cooper, D. R., & Schindler, P. S. 2005. Business research methods.
London: McGraw-Hill.
Blythe, J., Baumann, A., Zeytinoglu, I., & Denton, M. 2008. Nursing generations in
the contemporary workplace, Public Personnel Management, 37(2), 137-159.
Bueno, D. J. 1990. Warning: Retention may be dangerous to your organizations
health, Nursing Economics, 8(4), 239-243.
Burke, R. J. 1983. Career orientations of Type A individuals, Psychological Reports,
53(1), 979-989.
Buykx, P., Humphreys, J., Wakerman, J., & Pashen, D. 2010. Systematic review of
effective retention incentives for health workers and remote areas: Towards
evidence-based policy, Australian Journal of Rural Health, 18(3), 102-109.
Boje, D. M. 2000.Transformational leadership. [online]. New York. Available from:
<http://cbae.nmsu.edu/~dboje/teaching/338/transformationalLeadership.htm#f
1> [Accessed 1 December 2012].
Boojihawon, D. K. 2006. Strategy implementation: Structure, systems, culture and
change: Study guide for MBA B820. Milton Keynes: Open University.
218
Boonzaier, B. 2001. A review of research on the job characteristics model and the
attendant job diagnostic survey, South African Journal of Business
Management, 32(1), 11-25.
Bradshaw, D., Van Wyk, V. P., Laubscher, R., Nojilana, B., Groenewald, P., Nannan,
A., & Metcalf, C. 2010. Cause of death statistics for South Africa: Challenges
and possibilities for improvement, Medical Research Council African Medical
Journal, 99(9), 648-652.
Burch, V., & Reid, S. 2008. Fit for purpose? The appropriate education of health
professionals in South Africa, South African Medical Journal, 101(1), 90-101.
Cameron, P. J., Este, D. C., & Warthington, A. 2012. Professional, personal and
community: 3 domains of physician retention in rural communities, Canadian
Journal of Rural Medicine, 17(2), 47-55.
Cameron, S. 2006. Managing human performance: Study guide for B713. 2nd ed.
Milton Keynes: Open University.
Casey, R., & Robbins, J. 2010. The Hackman and Oldham job characteristics model:
Implications from four industries, International Journal of Business and Public
Administration, 7(2), 76-90.
Casey, R., Hilton, R., & Robbins, J. 2012. A comparison of motivation of workers in
the United States versus Nicaragua and Guatemala, utilizing the Hackman
and Oldham job characteristics model, International Journal of Business &
Public Administration, 9(3), 39-59.
Champoux, J. E. 1980. A three sample test of some extensions to the job
characteristics model of work motivation, Academy of Management Journal,
23(3), 466-478.
Charlesworth, J., Lewis, J., Martin, V., & Taylor, P. 2003. Investigating performance
and change: Study guide for B736. Milton Keynes: Open University.
Chaudhuri, A., & Stanger, H. 2005. Survey sampling, theory and methods. 2nd ed.
New York: CRC Press.
219
Chen, P. Y., & Krauss, A. D. 2014. The encyclopaedia of social science research
methods. Thousand Oaks: SAGE Publications.
Choc, N. S. 2010. Pearson's versus Spearman's and Kendall's correlation
coefficients for continuous data. Master's Thesis: University of Pittsburgh.
Coetzee, M., & Schreuder, A. M. G. 2008. A multi-cultural investigation of students’
career anchors at a South African higher education institution, South African
Journal of Labour Relations, 32(2), 121-132.
Cohen, A. 1993. Organizational commitment and turnover: A meta-analysis,
Academy of Management Journal, 36(5), 1140-1157.
Coldwell, D., & Herbst, F. 2004. Business research. Cape Town: Juta.
Cooper, D. R., & Schindler, P. S. 2011. Business research methods. New York:
McGraw-Hill.
Cottingham, S., DiaBartolo, B., Battistoni, S., & Brown, T. 2010. Partners in nursing:
A mentoring initiative to enhance nurse retention, Nursing Education
Perspectives, 32(4), 20-29.
Darvish, H., Najafi, Z., & Zara, R. 2003. Evaluate the level of talent management
competencies and its relationship with intention to quit the organization,
Journal of Basic and Applied Scientific Research, 2(10), 1068-1076.
Danziger, N., Rachman‐Moore, D., & Valency, R. 2008. The construct validity of
Schein's career anchors orientation inventory, Career Development
International, 13(1), 7-19.
Danzinger, N., & Valency, R. 2006. Career anchors: Distribution and impact on job
satisfaction: The Israeli case, Career Development International, 11(4), 293-
303.
De Long, J. 1981. Career anchors: A new concept in career development for the
professional educator, paper presented at the annual meeting of the American
Educational Research Association. New York: Macmillan Publishing.

220
De Long, T. J. 1982a. The career orientations of MBA alumni: A multidimensional
model, Educational Research Association. New York: Macmillan Publishing.
De Long. T. J. 1982b. Re-examining the career anchor model, Personnel, 59(3), 50-
61.
De Long, T. J. 1982c. Career orientations of rural educators: An investigation, The
Rural Educator, 4(2), 12-16.
De Long, T. J. 1983. Dentists and career satisfaction: An empirical view, Journal of
Dentistry for Children, 5(6), 179-185.
Department of Health Annual Report. 2014. Department of Health Annual Report,
2013-2014. [online]. South Africa. Available from:
<http://www.gov.za/sites/www.gov.za/files/Department_of
Health_Annual_Report_2014.pdf.South Africa> [Accessed August 2015].
Dey, S. 2009. Employee retention a key to organizational growth, Global Medical
Journal, 3(1), 45-49.
DeVaro, J., Li, R., & Brookshire, D. 2007. Analysing the job characteristics model:
New support from a cross-section of establishments, International Journal of
Human Sciences, 5(1), 20-25.
Dhammika, K., Ahmad, F., & Sam, T. 2012. Job satisfaction, commitment and
performance: Testing the goodness of measures of three employee outcomes,
South Asian Journal of Management, 19(2), 7-22.
Droar, D. 2006. Expectancy theory of motivation [online]. Available from:
<http://www.arrod.co.uk/archive/concept_vroom.ph> [Accessed 20 October
2013].
Doherty, J. 2010. Cost-effectiveness analysis for priority-setting in South Africa - what
are the possibilities? South African Medical Journal, 100(12), 816-821.

221
Dubinsky, A. J., Yammarino, F. J., & Jolson, M. A. 1995. An examination of the
linkages between personal characteristics and dimensions of transformational
leadership, Journal of Business and Psychology, 9(3), 315-335.
Duffield, C., & O’Brien-Pallas, L. 2004. Nurses who work outside nursing, Journal of
Advanced Nursing, 47(6), 10-24.
Dunn, M., Dastoor, B., & Sims, R. 2012. Transformational leadership and
organizational commitment: A cross-cultural perspective, Journal of
Multidisciplinary Research, 4(1), 45-60.
Ehlers, V. J. 2003. Professional nurses’ requests to remove their names from the
South African Nursing Council’s register. Part 1, SA Gesondheid, 8(2), 48-60.
Ehlers, V. J. 2006. Challenges nurses face in coping with the HIV/Aids pandemic in
Africa, International Journal of Nursing Studies, 43(4), 657-662.
Elangovan, A. R. 2001. Causal ordering of stress, satisfaction and commitment, and
intention to quit: A structural equations analysis, Leadership & Organization
Development Journal, 22(4), 159-165.
Felps, W., Mitchell, T., Hekman, D., Lee, T., Holtom, B., & Harman, W. 2009.
Turnover contagion: How co-workers’ job embeddedness and job search
behaviours influence quitting, Academy of Management Journal, 52(3), 545-
561.
Fenton-O’Creevy, M. 2006. Leadership in the new organization: Study guide for
B713. 2nd ed. Milton Keynes: Open University.
Fenton-O’Creevy, M., Lewis, J., & Martin, V. 2001. Templates: Study guide. Milton
Keynes: Open University.
Fenton-O’Creevy, M. 2007. Managing human resources: Study guide for B713. 2nd
ed. Milton Keynes: Open University.
Firth, L., Mellor, D. J., Moore, K. A., & Loquet, C. 2004. How can managers reduce
employee intention to quit? Journal of Managerial Psychology, 19(2), 170-187.
222
French, H., du Plessis, E., & Scrooby, B. 2011. The emotional well-being of the
nurse within the multi-skill setting, Health South Africa Gesond, 16(1), 553-
562.
Freund, R. J., Wilson, J. W., & Mohr, D. 2010. Statistical methods. 3rd ed. Vancouver:
Elservier.
Fried, Y., & Ferris, G. 1985. The validity of the job characteristics model: A review
and meta-analysis, Personnel Psychology, 40(2), 287-322.
Gary, T. H. 1990. Practical sampling. London: SAGE.
Geertz, C. 1973. The interpretation of cultures: Selected essays. New York: Basic
Books.
George, G., & Quinlan, T. 2007. Public-private sector partnerships as a means of
development in Africa, in the context of HIV/AIDS, Eurohealth, 14(2), 33-41.
Glissmeyer, M., Bishop, J. W., & Fass, R. D. 2007. Role conflict, role ambiguity, and
intention to quit the organization: The case of law enforcement officers,
Academy of Management Journal, 40(1), 82-111.
Gibbons, T. W. 1996. Motivational characteristics of job satisfaction for elementary
school teachers. Unpublished Doctoral Thesis. University of Saint Louis.
Good, P. I. 2013. The A-Z of error free research. Boca Roton: CRC Press.
Goštautaitė, B., & Bučiūnienė, A. 2010. Integrating job characteristics model into the
person-environment fit framework, Economics & Management Journal, 20(1),
505-511.
Grunfeld, E., Whelan, T. J., Zitzelsberger, L., Willan, A. R., Montesanto, B., & Evans,
W. K. 2000. Cancer care workers in Ontario: Prevalence of burnout, job stress
and job satisfaction, Canadian Medical Association Journal, 163(2), 166-169.
Haeberle, S., & Christmas, K. 2006. Recruitment and retention metrics: Implications
for leadership, Military Medicine Nursing Economics, 24(6), 328-330.
223
Hartmann, L. C., & Bambacas, M. 2000. Organizational commitment: A multi method
scale analysis and test of effects, International Journal of Organizational
Analysis, 8(1), 89-108.
Hackman, J., & Lawler, E. 1971. Employees reactions to job characteristics, Journal
of Applied Psychology, 55(3), 259-286.
Hackman, J. & Oldham, G. 1976. Development of the job diagnostic survey, Journal
of Applied Psychology, 60(2), 159-170.
Hackman, J., Oldham, G., Janson, R., & Purdy, K. 1975. A new strategy for job
enrichment, California Management Review, 17(4), 57-71.
Hannif, Z., & Vo, A. 2011. Call centre job functions and the quality of work life:
Revisiting the job characteristics model, International Journal of Business
Research, 11(2), 236-247.
Halbesleben, J., & Wheeler, A. 2008. The relative roles of engagement and
embeddedness in predicting job performance and intention to leave, Work &
Stress Journal, 22(3), 242-256.
Hausknecht, J. P., Rodda, J. M., & Howard, M. J. 2009. Targeted employee
retention: Performance-based and job-related differences in reported reasons
for staying, Human Resource Management, 48(1), 269-288.
Herzberg, F. 1966. Work motivation, Work & Stress Journal, 20(2), 303-304.
Hofstede, G. 1991. Cultures and organizations: Software of the mind. London:
McGraw-Hill.
Hofstede, G. 1988. Hofstede cultural dimensions. [online]. USA. Available
from<http://www.geert-hofstede.com/hofstede_united_states.shtml>
[Accessed 5 April 2013].
Holland, J. L. 1966. The psychology of vocational choice. Waltham: Blaisdell.
224
Holland, J. L. 1985. Making vocational choices: A theory of vocational personalities
and work environments. Englewood Cliffs: Prentice-Hall.
Hom, P., & Griffeth, R. 1991. A structural equations modelling test of a turnover
theory: Cross-sectional and longitudinal analysis, Journal of Applied
Psychology, 76(1), 350-366.
Hom, P., & Kinicki, A. 2001. Toward a greater understanding of how dissatisfaction
drives employee turnover, Academy Of Management Journal, 44(5), 975-987.
Horwitz, F. M., & Pundit, P. 2008. Job satisfaction and retention of nurses in the
South African labour market, South African Journal of Labour Relations, 32(2),
23-44.
Hytter, A. 2007. Retention strategies in France and Sweden, The Irish Journal of
Management, 8(8), 59-79.
Ingraham, P., & Rubaii-Barrett, A. 2007. Foundations of public administration.
Belmont: Wadsworth/Thomson.
Jain, M. 2011. Employee retention strategies for organizational success, Journal of
Social Welfare and Management, 165(3), 757-761.
Jenkins, J. G., Glick, W., & Gupta, N. 1983. Job characteristics and employee
responses, Academy of Management Proceedings, 22(3), 164-168.
Johnston, M., Varadarajan, P., Futrell, C., & Sager, J. 1987. The relationship
between organizational commitment, job satisfaction, and turnover among
new salespeople, Journal of Personal Selling & Sales Management, 7(3), 29-
38.
Jordan, Z. 2009. Magnet recognition and practice development: Two journeys
towards practice improvement in health care, Journal of Social Welfare and
Management, 165(3), 757-761.
225
Kaifeng, J., Dong, L., McKay, P., Lee, T., & Mitchel, T. 2012. When and how is job
embeddedness predictive of turnover? A meta-analytic investigation, Journal
of Applied Psychology, 97(5), 1077-1096.
Karantzas, G. C., Mellor, D., McCabe, M. P., Davison, T. E., Beaton, P & Mrckic, D.,
2011. Intentions to quite work among care staff working in the aged care
sector, The Gerontologist, (1)1, 1-11.
Katz, R. 1982. Career issues in human resource management. Englewood Cliffs:
Prentice-Hall.
Keane, S., Smith, T., Lincoln, M., & Fisher, S. 2010. Survey of the rural allied health
workforce in New South Wales to inform recruitment and retention, Australian
Journal of Rural Health, 19(1), 38-44.
Kothari, C. R. 2004. Research methodology: Methods and techniques. Deli:
Bloomsbury.
Kreitner, R., & Kinicki, A. 1999. Organizational behaviour. New York: McGraw-Hill.
Krejcie, R. V., & Morgan, D. W. 1970. Determining sample size for research activities,
Educational and Psychological Measurement, 38(1), 280-290.
Krishnan, S., & Singh, M. 2010. Outcomes of intention to quit of Indian IT
professionals, Human Resource Management, 49(3), 421-437.
Krishnaveni, R., & Ramkumar, N. 2013. Revalidation process for established
instruments: A case of Myer & Allen organization commitment scale: The
Institute of Chartered Financial Analysts of India, Journal of Organizational
Behaviour, 2(1), 7-17.
Kulik, C., Oldham, G., & Langner, P. 1988. Measurement of job characteristics:
Comparison of the original and the revised job diagnostic survey, Journal of
Applied Psychology, 73(3), 462-466.
226
Lawther, W. C. 1999. The role of public employees in the privatization process:
Personnel and transitional issues, Review of Public Personnel Administration,
19(1), 28-40.
Lei, P. W., & Wu, Q. 2007. Introduction to structural equation modelling: Issues and
practical considerations, Educational Measurement: Issues and Practice,
26(3), 33-43.
Lyons, S., & Linda, E. 2006. A comparison of the values and commitment of the
private sector, public sector, and para public sector employees, Public
Administration Review, 66(4), 605-618.
Loan-Clarke, J., Arnold, J., Coombs, C., Hartley, R., & Basley, S. 2010. Retention,
turnover and return-a longitudinal study of allied health professionals in Britain,
Human Resource Management Journal, 20(4), 391-406.
Longmore, B., & Ronnie, L. 2014. Human resource management practices in a
medical complex in the Eastern Cape, South Africa: Assessing their impact on
the retention of doctors, South African Medical Journal, 104(5), 368-371.
Manion, J. 2004. Nurture a culture of retention. Journal of Nursing Management,
34(1), 29-39.
Maritz, D. 2000. South African leaders’ emergence towards transformational
leadership, Management Today, 7(1), 16-18.
Maslow, A. H. 1943. A theory of human motivation, Psychological Review, 50(4),
370-382.
Mathieu, A., Bruvold, N., & Ritchey, P. 2000. Subcultural research on organizational
commitment with the 15 OCQ invariant instrument, Journal of Personal Selling
& Sales Management, 20(3), 129-138.
McDonald, J. A. 2013. Spring 2013 job satisfaction case study. [online]. Penn State.
Available from
<https://wikispaces.psu.edu/display/PSYCH484/Spring+2013+Job+Satisfactio
n+Case+Study+Page> [Accessed 11 May 2014].
227
McGregor, E. B. 1998. The public sector human resource puzzle: Strategic
management of a strategic resource, Public Administration Review, 48(6),
941-950.
Meyer, J., & Allen, N. 1991. A three-component conceptualization of organizational
commitment, Human Resource Management Review, 1(1), 61-89.
Meyer, J., & Allen, N. 1997. Commitment in the workplace. Thousand Oaks: SAGE
Publications.
Merlyn, L. 2003. The nursing shortage crisis: A familiar problem dressed in new
clothes: Part I, Leadership in Health Services, 16(1), 11-18.
Mitchell, T., Holtom, B., Lee, T., Sablynski, C., & Erez, M. 2001. Why people stay:
Using job embeddedness to predict voluntary turnover, Academy Of
Management Journal, 44(6), 1102-1121.
Morrison, E. E., Burke, G. C., & Greene, L. 2007. Meaning in motivation: Does your
organization need an inner life? Journal of the Historical Society of South
Australia, 48(6), 98-115.
Mokoka, E., Oosthuizen, M. J., & Ehlers, V. J., 2010, Retaining professional nurses
in South Africa: Nurse managers’ perspectives, Health SA Gesondheid 15(1),
484-497.
Myers, B. I., & McCauley, M. H. 1985. Manual: A guide to the development and use
of the Myers-Briggs type indicator. Palo Alto: Consulting Psychologists Press.
Neil, M., & Reimann, S. 2010. Managing human resources. New York: Blackwell
Publishing.
Nordvik, H. 1996. Relationships between Holland's vocational typology, Schein's
career anchors and Myers-Briggs' types, Journal of Occupational &
Organizational Psychology, 69(3), 263-275.
228
O’Neil, A., & Mary, L. 2008. Human resource leadership. [online]. New York.
Available from: <http://www.human-resources-health.com/content/6/1/10>
[Accessed 10 May 2013].
O’Neil, A., Mary, L., & Paydos, M. 2008. Improving retention and performance in civil
society in Uganda. [online]. Uganda. Available from: <http://www.human-
resources-health.com/content/6/1/11> [Accessed 30 May 2014]
O’Brien-Pallas, L., Duffield, C., & Hayes, l. 2006. Do we really understand how to
retain nurses? Journal of Nursing Management, 14(10), 262-270.
Oehley, A. M. 2007. The development and evaluation of a partial talent management
competency model, MSc Thesis: Stellenbosch University, South Africa.
Oldham, G., & Hackman, J. 2010. Not what it was and not what it will be: The future
of job design research, Journal of Organizational Behaviour, 31(2), 463-479.
Ofori, D. F., Sekyere-Abankwa, V., & Borquaye, B. 2012. Perceptions of the human
resource management among professionals: A Ghanaian study, International
Journal of Business and Management, 7(5), 159-178.
Paul, V. W., Gardner, D. C., & Haeffele, L. 2012. When to use what research design.
New York: Guilford Press.
Perry, C. 2008. Empowering primary care workers to improve health services
[online]. Mozambique. Available from: <http://www.human-resources-
health.com/content/6/1/14> [Accessed 18 November 2013].
Pepe, M. 2010. The impact of extrinsic motivational dissatisfies on employee level of
job satisfaction and commitment resulting in the intent to turnover, Journal of
Business and Economics Research, 8(9), 99-107.
Pienaar, J. W., & Bester, C. K. 2011. The impact of burnout on the intention to quit
among professional nurses in the Free State region - a national crisis, South
African, Journal of Psychology, 41(1), 113-122.
229
Pierce, J., Jussila, I., & Cummings, A. 2009. Psychological ownership within the job
design context: Revision of the job characteristics model, Journal of
Organizational Behaviour, 30(4), 477-496.
Phillip, G. I. 2012. Common errors in statistics and how to avoid them. 4th ed. New
York: Wiley Chichester.
Porath, C., Spreitzer, G., Gibson, C., & Garnett, F. 2012. Thriving at work: Toward its
measurement, construct validation, and theoretical refinement, Journal of
Organizational Behaviour, 33(2), 250-275.
Ramlall, S. 2004. A review of employee motivation theories and their implications for
employee retention within organizations, The Journal of the American
Academy of Business, Cambridge, 5(1), 52-63.
Renn, R., & Vandenberg, R. 1995. The critical psychological states: An
underrepresented component in job characteristics model research, Journal of
Management, 21(2), 279-288.
Roberts, K., & Glick, W. 1981. The job characteristics approach to task design: A
critical review, Journal of Applied Psychology, 66(2), 193-217.
Robbins, S. 2003. The truth about managing people and nothing but the truth. Upper
Saddle River: FT Prentice Hall.
Ross, G. F. 1992. Tourism and hospitality industry job-attainment beliefs and work
values among school leavers, International Journal of Hospitality
Management, 11(1), 319-330.
Schein, E. H. 1971. The individual, the organization and the career: A conceptual
scheme, Journal of Applied Behavioural Science, 7(4), 401-426.
Schein, E. H. 1975. Career anchors holds executives to their career paths,
Personnel, 52(3), 11-24.
Schein, E. H. 1990. Organizational culture, American Psychologist, 45(2), 109-119.
230
Schein, E. H. 1996. Career anchors revisited: Implications for career development in
the 21st century, Academy of Management Executive, 10(4), 80-88.
Schein, E. H. 2006. Participant workbook: Career anchors, 3rd ed. San Francisco:
Pfeiffer.
Scroggins, W. 2008. The relationship between employee fit perceptions, job
performance and retention: Implications of perceived fit, Employee
Responsibilities and Rights Journal, 20(1), 57-71.
Seldon, S., & Willow, J. 2007. Government’s largest investment: Human resource
management in states, counties, and cities. Baltimore: The Johns Hopkins
University Press.
Segaran, T. 2007. Programming collective intelligence: Building smart web 2.0
applications. Sebastopol: O'Reilly Media.
Shamoo, A., & Resnik, D. 2009. Responsible conduct of research. New York: Oxford
University Press.
Shipalana, M. L., & Phago, K. G. 2014. Turnover of health care professionals: A
focus on the Limpopo Province, Journal of Public Administration, 49(1), 330-
348.
Shirey, M. R. 2006. Authentic leaders creating healthy work environments for nursing
practice, American Journal of Critical Care, 15(3), 256-267.
Smith, S. 2013. Determining sample size: How to ensure you get the correct sample
size. New York: McGraw-Hill.
Stanz, K., & Greyling, J. 2010. Turnover of nursing employees in a Gauteng hospital,
group, South African Journal of Industrial Psychology, 36(1), 1-11.
Steers, R. M. & Porter, L. M. 1983. Motivation and work behaviour. Michigan:
McGraw-Hill.
231
Strachan, B., Zabow, T., & van der Spuy, Z. M. 2011. More doctors and dentists are
needed in South Africa, South African Medical Journal, 101(8), 523-528.
Stodel, J. M., & Stewart-Smith, A. 2011. The influence of burnout on skills retention
of junior doctors at Red Cross War Memorial Children's Hospital: A case
study, South African Medical Journal, 101(2), 115-118.
Studer, Q. 2004. The value of employee retention, Healthcare Financial
Management, 10(2), 52-57.
Suadicani, P., Bonde, J. P., Olesen, K., & Gyntelberg, F. 2013. Job satisfaction and
intention to quit the job, Occupational Medical, 63(2), 96-102.
Terre Blanche, M., Durrheim, K., & Painter, D. 2009. Research in practice: Applied
methods for the social sciences. Cape Town: UCT Press.
Thomas, A., Venter, A. B., & Boninelli, I. 2010. Addressing the nursing shortage at
Netcare: A new remedy or the same prescription? South African Journal of
Labour Relations, 34(1), 111-115.
Thomas, W. H., & Butts, L. 2009. Effectiveness of organizational efforts to lower
turnover intentions, the moderating role of employee locus of control, Journal
of Human Resource Management, 48(2), 289-310.
Thompson, A., Gamble, J., & Strickland, A. 2004. Strategy: Winning in the
marketplace. New York: McGraw-Hill Irwin.
Thompson, S. K. 2012. Sampling. 3rd ed. New York: Wiley Series.
Tiegs, R., Tetrick, L., & Fried, Y. 1992. Growth need strength and context
satisfactions as moderators of the relations of the job characteristics model,
Journal of Management, 18(3), 575-588.
Trochim, W. M. K. 2004. An introduction to concept mapping for planning and
valuation, Evaluation Program Plan, 12(1), 1-16.
232
Tung-Chun, H., & Wan-Jung, H. 2007. The causal relationship between job
satisfaction and organizational commitment, Social behaviour and personality:
An International Journal, 35(9), 1265-1275.
Turner, A. N., & Lawrence, P. R. 1965. Industrial jobs and the worker. Boston:
Harvard Graduate School of Business Administration.
Urdan, T. C. 2010. Statistics in plain English. 3rd ed. New York: Routledge.
Van Saane, N., Sluiter, J. K., Verbeek, J. H., & Frings-Dresen, M. H. 2003. Reliability
and validity of instruments measuring job satisfaction - a systematic review,
Occupational Medical Journal, 53(3), 191-200.
Van Teijlingen, E. R., Rennie, A. M., Hundley, V., & Graham, W. 2001. The
importance of conducting and reporting pilot studies: The example of the
Scottish Births Survey, Journal of Advanced Nursing, 34(3), 289-295.
Velaphi, S., & Rhoda, N. 2012. Reducing neonatal deaths in South Africa: Are we
there yet, and what can be done? South African Journal of Child Health, 6(3),
67-71.
Vroom, V. H. 1964. Work and motivation. New York: John Wiley & Sons.
Waldman, J. D., & Arora, S. 2010. Measuring retention rather than turnover: A
different complementary HR calculus, Human Resource Planning, 27(3), 6-9.
Wall, T., Clegg, C., & Jackson, P. 1978. An evaluation of the job characteristics
model, Journal of Occupational Psychology, 51(2), 83-196.
Weathington, B. L., Christopher, J. L., & Cunningham, D. J. 2012. Understanding
business research. New York: Wiley and Sons.
Wils, L., Wils, T., & Tremblay, M. 2010. Toward a career anchor structure: An
empirical investigation of engineers, Industrial Relations, 65(2), 236-256.
233
Wood, L., Winston, R. B., & Polkosnik, M. C. 1985. Career orientations and
professional development of young student affairs professionals, Journal of
College Student Personnel, 26(6), 533-538.
URL: World Health Organization. 2001. GBD 2000 Results (version 1). [online]. USA.
Available from: <http://www.who.int/evidence/bod> [Accessed April 2015].
Yao, X., & Wang, L. 2006. The predictability of normative organizational commitment
for turnover in Chinese companies: A cultural perspective, International
Journal of Human Resource Management, 17(6), 1058-1075.
Van Saane, N., Sluiter, J. H., Verbeek, A. M., & Frings-Dresen, A. 2003. Reliability
and validity of instruments measuring job satisfaction: A systematic review,
Occupational Medicine, 53(1), 191–200.
Zaiontz, C. 2014. Real statistics using Excel: Cronbach’s alpha. [online]. USA.
Available from: <http://www.real-statistics.com/reliability/cronbachs-alpha/>
[Accessed 23 February 2015].
234
APPENDIX ONE: COMBINED QUESTIONNAIRE
CONSENT TO PARTICIPATE IN RESEARCH
Development of a retention strategy model for scarce-skilled professionals in the
Health Sector
You are invited to participate in a research study conducted by Ms Shiksha Reddy
and Professor Renier Steyn (PhD, DLitt et Phil, PhD), from the University of South
Africa. This research forms part of my studies towards a PhD in Business
Leadership. Please read the following and decide whether you are interested in
participating in the study. You will be included in this study only if you are willing to
participate voluntarily.
PURPOSE OF THE STUDY
The aim of the research is to develop a retention strategy model for scarce-skilled
professionals in the laboratory environment. To date no effective retention strategy
has been implemented, which in turn had led to a serious problem of the shortage of
skilled professionals in the health sector resulting in poor service delivery and
increased patient deaths. The research will add to the body of knowledge and could
improve the quality of life.
CONFIDENTIALITY
Your privacy will be highly respected and your anonymity will be secured and
confidentiality maintained. All information will be strictly confidential and will be
disclosed only with your permission or as required by legislation (The Mental Health
Care Act, Act 17 of 2002).
235
PROCEDURES
You will be required to complete five questionnaires, which should take you a total of
about 45 minutes to complete. The questionnaires include a career anchor, job
diagnostic and job satisfaction, intention to quit and organisational commitment
questionnaires. Once you have completed answering all the questions, you will have
to click on SUBMIT.
POTENTIAL RISKS AND DISCOMFORTS
There are no foreseeable physical or psychological risks in participation. You will be
mildly inconvenienced by the time it takes to complete the questionnaire (45
minutes). If you would like to discuss the research and your reactions to the
questionnaire, you are welcome to do so after the session.
POTENTIAL BENEFITS TO SUBJECTS AND/OR TO SOCIETY
You will not directly benefit from your participation in the research. The results of the
research will, however, be of scientific and practical value in allowing the researcher
to find a retention strategy model that could find solutions to the long-standing
problem of shortage of scarce-skilled professionals. Should you wish for feedback on
the outcome of the study you can contact the researcher for the information.
PAYMENT FOR PARTICIPATION
You will receive no payment for your participation.
PARTICIPATION AND WITHDRAWAL
Participation is voluntary and you may withdraw at any time without any
repercussions.
236
IDENTIFICATION OF INVESTIGATORS
If you have any questions or concerns about the research, please feel free to contact
Shiksha Reddy on [email protected] or on 0829039779.
RIGHTS OF RESEARCH SUBJECTS
You may withdraw your consent at any time and cease participating without any
penalty. You are not giving up any legal rights because of your participation in this
research study. If you have questions regarding your rights as a research participant,
you may contact the Health Professionals Council of South Africa, Post Office Box
205, Pretoria, South Africa, (012) 338 9300 or any of the ethics committees of the
SBL University of South Africa.
SIGNATURE OF RESEARCH PARTICIPANT
I understand the procedures described above. My questions have been answered to
my satisfaction, and I agree to participate in this study. Kindly note that you will not
be required to sign this declaration; however you will indicate your consent by
completing the questionnaire. (A signed copy is not required, owing to anonymity.)
BIOGRAPHICAL INFORMATION
Your biographical information in this study is very important, and is required for
statistical purposes only. This information, as well as all your responses, will not be
revealed to any person other than the researcher(s). You are requested to mark with
a cross (X) inside the box that contains the information that best describes you.
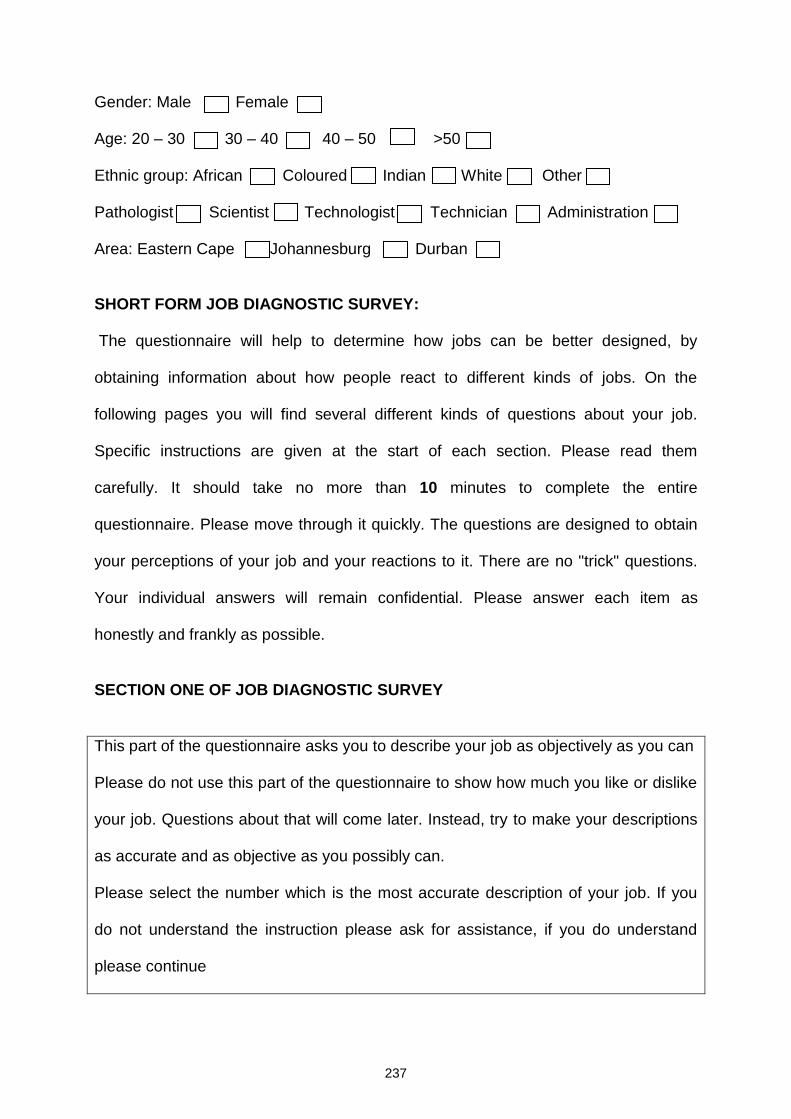
237
Gender: Male Female
Age: 20 – 30 30 – 40 40 – 50 >50
Ethnic group: African Coloured Indian White Other
Pathologist Scientist Technologist Technician Administration
Area: Eastern Cape Johannesburg Durban
SHORT FORM JOB DIAGNOSTIC SURVEY:
The questionnaire will help to determine how jobs can be better designed, by
obtaining information about how people react to different kinds of jobs. On the
following pages you will find several different kinds of questions about your job.
Specific instructions are given at the start of each section. Please read them
carefully. It should take no more than 10 minutes to complete the entire
questionnaire. Please move through it quickly. The questions are designed to obtain
your perceptions of your job and your reactions to it. There are no "trick" questions.
Your individual answers will remain confidential. Please answer each item as
honestly and frankly as possible.
SECTION ONE OF JOB DIAGNOSTIC SURVEY
This part of the questionnaire asks you to describe your job as objectively as you can
Please do not use this part of the questionnaire to show how much you like or dislike
your job. Questions about that will come later. Instead, try to make your descriptions
as accurate and as objective as you possibly can.
Please select the number which is the most accurate description of your job. If you
do not understand the instruction please ask for assistance, if you do understand
please continue
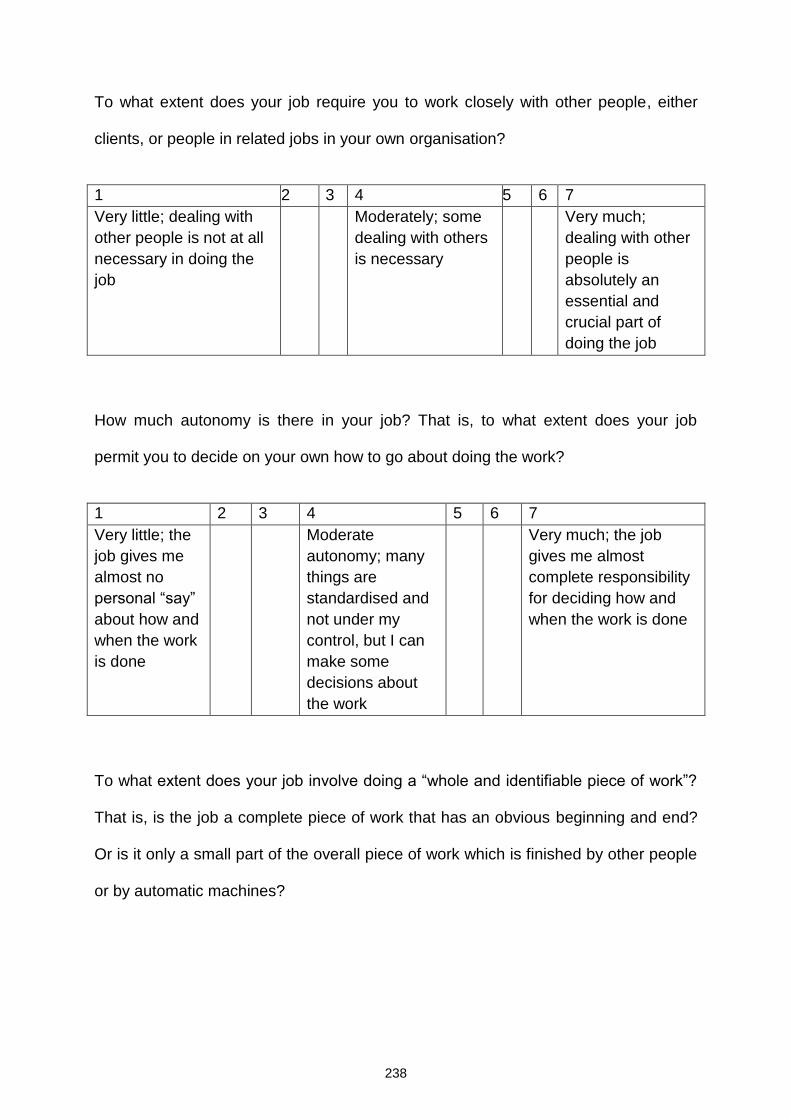
238
To what extent does your job require you to work closely with other people, either
clients, or people in related jobs in your own organisation?
1 2 3 4 5 6 7
Very little; dealing with
other people is not at all
necessary in doing the
job
Moderately; some
dealing with others
is necessary
Very much;
dealing with other
people is
absolutely an
essential and
crucial part of
doing the job
How much autonomy is there in your job? That is, to what extent does your job
permit you to decide on your own how to go about doing the work?
1 2 3 4 5 6 7
Very little; the
job gives me
almost no
personal “say”
about how and
when the work
is done
Moderate
autonomy; many
things are
standardised and
not under my
control, but I can
make some
decisions about
the work
Very much; the job
gives me almost
complete responsibility
for deciding how and
when the work is done
To what extent does your job involve doing a “whole and identifiable piece of work”?
That is, is the job a complete piece of work that has an obvious beginning and end?
Or is it only a small part of the overall piece of work which is finished by other people
or by automatic machines?
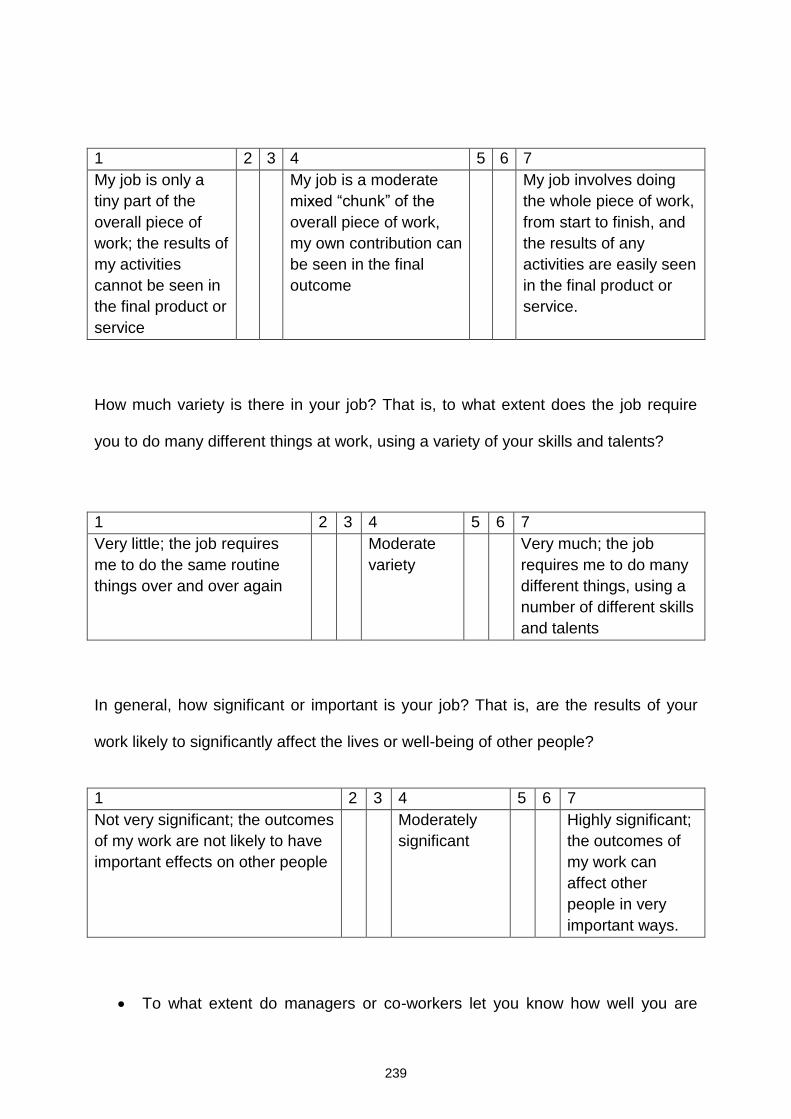
239
1 2 3 4 5 6 7
My job is only a
tiny part of the
overall piece of
work; the results of
my activities
cannot be seen in
the final product or
service
My job is a moderate
mixed “chunk” of the
overall piece of work,
my own contribution can
be seen in the final
outcome
My job involves doing
the whole piece of work,
from start to finish, and
the results of any
activities are easily seen
in the final product or
service.
How much variety is there in your job? That is, to what extent does the job require
you to do many different things at work, using a variety of your skills and talents?
1 2 3 4 5 6 7
Very little; the job requires
me to do the same routine
things over and over again
Moderate
variety
Very much; the job
requires me to do many
different things, using a
number of different skills
and talents
In general, how significant or important is your job? That is, are the results of your
work likely to significantly affect the lives or well-being of other people?
1 2 3 4 5 6 7
Not very significant; the outcomes
of my work are not likely to have
important effects on other people
Moderately
significant
Highly significant;
the outcomes of
my work can
affect other
people in very
important ways.
To what extent do managers or co-workers let you know how well you are

240
doing on your job?
1 2 3 4 5 6 7
Very little;
people
almost never
let me know
how well I am
doing.
Moderately;
sometimes people
may give me
“feedback;” other
times they may
not.
Very much; managers or co-
workers provide me with almost
constant “feedback” about how
well I am doing.
To what extent does doing the job itself provide you with information about your work
performance? That is, does the actual work itself provide clues about how well you
are doing- aside from any “feedback” co-workers or supervisors may provide?
1 2 3 4 5 6 7
Very little; the job
itself is set up so I
could work forever
without finding out
how well I am
doing.
Moderately;
sometimes doing
the job provides
‘feedback” to me;
sometimes it does
not.
Very much; the job is
set up so that I get
almost constant
“feedback” as I work
about how well I am
doing.
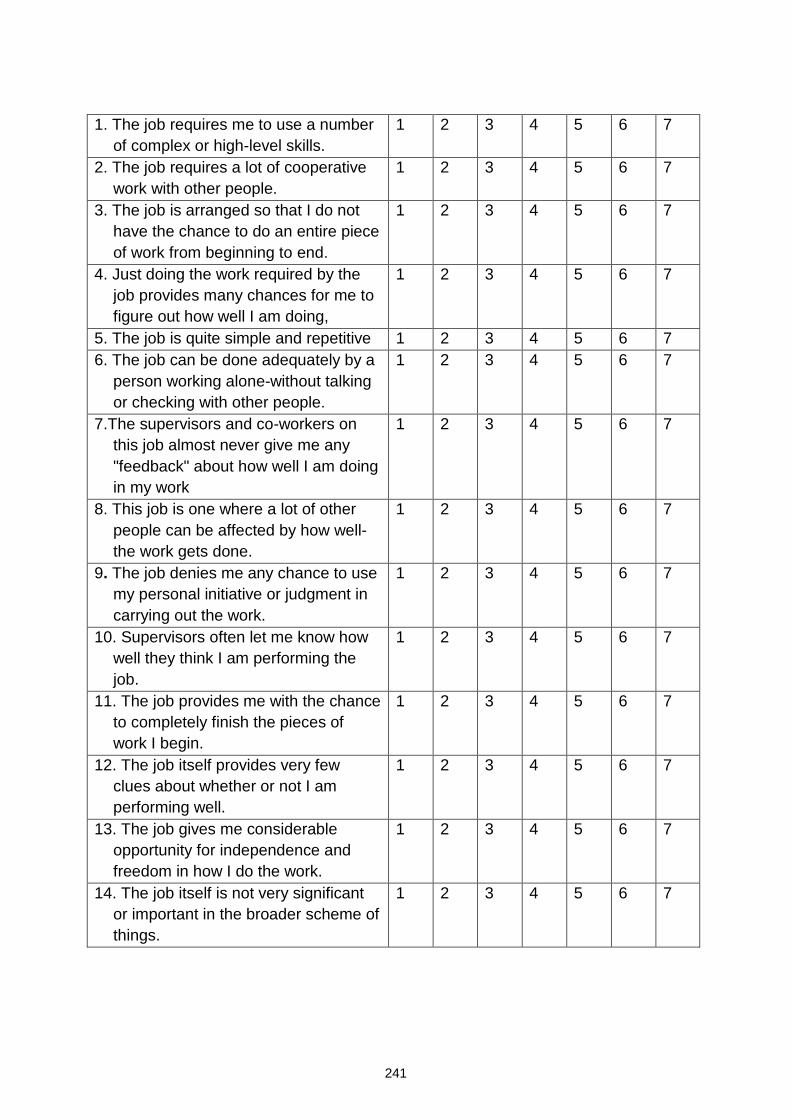
241
1. The job requires me to use a number
of complex or high-level skills.
1 2 3 4 5 6 7
2. The job requires a lot of cooperative
work with other people.
1 2 3 4 5 6 7
3. The job is arranged so that I do not
have the chance to do an entire piece
of work from beginning to end.
1 2 3 4 5 6 7
4. Just doing the work required by the
job provides many chances for me to
figure out how well I am doing,
1 2 3 4 5 6 7
5. The job is quite simple and repetitive 1 2 3 4 5 6 7
6. The job can be done adequately by a
person working alone-without talking
or checking with other people.
1 2 3 4 5 6 7
7.The supervisors and co-workers on
this job almost never give me any
"feedback" about how well I am doing
in my work
1 2 3 4 5 6 7
8. This job is one where a lot of other
people can be affected by how well-
the work gets done.
1 2 3 4 5 6 7
9. The job denies me any chance to use
my personal initiative or judgment in
carrying out the work.
1 2 3 4 5 6 7
10. Supervisors often let me know how
well they think I am performing the
job.
1 2 3 4 5 6 7
11. The job provides me with the chance
to completely finish the pieces of
work I begin.
1 2 3 4 5 6 7
12. The job itself provides very few
clues about whether or not I am
performing well.
1 2 3 4 5 6 7
13. The job gives me considerable
opportunity for independence and
freedom in how I do the work.
1 2 3 4 5 6 7
14. The job itself is not very significant
or important in the broader scheme of
things.
1 2 3 4 5 6 7
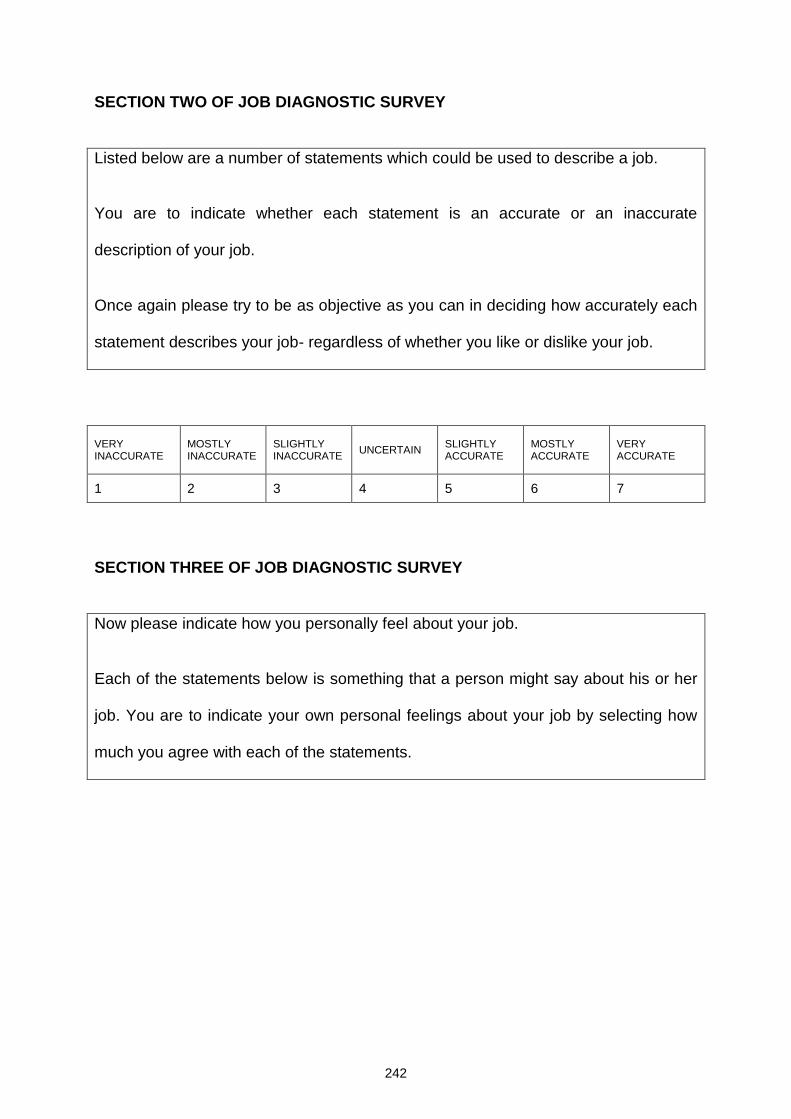
242
SECTION TWO OF JOB DIAGNOSTIC SURVEY
Listed below are a number of statements which could be used to describe a job.
You are to indicate whether each statement is an accurate or an inaccurate
description of your job.
Once again please try to be as objective as you can in deciding how accurately each
statement describes your job- regardless of whether you like or dislike your job.
VERY INACCURATE
MOSTLY INACCURATE
SLIGHTLY INACCURATE
UNCERTAIN SLIGHTLY ACCURATE
MOSTLY ACCURATE
VERY ACCURATE
1 2 3 4 5 6 7
SECTION THREE OF JOB DIAGNOSTIC SURVEY
Now please indicate how you personally feel about your job.
Each of the statements below is something that a person might say about his or her
job. You are to indicate your own personal feelings about your job by selecting how
much you agree with each of the statements.

243
How much do you agree with the statements?
STRONGLY
DISAGREE
DISAGREE DISAGREE
SLIGHTLY
NEUTRAL AGREE
SLIGHTLY
AGREE STRONGLY
AGREE
1 2 3 4 5 6 7
1. My opinion of myself goes up when I
do this job well.
1 2 3 4 5 6 7
2. Generally speaking, I am very satisfied
with this job.
1 2 3 4 5 6 7
3. I feel a great sense of personal
satisfaction when I do this job well.
1 2 3 4 5 6 7
4. 1 frequently think of quitting this job. 1 2 3 4 5 6 7
5. I feel bad and unhappy when I
discover that I have performed poorly
in this job.
1 2 3 4 5 6 7
6. I am generally satisfied with the kind of
work I do in this job.
1 2 3 4 5 6 7
7. My own feelings generally are not
affected much one way or the other by
how well I do in this job.
1 2 3 4 5 6 7
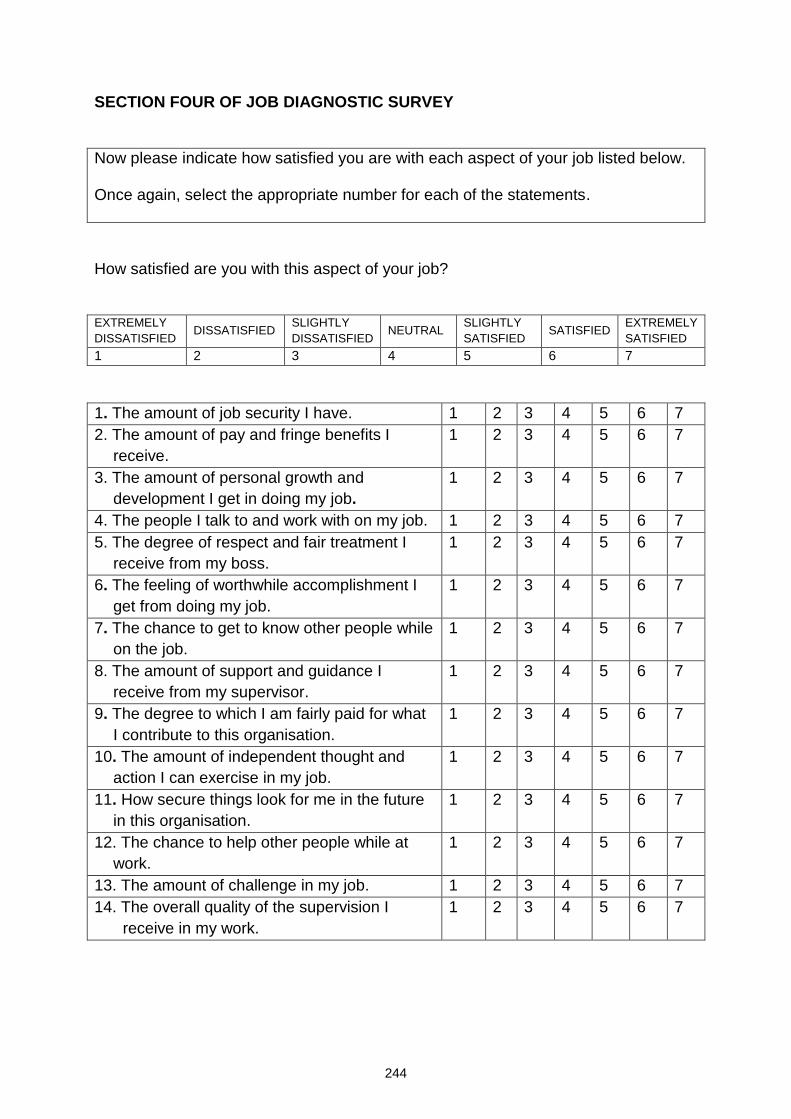
244
SECTION FOUR OF JOB DIAGNOSTIC SURVEY
Now please indicate how satisfied you are with each aspect of your job listed below.
Once again, select the appropriate number for each of the statements.
How satisfied are you with this aspect of your job?
EXTREMELY
DISSATISFIED DISSATISFIED
SLIGHTLY
DISSATISFIED NEUTRAL
SLIGHTLY
SATISFIED SATISFIED
EXTREMELY
SATISFIED
1 2 3 4 5 6 7
1. The amount of job security I have. 1 2 3 4 5 6 7
2. The amount of pay and fringe benefits I
receive.
1 2 3 4 5 6 7
3. The amount of personal growth and
development I get in doing my job.
1 2 3 4 5 6 7
4. The people I talk to and work with on my job. 1 2 3 4 5 6 7
5. The degree of respect and fair treatment I
receive from my boss.
1 2 3 4 5 6 7
6. The feeling of worthwhile accomplishment I
get from doing my job.
1 2 3 4 5 6 7
7. The chance to get to know other people while
on the job.
1 2 3 4 5 6 7
8. The amount of support and guidance I
receive from my supervisor.
1 2 3 4 5 6 7
9. The degree to which I am fairly paid for what
I contribute to this organisation.
1 2 3 4 5 6 7
10. The amount of independent thought and
action I can exercise in my job.
1 2 3 4 5 6 7
11. How secure things look for me in the future
in this organisation.
1 2 3 4 5 6 7
12. The chance to help other people while at
work.
1 2 3 4 5 6 7
13. The amount of challenge in my job. 1 2 3 4 5 6 7
14. The overall quality of the supervision I
receive in my work.
1 2 3 4 5 6 7

245
SECTION FIVE OF JOB DIAGNOSTIC SURVEY
Listed below are a number of characteristics which could be present in any job.
People differ about how much they would like to have each one present in their own
job. We are interested in learning how much you personally would like to have each
one present in your job.
Using the scale below, please indicate the degree to which you would like to have
each characteristic present in your job. NB. The numbers on this scale are
different from those used in previous scales.
4 5 6 7 8 9 10
Would like
having this
only a
moderate
amount or
less
Would like
having
this very
much
Would like
having this
very much
1. High respect and fair treatment from my supervisor. 4 5 6 7 8 9 10
2. Stimulating and challenging work. 4 5 6 7 8 9 10
3. Chances to exercise independent thought and action
in my job.
4 5 6 7 8 9 10
4. Great job security. 4 5 6 7 8 9 10
5. Very friendly co-workers 4 5 6 7 8 9 10
6. Opportunities to learn new things from my work. 4 5 6 7 8 9 10
7.High salary and good fringe benefits 4 5 6 7 8 9 10
8.Opportunitiee to be creative and imaginative in my
work
4 5 6 7 8 9 10
9. Quick promotions 4 5 6 7 8 9 10
10. Opportunities for personal growth and development
in my job.
4 5 6 7 8 9 10
11. A sense of worthwhile accomplishment in my work. 4 5 6 7 8 9 10
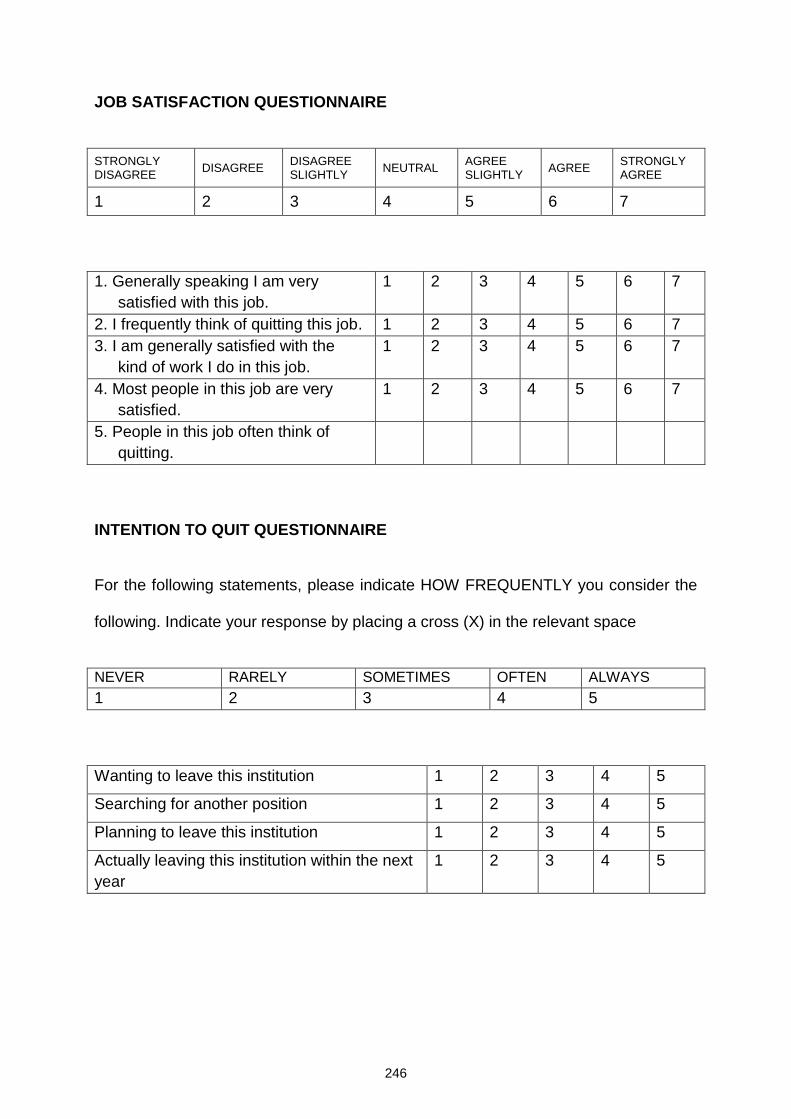
246
JOB SATISFACTION QUESTIONNAIRE
STRONGLY DISAGREE
DISAGREE DISAGREE SLIGHTLY
NEUTRAL AGREE SLIGHTLY
AGREE STRONGLY AGREE
1 2 3 4 5 6 7
1. Generally speaking I am very
satisfied with this job.
1 2 3 4 5 6 7
2. I frequently think of quitting this job. 1 2 3 4 5 6 7
3. I am generally satisfied with the
kind of work I do in this job.
1 2 3 4 5 6 7
4. Most people in this job are very
satisfied.
1 2 3 4 5 6 7
5. People in this job often think of
quitting.
INTENTION TO QUIT QUESTIONNAIRE
For the following statements, please indicate HOW FREQUENTLY you consider the
following. Indicate your response by placing a cross (X) in the relevant space
NEVER RARELY SOMETIMES OFTEN ALWAYS
1 2 3 4 5
Wanting to leave this institution 1 2 3 4 5
Searching for another position 1 2 3 4 5
Planning to leave this institution 1 2 3 4 5
Actually leaving this institution within the next
year
1 2 3 4 5
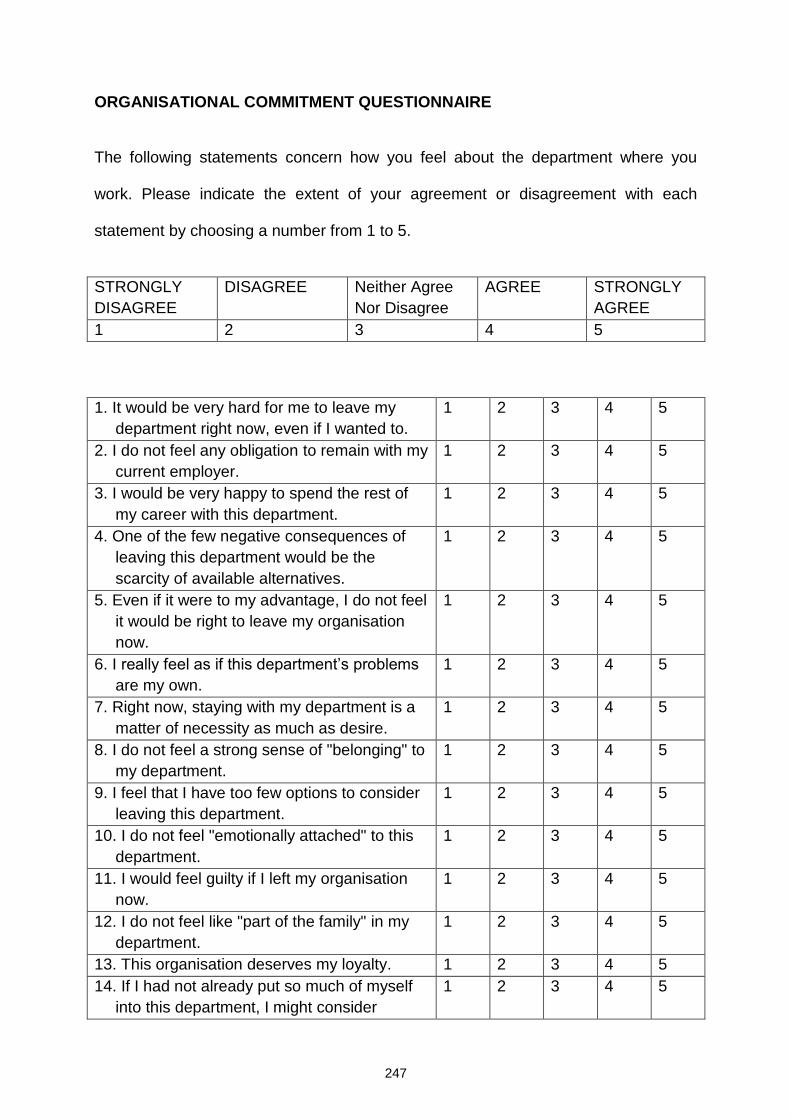
247
ORGANISATIONAL COMMITMENT QUESTIONNAIRE
The following statements concern how you feel about the department where you
work. Please indicate the extent of your agreement or disagreement with each
statement by choosing a number from 1 to 5.
STRONGLY
DISAGREE
DISAGREE Neither Agree
Nor Disagree
AGREE STRONGLY
AGREE
1 2 3 4 5
1. It would be very hard for me to leave my
department right now, even if I wanted to.
1 2 3 4 5
2. I do not feel any obligation to remain with my
current employer.
1 2 3 4 5
3. I would be very happy to spend the rest of
my career with this department.
1 2 3 4 5
4. One of the few negative consequences of
leaving this department would be the
scarcity of available alternatives.
1 2 3 4 5
5. Even if it were to my advantage, I do not feel
it would be right to leave my organisation
now.
1 2 3 4 5
6. I really feel as if this department’s problems
are my own.
1 2 3 4 5
7. Right now, staying with my department is a
matter of necessity as much as desire.
1 2 3 4 5
8. I do not feel a strong sense of "belonging" to
my department.
1 2 3 4 5
9. I feel that I have too few options to consider
leaving this department.
1 2 3 4 5
10. I do not feel "emotionally attached" to this
department.
1 2 3 4 5
11. I would feel guilty if I left my organisation
now.
1 2 3 4 5
12. I do not feel like "part of the family" in my
department.
1 2 3 4 5
13. This organisation deserves my loyalty. 1 2 3 4 5
14. If I had not already put so much of myself
into this department, I might consider
1 2 3 4 5
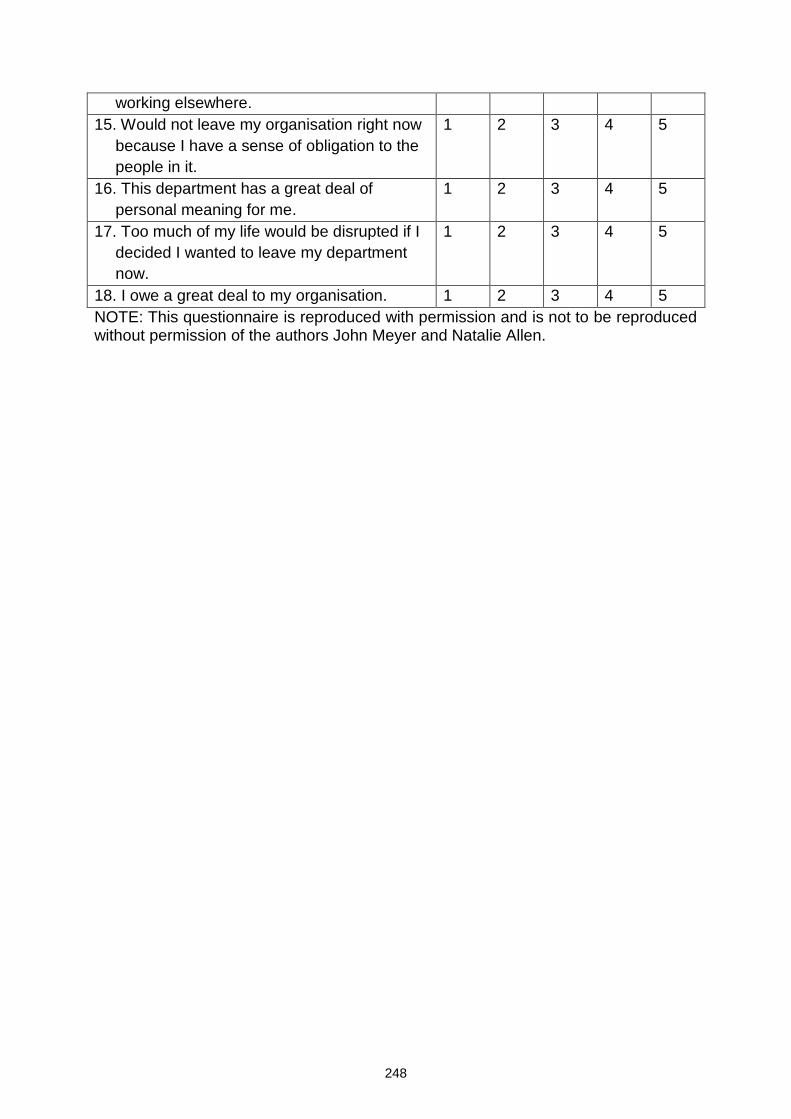
248
working elsewhere.
15. Would not leave my organisation right now
because I have a sense of obligation to the
people in it.
1 2 3 4 5
16. This department has a great deal of
personal meaning for me.
1 2 3 4 5
17. Too much of my life would be disrupted if I
decided I wanted to leave my department
now.
1 2 3 4 5
18. I owe a great deal to my organisation. 1 2 3 4 5
NOTE: This questionnaire is reproduced with permission and is not to be reproduced without permission of the authors John Meyer and Natalie Allen.
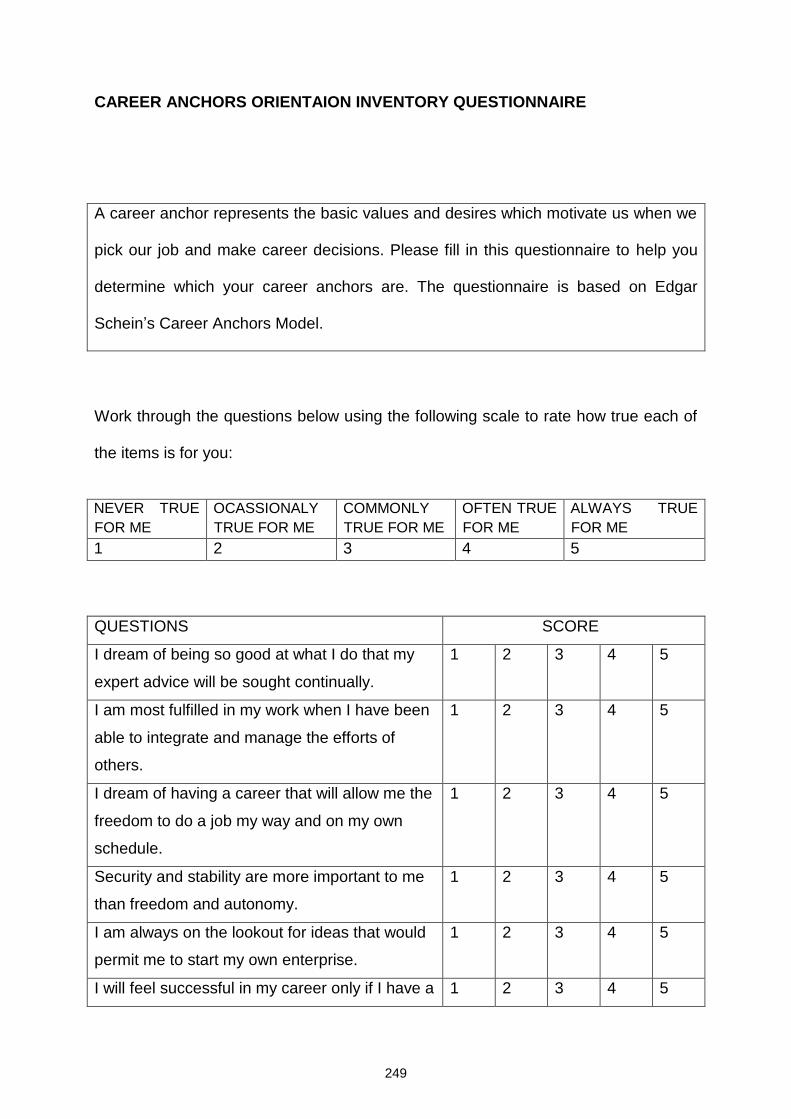
249
CAREER ANCHORS ORIENTAION INVENTORY QUESTIONNAIRE
A career anchor represents the basic values and desires which motivate us when we
pick our job and make career decisions. Please fill in this questionnaire to help you
determine which your career anchors are. The questionnaire is based on Edgar
Schein’s Career Anchors Model.
Work through the questions below using the following scale to rate how true each of
the items is for you:
NEVER TRUE
FOR ME
OCASSIONALY
TRUE FOR ME
COMMONLY
TRUE FOR ME
OFTEN TRUE
FOR ME
ALWAYS TRUE
FOR ME
1 2 3 4 5
QUESTIONS SCORE
I dream of being so good at what I do that my
expert advice will be sought continually.
1 2 3 4 5
I am most fulfilled in my work when I have been
able to integrate and manage the efforts of
others.
1 2 3 4 5
I dream of having a career that will allow me the
freedom to do a job my way and on my own
schedule.
1 2 3 4 5
Security and stability are more important to me
than freedom and autonomy.
1 2 3 4 5
I am always on the lookout for ideas that would
permit me to start my own enterprise.
1 2 3 4 5
I will feel successful in my career only if I have a 1 2 3 4 5

250
feeling of having made a real contribution to the
welfare of society.
I dream of a career in which I can solve
problems or win out in situations that are
extremely challenging.
1 2 3 4 5
I would rather leave my organisation than be put
into a job that would compromise my ability to
pursue personal and family concerns.
1 2 3 4 5
I will feel successful in my career only if I can
develop my technical or functional skills to a
very high level of competence.
1 2 3 4 5
I dream of being in charge of a complex
organisation and making decisions that affect
many people.
1 2 3 4 5
I am most fulfilled in my work when I am
completely free to define my own tasks,
schedules, and procedures.
1 2 3 4 5
I would rather leave my organisation altogether
than accept an assignment that would
jeopardise my security in that organisation.
1 2 3 4 5
Building my own business is more important to
me than achieving a high level managerial
position in someone else’s organisation.
1 2 3 4 5
I am most fulfilled in my career when I have
been able to use my talents in the service of
others.
1 2 3 4 5
I will feel successful in my career only if I face
and overcome very difficult challenges.
1 2 3 4 5
I dream of a career that will permit me to
integrate my personal, family and work needs.
1 2 3 4 5
Becoming a senior functional manager in my
area of expertise is more attractive to me than
becoming a general manager.
1 2 3 4 5
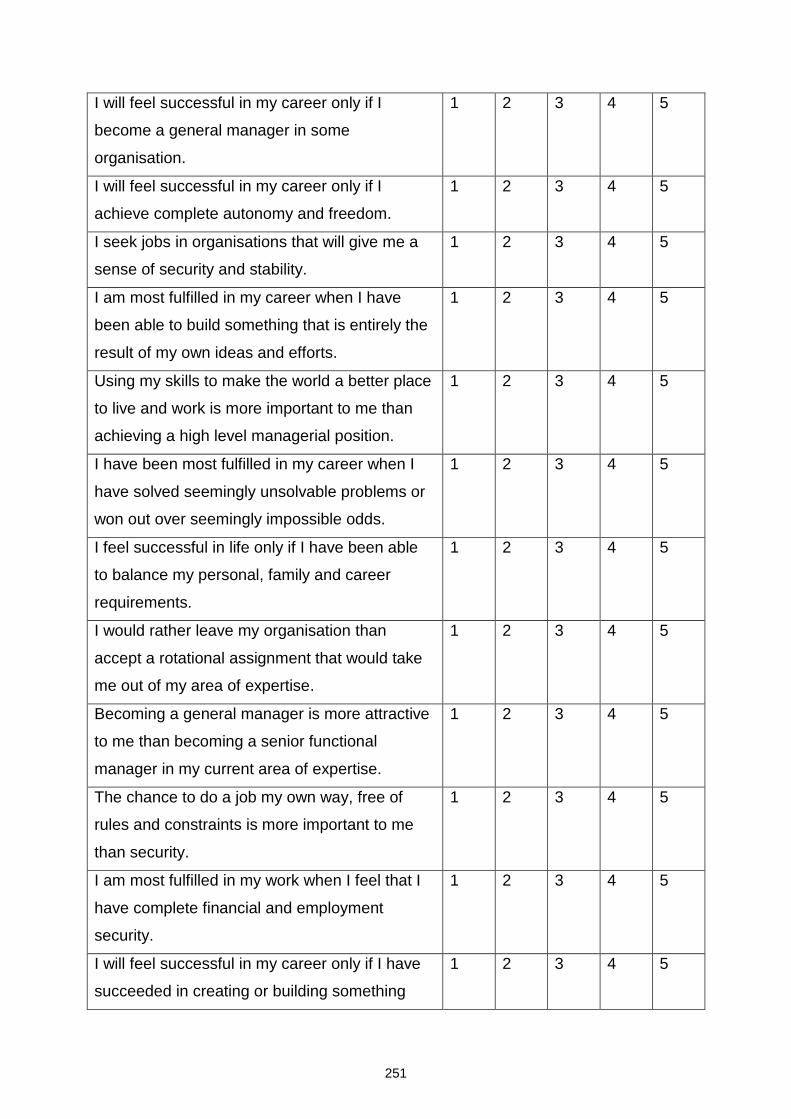
251
I will feel successful in my career only if I
become a general manager in some
organisation.
1 2 3 4 5
I will feel successful in my career only if I
achieve complete autonomy and freedom.
1 2 3 4 5
I seek jobs in organisations that will give me a
sense of security and stability.
1 2 3 4 5
I am most fulfilled in my career when I have
been able to build something that is entirely the
result of my own ideas and efforts.
1 2 3 4 5
Using my skills to make the world a better place
to live and work is more important to me than
achieving a high level managerial position.
1 2 3 4 5
I have been most fulfilled in my career when I
have solved seemingly unsolvable problems or
won out over seemingly impossible odds.
1 2 3 4 5
I feel successful in life only if I have been able
to balance my personal, family and career
requirements.
1 2 3 4 5
I would rather leave my organisation than
accept a rotational assignment that would take
me out of my area of expertise.
1 2 3 4 5
Becoming a general manager is more attractive
to me than becoming a senior functional
manager in my current area of expertise.
1 2 3 4 5
The chance to do a job my own way, free of
rules and constraints is more important to me
than security.
1 2 3 4 5
I am most fulfilled in my work when I feel that I
have complete financial and employment
security.
1 2 3 4 5
I will feel successful in my career only if I have
succeeded in creating or building something
1 2 3 4 5
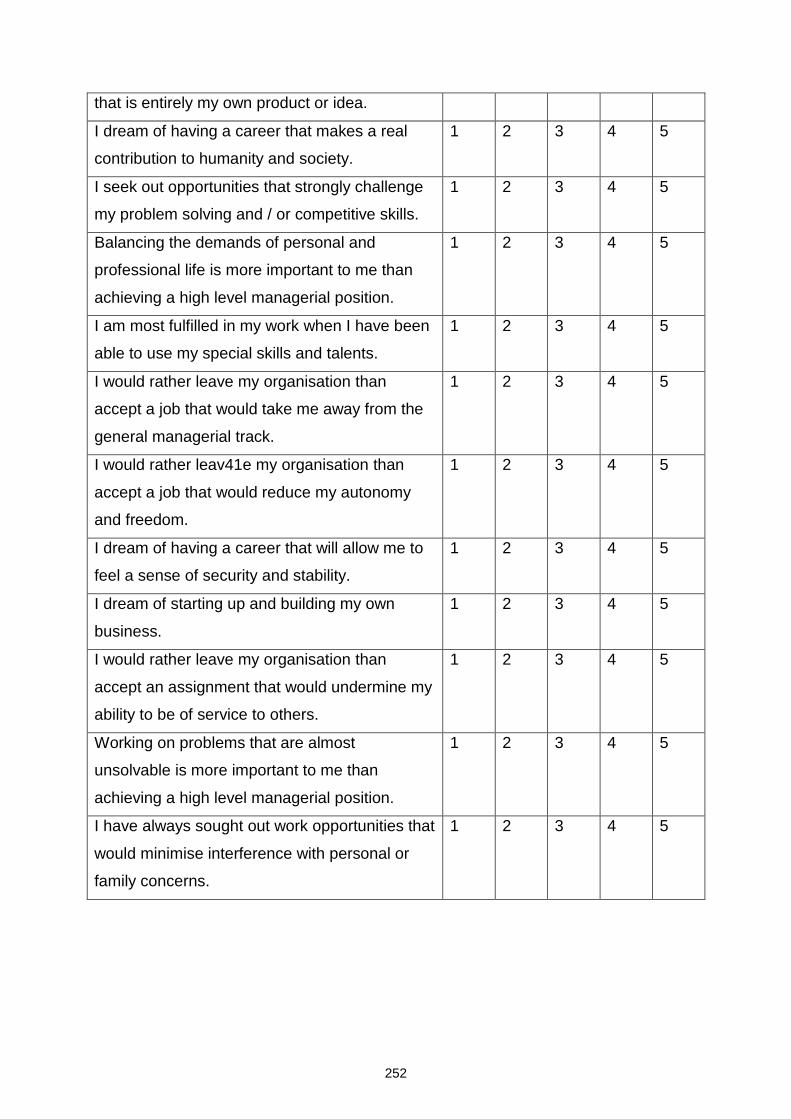
252
that is entirely my own product or idea.
I dream of having a career that makes a real
contribution to humanity and society.
1 2 3 4 5
I seek out opportunities that strongly challenge
my problem solving and / or competitive skills.
1 2 3 4 5
Balancing the demands of personal and
professional life is more important to me than
achieving a high level managerial position.
1 2 3 4 5
I am most fulfilled in my work when I have been
able to use my special skills and talents.
1 2 3 4 5
I would rather leave my organisation than
accept a job that would take me away from the
general managerial track.
1 2 3 4 5
I would rather leav41e my organisation than
accept a job that would reduce my autonomy
and freedom.
1 2 3 4 5
I dream of having a career that will allow me to
feel a sense of security and stability.
1 2 3 4 5
I dream of starting up and building my own
business.
1 2 3 4 5
I would rather leave my organisation than
accept an assignment that would undermine my
ability to be of service to others.
1 2 3 4 5
Working on problems that are almost
unsolvable is more important to me than
achieving a high level managerial position.
1 2 3 4 5
I have always sought out work opportunities that
would minimise interference with personal or
family concerns.
1 2 3 4 5

253
APPENDIX TWO: TABLE SHOWING QUESTIONS USED IN
THE CAREER ORIENTATION INVENTORY FOR EACH
CAREER ANCHOR
TF GM AU SE EC SV CH LS
Question Question Question Question Question Question Question Question
1 2 3 4 5 6 7 8
9 10 11 12 13 14 15 16
17 18 19 20 21 22 23 24
25 26 27 28 29 30 31 32
33 34 35 36 37 38 39 40
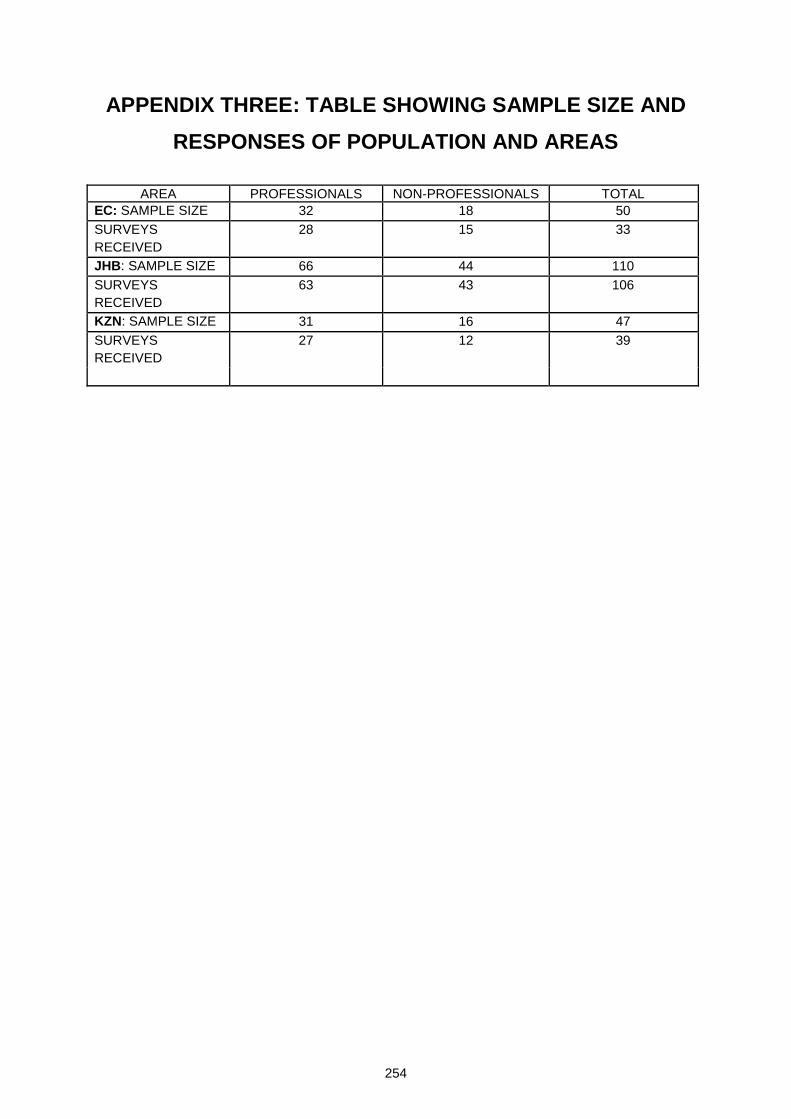
254
APPENDIX THREE: TABLE SHOWING SAMPLE SIZE AND
RESPONSES OF POPULATION AND AREAS
AREA PROFESSIONALS NON-PROFESSIONALS TOTAL
EC: SAMPLE SIZE 32 18 50
SURVEYS
RECEIVED
28 15 33
JHB: SAMPLE SIZE 66 44 110
SURVEYS
RECEIVED
63 43 106
KZN: SAMPLE SIZE 31 16 47
SURVEYS
RECEIVED
27 12 39
Copyright © 2022 FDOKUMEN