Intensive measurement of nitrous oxide emissions from a corn?soybean?wheat rotation under two...
15
Intensive measurement of nitrous oxide emissions from a corn–soybean–wheat rotation under two contrasting management systems over 5 years CLAUDIA WAGNER-RIDDLE, ADRIANA FURON, NICOLE L. MCLAUGHLIN, IVAN LEE, JOHN BARBEAU, SUSANTHA JAYASUNDARA, GARY PARKIN, PETER VON BERTOLDI and J O N W A R L A N D Department of Land Resource Science, University of Guelph, Guelph, ON, Canada N1G 2W1 Abstract No-tillage (NT), a practice that has been shown to increase carbon sequestration in soils, has resulted in contradictory effects on nitrous oxide (N 2 O) emissions. Moreover, it is not clear how mitigation practices for N 2 O emission reduction, such as applying nitrogen (N) fertilizer according to soil N reserves and matching the time of application to crop uptake, interact with NT practices. N 2 O fluxes from two management systems [conven- tional (CP), and best management practices: NT 1reduced fertilizer (BMP)] applied to a corn (Zea mays L.), soybean (Glycine max L.), winter-wheat (Triticum aestivum L.) rotation in Ontario, Canada, were measured from January 2000 to April 2005, using a micrometeorological method. The superimposition of interannual variability of weather and management resulted in mean monthly N 2 O fluxes ranging from 1.9 to 61.3 g N ha 1 day 1 . Mean annual N 2 O emissions over the 5-year period decreased significantly by 0.79 from 2.19 kg N ha 1 for CP to 1.41 kg N ha 1 for BMP. Growing season (May–October) N 2 O emissions were reduced on average by 0.16 kg N ha 1 (20% of total reduction), and this decrease only occurred in the corn year of the rotation. Nongrowing season (November–April) emissions, comprised between 30% and 90% of the annual emissions, mostly due to increased N 2 O fluxes during soil thawing. These emissions were well correlated (r 2 5 0.90) to the accumulated degree-hours below 0 1C at 5 cm depth, a measure of duration and intensity of soil freezing. Soil management in BMP (NT) significantly reduced N 2 O emissions during thaw (80% of total reduction) by reducing soil freezing due to the insulating effects of the larger snow cover plus corn and wheat residue during winter. In conclusion, significant reductions in net greenhouse gas emissions can be obtained when NT is combined with a strategy that matches N application rate and timing to crop needs. Keywords: crop and soil management, freeze-thaw cycles, nitrogen fertilization, nitrous oxide flux Received 10 November 2006; revised version received 16 February 2007 and accepted 9 March 2007 Introduction Increased concentrations of nitrous oxide (N 2 O) since preindustrial times are of concern as N 2 O contributes to the greenhouse effect in the troposphere (IPCC, 2001), and plays a role in the destruction of beneficial ozone in the stratosphere (Cicerone, 1989). N 2 O is produced by the microbiological processes of nitrification and deni- trification (Firestone & Davidson, 1989), and approxi- mately 60% of the total N 2 O emitted to the atmosphere is derived from soils, roughly a third of which is produced in agricultural soils (IPCC, 2001). The complex interplay of microbiological processes and soil conditions, such as water content, carbon (C) and nitrogen (N) content, temperature and pH (Granli &Bckman, 1994) regulates N 2 O dynamics in the soil profile, and how and when N 2 O is released from the soil surface. Management practices such as soil tillage, crop type, and the application of nitrogen fertilizers influ- ence the physical and hydrological condition of the soil and the timing and distribution of nutrient inputs. This Correspondence: Claudia Wagner-Riddle, fax 11 519 824 5730, e-mail: [email protected] Global Change Biology (2007) 13, 1722–1736, doi: 10.1111/j.1365-2486.2007.01388.x r 2007 The Authors 1722 Journal compilation r 2007 Blackwell Publishing Ltd
Transcript of Intensive measurement of nitrous oxide emissions from a corn?soybean?wheat rotation under two...
Intensive measurement of nitrous oxide emissions froma corn–soybean–wheat rotation under two contrastingmanagement systems over 5 years
C L A U D I A WA G N E R - R I D D L E , A D R I A N A F U R O N , N I C O L E L . M C L A U G H L I N , I VA N L E E ,
J O H N B A R B E A U , S U S A N T H A J AYA S U N D A R A , G A R Y PA R K I N , P E T E R V O N B E R T O L D I
and J O N WA R L A N D
Department of Land Resource Science, University of Guelph, Guelph, ON, Canada N1G 2W1
Abstract
No-tillage (NT), a practice that has been shown to increase carbon sequestration in soils,
has resulted in contradictory effects on nitrous oxide (N2O) emissions. Moreover, it is not
clear how mitigation practices for N2O emission reduction, such as applying nitrogen (N)
fertilizer according to soil N reserves and matching the time of application to crop
uptake, interact with NT practices. N2O fluxes from two management systems [conven-
tional (CP), and best management practices: NT 1reduced fertilizer (BMP)] applied to a
corn (Zea mays L.), soybean (Glycine max L.), winter-wheat (Triticum aestivum L.)
rotation in Ontario, Canada, were measured from January 2000 to April 2005, using a
micrometeorological method. The superimposition of interannual variability of weather
and management resulted in mean monthly N2O fluxes ranging from �1.9 to
61.3 g N ha�1 day�1. Mean annual N2O emissions over the 5-year period decreased
significantly by 0.79 from 2.19 kg N ha�1 for CP to 1.41 kg N ha�1 for BMP. Growing
season (May–October) N2O emissions were reduced on average by 0.16 kg N ha�1 (20% of
total reduction), and this decrease only occurred in the corn year of the rotation.
Nongrowing season (November–April) emissions, comprised between 30% and 90% of
the annual emissions, mostly due to increased N2O fluxes during soil thawing. These
emissions were well correlated (r2 5 0.90) to the accumulated degree-hours below 0 1C at
5 cm depth, a measure of duration and intensity of soil freezing. Soil management in
BMP (NT) significantly reduced N2O emissions during thaw (80% of total reduction) by
reducing soil freezing due to the insulating effects of the larger snow cover plus corn and
wheat residue during winter. In conclusion, significant reductions in net greenhouse gas
emissions can be obtained when NT is combined with a strategy that matches N
application rate and timing to crop needs.
Keywords: crop and soil management, freeze-thaw cycles, nitrogen fertilization, nitrous oxide flux
Received 10 November 2006; revised version received 16 February 2007 and accepted 9 March 2007
Introduction
Increased concentrations of nitrous oxide (N2O) since
preindustrial times are of concern as N2O contributes to
the greenhouse effect in the troposphere (IPCC, 2001),
and plays a role in the destruction of beneficial ozone in
the stratosphere (Cicerone, 1989). N2O is produced by
the microbiological processes of nitrification and deni-
trification (Firestone & Davidson, 1989), and approxi-
mately 60% of the total N2O emitted to the atmosphere
is derived from soils, roughly a third of which is
produced in agricultural soils (IPCC, 2001).
The complex interplay of microbiological processes
and soil conditions, such as water content, carbon (C)
and nitrogen (N) content, temperature and pH (Granli
& B�ckman, 1994) regulates N2O dynamics in the soil
profile, and how and when N2O is released from the soil
surface. Management practices such as soil tillage, crop
type, and the application of nitrogen fertilizers influ-
ence the physical and hydrological condition of the soil
and the timing and distribution of nutrient inputs. ThisCorrespondence: Claudia Wagner-Riddle, fax 11 519 824 5730,
e-mail: [email protected]
Global Change Biology (2007) 13, 1722–1736, doi: 10.1111/j.1365-2486.2007.01388.x
r 2007 The Authors1722 Journal compilation r 2007 Blackwell Publishing Ltd
in turn affects the size, composition and activity
of the soil microbial population, and therefore, the
extent of N2O production and emission from agricul-
tural soils.
Studies consistently have shown that by providing
additional N, fertilization can greatly increase N2O
emissions (Conrad et al., 1983; Bouwman, 1990; Aulakh
et al., 1992; Maggiotto et al., 2000). Therefore, applying N
according to soil N reserves and matching the time of
application to crop uptake, may increase N use effi-
ciency and potentially reduce N2O emissions (Mosier,
1994).
Storage of C in agricultural soils, through manage-
ment practices such as no-tillage (NT), has been identi-
fied as a potential measure to offset increasing global
CO2 levels (Lal et al., 1998). However, carbon and N
dynamics in soils are intrinsically linked, and soil
management practices to increase C in soils may actu-
ally increase N2O emissions, pointing to a need to
identify practices that minimize net greenhouse gas
emissions (Follett et al., 2005). This means quantifying
net fluxes of CO2 and N2O, and expressing them in
terms of CO2 equivalent by considering the global
warming potential of N2O, which is 296 times larger
than that for CO2 (IPCC, 2001).
NT soils are characterized by the surface accumula-
tion of crop residues and tend to be less aerated, have
greater C, N and water contents, and therefore higher
denitrification rates, particularly in the surface layer,
when compared with tilled soils (Staley et al., 1990;
McKenney et al., 1993). In addition, the amplitude in
temperature variation is decreased in NT soil, resulting
in cooler temperatures early in the growing season (GS)
(Drury et al., 1999), but warmer minimum winter
temperatures when compared with conventional
tillage (Gauer et al., 1982). Some of the changes in soil
conditions under NT, such as soil organic matter in-
crease, occur over long (410 years) time periods; other
changes associated with surface placement of residue
and lack of fragmentation due to tillage occur in the
short term (days or months) (Kay & VandenBygaart,
2002).
The complex interaction of soil factors affected by NT
likely explains the contradictory results obtained in
investigations into effects on N2O emissions. Some
studies have found that NT decreased N2O emissions
(Kessavalou et al., 1998; Lemke et al., 1999; Liebig et al.,
2005), whereas others reported no change (Robertson
et al., 2000; Grandy et al., 2006; Parkin & Kaspar, 2006) or
increased N2O emissions under NT (Aulakh et al., 1984;
McKenney et al., 1993; Ball et al., 1997; Mackenzie et al.,
1997). In a recent compilation of Canadian studies,
Helgason et al. (2005) observed that in humid regions
NT tended to increase N2O emissions, while in arid
regions emissions were reduced sometimes. Most of
these studies have used long-term (410 years) NT
plots, but as discussed above, N2O flux also could be
affected by short-term changes in soil conditions due
to NT.
Given that NT has the potential for carbon sequestra-
tion, as well as several other environmental benefits
(Holland, 2004), it is imperative to determine if match-
ing N application rate and timing to crop needs under
NT can reduce N2O emissions when compared with
conventional practices (CP). Indeed, it has been sug-
gested that N management strategies for long-term N2O
flux reduction under NT conditions should be the focus
of additional research (Six et al., 2004).
N2O fluxes from soil are highly episodic with peak
emissions occurring after wetting of a dry soil (Jorgensen
et al., 1998), following the application of ni-
trogen fertilizers (Maggiotto et al., 2000) and during
the thaw of frozen soils (Wagner-Riddle et al., 1997).
Thus, continuous and intensive sampling are re-
quired to quantify annual emissions. Soil freezing and
thawing occurs over 35% of the earth’s land area,
mainly in the Northern Hemisphere, including large
areas in Russia, middle North America, Northern
Europe (Williams & Smith, 1989) and Northern China
(Jin et al., 2000). Significant N2O losses have been
observed from cultivated soils over winter (Rover
et al., 1998; Teepe et al., 2000; van Bochove et al., 2000)
and during spring thaw (Bremner et al., 1980;
Wagner-Riddle & Thurtell, 1998; Dorsch et al., 2004).
In addition, a seasonal response of N2O emissions
to NT has been observed, with increased emissions
during summer but decreased emissions during
spring thaw in comparison with cultivated soil (Lemke
et al., 1998), emphasizing the need for year-round
measurements.
Here, we report on N2O fluxes from two management
systems applied to a corn (Zea mays L.), soybean (Gly-
cine max L.), winter-wheat (Triticum aestivum L.) rotation
in Ontario, Canada, measured from January 2000 to
April 2005, using a micrometeorological method. One
system, termed the conventional system, employed
conventional tillage and fertilization based on general
recommendations for each crop. The other system,
named the best management system, employed NT
(initiated in May 1999), fertilization based on soil tests
and timed to crop uptake, and use of a cover crop when
possible. The objectives of this study were (1) to eval-
uate the magnitude of N2O emission reduction due to
best management practices (BMP) for greenhouse gas
mitigation in comparison with CP; (2) to study the
seasonal variability in reduction of emissions due to
the interaction between management and weather over
5 years.
N 2 O E M I S S I O N S F R O M C O N T R A S T I N G M A N A G E M E N T 1723
r 2007 The AuthorsJournal compilation r 2007 Blackwell Publishing Ltd, Global Change Biology, 13, 1722–1736
Materials and methods
Site description
Flux measurements were performed at the Elora Re-
search Station (431390N 801250W, 376 m elevation),
Ontario, Canada, from January 2000 to April 2005. The
soil at the site is classified as an imperfectly drained
Guelph silt loam (29% sand, 52% silt, 19% clay), with
average pH of 7.6 (water), organic carbon of 27 g kg�1,
total N of 2 g kg�1, available P of 24 mg kg�1 and avail-
able K of 146 mg kg�1, in the 0–15 cm soil layer. The
experiment consisted of two management systems, one
using CP and one using BMP. Four plots were mon-
itored, each 150 m� 100 m (1.5 ha) in size, two plots for
each system (plots 1 and 4 for CP; 2 and 3 for BMP).
These plots were within a level and aerodynamically
homogeneous, 30 ha area, which was planted with the
same crop as used in the experimental area. Corn,
soybean and winter-wheat or barley had been grown
in rotation in the experimental plots over the previous
8 years. Crops had been fertilized with inorganic N
fertilizer at the recommended rates (70–90 kg N ha�1 for
winter-wheat or barley; 150 kg N ha�1 for corn). Solid
beef manure (16 Mg ha�1) had been applied to the site,
once every 3 years, following cereal harvest (last in fall
of 1998).
The crop sequence during the experiment, corn in
2000, soybean in 2001, winter wheat in 2002, corn in
2003, and soybean in 2004, was common for both
systems. Depending on the year, corn and soybeans
were planted in May or June. Soybeans were harvested
in September, and corn in October or November. Win-
ter-wheat was planted in October after soybean harvest
in 2001, and harvested in August 2002.
In the CP system, seedbed preparation at planting
consisted of disking and application of fertilizer N
according to the local, general recommendations
(OMAFRA, 2002). For corn (in May 2000 and 2003),
fertilizer N was supplied as granular urea broadcasted
at planting at a rate of 150 kg N ha�1. For winter wheat
(in April 2002) fertilizer N was applied as granular urea
broadcasted before the start of stem elongation at a rate
of 90 kg N ha�1. Fertilizer N was not applied to soy-
beans. Conventional tillage was practiced by mold-
board ploughing to a depth of 20 cm after harvest,
except for fall 2000, when ploughing was delayed until
spring 2001 due to weather conditions, and before
winter-wheat planting (after soybean harvest) in 2001,
when plots were only disked. Crop residue was
chopped after corn harvest (2000 and 2003) in CP plots
in order to facilitate residue incorporation.
In the BMP system, a combination of BMP was
performed. They were: NT, N fertilizer rate based on a
soil N test applied at a later date than in CP for corn,
and inclusion of a cover crop when possible. The BMP
plots were last tilled in May 1999, when the 30 ha area
was seeded to corn. For corn, a side-dress injection of
28% N (urea-ammonium nitrate solution) occurred at
the six-leaf stage with rate of N determined according to
a soil NO3� test (OMAFRA, 2002) on soil samples taken
at planting. Application rates were 50 and 60 kg N ha�1,
applied 30 and 45 days after planting, respectively, in
2000 and 2003. For wheat in 2002, consideration of
30 kg N ha�1 credits from the previous year’s soybean
crop allowed reduction of N applied as urea to
60 kg N ha�1 applied at the same time as for CP treat-
ment. Red clover (Trifolium pratense L.) was used as a
cover crop during winter of 2002/2003 by underseeding
it to winter wheat in March 2002, and chemically killing
in April 2003. Details on the timing of different manage-
ment practices in the two systems are given in Jayasun-
dara et al. (2006).
Micrometeorological measurements
The vertical flux of N2O was obtained using the flux-
gradient method:
FN2O ¼ �K@C
@z; ð1Þ
where K is the eddy diffusivity of N2O at height z and
@C/@z is the N2O concentration gradient at height z.
Assumption of similarity between sensible heat and
N2O turbulent transport, and integration of Eqn (1)
between heights z1 and z2 results in
FN2O ¼u�kDC
ln z2�dz1�d
� �� ch2
þ ch1
h i ; ð2Þ
where u�is the friction velocity, k is the von Karman
constant (50.41), DC is the N2O concentration differ-
ence between heights z2 and z1, d is the displacement
height, and ch2and ch1
are the integrated Monin–
Obukhov similarity functions for heat for both sampling
heights. These functions were calculated using the
stability parameter (z�d)/L, where L is the Obukhov
length, according to empirical expressions derived by
Dyer & Hicks (1970) and Paulson (1970), as reported in
Wagner-Riddle et al. (1996).
The concentration of N2O was measured at heights z2
and z1, spaced 40 cm apart, using a tunable diode laser
trace gas analyzer (TGA100, Campbell Scientific, Logan,
UT, USA). An air intake made of copper tubing
(12.7 mm i.d.) was placed at each height and connected
to one of the two ports of a solenoid valve (Mark 15 line,
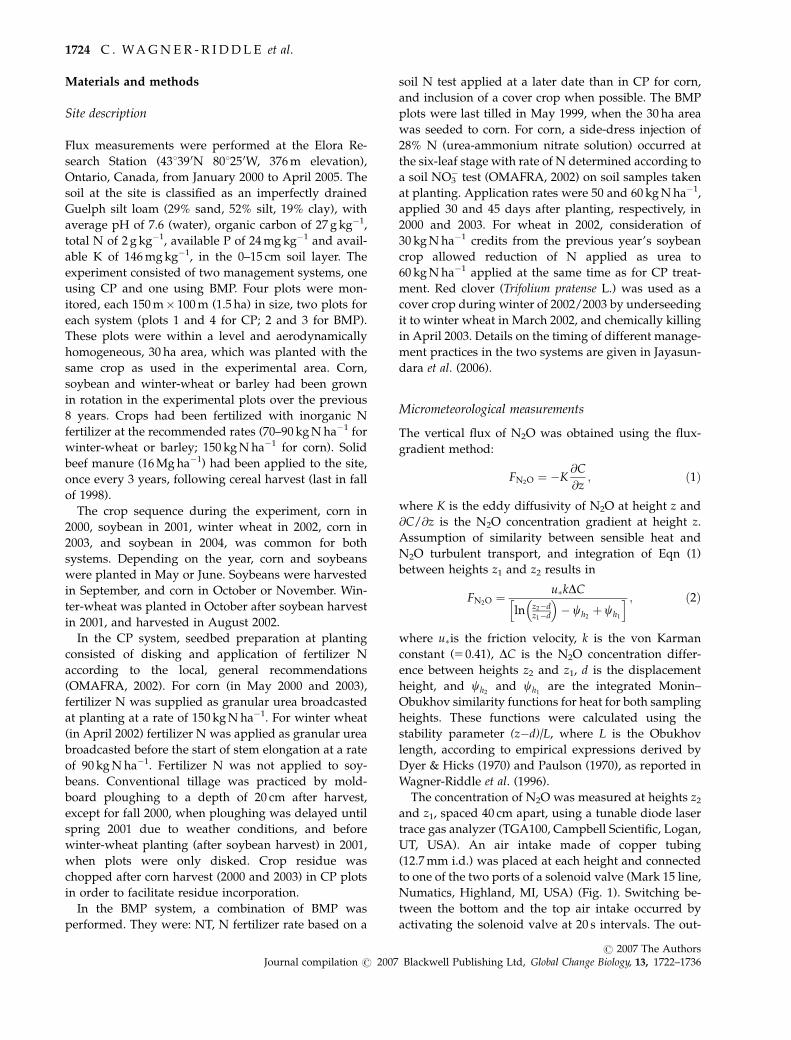
Numatics, Highland, MI, USA) (Fig. 1). Switching be-
tween the bottom and the top air intake occurred by
activating the solenoid valve at 20 s intervals. The out-
1724 C . WA G N E R - R I D D L E et al.
r 2007 The AuthorsJournal compilation r 2007 Blackwell Publishing Ltd, Global Change Biology, 13, 1722–1736
put of the solenoid valve was connected to a filter
holder (47 mm in-line, Gelman Sciences, Ann Arbor,
MI, USA) with a 2mm Teflo filter, followed by a multi-
tube dryer (Perma Pure products, Toms River, NJ,
USA), and a severe service needle valve (Whitey, High-
land Heights, OH, USA). The sampled air then traveled
through polyethylene tubing (12.7 mm i.d.) to a three-
way valve (Ascoelectric Ltd, Brantford, ON) (Fig. 1)
placed inside an instrumentation trailer. The tubing
length varied between plots, and was 60, 95, 88, and
180 m for plots 1, 2, 3, and 4, respectively, due to the
asymmetrical layout of the experimental site. Each one
of the four 1.5 ha plots studied had its own air sampling
system, comprised of two air intakes, solenoid valve,
filter, drier, needle valve, tubing and three-way valve.
Each drier was fixed to a stake approximately in the
center of each plot, except during the corn GS when the
drier was placed at the edge of the plots. The four three-
way valves (one for each plot) were mounted on a
manifold inside the instrumentation trailer, with all
‘off’ positions connected to a vacuum pump (RB 0040,
Busch, Virginia Beach, VA, USA) (pump A in Fig. 1),
and all ‘on’ positions connected to the TGA100. A
second vacuum pump (RB 0021, Busch) (pump B, Fig.
1) was used to draw sampled air from the valve mani-
fold into the TGA100, which was operated at a pressure
of about 50 mb. One three-way valve was activated for
1 h in sequence so that air originating from one plot at a
time was analyzed over 1 h. Air samples from the other
three plots (i.e. three-way valves that were not acti-
vated) were discarded. The purge flow of each drier
was directed to a manifold via 60–180 m of vinyl tubing
(19-mm, Rubberline, Guelph, ON, USA) which in turn
was connected to the RB 0040 pump. A flowmeter
(Visiflow, Dwyer Instruments, Michigan City, IN,
USA) was used to regulate the purge air flow in each
drier (1.5 L min�1).
The liquid nitrogen cooled laser (serial number 1085–
14, Laser Analytics Inc., Bedford, MA, USA) in the
TGA100 was operated at a temperature of 89.2 K, a
current of 257 mA, and a wavenumber of 2233.3 cm�1.
Switching between the two intake heights over each
plot was controlled by the analyzer’s software, which
also calculated N2O concentrations at a frequency of
10 Hz. The software selected 10 Hz data for each intake
height to be used in calculating hourly concentration
values after accounting for air sample travel time and
removing data points which consisted of an air mixture
of both sample heights. The average hourly difference in
N2O concentration between the two heights was then
calculated using the remaining data points (Wagner-
Riddle et al., 2005).
Hourly friction velocity and sensible heat flux,
needed for calculating the Obukhov length and estimat-
ing the stability functions, were measured with two
sonic anemometers (CSAT3, Campbell Scientific, Logan,
UT, USA), one for each treatment. A tower with four
cup anemometers (F460, Climatronics Corp., Newton,
PA, USA), was placed in one plot of each treatment, and
hourly wind speed profiles were recorded. Data from
sonic and cup anemometers were used in the logarith-
mic wind profile equation to iteratively solve for dis-
placement height (d) and roughness length (zo). Mean d
and zo for specific periods, taking into account changes
in surface conditions over the year, were then calcu-
lated. These means were directly used to calculate flux,
and to estimate u� with measured wind speeds in the
logarithmic wind profile equation (d and zo). The latter
calculation was necessary when the sonic anemometer
did not yield data (e.g. due to rainy or foggy condi-
tions). For those periods, stability corrections in the
wind profile equation were calculated using an estimate
of sensible heat flux based on measured net radiation
(CNR1, Kipp and Zonen, Delft, the Netherlands). This
approach yielded an N2O flux that related linearly
(r2 5 0.95) with flux values calculated using a directly
measured u�, and allowed for calculation of fluxes for
rainy periods, which are extremely important for esti-
mation of total annual N2O emissions.
Measured hourly N2O concentrations that met the
following criteria were selected for concentration dif-
ference calculations: hourly SD o100 ppb; analyzer
operating pressure 430 and o70 mb; difference in
Pump B
TGA
Pump A
Valve A
Valve B
Drier
Air intakes
Filter
Needle valve
Needle valve and flowmeter
Purge line
Sample tubing
Drier purge flow manifold
Fig. 1. Diagram of the air sampling system used over four
1.5 ha plots at the Elora Research Station from January 2000 to
April 2005. Valve A denotes solenoid valve used for switching
between upper and lower air intake. Valve B denotes three-way
valve used for selecting air over 1 h from plots 1–4 in sequence.
Vacuum pump A was used for purging driers and bringing
sampled air to three-way valves, while pump B was used to
draw sampled air through the trace gas analyzer (TGA).
N 2 O E M I S S I O N S F R O M C O N T R A S T I N G M A N A G E M E N T 1725
r 2007 The AuthorsJournal compilation r 2007 Blackwell Publishing Ltd, Global Change Biology, 13, 1722–1736
analyzer pressure when measuring air sampled from
upper and lower intakes o2 mb; and number of sam-
ples per hour 480% of maximum possible number of
data points. Hourly wind speed and friction velocity
41.0 and 40.1 m s�1, respectively, were selected for
turbulence calculations. The stability parameter (z�d)/
L was constrained to values o2 and 4�5, as these were
the conditions for which the empirical stability func-
tions were derived (Arya, 1988). In addition, wind
direction recorded at the Elora weather station (100 m
from the experimental site) was used in conjunction
with air intake and cup anemometer heights and tower
position within plots, to select periods when the wind
direction allowed for a fetch-to-height ratio of at least
50 : 1 (horizontal distance to height of measurement
ratio). According to theory developed by Leclerc &
Thurtell (1990), this criterion assured that 480% of
the flux measured originated within the experimental
plots monitored, depending on atmospheric stability
conditions, and height of the crop.
Filtered data were used in Eqn (2) to calculate hourly
N2O flux for each plot. Owing to the sequential air
sampling setup used, a maximum of six hourly flux
values were calculated for each plot per day (e.g. at 1:00,
5:00, 9:00, 13:00, 17:00, 21:00 h for plot 1). Daily flux
means for each plot were obtained by averaging hourly
values collected during a day (minimum of two hourly
values). Fluxes for days with missing data were inter-
polated by averaging means occurring on days adjacent
to the missing value. For long periods with missing data
(41 month) an average obtained from data in adjacent
months for all plots was used, in order to not bias the
overall comparison of treatment means. The daily inter-
polated flux data set expressed in kg N2O–N ha�1 day�1
was then summed to yield monthly and annual N2O
emission.
Continuous periods with missing data occurred
mostly when instrumentation was removed from the
plots for field operations such as soil tillage, planting
and harvest. These data gaps varied from 6 to 40 days,
the latter in fall 2000 when weather conditions delayed
soil tillage until a decision was made to defer ploughing
until spring. In addition, problems with the trace gas
analyzer from end of August to October 2004 resulted in
a 70 days data gap. The percent of daily data capture for
May to October was 50% in 2000, 80% in 2001, 60% in
2002, 32% in 2003, 49% in 2004. For the November to
April period data capture was 66% in 2000/2001, 94% in
2001/2002, 92% in 2002/2003, 79% in 2003/2004 and
87% in 2004/2005. The difference between periods was
mostly due to fetch to height requirements that were met
more frequently during the nongrowing season (NGS).
Over the 5 years, 5015 daily fluxes were used in this
study, obtained from a total of 22 214 hourly fluxes.
Supporting data
Air temperature, precipitation and snow depth on the
ground were obtained from the Elora weather station.
In addition, snow depth on the ground was measured
on each plot at several points (at least five) using a ruler.
Soil temperature was measured at 5 cm depth using
thermistors (Model #107, Campbell Scientific), and soil
water content in the 0–10 cm layer using reflectometers
(Model CS615, Campbell Scientific) (McCoy et al., 2006).
Five soil samples from the 0 to 30 cm soil layer were
taken per plot on a biweekly basis during the GS and
then monthly after harvest. The five sampling points
were selected at 25 m intervals along a transect in the
middle of each 1.5 ha plot. Samples were kept on ice
in a cooler until transported to the laboratory. Ex-
changeable NH41 and NO3
� nitrogen were extracted
from the field moist soil with 2 M KCl (at 1 : 5 soil : ex-
tractant ratio) within 24 h after sampling. Concentra-
tions of NO3–N in soil KCl extracts were measured by
copper cadmium reduction to nitrite (Technicon Indus-
trial Method No. 824–89T), and of NH4–N by the
indophenol blue method (Technicon Industrial Method
No. 820–89T).
Statistical analyses
The probability distribution of N2O fluxes has been
shown to follow log normal or highly skewed (e.g.
reverse J shaped) distributions (Yates et al., 2006). This
was also the case for daily flux values observed in this
study. Hence, treatment effects were tested by paired
comparison of daily medians using the Wilcoxon signed
rank-test (Steel et al., 1997). This statistical test was
performed using measured values, that is, without
considering the interpolated daily means, so as not to
bias treatment comparisons. The experimental area was
arranged in a randomized complete block design,
where plot 1 was paired with plot 2, and plot 3 was
paired with plot 4.
Results and discussion
Overview of experimental conditions
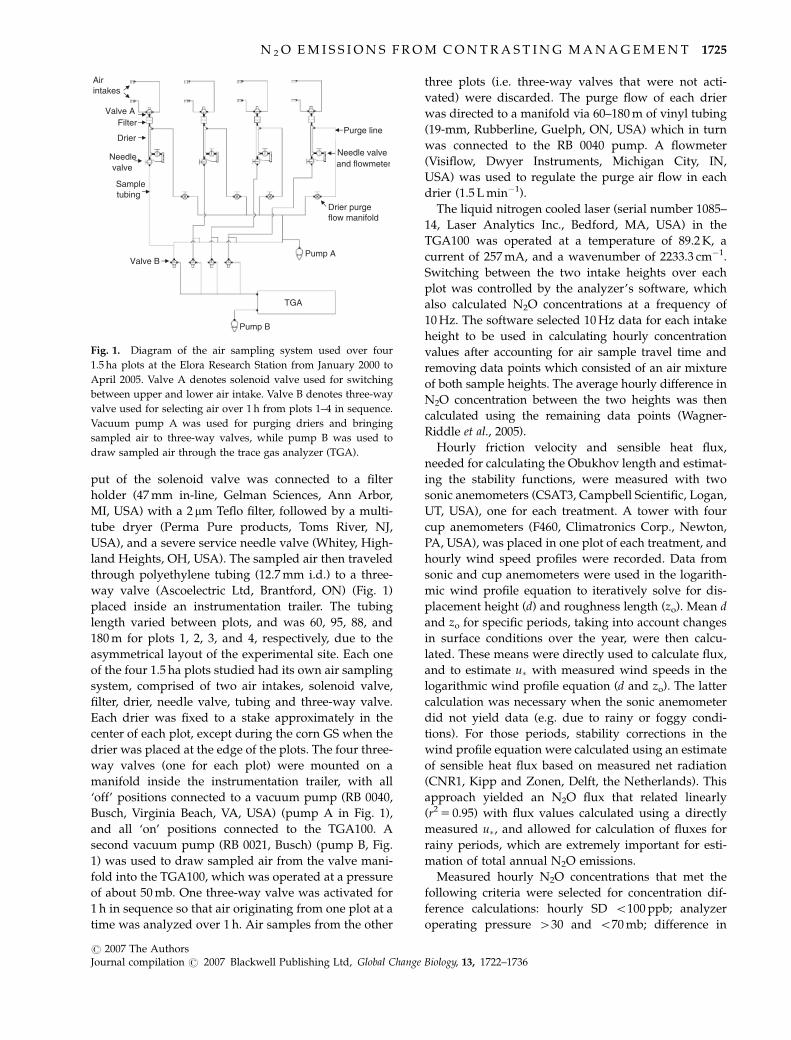
During the experimental period, mean monthly air
temperature varied between –10.7 1C in January 2004
and 21.1 1C in July 2002, and total monthly precipitation
between 17 mm in March 2005 and 180 mm in June 2000
(Fig. 2a). The GS, defined here as the May–October
period, was warmest in 2001 and 2002, with mean
temperature around 15.5 1C, and slightly cooler during
the other years at 14.5 1C. The wettest GS occurred in
2000 with 570 mm, and the driest in 2002 with 411 mm.
1726 C . WA G N E R - R I D D L E et al.
r 2007 The AuthorsJournal compilation r 2007 Blackwell Publishing Ltd, Global Change Biology, 13, 1722–1736
Crop yields were not significantly affected by treatment
except for higher soybeans yields for BMP in 2001 (4.9
vs. 3.4 Mg ha�1 for CP). Cool and wet conditions in 2000
decreased mean corn yields for both treatments to
4.1 Mg ha�1 compared with 8.7 Mg ha�1 in 2003, while
2002 and 2004 were favorable for crop growth, yielding
an average of 7.2 and 3.7 Mg ha�1 for winter-wheat and
soybeans, respectively.
The NGS, here defined as the November to April
period, presented large interannual variability in mean
air temperature varying from 0.4 1C in 2001/2002 (No-
vember 2001 to April 2002) to –3.4 1C in 2002/2003.
Warmer conditions during 2001/2002 resulted in the
smallest depth of snow cover over the study period
(mean o5 cm), while it reached a maximum of 35 cm in
2000/2001 (Fig. 2a). Precipitation was highest in the
NGS of 2003/2004 with 437 mm, and lowest in 2002/
2003 with 314 mm.
Soil and crop management resulted in substantial
variations in mineral N in the 0–30 cm soil layer over
May Ju
l
Sep
Nov Jan
Mar
May Ju
l
Sep
Nov Jan
Mar
May Ju
l
Sep
Nov Jan
Mar
May Ju
l
Sep
Nov Jan
Mar
May Ju
l
Sep
Nov Jan
Mar
0
40
80
120
160
Min
eral
N (
kg h
a–1)
F P F P F P P
May Ju
l
Sep
Nov Jan
Mar
May Ju
l
Sep
Nov Jan
Mar
May Ju
l
Sep
Nov Jan
Mar
May Ju
l
Sep
Nov Jan
Mar
May Ju
l
Sep
Nov Jan
Mar
–10
0
10
20
30
40
Tem
pera
ture
(°C
)
Sno
w d
epth
(cm
)
0
40
80
120
160
200(a)
(b)
(c)
Pre
cipi
tatio
n (m
m)
2000/2001 2001/2002 2002/2003 2003/2004 2004/2005
May Ju
l
Sep
Nov Jan
Mar
May Ju
l
Sep
Nov Jan
Mar
May Ju
l
Sep
Nov Jan
Mar
May Ju
l
Sep
Nov Jan
Mar
May Ju
l
Sep
Nov Jan
Mar
0
20
40
60
N2O
flux
(g
N h
a–1 d
ay–1
)
T T T T T
corn Soy Wheat Clover (BMP) Corn Soy
Fig. 2. Mean monthly (a) air temperature (solid line), daily snow depth (dashed line), and monthly total precipitation (bars) recorded at
the Elora research station, (b) mineral nitrogen content (NO3�1 NH4
1 ) in the 0–30 cm soil layer, and (c) nitrous oxide flux for plots under
conventional (4) and best management practices (BMP) (�) measured from May 2000 to April 2005. Horizontal arrows in (b) indicate the
crop grown, which were common for both practices, except in August 2002–April 2003 when red clover was grown in the BMP plots only.
Vertical arrows in (b) show when conventional plots were ploughed or disked (P), and when nitrogen fertilizer (F) was applied. Closed
diamonds in (c) show when soil thawing (T) took place each year.
N 2 O E M I S S I O N S F R O M C O N T R A S T I N G M A N A G E M E N T 1727
r 2007 The AuthorsJournal compilation r 2007 Blackwell Publishing Ltd, Global Change Biology, 13, 1722–1736
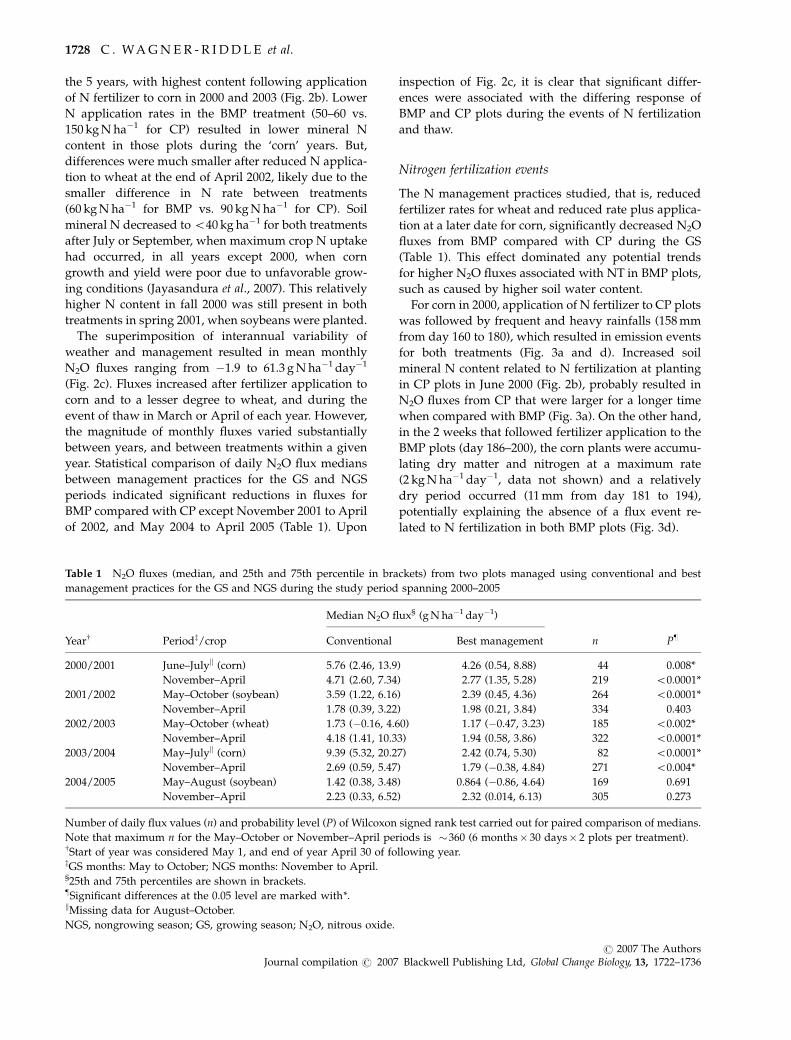
the 5 years, with highest content following application
of N fertilizer to corn in 2000 and 2003 (Fig. 2b). Lower
N application rates in the BMP treatment (50–60 vs.
150 kg N ha�1 for CP) resulted in lower mineral N
content in those plots during the ‘corn’ years. But,
differences were much smaller after reduced N applica-
tion to wheat at the end of April 2002, likely due to the
smaller difference in N rate between treatments
(60 kg N ha�1 for BMP vs. 90 kg N ha�1 for CP). Soil
mineral N decreased to o40 kg ha�1 for both treatments
after July or September, when maximum crop N uptake
had occurred, in all years except 2000, when corn
growth and yield were poor due to unfavorable grow-
ing conditions (Jayasandura et al., 2007). This relatively
higher N content in fall 2000 was still present in both
treatments in spring 2001, when soybeans were planted.
The superimposition of interannual variability of
weather and management resulted in mean monthly
N2O fluxes ranging from �1.9 to 61.3 g N ha�1 day�1
(Fig. 2c). Fluxes increased after fertilizer application to
corn and to a lesser degree to wheat, and during the
event of thaw in March or April of each year. However,
the magnitude of monthly fluxes varied substantially
between years, and between treatments within a given
year. Statistical comparison of daily N2O flux medians
between management practices for the GS and NGS
periods indicated significant reductions in fluxes for
BMP compared with CP except November 2001 to April
of 2002, and May 2004 to April 2005 (Table 1). Upon
inspection of Fig. 2c, it is clear that significant differ-
ences were associated with the differing response of
BMP and CP plots during the events of N fertilization
and thaw.
Nitrogen fertilization events
The N management practices studied, that is, reduced
fertilizer rates for wheat and reduced rate plus applica-
tion at a later date for corn, significantly decreased N2O
fluxes from BMP compared with CP during the GS
(Table 1). This effect dominated any potential trends
for higher N2O fluxes associated with NT in BMP plots,
such as caused by higher soil water content.
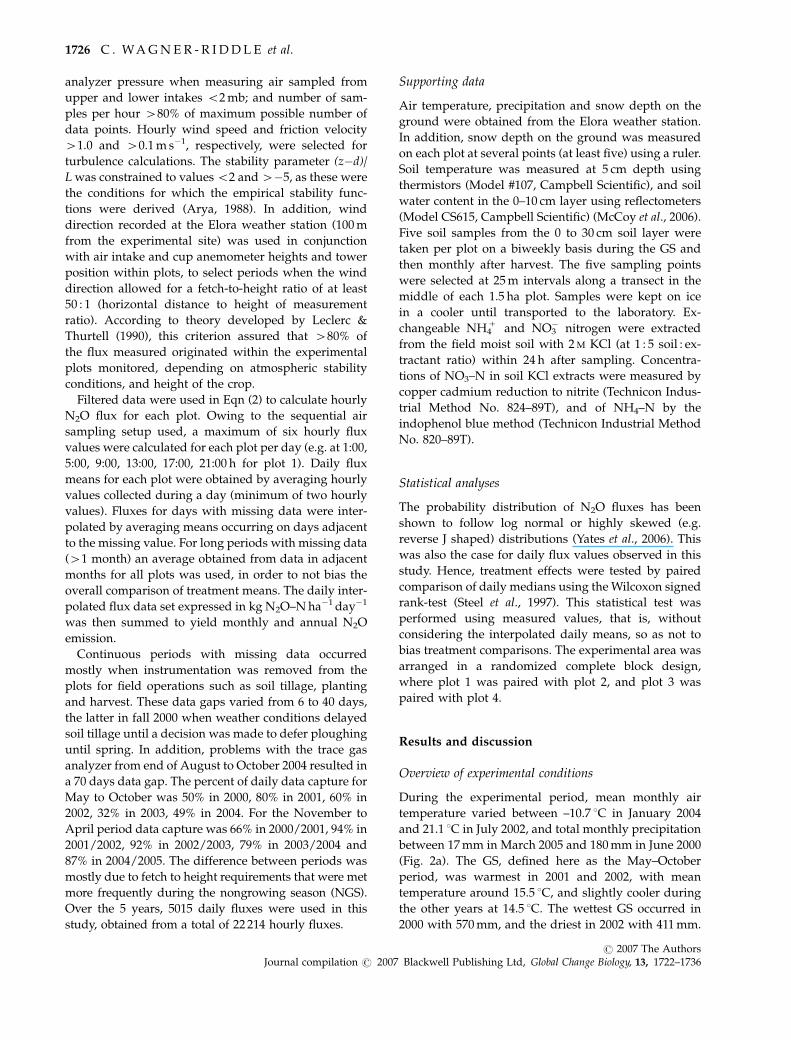
For corn in 2000, application of N fertilizer to CP plots
was followed by frequent and heavy rainfalls (158 mm
from day 160 to 180), which resulted in emission events
for both treatments (Fig. 3a and d). Increased soil
mineral N content related to N fertilization at planting
in CP plots in June 2000 (Fig. 2b), probably resulted in
N2O fluxes from CP that were larger for a longer time
when compared with BMP (Fig. 3a). On the other hand,
in the 2 weeks that followed fertilizer application to the
BMP plots (day 186–200), the corn plants were accumu-
lating dry matter and nitrogen at a maximum rate
(2 kg N ha�1 day�1, data not shown) and a relatively
dry period occurred (11 mm from day 181 to 194),
potentially explaining the absence of a flux event re-
lated to N fertilization in both BMP plots (Fig. 3d).
Table 1 N2O fluxes (median, and 25th and 75th percentile in brackets) from two plots managed using conventional and best
management practices for the GS and NGS during the study period spanning 2000–2005
Yearw Periodz/crop
Median N2O flux§ (g N ha�1 day�1)
n P}Conventional Best management
2000/2001 June–Julyk (corn) 5.76 (2.46, 13.9) 4.26 (0.54, 8.88) 44 0.008*
November–April 4.71 (2.60, 7.34) 2.77 (1.35, 5.28) 219 o0.0001*
2001/2002 May–October (soybean) 3.59 (1.22, 6.16) 2.39 (0.45, 4.36) 264 o0.0001*
November–April 1.78 (0.39, 3.22) 1.98 (0.21, 3.84) 334 0.403
2002/2003 May–October (wheat) 1.73 (�0.16, 4.60) 1.17 (�0.47, 3.23) 185 o0.002*
November–April 4.18 (1.41, 10.33) 1.94 (0.58, 3.86) 322 o0.0001*
2003/2004 May–Julyk (corn) 9.39 (5.32, 20.27) 2.42 (0.74, 5.30) 82 o0.0001*
November–April 2.69 (0.59, 5.47) 1.79 (�0.38, 4.84) 271 o0.004*
2004/2005 May–August (soybean) 1.42 (0.38, 3.48) 0.864 (�0.86, 4.64) 169 0.691
November–April 2.23 (0.33, 6.52) 2.32 (0.014, 6.13) 305 0.273
Number of daily flux values (n) and probability level (P) of Wilcoxon signed rank test carried out for paired comparison of medians.
Note that maximum n for the May–October or November–April periods is �360 (6 months� 30 days� 2 plots per treatment).wStart of year was considered May 1, and end of year April 30 of following year.zGS months: May to October; NGS months: November to April.§25th and 75th percentiles are shown in brackets.}Significant differences at the 0.05 level are marked with*.kMissing data for August–October.
NGS, nongrowing season; GS, growing season; N2O, nitrous oxide.
1728 C . WA G N E R - R I D D L E et al.
r 2007 The AuthorsJournal compilation r 2007 Blackwell Publishing Ltd, Global Change Biology, 13, 1722–1736
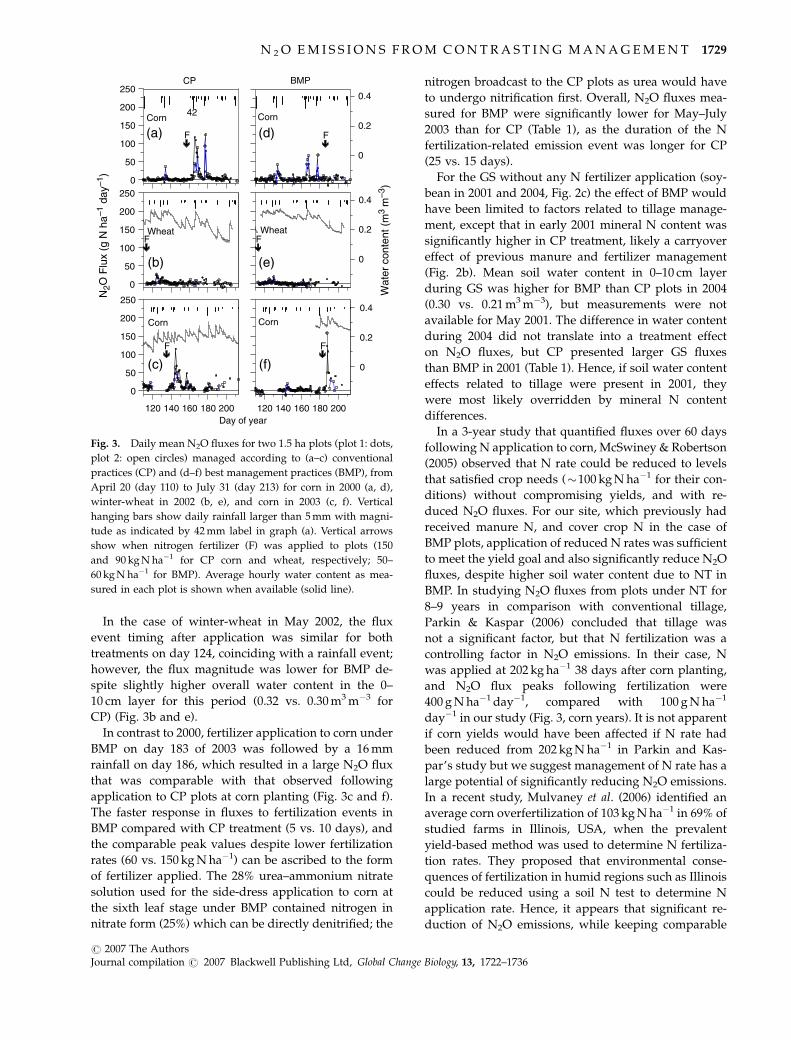
In the case of winter-wheat in May 2002, the flux
event timing after application was similar for both
treatments on day 124, coinciding with a rainfall event;
however, the flux magnitude was lower for BMP de-
spite slightly higher overall water content in the 0–
10 cm layer for this period (0.32 vs. 0.30 m3 m�3 for
CP) (Fig. 3b and e).
In contrast to 2000, fertilizer application to corn under
BMP on day 183 of 2003 was followed by a 16 mm
rainfall on day 186, which resulted in a large N2O flux
that was comparable with that observed following
application to CP plots at corn planting (Fig. 3c and f).
The faster response in fluxes to fertilization events in
BMP compared with CP treatment (5 vs. 10 days), and
the comparable peak values despite lower fertilization
rates (60 vs. 150 kg N ha�1) can be ascribed to the form
of fertilizer applied. The 28% urea–ammonium nitrate
solution used for the side-dress application to corn at
the sixth leaf stage under BMP contained nitrogen in
nitrate form (25%) which can be directly denitrified; the
nitrogen broadcast to the CP plots as urea would have
to undergo nitrification first. Overall, N2O fluxes mea-
sured for BMP were significantly lower for May–July
2003 than for CP (Table 1), as the duration of the N
fertilization-related emission event was longer for CP
(25 vs. 15 days).
For the GS without any N fertilizer application (soy-
bean in 2001 and 2004, Fig. 2c) the effect of BMP would
have been limited to factors related to tillage manage-
ment, except that in early 2001 mineral N content was
significantly higher in CP treatment, likely a carryover
effect of previous manure and fertilizer management
(Fig. 2b). Mean soil water content in 0–10 cm layer
during GS was higher for BMP than CP plots in 2004
(0.30 vs. 0.21 m3 m�3), but measurements were not
available for May 2001. The difference in water content
during 2004 did not translate into a treatment effect
on N2O fluxes, but CP presented larger GS fluxes
than BMP in 2001 (Table 1). Hence, if soil water content
effects related to tillage were present in 2001, they
were most likely overridden by mineral N content
differences.
In a 3-year study that quantified fluxes over 60 days
following N application to corn, McSwiney & Robertson
(2005) observed that N rate could be reduced to levels
that satisfied crop needs (�100 kg N ha�1 for their con-
ditions) without compromising yields, and with re-
duced N2O fluxes. For our site, which previously had
received manure N, and cover crop N in the case of
BMP plots, application of reduced N rates was sufficient
to meet the yield goal and also significantly reduce N2O
fluxes, despite higher soil water content due to NT in
BMP. In studying N2O fluxes from plots under NT for
8–9 years in comparison with conventional tillage,
Parkin & Kaspar (2006) concluded that tillage was
not a significant factor, but that N fertilization was a
controlling factor in N2O emissions. In their case, N
was applied at 202 kg ha�1 38 days after corn planting,
and N2O flux peaks following fertilization were
400 g N ha�1 day�1, compared with 100 g N ha�1
day�1 in our study (Fig. 3, corn years). It is not apparent
if corn yields would have been affected if N rate had
been reduced from 202 kg N ha�1 in Parkin and Kas-
par’s study but we suggest management of N rate has a
large potential of significantly reducing N2O emissions.
In a recent study, Mulvaney et al. (2006) identified an
average corn overfertilization of 103 kg N ha�1 in 69% of
studied farms in Illinois, USA, when the prevalent
yield-based method was used to determine N fertiliza-
tion rates. They proposed that environmental conse-
quences of fertilization in humid regions such as Illinois
could be reduced using a soil N test to determine N
application rate. Hence, it appears that significant re-
duction of N2O emissions, while keeping comparable
0
50
100
150
200
(a) (d)
(e)(b)
(c) (f)
250
F F
0
0.2
0.4
0
50
100
150
200
250
N2O
Flu
x (g
N h
a–1 d
ay–1
)
F F
0
0.2
0.4
Wat
er c
onte
nt (
m3
m–3
)
120 140 160 180 200Day of year
0
50
100
150
200
250
F
120 140 160 180 200
F
0
0.2
0.4
42
CP BMP
Corn
Wheat
Corn
Wheat
Corn Corn
Fig. 3. Daily mean N2O fluxes for two 1.5 ha plots (plot 1: dots,
plot 2: open circles) managed according to (a–c) conventional
practices (CP) and (d–f) best management practices (BMP), from
April 20 (day 110) to July 31 (day 213) for corn in 2000 (a, d),
winter-wheat in 2002 (b, e), and corn in 2003 (c, f). Vertical
hanging bars show daily rainfall larger than 5 mm with magni-
tude as indicated by 42 mm label in graph (a). Vertical arrows
show when nitrogen fertilizer (F) was applied to plots (150
and 90 kg N ha�1 for CP corn and wheat, respectively; 50–
60 kg N ha�1 for BMP). Average hourly water content as mea-
sured in each plot is shown when available (solid line).
N 2 O E M I S S I O N S F R O M C O N T R A S T I N G M A N A G E M E N T 1729
r 2007 The AuthorsJournal compilation r 2007 Blackwell Publishing Ltd, Global Change Biology, 13, 1722–1736
yields as observed in our study, could be achieved in a
large geographical region.
Winter and spring thaw events
N2O fluxes during the November to April period were
significantly affected by treatment in three out of five
study years (Table 1). The treatment differences were
mostly due to the magnitude of fluxes during thawing
events in February, March or April. N2O fluxes were
much larger for CP than BMP during spring thaw of
2003, somewhat larger in 2001 and 2004, but similar in
2002 and 2005 (Fig. 2c).
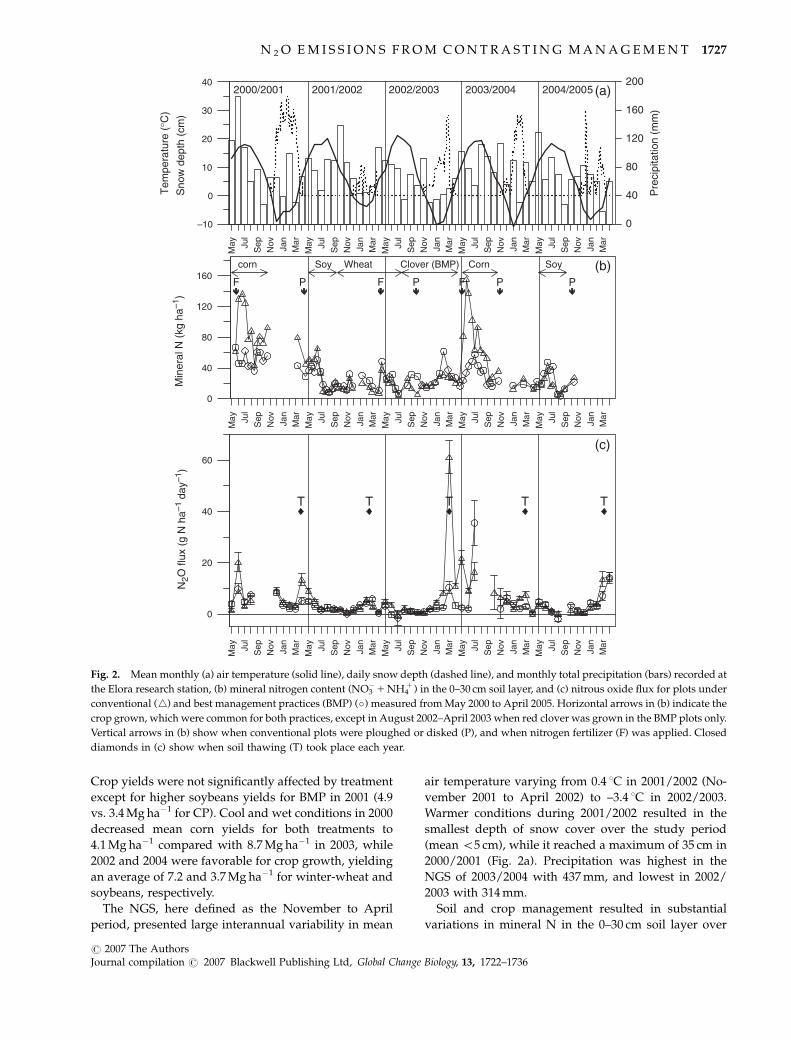
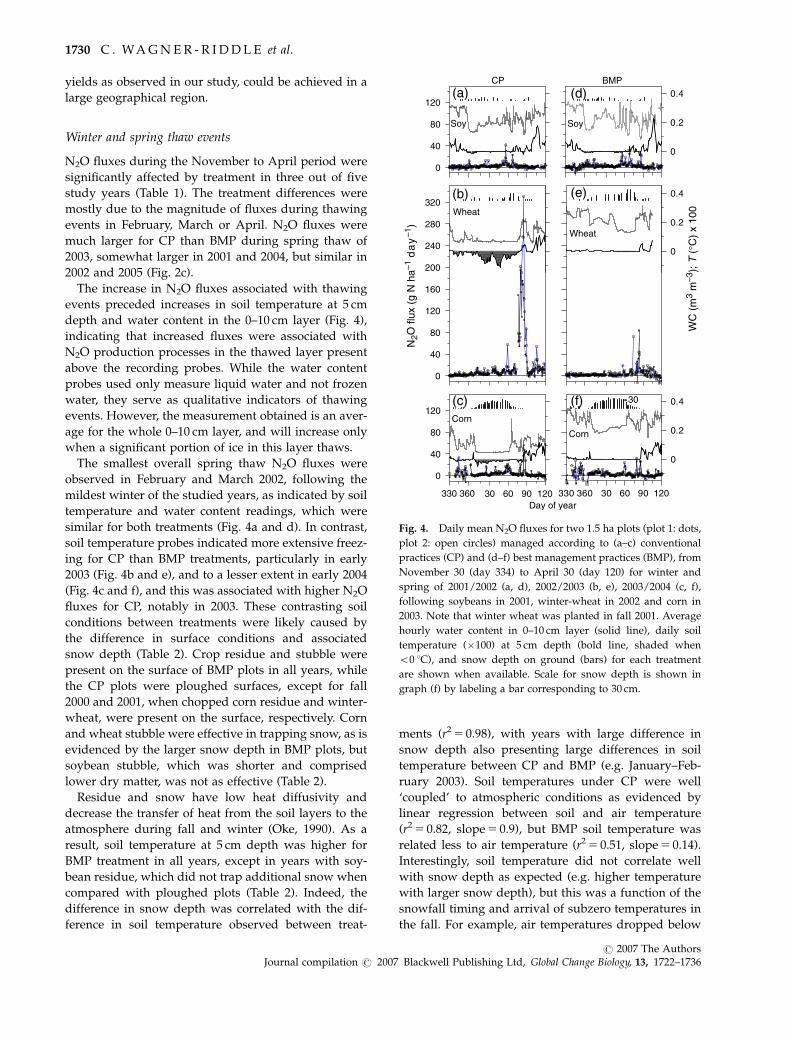
The increase in N2O fluxes associated with thawing
events preceded increases in soil temperature at 5 cm
depth and water content in the 0–10 cm layer (Fig. 4),
indicating that increased fluxes were associated with
N2O production processes in the thawed layer present
above the recording probes. While the water content
probes used only measure liquid water and not frozen
water, they serve as qualitative indicators of thawing
events. However, the measurement obtained is an aver-
age for the whole 0–10 cm layer, and will increase only
when a significant portion of ice in this layer thaws.
The smallest overall spring thaw N2O fluxes were
observed in February and March 2002, following the
mildest winter of the studied years, as indicated by soil
temperature and water content readings, which were
similar for both treatments (Fig. 4a and d). In contrast,
soil temperature probes indicated more extensive freez-
ing for CP than BMP treatments, particularly in early
2003 (Fig. 4b and e), and to a lesser extent in early 2004
(Fig. 4c and f), and this was associated with higher N2O
fluxes for CP, notably in 2003. These contrasting soil
conditions between treatments were likely caused by
the difference in surface conditions and associated
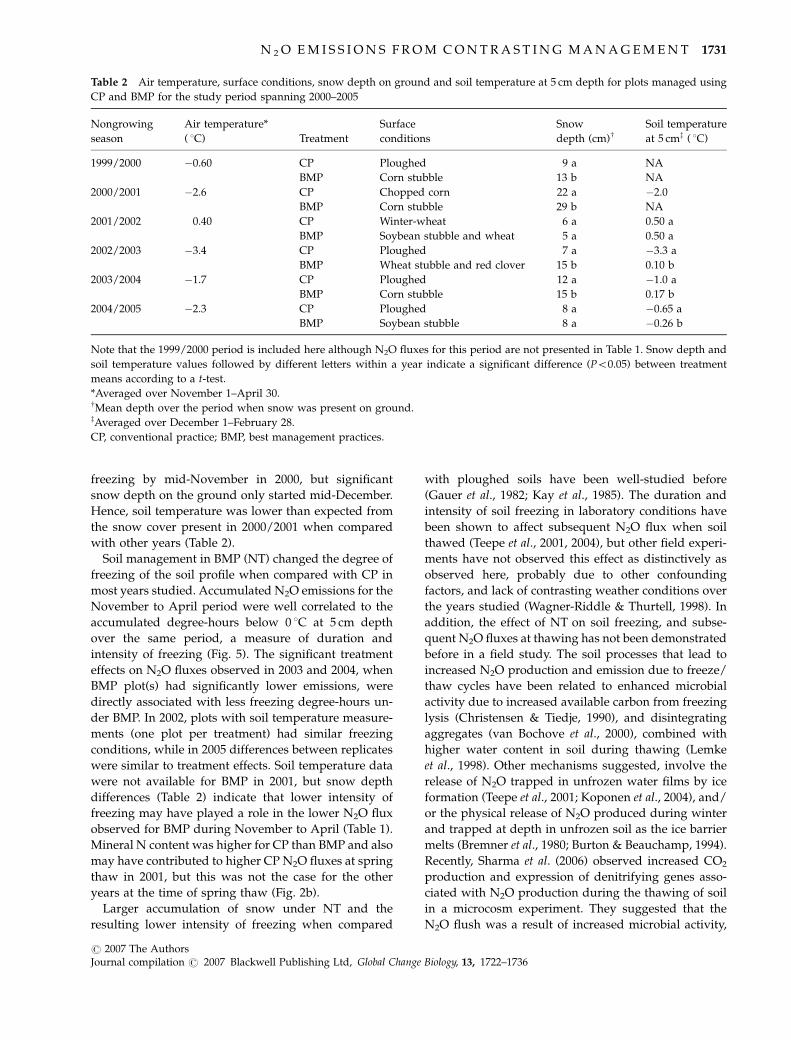
snow depth (Table 2). Crop residue and stubble were
present on the surface of BMP plots in all years, while
the CP plots were ploughed surfaces, except for fall
2000 and 2001, when chopped corn residue and winter-
wheat, were present on the surface, respectively. Corn
and wheat stubble were effective in trapping snow, as is
evidenced by the larger snow depth in BMP plots, but
soybean stubble, which was shorter and comprised
lower dry matter, was not as effective (Table 2).
Residue and snow have low heat diffusivity and
decrease the transfer of heat from the soil layers to the
atmosphere during fall and winter (Oke, 1990). As a
result, soil temperature at 5 cm depth was higher for
BMP treatment in all years, except in years with soy-
bean residue, which did not trap additional snow when
compared with ploughed plots (Table 2). Indeed, the
difference in snow depth was correlated with the dif-
ference in soil temperature observed between treat-
ments (r2 5 0.98), with years with large difference in
snow depth also presenting large differences in soil
temperature between CP and BMP (e.g. January–Feb-
ruary 2003). Soil temperatures under CP were well
‘coupled’ to atmospheric conditions as evidenced by
linear regression between soil and air temperature
(r2 5 0.82, slope 5 0.9), but BMP soil temperature was
related less to air temperature (r2 5 0.51, slope 5 0.14).
Interestingly, soil temperature did not correlate well
with snow depth as expected (e.g. higher temperature
with larger snow depth), but this was a function of the
snowfall timing and arrival of subzero temperatures in
the fall. For example, air temperatures dropped below
0
40
80
120
160
200
240
280
320
(a)
(b)
(c) (f)
(e)
(d)
0
0.2
0.4
WC
(m
3 m
–3);
T (
°C)
x 10
0
0
40
80
120
N2O
flux
(g
N h
a–1 d
ay
–1)
0
0.2
0.4
330 360
0
40
80
120
30 60 90 120Day of year
330 360 30 60 90 120
0
0.2
0.430
CP BMP
Soy Soy
Corn
Corn
Wheat
Wheat
Fig. 4. Daily mean N2O fluxes for two 1.5 ha plots (plot 1: dots,
plot 2: open circles) managed according to (a–c) conventional
practices (CP) and (d–f) best management practices (BMP), from
November 30 (day 334) to April 30 (day 120) for winter and
spring of 2001/2002 (a, d), 2002/2003 (b, e), 2003/2004 (c, f),
following soybeans in 2001, winter-wheat in 2002 and corn in
2003. Note that winter wheat was planted in fall 2001. Average
hourly water content in 0–10 cm layer (solid line), daily soil
temperature (�100) at 5 cm depth (bold line, shaded when
o0 1C), and snow depth on ground (bars) for each treatment
are shown when available. Scale for snow depth is shown in
graph (f) by labeling a bar corresponding to 30 cm.
1730 C . WA G N E R - R I D D L E et al.
r 2007 The AuthorsJournal compilation r 2007 Blackwell Publishing Ltd, Global Change Biology, 13, 1722–1736
freezing by mid-November in 2000, but significant
snow depth on the ground only started mid-December.
Hence, soil temperature was lower than expected from
the snow cover present in 2000/2001 when compared
with other years (Table 2).
Soil management in BMP (NT) changed the degree of
freezing of the soil profile when compared with CP in
most years studied. Accumulated N2O emissions for the
November to April period were well correlated to the
accumulated degree-hours below 0 1C at 5 cm depth
over the same period, a measure of duration and
intensity of freezing (Fig. 5). The significant treatment
effects on N2O fluxes observed in 2003 and 2004, when
BMP plot(s) had significantly lower emissions, were
directly associated with less freezing degree-hours un-
der BMP. In 2002, plots with soil temperature measure-
ments (one plot per treatment) had similar freezing
conditions, while in 2005 differences between replicates
were similar to treatment effects. Soil temperature data
were not available for BMP in 2001, but snow depth
differences (Table 2) indicate that lower intensity of
freezing may have played a role in the lower N2O flux
observed for BMP during November to April (Table 1).
Mineral N content was higher for CP than BMP and also
may have contributed to higher CP N2O fluxes at spring
thaw in 2001, but this was not the case for the other
years at the time of spring thaw (Fig. 2b).
Larger accumulation of snow under NT and the
resulting lower intensity of freezing when compared
with ploughed soils have been well-studied before
(Gauer et al., 1982; Kay et al., 1985). The duration and
intensity of soil freezing in laboratory conditions have
been shown to affect subsequent N2O flux when soil
thawed (Teepe et al., 2001, 2004), but other field experi-
ments have not observed this effect as distinctively as
observed here, probably due to other confounding
factors, and lack of contrasting weather conditions over
the years studied (Wagner-Riddle & Thurtell, 1998). In
addition, the effect of NT on soil freezing, and subse-
quent N2O fluxes at thawing has not been demonstrated
before in a field study. The soil processes that lead to
increased N2O production and emission due to freeze/
thaw cycles have been related to enhanced microbial
activity due to increased available carbon from freezing
lysis (Christensen & Tiedje, 1990), and disintegrating
aggregates (van Bochove et al., 2000), combined with
higher water content in soil during thawing (Lemke
et al., 1998). Other mechanisms suggested, involve the
release of N2O trapped in unfrozen water films by ice
formation (Teepe et al., 2001; Koponen et al., 2004), and/
or the physical release of N2O produced during winter
and trapped at depth in unfrozen soil as the ice barrier
melts (Bremner et al., 1980; Burton & Beauchamp, 1994).
Recently, Sharma et al. (2006) observed increased CO2
production and expression of denitrifying genes asso-
ciated with N2O production during the thawing of soil
in a microcosm experiment. They suggested that the
N2O flush was a result of increased microbial activity,
Table 2 Air temperature, surface conditions, snow depth on ground and soil temperature at 5 cm depth for plots managed using
CP and BMP for the study period spanning 2000–2005
Nongrowing
season
Air temperature*
( 1C) Treatment
Surface
conditions
Snow
depth (cm)wSoil temperature
at 5 cmz ( 1C)
1999/2000 �0.60 CP Ploughed 9 a NA
BMP Corn stubble 13 b NA
2000/2001 �2.6 CP Chopped corn 22 a �2.0
BMP Corn stubble 29 b NA
2001/2002 0.40 CP Winter-wheat 6 a 0.50 a
BMP Soybean stubble and wheat 5 a 0.50 a
2002/2003 �3.4 CP Ploughed 7 a �3.3 a
BMP Wheat stubble and red clover 15 b 0.10 b
2003/2004 �1.7 CP Ploughed 12 a �1.0 a
BMP Corn stubble 15 b 0.17 b
2004/2005 �2.3 CP Ploughed 8 a �0.65 a
BMP Soybean stubble 8 a �0.26 b
Note that the 1999/2000 period is included here although N2O fluxes for this period are not presented in Table 1. Snow depth and
soil temperature values followed by different letters within a year indicate a significant difference (Po0.05) between treatment
means according to a t-test.
*Averaged over November 1–April 30.wMean depth over the period when snow was present on ground.zAveraged over December 1–February 28.
CP, conventional practice; BMP, best management practices.
N 2 O E M I S S I O N S F R O M C O N T R A S T I N G M A N A G E M E N T 1731
r 2007 The AuthorsJournal compilation r 2007 Blackwell Publishing Ltd, Global Change Biology, 13, 1722–1736
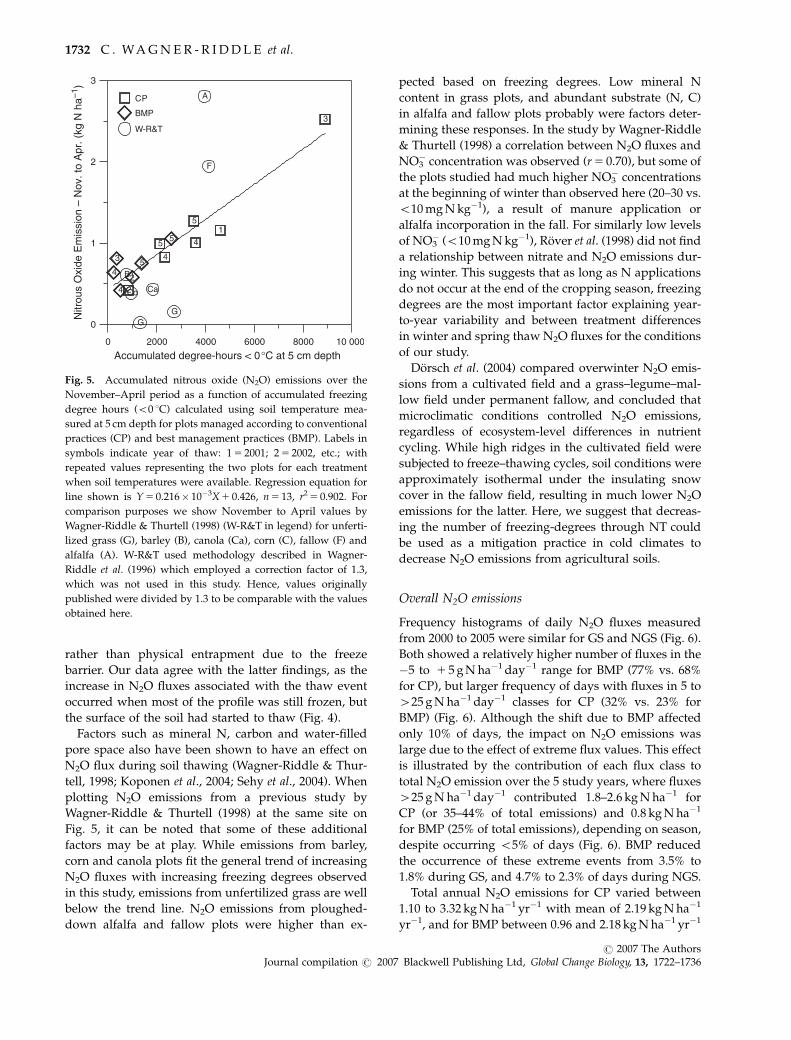
rather than physical entrapment due to the freeze
barrier. Our data agree with the latter findings, as the
increase in N2O fluxes associated with the thaw event
occurred when most of the profile was still frozen, but
the surface of the soil had started to thaw (Fig. 4).
Factors such as mineral N, carbon and water-filled
pore space also have been shown to have an effect on
N2O flux during soil thawing (Wagner-Riddle & Thur-
tell, 1998; Koponen et al., 2004; Sehy et al., 2004). When
plotting N2O emissions from a previous study by
Wagner-Riddle & Thurtell (1998) at the same site on
Fig. 5, it can be noted that some of these additional
factors may be at play. While emissions from barley,
corn and canola plots fit the general trend of increasing
N2O fluxes with increasing freezing degrees observed
in this study, emissions from unfertilized grass are well
below the trend line. N2O emissions from ploughed-
down alfalfa and fallow plots were higher than ex-
pected based on freezing degrees. Low mineral N
content in grass plots, and abundant substrate (N, C)
in alfalfa and fallow plots probably were factors deter-
mining these responses. In the study by Wagner-Riddle
& Thurtell (1998) a correlation between N2O fluxes and
NO3� concentration was observed (r 5 0.70), but some of
the plots studied had much higher NO3� concentrations
at the beginning of winter than observed here (20–30 vs.
o10 mg N kg�1), a result of manure application or
alfalfa incorporation in the fall. For similarly low levels
of NO3� (o10 mg N kg�1), Rover et al. (1998) did not find
a relationship between nitrate and N2O emissions dur-
ing winter. This suggests that as long as N applications
do not occur at the end of the cropping season, freezing
degrees are the most important factor explaining year-
to-year variability and between treatment differences
in winter and spring thaw N2O fluxes for the conditions
of our study.
Dorsch et al. (2004) compared overwinter N2O emis-
sions from a cultivated field and a grass–legume–mal-
low field under permanent fallow, and concluded that
microclimatic conditions controlled N2O emissions,
regardless of ecosystem-level differences in nutrient
cycling. While high ridges in the cultivated field were
subjected to freeze–thawing cycles, soil conditions were
approximately isothermal under the insulating snow
cover in the fallow field, resulting in much lower N2O
emissions for the latter. Here, we suggest that decreas-
ing the number of freezing-degrees through NT could
be used as a mitigation practice in cold climates to
decrease N2O emissions from agricultural soils.
Overall N2O emissions
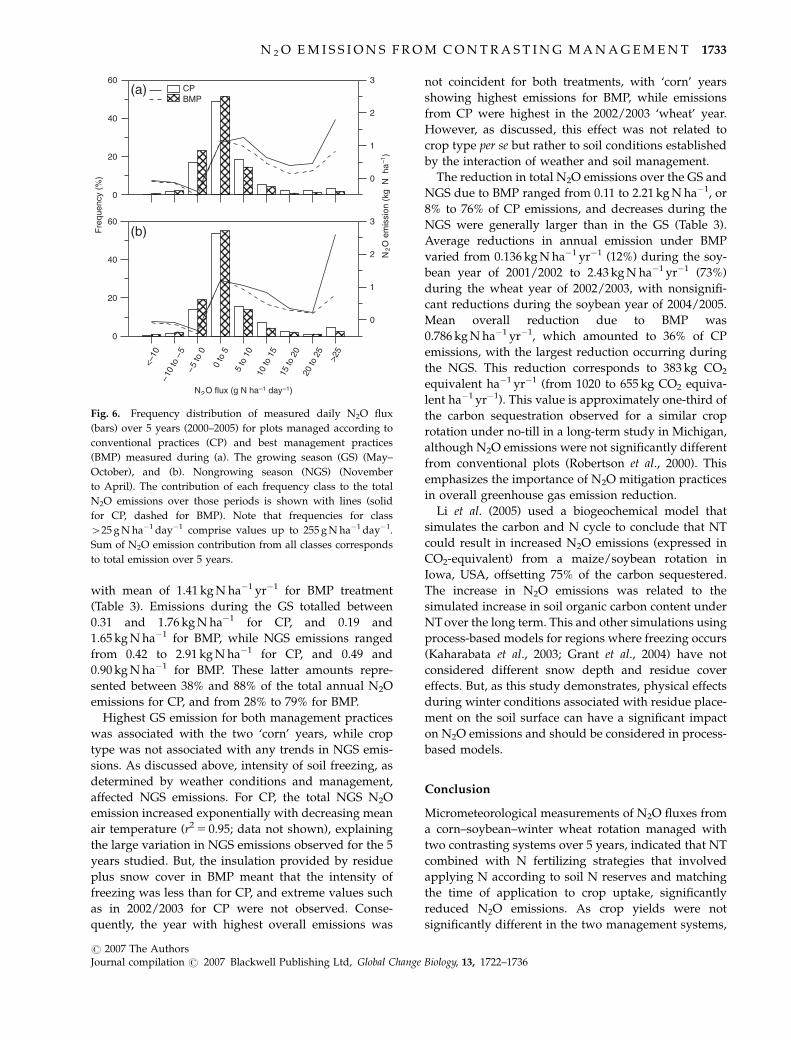
Frequency histograms of daily N2O fluxes measured
from 2000 to 2005 were similar for GS and NGS (Fig. 6).
Both showed a relatively higher number of fluxes in the
�5 to 1 5 g N ha�1 day�1 range for BMP (77% vs. 68%
for CP), but larger frequency of days with fluxes in 5 to
425 g N ha�1 day�1 classes for CP (32% vs. 23% for
BMP) (Fig. 6). Although the shift due to BMP affected
only 10% of days, the impact on N2O emissions was
large due to the effect of extreme flux values. This effect
is illustrated by the contribution of each flux class to
total N2O emission over the 5 study years, where fluxes
425 g N ha�1 day�1 contributed 1.8–2.6 kg N ha�1 for
CP (or 35–44% of total emissions) and 0.8 kg N ha�1
for BMP (25% of total emissions), depending on season,
despite occurring o5% of days (Fig. 6). BMP reduced
the occurrence of these extreme events from 3.5% to
1.8% during GS, and 4.7% to 2.3% of days during NGS.
Total annual N2O emissions for CP varied between
1.10 to 3.32 kg N ha�1 yr�1 with mean of 2.19 kg N ha�1
yr�1, and for BMP between 0.96 and 2.18 kg N ha�1 yr�1
0 2000 4000 6000 8000 10 000
Accumulated degree-hours < 0°C at 5 cm depth
0
1
2
3N
itrou
s O
xide
Em
issi
on –
Nov
. to
Apr
. (kg
N h
a–1)
1
2
3
4
45
5
2
3
4
45
5
CP
BMP
W-R&T
F
A
G
B
Ca
G
Co
Fig. 5. Accumulated nitrous oxide (N2O) emissions over the
November–April period as a function of accumulated freezing
degree hours (o0 1C) calculated using soil temperature mea-
sured at 5 cm depth for plots managed according to conventional
practices (CP) and best management practices (BMP). Labels in
symbols indicate year of thaw: 1 5 2001; 2 5 2002, etc.; with
repeated values representing the two plots for each treatment
when soil temperatures were available. Regression equation for
line shown is Y 5 0.216� 10�3X 1 0.426, n 5 13, r2 5 0.902. For
comparison purposes we show November to April values by
Wagner-Riddle & Thurtell (1998) (W-R&T in legend) for unferti-
lized grass (G), barley (B), canola (Ca), corn (C), fallow (F) and
alfalfa (A). W-R&T used methodology described in Wagner-
Riddle et al. (1996) which employed a correction factor of 1.3,
which was not used in this study. Hence, values originally
published were divided by 1.3 to be comparable with the values
obtained here.
1732 C . WA G N E R - R I D D L E et al.
r 2007 The AuthorsJournal compilation r 2007 Blackwell Publishing Ltd, Global Change Biology, 13, 1722–1736
with mean of 1.41 kg N ha�1 yr�1 for BMP treatment
(Table 3). Emissions during the GS totalled between
0.31 and 1.76 kg N ha�1 for CP, and 0.19 and
1.65 kg N ha�1 for BMP, while NGS emissions ranged
from 0.42 to 2.91 kg N ha�1 for CP, and 0.49 and
0.90 kg N ha�1 for BMP. These latter amounts repre-
sented between 38% and 88% of the total annual N2O
emissions for CP, and from 28% to 79% for BMP.
Highest GS emission for both management practices
was associated with the two ‘corn’ years, while crop
type was not associated with any trends in NGS emis-
sions. As discussed above, intensity of soil freezing, as
determined by weather conditions and management,
affected NGS emissions. For CP, the total NGS N2O
emission increased exponentially with decreasing mean
air temperature (r2 5 0.95; data not shown), explaining
the large variation in NGS emissions observed for the 5
years studied. But, the insulation provided by residue
plus snow cover in BMP meant that the intensity of
freezing was less than for CP, and extreme values such
as in 2002/2003 for CP were not observed. Conse-
quently, the year with highest overall emissions was
not coincident for both treatments, with ‘corn’ years
showing highest emissions for BMP, while emissions
from CP were highest in the 2002/2003 ‘wheat’ year.
However, as discussed, this effect was not related to
crop type per se but rather to soil conditions established
by the interaction of weather and soil management.
The reduction in total N2O emissions over the GS and
NGS due to BMP ranged from 0.11 to 2.21 kg N ha�1, or
8% to 76% of CP emissions, and decreases during the
NGS were generally larger than in the GS (Table 3).
Average reductions in annual emission under BMP
varied from 0.136 kg N ha�1 yr�1 (12%) during the soy-
bean year of 2001/2002 to 2.43 kg N ha�1 yr�1 (73%)
during the wheat year of 2002/2003, with nonsignifi-
cant reductions during the soybean year of 2004/2005.
Mean overall reduction due to BMP was
0.786 kg N ha�1 yr�1, which amounted to 36% of CP
emissions, with the largest reduction occurring during
the NGS. This reduction corresponds to 383 kg CO2
equivalent ha�1 yr�1 (from 1020 to 655 kg CO2 equiva-
lent ha�1 yr�1). This value is approximately one-third of
the carbon sequestration observed for a similar crop
rotation under no-till in a long-term study in Michigan,
although N2O emissions were not significantly different
from conventional plots (Robertson et al., 2000). This
emphasizes the importance of N2O mitigation practices
in overall greenhouse gas emission reduction.
Li et al. (2005) used a biogeochemical model that
simulates the carbon and N cycle to conclude that NT
could result in increased N2O emissions (expressed in
CO2-equivalent) from a maize/soybean rotation in
Iowa, USA, offsetting 75% of the carbon sequestered.
The increase in N2O emissions was related to the
simulated increase in soil organic carbon content under
NT over the long term. This and other simulations using
process-based models for regions where freezing occurs
(Kaharabata et al., 2003; Grant et al., 2004) have not
considered different snow depth and residue cover
effects. But, as this study demonstrates, physical effects
during winter conditions associated with residue place-
ment on the soil surface can have a significant impact
on N2O emissions and should be considered in process-
based models.
Conclusion
Micrometeorological measurements of N2O fluxes from
a corn–soybean–winter wheat rotation managed with
two contrasting systems over 5 years, indicated that NT
combined with N fertilizing strategies that involved
applying N according to soil N reserves and matching
the time of application to crop uptake, significantly
reduced N2O emissions. As crop yields were not
significantly different in the two management systems,
0
20
40
60
0
1
2
3
N O
em
issi
on (
kg N
ha
)
<–10
–10
to –
5–5
to 0
0 to
5
5 to
10
10 to
15
15 to
20
20 to
25
>25
0
20
40
60
Fre
quen
cy (
%)
0
1
2
3
CP(a)
(b)
BMP
N O flux (g N ha day )
Fig. 6. Frequency distribution of measured daily N2O flux
(bars) over 5 years (2000–2005) for plots managed according to
conventional practices (CP) and best management practices
(BMP) measured during (a). The growing season (GS) (May–
October), and (b). Nongrowing season (NGS) (November
to April). The contribution of each frequency class to the total
N2O emissions over those periods is shown with lines (solid
for CP, dashed for BMP). Note that frequencies for class
425 g N ha�1 day�1 comprise values up to 255 g N ha�1 day�1.
Sum of N2O emission contribution from all classes corresponds
to total emission over 5 years.
N 2 O E M I S S I O N S F R O M C O N T R A S T I N G M A N A G E M E N T 1733
r 2007 The AuthorsJournal compilation r 2007 Blackwell Publishing Ltd, Global Change Biology, 13, 1722–1736
this means the BMP studied here had a lower N2O
output per dry weight of grain produced, when com-
pared with CP (365, 117 and 304 g N2O–N Mg�1 for
BMP vs. 430, 487 and 423 g N2O–N Mg�1 for corn,
winter-wheat and soybeans for CP, respectively).
The reduction in N2O emissions under BMP occurred
due to two main effects: (1) reduction in soil mineral N
content related to reduced fertilizer application in corn,
which offset any potential increases in emissions due to
higher moisture content under NT; and (2) lower degree
and intensity of freezing due to the insulating effects of
the snow cover plus corn and wheat residue in NT plots
during winter. The fertilization effect occurred mostly
during the GS (May–October) and accounted for an
average reduction of 0.16 kg N ha�1 (20% of the mean
annual reduction of 0.79 kg N ha�1). The freezing effect
was more significant accounting for 80% of total reduc-
tion, or 0.63 kg N ha�1 averaged over 5 years. While the
magnitude of reduction can not be extrapolated easily
to a large geographical region, we can conclude that
significant reductions in net greenhouse gas emissions
can be obtained when NT is combined with a strategy
that matches N application rate and timing to crop
needs. This study highlights the need for year-round
measurements over an extended period of time to cap-
ture the interaction of crop management and weather,
and the subsequent effect on N2O emissions. In addi-
tion, the change in winter soil freezing in the BMP
compared with CP treatment has important implica-
tions for modeling the effect of NT on N2O emissions in
cold climates. Our study demonstrates that the physical
effects associated with residue placement on the soil
surface should be considered in modeling efforts to
assess the long-term effects of NT on greenhouse gas
emissions from soils in cold climates.
Acknowledgements
Primary funding for the research was provided by the CanadianFoundation for Climate and Atmospheric Sciences (CFCAS), andthe Ontario Ministry of Agriculture and Food (OMAF). Addi-tional funding was provided by BIOCAP Canada and theClimate Change Funding Initiative in Agriculture (CCFIA) fromAgriculture Canada administered by Canadian Agri-Food Re-search Council. Robert Sweetman provided technical assistancefor this project. Sean Shaw, J. P. Bezeau, Alison Veale, KateTaillon and Karen Clark provided field assistance in variousaspects of the project.
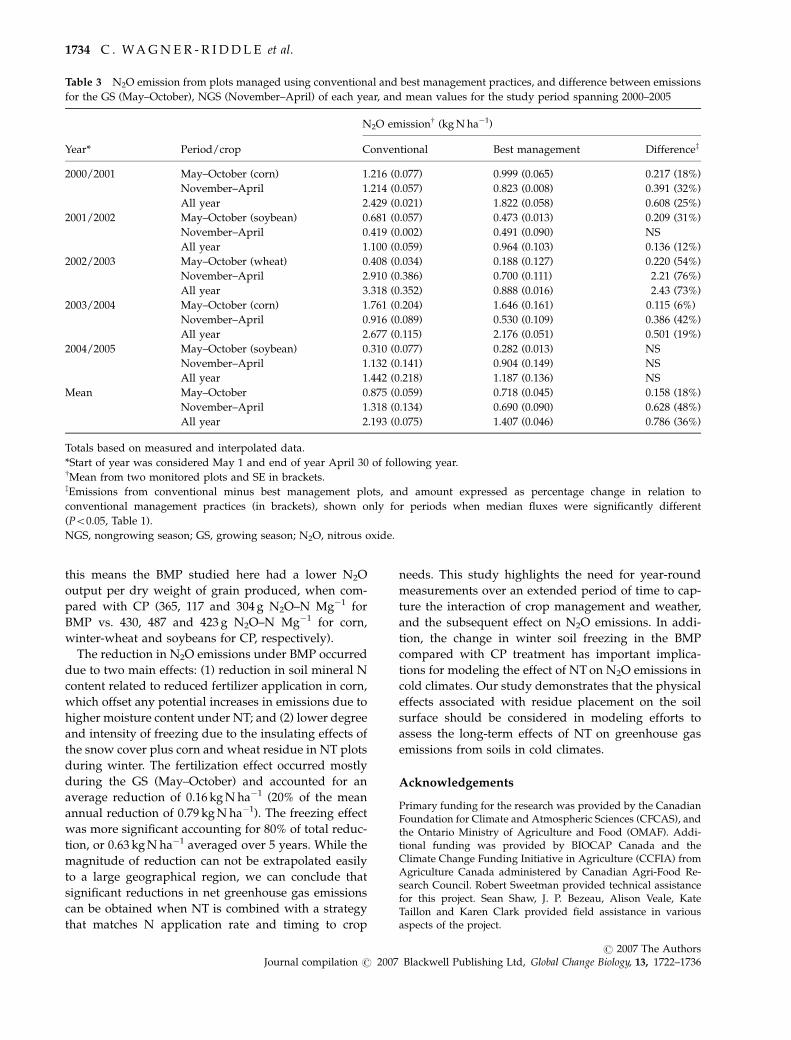
Table 3 N2O emission from plots managed using conventional and best management practices, and difference between emissions
for the GS (May–October), NGS (November–April) of each year, and mean values for the study period spanning 2000–2005
Year* Period/crop
N2O emissionw (kg N ha�1)
Conventional Best management Differencez
2000/2001 May–October (corn) 1.216 (0.077) 0.999 (0.065) 0.217 (18%)
November–April 1.214 (0.057) 0.823 (0.008) 0.391 (32%)
All year 2.429 (0.021) 1.822 (0.058) 0.608 (25%)
2001/2002 May–October (soybean) 0.681 (0.057) 0.473 (0.013) 0.209 (31%)
November–April 0.419 (0.002) 0.491 (0.090) NS
All year 1.100 (0.059) 0.964 (0.103) 0.136 (12%)
2002/2003 May–October (wheat) 0.408 (0.034) 0.188 (0.127) 0.220 (54%)
November–April 2.910 (0.386) 0.700 (0.111) 2.21 (76%)
All year 3.318 (0.352) 0.888 (0.016) 2.43 (73%)
2003/2004 May–October (corn) 1.761 (0.204) 1.646 (0.161) 0.115 (6%)
November–April 0.916 (0.089) 0.530 (0.109) 0.386 (42%)
All year 2.677 (0.115) 2.176 (0.051) 0.501 (19%)
2004/2005 May–October (soybean) 0.310 (0.077) 0.282 (0.013) NS
November–April 1.132 (0.141) 0.904 (0.149) NS
All year 1.442 (0.218) 1.187 (0.136) NS
Mean May–October 0.875 (0.059) 0.718 (0.045) 0.158 (18%)
November–April 1.318 (0.134) 0.690 (0.090) 0.628 (48%)
All year 2.193 (0.075) 1.407 (0.046) 0.786 (36%)
Totals based on measured and interpolated data.
*Start of year was considered May 1 and end of year April 30 of following year.wMean from two monitored plots and SE in brackets.zEmissions from conventional minus best management plots, and amount expressed as percentage change in relation to
conventional management practices (in brackets), shown only for periods when median fluxes were significantly different
(Po0.05, Table 1).
NGS, nongrowing season; GS, growing season; N2O, nitrous oxide.
1734 C . WA G N E R - R I D D L E et al.
r 2007 The AuthorsJournal compilation r 2007 Blackwell Publishing Ltd, Global Change Biology, 13, 1722–1736
References
Arya SP (1988) Introduction to Micrometeorology. Academic Press,
London.
Aulakh MS, Doran JW, Mosier AR (1992) Soil denitrification –
significance, measurements and effects of management. Ad-
vances in Soil Science, 18, 1–57.
Aulakh MS, Rennie DA, Paul EA (1984) Gaseous nitrogen losses
from cropped and summer-fallowed soils. Canadian Journal of
Soil Science, 62, 187–196.
Ball BC, Horgan GW, Clayton H, Parker JP (1997) Spatial
variability of nitrous oxide fluxes and controlling soil and
topographic properties. Journal of Environmental Quality, 26,
1399–1409.
Bouwman AF (1990) Exchange of greenhouse gases between
terrestrial ecosystems and the atmosphere. In: Soils and the
Greenhouse Effect (ed. Bouwman AF), pp. 61–127. Wiley and
Sons, New York.
Bremner JM, Robbins SG, Blackmer AM (1980) Seasonal varia-
bility in emission of nitrous oxide from soil. Geophysical
Research Letters, 7, 641–644.
Burton DL, Beauchamp EG (1994) Profile of nitrous oxide and
carbon dioxide concentrations in a soil subject to freezing. Soil
Science Society America Journal, 58, 115–122.
Christensen S, Tiedje JM (1990) Brief and vigorous N2O produc-
tion by soil at spring thaw. Journal of Soil Science, 41, 1–4.
Cicerone R (1989) Analysis of sources and sinks of atmospheric
nitrous oxide. Journal of Geophysical Research, 94, 18265–18271.
Conrad R, Seiler W, Bunse G (1983) Factors influencing the loss
of fertilizer nitrogen into the atmosphere as N2O. Journal of
Geophysical Research, 88, 6709–6718.
Dorsch PA, Palojarvi A, Mommertz S (2004) Overwinter green-
house gas fluxes in two contrasting agricultural habitats.
Nutrient Cycling in Agroecosystems, 70, 117–133.
Drury CF, Tan CS, Welacky TW, Oloya TO, Hamill AS, Weaver
SE (1999) Red clover and tillage influence on soil temperature,
water content, and corn emergence. Agronomy Journal, 91,
101–108.
Dyer AJ, Hicks BB (1970) Flux-gradient relationships in the
constant flux layer. Quarterly Journal of Royal Meteorology
Society, 96, 715–721.
Firestone MK, Davidson EA (1989) Microbiological basis of NO
and N2O production and consumption in the soil. In: Exchange
of Trace Gases Between Terrestrial Ecosystems and the Atmosphere
(eds Andreae MO, Schimel DS), pp. 7–21. Wiley and Sons,
Chichester.
Follett RF, Shafer SR, Jawson MD, Franzluebbers AJ (2005)
Research and implementation needs to mitigate greenhouse
gas emissions from agriculture in the USA. Soil and Tillage
Research, 83, 159–166.
Gauer E, Shaykewich CF, Stobbe EH (1982) Temperature and
soil water under zero tillage in Manitoba. Canadian Journal
of Soil Science, 62, 311–325.
Grandy S, Loecke TD, Parr S, Robertson GP (2006) Long-term
trends in nitrous oxide emissions, soil nitrogen, and crop
yields of till and no-till cropping systems. Journal of Environ-
mental Quality, 35, 1487–1495.
Granli T, B�ckman OC (1994) Nitrous oxide from agriculture.
Norwegian Journal of Agricultural Sciences, 12, 1–127.
Grant B, Smith WN, Desjardins R, Lemke R, Li C (2004) Esti-
mated N2O and CO2 emissions as influenced by agricultural
practices in Canada. Climatic Change, 65, 315–332.
Helgason BL, Janzen HH, Chantigny MH et al. (2005) Toward
improved coefficients for predicting direct N2O emissions
from soil in Canadian agroecosytems. Nutrient Cycling in
Agroecosystems, 72, 87–99.
Holland JM (2004) The environmental consequences of adopting
conservation tillage in Europe: reviewing the evidence. Agri-
culture, Ecosystems and Environment, 103, 1–25.
IPCC. (2001) Climate Change 2001: The Scientific Basis. Cambridge
University Press, New York.
Jayasundara S, Wagner-Riddle C, Parkin G et al. (2006) Mineral
nitrogen dynamics and enhanced fertilizer nitrogen efficiency
in a corn-soybean-winter wheat rotation with best manage-
ment practices. Nutrient Cycling in Agroecosystems, doi:
10.1007/s10705-007-9103-9.
Jin HJ, Li SX, Cheng GD, Wang SL, Li X (2000) Permafrost and
climatic change in China. Global and Planetary Change, 26,
387–404.
Jorgensen RN, Jorgensen BJ, Nielsen NE (1998) N2O emission
immediately after rainfall in a dry stubble field. Soil Biology and
Biochemistry, 30, 545–546.
Kaharabata SK, Drury CF, Priesack E, Desjardins RL, McKenney
DJ, Tan CS, Reynolds D (2003) Comparing measured and
Expert-N predicted N2O emissions from conventional till
and no till corn treatments. Nutrient Cycling in Agroecosystems,
66, 107–118.
Kay BD, Grant CD, Groenevelt PH (1985) Significance of ground
freezing on soil bulk density under zero tillage. Soil Science
Society of America Journal, 49, 973–978.
Kay BD, VandenBygaart AJ (2002) Conservation tillage and
depth stratification of porosity and soil organic matter. Soil
and Tillage Research, 66, 107–118.
Kessavalou A, Mosier AR, Doran JW, Drijber RA, Lyon D,
Heinemeyer O (1998) Fluxes of carbon dioxide, nitrous oxide,
and methane in grass sod and winter wheat-fallow tillage
management. Journal of Environmental Quality, 27, 1094–1104.
Koponen HT, Flojt L, Martikainen TJ (2004) Nitrous oxide emis-
sions from agricultural soils at low temperature: a laboratory
microcosm study. Soil Biology and Biochemistry, 36, 757–766.
Lal R, Kimble JM, Follett RF (1998) Land use and soil C pools in
the terrestrial ecosystems. In: Management of Carbon Sequestra-
tion in Soil (eds Lal R, Kimble JM, Follett RF, Stewart BA),
pp. 1–10. CRC Press, Florida.
Leclerc MY, Thurtell GW (1990) Footprint prediction of scalar
fluxes using a Markovian analysis. Boundary-Layer Meteorology,
52, 247–258.
Lemke RL, Izaurralde RC, Nyborg M (1998) Seasonal distribu-
tion of nitrous oxide emissions from soil in the Parkland
region. Soil Science Society America Journal, 62, 1320–1326.
Lemke RL, Izaurralde RC, Nyborg M, Solberg ED (1999) Tillage
and N source influence soil-emitted nitrous oxide in the Alberta
Parkland region. Canadian Journal Soil Science, 79, 15–24.
Li CS, Frolking S, Butterbach-Bahl K (2005) Carbon sequestration
in arable soils is likely to increase nitrous oxide emissions,
offsetting reductions in climate radiative forcing. Climatic
Change, 72, 321–338.
N 2 O E M I S S I O N S F R O M C O N T R A S T I N G M A N A G E M E N T 1735
r 2007 The AuthorsJournal compilation r 2007 Blackwell Publishing Ltd, Global Change Biology, 13, 1722–1736
Liebig MA, Morgan JA, Reeder JD, Ellert BH, Gollany HT,
Schuman GE (2005) Greenhouse gas contributions and mitiga-
tion potential of agricultural practices in northwestern USA
and Western Canada. Soil and Tillage Research, 83, 25–52.
MacKenzie AF, Fan MX, Cadrin F (1997) Nitrous oxide emission
as affected by tillage, corn–soybean–alfalfa rotation and nitro-
gen fertilization. Canadian Journal of Soil Science, 77, 145–152.
Maggiotto SR, Webb J, Wagner-Riddle C, Thurtell GW (2000)
Nitrous and nitrogen oxide emissions from turfgrass receiving
different forms of nitrogen fertilizer. Journal of Environmental
Quality, 29, 621–630.
McCoy AJ, Parkin G, Wagner-Riddle C, Warland JS, Lauzon J,
von Bertoldi P, Jayasundara S (2006) Using automated soil
water content and temperature measurement to estimate soil
water budgets. Canadian Journal of Soil Science, 86, 47–56.
McKenney DJ, Wang SW, Drury CF, Findlay WI (1993) Denitri-
fication and mineralization in soil amended with legume,
grass and corn residues. Soil Science Society of America Journal,
57, 1013–1020.
McSwiney CP, Robertson GP (2005) Nonlinear response of N2O
flux to incremental fertilizer addition in a continuous maize (Zea
mays L.) cropping system. Global Change Biology, 11, 1712–1719.
Mosier AR (1994) Nitrous oxide summary. In: CH4 and N2O:
Global Emissions and Controls from Rice Fields and other Agricul-
tural and Industrial Sources (eds Minami K, Mosier A, Sass R),
pp. 135–139. NIAES, Tsukuba.
Mulvaney RL, Khan SA, Ellsworth TR (2006) Need for a soil-
based approach in managing nitrogen fertilizers for profitable
corn production. Soil Science Society Of America Journal, 70,
172–182.
Oke TR (1990) Boundary Layer Climates. Routledge, New York,
NY, USA.
Ontario Ministry of Agriculture Food and Rural Affairs (2002)
Agronomy Guide to Field Crops, Publication 811. Ministry of
Agriculture, Food and Rural Affairs, Toronto.
Parkin TB, Kaspar TC (2006) Nitrous oxide emissions from corn–
soybean systems in the Midwest. Journal of Environmental
Quality, 35, 1496–1506.
Paulson CA (1970) The mathematical representation of wind
speed and temperature profiles in the unstable atmospheric
surface layer. Journal of Applied Meteorology, 9, 857–861.
Robertson GP, Paul EA, Harwood RR (2000) Greenhouse gases in
intensive agriculture: contributions of individual gases to the
radiative forcing of the atmosphere. Science, 289, 1922–1925.
Rover M, Heinemeyer O, Kaiser EA (1998) Microbial induced
nitrous oxide emissions from an arable soil during winter. Soil
Biology and Biochemistry, 14, 1859–1865.
Sehy UJ, Dyckmans J, Ruser R, Munch JC (2004) Adding dis-
solved organic carbon to simulate freeze–thaw related N2O
emissions from soils. Journal of Plant Nutrition and Soil Science,
167, 471–478.
Sharma S, Szele Z, Schilling R, Munch JC, Schloter M (2006)
Influence of freeze–thaw stress on the structure and func-
tion of microbial communities and denitrifying popula-
tions in soil. Applied and Environmental Microbiology, 72,
2148–2154.
Six J, Ogle SM, Breidt FJ, Conant RT, Mosier AR, Paustian K
(2004) The potential to mitigate global warming with no-tillage
management is only realized when practised in the long term.
Global Change Biology, 10, 155–160.
Staley TE, Caskey WH, Boyer DG (1990) Soil denitrification and
nitrification potentials during the growing season relative to
tillage. Soil Science Society of America Journal, 54, 1602–1608.
Steel RGD, Torrie JH, Dickey DA (1997) Principles and Procedures
of Statistics: A Biometrical Approach, 3rd edn. McGraw-Hill,
New York.
Teepe R, Brumme R, Beese F (2000) Nitrous oxide emissions from
frozen soils under agricultural, fallow and forest land. Soil
Biology and Biochemistry, 32, 1807–1810.
Teepe R, Brumme R, Beese F (2001) Nitrous oxide emissions from
soil during freezing and thawing periods. Soil Biology and
Biochemistry, 33, 1269–1275.
Teepe R, Vor A, Beese F, Ludwig B (2004) Emissions of N2O from
soils during cycles of freezing and thawing and duration of
freezing. European Journal of Soil Science, 55, 357–365.
van Bochove E, Jones HG, Bertrand N, Prevost D (2000) Winter
fluxes of greenhouse gases from snow-covered agricultural
soil: intra-annual and interannual variations. Global Biogeo-
chemical Cycles, 14, 113–125.
Wagner-Riddle C, Thurtell GW (1998) Nitrous oxide emissions
from agricultural fields during winter and spring thaw
as affected by management practices. Nutrient Cycling in
Agroecosystems, 52, 151–163.
Wagner-Riddle C, Thurtell GW, Edwards GC (2005) Trace gas
concentration measurements for micrometeorological flux
quantification. In: Micrometeorology in Agricultural Systems
(eds Hatfield JL, Baker JM), pp. 321–344. Agronomy Mono-
graph no. 47 ASA-CSSA-SSSA, Madison, WI, USA.
Wagner-Riddle C, Thurtell GW, Kidd GK, Beauchamp EG,
Sweetman R (1997) Estimates of nitrous oxide emissions from
agricultural fields over 28 months. Canadian Journal Soil
Science, 77, 135–144.
Wagner-Riddle C, Thurtell GW, King KM, Kidd GE, Beauchamp
EG (1996) Nitrous oxide and carbon dioxide fluxes from a bare
soil using a micrometeorological approach. Journal of Environ-
mental Quality, 25, 898–907.
Williams PJ, Smith MW (1989) The Frozen Earth: Fundamentals
of Geocryology. Cambridge University Press, Cambridge.
Yates TT, Si BC, Farrell RE, Pennock DJ (2006) Probability
distribution and spatial dependence of nitrous oxide emission:
temporal change in hummocky terrain. Soil Science Society
of America Journal, 70, 753–762.
1736 C . WA G N E R - R I D D L E et al.
r 2007 The AuthorsJournal compilation r 2007 Blackwell Publishing Ltd, Global Change Biology, 13, 1722–1736