Integration of Transcriptome and Whole Genomic Resequencing Data to Identify Key Genes Affecting...
18
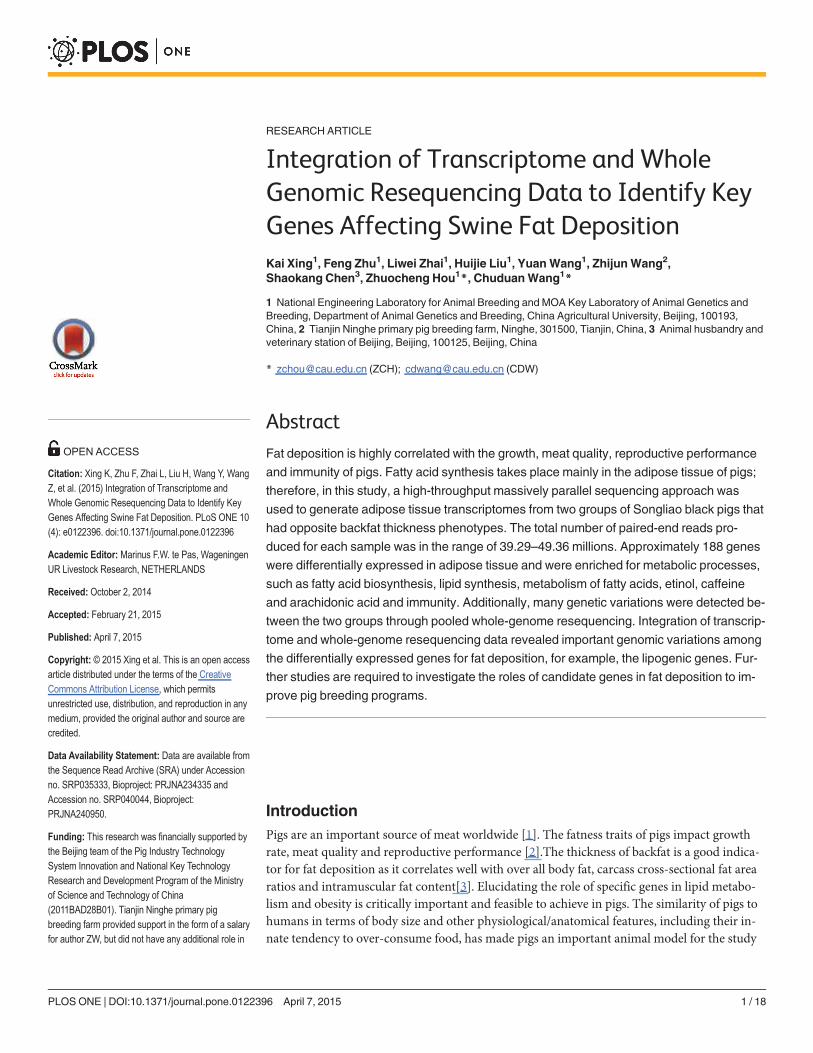
RESEARCH ARTICLE Integration of Transcriptome and Whole Genomic Resequencing Data to Identify Key Genes Affecting Swine Fat Deposition Kai Xing 1 , Feng Zhu 1 , Liwei Zhai 1 , Huijie Liu 1 , Yuan Wang 1 , Zhijun Wang 2 , Shaokang Chen 3 , Zhuocheng Hou 1 *, Chuduan Wang 1 * 1 National Engineering Laboratory for Animal Breeding and MOA Key Laboratory of Animal Genetics and Breeding, Department of Animal Genetics and Breeding, China Agricultural University, Beijing, 100193, China, 2 Tianjin Ninghe primary pig breeding farm, Ninghe, 301500, Tianjin, China, 3 Animal husbandry and veterinary station of Beijing, Beijing, 100125, Beijing, China * [email protected] (ZCH); [email protected] (CDW) Abstract Fat deposition is highly correlated with the growth, meat quality, reproductive performance and immunity of pigs. Fatty acid synthesis takes place mainly in the adipose tissue of pigs; therefore, in this study, a high-throughput massively parallel sequencing approach was used to generate adipose tissue transcriptomes from two groups of Songliao black pigs that had opposite backfat thickness phenotypes. The total number of paired-end reads pro- duced for each sample was in the range of 39.29–49.36 millions. Approximately 188 genes were differentially expressed in adipose tissue and were enriched for metabolic processes, such as fatty acid biosynthesis, lipid synthesis, metabolism of fatty acids, etinol, caffeine and arachidonic acid and immunity. Additionally, many genetic variations were detected be- tween the two groups through pooled whole-genome resequencing. Integration of transcrip- tome and whole-genome resequencing data revealed important genomic variations among the differentially expressed genes for fat deposition, for example, the lipogenic genes. Fur- ther studies are required to investigate the roles of candidate genes in fat deposition to im- prove pig breeding programs. Introduction Pigs are an important source of meat worldwide [1]. The fatness traits of pigs impact growth rate, meat quality and reproductive performance [2].The thickness of backfat is a good indica- tor for fat deposition as it correlates well with over all body fat, carcass cross-sectional fat area ratios and intramuscular fat content[3]. Elucidating the role of specific genes in lipid metabo- lism and obesity is critically important and feasible to achieve in pigs. The similarity of pigs to humans in terms of body size and other physiological/anatomical features, including their in- nate tendency to over-consume food, has made pigs an important animal model for the study PLOS ONE | DOI:10.1371/journal.pone.0122396 April 7, 2015 1 / 18 OPEN ACCESS Citation: Xing K, Zhu F, Zhai L, Liu H, Wang Y, Wang Z, et al. (2015) Integration of Transcriptome and Whole Genomic Resequencing Data to Identify Key Genes Affecting Swine Fat Deposition. PLoS ONE 10 (4): e0122396. doi:10.1371/journal.pone.0122396 Academic Editor: Marinus F.W. te Pas, Wageningen UR Livestock Research, NETHERLANDS Received: October 2, 2014 Accepted: February 21, 2015 Published: April 7, 2015 Copyright: © 2015 Xing et al. This is an open access article distributed under the terms of the Creative Commons Attribution License, which permits unrestricted use, distribution, and reproduction in any medium, provided the original author and source are credited. Data Availability Statement: Data are available from the Sequence Read Archive (SRA) under Accession no. SRP035333, Bioproject: PRJNA234335 and Accession no. SRP040044, Bioproject: PRJNA240950. Funding: This research was financially supported by the Beijing team of the Pig Industry Technology System Innovation and National Key Technology Research and Development Program of the Ministry of Science and Technology of China (2011BAD28B01). Tianjin Ninghe primary pig breeding farm provided support in the form of a salary for author ZW, but did not have any additional role in
-
Upload
independent -
Category
Documents
-
view
1 -
download
0
Transcript of Integration of Transcriptome and Whole Genomic Resequencing Data to Identify Key Genes Affecting...
RESEARCH ARTICLE
Integration of Transcriptome and WholeGenomic Resequencing Data to Identify KeyGenes Affecting Swine Fat DepositionKai Xing1, Feng Zhu1, Liwei Zhai1, Huijie Liu1, YuanWang1, ZhijunWang2,Shaokang Chen3, Zhuocheng Hou1*, ChuduanWang1*
1 National Engineering Laboratory for Animal Breeding and MOA Key Laboratory of Animal Genetics andBreeding, Department of Animal Genetics and Breeding, China Agricultural University, Beijing, 100193,China, 2 Tianjin Ninghe primary pig breeding farm, Ninghe, 301500, Tianjin, China, 3 Animal husbandry andveterinary station of Beijing, Beijing, 100125, Beijing, China
* [email protected] (ZCH); [email protected] (CDW)
AbstractFat deposition is highly correlated with the growth, meat quality, reproductive performance
and immunity of pigs. Fatty acid synthesis takes place mainly in the adipose tissue of pigs;
therefore, in this study, a high-throughput massively parallel sequencing approach was
used to generate adipose tissue transcriptomes from two groups of Songliao black pigs that
had opposite backfat thickness phenotypes. The total number of paired-end reads pro-
duced for each sample was in the range of 39.29–49.36 millions. Approximately 188 genes
were differentially expressed in adipose tissue and were enriched for metabolic processes,
such as fatty acid biosynthesis, lipid synthesis, metabolism of fatty acids, etinol, caffeine
and arachidonic acid and immunity. Additionally, many genetic variations were detected be-
tween the two groups through pooled whole-genome resequencing. Integration of transcrip-
tome and whole-genome resequencing data revealed important genomic variations among
the differentially expressed genes for fat deposition, for example, the lipogenic genes. Fur-
ther studies are required to investigate the roles of candidate genes in fat deposition to im-
prove pig breeding programs.
IntroductionPigs are an important source of meat worldwide [1]. The fatness traits of pigs impact growthrate, meat quality and reproductive performance [2].The thickness of backfat is a good indica-tor for fat deposition as it correlates well with over all body fat, carcass cross-sectional fat arearatios and intramuscular fat content[3]. Elucidating the role of specific genes in lipid metabo-lism and obesity is critically important and feasible to achieve in pigs. The similarity of pigs tohumans in terms of body size and other physiological/anatomical features, including their in-nate tendency to over-consume food, has made pigs an important animal model for the study
PLOSONE | DOI:10.1371/journal.pone.0122396 April 7, 2015 1 / 18
OPEN ACCESS
Citation: Xing K, Zhu F, Zhai L, Liu H, Wang Y, WangZ, et al. (2015) Integration of Transcriptome andWhole Genomic Resequencing Data to Identify KeyGenes Affecting Swine Fat Deposition. PLoS ONE 10(4): e0122396. doi:10.1371/journal.pone.0122396
Academic Editor: Marinus F.W. te Pas, WageningenUR Livestock Research, NETHERLANDS
Received: October 2, 2014
Accepted: February 21, 2015
Published: April 7, 2015
Copyright: © 2015 Xing et al. This is an open accessarticle distributed under the terms of the CreativeCommons Attribution License, which permitsunrestricted use, distribution, and reproduction in anymedium, provided the original author and source arecredited.
Data Availability Statement: Data are available fromthe Sequence Read Archive (SRA) under Accessionno. SRP035333, Bioproject: PRJNA234335 andAccession no. SRP040044, Bioproject:PRJNA240950.
Funding: This research was financially supported bythe Beijing team of the Pig Industry TechnologySystem Innovation and National Key TechnologyResearch and Development Program of the Ministryof Science and Technology of China(2011BAD28B01). Tianjin Ninghe primary pigbreeding farm provided support in the form of a salaryfor author ZW, but did not have any additional role in
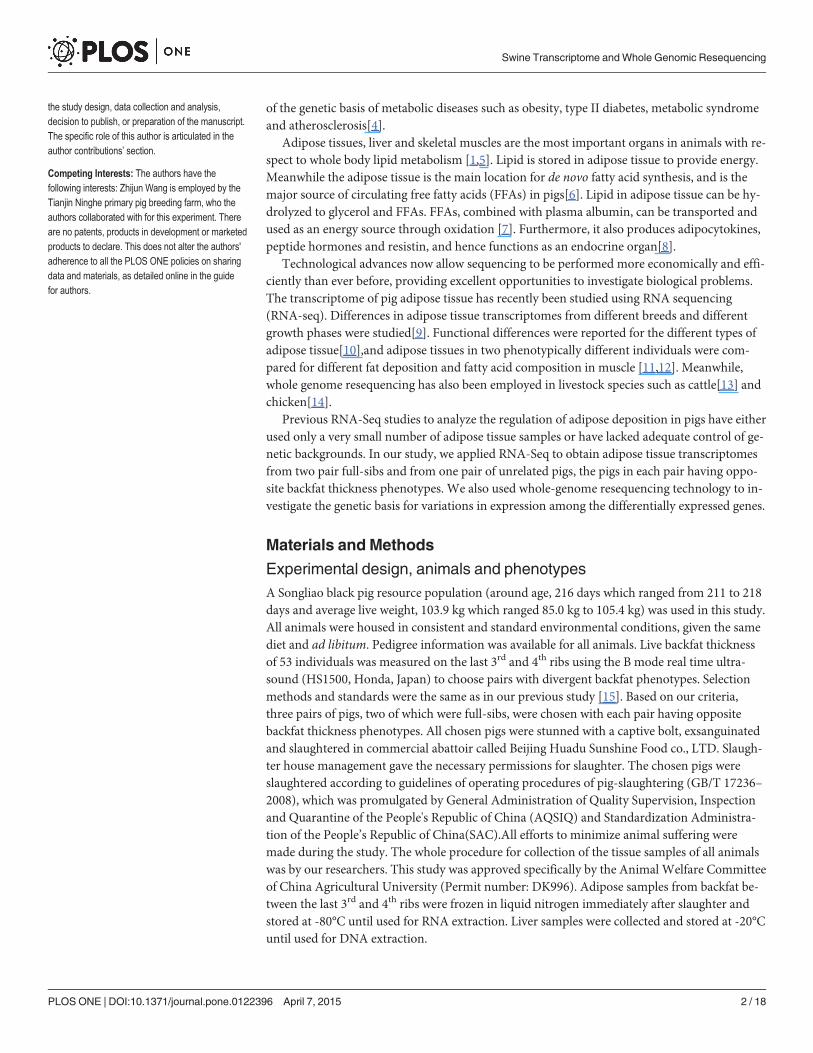
of the genetic basis of metabolic diseases such as obesity, type II diabetes, metabolic syndromeand atherosclerosis[4].
Adipose tissues, liver and skeletal muscles are the most important organs in animals with re-spect to whole body lipid metabolism [1,5]. Lipid is stored in adipose tissue to provide energy.Meanwhile the adipose tissue is the main location for de novo fatty acid synthesis, and is themajor source of circulating free fatty acids (FFAs) in pigs[6]. Lipid in adipose tissue can be hy-drolyzed to glycerol and FFAs. FFAs, combined with plasma albumin, can be transported andused as an energy source through oxidation [7]. Furthermore, it also produces adipocytokines,peptide hormones and resistin, and hence functions as an endocrine organ[8].
Technological advances now allow sequencing to be performed more economically and effi-ciently than ever before, providing excellent opportunities to investigate biological problems.The transcriptome of pig adipose tissue has recently been studied using RNA sequencing(RNA-seq). Differences in adipose tissue transcriptomes from different breeds and differentgrowth phases were studied[9]. Functional differences were reported for the different types ofadipose tissue[10],and adipose tissues in two phenotypically different individuals were com-pared for different fat deposition and fatty acid composition in muscle [11,12]. Meanwhile,whole genome resequencing has also been employed in livestock species such as cattle[13] andchicken[14].
Previous RNA-Seq studies to analyze the regulation of adipose deposition in pigs have eitherused only a very small number of adipose tissue samples or have lacked adequate control of ge-netic backgrounds. In our study, we applied RNA-Seq to obtain adipose tissue transcriptomesfrom two pair full-sibs and from one pair of unrelated pigs, the pigs in each pair having oppo-site backfat thickness phenotypes. We also used whole-genome resequencing technology to in-vestigate the genetic basis for variations in expression among the differentially expressed genes.
Materials and Methods
Experimental design, animals and phenotypesA Songliao black pig resource population (around age, 216 days which ranged from 211 to 218days and average live weight, 103.9 kg which ranged 85.0 kg to 105.4 kg) was used in this study.All animals were housed in consistent and standard environmental conditions, given the samediet and ad libitum. Pedigree information was available for all animals. Live backfat thicknessof 53 individuals was measured on the last 3rd and 4th ribs using the B mode real time ultra-sound (HS1500, Honda, Japan) to choose pairs with divergent backfat phenotypes. Selectionmethods and standards were the same as in our previous study [15]. Based on our criteria,three pairs of pigs, two of which were full-sibs, were chosen with each pair having oppositebackfat thickness phenotypes. All chosen pigs were stunned with a captive bolt, exsanguinatedand slaughtered in commercial abattoir called Beijing Huadu Sunshine Food co., LTD. Slaugh-ter house management gave the necessary permissions for slaughter. The chosen pigs wereslaughtered according to guidelines of operating procedures of pig-slaughtering (GB/T 17236–2008), which was promulgated by General Administration of Quality Supervision, Inspectionand Quarantine of the People's Republic of China (AQSIQ) and Standardization Administra-tion of the People’s Republic of China(SAC).All efforts to minimize animal suffering weremade during the study. The whole procedure for collection of the tissue samples of all animalswas by our researchers. This study was approved specifically by the Animal Welfare Committeeof China Agricultural University (Permit number: DK996). Adipose samples from backfat be-tween the last 3rd and 4th ribs were frozen in liquid nitrogen immediately after slaughter andstored at -80°C until used for RNA extraction. Liver samples were collected and stored at -20°Cuntil used for DNA extraction.
Swine Transcriptome andWhole Genomic Resequencing
PLOS ONE | DOI:10.1371/journal.pone.0122396 April 7, 2015 2 / 18
the study design, data collection and analysis,decision to publish, or preparation of the manuscript.The specific role of this author is articulated in theauthor contributions’ section.
Competing Interests: The authors have thefollowing interests: Zhijun Wang is employed by theTianjin Ninghe primary pig breeding farm, who theauthors collaborated with for this experiment. Thereare no patents, products in development or marketedproducts to declare. This does not alter the authors'adherence to all the PLOS ONE policies on sharingdata and materials, as detailed online in the guidefor authors.
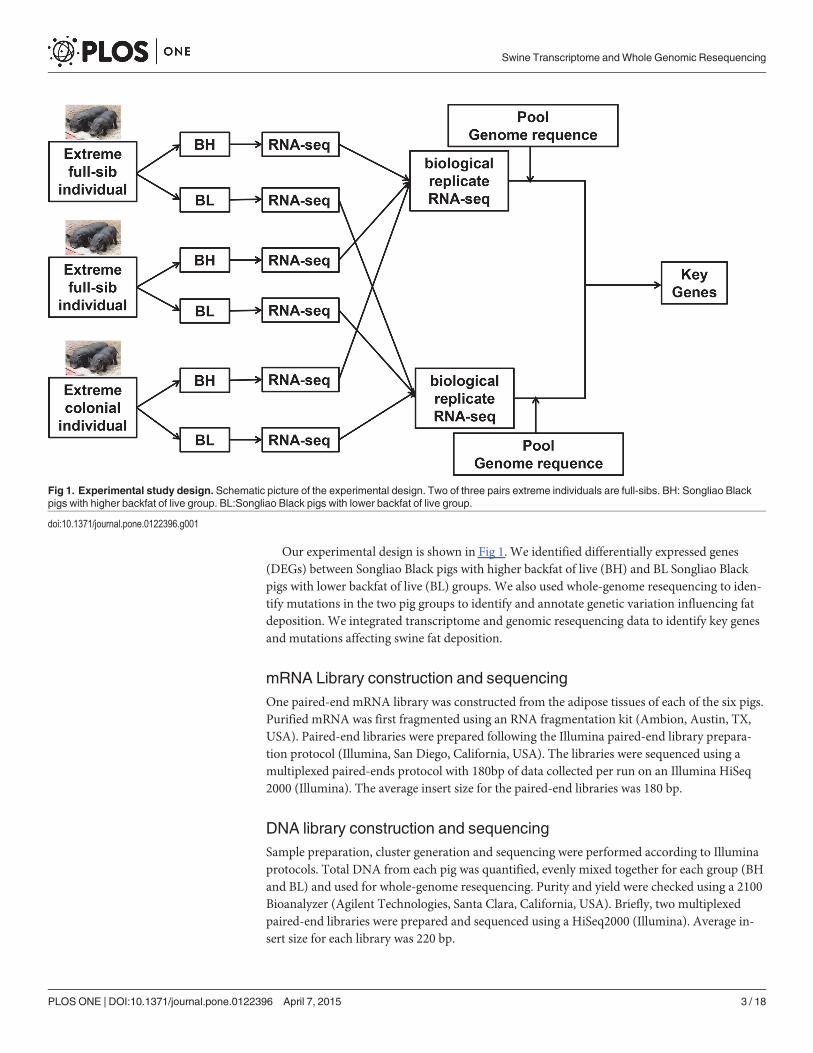
Our experimental design is shown in Fig 1. We identified differentially expressed genes(DEGs) between Songliao Black pigs with higher backfat of live (BH) and BL Songliao Blackpigs with lower backfat of live (BL) groups. We also used whole-genome resequencing to iden-tify mutations in the two pig groups to identify and annotate genetic variation influencing fatdeposition. We integrated transcriptome and genomic resequencing data to identify key genesand mutations affecting swine fat deposition.
mRNA Library construction and sequencingOne paired-end mRNA library was constructed from the adipose tissues of each of the six pigs.Purified mRNA was first fragmented using an RNA fragmentation kit (Ambion, Austin, TX,USA). Paired-end libraries were prepared following the Illumina paired-end library prepara-tion protocol (Illumina, San Diego, California, USA). The libraries were sequenced using amultiplexed paired-ends protocol with 180bp of data collected per run on an Illumina HiSeq2000 (Illumina). The average insert size for the paired-end libraries was 180 bp.
DNA library construction and sequencingSample preparation, cluster generation and sequencing were performed according to Illuminaprotocols. Total DNA from each pig was quantified, evenly mixed together for each group (BHand BL) and used for whole-genome resequencing. Purity and yield were checked using a 2100Bioanalyzer (Agilent Technologies, Santa Clara, California, USA). Briefly, two multiplexedpaired-end libraries were prepared and sequenced using a HiSeq2000 (Illumina). Average in-sert size for each library was 220 bp.
Fig 1. Experimental study design. Schematic picture of the experimental design. Two of three pairs extreme individuals are full-sibs. BH: Songliao Blackpigs with higher backfat of live group. BL:Songliao Black pigs with lower backfat of live group.
doi:10.1371/journal.pone.0122396.g001
Swine Transcriptome andWhole Genomic Resequencing
PLOS ONE | DOI:10.1371/journal.pone.0122396 April 7, 2015 3 / 18
Bioinformatic analysisThe raw data were subjected todata quality evaluation, filtering and trimming before mappingon the swine reference genome. After the data quality control process, we used TopHat soft-ware for mapping short-reads and easyRNASeq software to quantify the raw reads. Differen-tially expressed genes (DEGs) were discovered using NOISeq [16]. NOISeq is a nonparametricapproach for the identification of differentially expressed genes. Because of the noise distribu-tion from the actual data, the NOISeq method could better adapt to the size of data set and wasmore effective in controlling the rate of false discoveries. A threshold of 0.8 was used for thisprobability, meaning that the gene is four times more likely to be differentially expressed thannon-differentially expressed, as an adjusted P-value threshold of 0.001 for the other methods[17]. Functional enrichment analysis of the DEGs were performed in the DAVID system [18]and functional protein interaction networks were constructed in the STRING database[19].Details of the RNA-Seq analysis are in our previous publication[15]. BWA software was usedto map genomic resequencing data to the reference pig genome (Sscrofa10.2) with default pa-rameters[20]. Quality score recalibration, local indel realignment and removal of duplicatesfrom alignments was performed using GATK[21]. Single nucleotide variants (SNVs) and indelvariants were called using GATK.
Quantitative PCR analysisTo validate changes in transcript levels between BH and BL groups (n = 3)(for genes with func-tions related to fatty acid synthesis), six genes, including ACACA, LDHA, ELOVL6, CYP1A2,PDK1 and SCD, were selected and quantified using qRT-PCR. Total RNA was extracted fromadipose tissue and converted to cDNA using a Revert Aid First Strand cDNA Synthesis Kit(Thermo Fisher Scientific, Waltham, MA, USA) following the manufacturer’s protocol. ThecDNA samples were then analyzed by RT-PCR using a Light Cycler 480 Real-Time PCR Sys-tem (Roche, Hercules, CA, USA). The RT-PCR reactions were performed in a final volume of20 μl using the Roche SYBR Green PCR Kit (Roche, Hercules, CA, USA) according to the man-ufacturer’s instructions. The RT-PCR primers designed for the six genes are listed in S1 Table.Gene expression values for qRT-PCR were normalized using the housekeeping gene, GAPDH.Triplicate qRT-PCRs were performed on each cDNA and the average Ct was used for furtheranalysis. The relative quantification values were calculated using the 2-ΔΔCt method.
Results
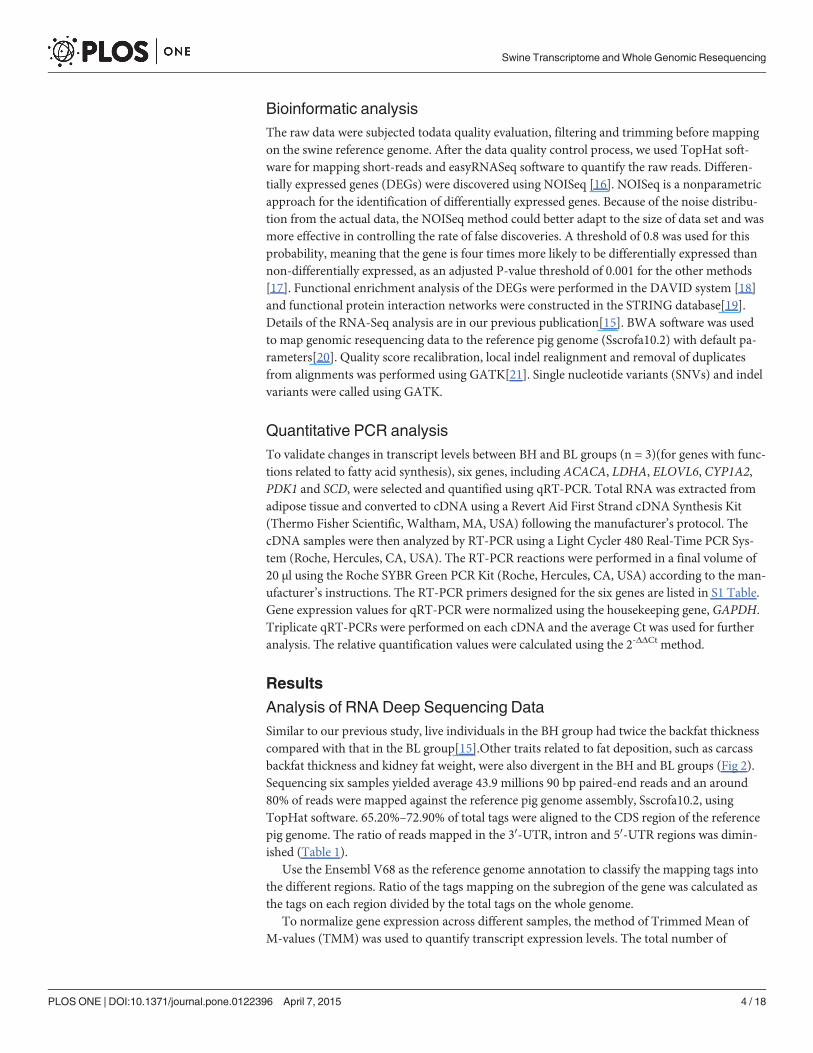
Analysis of RNA Deep Sequencing DataSimilar to our previous study, live individuals in the BH group had twice the backfat thicknesscompared with that in the BL group[15].Other traits related to fat deposition, such as carcassbackfat thickness and kidney fat weight, were also divergent in the BH and BL groups (Fig 2).Sequencing six samples yielded average 43.9 millions 90 bp paired-end reads and an around80% of reads were mapped against the reference pig genome assembly, Sscrofa10.2, usingTopHat software. 65.20%–72.90% of total tags were aligned to the CDS region of the referencepig genome. The ratio of reads mapped in the 30-UTR, intron and 50-UTR regions was dimin-ished (Table 1).
Use the Ensembl V68 as the reference genome annotation to classify the mapping tags intothe different regions. Ratio of the tags mapping on the subregion of the gene was calculated asthe tags on each region divided by the total tags on the whole genome.
To normalize gene expression across different samples, the method of Trimmed Mean ofM-values (TMM) was used to quantify transcript expression levels. The total number of
Swine Transcriptome andWhole Genomic Resequencing
PLOS ONE | DOI:10.1371/journal.pone.0122396 April 7, 2015 4 / 18
expressed genes in different animals was similar and ranged from 17,175 to 17,715 (S2 Table).Correlations between biological replicate samples had very high reproducibility. The deep se-quencing data of total RNA have been submitted to NCBI Sequence Read Archive (SRA) underAccession no.SRP035333, Bioproject: PRJNA234335.
To validate the RNA-seq results, on the basis of differential expression, a total of six geneswith functions related to fatty acid synthesis, including ACACA, LDHA, ELOVL6, CYP1A2,PDK1 and SCD, were selected and their expression assayed byRT-PCR. The commonly usedreference gene, GAPDH, was used for validation. For all six genes, the RT-PCR fold-change ra-tios between BH and BL groups were consistent with the RNA-Seq data (S1 Fig).
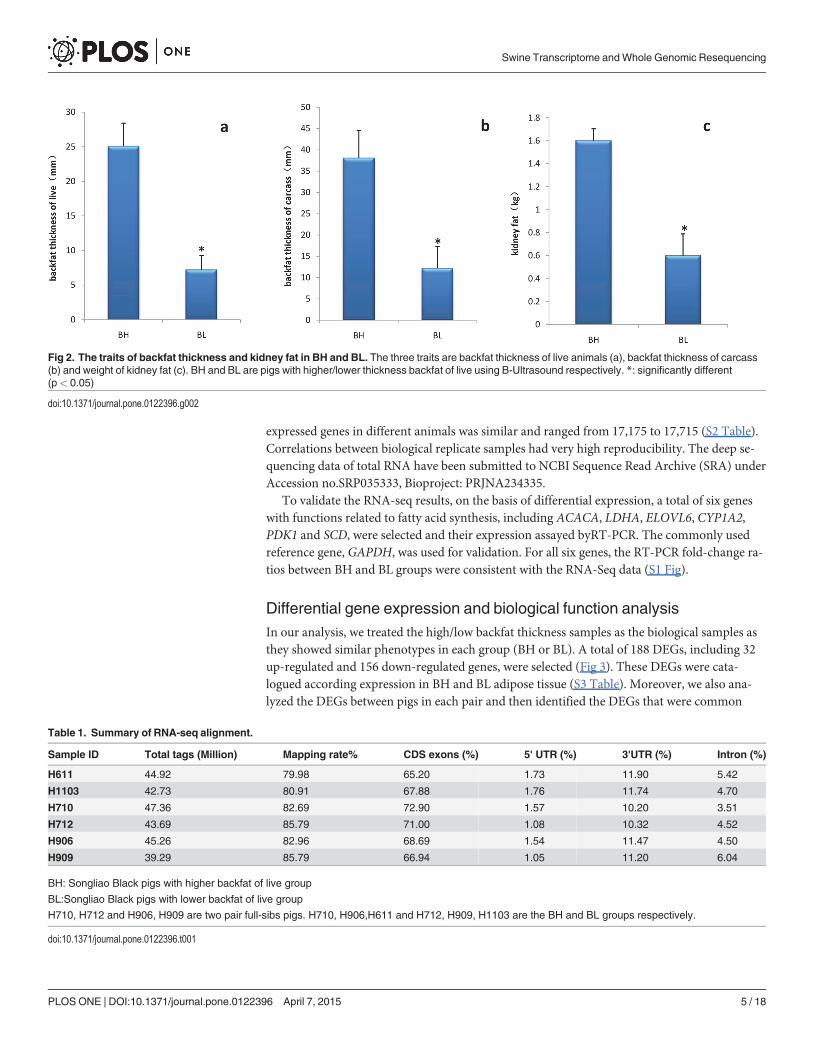
Differential gene expression and biological function analysisIn our analysis, we treated the high/low backfat thickness samples as the biological samples asthey showed similar phenotypes in each group (BH or BL). A total of 188 DEGs, including 32up-regulated and 156 down-regulated genes, were selected (Fig 3). These DEGs were cata-logued according expression in BH and BL adipose tissue (S3 Table). Moreover, we also ana-lyzed the DEGs between pigs in each pair and then identified the DEGs that were common
Fig 2. The traits of backfat thickness and kidney fat in BH and BL. The three traits are backfat thickness of live animals (a), backfat thickness of carcass(b) and weight of kidney fat (c). BH and BL are pigs with higher/lower thickness backfat of live using B-Ultrasound respectively. *: significantly different(p< 0.05)
doi:10.1371/journal.pone.0122396.g002
Table 1. Summary of RNA-seq alignment.
Sample ID Total tags (Million) Mapping rate% CDS exons (%) 5' UTR (%) 3'UTR (%) Intron (%)
H611 44.92 79.98 65.20 1.73 11.90 5.42
H1103 42.73 80.91 67.88 1.76 11.74 4.70
H710 47.36 82.69 72.90 1.57 10.20 3.51
H712 43.69 85.79 71.00 1.08 10.32 4.52
H906 45.26 82.96 68.69 1.54 11.47 4.50
H909 39.29 85.79 66.94 1.05 11.20 6.04
BH: Songliao Black pigs with higher backfat of live group
BL:Songliao Black pigs with lower backfat of live group
H710, H712 and H906, H909 are two pair full-sibs pigs. H710, H906,H611 and H712, H909, H1103 are the BH and BL groups respectively.
doi:10.1371/journal.pone.0122396.t001
Swine Transcriptome andWhole Genomic Resequencing
PLOS ONE | DOI:10.1371/journal.pone.0122396 April 7, 2015 5 / 18
among the three different pairs (Fig 4). The DEG details, including gene name, expression leveland statistical information, were shown in the S4 Table. Because of the sample limitations ofthe DEGs for each pair, we only show DEGs and their functional analysis that were obtainedby treating three pairs as the three biological replicates.
About 27 of 28 highly expressed genes in the BH group were mapped to GO and KEGGpathways in DAVID. The functional enrichment of pathways (Table 2) and biological func-tions (Fig 5) included fatty acid biosynthesis, the insulin signaling pathway, biosynthesis of un-saturated fatty acids, lipid synthesis, fatty acid metabolic process, response to hormone, lipaseactivity, and saccharide metabolic process. These results showed that the enzymes involved in
Fig 3. Gene expression level in BH and BL groups. A. X-axis plots gene expression counts in the BH group after TMM quantification and the y-axis plotsgene expression counts in the BL group after TMM quantification. The red points indicate significantly differentially expressed genes.
doi:10.1371/journal.pone.0122396.g003
Swine Transcriptome andWhole Genomic Resequencing
PLOS ONE | DOI:10.1371/journal.pone.0122396 April 7, 2015 6 / 18
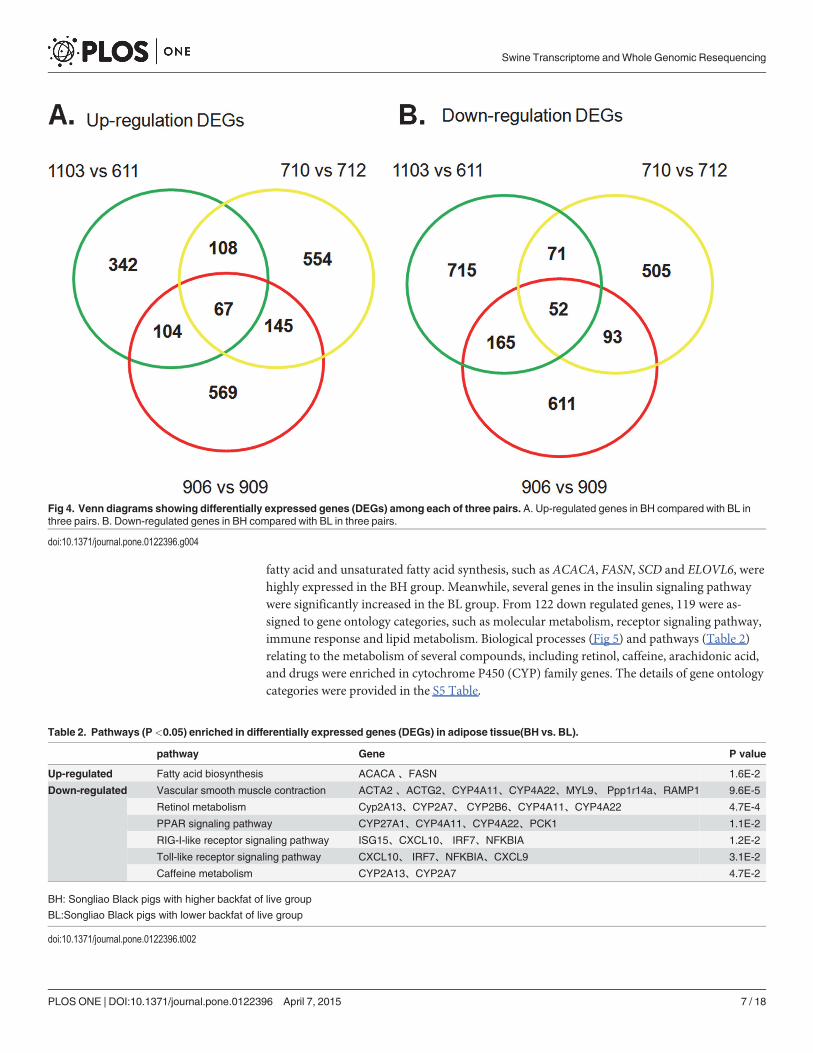
fatty acid and unsaturated fatty acid synthesis, such as ACACA, FASN, SCD and ELOVL6, werehighly expressed in the BH group. Meanwhile, several genes in the insulin signaling pathwaywere significantly increased in the BL group. From 122 down regulated genes, 119 were as-signed to gene ontology categories, such as molecular metabolism, receptor signaling pathway,immune response and lipid metabolism. Biological processes (Fig 5) and pathways (Table 2)relating to the metabolism of several compounds, including retinol, caffeine, arachidonic acid,and drugs were enriched in cytochrome P450 (CYP) family genes. The details of gene ontologycategories were provided in the S5 Table.
Fig 4. Venn diagrams showing differentially expressed genes (DEGs) among each of three pairs. A. Up-regulated genes in BH compared with BL inthree pairs. B. Down-regulated genes in BH compared with BL in three pairs.
doi:10.1371/journal.pone.0122396.g004
Table 2. Pathways (P<0.05) enriched in differentially expressed genes (DEGs) in adipose tissue(BH vs. BL).
pathway Gene P value
Up-regulated Fatty acid biosynthesis ACACA 、FASN 1.6E-2
Down-regulated Vascular smooth muscle contraction ACTA2 、ACTG2、CYP4A11、CYP4A22、MYL9、 Ppp1r14a、RAMP1 9.6E-5
Retinol metabolism Cyp2A13、CYP2A7、 CYP2B6、CYP4A11、CYP4A22 4.7E-4
PPAR signaling pathway CYP27A1、CYP4A11、CYP4A22、PCK1 1.1E-2
RIG-I-like receptor signaling pathway ISG15、CXCL10、 IRF7、NFKBIA 1.2E-2
Toll-like receptor signaling pathway CXCL10、 IRF7、NFKBIA、CXCL9 3.1E-2
Caffeine metabolism CYP2A13、CYP2A7 4.7E-2
BH: Songliao Black pigs with higher backfat of live group
BL:Songliao Black pigs with lower backfat of live group
doi:10.1371/journal.pone.0122396.t002
Swine Transcriptome andWhole Genomic Resequencing
PLOS ONE | DOI:10.1371/journal.pone.0122396 April 7, 2015 7 / 18
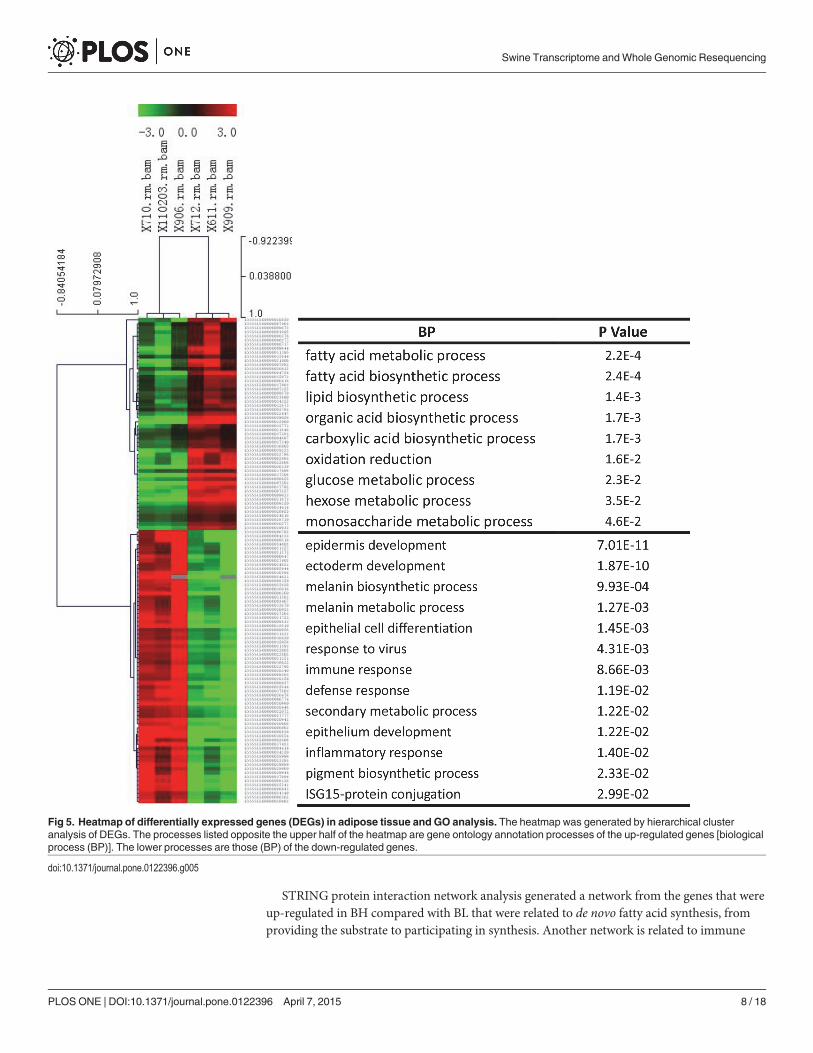
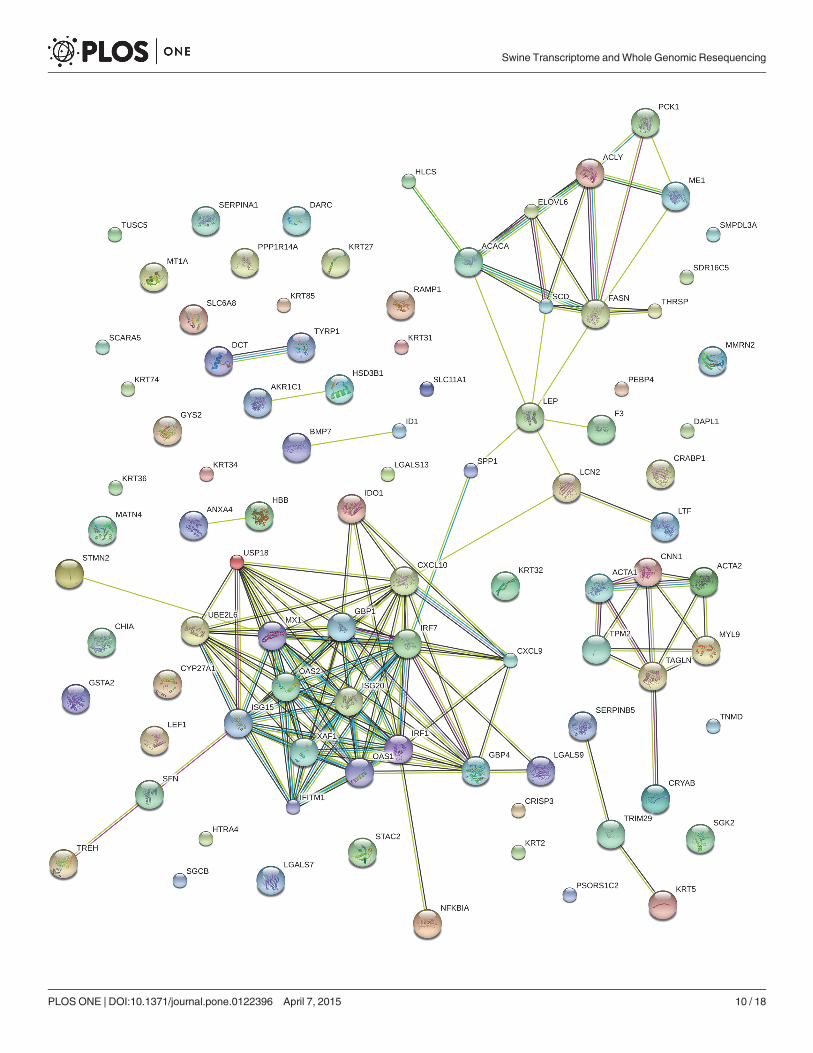
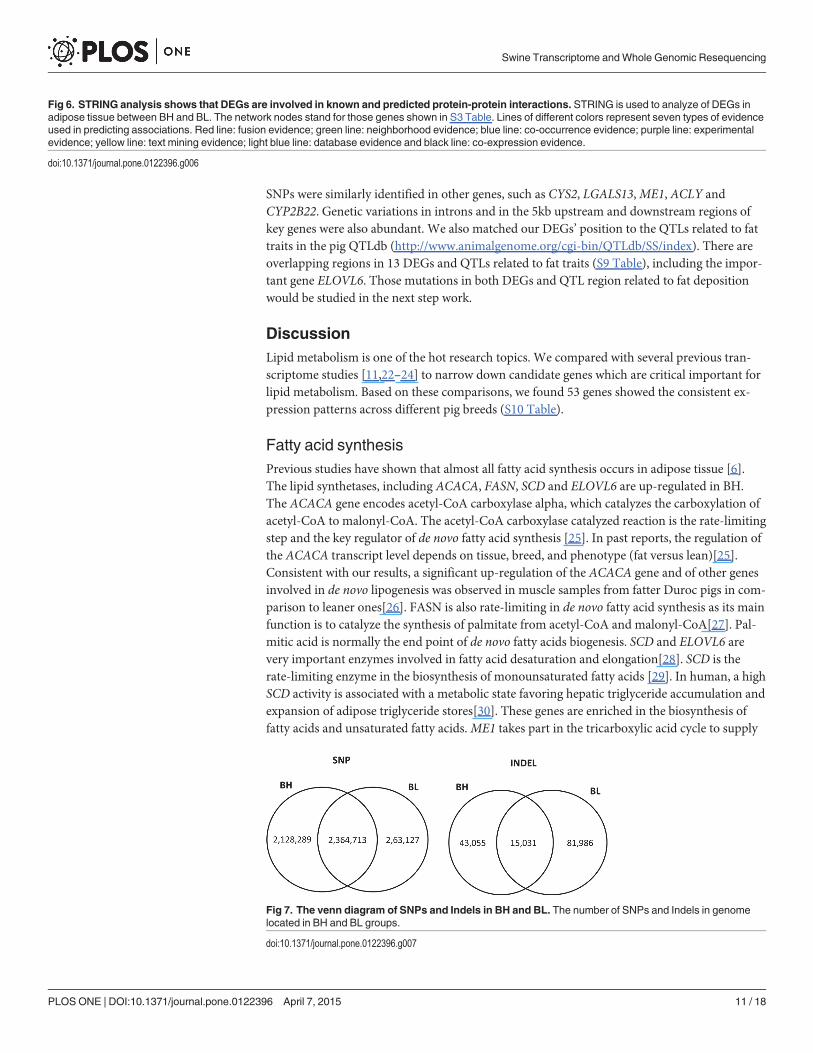
STRING protein interaction network analysis generated a network from the genes that wereup-regulated in BH compared with BL that were related to de novo fatty acid synthesis, fromproviding the substrate to participating in synthesis. Another network is related to immune
Fig 5. Heatmap of differentially expressed genes (DEGs) in adipose tissue and GO analysis. The heatmap was generated by hierarchical clusteranalysis of DEGs. The processes listed opposite the upper half of the heatmap are gene ontology annotation processes of the up-regulated genes [biologicalprocess (BP)]. The lower processes are those (BP) of the down-regulated genes.
doi:10.1371/journal.pone.0122396.g005
Swine Transcriptome andWhole Genomic Resequencing
PLOS ONE | DOI:10.1371/journal.pone.0122396 April 7, 2015 8 / 18
action through three systems: 1) direct involvement in the antiviral process, 2) regulation of in-terfere on antiviral effectors, 3) functions in ubiquitination by immune and proinflammatoryresponses (Fig 6). Most genes in the immune action network are down-regulated in the BHgroup compared with the BL group.
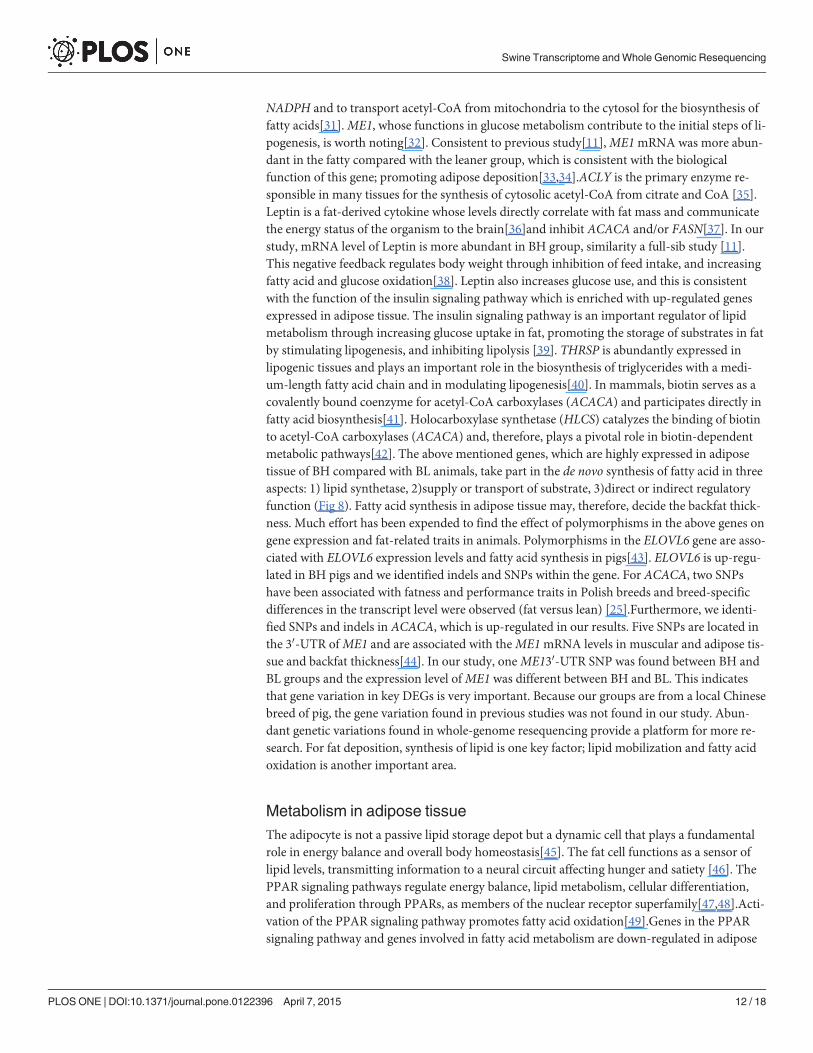
Genome sequencing, SNP/indel detection, and functional annotation ofgenomic variationEach whole genomic resequencing pooled sample were harvested to about 25G clean data withaverage 10×for each pool. Complete data sets of whole genomic resequencing have been sub-mitted to NCBI SRA under Accession no. SRP040044, Bioproject: PRJNA240950. UsingGATK, we identified single nucleotide polymorphisms (SNPs) and indels in BH and BLgroups, some of which were common (Fig 7). The number of homozygous SNPs in BH and BLgroups, was smaller than that of heterozygous SNPs, with a ratio of 1:1.46 and 1:1.36 (homozy-gous: heterozygous), respectively, but among the indels, the result was the opposite (2.63:1 and2.61:1). Most of the SNPs and indels are located between genes or within intergenic regionsand introns.
Because the two groups have opposite backfat thickness phenotypes, we focused on theSNPs and indels that were different between groups. The SNPs that were only in BH or BLwere annotated to 21,134 and 21,623 genes, respectively, using the NCBI Reference sequencedatabase (S6 Table). Non-synonymous (NS) SNPs and indels within a coding DNA sequence(cIndel) may affect gene expression or function. We detected 5,099 NS SNPs in 2753 genes and145 cIndels in 104 genes in the BH group. Similarly, we detected 6,010 NS SNPs in 3116 genesand 223 cIndels in 139 genes in the BL group. In total, there were 2818 and 3198 genes with NSSNPs/cIndels in the BH and BL groups, respectively. After conversion to homologous humangenes, we conducted a DAVID functional annotation clustering analysis of genes containingvariants (NS SNPs/cIndels) to identify molecular functions (MF), biological processes (BP),cellular components (CC) and KEGG pathways (S7 Table). The genes with variants (NS SNPs/cIndels) were found in numerous pathways, including synthesis, metabolism, oxidation reduc-tion, enzymes activity, molecule transport and binding. The most significant pathway was ol-factory transduction in both BH and BL, and is involved with 107 and 110 genes in BH and BL,respectively. Sixty and 67 genes were detected in the lipid related process such as lipid biosyn-thesis, lipid transport, lipid localization, lipid binding, fatty acid metabolic process, and regula-tion of lipid kinase activity. NS SNPs/cIndels genes were significantly enriched in the linoleicacid metabolism, fatty acid metabolism and starch and sucrose metabolism which are very im-portant in the lipid metabolism (S7 Table).
Mutations in DEGs supported by genomic resequencingA large number of SNPs and indels were detected in adipose tissue DEGs in the BH and BLgroups (S8 Table). The genetic variations included frame shift, splice site, UTR and non-synon-ymous coding lesions that may affect gene expression, function and even phenotype. As men-tioned above, through DEG functional enrichment analysis, several genes regulating lipidprocesses were found. For these genes, genetic variation between BH and BL is particularly im-portant. Almost all indels were found in introns except for two frame-shifts: one in the ACACAgene and one in the CYS2 30-UTR. It is noteworthy that a great number of indels were identi-fied in ACACA and ELOVL6 genes. Many SNPs were detected in important regions of the keyDEGs. For instance, SCD, a key gene in the biosynthesis of unsaturated fatty acids, had sevenSNPs in the 30-UTR. For FASN, a key gene in the biosynthesis of fatty acids, the genetic varia-tion was more complex and included three 50-UTR and nine non-synonymous coding SNPs.
Swine Transcriptome andWhole Genomic Resequencing
PLOS ONE | DOI:10.1371/journal.pone.0122396 April 7, 2015 9 / 18
Swine Transcriptome andWhole Genomic Resequencing
PLOS ONE | DOI:10.1371/journal.pone.0122396 April 7, 2015 10 / 18
SNPs were similarly identified in other genes, such as CYS2, LGALS13,ME1, ACLY andCYP2B22. Genetic variations in introns and in the 5kb upstream and downstream regions ofkey genes were also abundant. We also matched our DEGs’ position to the QTLs related to fattraits in the pig QTLdb (http://www.animalgenome.org/cgi-bin/QTLdb/SS/index). There areoverlapping regions in 13 DEGs and QTLs related to fat traits (S9 Table), including the impor-tant gene ELOVL6. Those mutations in both DEGs and QTL region related to fat depositionwould be studied in the next step work.
DiscussionLipid metabolism is one of the hot research topics. We compared with several previous tran-scriptome studies [11,22–24] to narrow down candidate genes which are critical important forlipid metabolism. Based on these comparisons, we found 53 genes showed the consistent ex-pression patterns across different pig breeds (S10 Table).
Fatty acid synthesisPrevious studies have shown that almost all fatty acid synthesis occurs in adipose tissue [6].The lipid synthetases, including ACACA, FASN, SCD and ELOVL6 are up-regulated in BH.The ACACA gene encodes acetyl-CoA carboxylase alpha, which catalyzes the carboxylation ofacetyl-CoA to malonyl-CoA. The acetyl-CoA carboxylase catalyzed reaction is the rate-limitingstep and the key regulator of de novo fatty acid synthesis [25]. In past reports, the regulation ofthe ACACA transcript level depends on tissue, breed, and phenotype (fat versus lean)[25].Consistent with our results, a significant up-regulation of the ACACA gene and of other genesinvolved in de novo lipogenesis was observed in muscle samples from fatter Duroc pigs in com-parison to leaner ones[26]. FASN is also rate-limiting in de novo fatty acid synthesis as its mainfunction is to catalyze the synthesis of palmitate from acetyl-CoA and malonyl-CoA[27]. Pal-mitic acid is normally the end point of de novo fatty acids biogenesis. SCD and ELOVL6 arevery important enzymes involved in fatty acid desaturation and elongation[28]. SCD is therate-limiting enzyme in the biosynthesis of monounsaturated fatty acids [29]. In human, a highSCD activity is associated with a metabolic state favoring hepatic triglyceride accumulation andexpansion of adipose triglyceride stores[30]. These genes are enriched in the biosynthesis offatty acids and unsaturated fatty acids.ME1 takes part in the tricarboxylic acid cycle to supply
Fig 6. STRING analysis shows that DEGs are involved in known and predicted protein-protein interactions. STRING is used to analyze of DEGs inadipose tissue between BH and BL. The network nodes stand for those genes shown in S3 Table. Lines of different colors represent seven types of evidenceused in predicting associations. Red line: fusion evidence; green line: neighborhood evidence; blue line: co-occurrence evidence; purple line: experimentalevidence; yellow line: text mining evidence; light blue line: database evidence and black line: co-expression evidence.
doi:10.1371/journal.pone.0122396.g006
Fig 7. The venn diagram of SNPs and Indels in BH and BL. The number of SNPs and Indels in genomelocated in BH and BL groups.
doi:10.1371/journal.pone.0122396.g007
Swine Transcriptome andWhole Genomic Resequencing
PLOS ONE | DOI:10.1371/journal.pone.0122396 April 7, 2015 11 / 18
NADPH and to transport acetyl-CoA from mitochondria to the cytosol for the biosynthesis offatty acids[31].ME1, whose functions in glucose metabolism contribute to the initial steps of li-pogenesis, is worth noting[32]. Consistent to previous study[11],ME1mRNA was more abun-dant in the fatty compared with the leaner group, which is consistent with the biologicalfunction of this gene; promoting adipose deposition[33,34].ACLY is the primary enzyme re-sponsible in many tissues for the synthesis of cytosolic acetyl-CoA from citrate and CoA [35].Leptin is a fat-derived cytokine whose levels directly correlate with fat mass and communicatethe energy status of the organism to the brain[36]and inhibit ACACA and/or FASN[37]. In ourstudy, mRNA level of Leptin is more abundant in BH group, similarity a full-sib study [11].This negative feedback regulates body weight through inhibition of feed intake, and increasingfatty acid and glucose oxidation[38]. Leptin also increases glucose use, and this is consistentwith the function of the insulin signaling pathway which is enriched with up-regulated genesexpressed in adipose tissue. The insulin signaling pathway is an important regulator of lipidmetabolism through increasing glucose uptake in fat, promoting the storage of substrates in fatby stimulating lipogenesis, and inhibiting lipolysis [39]. THRSP is abundantly expressed inlipogenic tissues and plays an important role in the biosynthesis of triglycerides with a medi-um-length fatty acid chain and in modulating lipogenesis[40]. In mammals, biotin serves as acovalently bound coenzyme for acetyl-CoA carboxylases (ACACA) and participates directly infatty acid biosynthesis[41]. Holocarboxylase synthetase (HLCS) catalyzes the binding of biotinto acetyl-CoA carboxylases (ACACA) and, therefore, plays a pivotal role in biotin-dependentmetabolic pathways[42]. The above mentioned genes, which are highly expressed in adiposetissue of BH compared with BL animals, take part in the de novo synthesis of fatty acid in threeaspects: 1) lipid synthetase, 2)supply or transport of substrate, 3)direct or indirect regulatoryfunction (Fig 8). Fatty acid synthesis in adipose tissue may, therefore, decide the backfat thick-ness. Much effort has been expended to find the effect of polymorphisms in the above genes ongene expression and fat-related traits in animals. Polymorphisms in the ELOVL6 gene are asso-ciated with ELOVL6 expression levels and fatty acid synthesis in pigs[43]. ELOVL6 is up-regu-lated in BH pigs and we identified indels and SNPs within the gene. For ACACA, two SNPshave been associated with fatness and performance traits in Polish breeds and breed-specificdifferences in the transcript level were observed (fat versus lean) [25].Furthermore, we identi-fied SNPs and indels in ACACA, which is up-regulated in our results. Five SNPs are located inthe 30-UTR ofME1 and are associated with theME1mRNA levels in muscular and adipose tis-sue and backfat thickness[44]. In our study, oneME130-UTR SNP was found between BH andBL groups and the expression level ofME1 was different between BH and BL. This indicatesthat gene variation in key DEGs is very important. Because our groups are from a local Chinesebreed of pig, the gene variation found in previous studies was not found in our study. Abun-dant genetic variations found in whole-genome resequencing provide a platform for more re-search. For fat deposition, synthesis of lipid is one key factor; lipid mobilization and fatty acidoxidation is another important area.
Metabolism in adipose tissueThe adipocyte is not a passive lipid storage depot but a dynamic cell that plays a fundamentalrole in energy balance and overall body homeostasis[45]. The fat cell functions as a sensor oflipid levels, transmitting information to a neural circuit affecting hunger and satiety [46]. ThePPAR signaling pathways regulate energy balance, lipid metabolism, cellular differentiation,and proliferation through PPARs, as members of the nuclear receptor superfamily[47,48].Acti-vation of the PPAR signaling pathway promotes fatty acid oxidation[49].Genes in the PPARsignaling pathway and genes involved in fatty acid metabolism are down-regulated in adipose
Swine Transcriptome andWhole Genomic Resequencing
PLOS ONE | DOI:10.1371/journal.pone.0122396 April 7, 2015 12 / 18

tissue between high and low backfat animals in cattle[50]. CYP2A13, in the PPAR signalingpathway, is down-regulated in adipose tissues between Korean native (fat) and Yorkshire(lean) pigs[51]. Consistent with our results, the PPAR signaling pathway and CYP2A13 aredown-regulated in adipose tissue between BH and BL. This indicates a higher fatty acid metab-olism in adipose tissue in the BL group. Retinoids (vitamin A) are crucial for most forms of life[52], and many studies have identified connections between retinoid and lipid metabolism[53].Retinoids regulate metabolism by activating specific nuclear receptors, including the retinoicacid receptor (RAR) and the retinoid Xreceptor (RXR), an obligate heterodimeric partner forother nuclear receptors, including PPARs, and help to coordinate energy balance[54].Retinoidmetabolism was down-regulated in adipose tissue and up-regulated in liver (BH vs. BL) andmay cause the difference in lipid metabolism between the two groups. Meanwhile, the P450gene family is activated by RXR and PPARs[55]. The P450 genes play critical roles in catalyzingreactions in the metabolism of drugs, environmental pollutants and other xenobiotics and inthe oxidation of unsaturated fatty acids to intracellular messengers[56]. Several P450 geneswere found at different expression levels between Korean native (fat) and Yorkshire (lean) pigs[51]. In our results, some P450 genes behave similarly.
Immune response and metabolic regulation in adipose tissueThe immune response and metabolic regulation are highly integrated. Adipose tissue is not animmune organ, but provides a close relationship between the immune system and metabolism[57].As above mentioned, the DEGs and pathways identified in this study regulate metabolism,especially fatty acid metabolism. Genes related to the immune system, such as NFKBIA, IRF1,
Fig 8. The function of DEGs in the de novo fatty acids synthesis. Black arrow means enzymes take part in the de novo fatty acids synthesis; red arrowmeans inhibiting effect; green arrow means promoting effect; blue quadrangle means up-regulation expression genes between BH and BL in adipose tissue
doi:10.1371/journal.pone.0122396.g008
Swine Transcriptome andWhole Genomic Resequencing
PLOS ONE | DOI:10.1371/journal.pone.0122396 April 7, 2015 13 / 18
MX1 and OAS1 show a significantly higher level of expression in the adipose tissue of BL pigs(the leaner group). Adipocytokines are a key component not only of metabolic regulation, butalso of the immune response. Leptin, an abundant adipocyte product, represents one of thebest examples of an adipocytokine. Leptin is involved in the control of energy expenditure,lipid and carbohydrate metabolism, which are mentioned above. Leptin also regulates endo-crine and immune functions. Genetic defects of leptin or leptin receptors leads to reduced mac-rophage phagocytosis and the expression of proinflammatory cytokines, both in vivo and invitro, and exogenous leptin up-regulates these[58]. These results indicate that leptin is up-regu-lated in inflammatory immune responses. But in our results, the mRNA level of leptin and ofimmune response-related genes was the opposite. Another way that metabolic and immuneprocesses are regulated by lipids involves transcription factors, like PPARs and LXRs. Ligandsto all three family members suppress NFKB, and then induce the production of proinflamma-tory cytokines. But unliganded PPARβ has an inflammatory function. In our results, both thePPAR signing pathway and NFKBIA are down-regulated in adipose tissue[59]. Studies demon-strate that changing the fatty acid composition of immune cells affects phagocytosis and otherfunctions[60]. Candidate genes affecting fatty acid composition, such as SCD and ELOVL6,show different mRNA levels in adipose tissues between BH and BL. This is another example ofthe immune response and metabolism having countless ties. In our RNA-seq results, DEGs inadipose tissue included genes related to the immune response and metabolism. The specific in-teractions among them are not clear, but these data provide candidates for future studies.
ConclusionsHere we showed whole genome expression differences in adipose tissues and genetic variationamong pigs with opposite backfat thickness phenotypes. RNA-seq provided a high resolutionmap of transcriptional activities and around 80% of the total reads could be mapped to anno-tated references. Animals are classified into two groups according to their backfat thicknessand 188 genes were found to be differentially expressed between groups. The identification ofnumerous DEGs confirms the key pathways and gene networks related to lipid synthesis andmetabolism. The DEGs such ACACA, FASN, SCD and ELOVL6 in de novo fatty acid synthesisin adipose tissue may affect backfat thickness. We also sequenced the whole genome of BH andBL mix pools. By comparison with the reference genome sequence, we also identified 4,493,002SNPs and 68,276 indels in BH and 5,027,840 SNPs and 97,017 indels respectively. Genetic vari-ation of this study, especially in DEGs, will provide valuable information for function studies,as well as for marker development associated with traits related to lipid deposition. Furtherstudies are required to investigate the roles of candidate genes in fat deposition to improve pigbreeding programs.
Supporting InformationS1 Fig. Comparison of qPCR and RNA-Seq expression ratios (BH and BL groups) for theselected genes.(TIF)
S1 Table. qRT-PCR primers for six genes related to lipid metabolism.(XLS)
S2 Table. Gene expression count in the six samples.(XLS)
S3 Table. DEGs between BH and BL in adipose tissue.(XLS)
Swine Transcriptome andWhole Genomic Resequencing
PLOS ONE | DOI:10.1371/journal.pone.0122396 April 7, 2015 14 / 18
S4 Table. DEGs common among the three different pairs.(XLSX)
S5 Table. Details of gene ontology categories for differently expression genes.(XLSX)
S6 Table. SNPs and indels only in BH and BL annotated in genes.(XLS)
S7 Table. Genes with NS or cIndel annotated in DAVID.(XLSX)
S8 Table. SNP and indels by type in differently expression genes.(XLSX)
S9 Table. Information of overlapping between DEGs and QTLs related to fat traits.(DOCX)
S10 Table. Detail information of common DEGs compared with other studies.(DOCX)
AcknowledgmentsGrateful acknowledgments are made to the reviewers for their constructive suggestions for ourmanuscript. Authors are also indebted to Weiliang Zhou from Tianjin Ninghe primary pigbreeding farm for providing pigs for experiment and to molecular quantitative genetics teammembers from China Agricultural University for experiment.
Author ContributionsConceived and designed the experiments: ZCH CDWKX. Performed the experiments: KXZJW. Analyzed the data: ZCH FZ. Contributed reagents/materials/analysis tools: ZJW HJLYW KX LWZ SKC. Wrote the paper: KX ZCH.
References1. Ramayo-Caldas Y, Mach N, Esteve-Codina A, Corominas J, Castello A, Ballester M, et al. (2012) Liver
transcriptome profile in pigs with extreme phenotypes of intramuscular fatty acid composition. BMCGe-nomics 13: 547. doi: 10.1186/1471-2164-13-547 PMID: 23051667
2. Tummaruk P, Tantasuparuk W, Techakumphu M, Kunavongkrit A (2009) The association betweengrowth rate, body weight, backfat thickness and age at first observed oestrus in crossbred Landrace xYorkshire gilts. Anim Reprod Sci 110: 108–122. doi: 10.1016/j.anireprosci.2008.01.004 PMID:18289804
3. Suzuki K, Inomata K, Katoh K, Kadowaki H, Shibata T (2009) Genetic correlations among carcasscross-sectional fat area ratios, production traits, intramuscular fat, and serum leptin concentration inDuroc pigs. Journal of animal science 87: 2209–2215. doi: 10.2527/jas.2008-0866 PMID: 19329483
4. Houpt KA, Houpt TR, PondWG (1979) The pig as a model for the study of obesity and of control of foodintake: a review. The Yale journal of biology and medicine 52: 307. PMID: 380187
5. Fam BC, Joannides CN, Andrikopoulos S (2012) The liver: Key in regulating appetite and body weight.Adipocyte 1: 259–264. PMID: 23700543
6. O'Hea EK, Leveille GA (1969) Significance of adipose tissue and liver as sites of fatty acid synthesis inthe pig and the efficiency of utilization of various substrates for lipogenesis. J Nutr 99: 338–344. PMID:5350989
7. Nguyen P, Leray V, Diez M, Serisier S, Bloc’h JL, Siliart B, et al. (2008) Liver lipid metabolism. Journalof animal physiology and animal nutrition 92: 272–283. doi: 10.1111/j.1439-0396.2007.00752.x PMID:18477307
Swine Transcriptome andWhole Genomic Resequencing
PLOS ONE | DOI:10.1371/journal.pone.0122396 April 7, 2015 15 / 18
8. Cao H, Gerhold K, Mayers JR, Wiest MM,Watkins SM, Hotamisligil GS (2008) Identification of a lipo-kine, a lipid hormone linking adipose tissue to systemic metabolism. Cell 134: 933–944. doi: 10.1016/j.cell.2008.07.048 PMID: 18805087
9. Li X, Yang H, Li G, Zhang G, Cheng J, Guan H, et al. (2012) Transcriptome profile analysis of porcineadipose tissue by high‐throughput sequencing. Animal genetics 43: 144–152. doi: 10.1111/j.1365-2052.2011.02240.x PMID: 22404350
10. Wang T, Jiang A, Guo Y, Tan Y, Tang G, Mai M, et al. (2013) Deep sequencing of the transcriptome re-veals inflammatory features of porcine visceral adipose tissue. International journal of biological sci-ences 9: 550. doi: 10.7150/ijbs.6257 PMID: 23781149
11. Chen C, Ai H, Ren J, Li W, Li P, Qiao R, et al. (2011) A global view of porcine transcriptome in three tis-sues from a full-sib pair with extreme phenotypes in growth and fat deposition by paired-end RNA se-quencing. BMCGenomics 12: 448. doi: 10.1186/1471-2164-12-448 PMID: 21906321
12. Ramayo-Caldas Y, Mach N, Esteve-Codina A, Corominas J, Castelló A, Ballester M, et al. (2012) Livertranscriptome profile in pigs with extreme phenotypes of intramuscular fatty acid composition. BMCGe-nomics 13: 547. doi: 10.1186/1471-2164-13-547 PMID: 23051667
13. Stothard P, Choi J-W, Basu U, Sumner-Thomson JM, Meng Y, Liao X, et al. (2011) Whole genomeresequencing of black Angus and Holstein cattle for SNP and CNV discovery. BMC genomics 12: 559.doi: 10.1186/1471-2164-12-559 PMID: 22085807
14. FanW-L, Ng CS, Chen C-F, Lu M-YJ, Chen Y-H, Liu CJ, et al. (2013) Genome-wide patterns of geneticvariation in two domestic chickens. Genome biology and evolution 5: 1376–1392. doi: 10.1093/gbe/evt097 PMID: 23814129
15. Xing K, Zhu F, Zhai L, Liu H, Wang Z, Hou Z, et al. (2014) The liver transcriptome of two full-sibling Son-gliao black pigs with extreme differences in backfat thickness. Journal of Animal Science and Biotech-nology 5: 32. doi: 10.1186/2049-1891-5-32 PMID: 25053997
16. Tarazona S, Furió-Tarı P, Ferrer A, Conesa A (2013) NOISeq: Differential Expression in RNA-seq.
17. Tarazona S, Garcia-Alcalde F, Dopazo J, Ferrer A, Conesa A (2011) Differential expression in RNA-seq: a matter of depth. Genome Res 21: 2213–2223. doi: 10.1101/gr.124321.111 PMID: 21903743
18. Huang daW, Sherman BT, Lempicki RA (2009) Systematic and integrative analysis of large gene listsusing DAVID bioinformatics resources. Nat Protoc 4: 44–57. doi: 10.1038/nprot.2008.211 PMID:19131956
19. Franceschini A, Szklarczyk D, Frankild S, Kuhn M, Simonovic M, Roth A, et al. (2013) STRING v9. 1:protein-protein interaction networks, with increased coverage and integration. Nucleic acids research41: D808–D815. doi: 10.1093/nar/gks1094 PMID: 23203871
20. Li H, Durbin R (2009) Fast and accurate short read alignment with Burrows-Wheeler transform. Bioin-formatics 25: 1754–1760. doi: 10.1093/bioinformatics/btp324 PMID: 19451168
21. McKenna A, HannaM, Banks E, Sivachenko A, Cibulskis K, Kernytsky A, et al. (2010) The GenomeAnalysis Toolkit: a MapReduce framework for analyzing next-generation DNA sequencing data. Ge-nome research 20: 1297–1303. doi: 10.1101/gr.107524.110 PMID: 20644199
22. Sodhi SS, Park WC, Ghosh M, Kim JN, Sharma N, Shin KY, et al. (2014) Comparative transcriptomicanalysis to identify differentially expressed genes in fat tissue of adult Berkshire and Jeju Native Pigusing RNA-seq. Mol Biol Rep 41: 6305–6315. doi: 10.1007/s11033-014-3513-y PMID: 25008993
23. Moon JK, Kim KS, Kim JJ, Choi BH, Cho BW, Kim TH, et al. (2009) Differentially expressed transcriptsin adipose tissue between Korean native pig and Yorkshire breeds. Anim Genet 40: 115–118. doi: 10.1111/j.1365-2052.2008.01798.x PMID: 18945290
24. Li X, Yang H, Li G, Zhang G, Cheng J, Guan H, et al. (2012) Transcriptome profile analysis of porcineadipose tissue by high‐throughput sequencing. Anim Genet 43: 144–152. doi: 10.1111/j.1365-2052.2011.02240.x PMID: 22404350
25. Stachowiak M, Nowacka-Woszuk J, Szydlowski M, Switonski M (2013) The ACACA and SREBF1genes are promising markers for pig carcass and performance traits, but not for fatty acid content in thelongissimus dorsi muscle and adipose tissue. Meat Sci 95: 64–71. doi: 10.1016/j.meatsci.2013.04.021PMID: 23657179
26. Canovas A, Quintanilla R, Amills M, Pena RN (2010) Muscle transcriptomic profiles in pigs with diver-gent phenotypes for fatness traits. BMCGenomics 11: 372. doi: 10.1186/1471-2164-11-372 PMID:20540717
27. Wakil SJ (1989) Fatty acid synthase, a proficient multifunctional enzyme. Biochemistry 28: 4523–4530.PMID: 2669958
28. Jakobsson A, Westerberg R, Jacobsson A (2006) Fatty acid elongases in mammals: their regulationand roles in metabolism. Progress in lipid research 45: 237–249. PMID: 16564093
Swine Transcriptome andWhole Genomic Resequencing
PLOS ONE | DOI:10.1371/journal.pone.0122396 April 7, 2015 16 / 18
29. Doran O, Moule SK, Teye GA, Whittington FM, Hallett KG, Wood JD (2006) A reduced protein diet in-duces stearoyl-CoA desaturase protein expression in pig muscle but not in subcutaneous adipose tis-sue: relationship with intramuscular lipid formation. Br J Nutr 95: 609–617. PMID: 16512947
30. Flowers MT, Ntambi JM (2008) Role of stearoyl-coenzyme A desaturase in regulating lipid metabolism.Curr Opin Lipidol 19: 248–256. doi: 10.1097/MOL.0b013e3282f9b54d PMID: 18460915
31. Wise EM Jr., Ball EG (1964) Malic Enzyme and Lipogenesis. Proc Natl Acad Sci U S A 52: 1255–1263.PMID: 14231450
32. Corominas J, Ramayo-Caldas Y, Puig-Oliveras A, Estellé J, Castelló A, Alves E, et al. (2013) Analysisof porcine adipose tissue transcriptome reveals differences in de novo fatty acid synthesis in pigs withdivergent muscle fatty acid composition. BMC genomics 14: 843. doi: 10.1186/1471-2164-14-843PMID: 24289474
33. Zhou SL, Li MZ, Li QH, Guan JQ, Li XW (2012) Differential expression analysis of porcine MDH1,MDH2 and ME1 genes in adipose tissues. Genet Mol Res 11: 1254–1259. doi: 10.4238/2012.May.9.4PMID: 22614353
34. Schmid GM, Converset V, Walter N, Sennitt MV, Leung KY, Byers H, et al. (2004) Effect of high-fat dieton the expression of proteins in muscle, adipose tissues, and liver of C57BL/6 mice. Proteomics 4:2270–2282. PMID: 15274121
35. Ren Z-Q, Wang Y, Xu Y-J, Wang L-J, Lei M-G, Zuo B, et al. (2008) Identification of a differentially ex-pressed gene, ACL, between Meishan× LargeWhite and LargeWhite× Meishan F1 hybrids and theirparents. Genet Sel Evol 40: 625–637. doi: 10.1051/gse:2008024 PMID: 18990355
36. Zhang Y, Proenca R, Maffei M, Barone M, Leopold L, Friedman JM (1994) Positional cloning of themouse obese gene and its human homologue. Nature 372: 425–432. PMID: 7984236
37. Lage R, Dieguez C, Vidal-Puig A, Lopez M (2008) AMPK: a metabolic gauge regulating whole-body en-ergy homeostasis. Trends Mol Med 14: 539–549. doi: 10.1016/j.molmed.2008.09.007 PMID:18977694
38. Dieguez C, Vazquez MJ, Romero A, Lopez M, Nogueiras R (2011) Hypothalamic control of lipid metab-olism: focus on leptin, ghrelin and melanocortins. Neuroendocrinology 94: 1–11. doi: 10.1159/000328441 PMID: 22143028
39. Saltiel AR, Kahn CR (2001) Insulin signalling and the regulation of glucose and lipid metabolism. Nature414: 799–806. PMID: 11742412
40. Colbert CL, Kim C-W, Moon Y-A, Henry L, Palnitkar M, McKeanWB, et al. (2010) Crystal structure ofSpot 14, a modulator of fatty acid synthesis. Proceedings of the National Academy of Sciences 107:18820–18825. doi: 10.1073/pnas.1012736107 PMID: 20952656
41. Wakil SJ, Gibson DM (1960) Studies on the mechanism of fatty acid synthesis VIII. The participation ofprotein-bound biotin in the biosynthesis of fatty acids. Biochimica et Biophysica Acta 41: 122–129.
42. Zempleni J, Kuroishi T (2012) Biotin. Adv Nutr 3: 213–214. doi: 10.3945/an.111.001305 PMID:22516729
43. Corominas J, Ramayo-Caldas Y, Puig-Oliveras A, Pérez-Montarelo D, Noguera JL, Folch JM, et al.(2013) Polymorphism in the ELOVL6 gene is associated with a major QTL effect on fatty acid composi-tion in pigs. PLoS ONE 8: e53687. doi: 10.1371/journal.pone.0053687 PMID: 23341976
44. Vidal O, Varona L, Oliver M, Noguera J, Sanchez A, Amills M (2006) Malic enzyme 1 genotype is asso-ciated with backfat thickness and meat quality traits in pigs. Animal genetics 37: 28–32. PMID:16887000
45. Rosen ED, Spiegelman BM (2006) Adipocytes as regulators of energy balance and glucose homeosta-sis. Nature 444: 847–853. PMID: 17167472
46. Kopecky J, Rossmeisl M, Flachs P, Brauner P, Sponarova J, Matejková O, et al. (2004) Energy metab-olism of adipose tissue—physiological aspects and target in obesity treatment. Physiol Res 53 Suppl1: S225–232. PMID: 15119952
47. Lemberger T, Desvergne B, Wahli W (1996) Peroxisome proliferator-activated receptors: a nuclear re-ceptor signaling pathway in lipid physiology. Annu Rev Cell Dev Biol 12: 335–363. PMID: 8970730
48. Evans RM, Barish GD, Wang YX (2004) PPARs and the complex journey to obesity. Nat Med 10: 355–361. PMID: 15057233
49. Roman J (2008) Peroxisome proliferator-activated receptor gamma and lung cancer biology: implica-tions for therapy. J Investig Med 56: 528–533. doi: 10.231/JIM.0b013e3181659932 PMID: 18317436
50. Taniguchi M, Guan LL, Basarab JA, Dodson MV, Moore SS (2008) Comparative analysis on gene ex-pression profiles in cattle subcutaneous fat tissues. Comparative Biochemistry and Physiology Part D:Genomics and Proteomics 3: 251–256. doi: 10.1016/j.cbd.2008.06.002 PMID: 20494844
Swine Transcriptome andWhole Genomic Resequencing
PLOS ONE | DOI:10.1371/journal.pone.0122396 April 7, 2015 17 / 18
51. Choi K-M, Moon J-K, Choi S-H, Kim K-S, Choi Y-I, Kim J-J, et al. (2008) Differential expression of cyto-chrome P450 genes regulate the level of adipose arachidonic acid in Sus Scrofa. Asian-Aust J AnimSci 21: 967–971.
52. Blomhoff R, Blomhoff HK (2006) Overview of retinoid metabolism and function. J Neurobiol 66: 606–630. PMID: 16688755
53. Keller H, Dreyer C, Medin J, Mahfoudi A, Ozato K, Wahli W, et al. (1993) Fatty acids and retinoids con-trol lipid metabolism through activation of peroxisome proliferator-activated receptor-retinoid X receptorheterodimers. Proc Natl Acad Sci U S A 90: 2160–2164. PMID: 8384714
54. Ziouzenkova O, Plutzky J (2008) Retinoid metabolism and nuclear receptor responses: New insightsinto coordinated regulation of the PPAR-RXR complex. FEBS Lett 582: 32–38. PMID: 18068127
55. Waxman DJ (1999) P450 gene induction by structurally diverse xenochemicals: central role of nuclearreceptors CAR, PXR, and PPAR. Archives of Biochemistry and Biophysics 369: 11–23. PMID:10462436
56. Lewis DF (2004) 57 varieties: the human cytochromes P450. Pharmacogenomics 5: 305–318. PMID:15102545
57. Hotamisligil GS (2006) Inflammation and metabolic disorders. Nature 444: 860–867. PMID: 17167474
58. Loffreda S, Yang S, Lin H, Karp C, BrengmanM, Wang DJ, et al. (1998) Leptin regulates proinflamma-tory immune responses. The FASEB Journal 12: 57–65. PMID: 9438411
59. Glass CK, Ogawa S (2006) Combinatorial roles of nuclear receptors in inflammation and immunity. NatRev Immunol 6: 44–55. PMID: 16493426
60. Calder PC (2008) The relationship between the fatty acid composition of immune cells and their func-tion. Prostaglandins, Leukotrienes and Essential Fatty Acids 79: 101–108. doi: 10.1016/j.plefa.2008.09.016 PMID: 18951005
Swine Transcriptome andWhole Genomic Resequencing
PLOS ONE | DOI:10.1371/journal.pone.0122396 April 7, 2015 18 / 18