Integrated Regulation of Nonpoint Pollution: Combining Managerial Controls and Economic Instruments...
10
Analysis Integrated regulation of nonpoint pollution: Combining managerial controls and economic instruments under multiple environmental targets Ashar Aftab a, ⁎, Nick Hanley b , Giovanni Baiocchi c a Department of Economics and Finance, Durham University, 23/26 Old Elvet, Durham DH1 3HY, United Kingdom b Division of Economics, University of Stirling, Stirling, FK9 4LA, United Kingdom c Norwich Business School, University of East Anglia, Norwich, NR4 7TJ, United Kingdom abstract article info Article history: Received 2 December 2009 Received in revised form 24 March 2010 Accepted 26 March 2010 Available online 17 September 2010 Keywords: Diffuse water pollution Environmental regulation Minimum river flow Mixed instruments Nonpoint pollution Regulators are often reluctant to rely solely on economic incentives to achieve environmental standards. We evaluate a “mixed approach” of economic instruments and management standards when two environmental objectives need to be met simultaneously: minimum river flow rates and reductions in nitrate pollution. We show how the relative efficiency of such mixed approaches can depend on exogenous factors, in this case weather conditions. Results indicate that mixed instruments outperform stand alone economic incentives or managerial controls under wet weather conditions, but not in ‘average’ years. However, the relative cost- effectiveness of mixed approaches increases considerably at higher levels of environmental standard compliance. © 2010 Elsevier B.V. All rights reserved. 1. Introduction Regulators have proved reluctant to use economic instruments as “stand alone” methods to address environmental problems, despite the strong case in favour of economic incentives made by economists over the last 30 years (Hahn, 2000). Indeed, evidence shows that economic instruments still account for the minority of environmental measures employed within the OECD, although their use is increasing (OECD, 1997; NCEE, 2004). It can be argued this reluctance is due to the political economy of environmental regulation — for example, regulators may consider criteria other than economic efficiency 1 as more important when designing policies to regulate an environmental externality. This is the case for both point and nonpoint source pollution (NPP), with multiple decision criteria and worries over the shortcomings of economic instruments combining to restrict the uptake of such policies (Hanley et al., 1990). Moreover, economists have identified circum- stances when a combination of measures — such as a tax combined with regulation — are better suited to achieve regulatory outcomes, for example in the case of stochastic pollutants (Baumol and Oates, 1988) and when both the mean and variance of pollutant concentration is of concern (Braden and Segerson, 1993). Studying the effects of combining economic instruments with managerial or regulatory measures may thus be more relevant than the traditional simple comparison of economic instruments with regulation. An important new policy context is the European Union's Water Framework Directive (WFD) (EU, 2000). The WFD sets the target of ‘Good Ecological Status’ in surface waters throughout Europe. In some catchments this implies the joint imposition of minimum river flow restrictions (water quantity) and ambient pollutant standards (water quality). A wider use of economic instruments is called for in the Directive, although not to the exclusion of managerial or direct regulatory approaches, whilst great stress is placed on cost-effectiveness of pollution control measures. Since the measurement of Good Ecological Status depends on a number of parameters, including nutrient status, biological oxygen demand and flow rates, then regulators are faced with the problem of achieving multiple environmental targets simultaneously (DEFRA, 2007). This is an interesting context in which to assess the relative benefits of single versus combined instruments for environ- mental management, particularly since the processes which regulators are trying to manage are inherently stochastic. In this paper, we develop a multi-farm catchment model which estimates the cost of improving water quality, where water quality depends both on diffuse-source nitrate pollution and river flows for a case study catchment in Scotland through combinations of management measures and economic instruments. The paper builds on Aftab et al. (2007) 2 and is more realistic in capturing multi-agent farm level Ecological Economics 70 (2010) 24–33 ⁎ Corresponding author. Tel.: + 44 7813943314. E-mail addresses: [email protected], [email protected] (A. Aftab). 1 Other criteria may include equity (distributional impacts), certainty of regulatory compliance, ancillary environmental benefits, simplicity, enforcement costs, political acceptability or perceived fairness. This is not to imply that economic instruments alone are necessarily most efficient, or cannot be perceived as fair or politically acceptable. 2 Aftab et al. (2007) quantifies the increase in social welfare from co-ordinating policies to maintain river flows and nonpoint nitrate pollution and the conditions under which it is beneficial. 0921-8009/$ – see front matter © 2010 Elsevier B.V. All rights reserved. doi:10.1016/j.ecolecon.2010.03.020 Contents lists available at ScienceDirect Ecological Economics journal homepage: www.elsevier.com/locate/ecolecon
Transcript of Integrated Regulation of Nonpoint Pollution: Combining Managerial Controls and Economic Instruments...

Ecological Economics 70 (2010) 24–33
Contents lists available at ScienceDirect
Ecological Economics
j ourna l homepage: www.e lsev ie r.com/ locate /eco lecon
Analysis
Integrated regulation of nonpoint pollution: Combining managerial controls andeconomic instruments under multiple environmental targets
Ashar Aftab a,⁎, Nick Hanley b, Giovanni Baiocchi c
a Department of Economics and Finance, Durham University, 23/26 Old Elvet, Durham DH1 3HY, United Kingdomb Division of Economics, University of Stirling, Stirling, FK9 4LA, United Kingdomc Norwich Business School, University of East Anglia, Norwich, NR4 7TJ, United Kingdom
⁎ Corresponding author. Tel.: +44 7813943314.E-mail addresses: [email protected], ashar.a
1 Other criteria may include equity (distributional imcompliance, ancillary environmental benefits, simplicitacceptability or perceived fairness. This is not to imply thare necessarily most efficient, or cannot be perceived as
0921-8009/$ – see front matter © 2010 Elsevier B.V. Adoi:10.1016/j.ecolecon.2010.03.020
a b s t r a c t
a r t i c l e i n f oArticle history:Received 2 December 2009Received in revised form 24 March 2010Accepted 26 March 2010Available online 17 September 2010
Keywords:Diffuse water pollutionEnvironmental regulationMinimum river flowMixed instrumentsNonpoint pollution
Regulators are often reluctant to rely solely on economic incentives to achieve environmental standards. Weevaluate a “mixed approach” of economic instruments and management standards when two environmentalobjectives need to be met simultaneously: minimum river flow rates and reductions in nitrate pollution. Weshow how the relative efficiency of such mixed approaches can depend on exogenous factors, in this caseweather conditions. Results indicate that mixed instruments outperform stand alone economic incentives ormanagerial controls under wet weather conditions, but not in ‘average’ years. However, the relative cost-effectiveness of mixed approaches increases considerably at higher levels of environmental standardcompliance.
[email protected] (A. Aftab).pacts), certainty of regulatoryy, enforcement costs, politicalat economic instruments alonefair or politically acceptable.
2 Aftab et al. (200policies to maintainunder which it is be
ll rights reserved.
© 2010 Elsevier B.V. All rights reserved.
1. Introduction
Regulators have proved reluctant to use economic instruments as“stand alone”methods to address environmental problems, despite thestrong case in favour of economic incentives made by economists overthe last 30 years (Hahn, 2000). Indeed, evidence shows that economicinstruments still account for the minority of environmental measuresemployed within the OECD, although their use is increasing (OECD,1997; NCEE, 2004). It can be argued this reluctance is due to the politicaleconomy of environmental regulation — for example, regulators mayconsider criteria other than economic efficiency1 as more importantwhen designing policies to regulate an environmental externality. Thisis the case for both point and nonpoint source pollution (NPP), withmultiple decision criteria and worries over the shortcomings ofeconomic instruments combining to restrict the uptake of such policies(Hanley et al., 1990). Moreover, economists have identified circum-stanceswhen a combination ofmeasures— such as a tax combinedwithregulation — are better suited to achieve regulatory outcomes, forexample in the case of stochastic pollutants (Baumol and Oates, 1988)and when both the mean and variance of pollutant concentration is ofconcern (Braden and Segerson, 1993). Studying the effects of combiningeconomic instruments with managerial or regulatory measures may
thus be more relevant than the traditional simple comparison ofeconomic instruments with regulation.
An important new policy context is the European Union's WaterFramework Directive (WFD) (EU, 2000). The WFD sets the target of‘Good Ecological Status’ in surface waters throughout Europe. In somecatchments this implies the joint imposition of minimum river flowrestrictions (water quantity) and ambient pollutant standards (waterquality). A wider use of economic instruments is called for in theDirective, although not to the exclusion of managerial or directregulatory approaches, whilst great stress is placed on cost-effectivenessof pollution controlmeasures. Since themeasurement ofGoodEcologicalStatus depends on a number of parameters, including nutrient status,biological oxygen demand and flow rates, then regulators are facedwiththeproblemof achievingmultiple environmental targets simultaneously(DEFRA, 2007). This is an interesting context in which to assess therelative benefits of single versus combined instruments for environ-mental management, particularly since the processes which regulatorsare trying to manage are inherently stochastic.
In this paper, we develop a multi-farm catchment model whichestimates the cost of improving water quality, where water qualitydepends both ondiffuse-source nitrate pollution and riverflows for a casestudy catchment in Scotland through combinations of managementmeasures and economic instruments. The paper builds on Aftab et al.(2007)2 and is more realistic in capturing multi-agent farm level
7) quantifies the increase in social welfare from co-ordinatingriver flows and nonpoint nitrate pollution and the conditions
neficial.
6 Of the total catchment area 20% is categorised sandy, 16.8% as silty and 63% asloamy. The four farms make up 15%, 30%, 34.6% and 20.4% of total catchment acreage;and 15%, 0%, 60% and 25% of baseline catchment livestock at a stocking density of 2 LU/
25A. Aftab et al. / Ecological Economics 70 (2010) 24–33
heterogeneity. Both flow rates and nitrate levels are linked to agriculturalland use, the former through irrigation. The 4346 ha West Peffercatchment suffers from low flow problems in summer due to high ratesof abstraction for potato farming and is presently subject to directabstraction controls,3 and has N levels in breach of the EU guidelinestandard of 11.3 mg/l N. Diffuse nitrogen pollution, which can result ineutrophication, contamination of potable water and acidification, is awidely acknowledgedproblem in Scotland (Darcy et al., 2000). High ratesof surface water extraction can lead to periods of unusually low riverflows, adversely affecting river ecology and amenity values (Hanley et al.,2006). Responding to these two problems is likely to be best achieved byan integratedapproach to catchmentmanagement: indeed, that is exactlywhat the WFD mandates for all catchments throughout the EU.
Previous work on the economics of agricultural NPP control haslargely focussed on this problem in hydrological isolation. Economicinstruments are known to be relatively cost-efficient in reducingambient nitrate levels under a range of restrictive conditions (Shortleand Horan, 2001). Numerous authors have previously considered theuse of mixed approaches or policy ‘packages’: combining input taxesand a liability rule (Braden and Segerson, 1993); input and ambienttaxes (Horan et al., 1998); emission and ambient taxes (Xepapadeas,1995); emission and output tax (Schmutzler, 1996); ex postnegligence liability and ex ante pigouvian taxation (Kolstad et al.,1990); land use tax with an input tax (Goetz et al., 2006); andcombining a subsidy/tax with marketable licences (Roberts andSpence, 1976). These studies report efficiency gains from the use ofmixed instruments. However, although some studies have consideredspatially untargeted land retirement (setaside) to reduce NPP fromagriculture (Ribaudo et al., 1994) the literature has not considered theintegration of direct regulation or managerial approaches, such as set-aside and stocking density reduction, with economic instruments.Likewise, although there are studies investigating the joint control ofboth water and nitrogen as inputs (Weinberg et al., 1993; Helfand andHouse, 1995; Larson et al., 1996; Albiac et al., 2001), only one study todate has reported on the efficiency properties of economic instru-ments in the presence of river flow controls (Aftab et al., 2007).
Previous work has established that the variability in NPPgeneration requires combining instruments that apply to specificmoments of the pollution distribution to ensure efficiency4 (Bradenand Segerson, 1993). Baumol and Oates (1988), in their classic textpropose Mixed Instruments (MI) combining economic instrumentsand discretionary ‘direct’ controls when regulating stochastic pointsource emissions.5 Obviously, this is only possible with certain pointsource pollutants — the possibility of using direct control during ahigh pollution episode to control NPP is not feasible. The question thusremains as to which are the most cost-effective instruments tocombine, given the problems of implementing diffuse pollutioncontrols. The main contribution of this paper to the literature is thusconceptual: in the context of NPP from agriculture and multipleenvironmental targets, is it better to use a combination of economicincentives and managerial measures, rather than economic incentivesalone? This MI approach is relevant to the policy debate since theiterative approach to developing environmental policy which dom-inates OECD countries does not favour ‘drastic’ changes in policychoice e.g. from regulation only to economic instruments only.Efficiency requires regulation of NPP emissions at both the intensiveand extensive margin (Shortle et al., 1998; Goetz et al., 2006).Moreover, the inclusion of transaction costs might make it cost
3 The regulator stops abstractions through licence suspension when river flow fallsto the 95% percentile (or minimum acceptable flow) at specific gauging points.
4 Unless emissions mean and variance are correlated a single instrument will notensure social optimality.
5 “...we may realise the best of both worlds by taking advantage of the efficiencyproperties of tax measures in normal circumstances and invoking direct controls tocopy with temporary periods of accentuated environmental deterioration (Baumoland Oates, 1988).”
effective to restrict the pollution reduction contribution from theextensive margin using managerial controls, such as set-aside, in a MIsetting. Weather variability turns out to be important in determiningwhether a MI approach is more cost effective than using stand aloneeconomic incentives. We use the same data set on which Aftab et al.(2007) is based to investigate the efficiency gains from MI. Howeverthe focus of the paper is not on specific empirical results; but ratherthe conceptual contribution in a policy context.
2. Model Construction
The bio-physical-economic model improves on a previous modelin the literature (Aftab et al., 2007) and differs in that the catchment ismodelled as 4 separate profit maximising farms (f1–f4). The 4 farmsare hypothetical, as individual farm data are not made available due toconfidentiality concerns, and represent variability in farm character-istics across the catchment. The farms differ in terms of (1) acreage,(2) proportion of 3 soil textures (hence crop mix and rotation), and(3) livestock production capacity.6 The differences between the 4farms serve as a proxy for catchment heterogeneity (Wossink et al.,2001) in terms of farming knowledge/experience, spatial character-istics, preferences and capital/infrastructure considerations.7
Four major arable crops (winter wheat, spring barely, winteroilseed rape, and potatoes), livestock production (dairy, sheep,lowland suckler and intensive beef), permanent grazing grass andsilage production were modelled. Farms also had the option topurchase silage from the market. Catchment agronomic practices andparameters, crop rotations and the existing baseline scenario weretaken from the literature and catchment level farm survey data. Farmsubsidies for both arable cultivation and livestock (SOAEFD, 1997)were included. The farmer's decision to apply nitrogen depends oncrop production functions for each crop (separate for each soil type)and profitability. The model was calibrated to the 1997/98 price level(SAC, 1997). Potatoes were assumed to be the only irrigated crop(they account for 85% of irrigated catchment land in reality) and thecost of irrigation per hectare was incorporated.
The model determines the most profitable land and nitrogenallocation to each farm activity. Livestock waste is accounted for as asource of nitrate and is a substitute for artificial fertiliser on both types ofmodelled grassland. The model uses separate leaching functions toestimate theweekly average leaching for3 ‘stylised’years (dry,meanandwet8) based on the actual weather in the 1989–1998 period. Leachingfunctions were derived by regressing the output of NITCAT (Lord, 1992)for each crop/soil combination within a reasonable range of nitrogenapplications. The IRRIGUIDE model (Bailey and Spackman, 1996) wasused to give crop-dependent weekly values of evapo-transpiration overwinter; while elution was modelled using the SLIMMER algorithm(Anthony et al., 1996). Grass land leaching was estimated using NCYCLE(Scholefield et al., 1991; Lockyer et al., 1995). Here, leaching refers to thenitrogen not taken up by the plant which drains to the sub soil water.Some is lost to groundwater, while most drains to the river.9 The modelassumes the nitrogen leachate is transported via drains to the riverinstantaneously. This enables relatively accurate approximation ofdiffuse nitrogen pollution levels for every week.
ha. The acreage of the modelled farms is within the range of farm sizes found in EastLothian, Scotland.
7 Heterogeneity captures the variation in farm impact and response to regulatorycontrol policies.
8 The mean weather scenario was based on the average weather data in the period,whereas the wet weather referred to the wettest in this period. The use of wet andmean ‘weather’ or ‘weather conditions’ refer to the wet and mean weather year in thisperiod respectively.
9 The West Peffer Catchment is a predominantly surface water catchment and itssmall size and geo-spatial characteristics justify this assumption.
14 Further details of modelling can be found at: WEB ADDRESS.15 Calibration involved using proportional ratios and bounds, total grassland acreage
26 A. Aftab et al. / Ecological Economics 70 (2010) 24–33
In Eastern Scotland, irrigation contributes to potato yield andquality.The West Peffer catchment is extensively used for surface waterextraction and is presently subject to controls whereby abstractionlicences are suspended when river flow falls to the 95th percentile(MAF) one-day flow at specific gauging points (Crabtree et al., 2000).The 95th percentile flow defines a flow exceeded naturally on 95% ofdays in an ‘average’ year (1989–1998 period) during which noabstraction took place. TheDIYhydrologicalmodelwas used to estimatenaturalised flows (Dunn, 1998) and the water available for potatoirrigation before the 90th, 95th and 98th percentile MAF target wasbreached (the 90th percentile imposes the greatest restriction onirrigation extraction while 98th percentile imposes the smallest10). Theabsence of any river flow restriction was also considered. The temporaldistribution of available water was then inputted to a potato growthmodel. It was assumed the farmer could subject his potato crop to 3separate levels of irrigation: optimal, restricted and no irrigation.Separate nitrogen potato production functions under 4 river flowrestrictions, 3 irrigation regimes and 3 weather conditions were thenapproximated (Crabtree et al., 2000).
3. Economic Modelling of Control Policies
The entire bio-physical economic model is summarised in Fig. 1. Thenon-linear optimizationmodelwaswritten inGAMS(Brookeet al., 1998)and solved using the CONOPT II solver (Stolbjerg-Drud, 1993) andconfirmed by the MINOS 5 solver. The catchment is modelled as foureconomic decision makers (f) who are assumed to maximise individualfarm profits (Πf
ϖr) by endogenously determining land and N fertiliserallocation to productive activities11 on each soil type. The regulator'sobjective is to minimise the difference between the unrestricted catch-ment profit (∑
fΠf
ϖr) and the catchment profit under different pollution
control policies subject to environmental constraints on minimum riverflows and maximum nitrate levels.12 The regulator's objective:
Minimise ∑fΠϖr
f −∑f ½∑c ∑
sYfcspc−wnnfcslfcs
� �+ ∑
i∑jhϖrfij pj
+ ∑bafbpb −wn ∑
iηϖrfi λϖr
fi −∑t∑sμftsmfts
� �−Cf + Τf�
ð1Þ
whereϖ is the prevailing weather condition (dry, mean, or wet) and ris the catchment MAF restriction (no flow restriction or 98th, 95th or90th percentile river flow restriction) enforced by the regulator. Πf
ϖr
for each ϖr combination is the outcome of an unrestricted run of themodel without any regulation on farm f. The catchment profit in theobjective function is defined as the sum of the return to eachproducer's management and allocation of resources minus the cost of
total farm nitrogen consumption ∑c
∑s
wnnfcslfcs
� �(arable crops),
wn ∑i
ηfiλfi (potatoes),wn ∑t
∑s
μftsmfts (silage and grazing grass) and
all other secondary costs of farming Cf. Exogenous terms in (1) includepc the market price of arable crop c, pj the market price of potatoquality j and pb is the market return from one livestock unit13 (LU) of
10 The minimum acceptable river flow percentile seems counter intuitive, but this is ahydrological term. A 98th percentile one-day flow is a less binding constraint, than the 90thpercentile, as itwould restrict abstractiononlywhenflow fell to that exceededon98%ofdays.11 Productive activity refers to crops (including potatoes crops with differentirrigation scheduling), livestock production (grassland) and setaside. Similar toprevious bio-physical economic models in the economic literature.12 A referee thankfully pointed out that even though the model is represented asminimising farmer's abatement cost (Beavis and Walker, 1983; Kampas and White,2004), it is in effect forecasting farmer's profit maximising behaviour under differentregulatory controls — a positive analysis.13 A livestock unit is defined in terms of the metabolised energy requirement. Withone unit being the maintenance of a mature 625 kg Friesian cow and the production ofa 40–45 kg calf, and 4500 l of milk at 36 g/kg of butterfat and 86 g/kg s.n.f. Based onthis the LU units of all livestock is calculated, e.g.: suckler cow (1 LU), ewe (0.15 LU),male cattle less than 2 years (0.6 LU), male cattle over 2 years (1 LU).
livestock type b. The number of livestock on each farm is representedby afb. wn refers to the cost of nitrogen fertiliser, nfcs and lfcs is thenitrogen applied and land allocated to arable crop c (excludingpotatoes and grassland) c on soil type s.mfts and μfts refer respectivelyto land and nitrogen allocated to grassland type t (grazing andcutting). λfi
ϖr and ηfiϖr refer to land allocated and nitrogen applied tothe potato crop under irrigation regime i (optimal, restricted or un-irrigated) resulting in potato yield hfij
ϖr differentiated by quality j. Tfrefers all transfer payments, positive for input and emission taxes andnegative for subsidies related to enforcing set-aside or stockingdensity reductions, where relevant. Such transfer payments are notincluded in estimates of abatement costs (Kampas and White, 2004).
Thus, (1) estimates the social cost of regulation under differentregulatory policies and weather conditions.14 The model's baselineallocation was calibrated15 to farm survey data on cropping andlivestock intensities. The model's mean weather (no MAF restriction)base run predictions were similar to actual catchment data. Thepercentage deviation between the two was: −7.15% for arable crops,4.90% for grassland, −11.79% for set-aside land and −4.05% forcatchment livestock units (LU).16 The model allocates slightly moreland to grassland at the expense of arable land and set-aside.
Depending on the most profitable land use and nitrogen inputallocation, the model calculated the total nitrate emissions generatedand the volume of water transporting them to the river, for differentweather scenarios and MAF river flow restrictions (met via restric-tions on the extraction of water for irrigation). The transaction costs ofenforcing MAF river flow restrictions and NPP control policies are notincluded in our model and are obvious limitations. The policyobjective in all model runs was to reduce ambient nitrate concentra-tions below the EU 50 mg NO3
−/l (or 11.3 mg N/l) limit for a variablenumber of weeks while achieving various minimum river flowrestrictions.17 Nitrate concentrations vary naturally through the yeardue to fluctuations in rainfall and crop demands. We thus implementthe nitrate standard as the number of weeks in which ambientconcentrations are predicted to exceed the EU standard (a zeroexceedance target is unrealistic).
A set of ‘stand alone’ policy options based on the literature andcurrent policy discussions were chosen. These were: (1) estimatedemission taxation, (2) nitrogen input taxation (IT) (Kampas andWhite, 2004), (3) emission quotas, (4) nitrogen input quotas (Wuet al., 1995), (5) managerial restrictions resulting in farm livestockstocking density reduction (FSDR) and, (6) restriction on theminimum area of farm setaside (farm land retirement — FLR18),since land retirement if correctly managed can be used to reducediffuse pollution (Burt and Haycock, 1993; Ribaudo et al., 1994).
The main contribution of this paper, as noted earlier, is inevaluating environmental control strategies which combine economicincentives with managerial approaches — that is, in evaluating mixedinstrument strategies in the presence of multiple environmental
was not fixed and allowed to vary to reflect changes in stocking density. Under someregulatory policy packages certain livestock constraints were relaxed to allowachieving stricter regulatory targets. In such circumstances we undertook appropriatesensitivity analysis in relaxing constraints. Standard agricultural modelling techniqueswere used (Barnard and Nix, 1973).16 For arable activities (grassland and setaside) percentage average deviation (PAD)=20.58 and for livestock (LU) PAD=10.13.17 MAF river flow restrictions were set independently of pollution control policy. Theregulator could not resort to irrigation controls beyond those required to meet MAFriver flow restrictions for the purpose of controlling NPP generation. Irrigation controlby itself is not a cost effective pollution control option as only potatoes are irrigated.However the slight reduction in NPP generation due to MAF restrictions wasconsidered in the design of pollution control regulation.18 FLRwasmodelledbothas (a) apercentageof total farmarea, and (b) as a percentage oftotal arable area (winterwheat, spring barley, winter oilseed rape and FLR itself). The latermeasurement is used to qualify for subsides under the EU Common Agricultural Policy(CAP). In 1997/1998 obligatory FLR was 5% of total arable area.
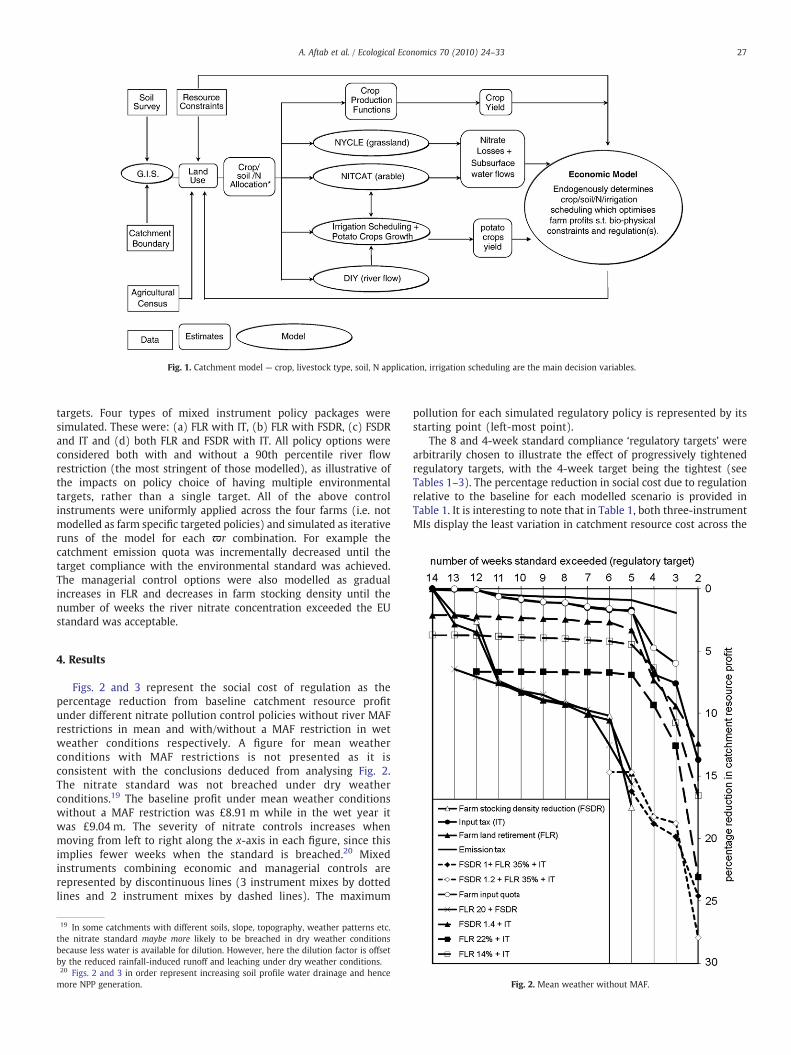
Fig. 1. Catchment model — crop, livestock type, soil, N application, irrigation scheduling are the main decision variables.
27A. Aftab et al. / Ecological Economics 70 (2010) 24–33
targets. Four types of mixed instrument policy packages weresimulated. These were: (a) FLR with IT, (b) FLR with FSDR, (c) FSDRand IT and (d) both FLR and FSDR with IT. All policy options wereconsidered both with and without a 90th percentile river flowrestriction (the most stringent of those modelled), as illustrative ofthe impacts on policy choice of having multiple environmentaltargets, rather than a single target. All of the above controlinstruments were uniformly applied across the four farms (i.e. notmodelled as farm specific targeted policies) and simulated as iterativeruns of the model for each ϖr combination. For example thecatchment emission quota was incrementally decreased until thetarget compliance with the environmental standard was achieved.The managerial control options were also modelled as gradualincreases in FLR and decreases in farm stocking density until thenumber of weeks the river nitrate concentration exceeded the EUstandard was acceptable.
4. Results
Figs. 2 and 3 represent the social cost of regulation as thepercentage reduction from baseline catchment resource profitunder different nitrate pollution control policies without river MAFrestrictions in mean and with/without a MAF restriction in wetweather conditions respectively. A figure for mean weatherconditions with MAF restrictions is not presented as it isconsistent with the conclusions deduced from analysing Fig. 2.The nitrate standard was not breached under dry weatherconditions.19 The baseline profit under mean weather conditionswithout a MAF restriction was £8.91 m while in the wet year itwas £9.04 m. The severity of nitrate controls increases whenmoving from left to right along the x-axis in each figure, since thisimplies fewer weeks when the standard is breached.20 Mixedinstruments combining economic and managerial controls arerepresented by discontinuous lines (3 instrument mixes by dottedlines and 2 instrument mixes by dashed lines). The maximum
19 In some catchments with different soils, slope, topography, weather patterns etc.the nitrate standard maybe more likely to be breached in dry weather conditionsbecause less water is available for dilution. However, here the dilution factor is offsetby the reduced rainfall-induced runoff and leaching under dry weather conditions.20 Figs. 2 and 3 in order represent increasing soil profile water drainage and hencemore NPP generation.
pollution for each simulated regulatory policy is represented by itsstarting point (left-most point).
The 8 and 4-week standard compliance ‘regulatory targets’ werearbitrarily chosen to illustrate the effect of progressively tightenedregulatory targets, with the 4-week target being the tightest (seeTables 1–3). The percentage reduction in social cost due to regulationrelative to the baseline for each modelled scenario is provided inTable 1. It is interesting to note that in Table 1, both three-instrumentMIs display the least variation in catchment resource cost across the
Fig. 2. Mean weather without MAF.
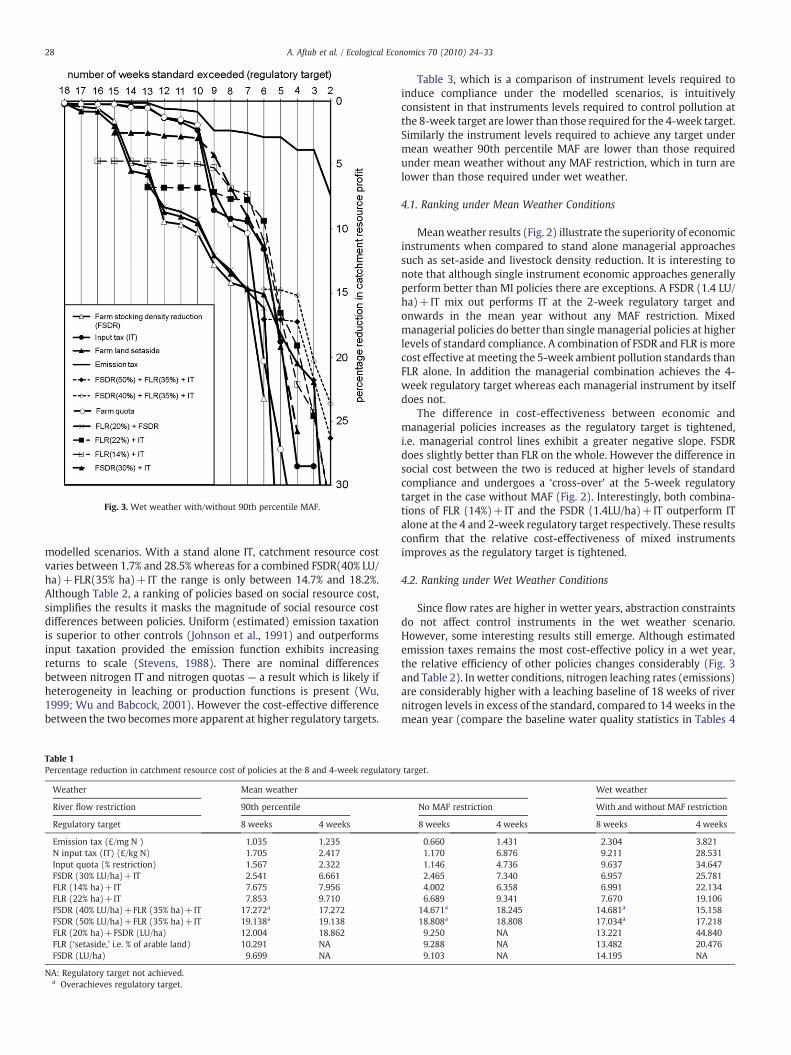
Fig. 3. Wet weather with/without 90th percentile MAF.
28 A. Aftab et al. / Ecological Economics 70 (2010) 24–33
modelled scenarios. With a stand alone IT, catchment resource costvaries between 1.7% and 28.5% whereas for a combined FSDR(40% LU/ha)+FLR(35% ha)+IT the range is only between 14.7% and 18.2%.Although Table 2, a ranking of policies based on social resource cost,simplifies the results it masks the magnitude of social resource costdifferences between policies. Uniform (estimated) emission taxationis superior to other controls (Johnson et al., 1991) and outperformsinput taxation provided the emission function exhibits increasingreturns to scale (Stevens, 1988). There are nominal differencesbetween nitrogen IT and nitrogen quotas — a result which is likely ifheterogeneity in leaching or production functions is present (Wu,1999; Wu and Babcock, 2001). However the cost-effective differencebetween the two becomesmore apparent at higher regulatory targets.
Table 1Percentage reduction in catchment resource cost of policies at the 8 and 4-week regulatory
Weather Mean weather
River flow restriction 90th percentile
Regulatory target 8 weeks 4 weeks
Emission tax (£/mg N ) 1.035 1.235N input tax (IT) (£/kg N) 1.705 2.417Input quota (% restriction) 1.567 2.322FSDR (30% LU/ha)+IT 2.541 6.661FLR (14% ha)+IT 7.675 7.956FLR (22% ha)+IT 7.853 9.710FSDR (40% LU/ha)+FLR (35% ha)+IT 17.272a 17.272FSDR (50% LU/ha)+FLR (35% ha)+IT 19.138a 19.138FLR (20% ha)+FSDR (LU/ha) 12.004 18.862FLR (‘setaside,’ i.e. % of arable land) 10.291 NAFSDR (LU/ha) 9.699 NA
NA: Regulatory target not achieved.a Overachieves regulatory target.
Table 3, which is a comparison of instrument levels required toinduce compliance under the modelled scenarios, is intuitivelyconsistent in that instruments levels required to control pollution atthe 8-week target are lower than those required for the 4-week target.Similarly the instrument levels required to achieve any target undermean weather 90th percentile MAF are lower than those requiredunder mean weather without any MAF restriction, which in turn arelower than those required under wet weather.
4.1. Ranking under Mean Weather Conditions
Meanweather results (Fig. 2) illustrate the superiority of economicinstruments when compared to stand alone managerial approachessuch as set-aside and livestock density reduction. It is interesting tonote that although single instrument economic approaches generallyperform better than MI policies there are exceptions. A FSDR (1.4 LU/ha)+IT mix out performs IT at the 2-week regulatory target andonwards in the mean year without any MAF restriction. Mixedmanagerial policies do better than single managerial policies at higherlevels of standard compliance. A combination of FSDR and FLR is morecost effective atmeeting the 5-week ambient pollution standards thanFLR alone. In addition the managerial combination achieves the 4-week regulatory target whereas each managerial instrument by itselfdoes not.
The difference in cost-effectiveness between economic andmanagerial policies increases as the regulatory target is tightened,i.e. managerial control lines exhibit a greater negative slope. FSDRdoes slightly better than FLR on the whole. However the difference insocial cost between the two is reduced at higher levels of standardcompliance and undergoes a ‘cross-over’ at the 5-week regulatorytarget in the case without MAF (Fig. 2). Interestingly, both combina-tions of FLR (14%)+IT and the FSDR (1.4LU/ha)+IT outperform ITalone at the 4 and 2-week regulatory target respectively. These resultsconfirm that the relative cost-effectiveness of mixed instrumentsimproves as the regulatory target is tightened.
4.2. Ranking under Wet Weather Conditions
Since flow rates are higher in wetter years, abstraction constraintsdo not affect control instruments in the wet weather scenario.However, some interesting results still emerge. Although estimatedemission taxes remains the most cost-effective policy in a wet year,the relative efficiency of other policies changes considerably (Fig. 3and Table 2). In wetter conditions, nitrogen leaching rates (emissions)are considerably higher with a leaching baseline of 18 weeks of rivernitrogen levels in excess of the standard, compared to 14 weeks in themean year (compare the baseline water quality statistics in Tables 4
target.
Wet weather
No MAF restriction With and without MAF restriction
8 weeks 4 weeks 8 weeks 4 weeks
0.660 1.431 2.304 3.8211.170 6.876 9.211 28.5311.146 4.736 9.637 34.6472.465 7.340 6.957 25.7814.002 6.358 6.991 22.1346.689 9.341 7.670 19.106
14.671a 18.245 14.681a 15.15818.808a 18.808 17.034a 17.2189.250 NA 13.221 44.8409.288 NA 13.482 20.4769.103 NA 14.195 NA

Table 2Catchment policy ranking under different river flow and weather conditions.
Weather Mean weather Wet weather
River Flow Restriction 90th percentile No MAF restriction With and without MAF restriction
Regulatory Target 8 weeks 4 weeks 8 weeks 4 weeks 8 weeks 4 weeks
Emission tax (£/mg N ) 1 1 1 1 1 1N Input tax (IT) (£/kg N) 3 3 2 4 5 8Input quota (% restriction) 2 2 3 2 6 9FSDR (30% LU/ha)+IT 4 4 4 5 2 7FLR (14% ha)+IT 5 5 5 3 3 6FLR (22% ha)+IT 6 6 6 6 4 4FSDR (40% LU/ha)+FLR (35% ha)+IT 10a 7 10a 7 10a 2FSDR (50% LU/ha)+FLR (35% ha)+IT 11a 9 11a 8 11a 3FLR (20% ha)+FSDR (LU/ha) 9 8 7 NA 7 10FLR (‘setaside,’ i.e. % of arable land) 8 NA 9 NA 8 5FSDR (LU/ha) 7 NA 8 NA 9 NA
NA: Regulatory target not achieved.a Overachieves regulatory target.
29A. Aftab et al. / Ecological Economics 70 (2010) 24–33
and 5). Another notable change under wetter conditions is thateconomic controls targeting inputs (input taxation and quota) do notperform as well, especially at high standard compliance levels (referto the 4-week target — Fig. 3). In comparison, mixed instrumentpolicies perform considerably better in wet weather conditions. Thecost-effectiveness of FLR/set-aside mix policies increases as theregulatory target is tightened — consider the difference in the socialcosts between input taxation and FLR/set-aside mix polices at 10, 8, 6and 4-week standard compliance target (or compare ranking inTable 2). In fact from the 8-week regulatory and onwards (strictercompliance) FLR+IT mixes are second only to estimated emissiontaxation.
The most dramatic cost-effective ‘cross-over’ involves FLR im-proving relative to IT as the regulatory target is tightened. At best inFig. 3 IT outperforms FLR left of the shaded zone (Fig. 3) at the 10-week target by 7.29%, however right of the shaded zone FLR deliversthe 4-week regulatory target with an improvement of 8.05% over IT. InFig. 3 the shaded zone represents the 9–5-week regulatory target zonein which 2 instrument mixes prevail over single input basedinstruments. Both FSDR+IT and FLR+IT combinations manage tobe more efficient than IT by itself. The FLR+IT combinationsdominate the stricter end of this zone. Interestingly, 3 instrumentmixes comprising of FSDR+FLR+IT extend the cost-effective lead ofmixed instruments over the best feasible stand alone instrument, IT.In fact 3-instrument mixes dominate the strict end of the regulatorytarget spectrum, i.e. from the 5-week regulatory target onwards.21
4.3. Impact of Policies on Water Quality Metrics
Even though the same regulatory target can be achieved at varyingcost by different policies the actual impact on water quality is likely todiffer. Mean weather river N concentration metrics (mg N/l) at the8 regulatory standard are presented in Table 4. Economic instrumentshave a lower maximum, 90th percentile and standard deviation thanMI and stand alone managerial controls. Water quality effects fromeconomic instruments are also negatively skewed whereas manage-rial and most mixed instruments are positively skewed. Interestinglythe 3 instrument MI policies are notably different in that there isconspicuous reduction in (a) the mean, (b) the degree of negativekurtosis, and (c) the 80th percentile river concentration relative toother policies. Wet weather river water metrics (Table 5) reflect
21 To illustrate, at the 4-week target a FSDR (40% LU/ha)+FLR (35%)+IT mix confersa catchment resource cost gain of 13.373% over IT (Table 1 and Fig. 3). Other mixedinstruments provide further efficiency gains at the more stringent end of theregulatory target spectrum. E.g. a policy mix of FLR (50%)+IT provides an efficiencygain of 10.792% over IT at the 3-week regulatory target (not shown in Fig. 3).
higher pollution levels relative to mean weather, e.g. meanNmedianand positive skewness. However the greatest increase in positiveskewness is associated with the 3 instrument MI policies. Interest-ingly, in Table 5, the 3 instrument mixes are leptokurtic (positivekurtosis) whereas all other instruments are platykurtic (negativekurtosis). This implies that the 3 instrument mixed instruments havemore acute peaks with fatter tails relative to a normal distribution.They also exhibit the lowest 80th percentile value (Table 5).
Both FLR and FSDR exhibit greater positive skewness and relativelypositive excess kurtosis across the weather conditions when com-pared to stand alone economic controls. Thus, in both weatherconditions, the presence of FLR in any mixed policy tends to result inmore positive skewness and kurtosis. This Implies that although FLRmix policies allow higher value outliers for ambient pollution levelsthey also exhibit a tendency to be tightly clustered around the mean.In otherwords, in weeks the standard is violated river N concentrationis likely to be higher under FLR mix policies than under stand aloneeconomic instruments. However there is more clustering of weeksaround the mean N concentration. For example the 80th percentile inTable 5 falls near the 11.3 mg/l N standard for most economicinstruments, but coincides with lower concentrations of 10.528 and9.853 mg/l N for the two 3 instrument policy mixes.
The trade off between catchment resource cost and water qualityis more apparent when water quality metrics are considered. The 3-instrument MIs are nearly 10 times more expensive than IT undermean weather conditions because they ‘over-abate’ pollution (con-sider the lower mean, 80th percentile and relatively higher excesskurtosis). River water quality with both 3 instrument MI is, onthe other hand, far better than under IT alone in mean weatherconditions — even though they meet the same regulatory target.However, our results for water quality metrics dismiss the notionthat stand alone managerial policies are less efficient because they‘over-abate.’ In actual fact they are both costly to farmers and do notover-abate pollution to ensure compliance with regulatory targets.The mean and standard deviation of ambient pollution with puremanagerial policies remain consistently higher than all other controls.
4.4. Discussion
In a second best world22 instruments regulate indirectly bycontrolling a subset of production choices (inputs or managementpractices) that are relatively easy to observe and correlated with
22 In the real world the theoretically ideal first-best efficiency conditions for a socialoptimum cannot be achieved due to lack of perfect information and/or transactioncosts. Cost-effective policies that attain the environmental standard at least social costare termed ‘second best.’

26 Additionally a FSDR (1.4 LU/ha)+IT mix, which is second to input based policies,in the 15–10-week regulatory target range manages to outperform IT from the 9-weektarget onwards (Fig. 3).27
Table 3Instrument levels to induce compliance with regulatory targets under modelled scenarios.
Weather Mean weather Wet weather
River Flow Restriction 90th percentile No MAF restriction With and without MAF restriction
Regulatory Target 8 weeks 4 weeks 8 weeks 4 weeks 8 weeks 4 weeks
Emission tax (£/mg N ) 35.40 75.40 45.50 90.50 51.60 57.20N Input tax (IT) (£/kg N) 1.2 1.56 1.3 3.56 7.15 24.53Input quota (% restriction) 34.80 43.65 35.25 63.25 79.05 97.00FSDR (30% LU/ha)+IT 0.86 2.66 0.88 3.11 2.87 22.12FLR (14% ha)+IT 0.68 0.92 0.81 2.09 2.23 14.6FLR (22% ha)+IT 0.52 1.98 0.54 2.32 1.3 11.12FSDR (40% LU/ha)+FLR (35% ha)+IT 0.42a 1.5 0.42a 4.1 0.42a 1.25FSDR (50% LU/ha)+FLR (35% ha)+IT 0.42a 2.02 0.42a 3.25 0.42a 0.9FLR (20% ha)+FSDR (LU/ha) 23.5 62.5 38.5 NA 58 78.70FLR (‘setaside,’ i.e. % of arable land) 33.3 NA 34.6 NA 49.1 74.5FSDR (LU/ha) 66.5 NA 67.5 NA 76 NA
NA: Regulatory target not achieved.a Overachieves regulatory target.
30 A. Aftab et al. / Ecological Economics 70 (2010) 24–33
emissions. However regulating the intensity of one input affects theintensity of all other inputs, thus an input tax (intensive margin23)should be accompanied by a restriction on land acreage (extensivemargin) (Shortle et al., 1998). This may take the form of a lump sumtax on extra-marginal land/firms or some managerial restriction.
Our main results, summarised in Table 6, indicate a change inpolicy ranking in wetter conditions which can be intuitively explainedby the difference in the impacts of each instrument at the intensiveand extensive margin. In a second best world, as both the allocation ofland to particular uses and N fertiliser application intensity effectdiffuse pollution moments, both should be regulated to ensure socialwelfare (Braden and Segerson, 1993). Economic and managerialcontrols limit pollution generation in different ways. While set-asideremoves land from agriculture (i.e. acts at the extensive margin),input quotas and taxation do not. Although input taxation and quotasprovide an incentive to decrease nitrogen consumption per hectare(intensive margin), farmers still apply nitrogen and the incentive totake land out of production is too low.24 Thus the potential to leachremains in a wet year. During a high rainfall pollution episode set-aside confers a dilution effect, i.e. the N concentration from leachateand runoff is very low and offsets the higher concentration diffusepollution from intensively used agricultural land (low FSDR grasslandoffers less of a dilution — depending on the stocking density). If theregulator sets an input tax based on expected (mean) nitrate loss thenthe ambient nitrate target (number of weeks exceeding standard) willonly be met on average. If wetter weather prevails more nitrate isleached and the required compliance level is not achieved. Obviouslya stricter regulatory target (compliance level) implies greatercompliance cost.25 Thus single instruments based on mean emissionsdo not account for the risks of stochastic loads, and may be neitherefficient nor effective (Shortle et al., 1998; Elofsson, 2003).
In contrast, farm stocking density reduction (FSDR) reduces theintensity of land use (intensive margin) by either re-allocating landfrom arable crops to grassland or by reducing the number of livestockin production or both. Both changes would reduce nitrogen input useon grassland. Very low stocking density rates are associated with
23 The ‘intensive margin’ refers to the degree (intensity) to which the land unitresource is utilised. While the ‘extensive margin’ corresponds to the number of landunits utilised in production (Goetz et al., 2006).24 Provided the benefit of growing a crop exceeds the cost — everything considered.Goetz et al. (2006) note that the crop mix may change as a result of levying an input tax.25 To illustrate, the optimal tax level ensuring standard compliance at the 4-weekregulatory target given mean weather conditions is an after tax input cost of £1.50/kgnitrate (see Table 3). However in wet conditions this results in the standard beingviolated in 11 weeks. The significantly higher after tax input cost of £25.53/kg nitrateis required to achieve the 4-week target in wet weather conditions.
near-zero N input to grassland, which is in effect similar to taking landout of production, similar to setaside. FSDR therefore performsrelatively better under wet conditions than mean weather conditionswhen compared to an input tax or quota. (compare the 6-weekstandard in Fig. 2 and 3).26 Obviously the greater the livestock densityin a catchment, the more effective leverage FSDR policies exert.
Overall our results imply the existence of cross-overs in therelative efficiency ranking of policies across weather scenarios.27 NPPis determined by land management, physical soil properties, topog-raphy and weather — pollution episodes are highly correlated withperiodic flash rainfall (Burt et al., 1993). Thus evidence for efficiency‘cross-overs’ from mean to wet weather, or that cost-effectiveregulation may vary depending on weather makes sense intuitively.Previous empirical studies have reported such cross-overs acrossabatement cost frontiers (Miltz et al., 1988; Braden et al., 1989) butnot across weather scenarios. It should be noted that althoughestimated emission taxes remain the least cost option in all weather/flow requirement scenarios, their supremacy is misleading as inreality they are impractical.28
The results are best explained by the difference in incentivesprovided by economic and managerial instruments at the intensiveand extensive margin. It is likely that the efficiency of MI wouldimprove further if themanagerial components were spatially targetedto more ‘leaky’ soils,29 unfortunately our modelling did not permitsuch analysis. This superiority of MI at higher regulatory target levelsis encouraging if one takes the view that regulators are likely to preferintegrating economic instruments with managerial/regulatoryapproaches, rather than relying entirely on either alone, sinceenvironmental objectives are often ratcheted up over time.
We also considered the impact of the weather variability on policychoice. Ultimately the regulator faces the difficult decision of choosinga policy instrument level(s) which meets the regulatory target cost
In a stochastic model with probabilistic environmental constraint this would bethe equivalent of saying that policy ranking is not consistent across reliability (target)levels.28 Estimated emission taxation is off the political agenda because it assumes farmers:(a) perfectly understand the regulator's modelled relationship between managementpractices, nitrogen applications, weather patterns and emissions, (b) are risk neutral(Schmutzler, 1996), and (c) have the same weather expectations as the regulator(Shortle and Dunn, 1986). Models at present cannot estimate emissions accuratelyenough to withstand legal challenges and the transaction costs of complex models canbe substantial (Shoemaker et al., 1993).29 Land retirement, if appropriately targeted, can generate sufficient benefits tooutweigh social costs (Ribaudo et al., 1994).
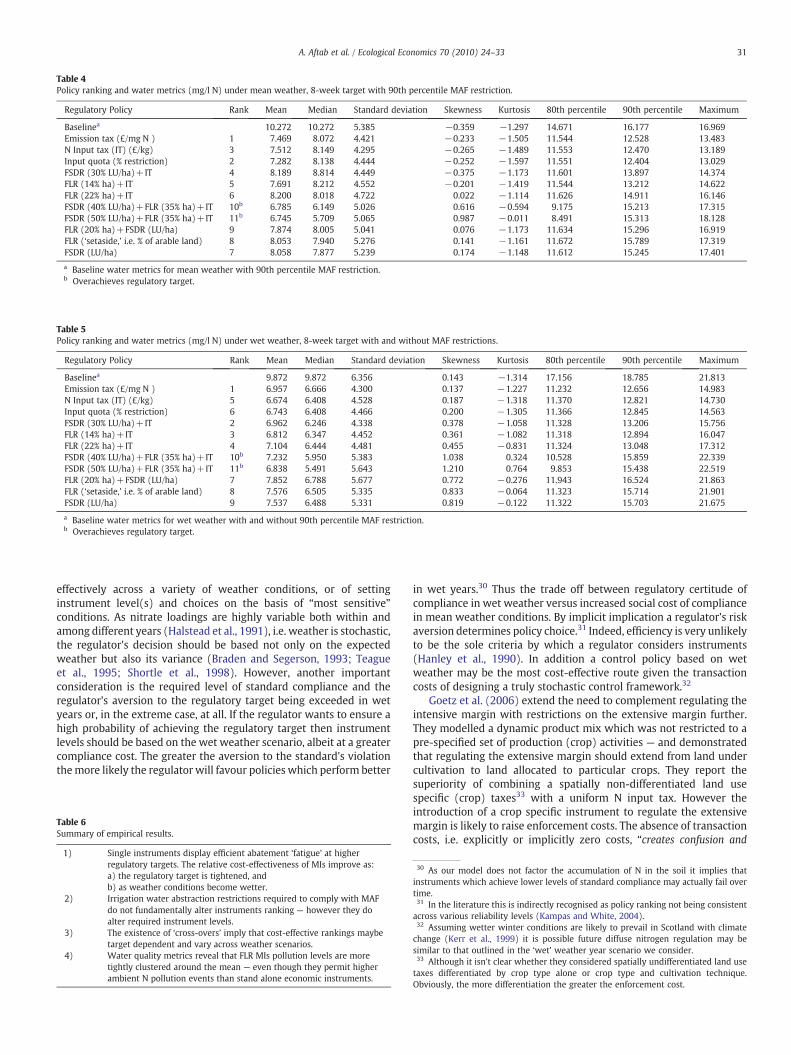
Table 4Policy ranking and water metrics (mg/l N) under mean weather, 8-week target with 90th percentile MAF restriction.
Regulatory Policy Rank Mean Median Standard deviation Skewness Kurtosis 80th percentile 90th percentile Maximum
Baselinea 10.272 10.272 5.385 −0.359 −1.297 14.671 16.177 16.969Emission tax (£/mg N ) 1 7.469 8.072 4.421 −0.233 −1.505 11.544 12.528 13.483N Input tax (IT) (£/kg) 3 7.512 8.149 4.295 −0.265 −1.489 11.553 12.470 13.189Input quota (% restriction) 2 7.282 8.138 4.444 −0.252 −1.597 11.551 12.404 13.029FSDR (30% LU/ha)+IT 4 8.189 8.814 4.449 −0.375 −1.173 11.601 13.897 14.374FLR (14% ha)+IT 5 7.691 8.212 4.552 −0.201 −1.419 11.544 13.212 14.622FLR (22% ha)+IT 6 8.200 8.018 4.722 0.022 −1.114 11.626 14.911 16.146FSDR (40% LU/ha)+FLR (35% ha)+IT 10b 6.785 6.149 5.026 0.616 −0.594 9.175 15.213 17.315FSDR (50% LU/ha)+FLR (35% ha)+IT 11b 6.745 5.709 5.065 0.987 −0.011 8.491 15.313 18.128FLR (20% ha)+FSDR (LU/ha) 9 7.874 8.005 5.041 0.076 −1.173 11.634 15.296 16.919FLR (‘setaside,’ i.e. % of arable land) 8 8.053 7.940 5.276 0.141 −1.161 11.672 15.789 17.319FSDR (LU/ha) 7 8.058 7.877 5.239 0.174 −1.148 11.612 15.245 17.401
a Baseline water metrics for mean weather with 90th percentile MAF restriction.b Overachieves regulatory target.
Table 5Policy ranking and water metrics (mg/l N) under wet weather, 8-week target with and without MAF restrictions.
Regulatory Policy Rank Mean Median Standard deviation Skewness Kurtosis 80th percentile 90th percentile Maximum
Baselinea 9.872 9.872 6.356 0.143 −1.314 17.156 18.785 21.813Emission tax (£/mg N ) 1 6.957 6.666 4.300 0.137 −1.227 11.232 12.656 14.983N Input tax (IT) (£/kg) 5 6.674 6.408 4.528 0.187 −1.318 11.370 12.821 14.730Input quota (% restriction) 6 6.743 6.408 4.466 0.200 −1.305 11.366 12.845 14.563FSDR (30% LU/ha)+IT 2 6.962 6.246 4.338 0.378 −1.058 11.328 13.206 15.756FLR (14% ha)+IT 3 6.812 6.347 4.452 0.361 −1.082 11.318 12.894 16.047FLR (22% ha)+IT 4 7.104 6.444 4.481 0.455 −0.831 11.324 13.048 17.312FSDR (40% LU/ha)+FLR (35% ha)+IT 10b 7.232 5.950 5.383 1.038 0.324 10.528 15.859 22.339FSDR (50% LU/ha)+FLR (35% ha)+IT 11b 6.838 5.491 5.643 1.210 0.764 9.853 15.438 22.519FLR (20% ha)+FSDR (LU/ha) 7 7.852 6.788 5.677 0.772 −0.276 11.943 16.524 21.863FLR (‘setaside,’ i.e. % of arable land) 8 7.576 6.505 5.335 0.833 −0.064 11.323 15.714 21.901FSDR (LU/ha) 9 7.537 6.488 5.331 0.819 −0.122 11.322 15.703 21.675
a Baseline water metrics for wet weather with and without 90th percentile MAF restriction.b Overachieves regulatory target.
31A. Aftab et al. / Ecological Economics 70 (2010) 24–33
effectively across a variety of weather conditions, or of settinginstrument level(s) and choices on the basis of “most sensitive”conditions. As nitrate loadings are highly variable both within andamong different years (Halstead et al., 1991), i.e. weather is stochastic,the regulator's decision should be based not only on the expectedweather but also its variance (Braden and Segerson, 1993; Teagueet al., 1995; Shortle et al., 1998). However, another importantconsideration is the required level of standard compliance and theregulator's aversion to the regulatory target being exceeded in wetyears or, in the extreme case, at all. If the regulator wants to ensure ahigh probability of achieving the regulatory target then instrumentlevels should be based on the wet weather scenario, albeit at a greatercompliance cost. The greater the aversion to the standard's violationthemore likely the regulator will favour policies which perform better
Table 6Summary of empirical results.
1) Single instruments display efficient abatement ‘fatigue’ at higherregulatory targets. The relative cost-effectiveness of MIs improve as:a) the regulatory target is tightened, andb) as weather conditions become wetter.
2) Irrigation water abstraction restrictions required to comply with MAFdo not fundamentally alter instruments ranking — however they doalter required instrument levels.
3) The existence of ‘cross-overs’ imply that cost-effective rankings maybetarget dependent and vary across weather scenarios.
4) Water quality metrics reveal that FLR MIs pollution levels are moretightly clustered around the mean — even though they permit higherambient N pollution events than stand alone economic instruments.
in wet years.30 Thus the trade off between regulatory certitude ofcompliance in wet weather versus increased social cost of compliancein mean weather conditions. By implicit implication a regulator's riskaversion determines policy choice.31 Indeed, efficiency is very unlikelyto be the sole criteria by which a regulator considers instruments(Hanley et al., 1990). In addition a control policy based on wetweather may be the most cost-effective route given the transactioncosts of designing a truly stochastic control framework.32
Goetz et al. (2006) extend the need to complement regulating theintensive margin with restrictions on the extensive margin further.They modelled a dynamic product mix which was not restricted to apre-specified set of production (crop) activities — and demonstratedthat regulating the extensive margin should extend from land undercultivation to land allocated to particular crops. They report thesuperiority of combining a spatially non-differentiated land usespecific (crop) taxes33 with a uniform N input tax. However theintroduction of a crop specific instrument to regulate the extensivemargin is likely to raise enforcement costs. The absence of transactioncosts, i.e. explicitly or implicitly zero costs, “creates confusion and
30 As our model does not factor the accumulation of N in the soil it implies thatinstruments which achieve lower levels of standard compliance may actually fail overtime.31 In the literature this is indirectly recognised as policy ranking not being consistentacross various reliability levels (Kampas and White, 2004).32 Assuming wetter winter conditions are likely to prevail in Scotland with climatechange (Kerr et al., 1999) it is possible future diffuse nitrogen regulation may besimilar to that outlined in the ‘wet’ weather year scenario we consider.33 Although it isn't clear whether they considered spatially undifferentiated land usetaxes differentiated by crop type alone or crop type and cultivation technique.Obviously, the more differentiation the greater the enforcement cost.
32 A. Aftab et al. / Ecological Economics 70 (2010) 24–33
errors both in defining the problem and in the search for solutions”(pg.524) (Vatn, 1998). Unfortunately, there are few reliable transac-tion cost estimates (Shortle et al., 1998; McCann and Easter, 1999;Kampas and White, 2004) and the addition of a crop specific land usetax may have regional political implications as well.
In contrast, we propose regulating the extensive margin by usingland setaside, as part of a MI approach. Managerial approaches arearguably cheaper to implement, since existing stocking density andset-aside restrictions currently enforced as cross-compliance require-ments under the European-wide Single Farm Payment Scheme meana data collection and monitoring infrastructure is already in place. Infact the monitoring costs of permanent set-aside would be signifi-cantly lesser. In addition, set-aside is associated with reducedinsecticide, herbicide, fungicide, nitrogen, phosphorus and sedimentpollution (Ribaudo et al., 1994). The accumulative transaction costs ofdesigning, enforcing and monitoring separate economic instrumentsto control each NPP externality may be prohibitive and warrant amore integrated and simpler approach. We note that a problem-byproblem, information-intensive approach to NPP is not practical, andthe focus on such approaches in the economics literature possiblyexplains the limited uptake of economic instruments to controlcomplex agricultural externalities. Managerial options can alsogenerate ancillary environmental benefits in terms of wildlife habitatand landscape amenity value which would increase their cost-effectiveness by reducing their net social costs (Hanley et al., 1999)and sustain the multi-functionality of agriculture.
5. Conclusions
This study has focussed on evaluating combinations of economicinstruments with managerial measures to achieve a reduction in nitratepollution while maintaining an environmental target of ensuringminimum river flows. Such multiple-objective management seemslikely to become more prevalent in the EU as a result of the WaterFramework Directive, whilst policy evolution seems certain to take in amixed instrument approach, combining economic incentives withregulation. For economists to lobby policy makers on the basis of apreference for “pure” economic instruments seems likely to beunproductive inpolitical economy terms, and this paperhas investigatedwhat the pay-offs (both positive and negative) might be of focussinginstead on a mixed approach. Combining economic instruments anddirect managerial regulation to control NPP has not been simulatedin the economics literature before. MIs make sense when the nature ofthe environmental problem(s) being considered (highly spatiallydiverse and time-varying; many actors; imperfectly observable actionsand effects) means that neither economic nor regulatory approachesalone can achieve acceptable levels of effectiveness and efficiency.
Conceptually, would a MI strategy be better than a singleinstrument in another catchment? The transferability of our resultsdepends on weather and the degree of regulatory strictness. Incatchments with wet weather MI comprising of economic andmanagerial regulation will fare better. Of course, defining ‘wetweather’ is relative and indeed determining a pattern in instrumentefficiency ‘cross-overs’ warrants further research.
References
Aftab, A., Hanley, N., et al., 2007. Coordinated environmental regulation: controllingnonpoint nitrate pollution while maintaining river flows. Environmental andResource Economics 38 (4), 573–593.
Albiac, J.M., Karaj, S.U., et al., 2001. Water Quality Protection through IrrigationManagement. Working Paper Unidad de Economia Agraria.
Anthony, S., Quinn, P., et al., 1996. Catchment scale modelling of nitrate leaching(modelling in applied biology: spatial aspects). Aspects of Applied Biology 46,23–32.
Bailey, R., Spackman, E., 1996. A model for estimating soil moisture changes as an aid toirrigation scheduling and crop water use studies: I. Operational details anddescription. Soil Use and Management 12 (3), 122–128.
Barnard, C.S., Nix, J.S., 1973. Farm Planning and Control. Cambridge University Press.Baumol, W., Oates, W., 1988. The Theory of Environmental Policy. Cambridge University
Press.Beavis, B., Walker, M., 1983. Random wastes, imperfect monitoring and environmental
quality standards. Journal of Public Economics 21, 377–387.Braden, J., Segerson, K., 1993. Information problems in the design of nonpoint-source
pollution policy. In: Russell, C., Shorgen, J. (Eds.), Theory, Modelling, andExperience in the Management of Nonpoint Source Pollution. Kluwer AcademicPublishers, Massachusetts. pp.
Braden, J., Johnson, G., et al., 1989. Optimal spatial management of agriculturalpollution. American Journal of Agricultural Economics 71, 404–413.
Brooke, A., Kendrick, D., et al., 1998. GAMS. Washington, D.C., GAMS DevelopmentCorporation.
Burt, T., Haycock, N., 1993. Controlling losses of nitrate by changing land use. In: Burt, T.,Heathwaite, A., Trudgill, S. (Eds.), Nitrate: Processes, Patterns and Management.Wiley & Sons, Chichester. pp.
Burt, T.P., Heathwaite, A.L., et al. (Eds.), 1993. Nitrate: Processes. John Wiley and Sons,Patterns and Management.
Crabtree, J.R., Chalmers, N., et al., 2000. Evaluating the Economic Impact of IrrigationControls. MLURI, Aberdeen, p. 100.
Darcy, B.J., Ellis, J.B., et al., 2000. Diffuse Pollution Impacts: The Environmental andEconomic Impacts of Diffuse Pollution in the U.K. CIWEM Publications, U.K.
DEFRA, 2007. Draft Partial Regulatory Impact Assessment (RIA) on Potential Costs andBenefits Associated with New Environmental Standards and conditions Proposedfor Water Framework Directive (WFD) Implementation. London.
Dunn, S., 1998. Development of an application of a distributed catchment scalehydrological model for the Ythan, NE Scotland. Hydrological Processes 12, 401–416.
Elofsson, K., 2003. Cost-effective reductions of stochastic agricultural loads to the BalticSea. Ecological Economics 47, 13–31.
EU, 2000. EU water framework directive. EU Official Journal OJ L327.Goetz, R.-U., Schmid, H., et al., 2006. Determining the economic gains from regulation at
the extensive and intensive margin. European Review of Agricultural Economics 33(1), 1–30.
Hahn, R.W., 2000. The impact of economics on environmental policy. Journal ofEnvironmental Economics and Management 39, 375–399.
Halstead, J., Batie, S., et al., 1991. Impacts of uncertainty on policy costs of managingnonpoint source ground-water contamination. Journal of Sustainable Agriculture 1,29–48.
Hanley, N., Hallett, S., et al., 1990. Why is more notice not taken of economists'prescriptions for the control of pollution? Environment and Planning A 22 (11),1421–1439.
Hanley, N., Whitby, M., et al., 1999. Assessing the success of agri-environmental policyin the UK. Land Use Policy 16 (2), 67–80.
Helfand, G., House, B., 1995. Regulating nonpoint-source pollution under heteroge-neous conditions. American Journal of Agricultural Economics 77, 1024–1032.
Horan, R., Shortle, J.S., et al., 1998. Ambient taxes when polluters have multiple choices.Journal of Environmental Economics and Management 36, 186–199.
Johnson, S., Adams, R., et al., 1991. The on-farm costs of reducing groundwaterpollution. American Journal of Agricultural Economics 73, 1063–1073.
Kampas, A., White, B., 2004. Administrative costs and instrument choice for stochasticnon-point source pollutants. Environment and Resource Economics 27 (2),109–133.
Kerr, A., Shackley, S., et al., 1999. Climate Change: Scottish Implications Scoping Study.Scottish Executive Central Research Unit, Edinburgh, p. 75.
Kolstad, C., Thomas, U., et al., 1990. Ex post liability for harm vs. ex ante safetyregulation: substitutes or complements? American Economic Review 80 (4),888–901.
Larson, D.M., Helfand, G.E., et al., 1996. Second-best tax policies to reduce nonpointsource pollution. American Journal of Agricultural Economics 78 (4), 1108–1117.
Lockyer, D., Scholefield, D., et al., 1995. N-CYCLE. MERTAL Courseware, Aberdeen.Lord, E., 1992. Modelling of nitrate leaching: nitrate sensitive areas. Aspects of Applied
Biology 30, 19–28.McCann, L., Easter, K.W., 1999. Transaction costs of policies to reduce agricultural
phosphorous pollution in the Minnesota River. Land Economics 75 (3), 402–414.Miltz, D., Braden, B., et al., 1988. Standards versus prices revised: the case of agricultural
non-point source pollution. Journal of Agricultural Economics 39 (3), 360–368.NCEE, 2004. International Experiences with Economic Incentives to Protect the
Environment. National Center for Environmental Economics, US EPA,WashingtonDC.OECD, 1997. Environmental Taxes and Green Tax Reform. Organisation of Economic
Cooperation and Development, Paris.Ribaudo, M., Osborn, C., et al., 1994. Land retirement as a tool for reducing agricultural
nonpoint source pollution. Land Economics 70, 77–87.Roberts, M., Spence, M., 1976. Effluent charges and licenses under uncertainty. Journal
of Public Economics 5, 193–208.SAC, 1997. Farm Management Handbook 1997/98. Scottish Agricultural College,
Edinburgh.Schmutzler, A., 1996. Pollution control with imperfectly observable emissions.
Environmental and Resource Economics 7, 251–262.Scholefield, D., Lockyer, D., et al., 1991. Amodel to predict transformations and losses of
nitrogen in UK pastures grazed by beef cattle. Plant and Soil 132, 165–177.Shoemaker, R.A., Ervin, D.E., et al., 1993. Data requirements for modeling and evaluation
of national policies aimed at controlling agricultural sources of nonpoint waterpollution. In: Russell, C.S., Shogren, J.F. (Eds.), Theory, Modeling and Experience inthe Management of Nonpoint-Source Pollution. Kluwer, Norwell, Mass. pp.
Shortle, J.S., Dunn, J., 1986. The relative efficiency of agricultural source water pollutioncontrol policies. American Journal of Agricultural Economics 68, 668–677.

33A. Aftab et al. / Ecological Economics 70 (2010) 24–33
Shortle, J.S., Horan, R., 2001. The economics of nonpoint pollution control. Journal ofEconomic Surveys 15 (3), 255–289.
Shortle, J.S., Horan, R., et al., 1998. Research issues in nonpoint pollution control.Environmental and Resource Economics 11, 571–585.
SOAEFD, 1997. Scottish Agriculture: A Guide to Grants and Services. Scottish Executive,Edinburgh.
Stevens, B., 1988. Fiscal implications of effluent charges and input taxes. Journal ofEnvironmental Economics and Management 15, 285–296.
Stolbjerg-Drud, A., 1993. GAMS/CONOPT. GAMS (The Solver Manuals). GAMSDevelopment Corporation, Washington DC. 55 pp.
Teague, M.L., Bernardo, D.J., et al., 1995. Farm level economic analysis incorporatingstochastic environmental riskassessment. American Journal ofAgricultural Economics77, 8–19.
Vatn, A., 1998. Input versus emission taxes: environmental taxes in a mass balance andtransaction costs perspectives. Land Economics 74 (4), 514–525.
Weinberg, M., Kling, C.L., et al., 1993. Water markets and water quality. AmericanJournal Agricultural Economics 75 (278–291).
Wossink, G.A., Oude-Lansink, A., et al., 2001. Non-separability and heterogeneity inintegrated agronomic–economic analysis of nonpoint-source pollution. EcologicalEconomics 38, 345–357.
Wu, J., 1999. Input substitution and pollution control under uncertainty and firmheterogeneity. Journal of Public Economic Policy 2 (2), 273–288.
Wu, J., Babcock, B.A., 2001. Spatial heterogeneity and the choice of instruments tocontrol nonpoint pollution. Environment and Resource Economics 18 (2), 173–192.
Wu, J., Teague, M., et al., 1995. An empirical analysis of the relative efficiency of policyinstruments to reduce nitrate water pollution in the U.S. Southern High Plains.Canadian Journal of Agricultural Economics 43, 403–420.
Xepapadeas, A., 1995. Observability and choice of instrument mix in the control ofexternalities. Journal of Public Economics 56, 485–498.