Integrated field, satellite and petrological observations of the ...
21
RESEARCH ARTICLE Integrated field, satellite and petrological observations of the November 2010 eruption of Erta Ale Lorraine Field & Talfan Barnie & Jon Blundy & Richard A. Brooker & Derek Keir & Elias Lewi & Kate Saunders Received: 5 January 2012 / Accepted: 10 September 2012 / Published online: 12 October 2012 # Springer-Verlag Berlin Heidelberg 2012 Abstract Erta Ale volcano, Ethiopia, erupted in November 2010, emplacing new lava flows on the main crater floor, the first such eruption from the southern pit into the main crater since 1973, and the first eruption at this remote volcano in the modern satellite age. For many decades, Erta Ale has contained a persistently active lava lake which is ordinarily confined, several tens of metres below the level of the main crater, within the southern pit. We combine on-the-ground field observations with multispectral imaging from the SEV- IRI satellite to reconstruct the entire eruptive episode begin- ning on 11 November and ending prior to 14 December 2010. A period of quiescence occurred between 14 and 19 November. The main eruptive activity developed between 19 and 22 November, finally subsiding to pre-eruptive levels between 8 and 15 December. The estimated total volume of lava erupted is ∼0.006 km 3 . The mineralogy of the 2010 lava is plagioclase+clinopyroxene+olivine. Geochemically, the lava is slightly more mafic than previously erupted lava lining the caldera floor, but lies within the range of histor- ical lavas from Erta Ale. SIMS analysis of olivine-hosted melt inclusions shows the Erta Ale lavas to be relatively volatile-poor, with H 2 O contents ≤1,300 ppm and CO 2 contents of ≤200 ppm. Incompatible trace and volatile element systematics of melt inclusions show, however, that the November 2010 lavas were volatile-saturated, and that degassing and crystallisation occurred concomitantly. Vola- tile saturation pressures are in the range 7–42 MPa, indi- cating shallow crystallisation. Calculated pre-eruption and melt inclusion entrapment temperatures from mineral/liquid thermometers are ∼1,150 °C, consistent with previously published field measurements. Keywords Afar . Ethiopia . Remote sensing of volcanoes . Lava lake . Melt inclusions . Basalt Introduction The Afar depression lies at the triple junction between the Red Sea, Gulf of Aden and East African rifts, and has been pro- duced by rifting between Africa and Arabia over the past ∼30 Myr (Wolfenden et al. 2005). The southern Red Sea rift has become punctuated over the past ∼3 million years with ∼60-km long magmatic segments as faulting and volcanic activity have become more focused into localised regions (Barberi and Varet 1977). Erta Ale is a basaltic shield volcano (13°36′11.41′′N, 40°39′50.08′′E) situated within the Erta Ale magmatic segment (Fig. 1) which comprises six main volcanic centres (Barberi and Varet 1970). The Erta Ale segment is the northernmost in Afar and forms the sub-aerial southwards Editorial responsibility: J.E. Gardner Electronic supplementary material The online version of this article (doi:10.1007/s00445-012-0660-7) contains supplementary material, which is available to authorized users. L. Field (*) : J. Blundy : R. A. Brooker : K. Saunders School of Earth Sciences, University of Bristol, Queen’ s Road, Bristol BS8 1RJ, UK e-mail: [email protected] T. Barnie Department of Geography, University of Cambridge, Downing Place, Cambridge CB2 3EN, UK D. Keir National Oceanography Centre Southampton, University of Southampton Waterfront Campus, European Way, Southampton SO14 3ZH, UK E. Lewi Geophysical Observatory, University of Addis Ababa, Addis Ababa, Ethiopia Bull Volcanol (2012) 74:2251–2271 DOI 10.1007/s00445-012-0660-7
-
Upload
khangminh22 -
Category
Documents
-
view
9 -
download
0
Transcript of Integrated field, satellite and petrological observations of the ...
RESEARCH ARTICLE
Integrated field, satellite and petrological observationsof the November 2010 eruption of Erta Ale
Lorraine Field & Talfan Barnie & Jon Blundy &
Richard A. Brooker & Derek Keir & Elias Lewi &Kate Saunders
Received: 5 January 2012 /Accepted: 10 September 2012 /Published online: 12 October 2012# Springer-Verlag Berlin Heidelberg 2012
Abstract Erta Ale volcano, Ethiopia, erupted in November2010, emplacing new lava flows on the main crater floor, thefirst such eruption from the southern pit into the main cratersince 1973, and the first eruption at this remote volcano inthe modern satellite age. For many decades, Erta Ale hascontained a persistently active lava lake which is ordinarilyconfined, several tens of metres below the level of the maincrater, within the southern pit. We combine on-the-groundfield observations with multispectral imaging from the SEV-IRI satellite to reconstruct the entire eruptive episode begin-ning on 11 November and ending prior to 14 December2010. A period of quiescence occurred between 14 and 19November. The main eruptive activity developed between 19and 22 November, finally subsiding to pre-eruptive levels
between 8 and 15 December. The estimated total volumeof lava erupted is ∼0.006 km3. The mineralogy of the 2010lava is plagioclase+clinopyroxene+olivine. Geochemically,the lava is slightly more mafic than previously erupted lavalining the caldera floor, but lies within the range of histor-ical lavas from Erta Ale. SIMS analysis of olivine-hostedmelt inclusions shows the Erta Ale lavas to be relativelyvolatile-poor, with H2O contents ≤1,300 ppm and CO2
contents of ≤200 ppm. Incompatible trace and volatileelement systematics of melt inclusions show, however, thatthe November 2010 lavas were volatile-saturated, and thatdegassing and crystallisation occurred concomitantly. Vola-tile saturation pressures are in the range 7–42 MPa, indi-cating shallow crystallisation. Calculated pre-eruption andmelt inclusion entrapment temperatures from mineral/liquidthermometers are ∼1,150 °C, consistent with previouslypublished field measurements.
Keywords Afar . Ethiopia . Remote sensing of volcanoes .
Lava lake . Melt inclusions . Basalt
Introduction
The Afar depression lies at the triple junction between the RedSea, Gulf of Aden and East African rifts, and has been pro-duced by rifting between Africa and Arabia over the past∼30 Myr (Wolfenden et al. 2005). The southern Red Sea rifthas become punctuated over the past ∼3 million years with∼60-km long magmatic segments as faulting and volcanicactivity have become more focused into localised regions(Barberi and Varet 1977). Erta Ale is a basaltic shield volcano(13°36′11.41′′N, 40°39′50.08′′E) situated within the Erta Alemagmatic segment (Fig. 1) which comprises sixmain volcaniccentres (Barberi and Varet 1970). The Erta Ale segment is thenorthernmost in Afar and forms the sub-aerial southwards
Editorial responsibility: J.E. Gardner
Electronic supplementary material The online version of this article(doi:10.1007/s00445-012-0660-7) contains supplementary material,which is available to authorized users.
L. Field (*) : J. Blundy :R. A. Brooker :K. SaundersSchool of Earth Sciences, University of Bristol,Queen’s Road,Bristol BS8 1RJ, UKe-mail: [email protected]
T. BarnieDepartment of Geography, University of Cambridge,Downing Place,Cambridge CB2 3EN, UK
D. KeirNational Oceanography Centre Southampton,University of Southampton Waterfront Campus,European Way,Southampton SO14 3ZH, UK
E. LewiGeophysical Observatory, University of Addis Ababa,Addis Ababa, Ethiopia
Bull Volcanol (2012) 74:2251–2271DOI 10.1007/s00445-012-0660-7
continuation of the Red Sea rift (Prodehl et al. 1997). The lasteruption in this segment occurred in November 2008 whenbasaltic lava covered 15 km2, originating from a fissure be-tween Dalaffilla and Alu volcanoes (Pagli et al. 2012).
Erta Ale is known for its active lava lakes situated in thenorthern and southern pits within a main 0.7×1.6-km ellip-tical summit crater (Fig. 1; a summary of recorded activity isprovided in Supplementary Table 5). The Erta Ale lava lakeis one of just four long-lived lava lakes existing across theworld; others are Erebus (Antarctica), Nyiragongo (DRCongo) and Ambrym (Vanuatu). Shorter-lived lava lakesalso appear elsewhere periodically, e.g. Kilauea, Hawaiiand Villarrica, Chile.
The first systematic study of the Erta Ale lava lake began in1967 (Barberi and Varet 1970), but the lake is likely to haveexisted from much earlier than this, as reports of a ‘smokingmountain’ and characteristic red summit glow were recordedby early visitors to the area (e.g. Nesbitt 1935; Dainelli andMarinelli 1907; Barberi and Varet 1970). Erta Ale volcano isremote and difficult to access, and as a result, observationshave been sporadic: it was not until the CNR-CNRS cam-paigns of the late 1960s that it began to be studied in detail(e.g. Barberi and Varet 1970; Tazieff 1973). At this time, alava lake existed in both the northern and southern pits, but the
northern lake solidified between 1988 and 1992 followingemplacement of two lava flows during this period (Vetsch etal. 1992). The southern lake's surface solidified briefly be-tween late 2004 and April 2005 (Bardintzeff and Gaudru2004; Yirgu and Philpotts 2005). It was reactivated in Sep-tember 2005, with lava visibly overturning at the edges of thelava lake, within the pit, possibly in response to the volcano-seismic crisis in Afar (Ayele et al. 2007). The level of thesouthern lake has fluctuated (Le Guern et al. 1979), but themajority of recent observations indicate the lake level wasgenerally tens of metres below the floor of the main crater,nestled at the base of the southern pit (e.g. Oppenheimer andFrancis 1997). Eruptions occur from these lakes from time totime, causing lava to overflow from the pits onto the maincrater floor, but they are rarely observed. Varet (1972a),reported the first recorded eruptive event from the southernpit in March 1972, following the emplacement of two newlava flows into the main crater which emanated from thesouthern side of the south pit; one sometime prior to 21 andone on 23 of March. This activity continued with three addi-tional new lava flows, visible when the volcano was visitedin May 1972 (Varet 1972b). Tazieff (1973) reported over-flows which overran the main crater rim in March 1973.From this occurrence until November 2010, no further
Fig. 1 Sketch map indicatingthe location of Erta Ale andsatellite image of the Erta Alecrater, with the extent of theNovember–December 2010eruption lavas [∼0.4 km2: GPStrack courtesy of JamesHammond (February 2011)].Sample locations from 22November are shown, whichwere subsequently covered byfurther overflows. Image takenby the PRISM instrument onALOS satellite, with an imageresolution of 2.5 m. Imageacquired on 19 November2008. Data acquired from ESA
2252 Bull Volcanol (2012) 74:2251–2271
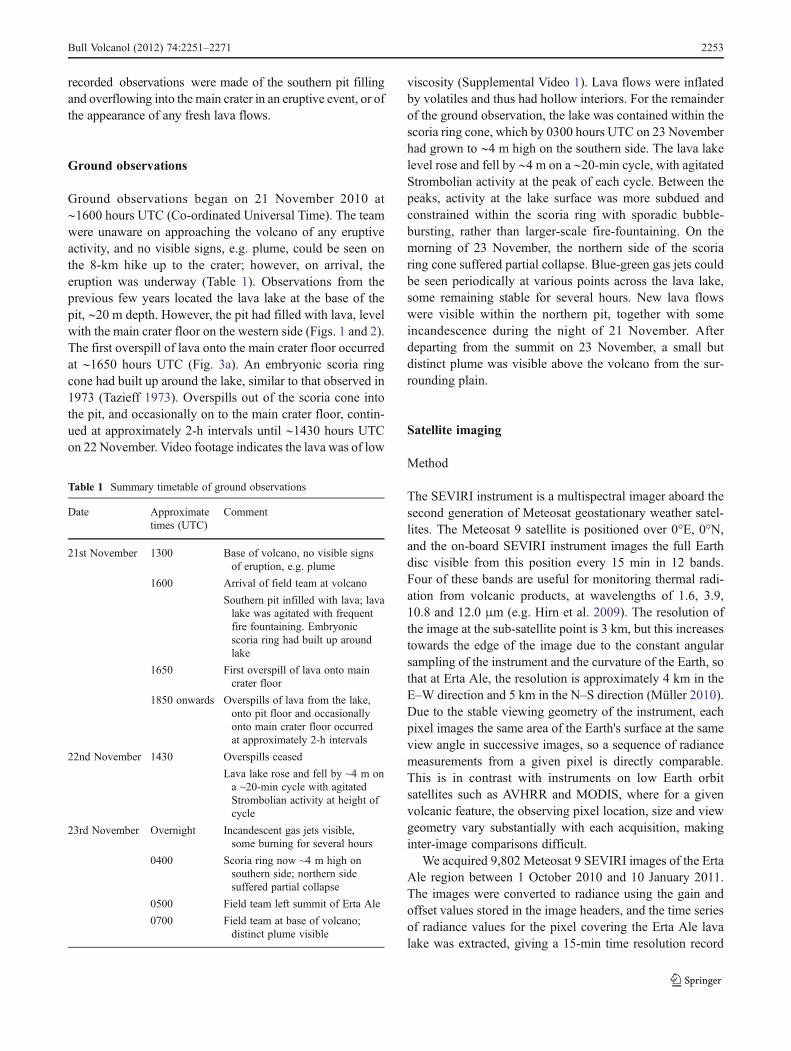
recorded observations were made of the southern pit fillingand overflowing into the main crater in an eruptive event, or ofthe appearance of any fresh lava flows.
Ground observations
Ground observations began on 21 November 2010 at∼1600 hours UTC (Co-ordinated Universal Time). The teamwere unaware on approaching the volcano of any eruptiveactivity, and no visible signs, e.g. plume, could be seen onthe 8-km hike up to the crater; however, on arrival, theeruption was underway (Table 1). Observations from theprevious few years located the lava lake at the base of thepit, ∼20 m depth. However, the pit had filled with lava, levelwith the main crater floor on the western side (Figs. 1 and 2).The first overspill of lava onto the main crater floor occurredat ∼1650 hours UTC (Fig. 3a). An embryonic scoria ringcone had built up around the lake, similar to that observed in1973 (Tazieff 1973). Overspills out of the scoria cone intothe pit, and occasionally on to the main crater floor, contin-ued at approximately 2-h intervals until ∼1430 hours UTCon 22 November. Video footage indicates the lava was of low
viscosity (Supplemental Video 1). Lava flows were inflatedby volatiles and thus had hollow interiors. For the remainderof the ground observation, the lake was contained within thescoria ring cone, which by 0300 hours UTC on 23 Novemberhad grown to ∼4 m high on the southern side. The lava lakelevel rose and fell by ∼4 m on a ∼20-min cycle, with agitatedStrombolian activity at the peak of each cycle. Between thepeaks, activity at the lake surface was more subdued andconstrained within the scoria ring with sporadic bubble-bursting, rather than larger-scale fire-fountaining. On themorning of 23 November, the northern side of the scoriaring cone suffered partial collapse. Blue-green gas jets couldbe seen periodically at various points across the lava lake,some remaining stable for several hours. New lava flowswere visible within the northern pit, together with someincandescence during the night of 21 November. Afterdeparting from the summit on 23 November, a small butdistinct plume was visible above the volcano from the sur-rounding plain.
Satellite imaging
Method
The SEVIRI instrument is a multispectral imager aboard thesecond generation of Meteosat geostationary weather satel-lites. The Meteosat 9 satellite is positioned over 0°E, 0°N,and the on-board SEVIRI instrument images the full Earthdisc visible from this position every 15 min in 12 bands.Four of these bands are useful for monitoring thermal radi-ation from volcanic products, at wavelengths of 1.6, 3.9,10.8 and 12.0 μm (e.g. Hirn et al. 2009). The resolution ofthe image at the sub-satellite point is 3 km, but this increasestowards the edge of the image due to the constant angularsampling of the instrument and the curvature of the Earth, sothat at Erta Ale, the resolution is approximately 4 km in theE–W direction and 5 km in the N–S direction (Müller 2010).Due to the stable viewing geometry of the instrument, eachpixel images the same area of the Earth's surface at the sameview angle in successive images, so a sequence of radiancemeasurements from a given pixel is directly comparable.This is in contrast with instruments on low Earth orbitsatellites such as AVHRR and MODIS, where for a givenvolcanic feature, the observing pixel location, size and viewgeometry vary substantially with each acquisition, makinginter-image comparisons difficult.
We acquired 9,802 Meteosat 9 SEVIRI images of the ErtaAle region between 1 October 2010 and 10 January 2011.The images were converted to radiance using the gain andoffset values stored in the image headers, and the time seriesof radiance values for the pixel covering the Erta Ale lavalake was extracted, giving a 15-min time resolution record
Table 1 Summary timetable of ground observations
Date Approximatetimes (UTC)
Comment
21st November 1300 Base of volcano, no visible signsof eruption, e.g. plume
1600 Arrival of field team at volcano
Southern pit infilled with lava; lavalake was agitated with frequentfire fountaining. Embryonicscoria ring had built up aroundlake
1650 First overspill of lava onto maincrater floor
1850 onwards Overspills of lava from the lake,onto pit floor and occasionallyonto main crater floor occurredat approximately 2-h intervals
22nd November 1430 Overspills ceased
Lava lake rose and fell by ~4 m ona ~20-min cycle with agitatedStrombolian activity at height ofcycle
23rd November Overnight Incandescent gas jets visible,some burning for several hours
0400 Scoria ring now ~4 m high onsouthern side; northern sidesuffered partial collapse
0500 Field team left summit of Erta Ale
0700 Field team at base of volcano;distinct plume visible
Bull Volcanol (2012) 74:2251–2271 2253
of the radiant output of the eruption. Thermal anomalieswere only observed in the 3.9-μm band, consistent withthe presence of a very small surface area at volcanic temper-atures. Larger areas would register at the 10.8- and 12.0-μmbands, saturate the 3.9-μm band and, if there was enoughincandescent material (e.g. cracks, fire fountains and shearzones), also register at the 1.6-μm band (Davies et al. 2010).We subtracted the radiance from a neighbouring cold pixelto obtain the excess radiance emitted by the hot volcanicmaterial, over and above that radiated and reflected by a
region with similar reflective and emissive properties atbackground temperatures. This gives us a time series ofthe thermal anomaly associated with the eruption, whichwe interpret qualitatively. The lava lake and backgroundpixel do have subtle differences in radiance patterns inthe absence of hot material in the lava lake pixel, and asa result, there is a regular small dip in the thermalanomaly at dawn; however, this effect is small and doesnot invalidate our observations, which are first order andqualitative in nature.
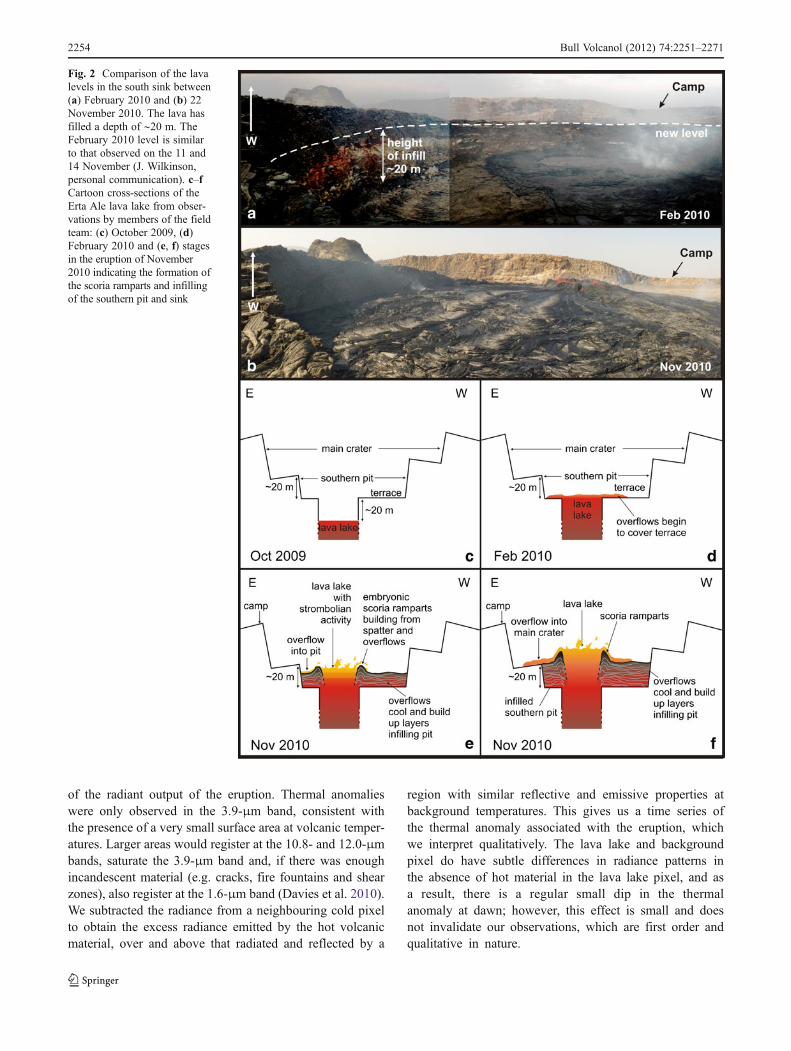
Fig. 2 Comparison of the lavalevels in the south sink between(a) February 2010 and (b) 22November 2010. The lava hasfilled a depth of ∼20 m. TheFebruary 2010 level is similarto that observed on the 11 and14 November (J. Wilkinson,personal communication). c–fCartoon cross-sections of theErta Ale lava lake from obser-vations by members of the fieldteam: (c) October 2009, (d)February 2010 and (e, f) stagesin the eruption of November2010 indicating the formation ofthe scoria ramparts and infillingof the southern pit and sink
2254 Bull Volcanol (2012) 74:2251–2271
Interpretation
The Erta Ale lava lake does not typically register in anySEVIRI band, despite being frequently observed by MODIS(e.g. Ayele et al. 2007; Wright and Pilger 2008). This is a
function of look angle; the MODIS instruments view thelava lake from a range of angles, while SEVIRI viewsfrom a constant angle of ∼42°E, at which the lake iscompletely occluded from the sensor field of view bythe crater rim when the lava lake is at a low stand
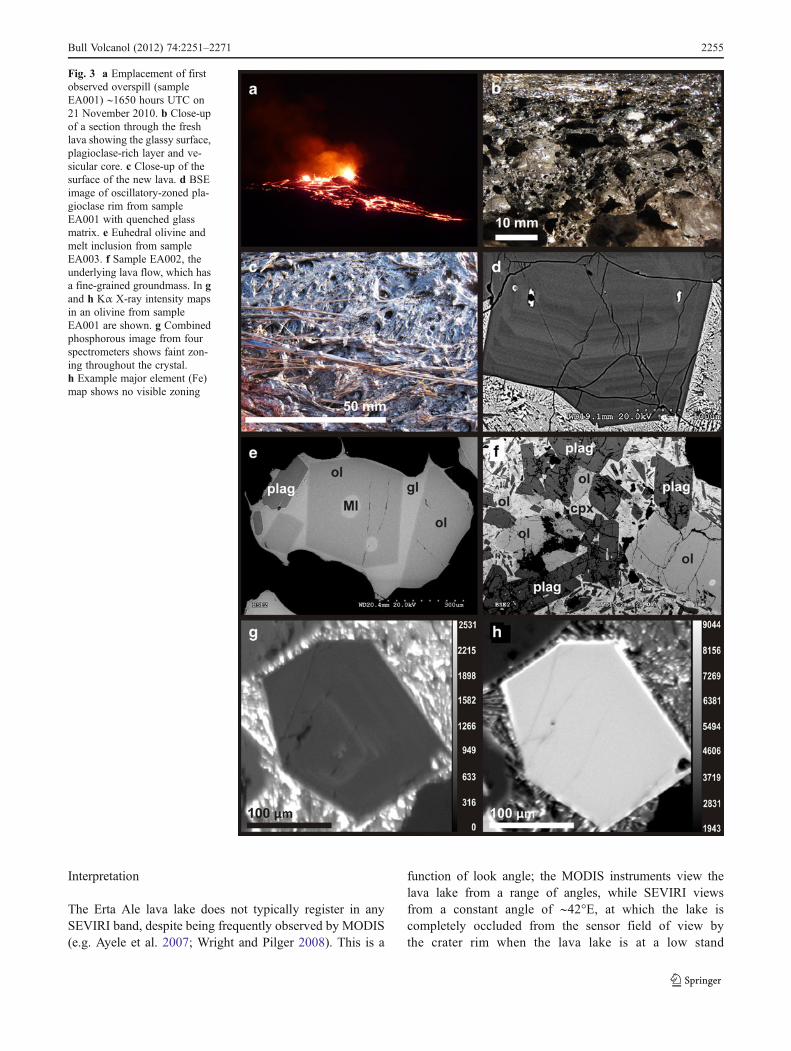
Fig. 3 a Emplacement of firstobserved overspill (sampleEA001) ∼1650 hours UTC on21 November 2010. b Close-upof a section through the freshlava showing the glassy surface,plagioclase-rich layer and ve-sicular core. c Close-up of thesurface of the new lava. d BSEimage of oscillatory-zoned pla-gioclase rim from sampleEA001 with quenched glassmatrix. e Euhedral olivine andmelt inclusion from sampleEA003. f Sample EA002, theunderlying lava flow, which hasa fine-grained groundmass. In gand h Kα X-ray intensity mapsin an olivine from sampleEA001 are shown. g Combinedphosphorous image from fourspectrometers shows faint zon-ing throughout the crystal.h Example major element (Fe)map shows no visible zoning
Bull Volcanol (2012) 74:2251–2271 2255
(typically ∼20 m below the surface). As the lava lakelevel rises, or overflows onto the pit floor, more of thesurface area of the lava comes into view of the sensor.This increases the measured radiance, resulting in a
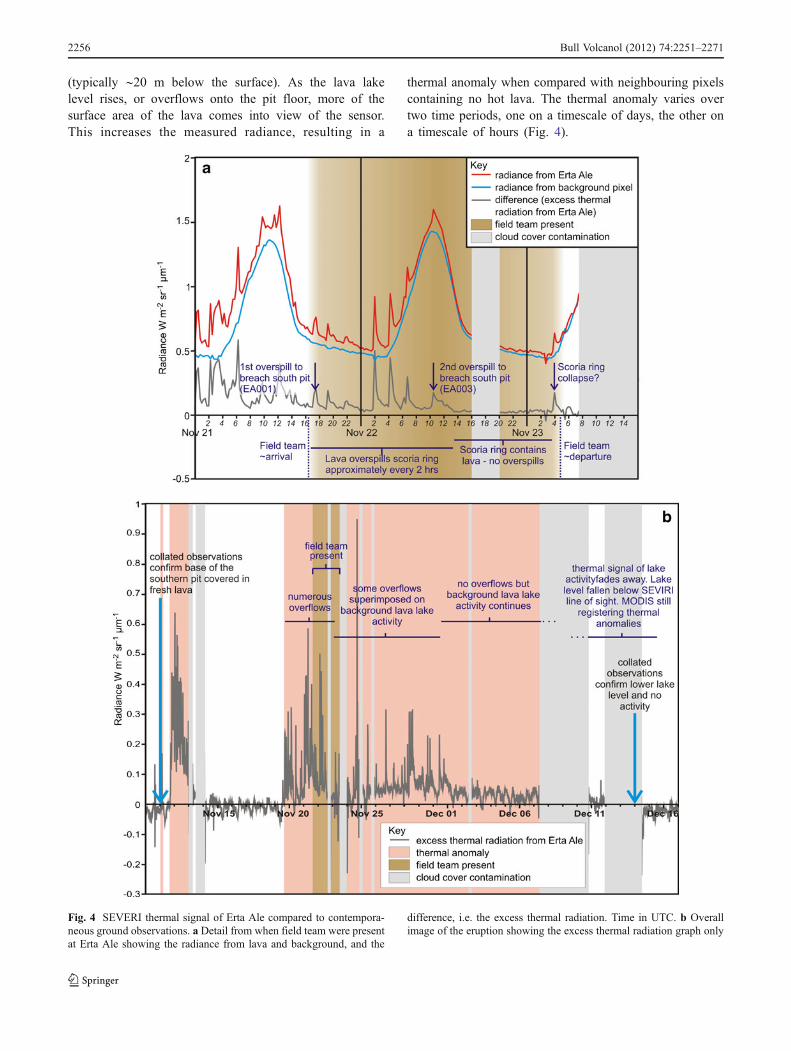
thermal anomaly when compared with neighbouring pixelscontaining no hot lava. The thermal anomaly varies overtwo time periods, one on a timescale of days, the other ona timescale of hours (Fig. 4).
Fig. 4 SEVERI thermal signal of Erta Ale compared to contempora-neous ground observations. a Detail from when field team were presentat Erta Ale showing the radiance from lava and background, and the
difference, i.e. the excess thermal radiation. Time in UTC. b Overallimage of the eruption showing the excess thermal radiation graph only
2256 Bull Volcanol (2012) 74:2251–2271
The variation on a timescale of hours is characterised bysharp increases in radiance over a period of <15 min, fol-lowed by an exponential decay over a period of around anhour. These spikes in radiance have been correlated withlava overflows observed in the field, so we interpret thespikes as lava overflows: either initially onto the ‘terrace’abutting the lake within the pit as the lake level rises or overthe scoria ramparts surrounding the high stand lake, onto thenew infilled surface of the pit and eventually onto the maincrater floor. The rapid rise in radiance over 15 to 30 minassociated with each spike is interpreted as the advance ofthe overflow; the subsequent exponential decay in radianceover a period of a few hours is the cooling of the surface.Each overflow can be considered a temporary increase in thearea of the ‘lava lake’. Between spikes, the backgroundradiance from the lava lake varies little as the lava lake levelremains relatively constant, which we interpret to mean thesurface temperature distribution varies little.
The second thermal anomaly variance is on a timescale ofdays. A thermal anomaly is present during two periods(Fig. 4b). The first starts with an isolated spike in radiance at0212 hours UTC on 11 November, which decays to thebackground level after about an hour. The anomaly reappearsslightly later at 1557 hours UTC, peaks aroundmidnight on 11November and then decays to 0657 hours UTC on 13November. This overall trend is punctuated by numerousspikes in radiance. The second period begins on 1442 hoursUTC on 19 November and is marked by numerous spikes inradiance. It continues until ∼1457 hours UTC on 22November.The baseline anomaly then slowly increased with markedlyfewer radiance spikes to approximately midnight on 30November. After this time, the background radiance dropsto a lower level and remains at approximately this leveluntil early morning on 7 December, when the lava lakebecame obscured by cloud. The thermal anomaly decays tobackground between 8 December and 15 December.
This pattern in the long timescale variation in the thermalanomaly could be due to changes in lava lake height (andtherefore occlusion by the rim), changes in lava lake area,surface temperature distribution, Strombolian activity, over-flows or renewal of activity in the solidified northern lake.Comparison with ground observations allows us to discrimi-nate between these possibilities. From field observations, weknow the period over which the lake level rose from the formerposition of ∼20 m below the rim to the surface, and thiscorresponds with a period of steadily increasing backgroundradiance. The final area of the lava lake at high stand is alsosimilar to the initial area (∼500 m2). We therefore infer that thelong timescale variation in radiance is primarily a function ofvarying degrees of occlusion of a lava lake of a roughlyconstant area as a result of changes in lake height, rather thana variation in total lake area as a result of increasing width withheight within the pit, or freezing of the margins of the lake.
Radiance spikes during the period of ground observationscorrelate with overflows and collapses, while a steady low-level radiance anomaly between spikes correlates with back-ground lake activity. The sampling interval of 15 min isinsufficient to resolve the observed 20-min variation in lakeheight. We therefore interpret the radiance spikes as over-flows, as the lava lake progressively builds itself up by firstepisodically flooding the pit, and then constructing thescoria ramparts by successive overflows and spatter (seeFig. 2e, f).
Petrology
Method
Three samples were collected for analysis: EA001 collectedfrom the margin of the first overflow onto the main craterfloor (Figs. 1 and 3a) and sampled approximately 12 h afteremplacement; EA002 collected from the main crater floor(most likely erupted in 1973), i.e. the flow underlying thenewly erupted flows; and EA003 from the last overflowobserved by the field team, collected <1 h after emplace-ment. Whole rock major and trace elements were analysedby X-ray fluorescence (XRF) using fused glass discs andpressed powder pellets, on a PANalytical Axios-AdvancedXRF spectrometer at Leicester University.
Polished thin sections were carbon-coated and imaged ona Hitachi S-3500N scanning electron microscope (SEM)prior to major element analysis using a CAMECA SX-100electron microprobe (EMP) instrument at the University ofBristol. A 15-kV accelerating voltage, 4-nA beam currentand defocused 10-μm beam were used for matrix glassesand feldspars, and 20-kV accelerating voltage, 10-nA beamcurrent and a focused beam (1 μm) for olivines and cpx(clinopyroxene). A minimum of six analyses per phase weremeasured in each thin section.
Olivine crystals were handpicked from a crushed sample ofEA003. The samples lose their glassy appearance towards thecentre of the flow, and the matrix becomes dull more than ∼2-cm depth from the surface. Phenocrysts picked for analysiswere taken from the rapidly cooled, glassy upper 2 cm of thesamples, mounted in resin and cold-cured for 2 weeks prior topolishing. Petrographic observation ensured all mountedgrains contained melt inclusions (Fig. 3e). These were exam-ined and mapped on the SEM uncoated, under variable vac-uum, to minimise carbon contamination. Any melt inclusionsthat showed obvious signs of post-entrapment crystallisation,fractures or re-entrants were rejected. All melt inclusionswere bubble-free. Eleven spot analyses from five separatemelt inclusions were made, analysing for CO2, H2O and anumber of trace elements by secondary ion mass spec-trometry (SIMS) using a Cameca ims4f instrument at the
Bull Volcanol (2012) 74:2251–2271 2257
University of Edinburgh Ion Microprobe Facility. Twoanalyses of matrix glass were made for CO2 and H2O.We used a 10-kV (nominal) O− primary beam and4,500 eV positive secondary ions with offset applied toreduce transmission of molecular ions. To enhance relief,grain mounts were polished with 0.3-μm alumina for 30 sprior to gold coating. CO2 (12C+) was determined first atsufficient mass resolution (∼1,600) to separate 24Mg2+
from 12C+ because both ions have the same mass-to-charge ratio. A 5-nA primary beam, with a 15-μm focusedspot was used, with 50 eV offset. Twenty-five- and twohundred fifty-micrometre lenses were activated to give a60-μm image field with field aperture No. 2 providing a∼15–20-μm restricted central area for analysis. Entranceslits were set at ∼110 (entrance) and 112 (exit). A 2-minpre-sputter with a 15-μm raster removed surface contam-ination prior to using a static spot for analysis. For sub-sequent H2O and trace element determinations, a 5-nAprimary beam with 75 eV offset and 30 s pre-sputterwas focused in the same location as the CO2 analysis.Secondary ions of 1H+, 9Be+, 11B+, 12C2+, 24Mg2+, 26Mg+,30Si+, 42Ca+, 44Ca+, 45Sc+, 47Ti+, 88Sr+, 89Y+, 90Zr+, 93Nb+,138Ba+, 139La+, 140Ce+, 141Pr+, 143Nd+, 149Sm+, 159Tb+,161Dy+, 165Ho+, 166Er+, 171Yb+, 178Hf+, 181Ta+, 232Th+
and 238U+ were collected at low mass resolution, with a25-μm image field and field aperture No. 2 providing∼10 μm area of analysis. Calibration and secondary stand-ards included a range of glasses of known trace element,H2O and CO2 values (basaltic glasses of Shishkina et al.(2010), BCR2g, TPA, TPF, SRM610 and CFD), togetherwith an olivine crystal from Erta Ale as a monitor ofbackground consistency.
Mid-IR spectra for H2O and CO2 were obtained at Bristolusing a Nicolet Nexus 670 FTIR spectrometer with an IRPLAN microscope attachment, Globar source, KBr beams-plitter and MCT detector (512 scans at 8-cm−1 resolution).Double-polished plates of around 50-μm thickness wereprepared and measured with Mitutoyo Digital Micrometerto ±1 μm. This thickness allowed an 80-μm beam to passthrough the melt inclusions (or the matrix glass) uninter-rupted. Spectra were compared to a volatile-free basalt toestimate peak heights, and these were converted to concen-trations using extinction coefficients of 63 Lmol−1cm−1 forwater at 3,550 cm−1 and 375 Lmol−1cm−1 for one of thecarbonate doublet peaks at 1,375 cm−1 (from Dixon et al.(1988) and Fine and Stolper (1986), respectively). Theerrors in the measured IR peak intensities (due to back-ground subtraction), the extinction coefficient, the thicknessmeasurement and the density estimate lead to an uncertaintyof about ±20 % for water and ±35 % for CO2 in theinclusions. For the matrix glass, the CO2 peak is not visible,suggesting it is below the detection limit of ∼50 ppm for thissample thickness.
Major elements were determined quantitatively by EMPAon the same melt inclusions previously analysed by SIMS andon phenocryst minerals. High precision S and Cl concentra-tion were also determined for matrix glass, one melt inclusion(J), and two small, previously unanalysed melt inclusionsusing two spectrometers for each element to increase totalcounts. The peak count was 120 s on each spectrometer. Thespectrometers were calibrated using BCR2 [Basaltic glass,Columbia River (Wilson 1997)]. Oxygen was calculated bystoichiometry, and weight percent oxide totals for SO2 arereported. Kα X-ray intensity maps for phosphorous, Ca andFe in olivine phenocrysts in EA001 were obtained in twostages. The first mapped P and Fewith a 256×256 pixel imageand dwell time of 100 ms per pixel. A second run at higherresolution used dwell times of 200 ms per pixel and a 512×512 pixel image, imaging P and Ca. For both runs, a beamcurrent of 400 nA, an accelerating voltage of 20 kVand beamdiameter of 1 μmwas used. Phosphorous was mapped on fourof the five spectrometers in both cases, and the final imageswere summed.
Results
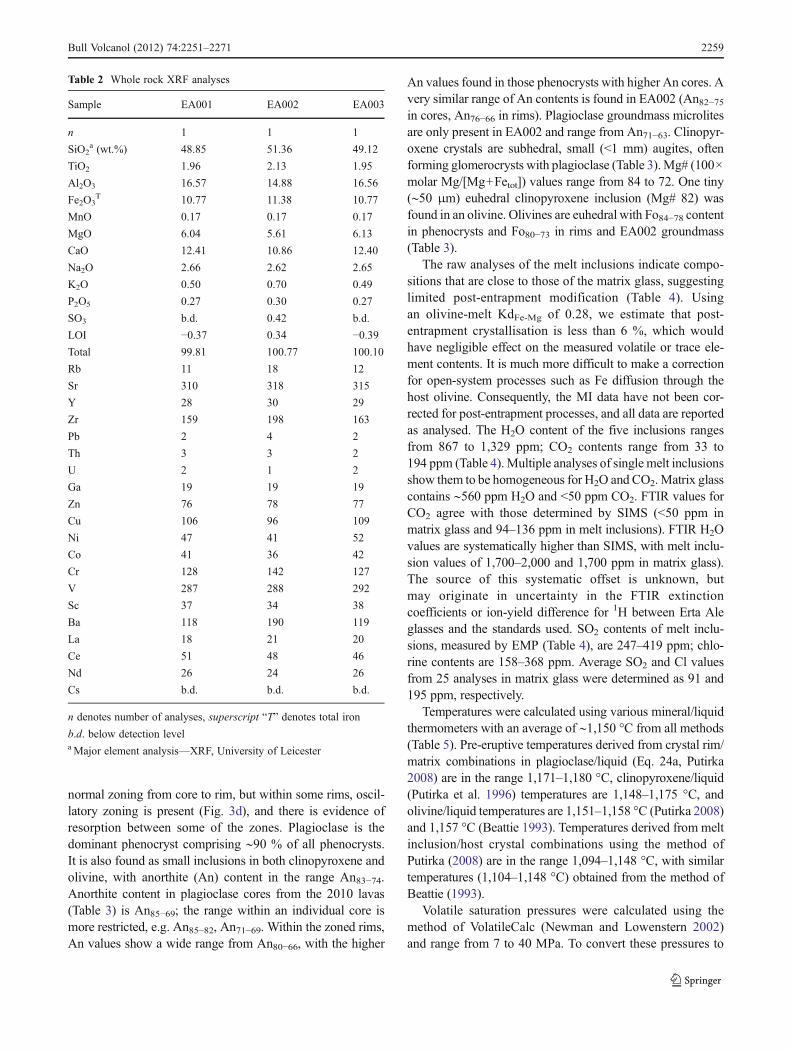
The lavas are porphyritic (∼20 % by volume) and vesicle-rich (up to 60 % volume in EA003, calculated by pointcounting; see Fig. 3b), and can be classified chemically astransitional basalts (Irvine and Baragar 1971). There aresurprisingly few published chemical analyses of basaltsfrom Erta Ale volcano. To our knowledge, the only pub-lished values come from Barberi et al. (1974) and Bizouardet al. (1980) who present only major elements on twosamples from Erta Ale volcano (one from the summit craterwall, and one from a western flank fissure) and Barrat et al.(1998) who present major and trace elements of four sam-ples from the volcano. The 2010 lavas (EA001 and EA003)are olivine-normative, whereas the older underlying lava(EA002: most likely from the 1973 eruption) is quartz-normative (Table 2). The sample taken from the underlyinglava has a higher silica content than the 2010 samples,comparable to the Erta Ale sample (F12) analysed byBarberi et al. (1974) from the main crater wall. This suggeststhe recent input to the system of less evolved but chemicallysimilar magma. EA002 also shows significant differences intexture (Fig. 3f); a crystalline groundmass with large glomer-ocrysts of plagioclase, cpx and olivine, compared to thequenched glass matrix and discrete euhedral crystals foundin EA001 and 3 (Fig. 3d, e). The silica contents of the 2010samples are comparable (<50 wt.%) to those of samplesanalysed by Barrat et al. (1998), although the exact localityof those samples has not been ascertained. The mineral as-semblage in the 2010 samples is plagioclase+clinopyroxene+olivine. No oxides or other accessory phases are present in anysample. Euhedral plagioclase phenocrysts, up to 4 mm, show
2258 Bull Volcanol (2012) 74:2251–2271
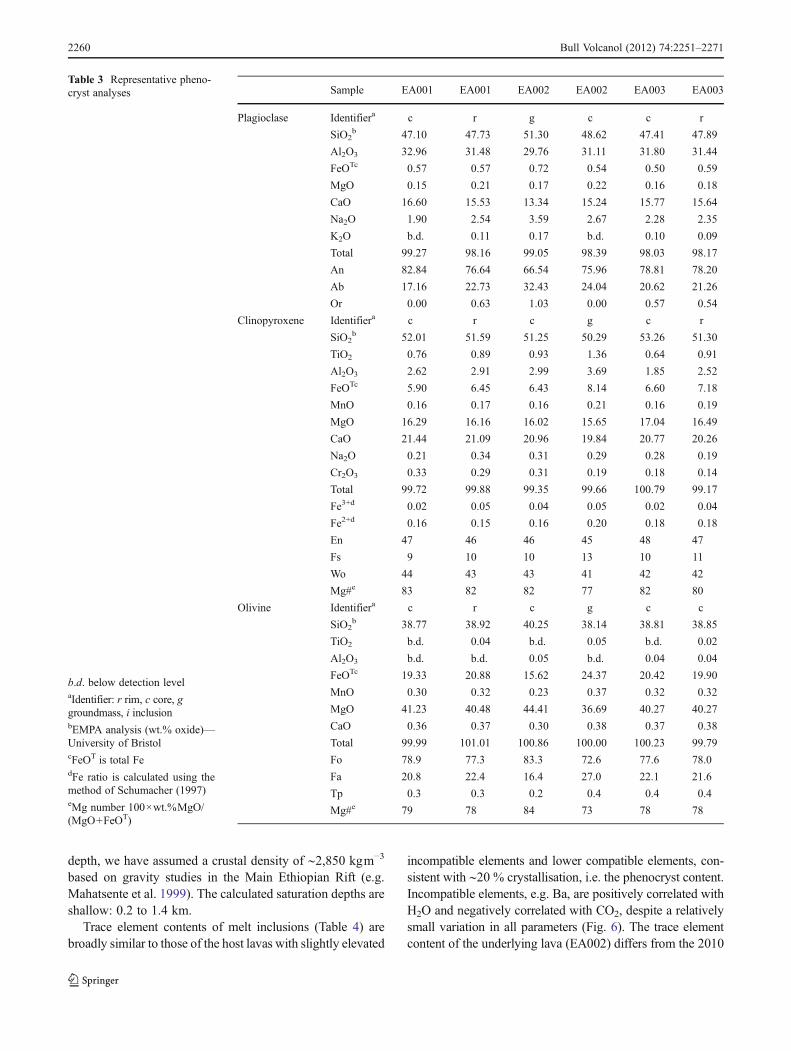
normal zoning from core to rim, but within some rims, oscil-latory zoning is present (Fig. 3d), and there is evidence ofresorption between some of the zones. Plagioclase is thedominant phenocryst comprising ∼90 % of all phenocrysts.It is also found as small inclusions in both clinopyroxene andolivine, with anorthite (An) content in the range An83−74.Anorthite content in plagioclase cores from the 2010 lavas(Table 3) is An85−69; the range within an individual core ismore restricted, e.g. An85−82, An71−69. Within the zoned rims,An values show a wide range from An80−66, with the higher
An values found in those phenocrysts with higher An cores. Avery similar range of An contents is found in EA002 (An82−75in cores, An76−66 in rims). Plagioclase groundmass microlitesare only present in EA002 and range from An71−63. Clinopyr-oxene crystals are subhedral, small (<1 mm) augites, oftenforming glomerocrysts with plagioclase (Table 3).Mg# (100×molar Mg/[Mg+Fetot]) values range from 84 to 72. One tiny(∼50 μm) euhedral clinopyroxene inclusion (Mg# 82) wasfound in an olivine. Olivines are euhedral with Fo84−78 contentin phenocrysts and Fo80−73 in rims and EA002 groundmass(Table 3).
The raw analyses of the melt inclusions indicate compo-sitions that are close to those of the matrix glass, suggestinglimited post-entrapment modification (Table 4). Usingan olivine-melt KdFe-Mg of 0.28, we estimate that post-entrapment crystallisation is less than 6 %, which wouldhave negligible effect on the measured volatile or trace ele-ment contents. It is much more difficult to make a correctionfor open-system processes such as Fe diffusion through thehost olivine. Consequently, the MI data have not been cor-rected for post-entrapment processes, and all data are reportedas analysed. The H2O content of the five inclusions rangesfrom 867 to 1,329 ppm; CO2 contents range from 33 to194 ppm (Table 4).Multiple analyses of single melt inclusionsshow them to be homogeneous for H2O and CO2.Matrix glasscontains ∼560 ppm H2O and <50 ppm CO2. FTIR values forCO2 agree with those determined by SIMS (<50 ppm inmatrix glass and 94–136 ppm in melt inclusions). FTIR H2Ovalues are systematically higher than SIMS, with melt inclu-sion values of 1,700–2,000 and 1,700 ppm in matrix glass).The source of this systematic offset is unknown, butmay originate in uncertainty in the FTIR extinctioncoefficients or ion-yield difference for 1H between Erta Aleglasses and the standards used. SO2 contents of melt inclu-sions, measured by EMP (Table 4), are 247–419 ppm; chlo-rine contents are 158–368 ppm. Average SO2 and Cl valuesfrom 25 analyses in matrix glass were determined as 91 and195 ppm, respectively.
Temperatures were calculated using various mineral/liquidthermometers with an average of ∼1,150 °C from all methods(Table 5). Pre-eruptive temperatures derived from crystal rim/matrix combinations in plagioclase/liquid (Eq. 24a, Putirka2008) are in the range 1,171–1,180 °C, clinopyroxene/liquid(Putirka et al. 1996) temperatures are 1,148–1,175 °C, andolivine/liquid temperatures are 1,151–1,158 °C (Putirka 2008)and 1,157 °C (Beattie 1993). Temperatures derived from meltinclusion/host crystal combinations using the method ofPutirka (2008) are in the range 1,094–1,148 °C, with similartemperatures (1,104–1,148 °C) obtained from the method ofBeattie (1993).
Volatile saturation pressures were calculated using themethod of VolatileCalc (Newman and Lowenstern 2002)and range from 7 to 40 MPa. To convert these pressures to
Table 2 Whole rock XRF analyses
Sample EA001 EA002 EA003
n 1 1 1
SiO2a (wt.%) 48.85 51.36 49.12
TiO2 1.96 2.13 1.95
Al2O3 16.57 14.88 16.56
Fe2O3T 10.77 11.38 10.77
MnO 0.17 0.17 0.17
MgO 6.04 5.61 6.13
CaO 12.41 10.86 12.40
Na2O 2.66 2.62 2.65
K2O 0.50 0.70 0.49
P2O5 0.27 0.30 0.27
SO3 b.d. 0.42 b.d.
LOI −0.37 0.34 −0.39
Total 99.81 100.77 100.10
Rb 11 18 12
Sr 310 318 315
Y 28 30 29
Zr 159 198 163
Pb 2 4 2
Th 3 3 2
U 2 1 2
Ga 19 19 19
Zn 76 78 77
Cu 106 96 109
Ni 47 41 52
Co 41 36 42
Cr 128 142 127
V 287 288 292
Sc 37 34 38
Ba 118 190 119
La 18 21 20
Ce 51 48 46
Nd 26 24 26
Cs b.d. b.d. b.d.
n denotes number of analyses, superscript “T” denotes total iron
b.d. below detection levelaMajor element analysis—XRF, University of Leicester
Bull Volcanol (2012) 74:2251–2271 2259
depth, we have assumed a crustal density of ∼2,850 kgm−3
based on gravity studies in the Main Ethiopian Rift (e.g.Mahatsente et al. 1999). The calculated saturation depths areshallow: 0.2 to 1.4 km.
Trace element contents of melt inclusions (Table 4) arebroadly similar to those of the host lavas with slightly elevated
incompatible elements and lower compatible elements, con-sistent with ∼20 % crystallisation, i.e. the phenocryst content.Incompatible elements, e.g. Ba, are positively correlated withH2O and negatively correlated with CO2, despite a relativelysmall variation in all parameters (Fig. 6). The trace elementcontent of the underlying lava (EA002) differs from the 2010
Table 3 Representative pheno-cryst analyses
b.d. below detection levelaIdentifier: r rim, c core, ggroundmass, i inclusionbEMPA analysis (wt.% oxide)—University of BristolcFeOT is total FedFe ratio is calculated using themethod of Schumacher (1997)eMg number 100×wt.%MgO/(MgO+FeOT)
Sample EA001 EA001 EA002 EA002 EA003 EA003
Plagioclase Identifiera c r g c c r
SiO2b 47.10 47.73 51.30 48.62 47.41 47.89
Al2O3 32.96 31.48 29.76 31.11 31.80 31.44
FeOTc 0.57 0.57 0.72 0.54 0.50 0.59
MgO 0.15 0.21 0.17 0.22 0.16 0.18
CaO 16.60 15.53 13.34 15.24 15.77 15.64
Na2O 1.90 2.54 3.59 2.67 2.28 2.35
K2O b.d. 0.11 0.17 b.d. 0.10 0.09
Total 99.27 98.16 99.05 98.39 98.03 98.17
An 82.84 76.64 66.54 75.96 78.81 78.20
Ab 17.16 22.73 32.43 24.04 20.62 21.26
Or 0.00 0.63 1.03 0.00 0.57 0.54
Clinopyroxene Identifiera c r c g c r
SiO2b 52.01 51.59 51.25 50.29 53.26 51.30
TiO2 0.76 0.89 0.93 1.36 0.64 0.91
Al2O3 2.62 2.91 2.99 3.69 1.85 2.52
FeOTc 5.90 6.45 6.43 8.14 6.60 7.18
MnO 0.16 0.17 0.16 0.21 0.16 0.19
MgO 16.29 16.16 16.02 15.65 17.04 16.49
CaO 21.44 21.09 20.96 19.84 20.77 20.26
Na2O 0.21 0.34 0.31 0.29 0.28 0.19
Cr2O3 0.33 0.29 0.31 0.19 0.18 0.14
Total 99.72 99.88 99.35 99.66 100.79 99.17
Fe3+d 0.02 0.05 0.04 0.05 0.02 0.04
Fe2+d 0.16 0.15 0.16 0.20 0.18 0.18
En 47 46 46 45 48 47
Fs 9 10 10 13 10 11
Wo 44 43 43 41 42 42
Mg#e 83 82 82 77 82 80
Olivine Identifiera c r c g c c
SiO2b 38.77 38.92 40.25 38.14 38.81 38.85
TiO2 b.d. 0.04 b.d. 0.05 b.d. 0.02
Al2O3 b.d. b.d. 0.05 b.d. 0.04 0.04
FeOTc 19.33 20.88 15.62 24.37 20.42 19.90
MnO 0.30 0.32 0.23 0.37 0.32 0.32
MgO 41.23 40.48 44.41 36.69 40.27 40.27
CaO 0.36 0.37 0.30 0.38 0.37 0.38
Total 99.99 101.01 100.86 100.00 100.23 99.79
Fo 78.9 77.3 83.3 72.6 77.6 78.0
Fa 20.8 22.4 16.4 27.0 22.1 21.6
Tp 0.3 0.3 0.2 0.4 0.4 0.4
Mg#e 79 78 84 73 78 78
2260 Bull Volcanol (2012) 74:2251–2271
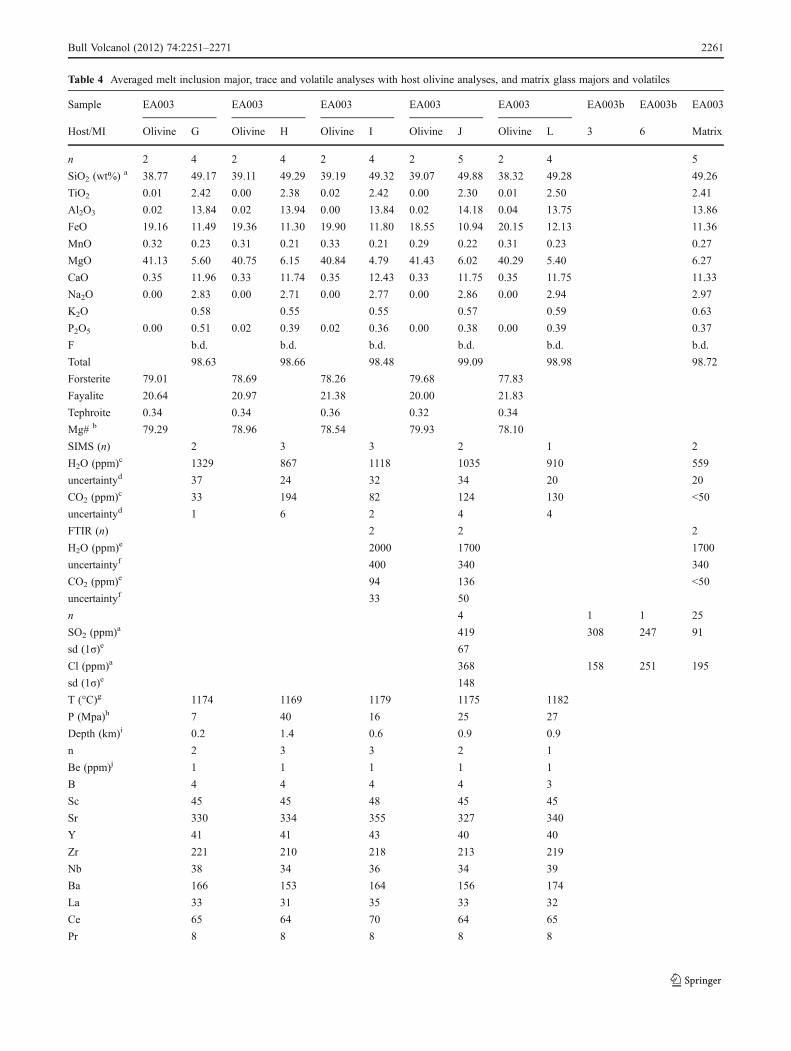
Table 4 Averaged melt inclusion major, trace and volatile analyses with host olivine analyses, and matrix glass majors and volatiles
Sample EA003 EA003 EA003 EA003 EA003 EA003b EA003b EA003
Host/MI Olivine G Olivine H Olivine I Olivine J Olivine L 3 6 Matrix
n 2 4 2 4 2 4 2 5 2 4 5
SiO2 (wt%) a 38.77 49.17 39.11 49.29 39.19 49.32 39.07 49.88 38.32 49.28 49.26
TiO2 0.01 2.42 0.00 2.38 0.02 2.42 0.00 2.30 0.01 2.50 2.41
Al2O3 0.02 13.84 0.02 13.94 0.00 13.84 0.02 14.18 0.04 13.75 13.86
FeO 19.16 11.49 19.36 11.30 19.90 11.80 18.55 10.94 20.15 12.13 11.36
MnO 0.32 0.23 0.31 0.21 0.33 0.21 0.29 0.22 0.31 0.23 0.27
MgO 41.13 5.60 40.75 6.15 40.84 4.79 41.43 6.02 40.29 5.40 6.27
CaO 0.35 11.96 0.33 11.74 0.35 12.43 0.33 11.75 0.35 11.75 11.33
Na2O 0.00 2.83 0.00 2.71 0.00 2.77 0.00 2.86 0.00 2.94 2.97
K2O 0.58 0.55 0.55 0.57 0.59 0.63
P2O5 0.00 0.51 0.02 0.39 0.02 0.36 0.00 0.38 0.00 0.39 0.37
F b.d. b.d. b.d. b.d. b.d. b.d.
Total 98.63 98.66 98.48 99.09 98.98 98.72
Forsterite 79.01 78.69 78.26 79.68 77.83
Fayalite 20.64 20.97 21.38 20.00 21.83
Tephroite 0.34 0.34 0.36 0.32 0.34
Mg# b 79.29 78.96 78.54 79.93 78.10
SIMS (n) 2 3 3 2 1 2
H2O (ppm)c 1329 867 1118 1035 910 559
uncertaintyd 37 24 32 34 20 20
CO2 (ppm)c 33 194 82 124 130 <50
uncertaintyd 1 6 2 4 4
FTIR (n) 2 2 2
H2O (ppm)e 2000 1700 1700
uncertaintyf 400 340 340
CO2 (ppm)e 94 136 <50
uncertaintyf 33 50
n 4 1 1 25
SO2 (ppm)a 419 308 247 91
sd (1σ)e 67
Cl (ppm)a 368 158 251 195
sd (1σ)e 148
T (°C)g 1174 1169 1179 1175 1182
P (Mpa)h 7 40 16 25 27
Depth (km)i 0.2 1.4 0.6 0.9 0.9
n 2 3 3 2 1
Be (ppm)j 1 1 1 1 1
B 4 4 4 4 3
Sc 45 45 48 45 45
Sr 330 334 355 327 340
Y 41 41 43 40 40
Zr 221 210 218 213 219
Nb 38 34 36 34 39
Ba 166 153 164 156 174
La 33 31 35 33 32
Ce 65 64 70 64 65
Pr 8 8 8 8 8
Bull Volcanol (2012) 74:2251–2271 2261
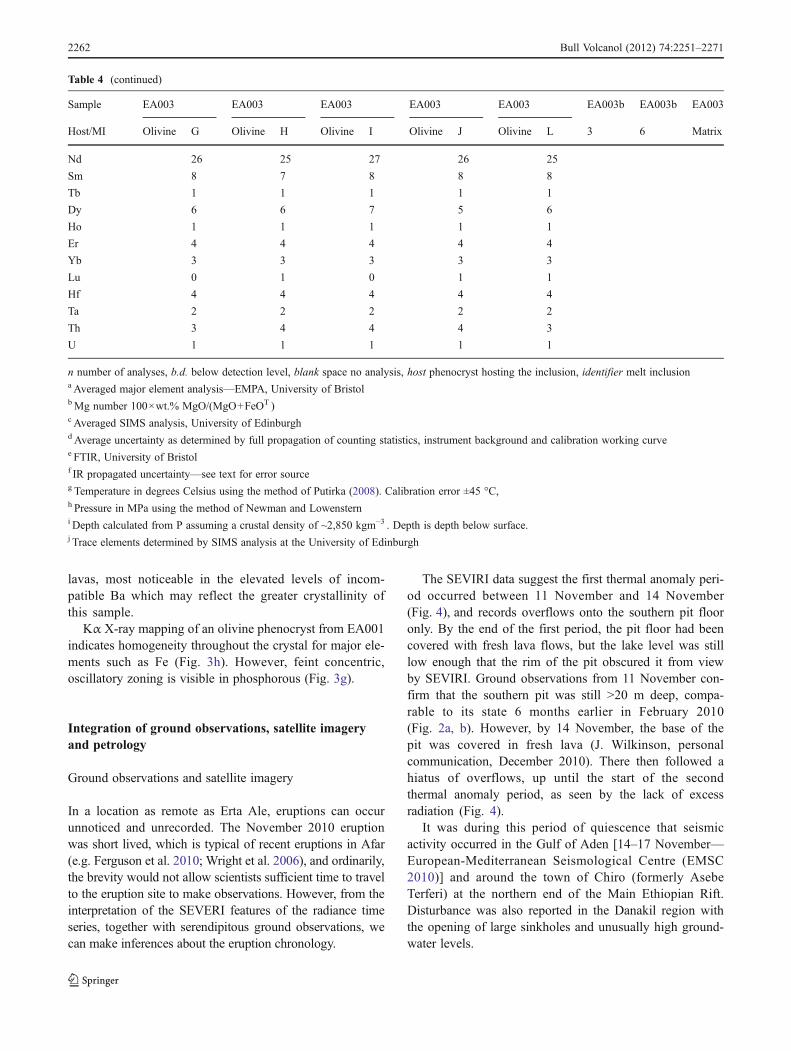
lavas, most noticeable in the elevated levels of incom-patible Ba which may reflect the greater crystallinity ofthis sample.
Kα X-ray mapping of an olivine phenocryst from EA001indicates homogeneity throughout the crystal for major ele-ments such as Fe (Fig. 3h). However, feint concentric,oscillatory zoning is visible in phosphorous (Fig. 3g).
Integration of ground observations, satellite imageryand petrology
Ground observations and satellite imagery
In a location as remote as Erta Ale, eruptions can occurunnoticed and unrecorded. The November 2010 eruptionwas short lived, which is typical of recent eruptions in Afar(e.g. Ferguson et al. 2010; Wright et al. 2006), and ordinarily,the brevity would not allow scientists sufficient time to travelto the eruption site to make observations. However, from theinterpretation of the SEVERI features of the radiance timeseries, together with serendipitous ground observations, wecan make inferences about the eruption chronology.
The SEVIRI data suggest the first thermal anomaly peri-od occurred between 11 November and 14 November(Fig. 4), and records overflows onto the southern pit flooronly. By the end of the first period, the pit floor had beencovered with fresh lava flows, but the lake level was stilllow enough that the rim of the pit obscured it from viewby SEVIRI. Ground observations from 11 November con-firm that the southern pit was still >20 m deep, compa-rable to its state 6 months earlier in February 2010(Fig. 2a, b). However, by 14 November, the base of thepit was covered in fresh lava (J. Wilkinson, personalcommunication, December 2010). There then followed ahiatus of overflows, up until the start of the secondthermal anomaly period, as seen by the lack of excessradiation (Fig. 4).
It was during this period of quiescence that seismicactivity occurred in the Gulf of Aden [14–17 November—European-Mediterranean Seismological Centre (EMSC2010)] and around the town of Chiro (formerly AsebeTerferi) at the northern end of the Main Ethiopian Rift.Disturbance was also reported in the Danakil region withthe opening of large sinkholes and unusually high ground-water levels.
Table 4 (continued)
Sample EA003 EA003 EA003 EA003 EA003 EA003b EA003b EA003
Host/MI Olivine G Olivine H Olivine I Olivine J Olivine L 3 6 Matrix
Nd 26 25 27 26 25
Sm 8 7 8 8 8
Tb 1 1 1 1 1
Dy 6 6 7 5 6
Ho 1 1 1 1 1
Er 4 4 4 4 4
Yb 3 3 3 3 3
Lu 0 1 0 1 1
Hf 4 4 4 4 4
Ta 2 2 2 2 2
Th 3 4 4 4 3
U 1 1 1 1 1
n number of analyses, b.d. below detection level, blank space no analysis, host phenocryst hosting the inclusion, identifier melt inclusiona Averaged major element analysis—EMPA, University of BristolbMg number 100×wt.% MgO/(MgO+FeOT )c Averaged SIMS analysis, University of Edinburghd Average uncertainty as determined by full propagation of counting statistics, instrument background and calibration working curvee FTIR, University of Bristolf IR propagated uncertainty—see text for error sourceg Temperature in degrees Celsius using the method of Putirka (2008). Calibration error ±45 °C,h Pressure in MPa using the method of Newman and Lowensterni Depth calculated from P assuming a crustal density of ~2,850 kgm−3 . Depth is depth below surface.j Trace elements determined by SIMS analysis at the University of Edinburgh
2262 Bull Volcanol (2012) 74:2251–2271
The field team arrived at ∼1600 hours UTC on 21November when the second phase of the eruption waswell underway, and the southern pit had filled. SEVERIimaging suggests this second phase of activity began during19 November, which indicates a rapid infilling of the southernpit between the 19th and 21st (Figs. 2 and 4). Assuming littleor no activity between 15 and 19 November, a flow rate ofapproximately 2 m3s−1 would be required to fill the area of thepit between 19 and 21 November (53 h). Oppenheimer andFrancis (1997) estimated an average magma discharge rate(MDR) of ∼400 kgs−1 for February 1972–March 1973.Assuming the same density for comparison (2,700 kgm−3), the calculated MDR for 19–21 November is∼5,600 kgs−1. The first overspill outside of the southernpit onto the main crater floor occurred at ∼1750 hours UTC(Fig. 3a). Throughout the eruption, the lake was surroundedby a scoria ring cone which continued to build, similar to thatobserved in 1973 (Tazieff. 1973). Overspills continued atapproximately 2-h intervals until ∼1430 hours UTC on 22November (Supplementary Video 1).
For the remainder of the ground observations, the lakewas contained within the scoria ring, which had grown to
∼4 m high by 0300 hours UTC on 23 November. A 20-mincycle followed, with lava lake levels rising and fallingby >4 m, during which, peak levels were marked byStrombolian activity. The northern part of the ring suf-fered a partial collapse on the morning of 23 November,which corresponds to a sharp peak at 0400 hours UTC inthe SEVERI imaging (Fig. 4). Periodically, incandescentblue-green gas jets were observed similar in description togas flames reported in January 2003, assumed to be SO2
(Vetsch et al. 2003). The northern pit also showed signs ofactivity with fresh lava flows erupted during the night of21 November.
After the field team departed on 23 November, the erup-tion continued, with new overflows covering over the sam-pled flows, and nearly reaching the western rim of thecaldera (Fig. 1; J. Hammond and J. Wilkinson, personalcommunication). The spacing between successive overflowsbecame long enough that periods of sustained radiance canbe identified, indicating that the lava lake had gained suffi-cient height to come into view of the sensor. SEVERIindicates lake activity persisted with sparse superimposedoverflows for 7 days, followed by a period of sustained lake
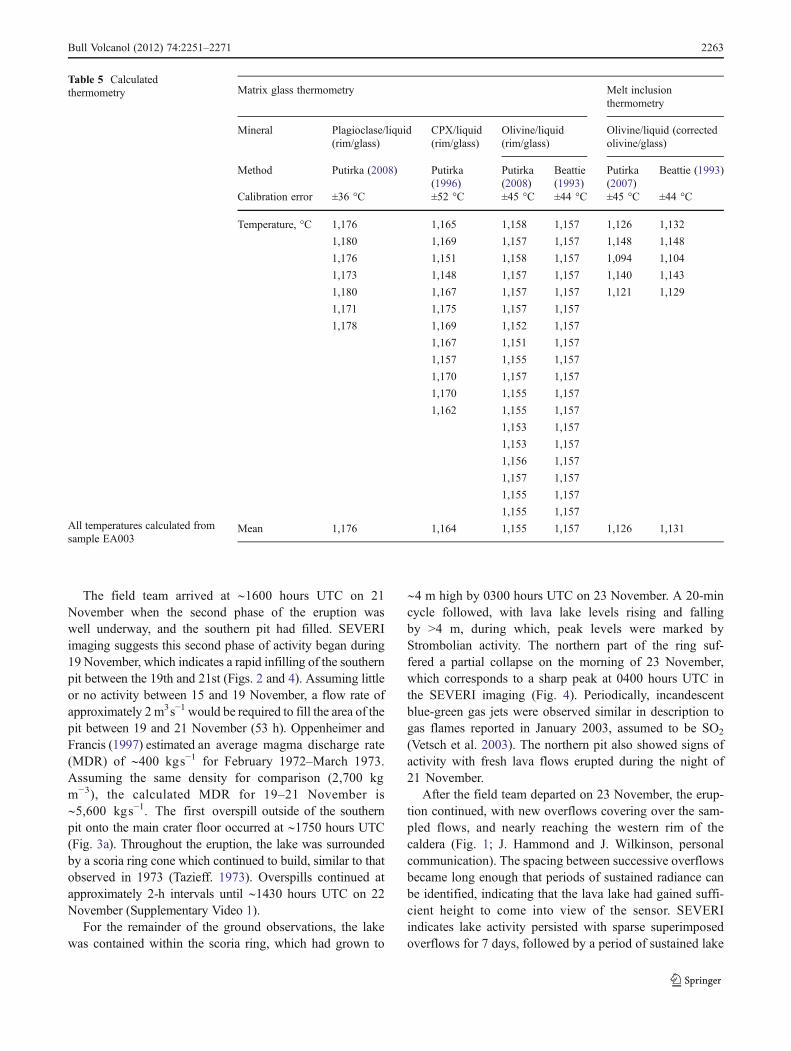
Table 5 Calculatedthermometry
All temperatures calculated fromsample EA003
Matrix glass thermometry Melt inclusionthermometry
Mineral Plagioclase/liquid(rim/glass)
CPX/liquid(rim/glass)
Olivine/liquid(rim/glass)
Olivine/liquid (correctedolivine/glass)
Method Putirka (2008) Putirka(1996)
Putirka(2008)
Beattie(1993)
Putirka(2007)
Beattie (1993)
Calibration error ±36 °C ±52 °C ±45 °C ±44 °C ±45 °C ±44 °C
Temperature, °C 1,176 1,165 1,158 1,157 1,126 1,132
1,180 1,169 1,157 1,157 1,148 1,148
1,176 1,151 1,158 1,157 1,094 1,104
1,173 1,148 1,157 1,157 1,140 1,143
1,180 1,167 1,157 1,157 1,121 1,129
1,171 1,175 1,157 1,157
1,178 1,169 1,152 1,157
1,167 1,151 1,157
1,157 1,155 1,157
1,170 1,157 1,157
1,170 1,155 1,157
1,162 1,155 1,157
1,153 1,157
1,153 1,157
1,156 1,157
1,157 1,157
1,155 1,157
1,155 1,157
Mean 1,176 1,164 1,155 1,157 1,126 1,131
Bull Volcanol (2012) 74:2251–2271 2263
activity with no overflows for 6 days, and within a further4 days, after 30 November, the lake signal disappeared,indicating a drop in lake level and occultation of the lakeby the rim once again. Cloud cover prevents us determiningthe exact end of the eruption, but activity was confirmed tohave ceased prior to 15 December (J. Wilkinson, personalcommunication, December 2010). In summary, the patternappears to be (1) first period of lake level rise, (2) hiatus/dropin lake level, (3) lake level rise including lava overspills intothe southern pit, (4) lake level stabilisation at high standincluding lava overspills into the main crater and (5) lake leveldrop. The estimated total volume of both the erupted surfacelava flows and the volume of lava required to fill the pit fromthe previous level is ∼0.006 km3, based on an estimated pitdepth of 20 m.
Thermometry
There is good agreement between temperatures determinedin February 2001 by Burgi et al. (2002) using thermocou-ples and pyrometers (1,145–1,187 °C), and the petrologicalestimates reported here (1,094–1,180 °C). The temperaturesare within error indicating a temperature for the system of∼1,150 °C, although there are likely to be some fluctuationswithin the conduit caused by magma circulation betweenmagma storage, the conduit and the lake itself (Harris et al.2005). Temperatures determined by Le Guern et al. (1979)in December 1971, January 1973 and 1974 provided a rangeof 1,100 °C through 1,210 °C. The Le Guern field teamdirectly inserted thermocouples into active hornitos, whichmay account for the differences between their study and thestudy of Burgi et al. (2002).
Volatiles
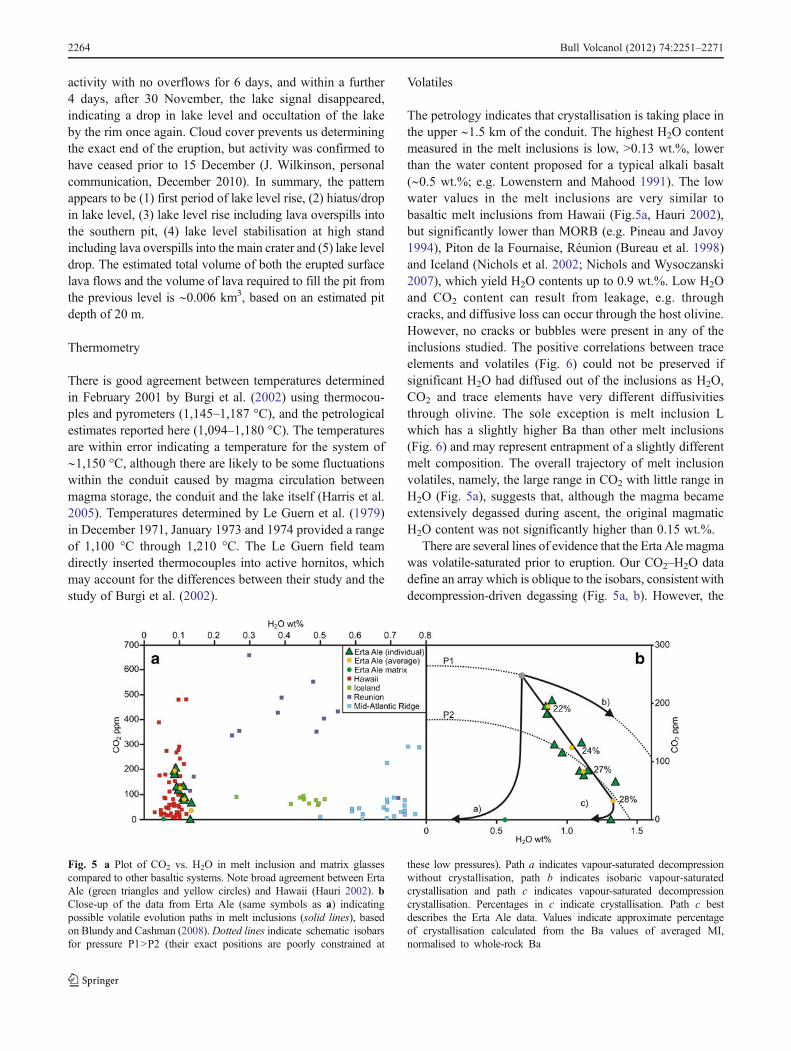
The petrology indicates that crystallisation is taking place inthe upper ∼1.5 km of the conduit. The highest H2O contentmeasured in the melt inclusions is low, >0.13 wt.%, lowerthan the water content proposed for a typical alkali basalt(∼0.5 wt.%; e.g. Lowenstern and Mahood 1991). The lowwater values in the melt inclusions are very similar tobasaltic melt inclusions from Hawaii (Fig.5a, Hauri 2002),but significantly lower than MORB (e.g. Pineau and Javoy1994), Piton de la Fournaise, Réunion (Bureau et al. 1998)and Iceland (Nichols et al. 2002; Nichols and Wysoczanski2007), which yield H2O contents up to 0.9 wt.%. Low H2Oand CO2 content can result from leakage, e.g. throughcracks, and diffusive loss can occur through the host olivine.However, no cracks or bubbles were present in any of theinclusions studied. The positive correlations between traceelements and volatiles (Fig. 6) could not be preserved ifsignificant H2O had diffused out of the inclusions as H2O,CO2 and trace elements have very different diffusivitiesthrough olivine. The sole exception is melt inclusion Lwhich has a slightly higher Ba than other melt inclusions(Fig. 6) and may represent entrapment of a slightly differentmelt composition. The overall trajectory of melt inclusionvolatiles, namely, the large range in CO2 with little range inH2O (Fig. 5a), suggests that, although the magma becameextensively degassed during ascent, the original magmaticH2O content was not significantly higher than 0.15 wt.%.
There are several lines of evidence that the Erta Ale magmawas volatile-saturated prior to eruption. Our CO2–H2O datadefine an array which is oblique to the isobars, consistent withdecompression-driven degassing (Fig. 5a, b). However, the
Fig. 5 a Plot of CO2 vs. H2O in melt inclusion and matrix glassescompared to other basaltic systems. Note broad agreement between ErtaAle (green triangles and yellow circles) and Hawaii (Hauri 2002). bClose-up of the data from Erta Ale (same symbols as a) indicatingpossible volatile evolution paths in melt inclusions (solid lines), basedon Blundy and Cashman (2008). Dotted lines indicate schematic isobarsfor pressure P1>P2 (their exact positions are poorly constrained at
these low pressures). Path a indicates vapour-saturated decompressionwithout crystallisation, path b indicates isobaric vapour-saturatedcrystallisation and path c indicates vapour-saturated decompressioncrystallisation. Percentages in c indicate crystallisation. Path c bestdescribes the Erta Ale data. Values indicate approximate percentageof crystallisation calculated from the Ba values of averaged MI,normalised to whole-rock Ba
2264 Bull Volcanol (2012) 74:2251–2271
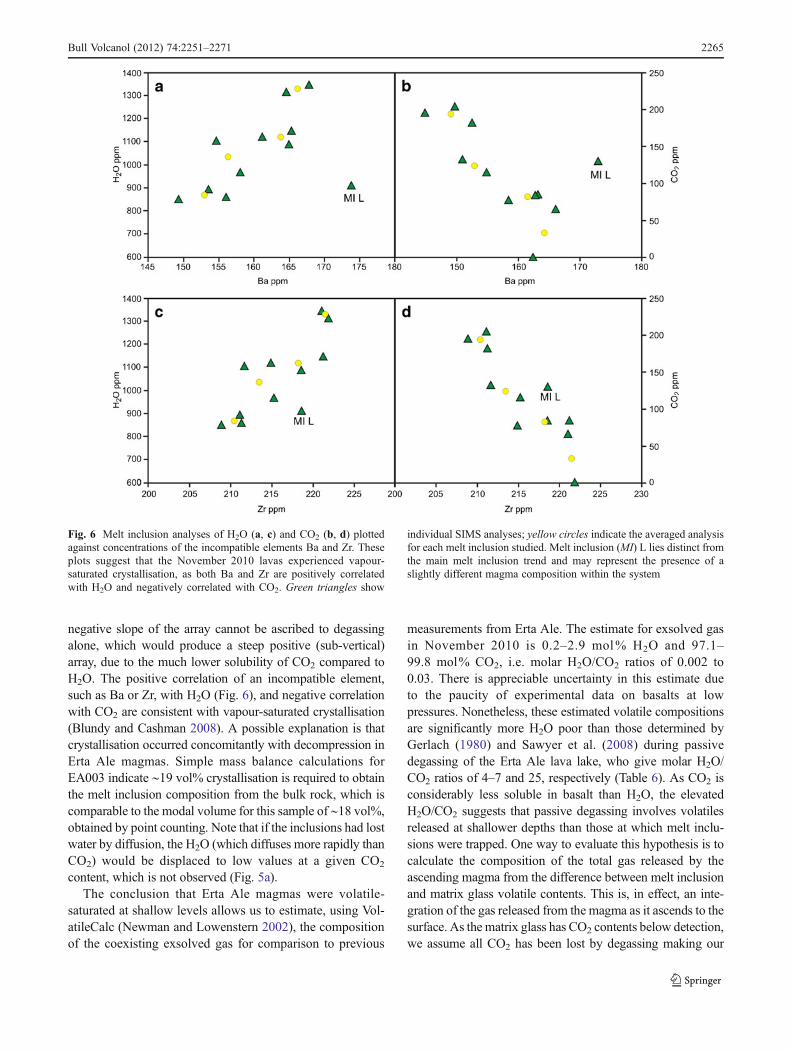
negative slope of the array cannot be ascribed to degassingalone, which would produce a steep positive (sub-vertical)array, due to the much lower solubility of CO2 compared toH2O. The positive correlation of an incompatible element,such as Ba or Zr, with H2O (Fig. 6), and negative correlationwith CO2 are consistent with vapour-saturated crystallisation(Blundy and Cashman 2008). A possible explanation is thatcrystallisation occurred concomitantly with decompression inErta Ale magmas. Simple mass balance calculations forEA003 indicate ∼19 vol% crystallisation is required to obtainthe melt inclusion composition from the bulk rock, which iscomparable to the modal volume for this sample of ∼18 vol%,obtained by point counting. Note that if the inclusions had lostwater by diffusion, the H2O (which diffuses more rapidly thanCO2) would be displaced to low values at a given CO2
content, which is not observed (Fig. 5a).The conclusion that Erta Ale magmas were volatile-
saturated at shallow levels allows us to estimate, using Vol-atileCalc (Newman and Lowenstern 2002), the compositionof the coexisting exsolved gas for comparison to previous
measurements from Erta Ale. The estimate for exsolved gasin November 2010 is 0.2–2.9 mol% H2O and 97.1–99.8 mol% CO2, i.e. molar H2O/CO2 ratios of 0.002 to0.03. There is appreciable uncertainty in this estimate dueto the paucity of experimental data on basalts at lowpressures. Nonetheless, these estimated volatile compositionsare significantly more H2O poor than those determined byGerlach (1980) and Sawyer et al. (2008) during passivedegassing of the Erta Ale lava lake, who give molar H2O/CO2 ratios of 4–7 and 25, respectively (Table 6). As CO2 isconsiderably less soluble in basalt than H2O, the elevatedH2O/CO2 suggests that passive degassing involves volatilesreleased at shallower depths than those at which melt inclu-sions were trapped. One way to evaluate this hypothesis is tocalculate the composition of the total gas released by theascending magma from the difference between melt inclusionand matrix glass volatile contents. This is, in effect, an inte-gration of the gas released from the magma as it ascends to thesurface. As the matrix glass has CO2 contents below detection,we assume all CO2 has been lost by degassing making our
Fig. 6 Melt inclusion analyses of H2O (a, c) and CO2 (b, d) plottedagainst concentrations of the incompatible elements Ba and Zr. Theseplots suggest that the November 2010 lavas experienced vapour-saturated crystallisation, as both Ba and Zr are positively correlatedwith H2O and negatively correlated with CO2. Green triangles show
individual SIMS analyses; yellow circles indicate the averaged analysisfor each melt inclusion studied. Melt inclusion (MI) L lies distinct fromthe main melt inclusion trend and may represent the presence of aslightly different magma composition within the system
Bull Volcanol (2012) 74:2251–2271 2265
H2O/CO2 estimates maxima. Our calculated values for molarH2O/CO2 from individual melt inclusions lie in the range 4–57 with an average for the entire population of 11±7. TheseH2O/CO2 ratios fall within the range determined by Sawyer etal. (2008) and Gerlach (1980). This suggests that the compo-sition of the gas released from the magma is consistent, quan-titatively, with exsolution of pre-eruptive volatiles containedwithin the magma; if a significant population of bubbles ofdeeper, magmatic gas with elevated CO2/H2O was present inthe magma prior to ascent, this would reduce the H2O/CO2
ratio of the gas below the values observed by Sawyer et al.(2008) and Gerlach (1980).
The calculated molar SO2/Cl ratio of the released gas is inthe range 1.0–2.0 (Table 6) compared to 12–19 measured infield studies (Gerlach 1980; Sawyer et al. 2008). As chlorineis the last volatile species to be exsolved from magma, theSO2/Cl ratio is a sensitive indicator of degassing depth(Lesne et al. 2011): higher ratios denote shallower degass-ing. Our low SO2/Cl ratios are consistent with completedegassing upon eruption in November 2010. Conversely,the lava lake gas measurement of Gerlach (1980) andSawyer et al. (2008), which were made at a time when the lavawas contained within the pit and not overflowing into themain crater, likely records a slightly deeper level of degass-ing, probably due to circulation within the conduit, givingrise to higher SO2/Cl ratios. These small changes in degass-ing depth will not have significant effect on the H2O/CO2
ratios, as almost all CO2 is lost prior to the onset of Cldegassing (Lesne et al. 2011). A schematic illustration ofthe Erta Ale shallow plumbing system that is consistentwith the observed differences in gas composition betweeneruptive and non-eruptive (passive) degassing episodes isshown in Fig. 7.
The difference in SO2 contents of melt inclusions andmatrix glass is in the range 160 to 330 ppm (Table 4).
Assuming that the November 2010 magma had a similarcomposition to that in the lava lake in 2005 when studiedby Sawyer et al. (2008), we calculate the total magma fluxthrough the conduit required to sustain their observed SO2
flux (0.69±0.17 kgs−1) to be in the range 2,090±520 to4,310±1,060 kgs−1. A broadly similar magma flux, cal-culated in the same way, can sustain the range of CO2
fluxes measured by Sawyer et al. (2008). However, ahigher flux, by a factor of two, is required to sustain theobserved H2O flux. This mismatch may be rooted in thecombined uncertainties on the analytical and gas measurementdata, or reflect, as suggested above, small differences in thedegassing depths between and during eruptions. Sawyer et al.(2008) noted that the H2O in the volcanic plume had signifi-cantly increased in the 30 years since Gerlach's (1980) work,and suggested this may be related to volatile depletion of thedeep source magma and/or to fractional magma degassing.Alternatively, variation in the H2O content of Erta Ale gasesmay reflect systematic changes in the depth within the conduitat which gases are extracted. In any case, our calculations lendsupport to the idea that the observed gas flux can be providedby near-complete degassing of magma passing through theshallow conduit system at rates of ∼3,000–7,000 kgs−1. Itdoes not appear that any substantial additional source of gas,i.e. gas-fluxing, is required to account for the field measure-ments of gas flux at Erta Ale.
The Erta Ale lavas show a high vesicularity (up to ∼60 %),which may initially seem surprising given the low volatilecontents indicated by the melt inclusions. Using the ideal gaslaw, the average value for lost H2O of 450 ppm (i.e. meltinclusion minus groundmass), a temperature of 1,150 °C,standard atmospheric pressure and an assumed density forbasalt of 2,700 kgm−3 (e.g. Oppenheimer and Francis 1997),a gas volume of 2.92×10⁻³m3 is obtained, ∼8 times more gasthan melt. This indicates that if 10 % degassing were to take
Table 6 Calculated molar gas ratios
This study Sawyer et al. (2008) Gerlach (1980)
Averagea sd EA003Jb sd 2005 sd 1974c 1973d 1973d 1971e
H2O/CO2 (mol) 10.7 7.2 9.4 1.6 24.8 0.8 6.6 3.8 3.7 3.9
CO2/SO2 0.7 0.5 0.5 0.1 1.5 0.1 1.6 2.7 4 2
SO2/Cl 1.9 3.1 1.0 0.6 12.4 0.2 18.6
H2O/SO2 7.1 3.8 5.0 0.8 38 3 10.4 10.4 14.5 7.9
a Average from this study, calculated using melt inclusion minus matrix analysis for each speciesb Example of an individual melt inclusion, calculated using melt inclusion minus matrix analysis for each speciesc Ratios from restored gas analysis (Gerlach 1980) (gases originally collected in 1974 from hornitos by Giggenbach and Le Guern)d Ratios from restored gas analysis (Gerlach 1980) (1973 gases originally collected from a hornito by Le Guern)e Ratios from restored gas analysis (Gerlach 1980) (1971 samples originally collected by Tazieff)
2266 Bull Volcanol (2012) 74:2251–2271
place, ∼40 % vesicularity would result, and 20 % degass-ing would result in ∼60 % vesicularity. Thus, releasing<448 ppm gas at, or close to, the surface at the eruptiontemperature is sufficient to generate the observed high vesic-ularities. Melt inclusion volatile data are also not suggestive ofthe presence of significant pre-eruptive bubbles in the magmaduring passive degassing episodes (see above). However,we cannot rule out the possibility that an influx of addi-tional gas drove the Strombolian activity observed in 2010.We have no field measurements of this degassing episode withwhich to test our hypothesis, but it does seem likely that anadditional gas source was required to sustain the observederuptive vigour.
During eruption, the viscosity of the lava appeared to bevery low (Supplementary Video 1). The calculated viscosity ofthe melt at eruption temperature using the model of Giordanoet al. (2008) is 70 Pas. The small fraction of crystals (∼18 vol%in EA003) is unlikely to have had any major impact on theviscosity (Caricchi et al. 2007). However, the vesicularitywould have had a greater effect. The vesicles observed in theErta Ale samples are highly elongate, which would haveresulted in a lowering of viscosity, whilst spherical vesicleswould instead have acted like phenocrysts to raise the viscosity(Llewellin and Manga 2005). Consequently, the calculatedviscosity of the vesicular magma is reduced to 5 Pas (Pal2003) or 15 Pas (Llewellin and Manga 2005).
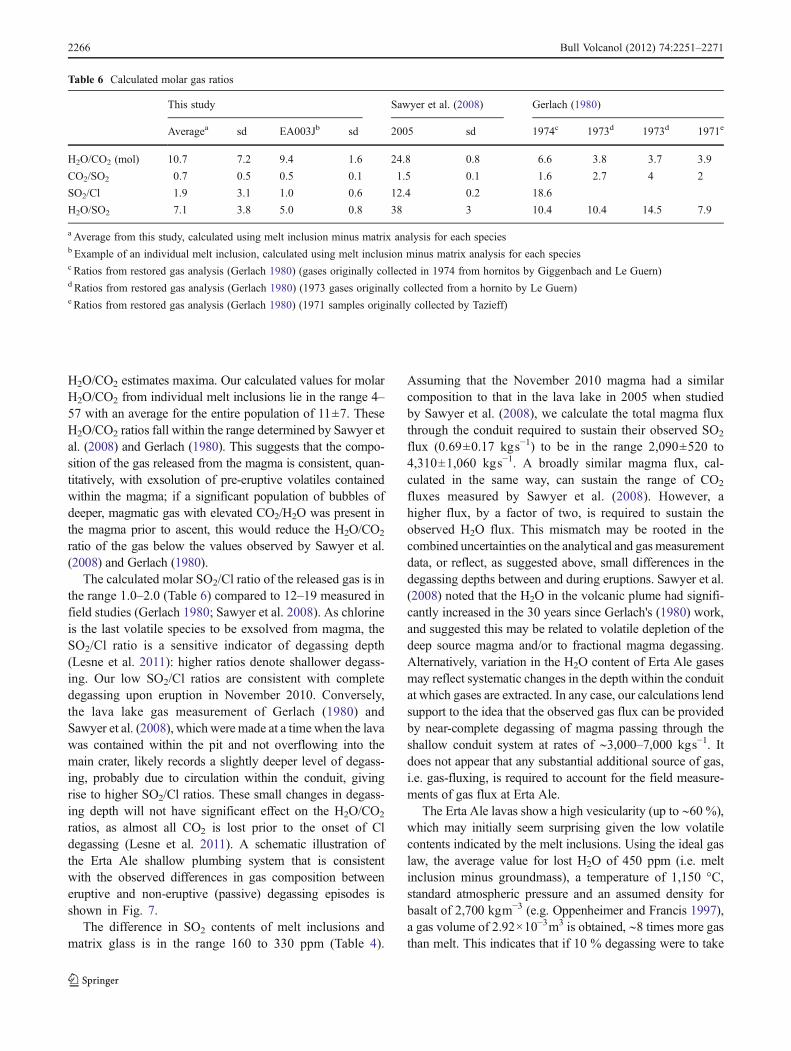
Fig. 7 Schematic of the Erta Ale shallow plumbing system in Novem-ber 2010 based on integrated ground and satellite observations andpetrology (not to scale). The arrows on the right hand side illustratehow gas extraction from different depths influences gas composition,with elevated Cl characteristic of very shallow degassing. Passive
degassing does not appear to require an additional source of gas toexplain the measured gas chemistry; it is sufficient that magma ascendsfrom the storage region to the lake itself releasing its volatiles en-route.However, it is possible that vigorous Strombolian activity is triggeredby the ascent of large bubbles from depth as shown schematically
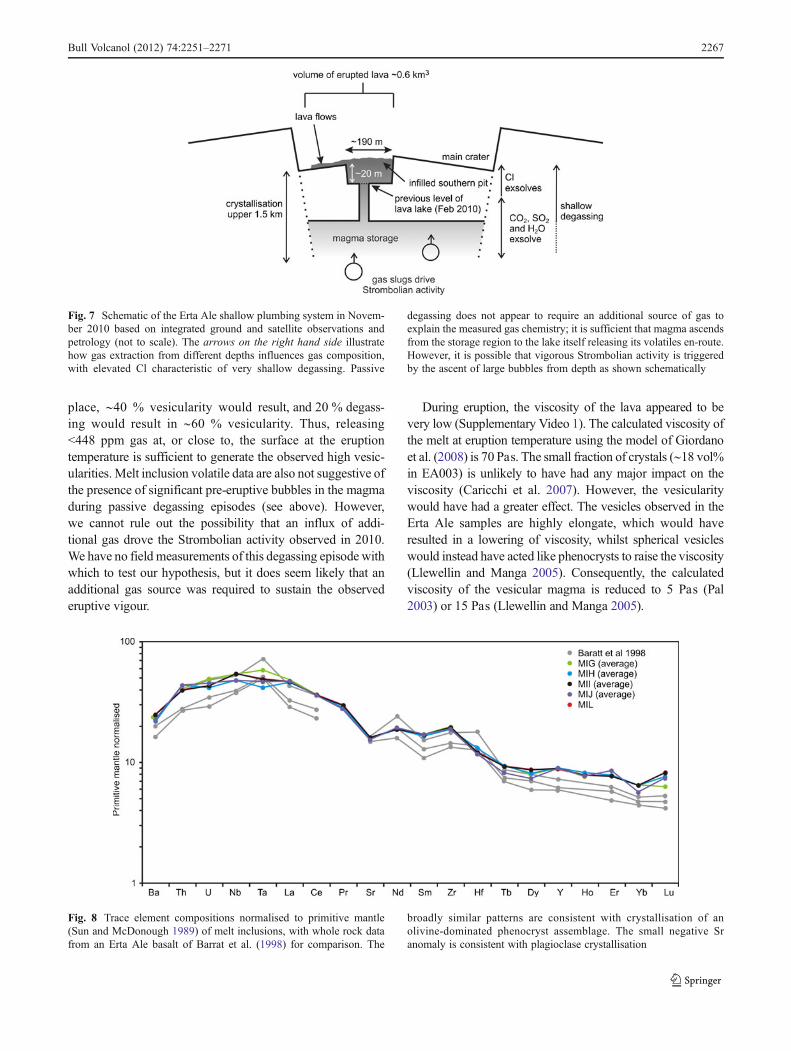
Fig. 8 Trace element compositions normalised to primitive mantle(Sun and McDonough 1989) of melt inclusions, with whole rock datafrom an Erta Ale basalt of Barrat et al. (1998) for comparison. The
broadly similar patterns are consistent with crystallisation of anolivine-dominated phenocryst assemblage. The small negative Sranomaly is consistent with plagioclase crystallisation
Bull Volcanol (2012) 74:2251–2271 2267
Geochemistry
A key question is whether the geochemistry of the 2010lavas is sufficiently different from those of earlier Erta Alelavas to indicate that recharge of the magma system oc-curred subsequent to 1973. We have already shown thatthe 1973 lavas appear to be texturally and chemicallydistinct from those of 2010. However, these differencescan be readily reconciled with a slightly increased degreeof fractionation of EA002, as evinced by higher contentsof incompatible elements, and lower temperatures as sug-gested by their more crystalline, microlite-rich texture.Overall, however, the 1973 and 2010 lavas are sufficientlysimilar to each other and within the range of Erta AleRange lavas that it seems unlikely that any recharge of thesystem since 1973 involved a truly distinct magma type.Nonetheless, the renewal of activity, the reduction in differen-tiation and crystallinity strongly suggest that the sub-volcanicreservoir was refilled by hotter, compositionally similarbasaltic magma.
Trace element systematics
Trace elements concentrations normalised to primitive man-tle (Sun and McDonough 1989) are plotted in Fig. 8. Wholerock samples from Barrat et al. (1998) are shown for com-parison. The melt inclusions have a similar overall pattern tothe whole rocks, but are displaced to the high concentrationend of the whole-rock range, consistent with a modestamount of crystallisation (∼20 %) of trace element poorphenocrysts. The small negative anomaly for Sr, in bothmelt inclusions and whole rocks, is consistent with crystal-lisation of plagioclase. The presence of plagioclase inclu-sions in both cpx and olivine crystals indicates plagioclasewas already crystallising when melt inclusions were entrap-ped in olivine. Europium, which also partitions strongly intoplagioclase, was not measured in the melt inclusions due tothe large isobaric interference of BaO on Eu at the massresolution used for trace element analyses.
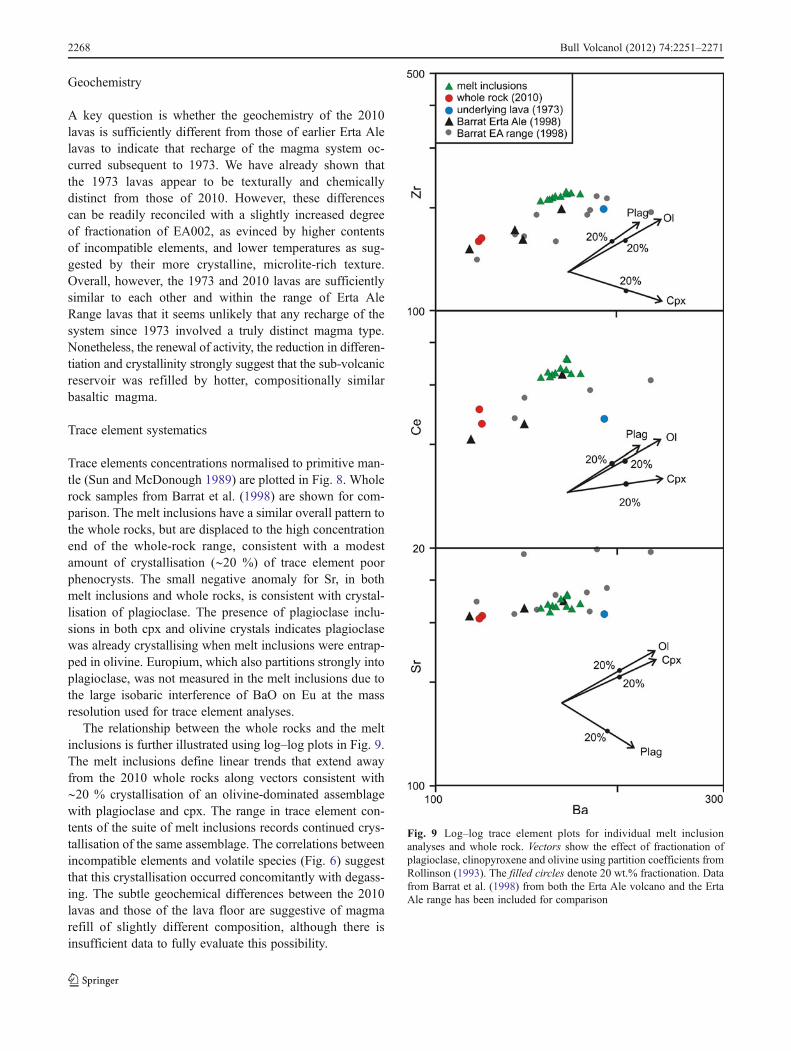
The relationship between the whole rocks and the meltinclusions is further illustrated using log–log plots in Fig. 9.The melt inclusions define linear trends that extend awayfrom the 2010 whole rocks along vectors consistent with∼20 % crystallisation of an olivine-dominated assemblagewith plagioclase and cpx. The range in trace element con-tents of the suite of melt inclusions records continued crys-tallisation of the same assemblage. The correlations betweenincompatible elements and volatile species (Fig. 6) suggestthat this crystallisation occurred concomitantly with degass-ing. The subtle geochemical differences between the 2010lavas and those of the lava floor are suggestive of magmarefill of slightly different composition, although there isinsufficient data to fully evaluate this possibility.
Fig. 9 Log–log trace element plots for individual melt inclusionanalyses and whole rock. Vectors show the effect of fractionation ofplagioclase, clinopyroxene and olivine using partition coefficients fromRollinson (1993). The filled circles denote 20 wt.% fractionation. Datafrom Barrat et al. (1998) from both the Erta Ale volcano and the ErtaAle range has been included for comparison
2268 Bull Volcanol (2012) 74:2251–2271
Magmatic timescales
Kα X-ray mapping revealed phosphorous zoning in theolivines, which was not apparent for other elements, e.g. Fe(Fig. 3h). Phosphorous diffuses extremely slowly comparedto Fe–Mg and Ca in olivine (Milman-Barris et al. 2008;Spandler and O'Neill 2010). Hence, the P zoning is pre-served, whilst Fe–Mg and Ca are homogenised during resi-dence in hot magma. An estimate of the minimum time itwould take to homogenise the crystal with respect to Fe–Mgand Ca at magmatic temperatures can be obtained from thecharacteristic diffusion length (x0(Dt)1/2; where x0distance,D0diffusivity, t0 time) of each element of interest. Diffusioncoefficients for Ca and Fe–Mg, parallel to the c-axis, werecalculated using the models of Coogan et al. (2005), Dohmenet al. (2007) and Dohmen and Chakraborty (2007) at amagmatic temperature of 1,170 °C and an oxygen fugacityequivalent to the QFM buffer. For a typical 200-μm olivinecrystal, Fe–Mg would have homogenised in approximately0.2 years, and Ca in 10 years, providing a minimum estimatefor the residence time of a crystal within this magma. Phos-phorous diffusion rates have not been constrained, but are atleast two orders of magnitude slower than other major cati-ons (Spandler and O'Neill 2010). Studies of experimentaland natural olivines have shown P and Cr to be correlated(Milman-Barris et al. 2008). Cr diffusion coefficients (Itoand Ganguly 2006) were therefore used to give an indicationof the minimum timescales required to eradicate the P zon-ing. This gives a minimum timescale of ∼94 years for ho-mogenisation of P within a typical 200-μm olivine crystal, asmodelled here. As P is not homogenous in the studiedolivines, this timescale provides an upper limit for residenceof this crystal. Although crystals can be retained in the sub-volcanic system following an eruptive episode, it is consid-ered that this is unlikely as the texture and appearance ofcrystals in the 2010 samples (EA001 and 3) are very differentfrom the underlying lava (EA002) from the previous over-spill (compare Fig. 3e, f). The last observed eruptive episodeat Erta Ale was in 1973. The fact that the estimated time-scales are of the order of decades, a period comparable to thatelapsed since Erta Ale last erupted, is consistent with ourearlier inferences that the magma system was recharged by anew pulse of hotter magma subsequent to 1973 (refer toSupplementary Table 5), we think these eruptive episodesare sufficiently infrequent that the period between the erup-tions acts as an upper bound and therefore suggest that thecrystal residence time was between ∼10 and ∼37 years.
Conclusions
We present an integrated field, satellite and petrological studyof the November 2010 eruption of the Erta Ale volcano. The
timeline of this small, but rare, eruption has been recon-structed from a combination of ground observations andSEVERI imaging. Two phases occurred, beginning on 11and 19 November 2010. Pristine melt inclusions have shownthe Erta Ale magma to be relatively dry (<0.15 wt.% H2O),although several petrological lines of evidence suggest themagma was volatile-saturated prior to eruption. The low vol-atile contents within the melt inclusions are sufficient at erup-tion temperature and low pressure, to account for thevesicularity of the erupted lava. The eruption and overflowof magma from the lava lake in November 2010 facilitatedalmost complete magma degassing. The calculated composi-tion of the released gas is broadly consistent with measuredpassive emissions of volcanic gas from the Erta Ale lava lake,although the higher measured SO2/Cl ratios suggests thatdegassing during non-eruptive episodes did not proceed tothe same extent as it did during the 2010 eruption. Coupledtrace and volatile element systematics indicate that crystalli-sation took place at shallow levels, in the top ∼1.5 km of theconduit, largely in response to degassing. We tentatively con-clude that slightly hotter, but broadly similar, magma wasinjected into the magmatic system after 1973, and that typicalphenocryst residence times indicated by phenocrysts in the2010 samples were between ∼10 and 37 years. The 2010samples are shown to be quite distinct from the underlyinglava from the previous overspills in 1973.
The November 2010 eruption was coincident with aseismic swarm in the Gulf of Aden; increased activity in2005 was also noted to be coincident with the 2005 volcano-seismic crisis in the Manda-Hararo magmatic rift segment. Itis possible that Erta Ale is particularly sensitive to tectonicactivity in the region, but future monitoring will be requiredto confirm this.
Acknowledgments This research was funded by the Natural Environ-mental Research Council, Afar Rift Consortium grant NE/F007604/1.K.S. was supported by a NERC Post-doctoral Research Fellowship (NE/G0129X/1). The authors acknowledge the generous support of the Uni-versity of Addis Ababa with fieldwork arrangements, and the AfarRegional Government for invaluable assistance. We thank N. Marshand R. Kelly for assistance with XRF at the University of Leicester, R.Hinton with the SIMS at the University of Edinburgh and J. Hammondfor the GPS track of the final emplaced lava flow (February 2011). J.Wilkinson is thanked for sharing his observations during and post-eruption. T. Rooney provided some helpful comments on an earlierversion of the manuscript. The manuscript was also improved by thecomments of two anonymous reviewers.
References
Ayele A, Jacques E, Kassim M, Kidane T, Omar A, Tait S, NercessianA, de Chabalier J, King G (2007) The volcano-seismic crisis inAfar, Ethiopia starting September 2005. Earth Planet Sci Lett 255(1–2):177–187
Bull Volcanol (2012) 74:2251–2271 2269
Barrat JA, Fourcade S, Jahn BM, Cheminee JL, Capdevila R (1998)Isotope (Sr, Nd, Pb, O) and trace-element geochemistry of vol-canics from the Erta Ale range (Ethiopia). J Volcanol GeothermRes 80(1–2):85–100
Barberi F, Varet J (1970) The Erta Ale volcanic range (Danakil depres-sion, northern Afar, Ethiopia). Bull Volcanol 34(4):848–917
Barberi F, Santacroce R, Varet J (1974) Silicic peralkaline volcanic rocksof the Afar depression (Ethiopia). Bull Volcanol 38(2):755–790
Barberi F, Varet J (1977) Volcanism of Afar—small-scale plate tectonicimplications. Geol Soc Am Bull 88(9):1251–1266
Bardintzeff J, Gaudru H (2004) 11/2004 (BGVN 29:11) Bulletin of theGlobal Volcanism Network. Smithsonian Institute, Global Volca-nism Program. www.si.edu. Accessed Jan 2011
Beattie P (1993) Olivine-melt and orthopyroxene-melt equilibria. ContribMineral Petrol 115(1):103–111
Bizouard H, Barberi F, Varet J (1980) Mineralogy and petrology ofErta Ale and Boina volcanic series, Afar Rift, Ethiopia. J Petrol 21(2):401–436
Blundy J, Cashman K (2008) Petrologic reconstruction of magmaticsystem variables and processes. In: Putirka KD, Tepley FJ (eds)Minerals, inclusions and volcanic processes. Mineralogical Soci-ety of America, Chantilly, pp 179–239
Bureau H, Pineau F, Métrich N, Semet MP, Javoy M (1998) A melt andfluid inclusion study of the gas phase at Piton de la Fournaisevolcano (Réunion Island). Chem Geol 147(1–2):115–130
Burgi P-Y, CailletM,Haefeli S (2002) Field temperaturemeasurements atErta'Ale Lava Lake, Ethiopia. Bull Volcanol 64(7):472–485
Caricchi L, Burlini L, Ulmer P, Gerya T, Vassalli M, Papale P (2007)Non-Newtonian rheology of crystal-bearing magmas and impli-cations for magma ascent dynamics. Earth Planet Sci Lett 264(3–4):402–419
Coogan LA, Hain A, Stahl S, Chakraborty S (2005) Experimentaldetermination of the diffusion coefficient for calcium in olivinebetween 900°C and 1500°C. Geochim Cosmochim Acta 69(14):3683–3694
Dainelli G, Marinelli O (1907) Vulcani attivi della Dancalia. Riv GeogItal 13:261–270
Davies AG, Keszthelyi LP, Harris AJL (2010) The thermal signature ofvolcanic eruptions on Io and Earth. J Volcanol Geotherm Res 194(4):75–99
Dixon JE, Stolper E, Delaney JR (1988) Infrared spectroscopic meas-urements of CO2 and H2O glasses in the Juan de Fuca Ridgebasaltic glasses. Earth Planet Sci Lett 90:87–104
Dohmen R, Becker HW, Chakraborty S (2007) Fe-Mg diffusion inolivine I: experimental determination between 700 and 1,200degrees C as a function of composition, crystal orientation andoxygen fugacity. Phys Chem Miner 34(6):389–407
Dohmen R, Chakraborty S (2007) Fe-Mg diffusion in olivine II: pointdefect chemistry, change of diffusion mechanisms and a model forcalculation of diffusion coefficients in natural olivine. Phys ChemMiner 34(6):409–430
EMSC—European-Mediterranean Seismological Centre (2010) EMSCwebsite: http://www.emsc-csem.org. Accessed 01 Dec 2010
Ferguson DJ, Barnie TD, Pyle DM, Oppenheimer C, Yirgu G, Lewi E,Kidane T, Carn S, Hamling I (2010) Recent rift-related volcanismin Afar, Ethiopia. Earth Planet Sci Lett 292(3–4):409–418
Fine G, Stolper E (1986) Dissolved carbon dioxide in basaltic glasses:concentrations and speciation. Earth Planet Sci Lett 76:263–278
Gerlach TM (1980) Investigation of volcanic gas analyses and magmaoutgassing from Erta 'Ale lava lake, Afar, Ethiopia. J VolcanolGeotherm Res 7(3–4):415–441
Giordano D, Russell JK, Dingwell D (2008) Viscosity of magmaticliquids: a model. Earth Planet Sci Lett 271:123–134
Harris AJL, Carniel R, Jones J (2005) Identification of variable con-vective regimes at Erta Ale Lava Lake. J Volcanol Geotherm Res142(3–4):207–223
Hauri E (2002) SIMS analysis of volatiles in silicate glasses, 2: iso-topes and abundances in Hawaiian melt inclusions. Chem Geol183(1–4):115–141
Hirn B, Di Bartola C, Ferrucci F (2009) Combined use of SEVIRI andMODIS for detecting, measuring, and monitoring active lavaflows at erupting volcanoes. IEEE Trans Geosci Remote Sens47(2):2923–2930
Irvine TN, Baragar WRA (1971) A guide to the chemical classificationof the common volcanic rocks. Can J Earth Sci 8:523–548
Ito M, Ganguly J (2006) Diffusion kinetics of Cr in olivine and 53Mn-53Cr thermochronology of early solar system objects. GeochimCosmochim Acta 70(3):799–809
Le Guern F, Carbonnelle J, Tazieff H (1979) Erta 'Ale lava lake: heatand gas transfer to the atmosphere. J Volcanol Geotherm Res 6(1–2):27–48
Lesne P, Kohn S, Blundy J, Witham F, Botcharnikov R, Behrens H(2011) Experimental simulation of closed-system degassing in thesystem basalt-H2O-CO2-S-Cl. J Petrol 52:1737–1762
Llewellin EW, Manga M (2005) Bubble suspension rheology andimplications for conduit flow. J Volcanol Geotherm Res 143(1–3):205–217
Lowenstern JB, Mahood GA (1991) New data on magmatic H2Ocontents of pantellerites with implications for petrogenesis anderuptive dynamics at Pantelleria. Bull Volcanol 54(1):78–83
Mahatsente R, Jentzsch G, Jahr T (1999) Crustal structure of the MainEthiopian Rift from gravity data: 3-dimensional modeling. Tecto-nophysics 313(4):363–382
Milman-Barris MS, Beckett JR, Baker MB, Hofmann AE, Morgan Z,Crowley MR, Vielzeuf D, Stolper E (2008) Zoning of phosphorusin igneous olivine. Contrib Mineral Petrol 155(6):739–765
Müller J (2010) MSG Level 1.5 Image data format description.Eumetsat documentation online EUM/MSG/ICD/105. http://www.eumetsat.int/groups/ops/documents/document/pdf_ten_05105_msg_img_data.pdfV6. Accessed 23 Feb 2010
Nesbitt LM (1935) Hell-hole of creation: the exploration of AbyssinianDanakil. Alfred. A. Knopf, New York, p 382
Newman S, Lowenstern JB (2002) VolatileCalc: a silicate melt-H2O-CO2 solution model written in Visual Basic for Excel. ComputGeosci 28(5):597–604
Nichols ARL, Carroll MR, Hoskuldsson A (2002) Is the Iceland hotspot also wet? Evidence from the water contents of undegassedsubmarine and subglacial pillow basalts. Earth Planet Sci Lett 202(1):77–87
Nichols ARL, Wysoczanski RJ (2007) Using micro-FTIR spectrosco-py to measure volatile contents in small and unexposed inclusionshosted in olivine crystals. Chem Geol 242:371–384
Oppenheimer C, Francis P (1997) Remote sensing of heat, lava andfumarole emissions from Erta Ale volcano, Ethiopia. Int J RemoteSens 18(8):1661–1692
Pal R (2003) Rheological behaviour of bubble-bearing magmas. EarthPlanet Sci Lett 207:165–179
Pagli C, Wright TJ, Ebinger CJ, Yun S, Cann JR, Barnie T, Ayele A(2012) Shallow axial magma chamber at the slow‐spreading ErtaAle Ridge. Nat Geosci 5284–5288. doi:10.1038/ngeo1414
Pineau F, Javoy M (1994) Strong degassing at ridge crests: the behav-iour of dissolved carbon and water in basalt glasses at 14°N, Mid-Atlantic Ridge. Earth Planet Sci Lett 123(1–3):179–198
Prodehl C, Fuchs K, Mechie J (1997) Seismic-refraction studies of theAfro-Arabian rift system—a brief review. Tectonophysics 278(1–4):1–13
Putirka K, Johnson M, Kinzler R, Longhi J, Walker D (1996) Thermo-barometry of mafic igneous rocks based on clinopyroxene-liquidequilibria, 0–30 kbar. Contrib Mineral Petrol 123(1):92–108
Putirka KD (2008) Thermometers and barometers for volcanic sys-tems. Minerals, inclusions and volcanic processes. Rev Min Geo-chem 69:61–120
2270 Bull Volcanol (2012) 74:2251–2271
Rollinson H (1993) Using geochemical data: evaluation, presentation,interpretation. Longman Scientific, New York
Sawyer GM, Oppenheimer C, Tsanev VI, Yirgu G (2008) Magmaticdegassing at Erta 'Ale volcano, Ethiopia. J Volcanol GeothermRes 178(4):837–846
Shishkina TA, Botcharnikov RE, Holtz F, Almeev RR, Portnyagin MV(2010) Solubility of H2O and CO2 bearing fluids in tholeiitic basaltsat pressures up to 500 MPa. Chem Geol 277(1–2):115–125
Spandler C, O’Neill H (2010) Diffusion and partition coefficients ofminor and trace elements in San Carlos olivine at 1,300°C withsome geochemical implications. Contrib Mineral Petrol 159(6):791–818
Sun S, McDonough WF (1989) Chemical and isotopic systematics ofoceanic basalts: implications for mantle composition and processes.In: Saunders AD, Norry MJ (eds) Magmatism in the ocean basins.Geol Soc Sp 42:313–345
Tazieff H (1973) Erta Ale volcano. Rev Geol Dyn Geogr 15(4):437–441Varet J (1972) 03/1972 (CSLP 16–72) Card 1363 (06 March 1972).
Bulletin of the Global Volcanism Network. Smithsonian Institute,Global Volcanism Program. www.si.edu. Accessed January 2011
Varet J (1972) 05/1972 (CSLP 16–72) Card 1390 (10 May 1972).Bulletin of the Global Volcanism Network. Smithsonian Institute,Global Volcanism Program. www.si.edu. Accessed January 2011
Vetsch P, Assefa G, Asfaw L (1992) 09/1992 (BGVN 17:09) Bulletinof the Global Volcanism Network. Smithsonian Institute, GlobalVolcanism Program. www.si.edu. Accessed January 2011
Vetsch P, Caillet M, Haefeli S, Burgi P-Y (2003) 04/2003 (BGVN28:04) Bulletin of the Global Volcanism Network. SmithsonianInstitute, Global Volcanism Program. www.si.edu. AccessedJanuary 2011
Wilson SA (1997) The collection, preparation and testing of USGSreference material BCR-2, Columbia river, basalt. USGS Open-File Report 98-xxx
Wolfenden E, Ebinger C, Yirgu G, Renne PR, Kelley SP (2005)Evolution of a volcanic rifted margin: Southern Red Sea, Ethiopia.Geol Soc Am Bull 117(7–8):846–864
Wright R, Pilger E (2008) Satellite observations reveal little inter-annual variability in the radiant flux from the Mount Erebus lavalake. J Volcanol Geotherm Res 177(3):687–694
Wright TJ, Ebinger CJ, Biggs J, Ayele A, Yirgu G, Keir D, StorkA (2006) Magma maintained rift segmentation at continentalrupture in the 2005 Afar dyking episode. Nature 442:291–294
Yirgu G, Philpotts A (2005) 09/2005 (BGVN 30:09) Bulletin of theGlobal Volcanism Network. Smithsonian Institute, Global Volca-nism Program. www.si.edu. Accessed January 2011
Bull Volcanol (2012) 74:2251–2271 2271