Crustal stress and seismic activity in the Ionian archipelago as inferred by satellite- and...
16
Crustal stress and seismic activity in the Ionian archipelago as inferred by satellite- and ground-based observations, Kefallinı `a, Greece MAURIZIO POSCOLIERI 1 , EVANGELOS LAGIOS 2 , GIOVANNI P. GREGORI 1 , GABRIELE PAPARO 1 , VASSILIS A. SAKKAS 2 , ISSAAK PARCHARIDIS 5 , IGINIO MARSON 3 , KONSTANTINOS SOUKIS 4 , EMMANUEL VASSILAKIS 4 , FRANCESCO ANGELUCCI 1 & SPYRIDOULA VASSILOPOULOU 2 1 Istituto di Acustica O. M. Corbino (CNR), via Fosso del Cavaliere 100, 00133 Roma, Italy (e-mail: [email protected]; [email protected]; [email protected]; [email protected]) 2 National and Kapodistrian University of Athens, Geophysics Laboratory, Space Applications in Geosciences, Panepistimiopolis, Ilissia, Athens 157 84, Greece (e-mail: [email protected]; [email protected]; [email protected]) 3 Dipartimento di Ingegneria Navale, del Mare e per l’Ambiente, Universita ` di Trieste, via Valerio 10, 34127 Trieste, Italy; Istituto Nazionale di Oceanografia e Geofisica Sperimentale (OGS), Borgo Grotta Gigante 42/c, 34010 Sgonico, Trieste, Italy (e-mail: [email protected]; [email protected]) 4 Department of Geology, University of Athens, Athens, Greece (e-mail: [email protected]; [email protected]) 5 Harokopio University of Athens, Athens, Greece (e-mail: [email protected]) Abstract: Different observational techniques are compared in order to investigate possible correlations in seismic activity. The study site is the island of Kefallinı `a (Greece), where measure- ments available included (1) DInSAR, DGPS, and DEM data, (2) soil exhalation measured by monitoring Radon (Rn) well content, and (3) acoustic emissions (AE) at high and low frequency (point-like records with high temporal resolution). AE records provide: (1) relative time variation of the applied stress intensity and (2) the state of fatigue of stressed rock volumes, the AE source. Our results indicate that the large spatial scale (poor time resolution) may be considered quite sat- isfactory, whereas fractal analysis of the AE time series displayed some discrepancies when com- pared to analogous investigations in the Italian Peninsula. Therefore, some refinement is needed in order to reach more precise interpretations of the relevant information available with this kind of data. However, both sets of observations appear in agreement with each other, although more exhaustive investigations would require a suitable array of point-like AE and Rn (or other) measuring sites, as well as longer data series. The latter are particulary helpful for detailed interpretations of the different occurrences within tectonically complex settings where crustal stress crises are marked by various types of geological phenomena. Slow deformations and crustal stress propagation characterize geodynamic phenomena over regional space scales much larger than the areas struck by a seismic event. The entire scenario can be depicted in terms of a perturbation propagating through the crust and giving rise to local deformations, and eventually triggering an earthquake wherever a suf- ficient amount of potential elastic energy has been stored by the system. We attempt to discuss the observational evidence eventually supporting such interpretation, based on observations carried out in the island of Kefallinı `a (Cephalonia) in Western Greece. Different observational techniques are con- sidered. The first is measurement of acoustic emis- sion (AE) in the ultrasound range: high-frequency or HF AE at 160 or 200 kHz and low-frequency or LF AE at 25 kHz. These are very effective for monitoring phenomena that occur on a submicro- scopic scale and precede extreme events by From:CELLO, G. & MALAMUD, B. D. (eds) 2006. Fractal Analysis for Natural Hazards. Geological Society, London, Special Publications, 261, 63–78. 0305-8719/06/$15.00 # The Geological Society of London 2006.
Transcript of Crustal stress and seismic activity in the Ionian archipelago as inferred by satellite- and...
Crustal stress and seismic activity in the Ionian archipelago
as inferred by satellite- and ground-based observations,
Kefallinıa, Greece
MAURIZIO POSCOLIERI1, EVANGELOS LAGIOS2, GIOVANNI P. GREGORI1,
GABRIELE PAPARO1, VASSILIS A. SAKKAS2, ISSAAK PARCHARIDIS5,
IGINIO MARSON3, KONSTANTINOS SOUKIS4, EMMANUEL VASSILAKIS4,
FRANCESCO ANGELUCCI1 & SPYRIDOULA VASSILOPOULOU2
1Istituto di Acustica O. M. Corbino (CNR), via Fosso del Cavaliere 100, 00133 Roma, Italy
(e-mail: [email protected]; [email protected];
[email protected]; [email protected])2National and Kapodistrian University of Athens, Geophysics Laboratory, Space Applications in
Geosciences, Panepistimiopolis, Ilissia, Athens 157 84, Greece (e-mail: [email protected];
[email protected]; [email protected])3Dipartimento di Ingegneria Navale, del Mare e per l’Ambiente, Universita di Trieste, via
Valerio 10, 34127 Trieste, Italy; Istituto Nazionale di Oceanografia e Geofisica Sperimentale
(OGS), Borgo Grotta Gigante 42/c, 34010 Sgonico, Trieste, Italy (e-mail:
[email protected]; [email protected])4Department of Geology, University of Athens, Athens, Greece (e-mail: [email protected];
[email protected])5Harokopio University of Athens, Athens, Greece (e-mail: [email protected])
Abstract: Different observational techniques are compared in order to investigate possiblecorrelations in seismic activity. The study site is the island of Kefallinıa (Greece), where measure-ments available included (1) DInSAR, DGPS, and DEM data, (2) soil exhalation measured bymonitoring Radon (Rn) well content, and (3) acoustic emissions (AE) at high and low frequency(point-like records with high temporal resolution). AE records provide: (1) relative time variationof the applied stress intensity and (2) the state of fatigue of stressed rock volumes, the AE source.Our results indicate that the large spatial scale (poor time resolution) may be considered quite sat-isfactory, whereas fractal analysis of the AE time series displayed some discrepancies when com-pared to analogous investigations in the Italian Peninsula. Therefore, some refinement is needed inorder to reach more precise interpretations of the relevant information available with this kind ofdata. However, both sets of observations appear in agreement with each other, although moreexhaustive investigations would require a suitable array of point-like AE and Rn (or other)measuring sites, as well as longer data series. The latter are particulary helpful for detailedinterpretations of the different occurrences within tectonically complex settings where crustalstress crises are marked by various types of geological phenomena.
Slow deformations and crustal stress propagationcharacterize geodynamic phenomena over regionalspace scales much larger than the areas struck bya seismic event. The entire scenario can be depictedin terms of a perturbation propagating through thecrust and giving rise to local deformations, andeventually triggering an earthquake wherever a suf-ficient amount of potential elastic energy has beenstored by the system. We attempt to discuss theobservational evidence eventually supporting such
interpretation, based on observations carried out inthe island of Kefallinıa (Cephalonia) in WesternGreece.
Different observational techniques are con-sidered. The first is measurement of acoustic emis-sion (AE) in the ultrasound range: high-frequencyor HF AE at 160 or 200 kHz and low-frequencyor LF AE at 25 kHz. These are very effective formonitoring phenomena that occur on a submicro-scopic scale and precede extreme events by
From: CELLO, G. & MALAMUD, B. D. (eds) 2006. Fractal Analysis for Natural Hazards.Geological Society, London, Special Publications, 261, 63–78.0305-8719/06/$15.00 # The Geological Society of London 2006.
several months. The temporal resolution of AE isvery high, and the information is point-like, andpremonitory phenomena deal with an area as largeas �106 km2. A few other techniques are muchmore effective in terms of spatial coverage over agiven area, although the temporal resolution is una-voidably very low. For instance, Differential Inter-ferometric Synthetic Aperture Radar (DInSAR)and Differential Global Position System (DGPS)are the best known standard satellite-based tech-niques for crustal deformation measurements.Topography is another information source, whichis utilized by means of suitable Digital ElevationModel (DEM) database.The aims of the present study are (1) to show that
DInSAR and DGPS are capable of measuring someimportant aspects of pre- and post-seismic crustaldeformation; (2) to demonstrate the synergistic inte-gration, and complementary use of two satellite-based techniques, with the AE technique and soilexhalation; and (3) to investigate by means of a suit-able analysis of a DEM some complementary geo-morphologic information related to the tectonicsetting of the island.
Tectonic setting
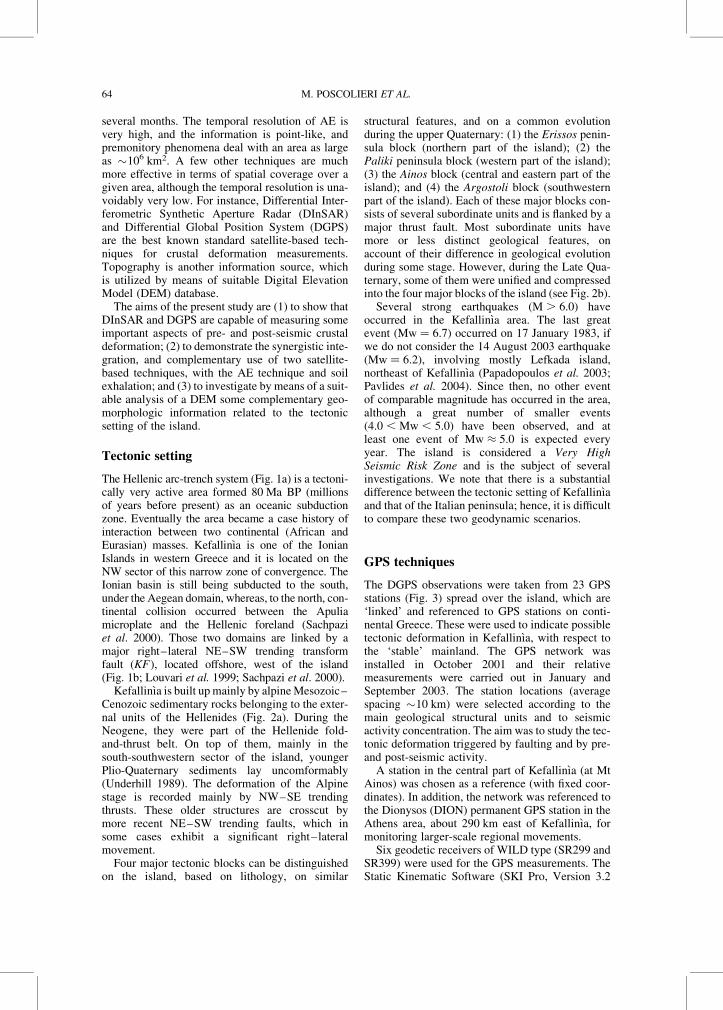
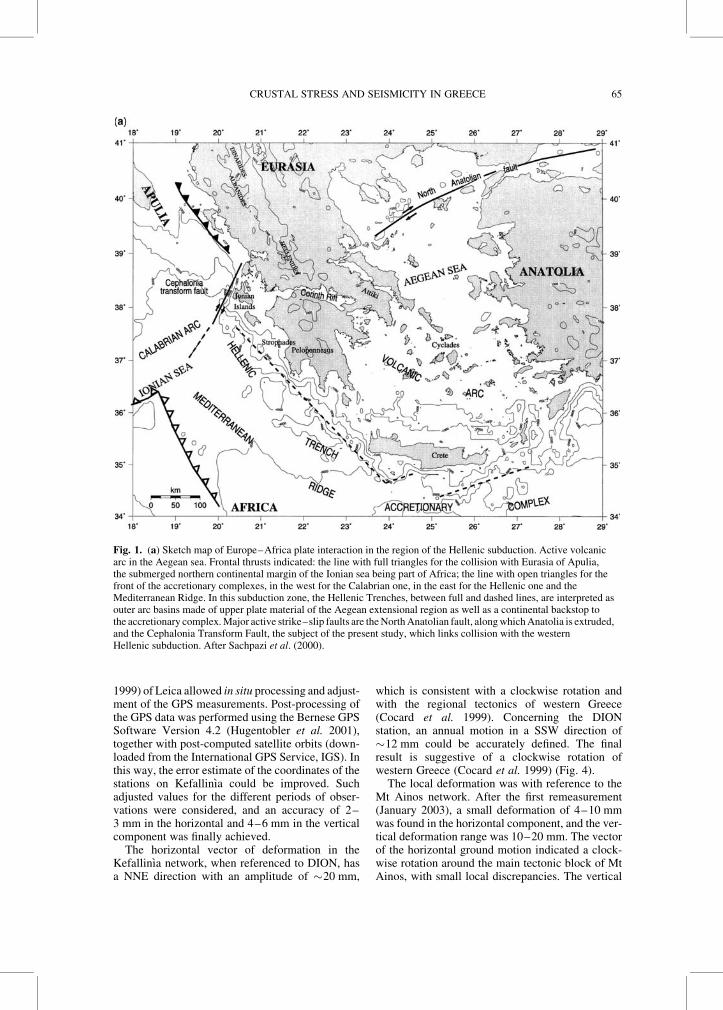
The Hellenic arc-trench system (Fig. 1a) is a tectoni-cally very active area formed 80 Ma BP (millionsof years before present) as an oceanic subductionzone. Eventually the area became a case history ofinteraction between two continental (African andEurasian) masses. Kefallinıa is one of the IonianIslands in western Greece and it is located on theNW sector of this narrow zone of convergence. TheIonian basin is still being subducted to the south,under the Aegean domain, whereas, to the north, con-tinental collision occurred between the Apuliamicroplate and the Hellenic foreland (Sachpaziet al. 2000). Those two domains are linked by amajor right–lateral NE–SW trending transformfault (KF), located offshore, west of the island(Fig. 1b; Louvari et al. 1999; Sachpazi et al. 2000).
Kefallinıa is built upmainly by alpineMesozoic–Cenozoic sedimentary rocks belonging to the exter-nal units of the Hellenides (Fig. 2a). During theNeogene, they were part of the Hellenide fold-and-thrust belt. On top of them, mainly in thesouth-southwestern sector of the island, youngerPlio-Quaternary sediments lay uncomformably(Underhill 1989). The deformation of the Alpinestage is recorded mainly by NW–SE trendingthrusts. These older structures are crosscut bymore recent NE–SW trending faults, which insome cases exhibit a significant right–lateralmovement.Four major tectonic blocks can be distinguished
on the island, based on lithology, on similar
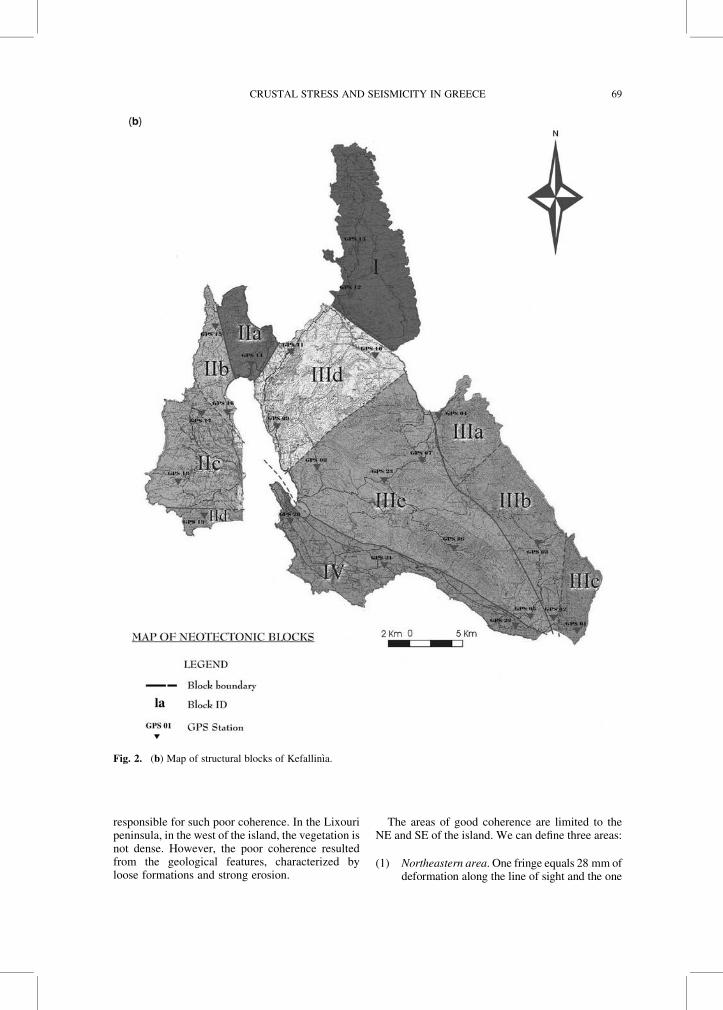
structural features, and on a common evolutionduring the upper Quaternary: (1) the Erissos penin-sula block (northern part of the island); (2) thePaliki peninsula block (western part of the island);(3) the Ainos block (central and eastern part of theisland); and (4) the Argostoli block (southwesternpart of the island). Each of these major blocks con-sists of several subordinate units and is flanked by amajor thrust fault. Most subordinate units havemore or less distinct geological features, onaccount of their difference in geological evolutionduring some stage. However, during the Late Qua-ternary, some of them were unified and compressedinto the four major blocks of the island (see Fig. 2b).
Several strong earthquakes (M . 6.0) haveoccurred in the Kefallinıa area. The last greatevent (Mw ¼ 6.7) occurred on 17 January 1983, ifwe do not consider the 14 August 2003 earthquake(Mw ¼ 6.2), involving mostly Lefkada island,northeast of Kefallinıa (Papadopoulos et al. 2003;Pavlides et al. 2004). Since then, no other eventof comparable magnitude has occurred in the area,although a great number of smaller events(4.0 , Mw , 5.0) have been observed, and atleast one event of Mw � 5.0 is expected everyyear. The island is considered a Very HighSeismic Risk Zone and is the subject of severalinvestigations. We note that there is a substantialdifference between the tectonic setting of Kefallinıaand that of the Italian peninsula; hence, it is difficultto compare these two geodynamic scenarios.
GPS techniques
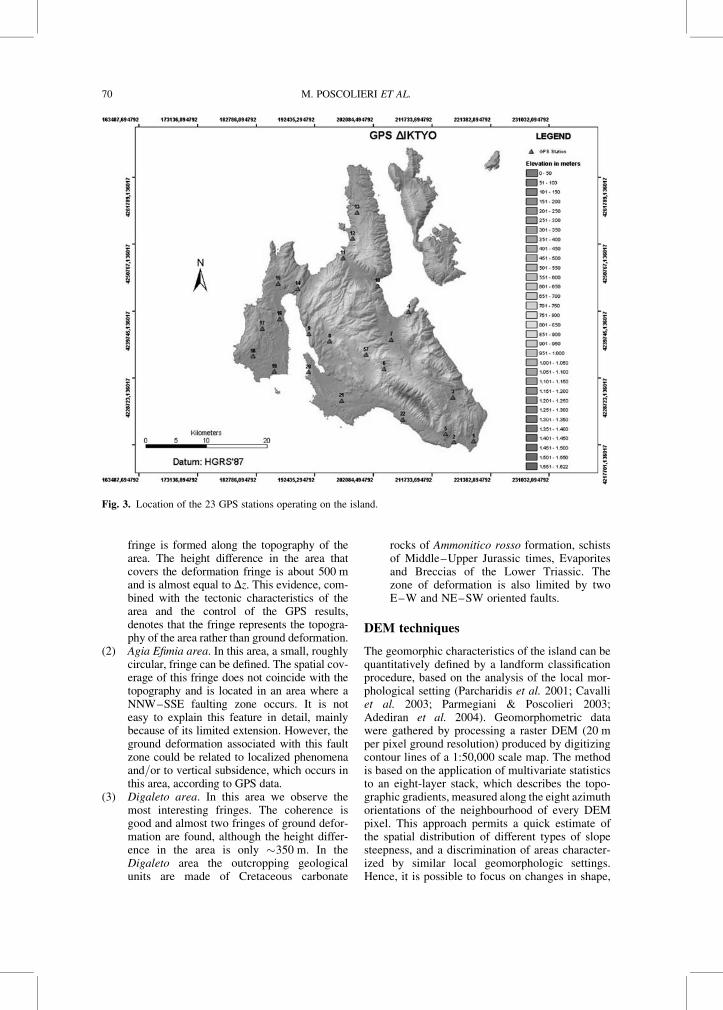
The DGPS observations were taken from 23 GPSstations (Fig. 3) spread over the island, which are‘linked’ and referenced to GPS stations on conti-nental Greece. These were used to indicate possibletectonic deformation in Kefallinıa, with respect tothe ‘stable’ mainland. The GPS network wasinstalled in October 2001 and their relativemeasurements were carried out in January andSeptember 2003. The station locations (averagespacing �10 km) were selected according to themain geological structural units and to seismicactivity concentration. The aim was to study the tec-tonic deformation triggered by faulting and by pre-and post-seismic activity.
A station in the central part of Kefallinıa (at MtAinos) was chosen as a reference (with fixed coor-dinates). In addition, the network was referenced tothe Dionysos (DION) permanent GPS station in theAthens area, about 290 km east of Kefallinıa, formonitoring larger-scale regional movements.
Six geodetic receivers of WILD type (SR299 andSR399) were used for the GPS measurements. TheStatic Kinematic Software (SKI Pro, Version 3.2
M. POSCOLIERI ET AL.64
1999) of Leica allowed in situ processing and adjust-ment of the GPS measurements. Post-processing ofthe GPS data was performed using the Bernese GPSSoftware Version 4.2 (Hugentobler et al. 2001),together with post-computed satellite orbits (down-loaded from the International GPS Service, IGS). Inthis way, the error estimate of the coordinates of thestations on Kefallinıa could be improved. Suchadjusted values for the different periods of obser-vations were considered, and an accuracy of 2–3 mm in the horizontal and 4–6 mm in the verticalcomponent was finally achieved.The horizontal vector of deformation in the
Kefallinıa network, when referenced to DION, hasa NNE direction with an amplitude of �20 mm,
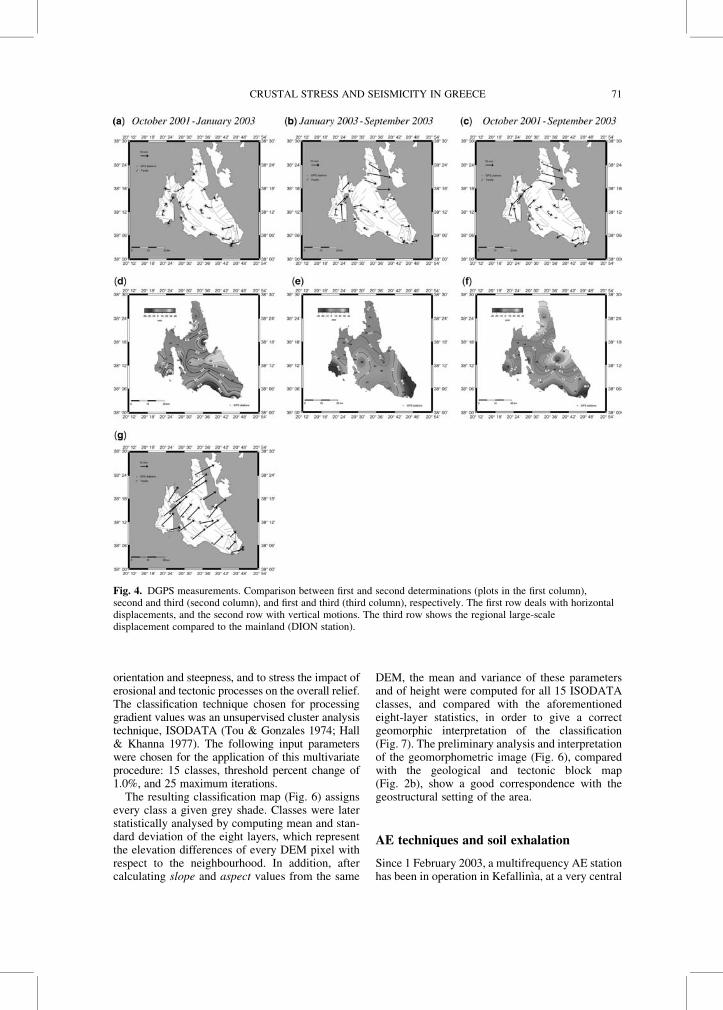
which is consistent with a clockwise rotation andwith the regional tectonics of western Greece(Cocard et al. 1999). Concerning the DIONstation, an annual motion in a SSW direction of�12 mm could be accurately defined. The finalresult is suggestive of a clockwise rotation ofwestern Greece (Cocard et al. 1999) (Fig. 4).
The local deformation was with reference to theMt Ainos network. After the first remeasurement(January 2003), a small deformation of 4–10 mmwas found in the horizontal component, and the ver-tical deformation range was 10–20 mm. The vectorof the horizontal ground motion indicated a clock-wise rotation around the main tectonic block of MtAinos, with small local discrepancies. The vertical
Fig. 1. (a) Sketch map of Europe–Africa plate interaction in the region of the Hellenic subduction. Active volcanicarc in the Aegean sea. Frontal thrusts indicated: the line with full triangles for the collision with Eurasia of Apulia,the submerged northern continental margin of the Ionian sea being part of Africa; the line with open triangles for thefront of the accretionary complexes, in the west for the Calabrian one, in the east for the Hellenic one and theMediterranean Ridge. In this subduction zone, the Hellenic Trenches, between full and dashed lines, are interpreted asouter arc basins made of upper plate material of the Aegean extensional region as well as a continental backstop tothe accretionary complex.Major active strike–slip faults are theNorthAnatolian fault, alongwhichAnatolia is extruded,and the Cephalonia Transform Fault, the subject of the present study, which links collision with the westernHellenic subduction. After Sachpazi et al. (2000).
CRUSTAL STRESS AND SEISMICITY IN GREECE 65
movement show a general uplift of the island, withareas of subsidence to be associated with step-likefaulting in the southwestern slopes of Mt Ainosand along the southern coast of the island.The DGPS results of the September 2003 remea-
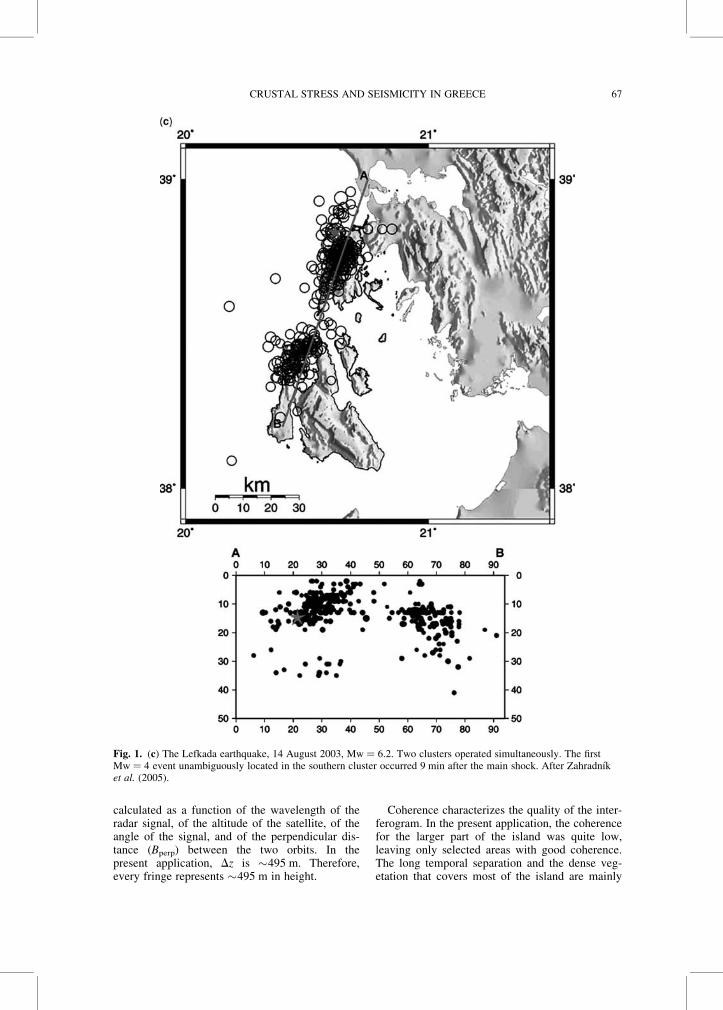
surement were strongly affected by the major 14August 2003 earthquake (Fig. 1c) that occurred onthe island of Lefkada (Papadopoulos et al. 2003;Pavlides et al. 2004). Aftershocks appeared linearlyconcentrated along the northern part of Kefallinıa.Stations located on this side of the islandshowed strong ground southeast motions, whilethe area was subsiding. Stations located furthersouth appeared less affected, maintaining the samepattern as that inferred from the first remeasurement.
DInSAR techniques
DInSAR has already proved its capability of provi-ding images of ground surface deformation (Gabrielet al. 1989; Zebker et al. 1994; Massonnet & Feigl1995, 1998; Peltzer & Rosen 1995; Hanssen 2001;Salvi et al. 2004; Wright et al. 2004). The technique
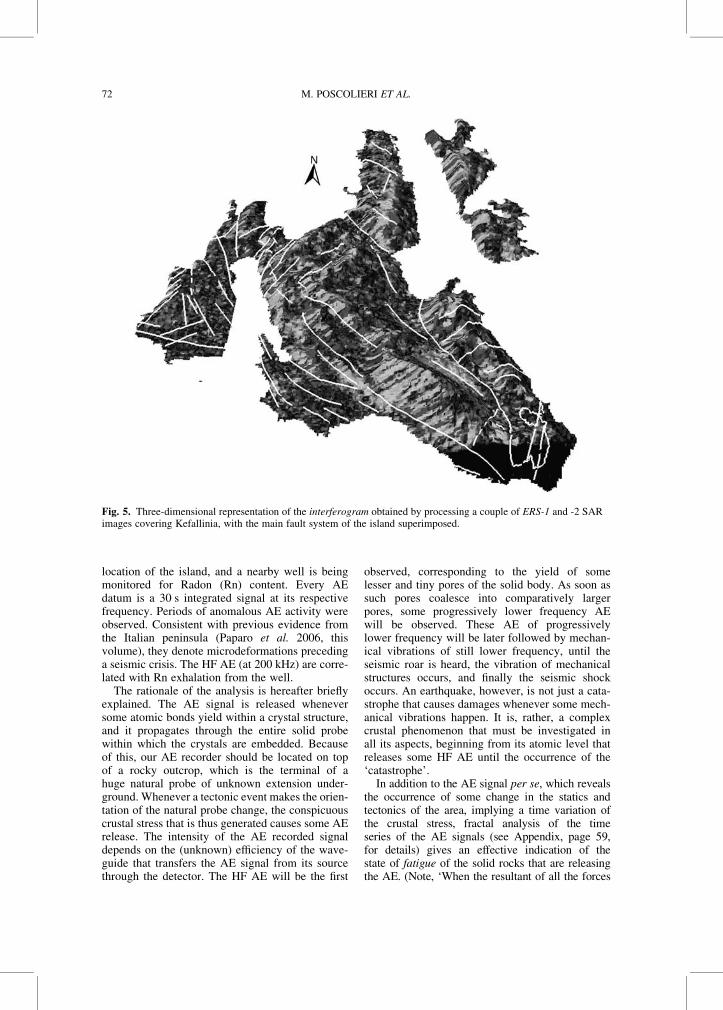
was used to plot interferograms, covering theinvestigated area, using radar images of the ESAsatellites ERS-2 and ENVISAT. Differential inter-ferometric images covering the period 28September 1995 to 14 August 1998 seem tocoincide with the ground deformation observed inthe island, although the period is not exactly thesame. The DInSAR image reveals deformations(Fig. 5) located in the northern part of Kefallinıa,and mainly in the eastern sector, hence confirmingthe ground activity observed by DGPS measure-ments through time.
A pair of SAR images was selected with a smallbaseline (Bp ¼ 12 m) although with long time sep-aration (ERS-1, 28 September 1995; and ERS-2,14 August 1998). Ground deformation could thusbe observed over a long period of time, duringwhich no seismic event occurred. In general, theresults of this analysis are consistent with theground deformation recorded on the island bymeans of DGPS techniques. In more detail, every3608 fringe circle represents one predefined greatdifference Dz (called altitude of ambiguity) forevery fringe of the interferogram. It can be
Fig. 1. (b) The Kefallinıa Transform Fault. The Kefallinıa segment of the fault is marked as C and the Lefkadasegment as L. The distribution of well-located seismicity (open circles) and epicentres of microearthquakes(filled circles), as well as the focal mechanisms of strong events are also shown. Figure and captions afterLouvari et al. (1999).
M. POSCOLIERI ET AL.66
calculated as a function of the wavelength of theradar signal, of the altitude of the satellite, of theangle of the signal, and of the perpendicular dis-tance (Bperp) between the two orbits. In thepresent application, Dz is �495 m. Therefore,every fringe represents �495 m in height.
Coherence characterizes the quality of the inter-ferogram. In the present application, the coherencefor the larger part of the island was quite low,leaving only selected areas with good coherence.The long temporal separation and the dense veg-etation that covers most of the island are mainly
Fig. 1. (c) The Lefkada earthquake, 14 August 2003, Mw ¼ 6.2. Two clusters operated simultaneously. The firstMw ¼ 4 event unambiguously located in the southern cluster occurred 9 min after the main shock. After Zahradnıket al. (2005).
CRUSTAL STRESS AND SEISMICITY IN GREECE 67
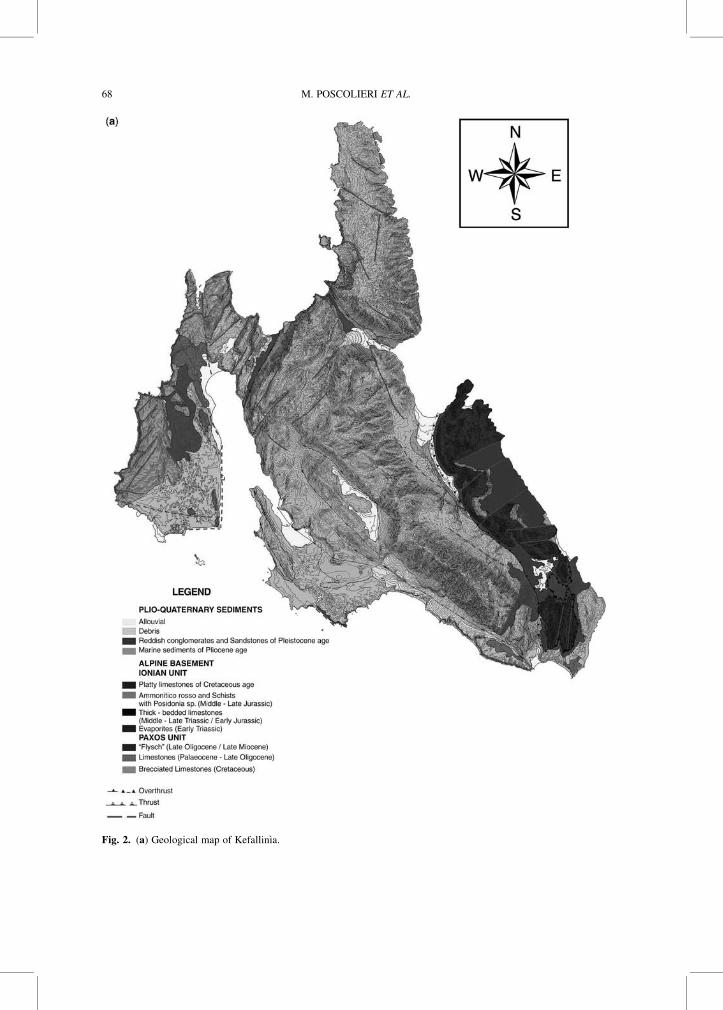
Fig. 2. (a) Geological map of Kefallinıa.
M. POSCOLIERI ET AL.68
responsible for such poor coherence. In the Lixouripeninsula, in the west of the island, the vegetation isnot dense. However, the poor coherence resultedfrom the geological features, characterized byloose formations and strong erosion.
The areas of good coherence are limited to theNE and SE of the island. We can define three areas:
(1) Northeastern area. One fringe equals 28 mm ofdeformation along the line of sight and the one
Fig. 2. (b) Map of structural blocks of Kefallinıa.
CRUSTAL STRESS AND SEISMICITY IN GREECE 69
fringe is formed along the topography of thearea. The height difference in the area thatcovers the deformation fringe is about 500 mand is almost equal to Dz. This evidence, com-bined with the tectonic characteristics of thearea and the control of the GPS results,denotes that the fringe represents the topogra-phy of the area rather than ground deformation.
(2) Agia Efimia area. In this area, a small, roughlycircular, fringe can be defined. The spatial cov-erage of this fringe does not coincide with thetopography and is located in an area where aNNW–SSE faulting zone occurs. It is noteasy to explain this feature in detail, mainlybecause of its limited extension. However, theground deformation associated with this faultzone could be related to localized phenomenaand/or to vertical subsidence, which occurs inthis area, according to GPS data.
(3) Digaleto area. In this area we observe themost interesting fringes. The coherence isgood and almost two fringes of ground defor-mation are found, although the height differ-ence in the area is only �350 m. In theDigaleto area the outcropping geologicalunits are made of Cretaceous carbonate
rocks of Ammonitico rosso formation, schistsof Middle–Upper Jurassic times, Evaporitesand Breccias of the Lower Triassic. Thezone of deformation is also limited by twoE–W and NE–SW oriented faults.
DEM techniques
The geomorphic characteristics of the island can bequantitatively defined by a landform classificationprocedure, based on the analysis of the local mor-phological setting (Parcharidis et al. 2001; Cavalliet al. 2003; Parmegiani & Poscolieri 2003;Adediran et al. 2004). Geomorphometric datawere gathered by processing a raster DEM (20 mper pixel ground resolution) produced by digitizingcontour lines of a 1:50,000 scale map. The methodis based on the application of multivariate statisticsto an eight-layer stack, which describes the topo-graphic gradients, measured along the eight azimuthorientations of the neighbourhood of every DEMpixel. This approach permits a quick estimate ofthe spatial distribution of different types of slopesteepness, and a discrimination of areas character-ized by similar local geomorphologic settings.Hence, it is possible to focus on changes in shape,
Fig. 3. Location of the 23 GPS stations operating on the island.
M. POSCOLIERI ET AL.70
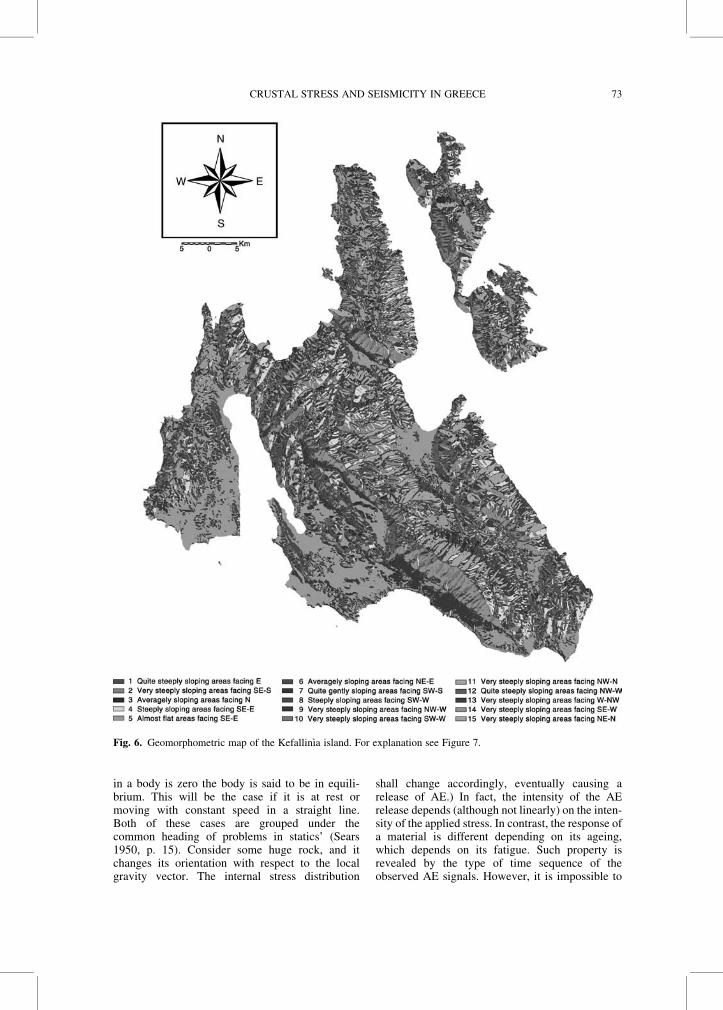
orientation and steepness, and to stress the impact oferosional and tectonic processes on the overall relief.The classification technique chosen for processinggradient values was an unsupervised cluster analysistechnique, ISODATA (Tou & Gonzales 1974; Hall& Khanna 1977). The following input parameterswere chosen for the application of this multivariateprocedure: 15 classes, threshold percent change of1.0%, and 25 maximum iterations.The resulting classification map (Fig. 6) assigns
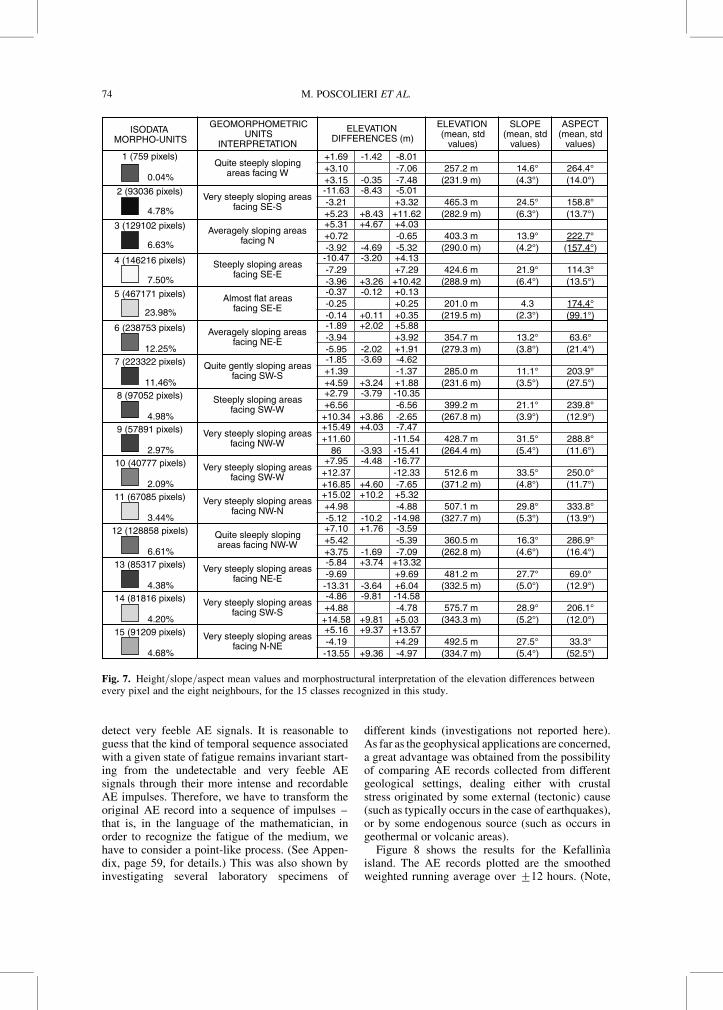
every class a given grey shade. Classes were laterstatistically analysed by computing mean and stan-dard deviation of the eight layers, which representthe elevation differences of every DEM pixel withrespect to the neighbourhood. In addition, aftercalculating slope and aspect values from the same
DEM, the mean and variance of these parametersand of height were computed for all 15 ISODATAclasses, and compared with the aforementionedeight-layer statistics, in order to give a correctgeomorphic interpretation of the classification(Fig. 7). The preliminary analysis and interpretationof the geomorphometric image (Fig. 6), comparedwith the geological and tectonic block map(Fig. 2b), show a good correspondence with thegeostructural setting of the area.
AE techniques and soil exhalation
Since 1 February 2003, a multifrequency AE stationhas been in operation in Kefallinıa, at a very central
Fig. 4. DGPS measurements. Comparison between first and second determinations (plots in the first column),second and third (second column), and first and third (third column), respectively. The first row deals with horizontaldisplacements, and the second row with vertical motions. The third row shows the regional large-scaledisplacement compared to the mainland (DION station).
CRUSTAL STRESS AND SEISMICITY IN GREECE 71
location of the island, and a nearby well is beingmonitored for Radon (Rn) content. Every AEdatum is a 30 s integrated signal at its respectivefrequency. Periods of anomalous AE activity wereobserved. Consistent with previous evidence fromthe Italian peninsula (Paparo et al. 2006, thisvolume), they denote microdeformations precedinga seismic crisis. The HF AE (at 200 kHz) are corre-lated with Rn exhalation from the well.The rationale of the analysis is hereafter briefly
explained. The AE signal is released wheneversome atomic bonds yield within a crystal structure,and it propagates through the entire solid probewithin which the crystals are embedded. Becauseof this, our AE recorder should be located on topof a rocky outcrop, which is the terminal of ahuge natural probe of unknown extension under-ground. Whenever a tectonic event makes the orien-tation of the natural probe change, the conspicuouscrustal stress that is thus generated causes some AErelease. The intensity of the AE recorded signaldepends on the (unknown) efficiency of the wave-guide that transfers the AE signal from its sourcethrough the detector. The HF AE will be the first
observed, corresponding to the yield of somelesser and tiny pores of the solid body. As soon assuch pores coalesce into comparatively largerpores, some progressively lower frequency AEwill be observed. These AE of progressivelylower frequency will be later followed by mechan-ical vibrations of still lower frequency, until theseismic roar is heard, the vibration of mechanicalstructures occurs, and finally the seismic shockoccurs. An earthquake, however, is not just a cata-strophe that causes damages whenever some mech-anical vibrations happen. It is, rather, a complexcrustal phenomenon that must be investigated inall its aspects, beginning from its atomic level thatreleases some HF AE until the occurrence of the‘catastrophe’.
In addition to the AE signal per se, which revealsthe occurrence of some change in the statics andtectonics of the area, implying a time variation ofthe crustal stress, fractal analysis of the timeseries of the AE signals (see Appendix, page 59,for details) gives an effective indication of thestate of fatigue of the solid rocks that are releasingthe AE. (Note, ‘When the resultant of all the forces
Fig. 5. Three-dimensional representation of the interferogram obtained by processing a couple of ERS-1 and -2 SARimages covering Kefallinia, with the main fault system of the island superimposed.
M. POSCOLIERI ET AL.72
in a body is zero the body is said to be in equili-brium. This will be the case if it is at rest ormoving with constant speed in a straight line.Both of these cases are grouped under thecommon heading of problems in statics’ (Sears1950, p. 15). Consider some huge rock, and itchanges its orientation with respect to the localgravity vector. The internal stress distribution
shall change accordingly, eventually causing arelease of AE.) In fact, the intensity of the AErelease depends (although not linearly) on the inten-sity of the applied stress. In contrast, the response ofa material is different depending on its ageing,which depends on its fatigue. Such property isrevealed by the type of time sequence of theobserved AE signals. However, it is impossible to
Fig. 6. Geomorphometric map of the Kefallinıa island. For explanation see Figure 7.
CRUSTAL STRESS AND SEISMICITY IN GREECE 73
detect very feeble AE signals. It is reasonable toguess that the kind of temporal sequence associatedwith a given state of fatigue remains invariant start-ing from the undetectable and very feeble AEsignals through their more intense and recordableAE impulses. Therefore, we have to transform theoriginal AE record into a sequence of impulses –that is, in the language of the mathematician, inorder to recognize the fatigue of the medium, wehave to consider a point-like process. (See Appen-dix, page 59, for details.) This was also shown byinvestigating several laboratory specimens of
different kinds (investigations not reported here).As far as the geophysical applications are concerned,a great advantage was obtained from the possibilityof comparing AE records collected from differentgeological settings, dealing either with crustalstress originated by some external (tectonic) cause(such as typically occurs in the case of earthquakes),or by some endogenous source (such as occurs ingeothermal or volcanic areas).
Figure 8 shows the results for the Kefallinıaisland. The AE records plotted are the smoothedweighted running average over +12 hours. (Note,
ISODATAMORPHO-UNITS
GEOMORPHOMETRICUNITS
INTERPRETATION
ELEVATION(mean, std
values)
SLOPE(mean, std
values)
ASPECT(mean, std
values)
ELEVATIONDIFFERENCES (m)
+1.69+3.10+3.15
-8.01-7.06-7.48
257.2 m(231.9 m)
14.6°(4.3°)
264.4°(14.0°)
-1.42
-0.35
1 (759 pixels)
0.04%
Quite steeply slopingareas facing W
-11.63-3.21+5.23
-5.01+3.32
+11.62465.3 m
(282.9 m)24.5°(6.3°)
158.8°(13.7°)
-8.43
+8.43
2 (93036 pixels)
4.78%
Very steeply sloping areasfacing SE-S
+5.31+0.72-3.92
+4.03-0.65-5.32
403.3 m(290.0 m)
13.9°(4.2°)
222.7°(157.4°)
+4.67
-4.69
3 (129102 pixels)
6.63%
Averagely sloping areasfacing N
-10.47-7.29-3.96
+4.13+7.29
+10.42424.6 m
(288.9 m)21.9°(6.4°)
114.3°(13.5°)
-3.20
+3.26
4 (146216 pixels)
7.50%
Steeply sloping areasfacing SE-E
-0.37-0.25-0.14
+0.13+0.25+0.35
201.0 m(219.5 m)
4.3(2.3°)
174.4°(99.1°)
-0.12
+0.11
5 (467171 pixels)
23.98%
Almost flat areasfacing SE-E
-1.89-3.94-5.95
+5.88+3.92+1.91
354.7 m(279.3 m)
13.2°(3.8°)
63.6°(21.4°)
+2.02
-2.02
6 (238753 pixels)
12.25%
Averagely sloping areasfacing NE-E
-1.85+1.39+4.59
-4.62-1.37+1.88
285.0 m(231.6 m)
11.1°(3.5°)
203.9°(27.5°)
-3.69
+3.24
7 (223322 pixels)
11.46%
Quite gently sloping areasfacing SW-S
+2.79+6.56+10.34
-10.35-6.56-2.65
399.2 m(267.8 m)
21.1°(3.9°)
239.8°(12.9°)
-3.79
+3.86
8 (97052 pixels)
4.98%
Steeply sloping areasfacing SW-W
+15.49+11.60
86
-7.47-11.54-15.41
428.7 m(264.4 m)
31.5°(5.4°)
288.8°(11.6°)
+4.03
-3.93
9 (57891 pixels)
2.97%
Very steeply sloping areasfacing NW-W
+7.95+12.37+16.85
-16.77-12.33-7.65
512.6 m(371.2 m)
33.5°(4.8°)
250.0°(11.7°)
-4.48
+4.60
10 (40777 pixels)
2.09%
Very steeply sloping areasfacing SW-W
+15.02+4.98-5.12
+5.32-4.88
-14.98507.1 m
(327.7 m)29.8°(5.3°)
333.8°(13.9°)
+10.2
-10.2
11 (67085 pixels)
3.44%
Very steeply sloping areasfacing NW-N
+7.10+5.42+3.75
-3.59-5.39-7.09
360.5 m(262.8 m)
16.3°(4.6°)
286.9°(16.4°)
+1.76
-1.69
12 (128858 pixels)
6.61%
Quite sleeply slopingareas facing NW-W
-5.84-9.69-13.31
+13.32+9.69+6.04
481.2 m(332.5 m)
27.7°(5.0°)
69.0°(12.9°)
+3.74
-3.64
13 (85317 pixels)
4.38%
Very steeply sloping areasfacing NE-E
-4.86+4.88+14.58
-14.58-4.78+5.03
575.7 m(343.3 m)
28.9°(5.2°)
206.1°(12.0°)
-9.81
+9.81
14 (81816 pixels)
4.20%
Very steeply sloping areasfacing SW-S
+5.16-4.19-13.55
+13.57+4.29-4.97
492.5 m(334.7 m)
27.5°(5.4°)
33.3°(52.5°)
+9.37
+9.36
15 (91209 pixels)
4.68%
Very steeply sloping areasfacing N-NE
Fig. 7. Height/slope/aspect mean values and morphostructural interpretation of the elevation differences betweenevery pixel and the eight neighbours, for the 15 classes recognized in this study.
M. POSCOLIERI ET AL.74
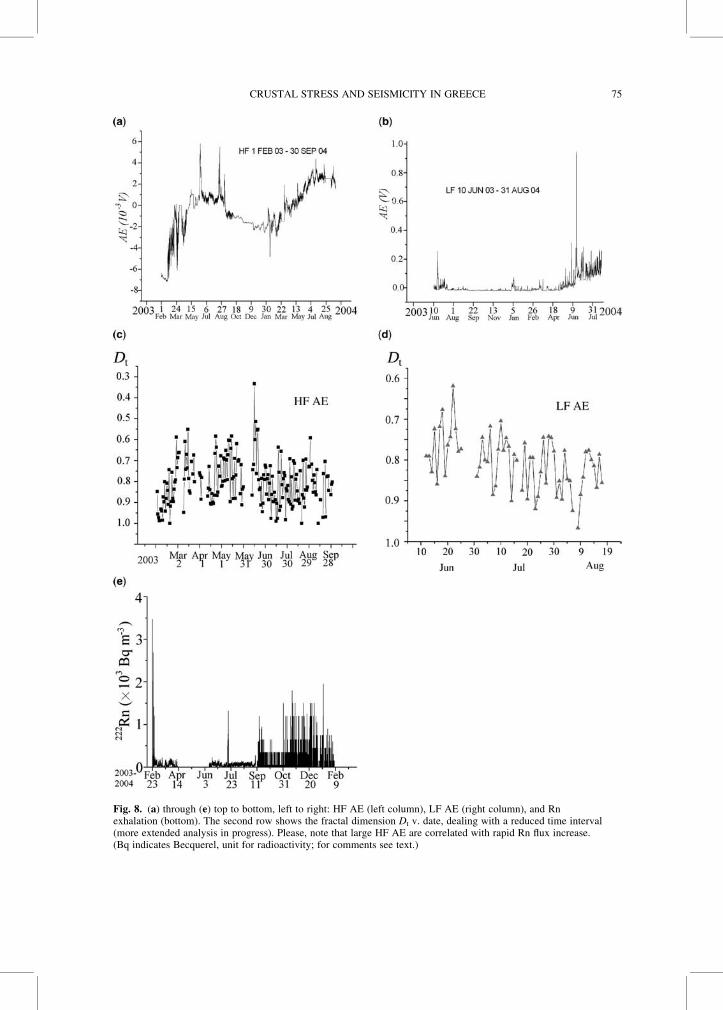
Fig. 8. (a) through (e) top to bottom, left to right: HF AE (left column), LF AE (right column), and Rnexhalation (bottom). The second row shows the fractal dimension Dt v. date, dealing with a reduced time interval(more extended analysis in progress). Please, note that large HF AE are correlated with rapid Rn flux increase.(Bq indicates Becquerel, unit for radioactivity; for comments see text.)
CRUSTAL STRESS AND SEISMICITY IN GREECE 75
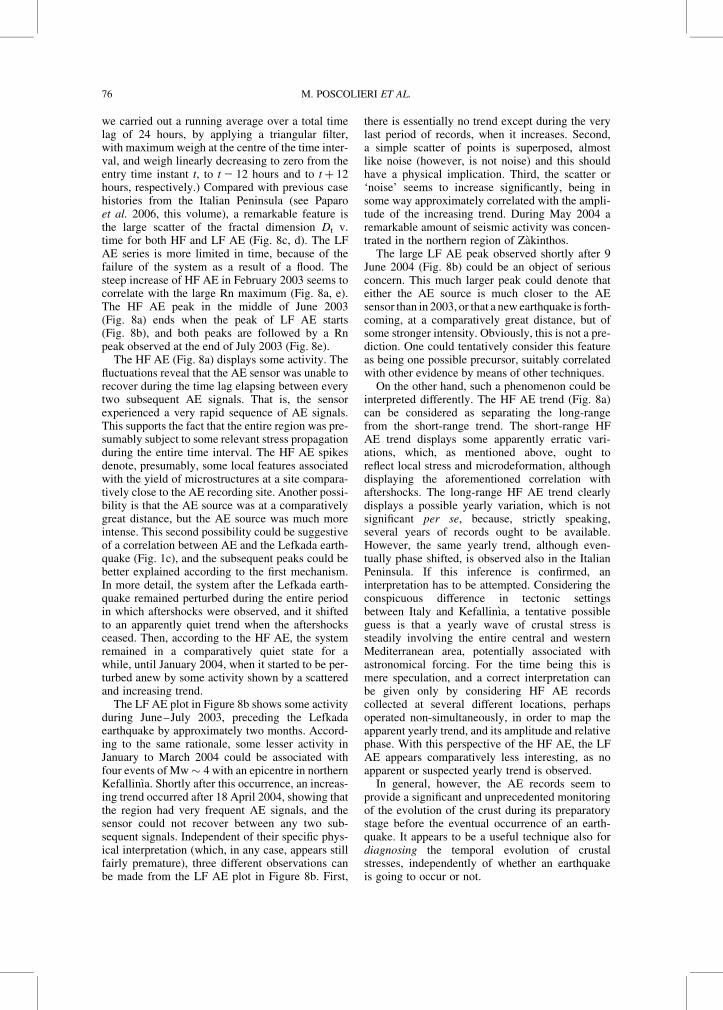
we carried out a running average over a total timelag of 24 hours, by applying a triangular filter,with maximum weigh at the centre of the time inter-val, and weigh linearly decreasing to zero from theentry time instant t, to t 2 12 hours and to t þ 12hours, respectively.) Compared with previous casehistories from the Italian Peninsula (see Paparoet al. 2006, this volume), a remarkable feature isthe large scatter of the fractal dimension Dt v.time for both HF and LF AE (Fig. 8c, d). The LFAE series is more limited in time, because of thefailure of the system as a result of a flood. Thesteep increase of HF AE in February 2003 seems tocorrelate with the large Rn maximum (Fig. 8a, e).The HF AE peak in the middle of June 2003(Fig. 8a) ends when the peak of LF AE starts(Fig. 8b), and both peaks are followed by a Rnpeak observed at the end of July 2003 (Fig. 8e).The HF AE (Fig. 8a) displays some activity. The
fluctuations reveal that the AE sensor was unable torecover during the time lag elapsing between everytwo subsequent AE signals. That is, the sensorexperienced a very rapid sequence of AE signals.This supports the fact that the entire region was pre-sumably subject to some relevant stress propagationduring the entire time interval. The HF AE spikesdenote, presumably, some local features associatedwith the yield of microstructures at a site compara-tively close to the AE recording site. Another possi-bility is that the AE source was at a comparativelygreat distance, but the AE source was much moreintense. This second possibility could be suggestiveof a correlation between AE and the Lefkada earth-quake (Fig. 1c), and the subsequent peaks could bebetter explained according to the first mechanism.In more detail, the system after the Lefkada earth-quake remained perturbed during the entire periodin which aftershocks were observed, and it shiftedto an apparently quiet trend when the aftershocksceased. Then, according to the HF AE, the systemremained in a comparatively quiet state for awhile, until January 2004, when it started to be per-turbed anew by some activity shown by a scatteredand increasing trend.The LF AE plot in Figure 8b shows some activity
during June–July 2003, preceding the Lefkadaearthquake by approximately two months. Accord-ing to the same rationale, some lesser activity inJanuary to March 2004 could be associated withfour events of Mw� 4 with an epicentre in northernKefallinıa. Shortly after this occurrence, an increas-ing trend occurred after 18 April 2004, showing thatthe region had very frequent AE signals, and thesensor could not recover between any two sub-sequent signals. Independent of their specific phys-ical interpretation (which, in any case, appears stillfairly premature), three different observations canbe made from the LF AE plot in Figure 8b. First,
there is essentially no trend except during the verylast period of records, when it increases. Second,a simple scatter of points is superposed, almostlike noise (however, is not noise) and this shouldhave a physical implication. Third, the scatter or‘noise’ seems to increase significantly, being insome way approximately correlated with the ampli-tude of the increasing trend. During May 2004 aremarkable amount of seismic activity was concen-trated in the northern region of Zakinthos.
The large LF AE peak observed shortly after 9June 2004 (Fig. 8b) could be an object of seriousconcern. This much larger peak could denote thateither the AE source is much closer to the AEsensor than in 2003, or that a new earthquake is forth-coming, at a comparatively great distance, but ofsome stronger intensity. Obviously, this is not a pre-diction. One could tentatively consider this featureas being one possible precursor, suitably correlatedwith other evidence by means of other techniques.
On the other hand, such a phenomenon could beinterpreted differently. The HF AE trend (Fig. 8a)can be considered as separating the long-rangefrom the short-range trend. The short-range HFAE trend displays some apparently erratic vari-ations, which, as mentioned above, ought toreflect local stress and microdeformation, althoughdisplaying the aforementioned correlation withaftershocks. The long-range HF AE trend clearlydisplays a possible yearly variation, which is notsignificant per se, because, strictly speaking,several years of records ought to be available.However, the same yearly trend, although even-tually phase shifted, is observed also in the ItalianPeninsula. If this inference is confirmed, aninterpretation has to be attempted. Considering theconspicuous difference in tectonic settingsbetween Italy and Kefallinıa, a tentative possibleguess is that a yearly wave of crustal stress issteadily involving the entire central and westernMediterranean area, potentially associated withastronomical forcing. For the time being this ismere speculation, and a correct interpretation canbe given only by considering HF AE recordscollected at several different locations, perhapsoperated non-simultaneously, in order to map theapparent yearly trend, and its amplitude and relativephase. With this perspective of the HF AE, the LFAE appears comparatively less interesting, as noapparent or suspected yearly trend is observed.
In general, however, the AE records seem toprovide a significant and unprecedented monitoringof the evolution of the crust during its preparatorystage before the eventual occurrence of an earth-quake. It appears to be a useful technique also fordiagnosing the temporal evolution of crustalstresses, independently of whether an earthquakeis going to occur or not.
M. POSCOLIERI ET AL.76
Conclusions
With respect to the AE technique, Kefallinıa and theItalian peninsula, although having very differenttectonic settings, display some interesting analo-gies, although every realistic inference on crustalstress evolution requires arrays of simultaneouslyoperated AE recording stations. More in general,this would allow us to better explore the potentialof fractal analysis of AE time series signals inorder to furnish important information on the stateof fatigue of stressed crustal rock volumes. Regard-ing the other techniques that are considered in thepresent study, their results appear to be in agree-ment with each other, although, as expected, nofinal conclusion seems as yet possible. The ‘large-scale’ information derived from satellite remotesensing or from DEM analysis lacks any adequatetime resolution. In contrast, the field records (AEand soil exhalation) have a good time resolution,although they are point-like, and one needs anarray of recording points to obtain informationvaluable for geophysical inference. Our resultsmight show, however, that the crustal stress inKefallinıa island propagates and interacts with (or,perhaps, it contributes to generating) the highlycomplicated faulting network responsible for theseismicity of the area. The degrees of freedom ofthe system are, however, too large, and no simpleor intuitive model can yet be proposed from the pre-sently available database.
References
ADEDIRAN, O. A., PARCHARIDIS, I., POSCOLIERI, M. &PAVLOPOULOS, K. 2004. Computer-assisted dis-crimination of morphological units on north-central Crete (Greece), by applying multivariatestatistics to local relief gradients. Geomorphology,58, 357–370.
CAVALLI, R. M., FUSILLI, L., PASCUCCI, S., PIGNATTI,S. & POSCOLIERI, M. 2003. Relationships betweenmorphological units and vegetation categories ofSoratte Mount (Italy) as inferred by processingelevation and MIVIS hyperspectral data. In:BENES, T. (ed.) Proceedings of 22nd EARSeLSymposium and General Assembly, Prague (CleckRep.), 4–6 June 2002, Millpress, Rotterdam(Netherlands), 573–579.
COCARD, M., KABLE, H. G. ET AL. 1999. New con-straints on the rapid crustal motion of the Aegeanregion: recent results inferred from GPS measure-ments (1993–1998) across the West HellenicArc, Greece. Earth and Planetary ScienceLetters, 172, 39–47.
GABRIEL, A. K., GOLDSTEIN R. M. & ZEBKER, H. A.1989. Mapping small elevation changes over largeareas: Differential radar interferometry. Journal ofGeophysical Research, 94(B7), 9183–9191.
HALL, D. J. & KHANNA, D. 1977. The ISODATAmethod of computation for relative perception ofsimilarities and differences in complex and real dataIn: ENSLEIN, K., RALSTON, A. & WILF, H. S. (eds)Statistical Methods for Digital Computers 3, JohnWiley Pub., New York, 340–373.
HANSSEN, R. F. 2001. Radar Interferometry. DataInterpretation and Error Analysis. KluwerAcademic Publishers, Dordrecht.
HUGENTOBLER, U., SCHAER, S. & FRIDEZ, P. 2001.Bernese GPS Software Version 4.2 Documen-tation. Astronomical Institute University of Bern,Switzerland.
LOUVARI, E., KIRATZI, A. A. & PAPAZACHOS, B. C.1999. The Cephalonia transform fault and its exten-sion to western Lefkada island (Greece). Tectono-physics, 308, 223–236.
MASSONNET, D. & FEIGL, K. L. 1995. Discriminationof geophysical phenomena in satellite radar inter-ferograms. Geophysical Research Letters, 22,1537–1540.
MASSONNET, D. & FEIGL, K. L. 1998. Radar interfero-metry and its application to changes in the Earth’ssurface. Review of Geophysics, 36, 441–500.
PAPADOPOULOS, G. A., KARASTATHIS, V., GANAS, A.,PAVLIDES,S., FOKAEFS,A.&ORFANOGIAUNAKI,K.2003. The Lefkada, Ionian Sea (Greece), shock(Mw 6.2) of 14 August 2003: Evidence for thecharacteristic earthquake from seismicity andground failures. Earth Physics Letters, 55,713–718.
PAPARO, G., GREGORI, G. P., POSCOLIERI, M.,MARSON, I., ANGELUCCI, F. & GLORIOSO, G.2006. Crustal stress crises and seismic activity inthe Italian peninsula investigated by fractal analy-sis of acoustic emissions, soil exhalation andseismic data emission (AE), soil exhalation andseismic data. In: CELLO, G. & MALAMUD, B. D.(eds) Fractal Analysis for Natural Hazards. Geo-logical Society, London, Special Publications,261, 47–61.
PARCHARIDIS, I., PAVLOPOULOS, A. & POSCOLIERI,M. 2001. Geomorphometric analysis of theVulcano and Nysiros island: clues of the defintionsof their volcanic landforms. In: GIOVANNELLI,F. (ed.) Proceedings of the International Workshop“The Bridge between Big Bang and Biology”,Stromboli (Messina, Italy), 13–17 September1999. CNR, President Bureau, Special Volume,310–320.
PARMEGIANI, N. & POSCOLIERI, M. 2003. Studio del-l’impatto antropico sull’assetto morfologico diun’area archeologica. In: Proceedings of the 7thASITA National Conference “L’informazione terri-toriale e la dimensione tempo”, Verona (Italy),28–31 October 2003, 2, 1569–1574.
PAVLIDES, S. B., PAPADOPOULOS, G. A., GANAS, A.,PAPATHANASSIOU, G., KARASTATHIS, V.,KERAMYDAS, D. & FOKAEFS, A. 2004. The 14August 2003 Lefkada (Ionian Sea) earthquake. In:Proceedings of the 5th International Symposiumon Eastern Mediterranean Geology, Thessaloniki,Greece, 14–20 April 2004, Paper T5-34, 1–4.
CRUSTAL STRESS AND SEISMICITY IN GREECE 77
PELTZER, G. & ROSEN, P. 1995. Surface displacementsof the 17 May 1993 Eureka Valley, California,earthquake observed by SAR interferometry.Science, 268, 1333–1336.
SACHPAZI, M., HIRN, A. ET AL. 2000. Western Hellenicsubduction and Cephalonia Transform: local earth-quakes and plate transport and strain. Tectonophy-sics, 319, 301–319.
SALVI, S., GANAS, A. ET AL. 2004. Monitoring long-term ground deformation by SAR Interferometry:examples from the Abruzzi, central Italy, andThessaly, Greece. In: Proceedings of 5th Inter-national Symposium on Eastern MediterraneanGeology, Thessaloniki, Greece, 14–20 April2004, Paper T7-17, 1–4.
SEARS, F. W. 1950. Mechanics, Heat and Sound.Addison-Wesley, Reading, MA.
TOU, J. T. & GONZALES, R. C. 1974. Pattern Recog-nition Principles. Addison-Wesley, Reading, MA.
UNDERHILL, J. R. 1989. Late Cenozoic deformation ofthe Hellenic foreland, Western Greece. GeologicalSociety of America Bulletin, 101, 613–634.
WRIGHT, J., PARSONS, B., ENGLAND, P. C. &FIELDING, E. J. 2004. InSAR observations of lowslip rates on the major faults of western Tibet.Science, 305, 236–239.
ZAHRADNIK, J., SERPETSIDAKI, A., SOKOS, E. &TSELENTIS, G.-A. 2005. Iterative deconvolutionof regional waveforms and a double-eventinterpretation of the 2003 Lefkada earthquake,Greece. Bulletin of the Seismological Society ofAmerica, 95, 159–172.
ZEBKER, H. A., ROSEN, P. A., GOLDSTEIN, R. M.,GABRIEL, A. K. & WERNER, C. L. 1994. On thederivation of coseismic displacement-fields usingdifferential radar interferometry – the Landersearthquake. Journal of Geophysical Research,99(B10), 19617–19634.
M. POSCOLIERI ET AL.78