Investigation of Pore Fluid Pressure Variations from Crustal ...
21
Investigation of Pore Fluid Pressure Variations from Crustal Deformation and Regional Gravity Flow: New Madrid Seismic Zone Grant no: 05HQGR0081 Final Technical Report Element Designation: III (Research on Earthquake Occurrence, Physics, and Effects) PIs: Lorraine W. Wolf and Ming-Kuo Lee Department of Geology and Geography Auburn University 210 Petrie Hall Auburn, AL 36849 Ph.: 334.844.4878 FAX: 334.844.4486 [email protected]; [email protected] www.auburn.edu/~wolflor www.auburn.edu/~leeming
-
Upload
khangminh22 -
Category
Documents
-
view
1 -
download
0
Transcript of Investigation of Pore Fluid Pressure Variations from Crustal ...

Investigation of Pore Fluid Pressure Variations from Crustal Deformation and Regional Gravity Flow: New
Madrid Seismic Zone
Grant no: 05HQGR0081 Final Technical Report
Element Designation: III (Research on Earthquake Occurrence, Physics, and Effects)
PIs: Lorraine W. Wolf and Ming-Kuo Lee
Department of Geology and Geography Auburn University
210 Petrie Hall Auburn, AL 36849 Ph.: 334.844.4878
FAX: 334.844.4486 [email protected]; [email protected]
www.auburn.edu/~wolflor www.auburn.edu/~leeming

1
Abstract
This study was conducted as part of an ongoing study to investigate the interrelationships of excess pore fluid pressures, seismicity, and fault stability. In this project, we initiated two aspects of hydrologic research related to seismic hazard: (1) a quantitative analysis of overpressure development in basin strata resulting from gravity flow and crustal deformation, and (2) a quantitative analysis of factors involved in overpressure development in near-surface sediments using simplified geologic models. The first aspect of the research involved the development of a quasi-coupled strain-fluid pressure model to track pore pressure changes initiated by gravity flow and by large displacements along major faults, given simple models that approximate the geology to first order. The second aspect involved analyzing water levels in wells and modeling the origin and distribution of excess pore pressure based on hydrostratigraphic relationships. Hydrogeologic data were incorporated into the groundwater flow models to assess the development of overpressures in two case studies. The research explores how the propagation of overpressures might affect deep fault stability and the potential for near-surface earthquake-induced hazards, such as increased stream discharge and changes in water-table levels and groundwater flow. The specific project objectives were (1) to develop models to predict fluid pressure changes due to elastic strain generated by slip on major faults; (2) to quantify the transient nature of pore pressure development and propagation using simple geologic models that consider thickness and permeability of confining layers; and (3) to test model predictions of fluid pressure variations against the present-day distribution of documented overpressures and liquefaction deposits. For model refinement and assessment, we applied the algorithms in two case studies, one focused on the New Madrid seismic zone (NMSZ) in the central U.S., and the other centered on the 1999 Chi-Chi earthquake in Taiwan. A documented history of widespread soil liquefaction, existing overpressures in the Mississippi Embayment, and the potential for large earthquakes makes the NMSZ zone an appropriate choice for studying overpressures generated by gravity flow. The Chi-Chi case study was chosen because excellent data sets document coseismic strain (GPS) and changes in water levels and stream discharge.
The work pursued in this study has resulted in development of a quasi-coupled deformation and fluid pressure algorithm to study to first order the effects of coseismic elastic strain on pore-fluid pressure changes. It has led to several publications and one Ph.D. thesis (see below). Codes developed in the course of the grant are available through the PIs websites. Using the models developed, we suggest a mechanism whereby overpressures in the NMSZ can be sustained by gravity flow and enhanced by coseismic strain. In the case of Chi-Chi, we assert that at least three mechanisms are required to explain observed earthquake-induced hydrologic changes. The project expanded upon our previous work by integrating two numerical codes: 3D-DEF (Gomberg, 1993; Gomberg and Ellis, 1993, 1994) and 3PFLOW (Lee and Wolf, 1998).
Publications arising from this grant Affane, Aji Chadia, 2007, Poroelasticity, Ph.D. thesis, Auburn University, 151 p. (available
online at http://graduate.auburn.edu/fpdb/auetd/AFFANE_AJI_10.pdf.

2
Lee, M.-K. P. J. Baird, P.J., Wolf, L. W. Jean, J. Affane, C., and Meir, A.J., 2006, Numerical
Analysis of Poroelastic Processes in Crustal Rocks and Alluvial Sediments During Strong Earthquakes, AGU Western Pacific Geophysical Meeting, July 24-27, Beijing, China.
Lee, M.-K., J. P. Baird, L. W. Wolf, J.-S. Jean, C.-H. Wang, and H. Kao, Numerical analysis of
groundwater anomalies and streamflow changes associated with the 1999 Chi-Chi earthquake, Taiwan, in revision.
Wolf, L. W., M-K. Lee, S. Browning, and M. P. Tuttle, 2005, Numerical Analysis of
overpressure development in the New Madrid seismic zone, Bull. Seis. Soc. Am., 95, p. 135-144.
Wolf, L. W., Lee, M-K,. and Baird, P., 2006, Poroelastic Modeling of the Mw 7.6 Chi-Chi,
Taiwan, Earthquake, Eos Trans. AGU, 87(52), Fall Meet. Suppl., Abstract T32A-03.
Results
Gravity Flow and Overpressure in the NMSZ
Spatial relationships among regions of abnormal fluid pressures, seismicity, wave velocity, and liquefaction in the NMSZ have been recognized by several authors. Al-Shukri and Mitchell (1988), Hamilton and Mooney (1990), and Vlahovic et al. (2000) observed correlations between anomalously low P-wave velocities and seismically active areas in the NMSZ. Some of these studies attribute low velocities in the upper 5 km of the crust to regions of elevated fluid pressures. Widespread liquefaction has been attributed to historic (Saucier, 1977; Obermeier, 1996) and prehistoric earthquakes (Tuttle et al., 2002), suggesting the development of excess fluid pressures in near-surface sediments over broad regions of the NMSZ. Similarly, regions of anomalous resistivity beneath the Blytheville-Pascola Arch have been associated with zones of excess fluid pressures (Stanley and Rodriguez, 1992; Rodriguez et al., 1996). Although these correlations are intriguing, none of the previous studies construct hydrological models that might explain the development of anomalous fluid pressures in the NMSZ.
There are several hypotheses on the origin and preservation of anomalous fluid pressures in sedimentary environments. Transient processes responsible for overpressure generation may include (1) mechanical (compaction or tectonic collision) or thermal (aquathermal expansion) loading of porous media, (2) generation of new fluid sources (oil or gas generation; smectite-illite dehydration), and (3) fluid movement (steady-state gravity flow) or buoyancy. In this study, we use mathematical and numerical models to explore the development of modern excess pore pressures in the shallow crust of the NMSZ resulting from topographically driven flow. Sediment compaction and aquathermal expansion caused by rapid burial are not considered because the study area has not experienced

3
active subsidence since Pliocene time. Using a hydrostratigraphic model constructed from well data, this study explores how the observed magnitude of excess pore pressures can be sustained in the discharge area by gravity flow. The model is aimed at identifying basin-scale hydrogeologic factors contributing to the development of ambient overpressure conditions. The study considers how these conditions may, in turn, relate to geophysical anomalies in the uppermost crust (< 5 km) and the large-scale hydrologic response of the basin to large earthquakes. Numerical Modeling We used a finite-difference numerical modeling code (Bethke et al., 1993) to simulate fluid migration and the distribution of abnormal pressure resulting from local and regional topographic relief in the NMSZ. The mathematical basis for the modeling algorithm is described in Lee and Wolf (1998) and Wolf et al. (2005). The model is aimed at identifying basin-scale hydrogeologic factors contributing to the development of overpressure conditions that may, in turn, influence the hydrologic response of the basin during strong-ground shaking. Simulations for the regional-scale model were generated along a generally east-west cross-section extending across Arkansas, Tennessee, and Mississippi (Fig. 1). Data for this hydrostratigraphic model are derived from 11 geologic logs and wells in Arkansas, Tennessee, and Mississippi (Wolf et al., 2005). Each hydrostratigraphic unit in the model consists of varying fractions of three different rock types: shale, sandstone, and, carbonate. General hydrologic properties for each rock type, such as porosity and permeability, are assigned to represent the transport characteristics of each stratigraphic unit during burial and compaction. The correlations for porosity and permeability of all rock types are taken from representative data from intracratonic basins (e.g., Illinois basin, Bethke et al. 1993). The bottom of the cross section is set to be a no-flow boundary to reflect low-permeability, Precambrian basement rock. The sides of the basin remain open to groundwater flow.
Lawrence
Craighead
Pointsett
CrossCrittenden
Shelby Fayette
Haywood
Madison
Rock type: ss, fraction
0 1.5
50 km
.5 km
ƒwell 1 ƒwell 2 ƒwell 3ƒwell 4 ƒwell 5 ƒwell 6 ƒwell 7 ƒwell 8 ƒwell 9 ƒwell 10
ƒwell 11
Clairborne Group
Wilcox Group
Portors CreekClay
Cam
bria
n-Si
luri
an C
arbo
nate
s
Upper CretaceousSands
EW
(A) (B)
Figure 1. (a) Reconstructed cross section of the Mississippi Embayment. Section extends about 280 km across Arkansas, Tennessee, and Mississippi. Regional confining aquitards are shown by gray color. (b) Locations of wells (solid circles) used in reconstructing geologic cross-section. Liquefaction deposits are shaded as blue. Red circles are locations of artesian wells exhibiting excess heads.

4
In a layered system composed of more than one sediment type, the hydrologic interconnection in the vertical direction is controlled mainly by the sediment with the lowest permeability (Freeze and Cherry, 1979). By this principle, the hydrologic connection between the shallow sediment and the deeper Cretaceous strata in NMSZ is likely controlled by the vertical permeability of confining units in the regionally extensive Porter’s Creek Clay. Although the hydrostratigraphic cross-section used in the overpressure calculations is derived from wells along a profile not collocated with the area of known artesian heads, the regional extent of the Porter’s Creek Clay and other stratigraphic units suggest that the model provides a reasonable representation of the basin. The vertical permeability of clay confining units is a difficult parameter to measure. The values of permeability vary with the scale on which it is observed due to geologic heterogeneity. Even in the absence of measurement error, values determined by laboratory or borehole tests may not necessarily be applied on a regional scale. The permeability of clay confining units thus represents a principle uncertainty in modeling large-scale groundwater flow. For sensitivity analyses, permeability values for the clay confining units from 10-6 to 10-4 darcy (1 darcy = 10-8 cm2), maintaining an anisotropy ratio of 10, are used in our models. These permeability values are in the same range as those observed for moderately compacted clay (Neuzil, 1994).
Recharge in the Mississippi Embayment occurs along its topographically high eastern and western margins, while discharge primarily occurs in the center of the embayment, near the Mississippi River (Fig. 2). The average flow velocity in the embayment predicted by the model is on the order of m/yr, which is consistent with field data of Ackerman (1996). The Porter’s Creek and the Clairborne Group confining units inhibit upward groundwater flow, which allows overpressures to develop in the underlying strata. Modeling results indicate an extensive region of overpressure prevailing in the central basin from well 4 to well 8 in the Upper Cretaceous sands and the Paleozoic carbonates (Fig. 2).
Assuming the lowest value in our range of permeabilities (k = 10-6 to 10-4 darcy) for the Porter’s Creek clay confining unit, the maximum overpressure in the embayment is approximately 10 atm. An increase in permeability to 10-4 darcy enhances upward fluid flow and reduces the magnitude of overpressure in underlying Cretaceous aquifers to about 5 atm. The predicted range of excess pressures (5 to 10 atm) using these values is slightly higher than the observed elevation heads (10-30 m) of artesian wells that penetrate the Upper Cretaceous and Paleozoic aquifers in the study area. Figure 2a shows the result when a permeability of 10-5 for the confining unit is assumed.
In other simulations, we examine how a shallow, vertical fault zone in the NMSZ may influence groundwater flow and the distribution of overpressure in the region. The model includes a fault zone (near well 4) that extends vertically from the deep Cambrian strata through the Porter’s Creek Clay (Fig. 2b). Based on shallow seismic reflection data, several authors have suggested that faulting may extend through Paleozoic rocks and upward into Tertiary units (e.g., Luzietti et al., 1992; Van Arsdale, 2000). The permeability of the fault zone is set to one darcy so that the fault acts as a conduit through which the groundwater can flow and overpressures can dissipate. The permeability of the non-faulted portion of confining units is held constant as 10-5 darcy. The predicted maximum overpressures drop to 4 atm in the underlying Upper Cretaceous and Paleozoic aquifers because fluids are permitted to escape through the fault (Fig. 2b). The predicted

5
magnitude of excess pore pressure (< 4 atm) when a permeable fault zone is present agrees better with observed field data of artesian well heads (< 30 m), suggesting that the main confining units in the embayment may be breached by faults.
Implications of the Regional Model
Both geologic and geophysical evidence support the prevailing overpressure condition and the circulation of deep fluids to the shallow strata in the NMSZ. The area
Overpressure, atm
–5 10020 km
0.5 km
ƒwell 1 ƒwell 2 ƒwell 3ƒwell 4 ƒwell 5 ƒwell 6 ƒwell 7 ƒwell 8 ƒwell 9 ƒwell 10
ƒwell 11
Cambrian LamotteSandstone
Clairborne GroupWilcox GroupUpper CretaceousSand Aquifers
Cam
bria
n-Si
luri
anC
arbo
nate
Overpressure, atm
–5 5020 km
0.5 km
(a)
(b)
Porter's Creek Clay
Fault Zone
Mississippi River Valley Aluvium
Figure 2. (a) Calculated groundwater flow and overpressure distribution in the Mississippi Embayment in response to regional topography. Arrows show predicted flow directions. Colors map the abnormal pore pressures from -5 atm (underpressure) in the recharge area to +10 atm (overpressure) in the discharge area. (b) Same as above except model includes vertical fault (permeability = 1 darcy) extending from deep Cambrian strata through the Porter’s Creek Clay near well 3.

6
of overpressure predicted by the model coincides stratigraphically with a zone in the shallow crust (< 5 km) of low P-wave velocities derived by Al-Shukri and Mitchell (1998) from a 3-D inversion of travel-time residuals from local earthquakes and a region of low resistivity determined from 2-D inversions of magnetotelluric data (Rodriguez et al., 1996). The modeling result supports previous assertions that these geophysical anomalies may reflect the presence of excess pore pressures and mechanically weak rocks. Al-Shukri and Mitchell (1988) note that observed velocity reductions (at least 7%) are greatest in the water-saturated Cambrian-Silurian carbonate strata, which is consistent with our model predictions (Fig. 2). Although the observed artesian heads and the overpressures calculated by our model are not large, some workers assert that as little as 0.1 MPa (~ 1 atm) can affect fault stability (Roeloffs, 1988).
Many investigators (e.g., Kerrich et al. 1984; Nesbitt and Muehlenbachs, 1989) have used stable isotopic compositions to identify the source of fluids present in deep fault zones of a number of different crustal environments. Depleted δ18O values indicate that fluids in several deep seismic fault zones are of meteoric origin. Brahana et al. (1988) analyzed the δ2H and δ18O compositions of groundwater in the Upper Cretaceous sand aquifers in the Mississippi Embayment. The groundwaters range in δ18O from -6.1 to -5‰ and δ2H from -39 to -29‰, respectively, relative to Standard Mean Ocean Water (SMOW). The light isotopic compositions are compatible with those of rainfall in the embayment and thus reflect in large part the circulation of meteoric water in these aquifers. Active hydrothermal circulation beneath the region indicates hydraulic continuity of the Paleozoic and Cretaceous aquifers and circulation of shallow meteoric water and deep metamorphic fluids through faults or fractures in Paleozoic strata (McKeown & Diehl, 1994). McKeown & Diehl (1994) also note solid geologic evidence for hydrothermal and hydrofracturing processes, including dilation and mineral filling of styolites and fractures in siliciclastic rocks (to ~ 4 km depth) and shales.
Our modeling results (Fig. 2b) suggest that the presence of permeable fractures or faults could facilitate the propagation of excess pore pressures from the Upper Cretaceous and Paleozoic aquifers to the shallow layers, thus affecting their anelastic properties. Christensen and Wepfer (1989) note that raising pore pressure has roughly the same effect on velocity as lowering confining pressure by a similar amount. Our hypothetical case cannot delimit how far excess pore pressures could propagate to shallow sediments; however, if they can be transmitted to near-surface sediments, they might reduce effective stress and increase the potential for liquefaction at depths greater than could otherwise occur under hydrostatic conditions.
The hydrogeology of the deep NMSZ below our modeling domain remains poorly understood. The current state of tectonic compression in the Mississippi Embayment (Zoback and Zoback, 1989) may generate excess pore pressure in the deep NMSZ and deserves further investigation if hydrogeologic data of deep crustal rocks and faults become available. Quasi-coupled coseismic strain and overpressure modeling
In this work, we consider seismically induced strains that lead to changes in pore pressure in a one-way coupled process. The program includes a boundary element crustal deformation model, 3D-DEF (Gomberg, 1993; Gomberg and Ellis, 1993, 1994) and a finite-difference fluid-flow model, 3D-PFLOW (Lee and Wolf, 1998). 3D-DEF utilizes
7
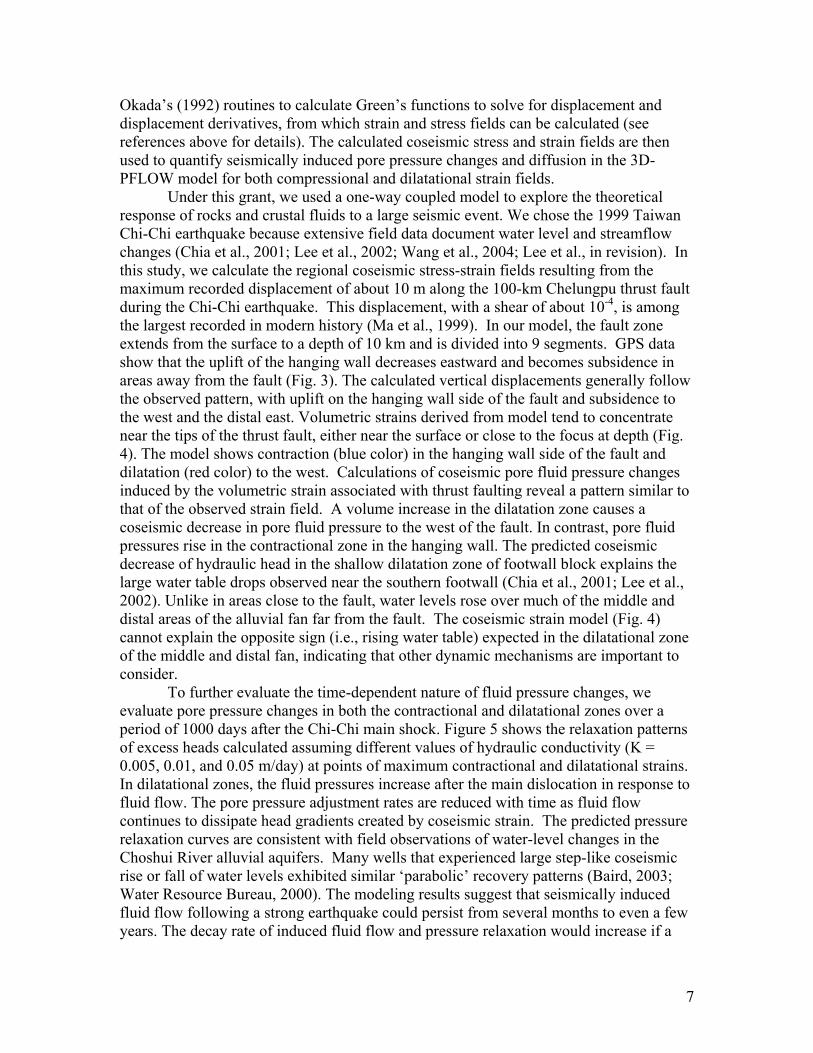
Okada’s (1992) routines to calculate Green’s functions to solve for displacement and displacement derivatives, from which strain and stress fields can be calculated (see references above for details). The calculated coseismic stress and strain fields are then used to quantify seismically induced pore pressure changes and diffusion in the 3D-PFLOW model for both compressional and dilatational strain fields.
Under this grant, we used a one-way coupled model to explore the theoretical response of rocks and crustal fluids to a large seismic event. We chose the 1999 Taiwan Chi-Chi earthquake because extensive field data document water level and streamflow changes (Chia et al., 2001; Lee et al., 2002; Wang et al., 2004; Lee et al., in revision). In this study, we calculate the regional coseismic stress-strain fields resulting from the maximum recorded displacement of about 10 m along the 100-km Chelungpu thrust fault during the Chi-Chi earthquake. This displacement, with a shear of about 10-4, is among the largest recorded in modern history (Ma et al., 1999). In our model, the fault zone extends from the surface to a depth of 10 km and is divided into 9 segments. GPS data show that the uplift of the hanging wall decreases eastward and becomes subsidence in areas away from the fault (Fig. 3). The calculated vertical displacements generally follow the observed pattern, with uplift on the hanging wall side of the fault and subsidence to the west and the distal east. Volumetric strains derived from model tend to concentrate near the tips of the thrust fault, either near the surface or close to the focus at depth (Fig. 4). The model shows contraction (blue color) in the hanging wall side of the fault and dilatation (red color) to the west. Calculations of coseismic pore fluid pressure changes induced by the volumetric strain associated with thrust faulting reveal a pattern similar to that of the observed strain field. A volume increase in the dilatation zone causes a coseismic decrease in pore fluid pressure to the west of the fault. In contrast, pore fluid pressures rise in the contractional zone in the hanging wall. The predicted coseismic decrease of hydraulic head in the shallow dilatation zone of footwall block explains the large water table drops observed near the southern footwall (Chia et al., 2001; Lee et al., 2002). Unlike in areas close to the fault, water levels rose over much of the middle and distal areas of the alluvial fan far from the fault. The coseismic strain model (Fig. 4) cannot explain the opposite sign (i.e., rising water table) expected in the dilatational zone of the middle and distal fan, indicating that other dynamic mechanisms are important to consider.
To further evaluate the time-dependent nature of fluid pressure changes, we evaluate pore pressure changes in both the contractional and dilatational zones over a period of 1000 days after the Chi-Chi main shock. Figure 5 shows the relaxation patterns of excess heads calculated assuming different values of hydraulic conductivity (K = 0.005, 0.01, and 0.05 m/day) at points of maximum contractional and dilatational strains. In dilatational zones, the fluid pressures increase after the main dislocation in response to fluid flow. The pore pressure adjustment rates are reduced with time as fluid flow continues to dissipate head gradients created by coseismic strain. The predicted pressure relaxation curves are consistent with field observations of water-level changes in the Choshui River alluvial aquifers. Many wells that experienced large step-like coseismic rise or fall of water levels exhibited similar ‘parabolic’ recovery patterns (Baird, 2003; Water Resource Bureau, 2000). The modeling results suggest that seismically induced fluid flow following a strong earthquake could persist from several months to even a few years. The decay rate of induced fluid flow and pressure relaxation would increase if a

8
smaller specific storage or a larger hydraulic conductivity is assumed (Fig. 5). Our variational analysis shows that induced excess pore pressures dissipate almost instantaneously in relatively conductive (K > 0.05 m/day) crustal rocks. While low hydraulic conductivity (K < 0.01 m/day) permits the development of significant coseismic excess pressures that may evolve to trigger aftershocks months or even years after the main shock. The estimated threshold conductivity (< 0.01 m/day) is near the low end of aquifer-test data for fractured crystalline rocks (10-2 to 103 m/day, Freeze and Cherry, 1979). It should be noted that geologic complexities are not incorporated into the preliminary one-way models. Our initial effort was aimed at providing a first-order estimate on pore pressure changes from mechanical deformation.
Figure 3. (a) Calculated vertical coseismic displacement along the Chelungpu fault (thick black line) for the 1999 Chi-Chi earthquake based on a 9-segment fault model with 10-m maximum slip. Cross-sectional view of strain along A-A’ depicted in Figure 7. (b) Observed vertical displacements from GPS data [Yu, et al., 2001]. Note maximum uplift along the hanging wall immediately to the east of the fault and subsidence to the west as well as the distal east.
120º00´E
23º4
5´N
120º00´E
23º4
5´N
TaiwanStrait
0
Ch
elu
ngp
uFa
ult
2 meters
dow
n
up
2 meters
dow
n
up
N
10 km
cm
(A)
(B)

9
Time (days)
Exc
ess
Hea
ds(m
)
0 250 500 750 1000
-600
-400
-200
0
200
400Compressional Zone
Dilatational Zone
K = 0.005 m/dayK = 0.01K = 0.05
K = 0.005 m/dayK = 0.01K = 0.05
Time (days)
Exc
ess
Hea
ds(m
)
0 250 500 750 1000
-600
-400
-200
0
200
400Compressional Zone
Dilatational Zone
K = 0.005 m/dayK = 0.01K = 0.05
K = 0.005 m/dayK = 0.01K = 0.05
Seismic loading and sediment compaction Large fluid pressures in excess of hydrostatic can develop in unconsolidated,
saturated sandy sediments during strong earthquakes. Cyclic shear waves cause re-arrangement and compaction of loose sand and subsequently pore-fluid pressures can increase dramatically when water drainage is inhibited by overlying low-permeability
Figure 5. Transient pore pressure changes (expressed as excess heads) near fault tip as a function of time after initial rupture. Curves show the evolution of excess head for hydraulic conductivity values of 0.005 (dashed), 0.01 (bold line), and 0.05 (thin line) m/day, respectively. Volume expansion in dilatational zone causes an initial decrease in pore-fluid pressure. The head rebounds afterwards in response to fluid migration from compressional zone to dilatational zone. Excess heads dissipate almost instantaneously in higher conductivity rocks (K > 0.05 m/day), but can take several months to years in rocks of lower conductivity.
Figure 4. Calculated volumetric strain (blue = negative, compaction; red = positive, dilation) along cross-section in southern portion of the Chelungpu thrust fault (see Fig. 6). Arrows indicate relative displacement along fault. Strain is concentrated near tips of fault rupture. The model predicts compression immediately to the east of the fault, and dilatation to the west (> 10 km) and to the distal east (10-15 km from fault trace).

10
confining units (Kramer, 1996). If the pore-fluid pressure builds up to a point approaching the overburden pressure, the effective stress approaches zero and earthquake-induced liquefaction can occur. Wang et al. (2001) suggested that cyclic seismic shaking may have initiated sediment consolidation and consequent rising pore pressure and liquefaction in the Choshui alluvial fan. We use a numerical model based on Bethke et al. (1993) to calculate pore pressure evolution due to collapse of pore volume during sediment compaction. The model is applied to hydrologic changes and overpressure development resulting from compaction of the unconsolidated alluvial sediments during seismic shaking. The effect of seismically induced compaction is included as a “forcing” term describing rates of pressure changes with collapse of pore volume
tg
zPk
zxPk
xtP zx
∂∂
−−⎥
⎦
⎤⎢⎣
⎡⎟⎠⎞
⎜⎝⎛ −∂∂
∂∂
+⎥⎦
⎤⎢⎣
⎡⎟⎠⎞
⎜⎝⎛∂∂
∂∂
=∂∂ φ
φρ
μμφβ
11
(1)
where kx and kz are permeability in the x and z directions, β is compressibility of pore fluid, μ is viscosity of fluid, P is pore fluid pressure, and φ is porosity. The equation is used to calculate the net pressure change resulting from compaction (pore collapse), provided that porosity and settling velocity of the aquifer is solved by the medium continuity equation (Bethke et al. 1993).
For this study, we use equation (1) to quantify the pore pressure change in a confined sandy aquifer during loading by seismic waves, as we vary thickness and permeability of overlying confining layers. The numerical model simulates the compaction of a three-layer system consisting of, from bottom to top, a sandy aquifer (thickness = 100 m), a clay confining unit, and an unconfined sand (thickness = 30 m). The model assumes that the direction of seismic loading is normal to the bedding planes. The loading increases the total stress from about 1.3 to 2.1 MPa at the bottom of the confined aquifer. Compaction drives fluids upward and toward the shallow unconfined unit, through the confining clay. Our first sensitivity analysis explores how variations in permeability (10-1 to 10-11 darcy) of the confining layer affects the magnitude of excess pressure (Figure 6a). We repeat the simulations holding the permeability of the confining layer constant as 10-3 darcy but allowing thickness of the confining layer to vary from 2 to 30 m (Figure 6b). Modeling results show that thin, permeable confining layers allow fluids to be expelled quickly, thereby preventing the development of significant overpressure in excess of hydrostatic in the shallow confined sediments. In contrast, thick, low-permeability confining layers provide the optimal sealing conditions for overpressure development. The results of the simulations may help to explain why certain overpressure zones show a high occurrence of liquefaction features, such as sand blows, while others do not. The modeling results are generally consistent with field data that document high overpressures and liquefaction in aquifers of the middle alluvial fan, where sediments are confined and exhibit a high vulnerability index.

11
Figure 6. Calculated overpressure vs. depth for a three-layer system (see text) from compaction during seismic loading. Curves show results of models assuming different values of (a) permeability (in logarithm of darcy) and (b) thickness (in m) of a clay confining unit.
Enhanced permeability and gravity-driven flow
An alternative mechanism for producing overpressure in sedimentary basins is seismically enhanced gravity-driven fluid flow through high-angle fractures in a recharge zone (Wang et al., 2004; Wolf et al., 2005). Our recent modeling studies (Wolf et al., 2006; Lee et al., in revision) suggests that regional gravity-driven fluid flow can generate significant overpressures near groundwater discharge areas under certain confining conditions. To explore this mechanism, we use numerical modeling techniques to evaluate how such gravity flow could enhance groundwater discharge and generate overpressures in the mountain foothills and alluvial fan of central Taiwan, two areas in which the hydrologic response is not explained by the coseismic strain model. A basin-scale hydrology model is used to characterize pre-seismic and coseismic regional groundwater flow in central western Taiwan. The model is aimed at investigating whether permeability enhancement from the opening of vertical fractures in the pre-Miocene mountains to the east of the main rupture could enhance water release, near-surface groundwater discharge, and overpressure development in alluvial sediments near the foothills, thus accounting for observations not consistent with predictions from previously discussed mechanisms. Using the gravity-driven flow model, we compare pre- and coseismic groundwater flow patterns and pressure conditions.
Simulations for the regional-scale model were generated along an east-west cross-section extending from the Choshui River alluvial fan to the pre-Miocene mountains in central western Taiwan (Fig. 7). The geologic strata in the study area are divided into several major hydrostratigraphic units, including pre-Miocene, Miocene, Pliocene, and alluvium and terrace formations. Each hydrostratigraphic unit consists of varying fractions of shale, sandstone, and gravel. Details of the modeling process and assumptions are given in (Lee et al., in revision).
Overpressure (MPa)
Dep
th(m
)
0 0.1 0.2 0.3 0.4
0
20
40
60
80
100
120
140
2 m
5 m 10 m
20 m
30 m
Overpressure (MPa)
Dep
th(m
)
0 0.1 0.2 0.3 0.4 0.5 0.6 0.7
0
20
40
60
80
100
120
140
Unconfinedaquifer
Confiningunit
Confinedaquifer
-1-3
-7
-8
-9 -11
101010 10
10
10
10 10
(A) (B)
Overpressure (MPa)
Dep
th(m
)
0 0.1 0.2 0.3 0.4 0.5 0.6 0.7
0
20
40
60
80
100
120
140
Unconfinedaquifer
Confiningunit
Confinedaquifer
-1-3
-7
-8
-9 -11
101010 10
10
10
10 10
(A) (B)

12
Figure 8 contains a hydrologic simulation used to examine how seismically
induced vertical fractures (vertical permeabilities ~ one darcy) in the mountain recharge areas might influence groundwater flow, stream discharge, and overpressure development in the foothills and outflow areas. Hypothesized fracture zones in the mountains act as conduits through which the groundwater can flow and water is released. Modeling results show that the presence of fracture zones with high permeability allows rapid downward recharge of water. This downward flow could explain the decline of water levels observed in many wells in the foothills. Draining of groundwater from the mountains to the underlying strata reverses the flow direction in the shallower alluvial sediments near the foothills. Groundwater migrates downward in prior to the opening of the fractures, but changes to predominantly upward flow in the alluvial sediments after the opening of vertical fractures. By considering a surface area of 500 km2 for the watershed basin in the foothills within 10 km east of the Chelungpu fault, the amount of near-surface enhanced vertical discharge is estimated to be about 60 m3/s. This result is in general agreement with observed coseismic stream discharge increases from 38 to 113 m3/s in the Choshui River and Wushi basins. The modeling result supports the
10 km
1 km
Pakuashananticline Chelungpu
faultShuangtung
fault
Alluvium
Miocene-Pliocene
Chinshuishale
Miocene-Pliocene
Alluvium Miocene andPre-Miocene
Chi-Chihypocenter
A A‘
AlluviumTerrace
PlioceneMiocene
Pre-Miocene
Ta-an River
AA'
Wu River
ChoshuiRiver
0 10 km
TaiwanStrait
Taichung
Chi-ChiEpicenter
PhillippinSea Plate
EurasianPlate
Chl
ungp
uFa
ult
ShangtungFault
Figure 7. (a) General geologic map and (b) reconstructed cross section of the central western Taiwan [after Lee, et al., 2002]. Section extends about 44 km across the Pakuashan High and Chelungpu and Shuangtung faults. The regional confining aquitard (the Chinshui Shale) is shown by gray color.

13
hypothesis that coseismic release of water from mountainous regions through vertical fractures could account for observed increases in streamflow in central western Taiwan.
Poroelasticity model development
We summarize in this section our achievements on poroelastic model development to date. This work reflects contributions from Dr. Ammon Meir (an expert in numerical analysis) and a former Ph.D. student, Ms. Chadia Affane, who developed the mathematical and numerical basis for the fully coupled solution as part of her thesis research in Auburn’s Department of Mathematics. This grant partially supported her work. She is now a professor at Tuskegee University in Alabama.
Biot (1941), Wang (2000), and Showalter (2000) summarized the physical and mathematical models for poroelastic problems. A set of partial differential equations can be used to solve for four basic variables: stress (σ), strain (ε), pore pressure (P), and
Z-specific discharge, cm/yr
–1800 5000
10 km
1 km
m/yr10050
Pakuashananticline Chelungpu
faultShuangtung
fault
Figure 8. (a) Calculated groundwater flow and discharge rates in central western Taiwan in response to regional topography. The model includes multiple vertical fracture zones (vertical permeability = 1 darcy) extending throughout the recharge area in the Pre-Miocene mountains. Arrows show predicted flow directions and discharge rates. Colors map the discharge rates from -1800 cm/yr (downward recharge) to +500 cm/yr (upward discharge) in the permeable alluvial sediments. Note that the groundwater discharge upward to the west of the fracture zone. This result could explain observed streamflow increases in an area predicted to be underpressured by the coseismic strain model (see Figs. 3 and 4).

14
increment of fluid content (ξ) in deformed porous media. First, the force equilibrium equations can be written as
iFjxji
−=∂
∂σ (2)
where σji is the total stress in the j-direction acting on the surface with normal in the i-direction and Fi is a body force per unit bulk volume. The stress σ is related to strain and poroelastic moduli by
ijijkkijij Pv
vGG δαδεεσ −−
+=21
22 (3)
where G is shear modulus, v is drained Poisson’s ratio, α is Biot-Willis coefficient, and δij is the Kronecker delta. The strain components in (3) can be evaluated in terms of displacement derivatives,
( )Tuu ∇+∇=21ε . (4)
Substituting equation (3) into (2) and replacing strain terms ε by displacements u, the general force equilibrium equation (2) can be expressed as
F)u(21
u2 =∇+⋅∇∇−
−∇− Pv
GG α . (5)
The governing mechanical equilibrium and fluid flow equations used here contain the displacement and fluid pressure as the primary variables.
For the flow continuity model, the propagation of induced excess pore pressure can be predicted by the general diffusion model,
QPktPS =∇⋅∇−∂∂ )(
μ (6)
where S is the specific storage of rock, k is permeability, μ is viscosity, and Q is a fluid source term, as induced by seismic faulting. In heterogeneous media hydrologic properties k and μ are allowed to have spatial dependence. According to equation (6), the net pressure change depends on the magnitude of fluid source term Q and the permeability (k) and storage capacity (S) of the rocks between the faulting zone and a site

15
of interest. The increment of fluid volume (ξ) released per unit bulk volume can be evaluated by ξ = S P. Equation (6) can thus be re-written as in term of ξ
QPkt
=∇⋅∇−∂∂ )(
μξ . (7)
Furthermore, the increment of fluid volume ξ is related to stress and pore pressure as
PKBK
PRH kkkk
ασασξ +=+=11 , (8)
where 1/H is the poroelastic expansion coefficient, 1/R is the unconstrained specific storage coefficient , K is the bulk modulus, and B is Skempton’s coefficient. Substitution of (8) into (7) yields an equation that relates mean stress and pore pressure
QPkt
BtP
KBkk =∇⋅∇−⎥⎦⎤
⎢⎣⎡
∂∂
+∂∂ )(
μσα . (9)
If displacement is chosen as the mechanical variable instead of stress, equation (9) can be re-written as
QPkPSt e =∇⋅∇−⋅∇+∂∂ )()(
μα u (10)
Equations (5) and (10) couple the standard theory of elasticity by the addition of the pore pressure field and can be solved by finite element or boundary element methods (Smith & Griffiths, 1988; Masterlark & Wang, 2000). The coefficient Se is related to the compressibility of the fluid and the porosity of the medium (Showalter, 2000). In the case that Se > 0 equations (5) and (10) are a parabolic system, whereas in the case that Se = 0 the system is formally elliptic. The model couples the mechanical deformation and the fluid continuity equations for a variety of poroelastic problems.
Boundary and initial conditions The governing equations (5) and (10) are posed on Ω × (0,T), where Ω ⊂ R3 is a
bounded spatial domain and (0,T) is the time interval of interest. These equations must be supplemented by initial and boundary conditions. Assume that Γ the boundary of Ω, is divided into two disjoint parts Γc and Γt along which we impose clamped boundary conditions and traction boundary conditions, respectively. We further divide Γ again into two disjoint parts Γd and Γf on which we have drained boundary conditions and the flux boundary conditions, respectively. Under certain geologic environments part of the

16
boundary conditions can belong to both Γt and Γf (Γtf = Γt ∩ Γf). With these conventions we allow the following combinations of boundary conditions
u = 0 on Γc (11)
( )( ) 021
2 =−⎥⎦⎤
⎢⎣⎡ ⋅∇
−+∇+∇ tf
T PIGG χβαυ
ν nnuuu on Γt . (12)
Here I is the identity tensor, and n is the outward-pointing, normal vector on the boundary, β and χtf are characteristic functions defined on Γtf (the part of the boundary which is neither drained nor clamped) which denotes the surface fraction of the matrix pores which are sealed along Γtf . Also
P = 0 on Γd (13)
( )( ) tftf hPkt
χμ
χαβ =⋅∇+⋅−∂∂
− nnu1 on Γf . (14)
Here h is the transverse flow on the boundary Γf . Finally we have the initial conditions
0vPSe =⋅∇+ u on Ω at t = 0 (15)
and ( ) 11 v=⋅− nuαβ on Γtf at t = 0 . (16)
There is little prior work on the numerical approximation of solutions of (5), (10)
and (11)-(16) in the mathematical literature. Gaspar et al. (2003) develops a finite-difference method for analyzing a one-dimensional problem (see also remarks in Ženíšek, 1984). It is interesting to note that related poroelasticity systems arise in other areas. The system we consider here (i.e., equations (5) and (10)) is equivalent to that describing thermoelasticity (see Xu (1996) and the references cited therein). Similar systems also play a role in describing the manufacturing process of composite materials (e.g., Farina & Preziosi, 2000), the biomechanics of soft tissues, and biological porous media (e.g., Murad & Cushman, 1996; Huyghe & Janssen, 1997, Levenston et al., 1998).
Numerical solutions For this project, we solve partial differential equations (5) and (10) with an
iterative method using 3-D finite element MATLAB™ codes. Using finite element method discretization in space and second-order Crank-Nicolson discretization in time, equations (5) and (10) convert to:

17
1n1n1n Fuu ++++ =∇+⋅∇∇−
−∇− )())((21
)( 12 iPiv
GiG nα (17)
11
1
))1(()()()()1( ++++
=+∇⋅∇−Δ
⋅∇−⋅∇+
Δ−+ nn
nn
e QiPkt
iit
iPiPSμ
αn1n uu (18)
Here the superscript n denotes the discrete time level at which the function is evaluated and i is an iterative counter. Once the initial pressure Pn+1(0) of seismic faulting is obtained from our 3D-DEF and 3D-PFLOW one-way coupling program, ∇⋅u n+1(0) is solved from equation (17). ∇⋅u n+1(0) and Pn+1(0) are then substituted into equation (18) for the new Pn+1(1). At the same time level, a new Pn+1(1) is used in equation (17) to calculate ∇⋅u n+1(1). Then ∇⋅u n+1(1) and Pn+1(1) will be used in equation (18) to solve for P n+1(2), which will be substituted in equation (17) again to solve for ∇⋅u n+1(2) in the next iteration. Back substitutions and iteration continues until the solutions for both P and u converge, that is, until the difference between the solutions generated at two successive iteration levels is less than a pre-set error tolerance (or convergence criteria). Since the governing equations (17) and (18) are iteratively coupled, a number of passes through the cycle are usually sufficient to solve the equations. The numerical solution proceeds by time-stepping from known values to a time level of unknown values, where the time step is the time difference between levels. Once the equations are solved, the solution begins another time step to a further time level. We choose the intermediate time level (n+1/2) in the finite element equations to minimize local truncation errors, which also represents the lower limit of unconditionally stability in solutions of the diffusion equation. Accuracy of the numerical technique is inferred from our preliminary tests, which show excellent agreement between numerical results and analytical solutions to simplified seismic faulting problems in homogeneous media. A further evaluation of our numerical solutions will come from future models that compare small finite element residuals and check for conservation of rock and fluid mass.
We have solved the two partial differential equations at each time step using direct methods. After discretization using finite elements method in space and second-order Crank-Nicolson in time, we get the system of linear algebraic equations which has the form:
⎥⎦
⎤⎢⎣
⎡=⎥
⎦
⎤⎢⎣
⎡⎥⎦
⎤⎢⎣
⎡− +
+
n
n
n
n
T QF
PU
BCCA
1
1
(19)
Here Fn and Qn are the right hand sides (evaluated at time n) and Un+1 and Pn+1 are the vectors of displacements and pressures at (all) grid points (at time n+1) to be solved for at each time step. A and B are symmetric positive definite matrices. We note that systems with this type of structure are fairly well understood and are similar to those obtained from stabilized finite element discretizations of saddle point problems (Benzi et al., 2005). Our challenge for the next phase of this project is to find efficient solvers for

18
equation 19 and to apply the fully coupled numerical model to the Chi-Chi earthquake event.
Bibliography
Ackerman, D. J. (1996). Hydrology of the Mississippi River Valley Alluvial Aquifer, South-
Central United State, U.S. Geol. Surv. Professional Paper 1416-D, 56 p. Al-Shukri, H. J., and Mitchell, B. J., 1988, Reduced seismic velocities in the source zone of the
New Madrid earthquakes: Bull. Seis. Soc. Am., v.78, p. 1491-1509. Baird, P., 2003, Hydrologic changes associated with the 1999 Chi-Chi earthquake, Taiwan: A
numerical study, M.S. Thesis, Auburn University, Alabama, 93 p. Bethke, C. M., Lee, M.-K., Quinodoz, H. and Kreiling, W. N., 1993, Basin Modeling with
Basin2, A Guide to Using Basin2, B2plot, B2video, and B2view, University of Illinois Press, Urbana, 225 p.
Benzi, M, Golub, G. H., and L.J., 2005, Numerical solution of saddle point problems, Acta Numer., 14.
Biot, M.A., 1941, General theory of three-dimensional consolidation, J. App. Phys., 12, 155-164. Brahana, J.V., and T. O. Mesko (1988). Hydrogeology and preliminary assessment of regional
flow in the Upper Cretaceous and adjacent aquifers in the northern Mississippi Embayment, U.S. Geol. Surv. Water Res. Invest. Report 87-4000, 65 p.
Chia, Y., Y.S. Wang, J. J. Chui, and C.-W. Liu, 2001, Changes of groundwater level due to the 1999 Chi-Chi earthquake in the Choshui River Alluvial fan in Taiwan. Bull. Seism. Soc. Am. 91, 1062-1068.
Christensen, N. I., and W. W. Wepfer (1989). Laboratory techniques for determining seismic velocities and attenuations, with applications to the continental lithosphere, in L. C. Pakiser and W. D. Mooney (Editors), Geophysical Framework of the Continental United States, Boulder, Colorado, Geol. Soc. of Amer. Memoir 172, 91-102.
Farina A., and Preziosi, L., 2000, Deformable porous media and composites manufacturing, In Heterogeneous Media, Model. Simul. Sci. Eng. Technol., 321-410, Birkhauser Boston, Boston, MA.
Freeze, R.A., J. A. Cherry, 1979, Groundwater, Prentice Hall, Englewood Cliffs, New Jersey. Gasper F. J., Lisbona, F. J., and Vabishchevich, P. N., 2003, A finite difference analysis of Biot’s
consolidation model, Appl. Numer. Math., 44, 487-506. Gomberg, J., 1993, Tectonic deformation in the New Madrid Seismic Zone: Inferences from map
view and cross-sectional boundary element models, Journal of Geophysical Research, v. 98, p. 6639-6664.
Gomberg, J. and Ellis, M., 1993, 3D-DEF: A user's manual, U.SG.S. Open File Rep., 93-547, 22 p.
Gomberg, J. and Ellis, M., 1994, Topography and tectonics of the central New Madrid seismic zone: Results of numerical experiments using a three-dimensional boundary element program, Journal of Geophysical Research, v. 99, p. 20299-20310.
Huyghe, J. M. and Janssen, J.D., 1997, Quadriphasic mechanics of swelling incompressible porous media, Int. J. Eng. Sci., 35, 793-802.
Kerrich, R., T. E. La Tour, L. Willmore (1984). Fluid participation in deep fault zones: evidence from geologic, geochemical, and 18O/16O relations, J. Geophys. Res. 89, 4331-4343.
Kramer, S. L., 1996, Geotechnical Earthquake Engineering, Prentice-Hall, Inc.New Jersey, 653 pp.

19
Lee, M.-K. and Wolf, L.W., 1998, Analysis of fluid pressure propagation in heterogeneous rocks: implications for hydrologically-induced earthquakes, Geophys. Res. Lett., v. 25, p. 2329-2332.
Lee, M., T.-K. Liu, K.-F. Ma, and Y.-M. Chang, 2002, Coseismic hydrological changes associated with disolocation of the September 21, 1999 Chichi earthquake, Taiwan. Geophys. Res. Lett. 29, doi: 10.1029/2002GL015116.
Levenston, M.E., Frank, E.H., and Grodzinsky, A.J., 1998, Variationally derived 3-field finite element formulations for quasistatic poroelastic analysis of hydrated biological tissues, Comput. Methods Appl. Mech. Eng., 156, 231-246.
Luzietti, E. A., L. R. Kanter, E. S. Schweig, K. M. Shedlock, and R. B. Van Arsdale (1992). Shallow deformation along the Crittenden County fault zone near the southeastern margin of the Reelfoot Rift, northeastern Arkansas, Seism. Res. Lett. 63, 285-295.
Ma., K.-F., 1999, The Chi-Chi Taiwan earthquake: large surface displacements on inland thrust fault, EOS AGU Transactions, v. 80, p. 605-611.
Masterlark, T. and Wang, H., 2000, Poroelastic coupling between the 1992 Landers and Big Bear earthquakes, Geophy. Res. Lett., 27, 3647-3650.
McKeown, F. A., and S. F. Diehl (1994). Evidence of contemporary and ancient excess fluid pressure in the New Madrid Seismic zone of the Reelfoot Rift, Central United States, U. S. Geol. Surv. Prof. Paper 1538-N, 24 p.
Murad, M.A. and Cushman, J. H., 1996, Multiscale flow and deformation in hydrophilic swelling porous media, Int. J. Eng. Sci., 34, 313-338.
Nesbitt, B. E., and K. Meuhlenbachs (1989). Origins and movement of fluids during deformation and metamorphism in the Canadian Cordillera, Science 245, 733-736.
Neuzil, C.E., How permeable are clays and shales?, Water Resources Journal, 30, 145-150, 1994. Obermeier, S. F. (1996). Using liquefaction-induced features for paleoseismicity analysis,
in Paleoseismology, J. P. McCalpin (Editor), Academic Press, New York, 331-396. Okada, Y., 1992, Internal deformation deformation due to shear and tensile faults in a half-space.
Bull. Seism. Soc. Am. 82, 1018-1040. Rodriguez, B. D., W. D. Stanley, and J. M. Williams (1996). Axial structures within the Reelfoot
Rift delineated with magnetotelluric surveys, in Investigations of the New Madrid Seismic Zone, K. M. Shedlock and A. C. Johnston (Editors), U. S. Geol. Surv. Prof. Paper 1538-K, 30p.
Roeloffs, E. A., 1988, Fault stability changes beneath a reservoir with cyclic variations in water level, Journal of Geophysical Research, v. 93, p. 2107-2124.
Saucier, R. T. (1977). Effects of the New Madrid earthquake series in the Mississippi alluvial valley, U.S. Army Eng. Waterways Experiment Station Misc. Paper S-77-5.
Showalter, R. E., 2000, Diffusion in poro-elastic media, J. Math Anal. Appl., 251, 310-340. Smith, I.M. and D. V. Griffiths, 1988, Programming the Finite Element Method, John Wiley,
New York. Stanley, W. D., B. D. Rodriguez (1992). Structure of the Reelfoot Rift as interpreted from 2-D
magnetotelluric models, Seism. Res. Lett. 63, 223-232. Tuttle, M. P., E. S. Schweig, J. D. Sims, R. H. Lafferty, L. W. Wolf, and M. L. Haynes, 2002,
The earthquake potential of the New Madrid seismic zone, Bull. Seis. Soc. Am., v. 92, 2080-2089.
Wang, C.-Y., L.-H Cheng, C.-V. Chin, and S.-B. Yu, 2001, Coseismic hydrologic response of an alluvial fan to the 1999 Chi-Chi earthquake, Taiwan, Geology, v. 32, p. 831-834.
Wang, C-Y, C.-H. Wang, and M. Manga, 2004, Coseismic release of water from mountains: Evidence from 1999 (Mw = 7.5) Chi-Chi, Taiwan, earthquake, Geology, 32, 769-772.
Wang, H., 2000, Theory of Linear Poroelasticity with Applications to Geomechanics and Hydrogeology, Princeton University Press, Princeton, New Jersey, 287 p.

20
Water Resources Bureau, 2000, Survey report of surface and ground water level fluctuations during the 1999 Chi-Chi earthquake, Taiwan, Water Resources Bureau, 37 p. (in Chinese).
Wolf, L. W., M-K. Lee, S. Browning, and M. P. Tuttle, 2005, Numerical Analysis of overpressure development in the New Madrid seismic zone, Bull. Seis. Soc. Am., 95, p. 135-144.
Wolf, L. W., Lee, M-K,. and Baird, P., 2006, Poroelastic Modeling of the Mw 7.6 Chi-Chi, Taiwan, Earthquake, Eos Trans. AGU, 87(52), Fall Meet. Suppl., Abstract T32A-03.
Xu, X., 1996, The N-dimensional quasistatic problem of thermoelastic contact with Barber’s heat exchange conditions, Adv. Math. Sci. Appl., 6, 559-587.
Zenisek, A., 1984, The existence and uniqueness theorem in Biot’s consolidation theory, Appl. Mat., 29, 194-211.
Zoback, M. L., and M. D. Zoback (1989). Tectonic stress field of the continental United States, in Geophysical framework of the continental United States, Geological Society of America Memoir 172, L. C. Pakiser and W. D. Mooney (Editors), Boulder, Colorado, 523-539.