Crustal strain in the Southern Alps, France, 1948–1998
17
Tectonophysics 319 (2000) 1–17 www.elsevier.com/locate/tecto Crustal strain in the Southern Alps, France, 1948–1998 E. Calais a, *, L. Galisson a,b, J.-F. Ste ´phan a, J. Delteil a, J. Deverche `re a, C. Larroque c, B. Mercier de Le ´pinay a, M. Popo a, M. Sosson a a UMR 6526, Centre National de la Recherche Scientifique, Universite ´ Pierre et Marie Curie, Universite ´ Nice-Sophia Antipolis, 250 Rue Albert Einstein, 06560 Valbonne, France b Ecole Nationale Supe ´rieur des Arts et Industries de Strasbourg, Strasbourg, France c Universite ´ de Reims, Laboratoire de Sciences de la Terre, Reims, France Received 9 June 1999; accepted for publication 14 January 2000 Abstract Active tectonics in the Western Alps is revealed by a moderate level of seismic activity and geological evidences for Quaternary deformation. We present new geodetic determinations of the current strain rates in the southern part of the Western Alps, that complement existing results in Provence, the Jura, and the Subalpine and Belledone massifs around Grenoble. We combined first- and second-order triangulation data collected in 1948 with global positioning system (GPS) data collected in 1998. We estimate shear strain rates of 0.1–0.2 mrad yr-1 over distances on the order of 30 km, significantly di erent from zero in most of the network. We obtain NW–SE to N–S compressive shear strain directions over most of the area, in agreement with the seismological and geological data. These geodetic estimates correspond to long-term overall N–S to NW–SE shortening of 2–4 mm yr-1 over the study area, on the same order as the far-field shortening measured by continuous GPS on the Grasse–Torino baseline ( -2.0±0.5 mm yr-1), that incorporates our geodetic network. These results provide new constraints on interseismic strain in the Western Alps. © 2000 Elsevier Science B.V. All rights reserved. Keywords: active deformation; Alps; global positioning system; triangulation 1. Introduction geodetic measurements in Sicily ( Ward, 1994; Zarraoa et al., 1994). Although this far-field kine- matic framework seems well constrained, the kine- Active deformation in the Alpine mountain matics of the present-day deformation within the range is commonly interpreted as a consequence Africa–Eurasia plate boundary in the Western of the present-day convergence between the Mediterranean remains poorly documented. This African and Eurasian plates (Fig. 1; e.g. Philip, hampers the understanding of the physical mecha- 1987). This convergence currently occurs at a rate nisms responsible for active deformation and of 6.2±0.5 mm yr-1 in a N17°W±9° direction at earthquakes within the plate boundary zone. For the longitude of the Western Alps according to the instance, the amount of Africa–Eurasia con- Nuvel-1A plate motion model (DeMets et al., vergence currently accommodated in the Alps is 1990) a value that has been confirmed by space not known, although this information is crucial for estimating the force balance currently driving * Corresponding author. Tel.: +33-4-92-94-26-28; its deformation (e.g. Lyon-Caen and Molnar, fax: +033-4-92-94-26-10. E-mail address: [email protected] ( E. Calais) 1989). 0040-1951/00/$ - see front matter © 2000 Elsevier Science B.V. All rights reserved. PII: S0040-1951(00)00029-9
Transcript of Crustal strain in the Southern Alps, France, 1948–1998

Tectonophysics 319 (2000) 1–17www.elsevier.com/locate/tecto
Crustal strain in the Southern Alps, France, 1948–1998
E. Calais a,*, L. Galisson a,b, J.-F. Stephan a, J. Delteil a, J. Deverchere a,C. Larroque c, B. Mercier de Lepinay a, M. Popoff a, M. Sosson a
a UMR 6526, Centre National de la Recherche Scientifique, Universite Pierre et Marie Curie, Universite Nice-Sophia Antipolis,250 Rue Albert Einstein, 06560 Valbonne, France
b Ecole Nationale Superieur des Arts et Industries de Strasbourg, Strasbourg, Francec Universite de Reims, Laboratoire de Sciences de la Terre, Reims, France
Received 9 June 1999; accepted for publication 14 January 2000
Abstract
Active tectonics in the Western Alps is revealed by a moderate level of seismic activity and geological evidences forQuaternary deformation. We present new geodetic determinations of the current strain rates in the southern part of theWestern Alps, that complement existing results in Provence, the Jura, and the Subalpine and Belledone massifs aroundGrenoble. We combined first- and second-order triangulation data collected in 1948 with global positioning system(GPS) data collected in 1998. We estimate shear strain rates of 0.1–0.2 mrad yr−1 over distances on the order of 30 km,significantly different from zero in most of the network. We obtain NW–SE to N–S compressive shear strain directionsover most of the area, in agreement with the seismological and geological data. These geodetic estimates correspond tolong-term overall N–S to NW–SE shortening of 2–4 mm yr−1 over the study area, on the same order as the far-fieldshortening measured by continuous GPS on the Grasse–Torino baseline (−2.0±0.5 mm yr−1), that incorporates ourgeodetic network. These results provide new constraints on interseismic strain in the Western Alps. © 2000 ElsevierScience B.V. All rights reserved.
Keywords: active deformation; Alps; global positioning system; triangulation
1. Introduction geodetic measurements in Sicily (Ward, 1994;Zarraoa et al., 1994). Although this far-field kine-matic framework seems well constrained, the kine-Active deformation in the Alpine mountainmatics of the present-day deformation within therange is commonly interpreted as a consequenceAfrica–Eurasia plate boundary in the Westernof the present-day convergence between theMediterranean remains poorly documented. ThisAfrican and Eurasian plates (Fig. 1; e.g. Philip,hampers the understanding of the physical mecha-1987). This convergence currently occurs at a ratenisms responsible for active deformation andof 6.2±0.5 mm yr−1 in a N17°W±9° direction atearthquakes within the plate boundary zone. Forthe longitude of the Western Alps according to theinstance, the amount of Africa–Eurasia con-Nuvel-1A plate motion model (DeMets et al.,vergence currently accommodated in the Alps is1990) a value that has been confirmed by spacenot known, although this information is crucialfor estimating the force balance currently driving* Corresponding author. Tel. : +33-4-92-94-26-28;its deformation (e.g. Lyon-Caen and Molnar,fax: +033-4-92-94-26-10.
E-mail address: [email protected] (E. Calais) 1989).
0040-1951/00/$ - see front matter © 2000 Elsevier Science B.V. All rights reserved.PII: S0040-1951 ( 00 ) 00029-9
2 E. Calais et al. / Tectonophysics 319 (2000) 1–17
Fig. 1. Regional tectonic setting (after Armijo et al., 1986; digitized data courtesy G. Ferhat). Areas in light gray indicate stableblocks or plates, areas in dark gray indicate active deformation regions. Squares and circles indicate deep and shallow earthquakes,respectively; filled circles before 1950, open circles after 1950. The large white triangles show permanent GPS stations, in particularGrasse and Torino, mentioned in this paper. Arrows at the bottom of the figure indicate the velocity of the African plate relative toEurasia according to the Nuvel-1A plate kinematic model (DeMets et al., 1994). The white square indicates the study area.
The present-day tectonic activity of the Western tonic analysis techniques difficult (Sebrier et al.,1997). In addition, the available geodetic measure-Alps (Fig. 1) is demonstrated by a moderate
seismicity (Thouvenot, 1996; Maddedu et al., ments of crustal deformation in the Western Alpsare so far controversial. Jouanne et al. (1994) in1997) and sparse geological and geomorphological
observations of recent deformation (e.g. Menard, the Jura and Martinod et al. (1996) aroundGrenoble report strain rates ranging between 0.51988; Labaume et al., 1989; Ritz, 1991; Dubar and
Perez, 1989; Combes, 1984; Grellet et al., 1993; and 1 mstrain yr−1, as high as those measuredaround such well-known active faults as the SanSue et al., 1999). The diffuse spatial distribution
of the seismicity and the difficulty to characterize Andreas fault in southern California (Feigl et al.,1990; Shen et al., 1996) or the North Anatolianactive faults in an environment where erosion and
anthropic activity compete with very low strain fault in Turkey (Straub and Kahle, 1995). In theSouthern French Alps and Provence, Ferhat et al.rates makes the application of classical seismotec-

3E. Calais et al. / Tectonophysics 319 (2000) 1–17
(1998) place a much lower upper bound of E–W (Fig. 2; Bethoux et al., 1998; Madeddu et al.,0.1 mrad yr−1 on active deformation. Reilly and 1997). The largest instrumental earthquakes in theGubler (1990) report similar strain rates of area, however, occurred along the northern margin0.21±0.04 mrad yr−1 in the Helvetic Alps and of the Ligurian basin (Fig. 2; 1963, magnitude 6.0;0.05±0.02 mrad yr−1 in the Jura mountains. 1989, magnitude 4.5; 1995, magnitude 4.7; RitzFinally, the analysis of 2.5 years of continuous et al., 1990; Bethoux et al., 1992; Courboulex et al.,global positioning system (GPS) data at Torino 1998). Focal mechanisms generally show compres-(Italy), Grasse (France), and Zimmerwald sion and strike–slip, with P-axes trending NW–SE(Switzerland) suggests that the present-day to N–S (Bethoux et al., 1992). A number ofdifferential motion across the Western Alps does historical earthquakes are also known in the Alpesnot exceed 3 mm yr−1 (Calais, 1999). Maritimes, some of them associated with severe
There is clearly a need for direct geodetic deter- casualties, such as the 1887 Ligurian earthquake,minations of crustal strain and block motion in that reached an intensity of X MSK (estimatedthe Alps, but the low expected rates, close to the magnitude 6.4; Levret et al., 1994) and affectedaccuracy of the geodetic techniques, make such most of the French Riviera between Nice andmeasurements challenging. GPS campaign meas- Menton. The occurrence of such events representsurements of crustal deformation in the Western a serious threat to this densely populated andAlps started in 1993 (Chery et al., 1995). However, highly touristic area. In addition to the geodynamicunambiguous detection of a tectonic signal greater objectives cited already, this study also aims atthan the GPS noise will take a minimum of three quantifying present-day strain rates in the Alpesobservation epochs over at least 5 years. Maritimes in order to contribute to seismic hazardContinuous measurements at permanent stations analyses.have also started (Calais et al., 1998), but their From a geological standpoint, the Alpesspatial resolution is coarse (>50 km between sta- Maritimes are located at the crossroads betweentions). An alternate strategy involves the compari-
the highly elevated cristalline massif of theson of old triangulation data with recent
Argentera, the sedimentary units of the southerntriangulation or GPS measurements. This paperSubalpine Massifs (the so-called Castellane andpresents the results of a comparison between trian-Nice arcs, or fold-and-thrust belts), and thegulation and GPS measurements made 50 yearsLigurian oceanic domain and its steep and narrowapart in the southernmost part of the Westernmargin (Fig. 2). Our study area is centered on theAlps (Alpes Maritimes, France). It complementsCastellane and Nice arcs, a series of S to SSW-similar studies by Reilly and Gubler (1990) in theverging fold and thrusts involving the Mesozoic toHelvetic Alps, Jouanne et al. (1994) in the southernPaleogene sediments, translated above a basalJura, Martinod et al. (1996) in the Subalpine anddecollement zone in upper Triassic evaporites andBelledone massifs around Grenoble, and Ferhatshales [Fig. 2B; Goguel (1936); Geze (1960, 1963);et al. (1998) in the southern Alps and Provence.Perez (1975); Gidon and Pairis (1986); Pelline-Chabert (1996); Laurent (1998)]. This decollementis connected to the north, in the inner part of botharcs, with a blind north-dipping crustal ramp2. Seismotectonic settingassociated with basement uplifts of the BarrotDome and the Argentera Massif [Fig. 2B; SiddansThe southern part of the Western Alps (Alpeset al. (1984); Labaume et al. (1989); Ritz (1991);Maritimes) is seismically one of the most activeLaurent et al. (1999)].part of the Alpine range (Fig. 1). The seismicity
Although most of the deformation in theis mostly concentrated on the northeastern side ofCastellane and Nice arcs occurred during thethe Argentera massif along the Pennic front, withMiocene, there is evidence for shortening anda variety of compressive, extensive, and strike–slip
focal mechanisms and P-axes trending SW–NE to uplift continuing into the Pliocene and the

4 E. Calais et al. / Tectonophysics 319 (2000) 1–17
Quaternary, under a stress-field similar to the (Campredon et al., 1977; Irr, 1984; Clauzon et al.,1996; Schroetter, 1998). Northeast of the Var andMiocene one (Ritz, 1991, 1992). Marine lower
Pliocene sediments that discomformably overlie Vesubie rivers confluence (ca. 25 km SW of siteMOUL, Fig. 2A), Pliocene conglomerates infillingthe western edge of the Nice arc along the Var
river are locally folded and underthrust the Messinian paleo-Var valley were uplifted to
Fig. 2. (A) Geodetic network superimposed on a structural map of recent/active faults and seismicity in the Southern French Alps.The open triangle is the GRAS permanent GPS site. BSMF, Breil–Sospel–Monaco fault; STF, Saorge–Taggia fault; VMBA, Vesubie–Mont Ferion–St Blaise–Aspermont fault. (B) Geological cross-section from the Ligurian Sea to the Argentera massif. Structural andgeological contours for A and B are from Laurent (1998), Chaumillon et al. (1994), and Stephan (unpublished data), seismologicalinformations from Bethoux et al. (1998), Moho depth from Recq (1973, 1974), Calais et al. (1993) and Chamot-Rooke et al. (1999).The geometry of the crustal ramps in (B) is speculative.

5E. Calais et al. / Tectonophysics 319 (2000) 1–17
Fig
.2.
(con
tinu
ed)

6 E. Calais et al. / Tectonophysics 319 (2000) 1–17
1030 m above a south-vergent thrust (Irr, 1984; to determine strain rates in that area, discuss theresults and their tectonic implications.Clauzon et al., 1996; Schroetter, 1998). In the
Castellane arc, Gilli and Delange (1999) foundevidence for very recent southward thrusting fromoffsets in speleothems built in karstic galleries 3. Data acquisition and analysisalong a north-dipping thrust plane. Recent move-ments are also evidenced by deformed Plio- Triangulation data come from first- and second-Pleistocene sediments along the left-lateral Breil– order surveys performed in 1948 by the FrenchSospel–Monaco strike–slip fault zone and the Institut Geographique National (IGN ) at 35 sitesSaorge–Taggia right-lateral strike–slip fault (Fig. 3). The 1948 measurements consist of angu-[Fig. 2A; Rebaı (1988); Ritz (1991); Cosani lar values only. They were acquired with Wild T3(1997)]. Quaternary tectonic activity is also evi- theodolites, with an associated uncertainty ofdenced by uplifted and faulted marine and river 0.5 arcsec, or about 2.4 microradians (mrad)terraces along the coast from the Maures– (Lejeune, 1950). We performed an adjustment ofTanneron massif eastwards and on both flanks of the 1948 triangulation network in order to checkthe lower Var valley (Dubar, 1987; Dubar and the quality of the data and select a list of sites thatPerez, 1989). Uplift was greater on the east bank had the appropriate planimetric accuracy (Fig. 3).of the Var (the 1.5–1.8 My terrace is 50 m higher) We decided to retain only the points for which itwith a transpressional regime to the east (NNE– was possible to ensure a millimeter per year levelSSW shortening) and a mostly extensional one to accuracy over 50 years, that is, points that werethe west (reactivation of Oligocene N–S graben) defined with an accuracy better than 5 cm for theirin the Provencal foreland of the Castellane arc east and north coordinates. We also performed a(Dubar and Perez, 1989). These differential move- Helmert transformation of the adjusted triangula-ments on both sides of the lower Var valley are tion network to the GPS coordinates (see below)probably related to the current activity of the in order to identify sites with abnormal coordinateso-called Vesubie–Mont Ferion–St Blaise– differences. Fourteen sites did not pass these twoAspremont lineament (Fig. 2), an inherited N–S tests because of insufficient or bad quality triangu-fault zone that shows radon anomalies lation data. They were not used in the rest of this(Borchiellini et al., 1991) and microseismic align- study. Moreover, we chose to measure only thements (Tressols, 1996). Offshore along the exact benchmarks that had been occupied duringLigurian margin, seismic reflection data between the 1948 surveys in order to avoid using local tiesNice and San Remo show evidences for to auxiliary benchmarks that would degrade theQuaternary deformation at the transition between overall accuracy of our solution. Among thethe continental slope and the bathyal plain, inter- remaining points, two were unreachable becausepreted by Chaumillon et al. (1994) as an uplift of of late snow falls in spring 1998 (Valdieri, Puntathe margin at a rate of 0.3–0.5 mm yr−1. North of Maladecia), three had been destroyed (Savi, Aiera,the Castellane and Nice arcs, apatite fission track and Fascia), and for one site we did not obtaindata show that the Argentera Massif is currently permission to observe it (Peille). We finallyuplifting at a minimum rate of 0.1 mm yr−1 (Bigot- observed a total of 14 sites (Fig. 2). The two-Cormier et al., 1999). Between the Argentera and dimensional rms of the final triangulation networkthe coast, incision of the hydrographic system, adjustment is 3 cm, which makes this data settogether with local anomalies in longitudinal pro- apropriate for a comparison with GPS data col-files of some rivers, also suggests recent tectonic lected 50 years later in 1998.activity (Julian, 1980; Guglielmi, 1993). GPS data were collected between 7 and 16 June
In spite of these numerous indications for active 1998, using four dual-frequency Ashtech Z12deformation in the southern part of the Western receivers sampling at a 30 s interval during 8–10 hAlps, no direct determinations of the current strain sessions. We processed pseudorange and phaserates are so far available. We present in the GPS data in single-day solutions using the
‘GAMIT’ software (version 9.6, King and Bock,following the methodology that we used in order
7E. Calais et al. / Tectonophysics 319 (2000) 1–17
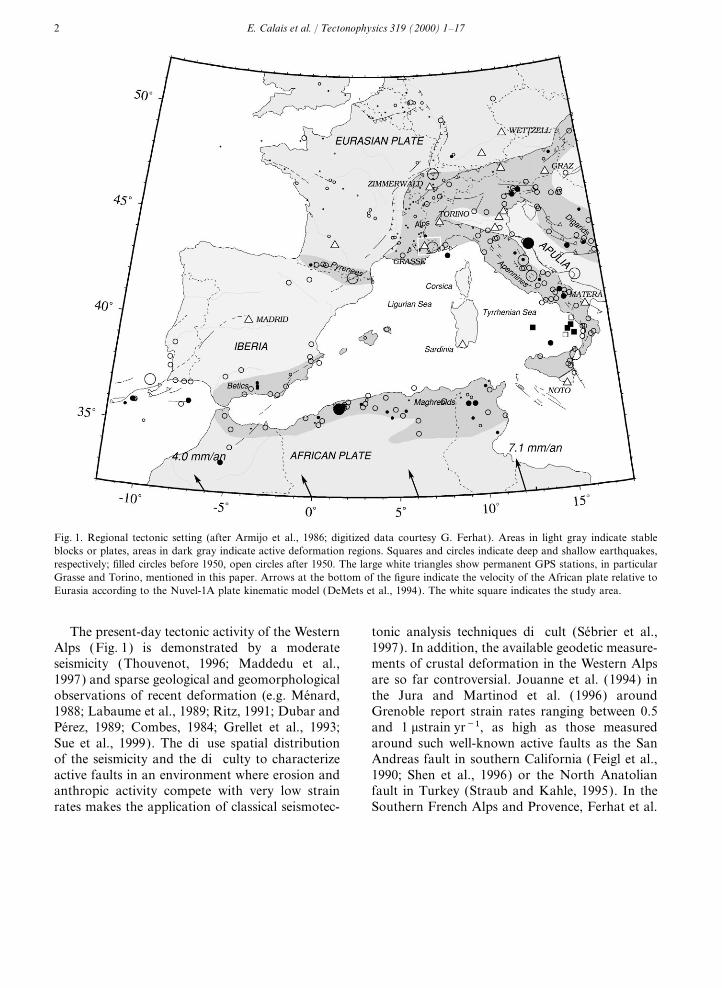
Fig. 3. Adjustment of the geodetic observations performed in the Alpes Maritimes and adjacent areas during the 1948 surveys. Theerror ellipses are 1-sigma and do not account for the NS–EW correlations. Sites equiped with several markers show several errorellipses.
1997). We solved for regional station coordinates, independent daily solution were then passed to aKalman filter (‘GLOBK’, Herring et al., 1990) insatellite state vectors, and phase ambiguities using
doubly-differenced ionosphere-free (‘LC’) GPS order to perform a global network adjustment andto estimate station positions and their formalphase measurements. We used IGS final orbits,
IERS Earth orientation parameters, and applied errors. We imposed the reference frame by mini-mizing the position and velocity deviations of IGSazimuth and elevation dependent antenna phase
center models, following the tables recommended stations with respect to the ITRF94 while esti-mating an orientation, translation and scaleby the IGS. We included in the processing seven
stations of the International GPS service for transformation.Since none of the sites were occupied duringGeodynamics (IGS) (Grasse, Matera, Kootwijk,
Zimmerwald, Graz, Torino, Villafranca) to serve more than one session, it was not possible tocompute measurement rms scatter (or ‘short-termas ties with the International Terrestrial Reference
Frame 1994 (ITRF94, Boucher et al., 1996). The repeatability’), a value that is commonly used toestimate the accuracy of GPS measurementsleast squares adjustment vector and its correspond-
ing variance–covariance matrix for station posi- (Larson and Agnew, 1991). However, a numberof tests on permanent GPS stations now operatingtions and orbital elements estimated for each

8 E. Calais et al. / Tectonophysics 319 (2000) 1–17
in the Western Alps show a short-term repeatabil- nents of velocity at a site located at (xn, x
e), L
ijare the components of the velocity gradient tensority on the order of 5 mm in the planimetric compo-
nents with 10–12 h sessions on 30–100 km long L that describes how velocity varies spatially, andtn
and te
represent the rigid body translation veloc-baselines using the processing strategy describedabove (which are the characteristics of the network ity common to all points. The velocity gradient
tensor can be decomposed into a symmetric part,analyzed in this study). Since all the sites werelocated in a low-multipath environment with a E, the horizontal strain rate tensor, and an asym-
metric part W, the horizontal rotation rate matrixgood sky visibility, we assume that this accuracyalso holds for our measurements. that describes rigid body rotation:
L=E+W=AE11
E12
E21
E22B+A 0 v
−v 0B4. Strain rates estimation
The strain rate tensor E can be diagonalizedand represented in a coordinate system defined byWe estimate the strain rates using the forwardthe principal strain rate axes using its eigenvaluesmodeling network deformation analysis software(ei) and unit eigenvector (e
i): (Dong, 1993) following the standard pro-
cedure used by Ferhat et al. (1998). The inputE=∑
i=12
eieieTidata sets are the angles from the triangulation
measurements and the baseline representation ofBy convention, extension is positive, e
1>e
2, andthe coordinate estimates from the GPS measure-
the principal shortening axis is oriented at anments, both with their associated variance. In aazimuth H measured clockwise from north. Thisfirst step, analyses each data set and pro-direction is oriented at 45° angle from the maxi-duces loosely constrained estimates of site posi-mum shear direction.tions at each observation reference epoch. We
The 1948 surveys involved only angular obser-constrained the vertical position components tovations, with no distance or absolute azimuththeir GPS-derived value because these parametersmeasurements. Consequently, the derived sitecannot be estimated from the triangulation data.coordinates and the velocity field obtained from aAll other parameters were loosely constrained incomparison with GPS measurements cannot yieldorder to allow the reference frame to be consis-rotation (v) and dilatation rates (D=E11+E22).tently defined at the combination stage. In a secondThe velocity gradient tensor and even the strainstep, combines individual loosely con-rate tensor are therefore ambiguous unless twostrained solutions at each observation referencesites of the measured network are fixed. Since theepoch into a single solution, allowing time-depen-choice of the fixed sites can have a large impactdent variation of the parameters. The result is anon the strain rates and azimuths, and because wehorizontal position (relative to a reference epoch)have no a priori way of knowing which sitesand a velocity for each station, together with strainexperienced zero relative motion between the 1948and rotation rates over the nework. A full descrip-and 1998 surveys, we chose to use a parameteriza-tion of the procedure can be found in Dongtion of the velocity gradient tensor in terms of two(1993) and Dong et al. (1998).angular shear strain rates c1 and c2:The deformation can then be derived from a
steady homogeneous horizontal velocity field given c1(E11−E
22)
by:c2=(2E
12)
Vn=L
11xn+L
12xe+t
n The meaning of c1 and c2 and their relationwith the velocity field gradient and the conven-V
e=L
21xn+L
22xe+t
e tional strain rate tensor are explained for instancein Feigl et al. (1990), to which we refer the readerwhere V
nand V
eare the north and east compo-

9E. Calais et al. / Tectonophysics 319 (2000) 1–17
for further details. This parameterization is inde-pendent on any assumption of fixed sites and isnot affected by the unknown rotation and dilata-tion rate. The drawback is that the interpretationof c1 and c2 in geological terms is not straightfor-ward. We therefore decided to follow the approachof Ferhat et al. (1998) and calculated maximumshear strain rates c:
c=Ec21+c2
2together with their azimuth Y given by:
tan(2Y )=c1/c2.
We plotted in Figs. 4–6 the azimuth H=Y−45°,which is the direction of the axis of the maximumcompressional principal strain rate, correspondingto the ‘P-axis’ in seismological nomenclature. Sucha representation has the advantage of being easilyreadable and directly comparable to seismologicalresults, but the disadvantage of not being able todistinguish pure shear from simple shear.
5. Results analysis and robustness tests
In order to assess the quality of our solutionsand the influence of the processing strategy on thestrain rate estimates, we performed a series ofrobustness tests on the quality of the points usedin the solutions, the a priori uncertainties used forthe station positions, and the geometry of thesubnetworks.
5.1. Quality of benchmarks
We observed on the field that all the geodeticbenchmarks were not in the same state of conserva-tion and consequently had to be weighted accord-ingly. We rank the sites into three categories onthe basis of the following criterias: category Asites: no ambiguity on the benchmark, millimeter-
Fig. 4. Test of the influence of the site quality on shear strainlevel centering possible, monument stable and rate estimates. The shear strain rate is shown in each subnet-undisturbed (7 points); category B sites: no ambui- work with the following symbols: thick black bars indicate the
value of the shear strain rate c, the superimposed thick grayguity on the benchmark, millimeter-level centeringbars give the one-sigma uncertainty. The two symmetrical thinpossible, monument stability questionable (4black lines give the one sigma uncertainty on the azimuth ofpoints); category C sites: ambiguity on the bench-the ‘geodetic P-axis’ H. (A) Solution using category A sites
mark, and/or millimeter-level centering not pos- only; (B) solution using category A and B sites; (C) solutionusing category A, B, and C sites.

10 E. Calais et al. / Tectonophysics 319 (2000) 1–17
It appears clearly that including all category A, B,and C sites (Fig. 4C) results in an unreasonablesolution, with maximum shear strain rates>1 mrad yr−1, on the same order as the valuesfound for instance in southern California (Feiglet al., 1990; Dong, 1993), not compatible with theseismotectonic information in the Alpes Maritimes(e.g. Maddedu et al., 1997; Bethoux et al., 1998).The same conclusion holds when including cate-gory C sites one by one in the solution. We alsoobserve that the solution with category A and Bsites is not significantly different from the solutionwith category A sites alone for the subnetworkscommon to the two solutions. This proves thatcategory B sites do not affect the quality of thesolution. We will therefore base our interpretationon solutions that include both category A andB sites.
5.2. A priori uncertainties
We performed a series of solutions by multiply-ing the a priori uncertainties on the vertical andhorizontal station position by a factor up to 5. Wefound that these perturbations do not modify thevalues of c1 and c2 by >10% of their uncertainty.
5.3. Geometry of subnetworks
In a region where the strain directions may varysignificantly over short distances, as observed onFig. 4, it is important to test the influence of thesubnetwork geometry on the strain rate field. Acorrect interpretation of the results would requirethe strain rate to be homogeneous within eachindividual subnetwork, but this condition of spatialhomogeneity is unfortunately not known a priori.Therefore, we try to reach the best compromisebetween the spatial resolution and the accuracy ofthe strain rate estimates. We show in Fig. 5A theshear strain rate field with the highest spatial
Fig. 5. Test of the influence of the network design on shear resolution (smallest possible subnetworks). A com-strain rate estimates. (A) Highest possible spatial resolution; parison with the larger subnetworks of Fig. 5B(B) medium spatial resolution; and (C) low spatial resolution. and C shows that the shear strain rates and
directions remain consistent at different scales inthe western part of the network, where the defor-sible, and/or unstable or disturbed monument (4
points). Fig. 4 shows our results as a function of mation seems therefore to be homogeneous. Thecomparison between Figs. 5A and 4B, that use thethe quality of the benchmarks used in the solution.

11E. Calais et al. / Tectonophysics 319 (2000) 1–17
Fig. 6. Final shear strain rate solution. Arrows show P-axis of earthquakes for which focal mechanisms are given in Fig. 2. The graydashed line indicates the approximate surface projection of the blind thrust ramp under the Argentera massif (see Fig. 2B).
same sites but a different subnetwork geometry in FRON–SANR subnetwork shows consistentNE–SW compression at a rate of 0.15 mrad yr−1,the western part of the network, also shows that
the strain rates and directions are largely indepen- whereas the ORME–TEND–MOUL–CAST–ALTO–FRON subnetworks shows consistentdent of the subnetwork geometry in that area. The
strain field over the CHEI-TOUR-NICE-CAST- NW–SE compression at a rate of 0.16 mrad yr−1.The CLAN–MOUL–TEND triangle shows insig-MOUL-CLAN area (western part of the network)
is therefore homogeneous, with N–S compression nificant strain.and a maximum shear strain rate to the order of0.10–0.20 mrad yr−1. The eastern part of the net-work does not show that homogeneity in the shear 6. Interpretation and discussionstrain rates and directions. At the highest spatialresolution (Fig. 5A), it shows triangles with NW– On the basis of the above analysis, we chose to
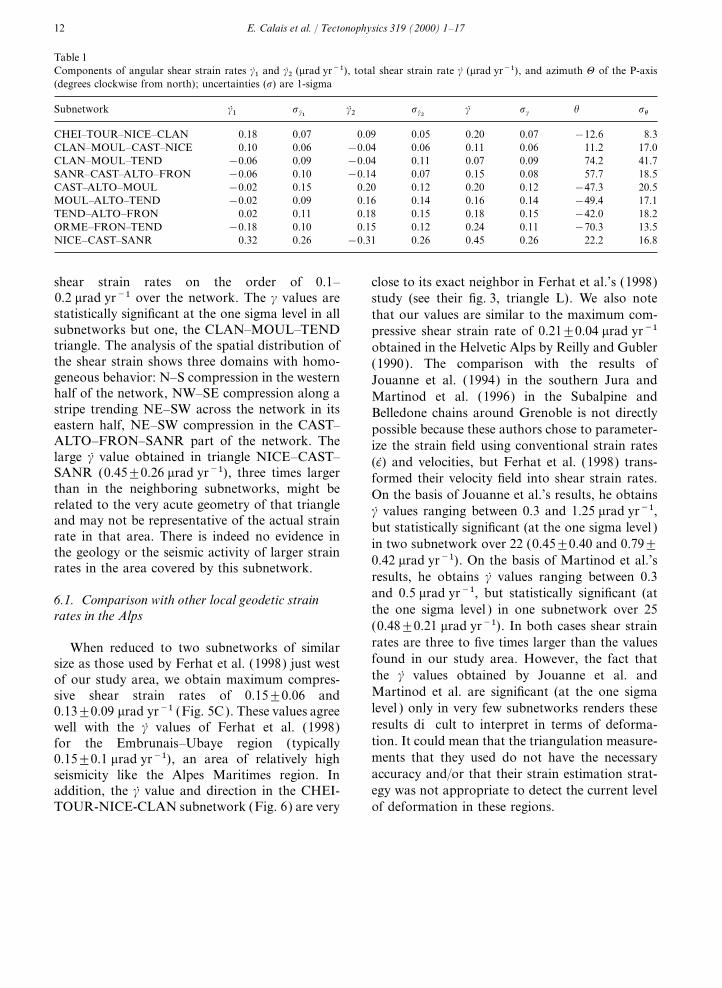
represent our results as shown in Fig. 6 (numericalSE compression and triangles with NE-SW com-pression. As shown in Fig. 5B, the CAST–ALTO– values are given in Table 1). We obtain maximum
12 E. Calais et al. / Tectonophysics 319 (2000) 1–17
Table 1Components of angular shear strain rates c1 and c2 (mrad yr−1), total shear strain rate c (mrad yr−1), and azimuth H of the P-axis(degrees clockwise from north); uncertainties (s) are 1-sigma
Subnetwork c1 sc1
c2 sc2
c sc
h sh
CHEI–TOUR–NICE–CLAN 0.18 0.07 0.09 0.05 0.20 0.07 −12.6 8.3CLAN–MOUL–CAST–NICE 0.10 0.06 −0.04 0.06 0.11 0.06 11.2 17.0CLAN–MOUL–TEND −0.06 0.09 −0.04 0.11 0.07 0.09 74.2 41.7SANR–CAST–ALTO–FRON −0.06 0.10 −0.14 0.07 0.15 0.08 57.7 18.5CAST–ALTO–MOUL −0.02 0.15 0.20 0.12 0.20 0.12 −47.3 20.5MOUL–ALTO–TEND −0.02 0.09 0.16 0.14 0.16 0.14 −49.4 17.1TEND–ALTO–FRON 0.02 0.11 0.18 0.15 0.18 0.15 −42.0 18.2ORME–FRON–TEND −0.18 0.10 0.15 0.12 0.24 0.11 −70.3 13.5NICE–CAST–SANR 0.32 0.26 −0.31 0.26 0.45 0.26 22.2 16.8
shear strain rates on the order of 0.1– close to its exact neighbor in Ferhat et al.’s (1998)0.2 mrad yr−1 over the network. The c values are study (see their fig. 3, triangle L). We also notestatistically significant at the one sigma level in all that our values are similar to the maximum com-subnetworks but one, the CLAN–MOUL–TEND pressive shear strain rate of 0.21±0.04 mrad yr−1triangle. The analysis of the spatial distribution of obtained in the Helvetic Alps by Reilly and Gublerthe shear strain shows three domains with homo- (1990). The comparison with the results ofgeneous behavior: N–S compression in the western Jouanne et al. (1994) in the southern Jura andhalf of the network, NW–SE compression along a Martinod et al. (1996) in the Subalpine andstripe trending NE–SW across the network in its Belledone chains around Grenoble is not directlyeastern half, NE–SW compression in the CAST– possible because these authors chose to parameter-ALTO–FRON–SANR part of the network. The ize the strain field using conventional strain rateslarge c value obtained in triangle NICE–CAST– (e) and velocities, but Ferhat et al. (1998) trans-SANR (0.45±0.26 mrad yr−1), three times larger formed their velocity field into shear strain rates.than in the neighboring subnetworks, might be On the basis of Jouanne et al.’s results, he obtainsrelated to the very acute geometry of that triangle c values ranging between 0.3 and 1.25 mrad yr−1,and may not be representative of the actual strain but statistically significant (at the one sigma level )rate in that area. There is indeed no evidence in in two subnetwork over 22 (0.45±0.40 and 0.79±the geology or the seismic activity of larger strain
0.42 mrad yr−1). On the basis of Martinod et al.’srates in the area covered by this subnetwork.
results, he obtains c values ranging between 0.3and 0.5 mrad yr−1, but statistically significant (at6.1. Comparison with other local geodetic strainthe one sigma level ) in one subnetwork over 25rates in the Alps(0.48±0.21 mrad yr−1). In both cases shear strainrates are three to five times larger than the valuesWhen reduced to two subnetworks of similarfound in our study area. However, the fact thatsize as those used by Ferhat et al. (1998) just westthe c values obtained by Jouanne et al. andof our study area, we obtain maximum compres-Martinod et al. are significant (at the one sigmasive shear strain rates of 0.15±0.06 andlevel ) only in very few subnetworks renders these0.13±0.09 mrad yr−1 (Fig. 5C). These values agreeresults difficult to interpret in terms of deforma-well with the c values of Ferhat et al. (1998)tion. It could mean that the triangulation measure-for the Embrunais–Ubaye region (typicallyments that they used do not have the necessary0.15±0.1 mrad yr−1), an area of relatively highaccuracy and/or that their strain estimation strat-seismicity like the Alpes Maritimes region. Inegy was not appropriate to detect the current leveladdition, the c value and direction in the CHEI-
TOUR-NICE-CLAN subnetwork (Fig. 6) are very of deformation in these regions.

13E. Calais et al. / Tectonophysics 319 (2000) 1–17
6.2. Coseismic versus interseimic deformation compressional shear strain azimuth determinedgeodetically, N–S in the western part of the net-work and NW–SE to NNW–SSE in its easternAssuming 0.15 mrad yr−1 of N–S shortening over
the whole network, coseismic deformation as the part (Fig. 6). The earthquake focal mechanismsavailable within our network have P-axis directionsonly contribution to the geodetic strain rates mea-
sured here would require about 35 cm of displace- trending N–S to NW–SE in general, in goodagreement with the geodetic P-axis orientations,ment within the network in the 50 years between
the surveys. However, no earthquake larger than except in the CLAN-TEND-MOUL subnetwork,but where the shear strain rate does not signifi-Ms=3.5 has been recorded within the network in
the past 50 years (Fig. 2). The largest earthquakes cantly differ from zero. The same is true forearthquakes located in the vicinity of site SANR,in the area (M=6.0 and M=5.7, 19/07/63) occurred
offshore, 100 km from the closest geodetic site <10 km east and north of the area, and along thenorthern margin of the Ligurian Sea, 20–25 km(Nice). Assuming 30 cm of coseismic slip on a
20 km long and 10 km deep strike–slip fault, a high- offshore. The N–S to NW–SE compression deter-mined geodetically, therefore, agrees with geologi-end scenario for the corresponding rupture, and
using a dislocation model in an elastic half-space cal and seismological observations over most ofthe network.(e.g. Okada, 1985), implies a maximum coseismic
displacement of 1 mm onshore, which cannot The active faults responsible for the currentdeformation in the study area are not yet clearlyexplain the geodetic signal. Two other earthquakes
(M=4.5, 26/12/89, 25 km offshore, and M=4.7, identified. Chaumillon et al. (1994) proposed acrustal north-dipping reverse fault zone at the base21/04/95, France–Italy border, Figure 2) occurred
at closer distances to the network but the corre- of the continental slope responsible for its currentuplift and for reverse earthquake focal mechanismssponding coseismic deformation within the network
would be less than a millimeter, which cannot along the margin (Fig. 2B). Below the ArgenteraMassif, several authors have proposed the exis-explain the geodetic signal either. Therefore, we
conclude that the shear strain rates measured in the tence of a blind thrust ramp, connected to thesouth with the decollement layer in the Triasicnetwork essentially reflect interseismic deformation.evaporites underlying the Catellane and Nice arcs(Fig. 2B; Siddans et al. (1984); Labaume et al.(1989); Ritz, 1991; Laurent, 1998). If their current6.3. Relation to known active tectonic structures
and earthquake focal mechanisms activity and geometry were confirmed by furtherstudies, these two faults (the Ligurian marginreverse fault zone and the Argentera thrust ramp)A number of geological observations show evi-
dence for Quaternary deformation in the study could contribute to the current uplift and thenorth-south compressive strain regime in thearea (see above), with two major characteristics: a
general uplift from the Argentera massif to the study area.Since compressive shear strain rates cannot dis-Ligurian oceanic margin and a N–S to NW–SE
compression in the Castellane and Nice arcs. tinguish pure shear from simple shear (see above),our geodetic result can be interpreted eitherMicrotectonic studies on recent faults and stress
tensor analysis from earthquake focal mechanisms as compressive pure shear perpendicular to theE–W- to NE–SW- trending compressive structuresindicate N–S to NNE–SSW compressive strain
and stress regime during the Quaternary in the (Castellane and Nice arc and/or deeper crustalthrust ramps), as simple shear along strike–Castellane arc and in the western and southern
part of the Nice arc, whereas NW–SE to NNW– slip faults (Vesubie–Mont Ferion–St Blaise–Aspremont, Breil–Sospel–Monaco, Saorge–Taggia),SSE shortening characterizes the southeastern part
of the Argentera Massif (Campredon et al., 1977; or as a combination of the two. However, we notein Fig. 6 that the azimuth of the maximumRitz, 1991; Maddedu et al., 1997). This shortening
regime is in good agreement with the maximum compressive shear strain rotates around the

14 E. Calais et al. / Tectonophysics 319 (2000) 1–17
Argentera massif from a N–S direction in the work NICE–CAST–SANR), this corresponds to1.5–3.1 mm yr−1 of shortening along the directionwestern part of the network to a NW–SE direction
in the eastern part and remains perpendicular to of the Grasse–Torino baseline (N30E azimuth).Since our network samples only the less seismicallythe proposed blind crustal thrust ramp beneath
the Argentera massif. We also note in Fig. 4B a active part of the Grasse–Torino baseline, onecould expect the shortening determined in theN–S gradient of the maximum compressive shear
strain rate from higher values along the Ligurian Alpes Maritimes to be significantly lower than thefar-field shortening rate. The fact that shorteningcoastline to lower ones toward the Argentera in
the western part of the network. These observa- in the study area along the Grasse–Torino directionis comparable to the Grasse–Torino rate of base-tions, together with geological evidences for N–S
Quaternary compression in the Castellane arc and line length change could indicate that most of thestrain along the Grasse–Torino baseline is localizedalong the Ligurian margin (cf. supra), could indi-
cate that the geodetic compressional shear strain within our network. The lower level of instrumen-tal seismicity in the external part of the southernis rather related to active N–S shortening along
E–W-trending folds and/or thrusts, at least in the French Alps (Castellane and Nice arcs), where ournetwork is located, compared to the inner zoneswestern part of the network.(northeastern flank of the Mercantour Massif ),could either mean that this strain is released aseis-6.4. Relation to larger scale geodetic deformationmically or during infrequent, but moderate orlarge, earthquakes. The existence of several earth-Fig. 7 shows the result of continuous GPS meas-
urements of the 160 km long baseline between quake of large to moderate magnitude along theLigurian coast (magnitude 6.4 in 1887, magnitudeGrasse and Torino, that crosses our study area
[details on the processing strategy can be found in 6.0 in 1963; magnitude 4.5, 1989; magnitude 4.7,1995), suggests that the deformation is not releasedCalais (1999)]. From October 1996 to December
1999 it shows a rate of baseline length change of aseismically (at least not entirely) and tends tosupport the latter hypothesis.−2.0±0.5 mm yr−1 (one sigma). The shear strain
rates found in the southern part of the Western However, such a comparison between locallydetermined strain rates and regional-scale displace-Alps imply an overall N–S to NW–SE shortening
of 2–4 mm yr−1 over the study area. Using a ments, which integrate strain over a large region,has several limitations. An initial limitation is theN350E average direction for the maximum com-
pressive shear strain (from Table 1, except subnet- fact that deformation in the Western Alps is dis-
Fig. 7. Time series of the Grasse–Torino baseline length measured continuously by permanent GPS instruments over the 3.2 yearperiod from October 1996 to December 1999.
15E. Calais et al. / Tectonophysics 319 (2000) 1–17
tributed on several active faults of different orienta- Acknowledgementstions and kinematics, as shown by the instrumentalseismicity (Bethoux et al., 1998), with simulta- The authors would like to thank Alain Harmel
from IGN/SGN for his explanations on the oldneous active thrusting in the external zones andwidespread radial extension in the internal zones triangulation data and for giving them access to
the triangulation site descriptions. They are partic-(Sue et al., 1999). In addition, block rotationshave been evidenced in the internal parts of the ularly grateful to Gilbert Ferhat for providing
them with the triangulation data set and for hisWestern Alps and could also play an importantrole in the internal deformation of the Alpine help with the software. They thank Georges
Buffet, Chi Chuan Tang, Olivier Laurent, Oliviarange (Thomas et al., 1999).Lesne, Anthony Lomax, Philippe Motte, VincentDupuis, and Rafaela Montelli, from GeosciencesAzur, as well as Yves Mehr from the ConseilGeneral des Alpes Maritimes for their efficient,7. Conclusionsand sometimes sportive, help during the GPSmeasurements. This work greatly benefited fromUsing a rigorous combination of GPS and
triangulation data collected 50 years apart in the discussions with Nicole Bethoux and Jean-Francois Ritz. Nicole Bethoux provided the earth-southern part of the Western Alps, we detect shear
strain rates to the order of 0.1–0.2 mrad yr−1, quake focal mechanisms and locations. They thankINSU for providing the GPS equipment. Thesignificantly different from zero in most of the
network. We obtain NW–SE to N–S maximum authors also thank A. Geiger, P.A. Ziegler andJ.-P. Burg for their constructive reviews, that sig-compressional strain directions over most of the
area, in agreement with the seismological and nificantly contributed to improve this paper. Thiswork was funded by the French national programgeological data, that both indicate a Quaternary
N–S to NW–SE compressive strain and stress ‘Geofrance 3D-Alpes’ (BRGM, MENR, INSU ).Contribution Geofrance 3D No. 69 andregime in the southern part of the Western Alps.
The observed strain rate values are about twice as Geosciences Azur No. 305.large as those obtained in Provence by Ferhatet al. (1998). This is consistent with a very lowlevel of seismicity and few geological evidence for Referencesactive deformation in Provence as compared tothe Alpes Maritimes. Interpreted as interseismic Armijo, R., Deschamps, A., Poirier, J.P., 1986. Carte sismotec-
tonique Europe et bassin mediterraneen. Inst. Physique duelastic strain accumulation on locked faults, theGlobe de Paris, Paris.shear strain rates measured here imply long-term
Bethoux, N., Frechet, J., Guyoton, F., Thouvenot, F., Catta-fault slip rates on the order of 2–4 mm yr−1 andneo, M., Eva, C., Nicolas, M., Feignier, B., 1992. A closing
an overall N–S to NW–SE shortening of Ligurian Sea? Pure Appl. Geophys. 139, 179–184.2–4 mm yr−1 over the study area. However, an Bethoux, N., Ouillon, G., Nicolas, M., 1998. The Western Alps
seismicity: spatio-temporal pattern. Geophys. J. Int. 135,interpretation of the strain rates measured here in177–194.term of interseimic deformation is difficult due to
Bigot-Cormier, F., Poupeau, G., Sosson, L., Stephan, J.-F.,a poor morphological expression of active faultsLabrin, E., Ziad, N., Schwarz, S., 1999. Fission track record
in the study area and the lack of information on and exhumation rates of the Argentera external crystallinetheir current activity and geometry at depth. A massif (Western Alps France–Italy). In: Conference on Fis-
sion Tracks, Italy.better identification of potentially active faults andBorchiellini, S., Campredon, R., Bernat, M., 1991. Ground vari-paleoearthquakes (recurrence time of large events)
ation of Radon 222 for location of hidden structural fea-is therefore important in order to integrate geo-tures. Example of the South of France (Alpes Maritimes).
detic, geological and seismological information Pure Appl. Geophys. 135, 625–638.into a deformation model and gain a better under- Boucher, C., Altamimi, Z., Feissel, M., Sillard, P., 1996. Results
and analysis of the ITRF94. IERS Technical Note 20.standing of seismic hazard in the Alpes Maritimes.

16 E. Calais et al. / Tectonophysics 319 (2000) 1–17
Calais, E., 1999. Continuous GPS measurements across the regional deformation from a combination of space and ter-restrial geodetic data. J. Geodesy. 72, 200–214.Western Alps, 1996–1998. Geophys. J. Int. 38, 221–230.
Calais, E., Carrier, A., Buffet, G., 1993. Comparaison de don- Dubar, M., 1987. New data about the structure and recentworking of the rift in the lower Var (Alpes Maritimes,nees de nivellement et de positionnement par GPS: applica-
tion a la determination du geoıde dans les Alpes Maritimes. France) through studying deformations of quaternary ter-rasses. C.R. Acad. Sci. Paris 304, 141–146.C.R. Acad. Sci. Paris 317, 1493–1500.
Calais, E., Barlier, F., Bayer, R., Boucher, C., Chery, J., Cotton, Dubar, M., Perez, J.-L., 1989. Quaternary neotectonics border-ing on the subalpine ‘‘Arc de Nice’’. C.R. Acad. Sci. ParisF., Gariel, J.C., Jouanne, F., Martinod, J., Vigny, C., 1998.
A permanent GPS network for monitoring crustal deforma- 308, serie II, 1485–1490.Feigl, K.F., King, R.W.K., Jordan, T.A., 1990. Geodetic meas-tion in the Western Alps. Annales Geophys. 6, Suppl. 1,
C393. urements of tectonic deformation in the Santa Maria foldand thrust belt, California. J. Geophys. Res. 95, 2679–2699.Campredon, R., Franco, M., Giannerini, G., Gigot, P., Irr, F.,
Lanteaume, M., Spini, H., Tapoul, J.-F., 1977. Les deform- Ferhat, G., Feigl, K.L., Ritz, J.F., Souriau, A., 1998. Geodeticmeasurement of tectonic deformation in the Southern Alpsations des conglomerats pliocenes de l’Arc de Nice (Alpes
Maritimes). C. R. Somm. Soc. Geol. France 2, 75–77. and Provence, France, 1947–1994. Earth Planet. Sci. Lett.159, 35–46.Chamot-Rooke, N., Jestin, F., Gaulier, J.-M., 1999. Constraints
on Moho depth and crustal thickness in the Liguro- Geze, B., 1963. Caracteres structuraux de l’Arc de Nice (AlpesMaritimes). Livre a la memoire du Professeur Fallot 2,Provencal basin from a 3D gravity inversion geodynamic
implications. In: Durand, B., Jolivet, L., Horvath, F., 289–300.Geze, B., 1960. La genese neogene de l’Arc de Nice (Alpes-Seranne, M. (Eds.), The Mediterranean Basins Tertiary
Extension within the Alpine Orogen, Geol. Soc. London, Mar). C. R. somm. Soc. Geol. Fr. 33–34.Gidon, M., Pairis, J.-L., 1986. La nappe de Digne (ChaınesSpecial Publication 156, 37–61.
Chaumillon, E., Deverchere, J., Rehault, J.-P., Gueguen, E., subalpines meridionales): origine, deplacement et significa-tion regionale. C. R. Acad. Sci. Paris 303, 981–984.1994. Tectonic reactivation and flexure of the Ligurian
margin ( Western Mediterranean Sea). C. R. Acad. Sci. Paris Gilli, E., Delange, P., 1999. Recent, slow and aseismic move-ment of an overthrust observed in the Abel sink hole (Saint-319, 675–682.
Chery, J., Vigny, C., Meyer, B., Ferhat, G., Anzidei, M., Bayer, Vallier-de-Thiey, Alpes Maritimes, France). Geodin. Acta12, 169–178.R., Boloh, L., Briole, P., Deschamps, A., Feigl, K.,
Gamond, J.F., Geiger, A., Jouanne, F., Kasser, M., Le Goguel, J., 1936. Description tectonique de la bordure des Alpesde la Bleone au Var. Mem. Serv. Carte Geol. Fr. 1–360.Pape, M., Martinod, J., Menard, G., Ruegg, J.C., Scheubel,
J.M., Walsh, J.J., 1995. Global positionning System network Grellet, B., Combes, P., Granier, T., Philip, H., 1993. Sismotec-tonique de la France metropolitaine dans son cadre geolog-monitors the Western Alps. EOS Trans. Am. Geophys.
Union August 27. ique et geophysique. Mem. Soc. Geol. Fr. 164, 1–176.Guglielmi, 1993. PhD Thesis.Clauzon, G., Suc, J.P., Gautier, F., Berger, A., Loutre, M.F.,
1996. Alternate interpretation of the Messinian salinity crisis Herring, T.A., Davis, J.L., Shapiro, I.I., 1990. Geodesy by radiointerferometry: the application of kalman filtering to theControversy resolved? Geology 24, 363–366.
Combes, P., 1984. La tectonique recente de la Provence occiden- analysis of very long baseline interferometry data. J. Geo-phys. Res. 95, 12561–12581.tale: microtectonique, caracteristiques dynamiques et cine-
matiques. PhD Thesis, Univ. Strasbourg, 1984. Irr, F., 1984. Paleoenvironnements et evolution geodynamiqueneogenes et quaternaires de la bordure nord du Bassin Med-Cosani, L., 1997. Neotectonique et heritage structural entre
Massif du Mercantour et marge ligure le secteur de Saorge– iterraneen Occidental, un systeme de pente de la paleo-marge provencale. PhD Thesis, Univ. Nice.Taggia. Geol Alpine 128–134.
Courboulex, F., Deschamps, A., Cattaneao, M., Costi, F., Jouanne, F., Menard, G., Jault, D., 1994. Present-day deforma-tion measurement in the French north-western Alps/south-Deverchere, J., Virieux, J., Augliera, P., Lanza, V., Spallar-
osa, D., 1998. Source study and tectonic implications of the ern Jura Mountains: data from triangulations comparison.Geophys. J. Int. 119, 151–165.Ventimiglia (border of Italy and France) earthquake
(ML=4.7). Tectonophysics 290, 245–257. Julian, M., 1980. Les Alpes Maritimes franco-italiennes : etudegeomorphologique, PhD Thesis, Univ. Aix-Marseille.DeMets, C., Gordon, R.G., Argus, D.F., Stein, S., 1990. Cur-
rent plate motions. Geophys. J. Int. 101, 425–478. King, R.W., Bock, Y., 1997. Documentation for the GAMITGPS Software Analysis, Release 9.7. Inst. of TechnologyDeMets, C., Gordon, R.G., Argus, D.F., Stein, S., 1994. Effect
of recent revisions to the geomagnetic reversal time scale on and Scripps Inst. of Oceanography, MA.Labaume, P., Ritz, J.-F., Philip, H., 1989. Recent normal faultsestimates of current plate motions. Geophys. Res. Lett. 21,
2191–2194. in the southwestern Alps: their relationships with compres-sion tectonics. C.R. Acad. Sci. Paris 308, serie II, 1553–1560.Dong, D., 1993. The horizontal velocity field in southern Cali-
fornia from a combination of terrestrial and space geodetic Larson, K.M., Agnew, D.C., 1991. Application of the GlobalPositioning System to crustal deformation measurement, 1.data. PhD Thesis, Mass. Inst. Tech.
Dong, D., Herring, T.A., King, R.W.K., 1998. Estimating Precision and accuracy. J. Geophys. Res. 96, 16547–16565.
17E. Calais et al. / Tectonophysics 319 (2000) 1–17
Laurent, O., 1998. Modalites de la structuration d’un prisme la croute terrestre entre Toulon et Genes. PhD Thesis, Univ.Paris 6, France.de front de chaıne : l’exemple de l’Arc de Castellane Chaınes
Reilly, W.I., Gubler, E., 1990. Crustal strain in Switzerland,subalpines meridionales, France, PhD Thesis, Univ. Nice1870–1970. Geophys. J. Int. 103, 251–256.Sophia Antipolis.
Ritz, J.-F., 1991. Evolution du champ de contrainte dans lesLaurent, O., Stephan, J.-F., Popoff, M., 1999. The Arc deAlpes du Sud depuis la fin de l’Oligocene, implications sis-Castellane fold-and-thrust belt Southern French Alps geo-motectoniques. PhD Thesis, Univ. Montpellier II, France.metry and kinematics. Tectonophysics (submitted for
Ritz, J.F., 1992. Tectonique recente et sismotectonique despublication).Alpes du Sud: analyse en termes de contraintes. QuaternaireLejeune, M., 1950. Memorial de la Nouvelle Traingulation3, 111–124.Francaise. Institut Geographique National, Paris.
Ritz, J.-F., Hoang Trong, P., Rebaı, S., Philip, H., Herquel,Levret, A., Backe, J.C., Cushing, M., 1994. Atlas of macro-G., 1989. Le seisme du 26 decembre, en Mediterranee, auseismic maps of French earthquakes with their principallarge de la Cote d’Azur: tectonique en compression perturb-
characteristics. Natural Hazards 10, 19–46.ations de contraintes et inversion tectonique au niveau d’une
Lyon-Caen, H., Molnar, P., 1989. Constraints on the deep marge continentale. C.R. Acad. Sci. Paris 310 (1505),structure and dynamic processes beneath the Alps and adja- 1512–1990.cent regions from an analysis of gravity anomalies. Geo- Schroetter, J.-M., 1998. L’enregistrement sedimentaire de laphys. J. Int. 99, 19–31. deformation mio-plio-quaternaire sur la bordure ouest de
Maddedu, B., Bethoux, N., Stephan, J.F., 1997. Champ de con- l’Arc de Nice : analyse sedimento-morpho-structurale. Geol.trainte post-pliocene et deformations recentes dans les Alpes Alpine 74, 146–149.sud-occidentales. Bull. Geol. Fr. 167, 797–810. Sebrier, M., Ghafiri, A., Bles, J.L., 1997. Paleoseismicity in
Martinod, J., Jouanne, F., Taverna, J., Menard, G., Gamond, France: fault trench studies in a region of moderate seismi-J.F., Darmendrail, X., Notter, J.C., Basile, C., 1996. Pre- city. J. Geodyn. 24, 207–217.sent-day deformation of the Dauphine alpine and subalpine Shen, Z.K., Jackson, D.D., Ge, B.X., 1996. Crustal deformationmassifs (SE France). Geophys. J. Int. 127, 189–200. across and beyond the Los Angeles basin from geodetic
Menard, G., 1988. Structure et cinematique d’une chaıne de measurements. J. Geophys. Res. 101, 27957–27980.Siddans, A.W.B., Henry, B., Kligfield, R., Lowrie, W., Hirt,collision: les Alpes occidentales et centrales, PhD Thesis,
A., Percevault, M.N., 1984. Finite strain patterns and theirUniv. Grenoble, France.significance in Permian rocks of the Alpes MaritimesOkada, Y., 1985. Surface deformation to shear and tensile faults(France). J. Struct. Geol. 6 (4), 339–368.in a half-space. Bull. Seism. Soc. Am. 75, 138–142.
Straub, C., Kahle, H.G., 1995. Active crustal deformation inPelline-Chabert, C., 1996. Geometrie et cinematique de lathe Marmara Sea region NW Anatolia, inferred from GPSbranche occidentale de l’Arc de Castellane (Chaınes subal-measurements. Geophys. Res. Lett. 22, 2533–2536.pines de Haute-Provence, France), PhD Thesis, Univ. Nice
Sue, C., Thouvenot, F., Frechet, J., Tricart, P., 1999. Wide-Sophia Antipolis, France.spread extension in the core of the Western Alps revealedPerez, J.-L., 1975. La zone limite entre l’Arc de Nice et l’Arcby erthquake analysis. J. Geophys. Res. 104, 25611–25622.de la Roya (Alpes Maritimes). Bull. Soc. Geol. Fr. 7,
Thomas, J.-C., Claudel, M.E., Collombet, M., Tricart, P.,930–938.Chauvin, A., Dumont, T., 1999. First paleomagnetic dataPhilip, H., 1987. Plio-Quaternary evolution of the stress fieldfrom the sedimentary cover of the French Penninic Alps:
in Mediterranean zones of subduction and collision. Ann.evidence for Tertiary counterclockwise rotations in the West-
Geophys. 3, 301–320. ern Alps. Earth Planet. Sci. Lett. 171, 561–574.Rebaı, S., 1988. Le champ de contrainte actuel en Europe et Thouvenot, F., 1996. Aspects geophysiques et structuraux des
dans les regions mediterraneennes — etude du decrochement Alpes occidentales et de 3 autres orogenes (Atlas, Pyrenees,senestre ploi-quaternaire de Peille-Laghet (Nice) et signifi- Oural ), PhD Thesis, Univ. Grenoble, France.cation des failles normales dans un contexte compressif. Tressols, F., 1996. PhD Thesis, Univ. Nice, France.Masters Thesis, Univ. Montpellier II, France. Ward, S.N., 1994. Constraints on the seismotectonics of the
Recq, M., 1973. Contribution a l’etude de la structure profonde central Mediterranean from Very Long Baseline Interfero-de la croute terrestre dans la region de Nice. Bull. Geofis. metry. Geophys. J. Int. 117, 441–452.Soc. Teor. Applic. 58, 161–180. Zarraoa, N., Rius, A., Sardon, E., Ryan, J.W., 1994. Relative
Recq, M., 1974. Contribution a l’etude de la zone de transition motions in Europe studied with a geodetic VLBI network.Geophys. J. Int. 117, 763–768.entre la structure continentale et la structure oceanique de