Present-Day Crustal Stress Pattern Across Spatial Scales
266
Present-Day Crustal Stress Pattern Across Spatial Scales: Analysis and Interpretation from Plate-Wide to Local-Scales Mojtaba Rajabi, B.Sc. (Hons.), M.Sc. The Australian School of Petroleum This thesis is submitted in fulfilment of the requirements for the degree of Doctor of Philosophy (Ph.D.) in the Faculty of Engineering, Computer & Mathematical Sciences, The University of Adelaide October 2016
-
Upload
khangminh22 -
Category
Documents
-
view
1 -
download
0
Transcript of Present-Day Crustal Stress Pattern Across Spatial Scales

Present-Day Crustal Stress Pattern Across Spatial Scales:
Analysis and Interpretation from Plate-Wide to Local-Scales
Mojtaba Rajabi, B.Sc. (Hons.), M.Sc.
The Australian School of Petroleum
This thesis is submitted in fulfilment of the requirements
for the degree of Doctor of Philosophy (Ph.D.)
in the Faculty of Engineering, Computer & Mathematical Sciences,
The University of Adelaide
October 2016

In memory of my dear Mum
To my Dad and siblings
with love and eternal appreciation
i
Table of Content
Abstract .......................................................................................................................................... iv
Declaration..................................................................................................................................... vi
Acknowledgements ...................................................................................................................... vii
1. Contextual Statement ............................................................................................................ 1
1.1. Subject of the Thesis .......................................................................................................... 1
1.2. Structure of the Thesis ...................................................................................................... 3
1.2.1. Journal Papers about the Australian Stress Pattern: New Phase of the Australian Stress
Map Project ...................................................................................................................................... 6
1.2.2. Journal Papers about the Stress Pattern in New Zealand ............................................... 10
1.2.3. Journal Paper about the Stress Pattern of Iceland .......................................................... 11
1.2.4. Contribution of This Thesis in the New Release of the WSM Project .......................... 11
1.2.5. Contribution of the Author to Other Publications .......................................................... 12
1.3. Stress Map Databases ...................................................................................................... 12
1.4. Reference .......................................................................................................................... 13
2. Literature Review: the Concept of Stress Tensor, Methodology and Sources of the
Contemporary Stress Field ......................................................................................................... 14
2.1. Introduction ...................................................................................................................... 14
2.2. The Concept of Stress Tensor ......................................................................................... 17
2.2.1. Force, Traction and Stress .............................................................................................. 17
2.2.2. Stress Tensor and Principal Stresses .............................................................................. 19
2.2.3. Tectonic Stress Regime .................................................................................................. 21
2.3. Methods for Estimation of the Contemporary Stress Orientation .............................. 21
2.3.1. Focal Mechanism Solution of Earthquakes .................................................................... 23
2.3.2. Drilling-Related Stress Indicators .................................................................................. 24
2.3.2.1. Borehole Breakouts .................................................................................................... 25
2.3.2.2. Drilling-Induced Tensile Fractures (DIFs) ................................................................. 27
2.3.3. Geological Indicators to Estimate the SHmax Orientation ................................................ 28

ii
2.3.4. Other Methods for Estimation of the SHmax Orientation ................................................. 29
2.3.5. World Stress Map Quality Ranking Criteria for the SHmax Orientation .......................... 29
2.4. Methods for Estimation of the (One Dimensional) Present-Day Stress Magnitude... 29
2.4.1. Vertical Stress: Integration of Density Log ................................................................... 31
2.4.2. Engineering Methods to Estimate SHmax and Shmin Magnitudes ...................................... 31
2.4.2.1. Hydraulic Fracturing Tests ......................................................................................... 32
2.4.2.2. Overcoring Measurements ......................................................................................... 32
2.4.3. Petroleum (Wellbore) Methods for Estimation of Shmin Magnitude ............................... 33
2.4.4. Petroleum (Wellbore) Methods for Estimation of SHmax Magnitude.............................. 35
2.4.4.1. SHmax Estimations from Extended Leak-Off and Minifracture Tests ......................... 35
2.4.4.2. SHmax Estimation from Frictional Limit Theory ......................................................... 36
2.4.4.3. SHmax Estimation from the Occurrence of DIFs and Breakouts .................................. 36
2.4.4.4. Poroelastic Equations for the Estimation of Horizontal Stress Magnitude ................ 37
2.5. Methods for Prediction of Three Dimensional Present-Day Stress: 3D Geomechanical-
Numerical Modelling ................................................................................................................... 38
2.6. The Stress State in the Earth’s Crust ............................................................................. 40
2.7. References ......................................................................................................................... 44
3. The Present-Day Stress Field of Australia ......................................................................... 53
3.1. Paper 1: Present-Day Stress Orientation in the Clarence-Moreton Basin of New South
Wales, Australia: A New High Density Dataset Reveals Local Stress Rotations .......................... 53
3.2. Paper 2: The Present-Day Stress Field of New South Wales, Australia ............................ 74
3.3. Paper 3: The Present-Day State of Stress in the Darling Basin, Australia: Implications for
Exploration and Production. .......................................................................................................... 97
3.4. Paper 4: New Constraints on the Contemporary Stress Pattern of the Flinders and Mount
Lofty Ranges, South Australia ..................................................................................................... 114
3.5. Paper 5: The Present-Day Stress Field of Australia ......................................................... 131
3.6. Paper 6: Prediction of the Present-Day Stress Field in the Australian Continental Crust
Using 3D Geomechanical-Numerical Models ............................................................................. 175
3.7. Conference Papers for the Australian Stress Research .................................................... 208
4. The Present-Day Stress Field of New Zealand ................................................................ 231

iii
4.1. Paper 7: Contemporary Tectonic Stress Pattern of the Taranaki Basin, New Zealand .... 231
4.2. Paper 8: Present-Day Stress Pattern of New Zealand ...................................................... 251
5. The Present-Day Stress Field of Iceland .......................................................................... 270
5.1. Paper 9: The Stress Pattern of Iceland ............................................................................. 270
5.2. Conference Papers Related to Iceland Stress Pattern ....................................................... 286
6. Conference Papers Related to the World Stress Map-2016 ........................................... 289
6.1. The World Stress Map Database Release 2016 - Global Crustal Stress Pattern vs. Absolute
Plate Motion ................................................................................................................................. 290
7. Concluding Statement........................................................................................................ 308
8. Contribution to Additional Papers ................................................................................... 312
8.1. Paper 10: The Effect of Magmatic Intrusions on Coalbed Methane Reservoir
Characteristics: A Case Study from the Hoskissons Coalbed, Gunnedah Basin, Australia ......... 312
8.2. Conference Papers ........................................................................................................... 326
9. Appendix ............................................................................................................................. 341

iv
Abstract
This thesis analyses the present-day crustal stress field (from 0 to 40 km depth) in a wide variety of tectonic settings and spatial scales, using data compiled in Australia (an intraplate tectonic setting), New Zealand (a convergent boundary with transform faults) and Iceland (a spreading centre overlying a hot-spot). The contemporary stress patterns of 20 sedimentary basins were interpreted by the author using analysis of wellbore image and four-arm caliper logs in 750 wells, resulting in approximately 1000 new quality-ranked stress indicators from wells. This extensive dataset of borehole breakout and drilling-induced fracture data was combined with over 300 additional wellbore stress indicators compiled from published or in-press sources. In addition, other sources of stress information, such as recent earthquake data, were compiled from various seismological catalogues and quality ranked according to the World Stress Map project (WSM) guidelines. The majority of the data analysed in this thesis are from regions where there were no, or sparse, in-situ stress information in the WSM database.
The first part of the thesis presents extensive wellbore data analysis of the contemporary maximum horizontal stress orientation (SHmax) in the Australian continent, which is entirely located in the Indo-Australian Plate. Previous studies on the stress field of Australia revealed that the complex stress pattern of the continent is controlled, at a first-order, by large-scale forces exerted at the plate boundaries. However, prior analysis of the contemporary Australian stress pattern has been unable to model or explain the stress pattern observed in most of eastern Australia, and has not extensively addressed the numerous smaller scale variations in stress orientation that are frequently observed in most basins. The recent development of unconventional reservoirs in Australia has resulted in a greatly increased amount of new data for stress analysis in previously unstudied or poorly-constrained areas in eastern Australia. In addition, stress analysis in conventional hydrocarbon, mineral and geothermal exploration wells in all other parts of the continent provided the opportunity to review and update the Australian Stress Map (ASM), and collect the first reliable and robust stress datasets from areas outside of sedimentary basins. The first part of this thesis presents an extensive analysis of borehole image and oriented-caliper logs in various parts of New South Wales (Gunnedah, Clarence-Moreton, Darling, Gloucester, Bowen-Surat and Sydney basins), Queensland (Bowen, Surat, Cooper-Eromanga and Galilee basins), South Australia (Officer, Cooper and Eromanga basins and mineral/geothermal wells), Western Australia (Browse Basin), Northern Territory (McArthur and Pedirka basins), Victoria and Tasmania (Gippsland, Otway, Bass and Sorell basins). In addition, all other published data for the stress analysis in the Australian continent was compiled to provide the most comprehensive stress map of Australia ever produced. This represents the first update of the ASM in 13 years, and raises the amount of stress data in the continent from 594 to 2140 data records, as well as an increase in the number of defined stress provinces to 30 (from 16 provinces in 2003). Analysis of stress provinces throughout the Australian continent reveals four major trends for the orientation of SHmax, including NE-SW in northern, northeastern Australia as well as Bonaparte and Canning Basins in northwestern Australia, E-W in most part of Western Australia and South Australia, ENE-WSW in most parts of eastern Australia and NW-SE in southeastern Australia. In addition, high-density datasets in several sedimentary basins of eastern Australia reveal substantial stress perturbations at smaller scales (from tens of kilometres to the meter scale) owing to various geological structures, including basement structures, faults, fractures and lithological contrasts.
Along with the Australian stress analysis conducted in this study, a 3D geomechanical-numerical model is constructed to predict the regional stress pattern of the continent. The model has several inputs, including various strength layers and rock mechanical data of different lithologies; and is subdivided into mantle, basement and sediment. The presented large-scale 3D model in this thesis fits

v
the first-order stress state of the Australian continent much better than previous published models. Hence, this predictive model can provide appropriate displacements or stress boundary conditions for high-resolution basin and reservoir-scale 3D geomechanical models.
The second part of this thesis presents the first comprehensive stress map of New Zealand with 652 in-situ stress data records, including 183 wellbore data records from the Taranaki, East Coast and Canterbury basins. The complex interaction of the Pacific and Australian plates at New Zealand provides a unique location to study the present-day stress field in a tectonically active area. Nine stress provinces are defined across New Zealand, which highlight the dominant role of Pacific Plate subduction beneath the Indo-Australian Plate, along the Hikurangi Margin, in the stress pattern of North Island’s New Zealand. The analysis of stress provinces in the North Island revealed two regional SHmax orientations, including an E-W trend around the eastern coast (~040°S) that is perpendicular to the subduction trench, and a prevailing NE-SW SHmax orientation in the intra-arc and back-arc regions that is parallel to the trench. The SHmax orientation in much of the South Island is ESE-WNW, which is sub-parallel to the absolute motion of the Pacific Plate in this region. The stress analyses across New Zealand revealed significant inconsistencies between the SHmax orientations and major active strike-slip faults (such as Alpine and Marlborough fault systems), which further supports the prevalent hypotheses that these large active tectonic features are weak.
The third part of this thesis examines the stress pattern of Iceland which has a unique geological and tectonic setting. It is located above a hotspot and on an exposed portion of the Mid-Atlantic Ridge, at the boundary of the North American and Eurasian plates. The contemporary stress pattern of Iceland has not been comprehensively investigated prior to this study. This thesis presents the contribution of the author in the first extensive compilation of in-situ stress data across Iceland. In particular, the author analysed acoustic wellbore image logs in 57 geothermal wells. The wellbore results were combined with other stress indicators, including overcoring measurements, geological information and earthquake focal mechanism solutions resulting in a dataset with 495 SHmax orientation data records. Analysis of stress data in Iceland revealed four regional SHmax orientations across the island. The SHmax is parallel to the rift axes around the active spreading centres while it is parallel to absolute plate motion in regions that are located far away from the ridge such as Westfjords. The orientation of SHmax in the northern part is NNW-SSE that changes to N-S in central part and to NE-SW in the southern Iceland.
The final part of this thesis presents the contribution the author has made to the forthcoming (2016) release of the WSM project, which is a collaborative effort that has involved dozens of researchers from across the world. This year marks the 30th anniversary of the WSM project, with significant improvements in the data qualities and quantities. The new release of the WSM project contains 42870 data that is an increase of > 20,000 data records from the prior 2008 WSM release. The contribution of the author in the WSM includes the latest in-situ stress data compilations in Australia, New Zealand, Iceland and the Middle East, and represents the largest increases in borehole data stress data by any single contributor to the WSM. The resulting data increase shows stress orientation variability in several areas at regional and local-scale, which again questions one of the original findings of the WSM project, namely that the crustal present-day stress pattern is primarily controlled by plate boundary forces. This original hypothesis is again re-visited herein, and I show that, whilst these earlier ideas are still valid in principle, there are many areas in which present-day stress significantly deviates from plate motion, or the stress expected to arise purely from plate boundary forces and major sources of intra-plate stress. These deviations seem to be either due to different plate boundary forces acting in different directions, mantle drag forces, major structural heterogeneities or additional internal body forces.

vi
Declaration
I certify that this work contains no material which has been accepted for the award of any other
degree or diploma in my name, in any university or other tertiary institution and, to the best of my
knowledge and belief, contains no material previously published or written by another person, except
where due reference has been made in the text. In addition, I certify that no part of this work will, in
the future, be used in a submission in my name, for any other degree or diploma in any university or
other tertiary institution without the prior approval of the University of Adelaide and where
applicable, any partner institution responsible for the joint award of this degree.
I give consent to this copy of my thesis when deposited in the University Library, being made
available for loan and photocopying, subject to the provisions of the Copyright Act 1968.
I acknowledge that copyright of published works contained within this thesis resides with the
copyright holder(s) of those works.
I also give permission for the digital version of my thesis to be made available on the web, via the
University’s digital research repository, the Library Search and also through web search engines,
unless permission has been granted by the University to restrict access for a period of time.
Mojtaba Rajabi Date

vii
Acknowledgements
This thesis documents my research about the ‘present-day stress pattern of the earth’s crust’. While
my name may be alone on the front cover of this thesis, I am by no means its sole contributor. Rather,
there are a number of people behind this piece of work who deserve to be both acknowledged and
thanked here.
Thanks to Dr. Mark Tingay for his supervision. Without his guidance and patience this thesis would
not have been possible. I am grateful for having such a supportive supervisor who has such a great
desire to see his student succeed. I also would like to thank my external supervisor Dr. Oliver
Heidbach for his ongoing support, encouragement and sharing his knowledge of the crustal stress and
geomechanical-numerical modelling.
This project could not have been undertaken without the support and data provided by the New South
Wales Department of Resources and Energy; the Geological Survey of Queensland (Department of
Natural Resources and Mines); Department of State Development, South Australia; Department of
Mines and Energy of Northern Territory; Department of Mines and Petroleum of Western Australia;
Mineral Resources Tasmania; Australian Geophysical Observing System project and the New Zealand
Petroleum & Minerals, Ministry of Business, Innovation & Employment. In particular I would like to
thank Michelle Kounnas and Alison Troup for their support in collecting the necessary data of New
South Wales and Queensland.
Thanks to all sponsors of this project for supporting and funding my research. Thanks to the
University of Adelaide for my ASI scholarship. Thanks also to the Australian Research Council (ARC
Discovery Grants DP120103849) and Australian Society of Exploration Geophysicists (ASEG
Research Foundation RF13P02) for their funding. I would also like to specially thank PESA-South
Australia, SPE-South Australia, Formation Evaluation Society of Australia, The European
Association of Geoscientists and Engineers, Elsevier and International Association for Mathematical
Geosciences for scholarships and grants that assisted my funding.
Thanks to all the staff at the Australian School of Petroleum who supported me during my study at the
school. A special thanks to Ian for help with all of my computer problems. I also deeply appreciate the
welcome I have received from the ‘Section 2.6’ of the ‘German Research Centre for Geosciences –
GFZ’ in Potsdam during my visits. Thanks also to the Ikon Science in Adelaide (formerly JRS

viii
Petroleum Research) in particular Dr. Jerry Meyer, Dr. Scott Mildren and Dr. Oliver Bartdorff for
giving me the opportunity to gain valuable industry work experience as well as geomechanical-related
help and advice during my PhD.
Thanks to all the co-authors for sharing their knowledge and ideas. In particular I would like to thank
Arno Zang, Betina Bendall, David Belton, Karsten Reiter, Moritz Ziegler, Natalie Balfour, Richard
Hillis and Scott Reynolds. I also wish to acknowledge thesis examiners and those who reviewed
papers and contributed to improvement of publications through their constructive comments.
Thanks to all the friends I have made over these years working in Australia and Germany, hopefully
our paths will cross again. To Ali Shemshadi, Alireza Keshavarz, Alireza Salmachi, Ernest
Swierczek, Fengtao Guo, Johannes Altmann, Hassan Amirparast, Karsten Reiter, Mohammad
Tabatabei, Moritz Ziegler, Sara Borazjani, Yulong Yang and Zahra Tooski.
Finally, special thanks to my dear Mum …I miss you Mum… I could never have done this without
your love, affection and unconditional support. I would like to extend my gratitude and sincere thanks
to my Dad for all his support and guidance throughout my whole life, and providing me the
opportunity to pursue my goals and dreams. I would like to especially thank my siblings, Farhad,
Fatemeh, Mansooreh and Marzieh for their support and encouragement. I would not have been able
to complete a PhD without them.

1. Contextual Statement
1.1. Subject of the Thesis
The crustal present-day stress is defined as the contemporary state of tectonic stresses within the
subsurface, and is commonly described by four components, namely the magnitudes of overburden
stress (Sv), minimum and maximum horizontal stresses (Shmin and SHmax, respectively); and the
orientation of SHmax (Engelder, 1993; Zoback, 2010). The study of crustal stress primarily examines
the causes (sources) and consequences (application) of in-situ stress in the earth’s crust. The stress at
any given point has several sources, including ‘long-term, ongoing and wide-scale’ and ‘short-term
and local-scale’ sources (Cornet, 2015; Gaucher et al., 2015; Heidbach et al., 2007; Zoback, 1992).
In order to better understand the crustal stress state, the analyses of both local- and wide-scale
sources are required. Because there is a direct relationship between the stress sources and the
application of the present-day stresses in various aspects of human’s life.
The study of stress at large-scales, so called first-order, (> 500 km) provides information on
geodynamic process, neotectonic deformation and seismic hazard assessments (Heidbach et al.,
2010; Zoback, 1992). The analyses of stress at smaller-scales have numerous applications in
reservoir geomechanics, civil engineering and mining industry (Bell, 1996; Jaeger and Cook, 1979;
Zang and Stephansson, 2010; Zoback, 2010). To date, numerous studies have investigated the stress
analysis from different perspectives. However, the stress, in geosciences, is still enigmatic because it
is a scale-dependant parameter. It means, stress variations can be studied at both the ‘spatial-scale’
and ‘temporal-scale’. This thesis aims to investigate the crustal stress pattern with a particular
emphasis on the SHmax orientation at various spatial-scales, ranging from continental scales down to
basin, field and wellbore scales, to better evaluate the role of various stress sources and their
applications in the earth’s crust. The bulk of the data analysed in this thesis are from petroleum,
geothermal and mineral wells, particularly in regions where there were no, or sparse, in-situ stress
information in the World Stress Map database.
Significance of the project: Crustal stresses are of extreme importance for understanding both
natural processes (e.g. understanding neotectonics, earthquake and seismic hazard assessment) and
anthropogenic activities (e.g. petroleum exploration and production, geothermal energy extraction,
CO2 sequestration, mine stability) and, thus, the fundamental significance of this project lies in
improving our knowledge on the nature and origin of stress in the earth’s crust. Whilst the global
present-day stress pattern has been a topic of broad interest for over three decades, the stress field of
some regions remain enigmatic (such as Australia) and/or poorly understood (such as New Zealand
and Iceland). The main part of this thesis aims to investigate the stress pattern of Australia and the
Indo-Australian Plate, which is unique amongst all major tectonic plates, as it is the only major plate
1

in which present-day SHmax orientation is not broadly aligned to absolute plate motion. Therefore, the
first part of this thesis presents the first major update of the Australian Stress Map since 2003. The
new Australian Stress Map presented herein contains approximately double the information of the
2003 version, both in terms of stress indicators as well as with regards to stress provinces
investigated, and reveals that the stress pattern in Australia is far more complex than previously
considered. The second part of the thesis examines New Zealand, which is located at the eastern
boundary of the Indo-Australian and Pacific Plates, and provides the most comprehensive stress map
of New Zealand produced to date. The stress data in New Zealand reveals the varying roles of plate
boundary forces in the state of crustal stress in this micro-continent. The subduction of the Pacific
Plate beneath the Indo-Australian Pate along the Hikurangi margin provides the major control on the
stress pattern of this region in which the stress pattern in the fore-arc is almost trench-perpendicular
while in the intra-arc and back-arc region is trench-parallel. The stress analyse in South Island show
a consistent ESE-WNW pattern of maximum horizontal stress that is aligned to the absolute Pacific
Plate motion in this region. The third part of this thesis highlights the contribution made by the
author in developing greater understanding of the stress pattern in Iceland, as part of the Iceland
Stress Map Project, which compiled the first ever detailed stress map at this unique tectonic setting
(i.e. active onshore spreading centre with a hotspot). This project is particularly significant because
it investigates the state of stress in three different tectonic settings, with a wide range of data at
various spatial scales from wellbore to tectonic plate. Indeed, the author’s contribution in the
interpretation and compilation of stress data, presented in this thesis has formed a significant part of
the third major release of the World Stress Map Project to be released in late 2016. More detailed
innovations of this project are summarised below.
• The first ever examination of contemporary stress pattern in several Australian basins,
including Gunnedah, Clarence-Moreton, Officer, Darling, Bowen, Surat, Galilee, Sydney
and Gloucester basins.
• The first ever wellbore investigation of SHmax orientation in mineral wells of South Australia
and Victoria in regions mainly consisting of basement rocks.
• The first major update of the Australian Stress Map for 13 years, with 2140 data records in
30 stress provinces (compared to 549 data records in 16 provinces previously available).
• An update to the stress-orders classification, in which ‘fourth-order’ stress sources are
suggested as controls on the stress pattern in small-scales (< 1km). These small-scale stress
sources, such as fractures, faults, lithological contrasts, have significant implications in
exploration and production of geothermal and unconventional hydrocarbon reservoirs.
• The first detailed 3D geomechanical-numerical model for the Australian continent that
contains both stress regime and orientation.
2

• The first comprehensive stress map of New Zealand with 652 present-day stress data
records including 183 data records from petroleum wells.
• The first detailed analysis of the SHmax orientation in Iceland inferred from borehole image
logs in geothermal wells, where routine petroleum tools cannot be run due to high
temperature conditions.
1.2. Structure of the Thesis
This thesis contains nine stress-related journal publications or manuscripts (Table 1; six published/in
press, two in review; one in preparation), as well as the 2016 release of the World Stress Map
project that has already been presented at three conferences (Table 2). The main emphasis of this
thesis is on the stress pattern of Australia, which is presented in six papers or manuscripts (Tables 1)
and seven conference papers (Table 2). In addition, this thesis presents the first comprehensive
stress map of New Zealand in two papers including the Taranaki Basin (published) and whole New
Zealand (in preparation). Finally, the contribution of the author towards stress data analysis in
Iceland is presented, and which has resulted in the first comprehensive compilation of stress data in
Iceland.
A brief overview on each paper is presented below. In particular, I describe below how these papers
are related to this thesis topic, and have resulted in the new release of the Australian Stress Map
project. I then explain my contribution in the new release of the World Stress Map project, which
marks the 30th anniversary of this significant scientific endeavour. The last part of the thesis
highlights the author’s contribution in the study of magmatic intrusions and their roles in the coal
seam gas reservoir characteristics (Papers J-10 and C-16 in Tables 1 and 2 respectively).
3

Table 1: continued…
No. Detail Status
J-1
Rajabi, M., Tingay, M., King, R., Heidbach, O., 2016. Present-day stress orientation
in the Clarence-Moreton Basin of New South Wales, Australia: a new high density
dataset reveals local stress rotations. Basin Research. DOI: 10.1111/bre.12175
Published
online
J-2
Rajabi, M., Tingay, M., Heidbach, O., 2016. The present-day stress field of New
South Wales, Australia. Australian Journal of Earth Sciences 63, 1-21. DOI:
10.1080/08120099.2016.1135821
Published
J-3
Rajabi, M., Tingay, M., Heidbach, O., 2016. The present-day state of stress in the
Darling Basin, Australia: Implications for exploration and production. Journal of
Marine and Petroleum Geology 77, 776-790. DOI: 10.1016/j.marpetgeo.2016.07.021
Published
J-4
Rajabi, M., Tingay, M., Belton, D., Balfour, N., Bendall, B., 2016. New constraints
on the neotectonic stress pattern of the Flinders and Mount Lofty Ranges, South
Australia. Exploration Geophysics. DOI: 10.1071/EG16076.
Published
online
J-5 Rajabi, M., Tingay, M., Heidbach, O., Hillis, R., Reynolds, S., in-review. The
present-day stress field of Australia, Under-review in Earth-Science Reviews. in review
J-6
Rajabi, M., Heidbach, O., Tingay, M., Reiter, K., Prediction of the present-day stress
field in the Australian continental crust using 3D geomechanical-numerical models.
Under-review in the Australian Journal of Earth Sciences.
in review
J-7
Rajabi, M., Ziegler, M., Tingay, M., Heidbach, O., Reynolds, S., 2016.
Contemporary tectonic stress pattern of the Taranaki Basin, New Zealand. Journal of
Geophysical Research: Solid Earth 121, 6053-6070. DOI: 10.1002/2016JB013178
Published
J-8 Rajabi, M., Tingay, M., Heidbach, O., Ziegler, M., in-prep. Present-day crustal
stress pattern of New Zealand. In-preparation. in preparation
J-9
Ziegler, M., Rajabi, M., Heidbach, O., Hersir, G.P., Ágústsson, K., Árnadóttir, S.,
Zang, A., 2016. The stress pattern of Iceland. Tectonophysics 674, 101-113. DOI:
10.1016/j.tecto.2016.02.008
Published
J-10
Salmachi, A., Rajabi, M., Reynolds, P., Yarmohammadtooski, Z., Wainman, C.,
2016. The Effect of Magmatic Intrusions on Coalbed Methane Reservoir
Characteristics: A Case Study from the Hoskissons Coalbed, Gunnedah Basin,
Australia. International Journal of Coal Geology 165, 278-289.
DOI:10.1016/j.coal.2016.08.025
Published
Table 1: An overview on the journal papers presented in this thesis.
4

Table 2: continued…
No. Detail Type
C-1 Rajabi, M., Tingay, M., King, R., Cooke, D., 2015. The present-day stress field of Australia: New release of the Australian Stress Map. ASEG Extended Abstracts 2015, 3 pages. DOI: http://dx.doi.org/10.1071/ASEG2015ab303
Peer-reviewed (extended abstract)
C-2
Rajabi, M., Tingay, M., Heidbach, O., King, R., 2015. The role of faults and fractures in local and regional perturbation of present-day horizontal stresses - an example from the Clarence-Moreton Basin, eastern Australia, 77th EAGE Conference & Exhibition 2015. EAGE, IFEMA Madrid, Spain, 5 pages. DOI: 10.3997/2214-4609.201413346
Peer-reviewed (extended abstract)
C-3 Rajabi, M., Tingay, M., 2016. Pattern and origin of the present-day tectonic stress in the Australian sedimentary basins. ASEG-PESA 2016, ASEG extended abstracts.
Peer-reviewed (extended abstract)
C-4 Rajabi, M., Tingay, M., Heidbach, O., King, R., 2015. The Pattern of In Situ Stress in Onshore Basins of New South Wales, AAPG International Conference & Exhibition. AAPG Datapages, Melbourne, Australia. DOI: 10.1190/ice2015-2210249
Abstract
C-5
Rajabi, M., Tingay, M., Heidbach, O., King, R., Cooke, D., 2015. The New Release of the Australian Stress Map: Controls on the Stress Pattern From the Plate to Field Scale, AAPG International Conference & Exhibition. AAPG, Melbourne, Australia.: DOI: 10.1190/ice2015-2210754
Abstract
C-6 Rajabi, M., Tingay, M., Heidbach, O., King, R., 2015. The contemporary state of stress in Australia from regional to local scale, Presented in: the Geology of Geomechanics. The Geological Society of London, London.
Abstract
C-7
Rajabi, M., Tingay, M., Heidbach, O., 2016. The present-day tectonic stress pattern of Australia: the new release of the Australian stress map project, Neotectonics on the Australian Plate. Presented in invited symposium: New Science for Energy, Mineral and Groundwater Systems, and Hazard Assessment. Geoscience Australia, Canberra.
Abstract
C-8
Rajabi, M., Tingay, M., 2013. Applications of intelligent systems in petroleum geomechanics - prediction of geomechanical properties in different types of sedimentary rocks, International Workshop on Geomechanics and Energy – The Ground as Energy Source and Storage. EAGE, Lausanne, Switzerland. 5 pages. DOI: 10.3997/2214-4609.20131949
Peer-reviewed (extended abstract)
C-9
Ziegler, M., Heidbach, O., Rajabi, M., Páll Hersir, G., Ágústsson, K., Árnadóttir, S., Zang, A., 2015. The stress pattern of Iceland, in: Manzella, A., Nardini, I. (Eds.), IMAGE (Integrated Methods for Advanced Geothermal Exploration) Mid-Term Conference, Advanced Exploration Concepts for Geothermal Systems CNR, Pisa, Italy.
Abstract
C-10 Ziegler, M., Rajabi, M., Heidbach, O., Hersir, G.P., Ágústsson, K., Árnadóttir, S., Zang, A., 2016. The Stress Pattern of Iceland, European Geosciences Union (EGU) General Assembly 2016. EGU, Vienna, Austria.
Abstract
C-11
Rajabi, M., Tingay, M., Heidbach, O., 2014. The Present-day stress pattern in the Middle East and Northern Africa and their importance: The World Stress Map database contains the lowest wellbore information in these petroliferous areas, International Petroleum Technology Conference. International Petroleum Technology Conference, Doha, Qatar. DOI: http://dx.doi.org/10.2523/IPTC-17663-MS
Peer-reviewed (full paper)
C-12
Heidbach, O., Rajabi, M., Ziegler, M., Reiter, K., WSM-Team, 2015. The World Stress Map Project – an ILP Success Story in: Rudloff, A., Scheck-Wenderoth, M. (Eds.), 35 Years of ILP "Celebrating excellence in solid earth sciences", ILP’s Third Potsdam Conference (Potsdam 2015). GFZ German Research Centre for Geosciences, Potsdam, Germany. DOI: http://doi.org/10.2312/GFZ.ILP.2015
Abstract
Table 2: An overview on the international conference papers presented in this thesis.
5

No. Detail Type
C-13
Heidbach, O., Rajabi, M., Ziegler, M., Reiter, K., Team, t.W., 2016. The World Stress Map Database Release 2016 - Global Crustal Stress Pattern vs. Absolute Plate Motion (EGU2016-4861), European Geosciences Union (EGU) General Assembly 2016. EGU, Vienna, Austria.
Abstract
C-14
Heidbach, O., Custodio, S., Kingdon, A., Mariucci, M.T., Montone, P., Müller, B., Simona, P., Rajabi, M., Reinecker, J., Reiter, K., Tingay, M., Williams, J., Ziegler, M., 2016. New crustal stress map of the Mediterranean and Central Europe (EGU2016-4851), European Geosciences Union (EGU) General Assembly 2016. EGU, Vienna, Austria.
Abstract
C-15
Heidbach, O., Rajabi, M., Ziegler, M., Reiter, K., WSM-Team, 2016. The World Stress Map Database Release 2016 - Global Crustal Stress Pattern vs. Absolute Plate Motion Arthur Holmes Meeting 2016 – The Wilson Cycle: Plate Tectonic and Structural Inheritance During Continental Deformation. Geological Society of London, London, Great Britain, p. Abstract Book Page 129.
Abstract
C-16
Salmachi, A., Wainman, C.C., Rajabi, M., McCabe, P., 2015. Effect of Volcanic Intrusions and Mineral Matters on Desorption Characteristics of Coals (Case Study), SPE Asia Pacific Unconventional Resources Conference and Exhibition. Society of Petroleum Engineers, Brisbane, Australia. DOI: 10.2118/176841-MS
Peer-reviewed (full paper)
C-17
Burgin, H., Amrouch, K., Rajabi, M., 2016. 4D fracture distribution as a signature of structural evolution in the Otway Basin, Australian Earth Science Convention (AESC) - Uncover Earth’s Past to Discover our Future. Geological Society of Australia, Adelaide, South Australia, p. 63.
Abstract
1.2.1. Journal Papers about the Australian Stress Pattern: New Phase of the Australian Stress Map
Project
Papers J-1 and J-2: Stress Pattern of Sedimentary Basins in New South Wales
These two papers demonstrate detailed analysis of crustal stress in New South Wales with 340 stress
data records inferred from seven sedimentary basins, including the Clarence-Moreton, Darling
Gunnedah, Gloucester, Bowen, Surat and Sydney basins. Prior to these studies, there were only 101
data records available in New South Wales, mostly from shallow engineering measurements in the
Sydney Basin. Hence, stress information throughout most New South Wales sedimentary basins was
largely based upon geomechanical-numerical model predictions of the stress pattern, from 20
available publications, rather than being able to use direct observations and measurements. In these
two papers, wellbore image logs in 135 coal seam gas and conventional petroleum wells, with a total
length of 58.6 km, were analysed to interpret the orientation of SHmax. This stress analyses resulted in
the identification of seven new stress provinces that show a variable stress pattern across New South
Wales. The Clarence-Moreton, Gloucester, Gunnedah and Sydney basins are characterised by a NE-
SW SHmax orientation, which rotates to E-W in the Darling Basin. The mean SHmax orientation in the
Table 2: continued…
6

South East Seismogenic Zone is NW-SE, which is in agreement with the regional stress pattern in
southeastern Australia. These two papers clearly demonstrate significant deviation between
observational stress data and the predicted results from previously published geomechanical-
numerical models. Further investigations of high resolution image logs, presented in these papers,
show numerous spectacular small-scale perturbations of wellbore breakouts in the vicinity of
fractures and faults in this region.
These papers have two major outcomes for the Australian stress pattern. Firstly, the published-
geomechanical numerical models for the Australian stress pattern need to be re-evaluated in terms of
their modelling strategy and boundary conditions, as all prior numerical models completely fail to
replicate the complexity of stresses in this region. Secondly, local geological structures have
significant impacts on the SHmax orientation at different scales. This perturbation of stress has
numerous implications in unconventional reservoirs, particularly where hydraulic fracturing is
crucial for the economic development of these reservoirs. This issue is particularly important for
New South Wales, which contains vast amounts of coal seam gas reserves. Hence, the results of
these papers clearly demonstrate that “hydraulic fracture designs based on regional stress
orientations can significantly affect stimulations”, which in turn has significant implications of
fracture containment and potential aquifer contamination. Therefore, it is necessary to carry out
comprehensive analysis of present-day stress, in order to adequately determine the regional and
local-scale stress perturbations, prior to undertaking fracture stimulation.
Paper J-3: State of Stress in the Darling Basin, Central Western New South Wales
This paper examines all components of the stress tensor, including the orientation of SHmax and the
magnitude of vertical (Sv), maximum and minimum horizontal stresses, in the Darling Basin in
central western New South Wales. Recent explorations in the Late Cambrian/Silurian to Early
Carboniferous Darling Basin provide sufficient data to undertake a comprehensive geomechanical
study in this basin. Statistical analysis of stress orientation data, including determining ‘stress
provinces using the Raleigh test’ and interpolation using a ‘search-radii algorithm’, indicates a
prevailing E-W SHmax orientation in the region. This inferred SHmax orientation is consistent with
surface neotectonic thrust faults around the basin. However, there appears to be some inconsistency
between the stress regime inferred from neotectonic structures and that estimated from petroleum
data. The analysis of stress magnitude indicates a transition between thrust and strike-slip stress
regime in the Darling Basin, which is slightly different from geological information that show
predominant pure reverse faulting stress regime. I also compiled three reliable 3D stress data points,
inferred from overcoring measurement in the region, and found that the overcoring data further
supports the interpretation from petroleum data that a present-day strike-slip/thrust stress regime
7

exists. This paper suggests two possible reasons for the inconsistency of stress regime inferred from
geomechanical and young geological features. Firstly, the stress regime in the region changes with
depth from thrust at the surface (indicated by geological data) to strike-slip in deeper part of the
crust (indicated by geomechanical data). Secondly, the neotectonic features likely formed in the
transition between thrust and strike-slip stress regime rather than pure thrust. The last part of this
paper explains the implication of the results for petroleum geomechanics applications, such as
wellbore stability and the risk of fault/fracture reactivation in the Darling Basin.
Paper J-4: Neotectonic Stress Pattern of Mount Lofty and Flinders Ranges – South Australia
This paper examines the first analysis of the SHmax orientation using petroleum technologies in
mineral wells of the Flinders and Mount Lofty ranges, South Australia. This region marks one of
four seismically-active zones of Australia, and is characterised by numerous Neogene-to-Recent
active reverse faults. Prior to this study, most of our information about the stress pattern of this
region was based on young geological structures and five single focal mechanism solutions of
earthquakes, which show variable stress orientations. However, analysis of borehole breakouts and
drilling-induced fractures in 16 wells in this region demonstrate a prevailing E-W SHmax orientation.
In this paper, I also determine the SHmax orientation and stress regime from a temporary seismometer
deployment that further confirms the E-W SHmax orientation from wellbore data. The analysis of
tectonic stress regime in this region indicates a dominant thrust faulting stress regime, which is
consistent with neotectonic features. However, this study also highlights the existence of some
localised zones of strike-slip and normal faulting stress regimes, which has not been suggested
extensively prior to this study.
Paper J-5: The Present-Day Stress Field of Australia
This in-review manuscript is the ‘key paper’ of this thesis in that it forms a comprehensive ‘review
paper’ summarising more than 25 years of research that has been conducted on the Australian stress
field to date and, more importantly, presents the new release of the Australian Stress Map (ASM).
Despite the extensive and widespread stress analysis undertaken in the early phases of the ASM
project (Hillis and Reynolds, 2000, 2003), the stress field for many parts of Australia, and
particularly eastern Australia, remained poorly resolved, with the dataset primarily comprised of
shallow engineering test data and predictions based on numerous geomechanical-numerical models.
The 2016 ASM database has been increased from 549 to 2140 present-day stress data records. This
large expansion of the ASM database has come from extensive analysis in individual basins, such as
8

papers J-1, J-2, J-3 and J-4 (Table 1), as well as additional data analysis throughout other basins and
regions.
The new compilation of the ASM highlights the inability of all prior geomechanical models to
reliably predict the stress pattern in eastern Australia. In this study, the regional stress field in
Australia is described and interpolated using various statistical methods including ‘defining stress
provinces using the Rayleigh test’, ‘stress trajectory’ and ‘search-radii’ methods, These analysis
reveal four major trends for the orientation of SHmax in the Australian continent, including a NE-SW
SHmax orientation in northern, northeastern Australia as well as Bonaparte and Canning basins in
northwestern Australia, E-W SHmax orientation in most part of Western Australia and South
Australia, ENE-WSW SHmax orientation in most parts of eastern Australia that rotates to NW-SE in
southeastern Australia. In addition to this regional variability, high density datasets in sedimentary
basins of eastern Australia revealed substantial stress perturbations at smaller scales due to different
geological features such as basement structures, fractures, faults and lithological contrasts. In
addition to SHmax orientation, the analysis of tectonic stress regimes, based on 211 data records, in
onshore Australia suggests that a thrust faulting stress regime predominately exists in the upper two
km of the Australian continental crust. Furthermore, the compiled database indicates that the stress
regime changes in deeper parts of the crust, where a strike-slip stress regime is prevailing.
Paper J-6: Prediction of the Present-Day Stress Field in the Australian continental Crust
This in-review manuscript presents a 3D geomechanical-numerical model for the Australian
continent that predicts the SHmax orientation and stress regime for whole the continent. In the
published literature there are over 20 papers that aimed to investigate the stress pattern of Australia
using geomechanical-numerical models. However, extensive stress analysis in this thesis revealed
that there are significant differences between the modelling results and the observed stress data in
many provinces and regions. Furthermore, almost all the published models only predicted the SHmax
orientation and did not provide tectonic stress regime information (or produced stress regime
predictions that also fail to match with observations). Hence, I created a physical-based 3D
geomechanical-numerical model to predict the stress state in Australia, particularly in areas where
no stress data is yet available. This model, which contains several inputs, is calibrated against the
Australian stress provinces (presented in paper J-5). The best-fit model in most areas is in good
agreement with the observed regional SHmax orientations and the stress regime. Hence, this model is
suggested as a reference model for Australia, and can be used to provide initial and boundary
conditions for local and reservoir-scale 3D geomechanical models across Australia.
9

1.2.2. Journal papers about the stress pattern in New Zealand
Paper J-7: Stress Map of the Taranaki Basin, New Zealand
This paper examines the first comprehensive analysis of wellbore data for the analysis of the SHmax
orientation in New Zealand. In this study, 129 caliper and image logs in the Taranaki Basin were
analysed in order to determine the regional pattern of in-situ stress across this basin. The Taranaki
Basin marks the western boundary of neotectonic deformation due to the Pacific Plate subduction
beneath the Indo-Australian Plate along the Hikurangi margin. Analysis of wellbore stress data,
along with 47 stress data records inferred from earthquake data, suggest a mean SHmax orientation of
N068°E (±22°) that is consistent with extensive geological data across the basin. In this study, the
SHmax orientation derived from wellbore and earthquake data were compared and revealed that these
two different methods of stress measurements provide similar results in the vicinity of plate
boundaries, which is an issue that had been previously highlighted in World Stress Map data
collection (Heidbach et al., 2010). Furthermore, the ENE-WSW SHmax orientation in the Taranaki
Basin is sub-parallel to the subducted slab and, hence, it is suggested that the subduction process,
and associated forces, control the regional pattern of stress in this region. In addition, two
hypotheses are proposed to try to explain the ~20° deviation between the determined regional SHmax
orientation and the trend of the subducting slab, namely the clockwise rotation of overriding plate
and the gravitational instability due to variable lithospheric thickness in this region.
Paper J-8: Stress Map of New Zealand
The stress analysis in this ‘in preparation’ manuscript resulted in the first comprehensive stress map
of New Zealand, containing 652 data records including 183 wellbore data, 466 earthquake data and
three stress data inferred from geological indicators (increased from only 67 data records in the 2008
release of the WSM project). Nine stress provinces are defined across New Zealand, which highlight
the dominant role of Pacific Plate subduction beneath the Australian Plate, along the Hikurangi
Margin, in the stress pattern of New Zealand’s North Island. The stress pattern in the North Island
shows a margin-normal orientation at the forearc region (~ 40°S), margin-parallel in the central
North Island and ENE-WSW in the Taranaki Basin in the western part. The SHmax orientation in
much of the South Island is WNW-ESE, which is a strikingly high angle between the SHmax
orientation and the trend of major strike-slip Alpine Fault, and suggests this major active tectonic
feature to be a weak fault. Comparisons between the tectonic stress field and active faults of New
Zealand show significant consistencies between normal and thrust faults. However, as outlined
above, the SHmax orientations are almost perpendicular in major strike-slip faults (such as Alpine and
10

Marlborough fault system) and furtherly support that “plate-bounding strike-slip faults are
frictionally weak”.
1.2.3. Journal paper about the stress pattern of Iceland
Paper J-9: Stress Pattern of Iceland
This paper demonstrates the stress pattern of Iceland, which was poorly understood in the 2008
release of the WSM project. Iceland has a unique geological and tectonic setting, as it is located
above a hotspot and on an exposed portion of the Mid-Atlantic Ridge, at the boundary of the North
American and Eurasian plates. There was significant potential to analyse the stress pattern of Iceland
because of its numerous seismic and volcanic activates, as well as a vibrant geothermal industry.
However, there were only 38 SHmax data records for Iceland in the 2008 release of the WSM project,
which is unlikely to properly represent the complex tectonic stress of Iceland. Hence, the Iceland
Stress Map project was initiated in order to investigate the present-day stress pattern using various
datasets. The presented map in this paper comprises 495 data records inferred from geological
information, earthquake focal mechanism solutions and wellbore data. The contribution of the
author in this paper was the analysis of acoustic wellbore image logs in 57 geothermal wells. Note
that normal petroleum image logs cannot be run in hot geothermal Icelandic wells (due to high
temperature conditions) and, hence, this study used a tool that was specially developed by the Island
GeoSurvay to study subsurface geological structures. Analysis of the stress data in Iceland revealed
four regional SHmax orientations across this island. The SHmax is parallel to the rift axes around the
active spreading centres while it is parallel to absolute plate motion in regions that are located far
away from the ridge such as Westfjords. The orientation of SHmax in the northern part is NNW-SSE
that changes to N-S in central part and to NE-SW in the southern Iceland.
1.2.4. Contribution of This Thesis in the New Release of the WSM Project
The World Stress Map is the only public-domain project that has compiled, since 1986, global
information on the crustal stress state. The WSM project has had three phases so far:
• The first phase of the project (1896-1992) with collaboration of more than 30 scientists
across the world that resulted to compilation of ~7700 data records. The key finding of this
phase of the project was that the “forces that drive plate motions provide the first-order
controls on the crustal stress pattern” (Zoback, 1992; Zoback et al., 1989).
• The second phase of the project (1995-2008) with cooperation of dozens of researchers from
across the world resulted in 21750 data records and revealed that “tectonic plate boundary
11

forces are not enough to explain the crustal stress pattern”, and highlighted the potentially
significant role of ‘third-order’ stress patterns in some regions (Heidbach et al., 2007;
Heidbach et al., 2010; Sperner et al., 2003).
• Since 2009, the WSM project has been in its third phase and, during the last seven years, a
large international team has analysed and compiled data, with a particular focus on regions
that previously had sparse or no published stress data.
Significant cooperation of the author in data analysis in Australia, New Zealand, Iceland and Middle
East (Table 2, Paper: C-11) resulted in the co-authorship in this project. This year marks the 30th
anniversary of the WSM project and, hence, the author is actively working with the WSM team to
publish the new WSM project. In this thesis the major results of the 2016 WSM project have already
been presented in three conferences (Table 2, C-12, C-13, C-14 and C13), and is expected to be
published as a journal article in 2017.
1.2.5. Contribution of the Author to Other Publications
Paper J-10: Effect of Magmatic Intrusions on Coalbed Methane Reservoir Characteristics
In the detailed analysis of borehole image logs in the Gunnedah Basin, the author observed that
geological structures, including faults, fracture and magmatic intrusions, strongly perturbed stresses
in the region (Paper J-2). The presence of magmatic rocks in the vicinity of coals, along with the
observed stress perturbations, helped to initiate a separate research project to investigate the effect of
magmatic intrusions in coal seam gas reservoir characteristics in the Gunnedah Basin. This paper
aims to investigate the impact of magmatic intrusions on fluid flow characteristics, gas content and
quality in the Hoskissons coal seam. The contribution of the author in this paper is the interpretation
of borehole image logs for analysis of subsurface fractures. Different sets of wellbore data,
including drill stem tests and borehole image logs, revealed the active role of natural fractures and
cleats in fluid flow of the Hoskissons coal seam. Interestingly, the wells that have variable SHmax
orientation also have the lowest amounts of permeability.
1.3. Stress Map Databases
As outlined above, this thesis provides the stress information in various regions. Hence, these
databases are presented in an attached CD-ROM. as the appendix of this thesis.
12

1.4. Reference:
Bell, J.S., 1996. Petro Geoscience 2. In situ stresses in sedimentary rocks (part 2): applications of stress measurements. Geoscience Canada 23, 135-153.
Cornet, F.H., 2015. Elements of crustal geomechanics. Cambridge University Press. Engelder, T., 1993. Stress regimes in the lithosphere. Princeton University Press, New Jersey. Gaucher, E., Schoenball, M., Heidbach, O., Zang, A., Fokker, P.A., van Wees, J.-D., Kohl, T., 2015.
Induced seismicity in geothermal reservoirs: A review of forecasting approaches. Renewable and Sustainable Energy Reviews 52, 1473-1490.
Heidbach, O., Reinecker, J., Tingay, M., Müller, B., Sperner, B., Fuchs, K., Wenzel, F., 2007. Plate boundary forces are not enough: Second- and third-order stress patterns highlighted in the World Stress Map database. Tectonics 26, TC6014.
Heidbach, O., Tingay, M., Barth, A., Reinecker, J., Kurfeß, D., Müller, B., 2010. Global crustal stress pattern based on the World Stress Map database release 2008. Tectonophysics 482, 3-15.
Hillis, R., Reynolds, S.D., 2000. The Australian Stress Map. Journal of the Geological Society 157, 915-921.
Hillis, R., Reynolds, S.D., 2003. In situ stress field of Australia. Geological Society of America Special Papers 372, 49-58.
Jaeger, J.C., Cook, N.G.W., 1979. Fundamentals of rock mechanics. Chapman and Hall. Sperner, B., Müller, B., Heidbach, O., Delvaux, D., Reinecker, J., Fuchs, K., 2003. Tectonic stress in the
Earth’s crust: advances in the World Stress Map project. Geological Society, London, Special Publications 212, 101-116.
Zang, A., Stephansson, O., 2010. Stress Field of the Earth's Crust. Springer Dordrecht Heidelberg London New York, Springer.
Zoback, M.D., 2010. Reservoir geomechanics. Cambridge University Press, Cambridge. Zoback, M.L., 1992. First- and second-order patterns of stress in the lithosphere: The World Stress Map
Project. Journal of Geophysical Research: Solid Earth 97, 11703-11728. Zoback, M.L., Zoback, M.D., Adams, J., Assumpcao, M., Bell, S., Bergman, E.A., Blumling, P.,
Brereton, N.R., Denham, D., Ding, J., Fuchs, K., Gay, N., Gregersen, S., Gupta, H.K., Gvishiani, A., Jacob, K., Klein, R., Knoll, P., Magee, M., Mercier, J.L., Muller, B.C., Paquin, C., Rajendran, K., Stephansson, O., Suarez, G., Suter, M., Udias, A., Xu, Z.H., Zhizhin, M., 1989. Global patterns of tectonic stress. Nature 341, 291-298.
13

2. Literature Review: the Concept of Stress Tensor, Methodology and
Sources of the Contemporary Stress Field
2.1. Introduction
Analysis of present-day stresses has been undertaken extensively over the past 50 years in order to
better understand the concept of plate tectonics (Hast, 1969; Heidbach et al., 2007; Heidbach et al.,
2010; Müller et al., 1992; Richardson, 1978; Richardson et al., 1976, 1979; Sbar and Sykes, 1973;
Sperner et al., 2003; Zoback and Zoback, 1980a; Zoback et al., 1989). In particular, numerous studies
on the pattern of crustal stress have conclusively demonstrated that the forces driving plate motions
also control the contemporary tectonic stress pattern in intraplate regions (Coblentz et al., 1998;
Heidbach et al., 2010; Reynolds et al., 2002; Richardson, 1992; Zoback, 1992). In addition to
understanding tectonics, the contemporary stress in the lithosphere has also been shown to have
important implications in economical, scientific and societal aspects of human’s life (Bell, 1996b;
Zoback, 2010). For example, knowledge of the present-day stress provides significant information on
the neotectonic deformation and earthquake hazard (Clark et al., 2012; Hillis et al., 2008; Müller et
al., 2006; Sandiford et al., 2004), induced seismicity (Grünthal, 2014; Hillis, 2001; Kraft and
Deichmann, 2014; Segall, 1989; Zang et al., 2014), stability of underground opening (tunnels, mines
and boreholes), subsurface fluid extraction (petroleum and geothermal) and injection (CO2
sequestration, nuclear waste disposal and enhanced oil recovery), (Reinecker et al., 2006; Tingay et
al., 2005b; Zang and Stephansson, 2010; Zoback, 2010).
Along with improvements in understanding causes and consequences of stress in the earth’s crust, the
measurement and estimation of stress has also received significant attention in the past 30 years
(Amadei and Stephansson, 1997; Bell, 1996a; Cornet, 2015; Engelder, 1993; Zang and Stephansson,
2010; Zoback, 2010). There are numerous methods to investigate the stress state at different depth
ranges (Amadei and Stephansson, 1997). Mining industry and groundwater investigations generally
require the stress state at quite shallower depths (typically <1 km depth), while petroleum and
geothermal activities involve understanding the stress state and intermediate depths (typically 1-5 km
depth) and seismological analysis generally focusses on deeper stresses (typically 5-40 km depth)
(Amadei and Stephansson, 1997). This wide range of applications has resulted in variable stress and
geomechanics terminology in the published literature, which I have summarised them in Table 1.
The primary aim of this literature review chapter is to explain the concept of the crustal stress tensor.
Herein, I first review different methods for estimation of the present-day stress orientation and
magnitude at different depth intervals, which are all used to map out the stress in this thesis. I then
briefly explain the concept of geomechanical-numerical modelling as an alternative method for
14

prediction of the crustal stress before, finally, reviewing our current knowledge of the crustal stress
sources that has resulted from 30 years of studies compiled by a wide range of authors and as part of
the World Stress Map (WSM) Project.
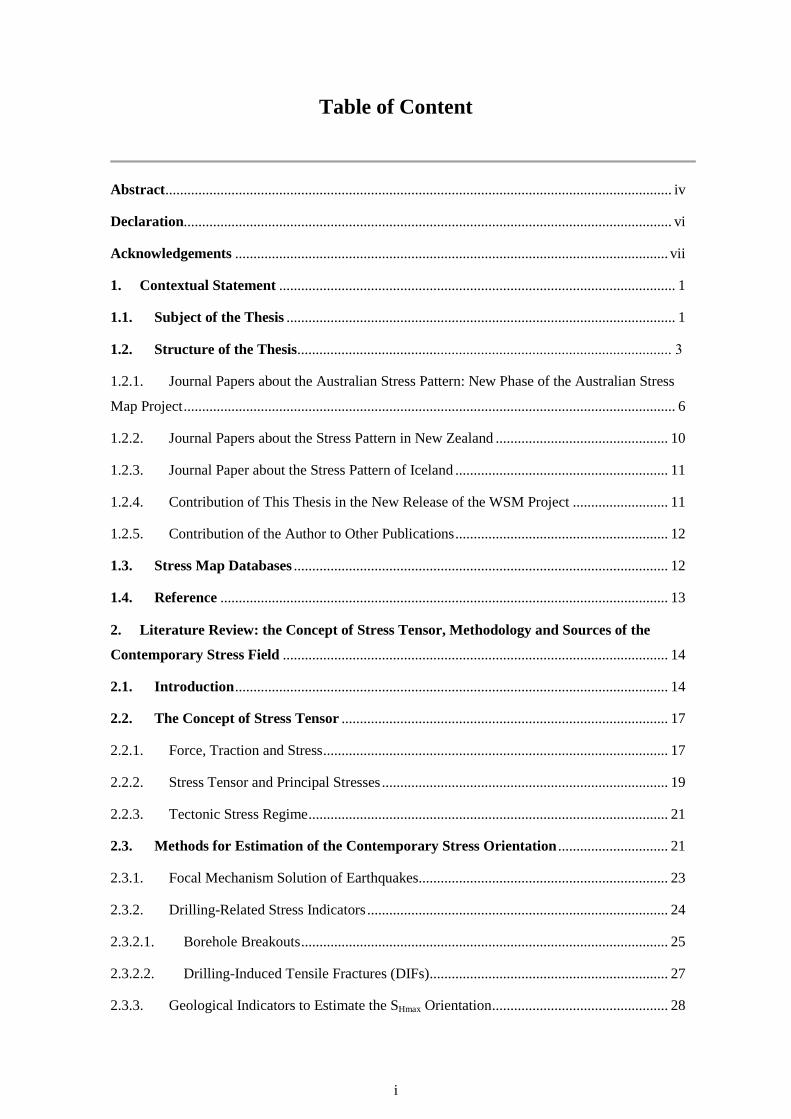
Table 1: A brief overview on the stress terminology in the field of geomechanics and structural geology (Amadei and Stephansson, 1997; Heidbach and Reinecker, 2013; Jaeger et al., 2007; Zang and Stephansson, 2010; Zoback, 2010).
Term Synonyms Definition/Comment
In-situ Stress Field
Present-Day Stress Contemporary Stress Neotectonic Stress Current-Day Stress Modern-Day Stress Virgin Stress
The state of natural stress at the present-day within the subsurface. This is commonly simplified (by assuming the overburden stress to be a principal stress) as consisting of four components, namely the direction of maximum horizontal stress and the magnitude of the vertical, minimum and maximum horizontal stresses.
Induced Stress
Disturbed In-situ Stresses Anthropogenically-Altered Stress
According to Amadei and Stephansson (1997): “man-made stress due to addition or removal of material”. Hence, any alteration in the natural state of stress due to human’s activity such as drilling, mining, impoundment, fluid injection and withdrawal can be considered as induced stress.
Tectonic Stress
Far-Field Stress Primary Stress
The stresses that are generated by large plate tectonic forces. The term ‘far-field stress’ is also often used to describe the in-situ, or unaltered stress state.
Non-tectonic Stress
Local Stress Third-Order Stress
Stresses that do not have tectonic origin, such as pressure solution (Cornet and Magnenet, 2016) or any local sources of stress such as local geological structures that deviate the regional stress pattern. See Residual stresses for more detail.
Gravitational Stress
Gravitational Potential Energy
The self-gravity of the earth that is equal to the overburden weight (Zang and Stephansson, 2010). In this respect the gravitational stress is similar to vertical stress. The gravitational stress considers the effect of topography on the lithospheric stresses (Amadei and Stephansson, 1997). Gravitational Potential Energy: is a general term to describe the stresses due to mountain belts.
Residual Stress
Remnant Stress
According to Ameen (2003): “the locked stresses in the rock during the past episodes of tectonic and gravitational forces” Amadei and Stephansson (1997) have used term ‘residual’ for our non-tectonic stresses. In addition, Amadei and Stephansson (1997) separated the residual and remnant stresses in which the remnant stress is involved with tectonic stress such as faulting, fracturing and boudinage. In this thesis, I consider the residual stress as the later of these two.
Terrestrial Stress
Stresses due to “seasonal and diurnal temperature variations, Coriolis force, Moon pull” (Amadei and Stephansson, 1997).
Transient Stress
In contrast to far-field stresses, which are consistent over large areas (>1000 km) and long time periods (> 100 ka), transient stresses are defined as perturbed stress that is more localised and changes through the time. For example, Gaucher et al. (2015) mentioned that that sedimentation, erosion, aseismic creep and
15
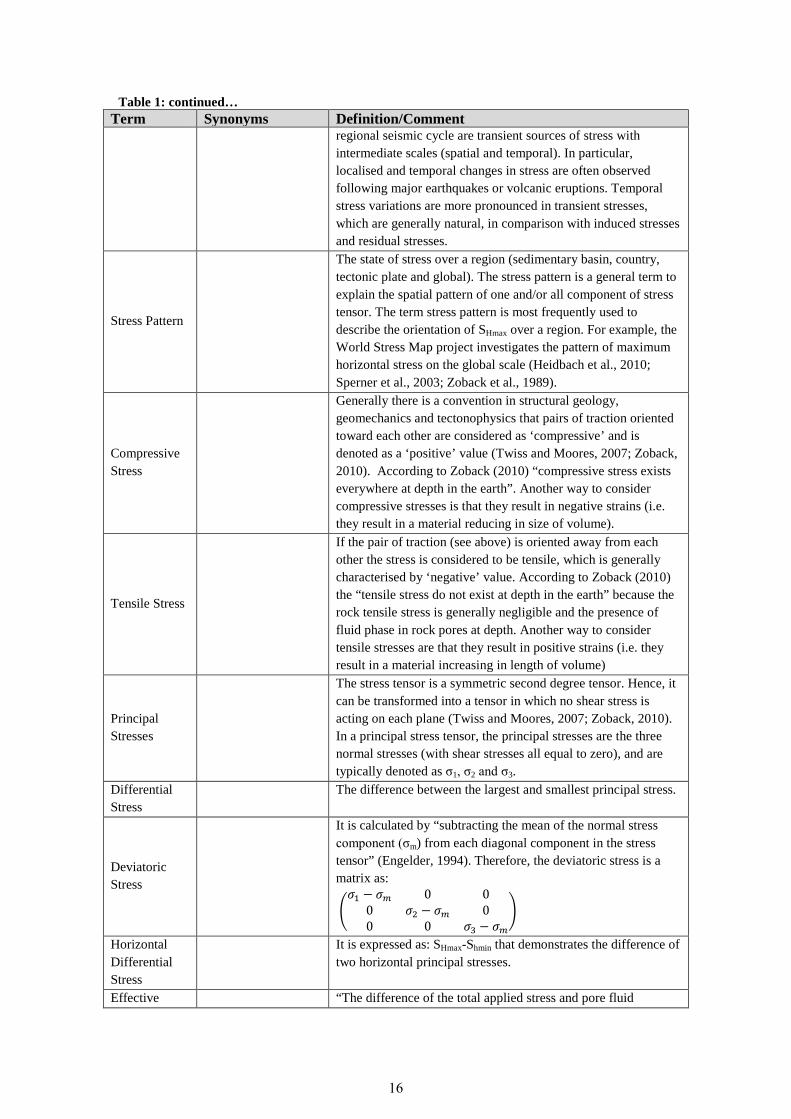
Table 1: continued… Term Synonyms Definition/Comment
regional seismic cycle are transient sources of stress with intermediate scales (spatial and temporal). In particular, localised and temporal changes in stress are often observed following major earthquakes or volcanic eruptions. Temporal stress variations are more pronounced in transient stresses, which are generally natural, in comparison with induced stresses and residual stresses.
Stress Pattern
The state of stress over a region (sedimentary basin, country, tectonic plate and global). The stress pattern is a general term to explain the spatial pattern of one and/or all component of stress tensor. The term stress pattern is most frequently used to describe the orientation of SHmax over a region. For example, the World Stress Map project investigates the pattern of maximum horizontal stress on the global scale (Heidbach et al., 2010; Sperner et al., 2003; Zoback et al., 1989).
Compressive Stress
Generally there is a convention in structural geology, geomechanics and tectonophysics that pairs of traction oriented toward each other are considered as ‘compressive’ and is denoted as a ‘positive’ value (Twiss and Moores, 2007; Zoback, 2010). According to Zoback (2010) “compressive stress exists everywhere at depth in the earth”. Another way to consider compressive stresses is that they result in negative strains (i.e. they result in a material reducing in size of volume).
Tensile Stress
If the pair of traction (see above) is oriented away from each other the stress is considered to be tensile, which is generally characterised by ‘negative’ value. According to Zoback (2010) the “tensile stress do not exist at depth in the earth” because the rock tensile stress is generally negligible and the presence of fluid phase in rock pores at depth. Another way to consider tensile stresses are that they result in positive strains (i.e. they result in a material increasing in length of volume)
Principal Stresses
The stress tensor is a symmetric second degree tensor. Hence, it can be transformed into a tensor in which no shear stress is acting on each plane (Twiss and Moores, 2007; Zoback, 2010). In a principal stress tensor, the principal stresses are the three normal stresses (with shear stresses all equal to zero), and are typically denoted as σ1, σ2 and σ3.
Differential Stress
The difference between the largest and smallest principal stress.
Deviatoric Stress
It is calculated by “subtracting the mean of the normal stress component (σm) from each diagonal component in the stress tensor” (Engelder, 1994). Therefore, the deviatoric stress is a matrix as:
�𝜎𝜎1 − 𝜎𝜎𝑚𝑚 0 0
0 𝜎𝜎2 − 𝜎𝜎𝑚𝑚 00 0 𝜎𝜎3 − 𝜎𝜎𝑚𝑚
�
Horizontal Differential Stress
It is expressed as: SHmax-Shmin that demonstrates the difference of two horizontal principal stresses.
Effective “The difference of the total applied stress and pore fluid
16

Table 1: continued… Term Synonyms Definition/Comment Stress pressure” (Terzaghi, 1943). It is an important because the
effective stress controls the rock deformation.
Vertical Stress Overburden Stress Lithostatic Stress
The vertical stress is generally considered as the weight of overburden. In petroleum geomechanics, it is calculated based on the integration of density log data (Tingay et al., 2003).
Orientation of Horizontal Stresses
If we assume that the overburden stress is one of the principal stresses at the subsurface, we then have two horizontal principal stresses, with the larger one being the maximum horizontal stress and the smaller one called the minimum horizontal stresses. These two horizontal stresses are perpendicular to each other. Note that the SHmax is the orientation of maximum horizontal principal stress in horizontal plane and generally is given in terms of degrees from north.
Tectonic Stress Regime
A term to describe the relative magnitude of the principal stresses. According to Anderson (1905) there are there types of stress regime in the earth’s crust that control the relative motion of along fault planes. The tectonic stress regime is classified to strike-slip, normal and thrust faulting.
Regime Stress Ratio (RSR)
A continuous scale for expression of stress regime that developed by Simpson (1997) based on combination of the tectonic stress regime and ratio. The RSR varies from ‘zero’ to ‘three’ in which ‘0.5’ shows the normal, ‘1.5’ denotes the strike-slip and ‘2.5’ demonstrates thrust faulting stress regime.
Orders of Stress Pattern
According to the World Stress Map project, sources of stress can be classified into three orders including the first-order that control the stress pattern a large scales (> 500 km), the second-order that control the stress pattern between 100 and 500 km) and third-order which control the state of stress at small–scales (< 100 km) such as sedimentary basins (Heidbach et al., 2007; Heidbach et al., 2010; Zoback, 1992).
Stress Gradient
The average gradient given by the magnitude at a depth divided by that depth (and it is not a first derivative or instantaneous gradient).
2.2. The Concept of Stress Tensor
2.2.1. Force, Traction and Stress
Force, as a vector quantity, is the fundamental concept of mechanics. In Newtonian or classical
mechanics a force (�⃗�𝐹) is defined as the interaction of the mass (m) and acceleration (�⃗�𝑎), which has
both magnitude and direction.
F�⃗ = m. a�⃗ (1)
Generally, forces are classified as two types, namely internal and external forces (Twiss and Moores,
2007). The internal forces are internally balanced and do not produce any deformation or motion.
17

These forces include mechanical properties such as stiffness, hardness and strength and, in the
geoscience community, these forces are described by rock attributes such as Poisson’s ratio, friction
coefficient, cohesion and Young’s modulus (Twiss and Moores, 2007).
The external forces, which cause failure and motion, are classified into surface and body forces
(Twiss and Moores, 2007). Body forces act on all elements of a volume. The most notable example of
a body force, particularly in structural geology and geomechanics, is gravity that affects every particle
within rocks. Surface forces are related to the interaction of two parts (or two bodies) along a shared
surface. For example, by pushing a rock block, we produce a surface force on the contact area of the
block (Twiss and Moores, 2007).
The force intensity, so called traction (∑), is then defined as “force per unit area on a surface of a
specific orientation” (Equation 2). Traction and pressure have similar unit, however traction is
represented by an orientation (Twiss and Moores, 2007).
∑ = F→
A(2)
Stress (σ), in geomechanics and structural geology, usually describes the traction when its orientation
and magnitude varies on a surface or within a three dimensional cube (Twiss and Moores, 2007). The
stress is always demonstrated as two perpendicular and independent components, including shear
stress (σs) that is parallel to the surface and normal stress (σn) that acts perpendicular to the surface,
(Engelder, 1993; Twiss and Moores, 2007) as following:
σn = F��⃗ nA
(3)
σs = τ = F��⃗ sA
(4)
To have an equilibrium condition, a pair of opposite and equal forces (or traction) are required to act
on the opposite side of any surface. The surface stress is then explained as the equal and opposite pair
of tractions on any oriented surfaces (Twiss and Moores, 2007). Consequently, there are a pair of
normal and shear component of the surface stress that are always opposite and equal to each other. In
order to characterise the nature of these opposite pair of components, standard sign convention are
used to describe them (Twiss and Moores, 2007; Zoback, 2010).
In tectonophysics, structural geology, rock mechanics and geomechanics, compressive stress is
considered as positive, which means a pair of normal tractions are toward each other, while tensile
stress is considered as negative, meaning that the pair of normal tractions are oriented away from each
other (Twiss and Moores, 2007; Zoback, 2010). The component of shear stress is also characterised
by their sense of motions in which they are ‘positive’ if they are contraclockwise (sinistral) and are
18

‘negative’ if they are clockwise (dextral) (Twiss and Moores, 2007). This sign convention is
implemented in the Mohr Circle, which is a graphical representative of stress in geoscience (Engelder,
1993; Twiss and Moores, 2007; Zoback, 2010).
2.2.2. Stress Tensor and Principal Stresses
As outline in the previous section, stress is often resolved into two components, the normal (σn) and
shear (σs) stresses. Hence, the stress on any plane can be defined by normal stress (σn) and a pair of
shear stress acting on the plane (τx and τy in Figure 1a) (Meyer, 2002). Therefore, the stress tensor in
two dimensions is expressed as the following tensor (Figure 1b):
σ = �σxx σxyσyx σyy� (5)
When considered in three dimensions (Figure 1c), the stress tensor can be defined by nine
components, including a normal stress and a pair of shear stress for each of the three orthogonal
planes as in the following tensor (Engelder, 1993; Twiss and Moores, 2007; Zoback, 2010):
σ = �σxx σxy σxzσyx σyy σyzσzx σzy σzz
� = �σxx σxy σxzσxy σyy σyzσxz σyz σzz
� (6)
As the 3D stress tensor is a ‘symmetric second order tensor’, the full stress tensor can be simplified to
six independent components (σij = σji). Note that σii represent the normal stress in the i direction, while
σij show the shear stress that acting on the plane perpendicular to the i direction (Engelder, 1993;
Twiss and Moores, 2007; Zoback, 2010).
Figure 1: (a) The stress components on a plane including normal stress (after Meyer, 2002) (σn), shear stress in x- and y- directions (τx and τy). (b) Shows the 2D stress components acting on a square and (c) shows three-dimensional stress components acting on a cube (Twiss and Moores, 2007).
19

Furthermore, each stress tensor can be transformed into a principal stress tensor, by a rotation matrix,
such that no shear stress is acting on each orthogonal plane. Consequently, principal stresses
directions are the normals to these planes. Hence, the full stress tensor can be constrained by the
directions of two principal stresses and three principal stress magnitudes as following:
σ = �σxx 0 00 σyy 00 0 σzz
� = �σ1 0 00 σ2 00 0 σ3
� (7)
where σ1, σ2 and σ3 respectively represent the largest, intermediate and smallest principal stress.
There is no shear stress on the earth’s surface and gravity is generally considered to be major force
acting on all parts of the earth, hence, generally the vertical stress is considered as one of the principal
stresses. Consequently, the two other principal stresses, which must be perpendicular to the vertical
stress, are commonly assumed to be approximately horizontal (Engelder, 1993; Twiss and Moores,
2007; Zoback, 2010). This assumption leads us to typically define the crustal stress tensor (Figure 2),
used in this thesis, as being comprised of the maximum horizontal stress (σHmax or SHmax), minimum
horizontal stress (σhmin or Shmin) and vertical stress (σv or Sv).
Figure 2: Schematic diagram to show the component of reduced stress tensor in sedimentary basins. In this example the vertical stress (Sv) is parallel to well axis, in vertical well, and orthogonal to the orientation of horizontal stresses (minimum: Shmin and maximum: SHmax). Drilling-induced fractures (DIF) and Breakouts (BO) are drilling-related stress indicators that are used to estimate the horizontal stress directions in the wellbore geomechanics (see section 2.3.2 for more detail).
20

2.2.3. Tectonic Stress Regime
The magnitudes of three principal stress orientations control the relative motion along fault planes in
the earth’s crust (Anderson, 1905; Anderson, 1951; Kanamori and Brodsky, 2004). In this thesis I use
the standard Andersonian classification (Anderson, 1905) that classifies the tectonic stress regime as
follows:
Normal faulting stress regime: Sv > SHmax > Shmin
Strike-slip faulting stress regime: SHmax > Sv > Shmin
Reverse or Thrust faulting stress regime: SHmax > Shmin > Sv
The stress regime is also expressed by “Regime Stress Ratio” (RSR) (Simpson, 1997) which is a
combination of tectonic stress regime and ratio. In this method, the stress regime is represented by
index n inferred from standard classification of Anderson (1905) (n=0 for normal, n=1 for strike-slip
and n=2 for the thrust stress regime). The stress ratio (Bott, 1959) in RSR method is defined by ratio
of stress magnitude as:
R = �S2 − S3S1 − S3� � (8)
Where S1, S2 and S3 denote the magnitude of principal stresses.
The RSR is then summarised as (Simpson, 1997):
RSR = (n + 0.5) + (−1)n(R− 0.5) (9)
The RSR provide a continuous scale for three faulting stress regime including RSR=0.5 (normal stress
regime), RSR=1.5 (strike-slip stress regime) and RSR=2.5 (reverse stress regime).
2.3. Methods for Estimation of the Contemporary Stress Orientation
During the past three decades, several methods have been developed for the determination of the
SHmax orientation at different depth intervals (Amadei and Stephansson, 1997; Bell, 1996a; Cornet,
2015; Engelder, 1993; Zang and Stephansson, 2010; Zoback, 2010). In this thesis, I compiled stress
data from near surface of the earth’s crust down to 40 km using methods suggested by the WSM
project to investigate the crustal stress (Heidbach et al., 2010; Sperner et al., 2003; Zoback, 1992).
The state of crustal stress in the deeper intervals (5 to 40 km) is estimated from the earthquake focal
mechanism solutions (Heidbach et al., 2010; Lund and Townend, 2007; McKenzie, 1969; Zoback,
1992). Wellbore derived stress indicators, including drilling-induced fractures and wellbore breakouts,
21

generally provide stress information on the upper five kilometres of the earth crust (Bell, 1996a;
Schmitt et al., 2012; Zoback, 2010). The state of crustal stress at shallow depths (typically < 1km) can
be determined from engineering methods such as overcoring and hydraulic fracture measurement
(Amadei and Stephansson, 1997; Bell, 1996a; Zang and Stephansson, 2010). Finally, geological
indicators, such as volcanic vent alignments and fault slip of younger than Quaternary age are used to
estimate the present-day stress at near surface (Sperner et al., 2003; Sperner and Zweigel, 2010).
Table 2 summarises the common methods for stress measurement. Herein I briefly explain the
methods that are used in this thesis.
Table 2: Common methods for measurement and estimation of in-situ rock stress (Amadei and Stephansson, 1997; Engelder, 1993; Heidbach et al., 2010; Schmitt et al., 2012; Sperner et al., 2003; Zang and Stephansson, 2010; Zoback, 1992). Highlighted rows show those methods that the World Stress Map project uses for stress data compilation.
Method Examples
Geological
Volcanic Vent Alignment
Fault Slip
H-Stylolites
Calcite Twins
Relief
Surface Relief Methods
Undercoring
Borehole Relief Methods (Overcoring, Slotter, etc.)
Large Rock Volume Relief (Bored Raise, Under-Excavation Technique, etc.)
Jacking Flat Jack
Curved Jack
Strain Recovery Differential Strain Curve Analysis
Anelastic Strain Recovery
Hydraulic
Hydraulic Fracturing
Sleeve Fracturing
Hydraulic Tests on Pre-Existing Fractures
Wellbore
Wellbore Breakouts
Drilling-Induced Tensile Fractures
Shear Sonic Anisotropy
Poroelastic (Strain-Based) Method
Seismological
Formal Inversion of Focal Mechanism Solutions (FMF)
Single Focal Mechanism Solutions (FMS)
Average and Composite Focal Mechanism Solutions (FMA)
Other
Petal Centreline Fractures
Drilling-Induced Core Fractures
Core Disking
22

2.3.1. Focal Mechanism Solution of Earthquakes
The most common source of information for the lithospheric stress state is inferred from earthquakes
(Heidbach et al., 2010; McKenzie, 1969; Raleigh et al., 1972; Zoback, 1992). Indeed, earthquakes
provide stress information, in deeper intervals (>5 km) that are usually inaccessible by other methods
(Table 2) (Heidbach et al., 2010; Tingay et al., 2010a). In the WSM database, three types of focal
mechanism solutions are usually employed to determine the state of stress, namely, individual
solution of focal mechanisms (FMS), composite or average focal mechanism solutions (FMA) and
formal inversion o stress from several focal mechanism solutions (FMF).
The FMS method uses the orientations of the P-, B-, and T- axes of a single-event focal mechanism
solution as a proxy to determine the orientation of stress field (McKenzie, 1969). However, these axes
are not usually equal to the orientation of principal stresses (Célérier, 2010; Heidbach et al., 2010;
McKenzie, 1969). A limiting factor for the derivation of the principal stress axes is that the maximum
principal stress is, strictly speaking, only constrained to be within the same (dilatational) quadrant of
the focal mechanism as the P-axis, which allows for potentially large uncertainties (Arnold and
Townend, 2007; McKenzie, 1969). Hence, the orientation of SHmax inferred from FMS always has, at
best, a ±25° standard deviation based on to the WSM ranking scheme (Table 3), (Heidbach et al.,
2010; Zoback, 1992).
The FMF, which uses stress inverted from several seismic events in spatial proximity, provides more
accurate stress information in comparison to other seismological methods (Heidbach et al., 2010;
Zoback, 1992). In contrast to FMS, the application of an inversion allows to significantly reduce the
uncertainties of the stress orientations as it minimises the difference between the direction of slip and
maximum shear stress of earthquakes (Angelier, 1984; Bott, 1959; Gephart and Forsyth, 1984;
Michael, 1984). The WSM quality ranking criteria uses this misfit angle to assign the data record
quality (Table 3) (Heidbach et al., 2010; Zoback, 1992). More recently, a probabilistic approach is
suggested by Arnold and Townend (2007) to identify the orientation of principal stress axes. Hence,
the FMF method can provide more significant and better quality estimates of the stress state (A and B
quality based on to the WSM ranking criteria) compared to FMSs (Heidbach et al., 2010; Zoback,
1992).
The FMA method aims to determine the stress state using the average (Leitner et al., 2001; Webb et
al., 1986; Zoback and Zoback, 1980b) or composite (Sbar et al., 1972) of P-, B-, and T- axes of
several focal mechanism solutions. This method is less reliable, in comparison to FMF and FMS
methods (Heidbach et al., 2010; Lund and Townend, 2007), and has a standard deviation of ±25° to
±40°, and thus receives a D-quality in the WSM ranking criteria (Heidbach et al., 2010).
23

2.3.2. Drilling-Related Stress Indicators
Drilling a well in pre-stressed rock essentially provides a ‘stress free surface’ where there is no shear
stress on the borehole wall (Meyer, 2002; Reynolds, 2001). This can lead to the alteration of far-field
stress and formation of drilling-induced fractures and wellbore breakouts that are used to determine
the direction of horizontal stresses (Bell and Gough, 1979; Kirsch, 1898). Kirsch (1898) derived, by
analytical solutions, the stress distribution due to effective minimum and maximum principal stresses
in an isotropic, elastic and homogeneous plate with a circular hole. In a vertical well, three principal
stresses can be assumed, including effective axial stress (σzz), effective radial stress (σrr) and effective
hoop or circumferential stress (σθθ) (Kirsch, 1898). Note that the hoop stress acts perpendicular to
axial and radial stresses in horizontal orientation and is tangential to the borehole wall (Meyer, 2002).
Hence, the Kirsch (1898) equations can be expressed as:
σθθ = 12
(SHmax′ + Shmin′ ) �1 + R2
r2� − 1
2(SHmax′ − Shmin′ ) �1 + 3 R4
r4� cos2θ − ∆PR
2
R2 (10)
σrr = 12
(SHmax′ + Shmin′ ) �1 + R2
r2� − 1
2(SHmax′ − Shmin′ ) �1 − 4 R2
r2+ 3 R4
r4� cos2θ − ∆PR
2
r2 (11)
τrθ = 12
(SHmax′ + Shmin′ ) �1 + 2 R2
r2− 3 R4
r4� sin2θ (12)
where r is distance from the hole centre, θ is the angle for the SHmax orientation, R is the hole radius,
SHmax′ and Shmin′ are effective maximum and minimum horizontal stresses, ΔP is the difference of
formation pore pressure (Pp) and wellbore pressure (Pw).
At the borehole wall (R=r) the equations can be rewritten:
σθθ = SHmax′ + Shmin′ − 2 (SHmax′ − Shmin′ ) cos2θ − ∆P (13)
σrr = ∆P (14)
τrθ = 0 (15)
The axial stress at the borehole wall can be presented as (Fairhurst, 1968):
σzz = Sv′ − 2ʋ(SHmax′ − Shmin′ ) cos2θ (16)
in this equation the ʋ denotes the Poisson’s ratio and 𝑆𝑆𝑣𝑣′ shows the effective vertical stress.
24

All the equations in this section are based on effective stresses and hence can be rewritten:
σθθ = SHmax + Shmin − 2 (SHmax − Shmin) cos2θ − Pw − Pp (17)
σrr = ∆P (18)
σzz = Sv − 2ʋ (SHmax − Shmin) cos2θ − pp (19)
Figure 3: Left ) Circumferential or hoop stress around the borehole and its relation to the formation of the wellbore breakout and drilling induced fractures (after Hillis et al., 1998). Right) A typical example of breakouts (outlined in blue) and drilling-induced fractures (outlined in green) in Formation MicroImager Log. Breakouts initiate where the tangential stress is more than the compressive strength of rock and show the orientation of minimum horizontal stress. In electrical wellbore image logs, the breakouts are characterised as a pair of conductive zone which is separated from each other by 180°. Tensile fractures that are oriented in the maximum horizontal stress form when the hoop stress is less that tensile strength of the rock. In electrical borehole image logs, the DIFs are interpreted as a subset of conductive vertical fractures on the opposite side of the well.
2.3.2.1. Borehole Breakouts
Analysis of wellbore breakouts is a well-established method to determine the SHmax orientation, in the
upper five km of the earth’s lithosphere (Amadei and Stephansson, 1997; Bell, 1996a; Zoback, 2010).
The use of borehole breakouts for stress analysis in wellbores has a long history and dates back to the
25

invention of the oriented caliper logs in petroleum industry. Cox (1970) and Cox (1972) by
interpretation of High-Resolution Dipmeter Tool, observed the preferential “ovalisation” of several
boreholes in the Alberta Basin. Babcock (1978) used the term “breakout” for these oriented
elongation of the wellbore wall. Bell and Gough (1979) proposed that borehole breakouts form
parallel to the Shmin, where the concentrated stress on the wellbore wall exceeds compressive rock
strength, and thus that breakouts could be used to determine stress orientation (Figure 3 and 4) (Bell,
1996a; Bell and Gough, 1979). Since then, the systematic interpretation of breakouts in oriented
caliper logs has provided significant in-situ stress information from various sedimentary basins
around the world (Bell, 1996a; Heidbach et al., 2010; Hillis and Reynolds, 2000; Tingay et al., 2010a;
Tingay et al., 2005b; Zoback, 2010; Zoback et al., 1989). Interpretation of breakouts from four-arm
caliper logs requires particular attentions because there are various types of borehole enlargements
that can be misinterpreted as breakout (Figure 5) (Bell, 1990; Plumb and Hickman, 1985; Reinecker et
al., 2003). Hence, the WSM project suggested a criteria based on Plumb and Hickman (1985) and Bell
(1990) to identify and interpret breakouts from oriented caliper logs (Reinecker et al., 2003).
More recently, wellbore image logs, which produce a picture of the wellbore wall, are also used to
provide a more reliable interpretation of breakouts and analyses of crustal in-situ stress (Barton et al.,
2009; Bell, 1996a; Schmitt et al., 2012; Zoback, 2010). Figure 3 and 5 demonstrate the interpretation
of breakouts in borehole image and caliper logs.
Figure 4: Wellbore breakouts in cross section based on CSIRO (Division of Geomechanics) lab test. The ellipsoid shape of the borehole is due to distribution of conjugate fractures (modified from Reinecker et al., 2003).
26

2.3.2.2. Drilling-Induced Tensile Fractures (DIFs)
DIFs are another well-established method for the determination of the SHmax orientation in boreholes
(Aadnoy, 1990a, b; Bell, 1996a). The initiation of DIFs is similar to the formation of induced
hydraulic fracture tests (Bell, 1996a; Bell and Babcock, 1986; Hubbert and Willis, 1957), in which
fracture initiation results from the perturbation of far-field stress due to drilling operations. DIFs form
parallel to the SHmax orientation when hoop stress is less than tensile rock strength (Figures 2 and 3)
(Kirsch, 1898; Scheidegger, 1962) and can only be observed via borehole image logs.
The first usage of DIFs as a method for wellbore stress determination in petroleum wells is not clear.
The “borehole televiewer” was introduced by Zemanek et al. (1969) as the early generation of image
logs to produce a pseudo-picture of the borehole wall. Although Zemanek et al. (1969) showed clear
examples of induced-fractures in image logs, the first use of image logs for interpretation of induced
fractures, as a method for stress determination, are those studies that run image logs after hydraulic
fracturing operation in boreholes to observe induced-hydraulic fractures (Bell, 1996a; Bell and
Babcock, 1986; Blomberg, 1971; Keys, 1980; Paillet, 1983; Paillet, 1985; Stock and Healy, 1988).
McCallum and Bell (1994a, 1994b, 1994c, 1995) and Bell (1996a) used borehole image logs for
interpretation of DIFs in determination of SHmax orientation in Western Canadian wells. The DIFs in
borehole image logs of vertical wells are characterised as a pair of conductive vertical fracture on
opposite side of the wellbore wall (Figure 3).
Figure 5: Different types of borehole elongation and interpretation of them using four-arm calipers (Plumb and Hickman, 1985; Reinecker et al., 2003). Note that only breakout provides information of the horizontal stress and particular care need to distinguish them from other types of enlargements.
27

2.3.3. Geological Indicators to Estimate the SHmax Orientation
Young geological features, so called neotectonic structures that are formed in the contemporary stress
state, can be used as an indicator of the contemporary tectonic stress state (Heidbach et al., 2010;
Sperner et al., 2003; Sperner and Zweigel, 2010; Zoback, 1992). Variations in the lower time-limit for
neotectonic features have resulted in various definitions for the term of ‘neotectonics’ (Table 3).
According to the published literature, there is not a clear-cut boundary between paleo-stress and
present-day stress (Hancock and Williams, 1986; Slemmons, 1991; Steward and Hancock, 1994). In
this respect, the WSM project includes geological structures such as fault slip data and volcanic vent
alignments as indicators of present-day stress if they are not older than Quaternary (i.e. 2.85 Ma)
(Sperner et al., 2003; Zoback, 1992).
Table 3: Different definitions of Neotectonics based on the literature.
Definition References “The study of the recent movements only taking place at the end of the Tertiary and the first half of the Quaternary”.
Gerbova and Tikhomirov (1982)
Any history of geology since Neogene. Murawski (1972) The study of post-Miocene history. Bates and Jackson (1980);
Gary et al. (1972) The time after the last major tectonic events. Şengör et al. (2004) The neotectonic phase of a particular region can be considered as the establishment of the present-day configuration of the plate boundaries in that region.
Hancock and Williams (1986)
Post-Pleistocene isotactic evidences. Doornkamp (1986) ‘The study of late Cainozoic deformation’. Vita-Finzi (1986) Neotectonic needs to be defined based on the modern-day stress of a region . Slemmons (1991); Steward
and Hancock (1994) The neotectonic is defined as the “youngest period of tectonic activity and up to the present”. The ‘transitional time interval’ can be considered as when the evidences of both neotectonic and paleo-tectonic are present and its length depends on the geology of the region. If there is a long transitional interval, the neotectonic time is the earliest time when the majority of the tectonic activity had occurred.
Becker (1993)
Different intervals for the begging of neotectonic stage were defined based on its case studies. For example Miocene for the Carpathian system in Czechoslovakia and Oligocene for the Bohemian Massif.
Radan (1992); Kopecky (1972)
The neotectonic stage commenced during Oligocene. Leonov (1972); Sitdikov (1979); Radan (1992)
Neotectonics “means new, living, recent or active tectonics and involves Neogene to Recent deformation”.
Bloom (1978)
All aspects of geoscience need to be taken to account for definition of neotectonic. It is time interval from Badenian (middle Miocene) to the recent.
Radan (1992)
28

2.3.4. Other Methods for Estimation of the SHmax Orientation
As demonstrated in Table 2, there are some other methods such as overcoring and hydraulic fracturing
tests for the determination of the SHmax orientation. Since, these methods also provide stress
magnitude; I explain them in section 4.
2.3.5. World Stress Map Quality Ranking Criteria for the Orientation of the SHmax
As explained in the previous sections, different methods use different concepts to estimate the SHmax
orientation at various depths. The assessment and comparison of these methods is one of the critical
issues that have led the WSM project to develop a ranking system (Heidbach et al., 2010; Sperner et
al., 2003; Zoback, 1992). According to the most up-to-date release of the WSM project (Heidbach et
al., 2010), all the SHmax data are classified from A to E quality (see Table 3). In this worldwide
accepted ranking criteria, the A-quality (the most reliable data records) are the most accurate data
records while the E-quality is the least reliable data records. Actually the E-quality is used when no
stress information can be determined or the results have standard deviation of > ±40° (Table 4,
Heidbach, et al., 2010). The WSM project suggests that the A-C quality data are reliable data records
which represent the regional (far-field) SHmax orientation and can be used for investigation of
geodynamic process. While particular attention needs to be given to the D-quality data because they
might represent the regional stress pattern (Reiter et al., 2014; Tingay et al., 2010a), or show the local
stress state that is deviated from regional trends (Hillis and Reynolds, 2000, 2003). The WSM quality
ranking criteria for the SHmax orientation, inferred from different methods, is demonstrated in Table 4
(Heidbach et al., 2010).
2.4. Methods for Estimation of the (One Dimensional) Present-Day Stress Magnitude
Similar to determination of the SHmax orientation, the magnitude of Shmin, SHmax and Sv, that determine
the tectonic stress regime, can be estimated from different mining and petroleum industry methods. A
brief overview of each method, with a particular emphasis on petroleum methods used primarily in
this thesis, is summarised briefly below.
29

Table 4: The quality ranking of maximum horizontal stress orientation developed by the World Stress Map project (Heidbach et al., 2010).

2.4.1. Vertical Stress: Integration of Density Log
The magnitude of overburden stress (vertical, Sv, or lithostatic stress) can be determined using the
integration of rock densities (Bell, 1996a; King et al., 2010; Tingay et al., 2003; Zoback, 2010). In the
petroleum industry, the rock density is commonly measured by wireline logging tools in wellbores.
Hence, Sv can easily be calculated as following:
Sv = ∫ ρ(z)g dzz0 (20)
where ρ is the rock density at any given depth (z) and g is the gravity acceleration (~9.81 ms-2).
Petrophysical log data in general, and the density log in particular, is highly prone to errors,
particularly in washout or rugose zones where there is a poor contact between the pad of the density
tool and the wellbore wall (Ellis and Singer, 2007). Hence, different types of corrections, such as
environmental correction and data formatting, need to be applied on the raw density data to filter
erroneous data (Tingay et al., 2003). In addition, petrophysical logs are not usually available for
whole well intervals because petroleum companies are more interested to determine petrophysical
properties of reservoir sections. Hence, rock density needs to be predicted from the top of the well log
to the surface (King et al., 2010; Tingay et al., 2003). In this respect, there are numerous methods for
the prediction of average density including:
• density measurement from near surface sediments, particularly rock cores (Niemann, 2002);
• sonic to density conversions using different empirical methods (Anselmetti and Eberli, 1993;
Brocher, 2005; Christensen and Stanley, 2003; Gardner et al., 1974; Ludwig et al., 1970).
Sonic data in this method can be obtained from sonic logs (if available) or check shot velocity
from seismic surveys.
• intelligent approaches such as fuzzy logic, genetic algorithms and neural networks. The inputs
of these models are usually determined based on the data availability in each well (Cuddy and
Glover, 2002; Finol et al., 2001; Rajabi et al., 2010).
2.4.2. Engineering Methods to Estimate SHmax and Shmin Magnitudes
In this thesis, no new overcoring (OC) and hydraulic fracturing tests (HF) were undertaken by the
author. However, numerous existing data from the literature is compiled and reassessed, particularly
for analysis of the crustal stress in Australia and Iceland. Hence, these two methods are briefly
described in the following section.
31

2.4.2.1. Hydraulic Fracturing Tests
Hydraulic fracturing (HF) was originally developed for reservoir stimulation in petroleum wells
(Clark, 1949). Hubbert and Willis (1957) used elasticity theory to suggest that recorded pressure and
induced-hydraulic fracture are comparable to in-situ stresses. Scheidegger (1962) and Fairhurst (1694)
suggested this method for the measurement of in-situ stresses (Amadei and Stephansson, 1997).
Although this method is originally developed in petroleum industry, nowadays it is also frequently
used for the measurements of in-situ stresses for mining and civil engineering purposes (Amadei and
Stephansson, 1997; Bell, 1996a). This method was conducted in the KTB project to estimate the in-
situ stresses at depths between 6 and 9 km (Amadei and Stephansson, 1997; Brudy et al., 1995). The
HF method aims to initiate a fracture, generally parallel to the orientation of the SHmax, in an isolated
interval of a borehole using increasing fluid pressure (Figure 6) (Enever, 1993). The direction of the
initiated fracture that represents SHmax orientation can be determined by oriented impression packer or
image log over the fracture zone (Enever, 1993).
Figure 6: Schematic diagram for the concept and equipment of hydraulic fracture that aims to initiate a planar fracture that opens against the minimum principal stress. Modified from Bell (1996a).
2.4.2.2. Overcoring Measurements
As explained in Table (2), overcoring (OC) is a ‘stress relief technique’ for the characterisation of
three-dimensional in-situ stress in the near surface in mines and geotechnical constructions (Amadei
and Stephansson, 1997; Engelder, 1993; McGarr and Gay, 1978; Obert, 1962). This method uses
instruments in boreholes and is based on the expansion of the rock body when a cylinder of rock is
32

isolated from the stress field (Engelder, 1993). The OC measurement involves drilling two types of
holes namely small pilot hole and larger core hole. The strain gauge is installed in the small hole and
drilling the second hole, which is cored centred. In this step the cored rock is released form the stress
of the earth and the amount of rock expansion is monitored by strain gauge monitors (Bell, 1996a).
The stress is then determined from the strain using the elastic property of the rock sample (Engelder,
1993). Although OC is the only approach to measure the full 3D stress, it is considered as an
expensive technique that usually collects stress information from near surface (Bell, 1996a; McGarr
and Gay, 1978; Zang and Stephansson, 2010). In addition, nearby excavations, geological structures
and topography significantly affect the result of this technique (Engelder and Sbar, 1984). Due to
these limitations, OC measurements generally do not provide far-field stress information and are more
representative of the local stress pattern (Zoback, 1992).
2.4.3. Petroleum (wellbore) Methods for Estimation of Shmin Magnitude
In petroleum wells the minimum horizontal stress magnitude is commonly estimated using data
collected from “leak-off tests” (LOTs), “extended leak-off tests” (XLOTs) and minifracture tests.
LOTs are usually undertaken immediately below a casing point to estimate the maximum limit of mud
weight in drilling operations for kick tolerance and to prevent significant damage to the wellbore wall
(Addis et al., 1998; Bell, 1996a; White et al., 2002). LOTs involve the increase of mud pressure
within a short, isolated and open interval of wellbore, immediately below the casing shoe (and
rathole), in order to initiate a small tensile fracture (Addis et al., 1998; Bell, 1996a; White et al.,
2002). Fluid pressure is monitored until the pressurising rate decreases, and so called ‘leak-off’ is
observed (Figure 7) (Bell, 1996a; Engelder, 1993; Meyer, 2002). The leak-off pressure (LOP) is
determined as the point at which the deviation from linearity in the pressure increase occur on the
LOT pressure-time chart (Meyer, 2002). The initiated fracture at leak-off is opened against the
direction of Shmin in a vertical well. If the test is stopped prior to a fracture being initiated (prior to the
leak-off pressure being reached), it is called a Formation Integrity Test (FIT) (Meyer, 2002; White et
al., 2002). The XLOT are a longer LOT in which pumping is continued after LOP to determine the
fracture closure pressure (Figure 7). XLOTs involve of one or more full cycles of LOP, formation
breakdown, fracture closure pressure (FCP), fracture propagation pressure and instantaneous shut-in
pressure (ISIP) (Li et al., 2009; Meyer, 2002; White et al., 2002). Figure 7 illustrates various stages of
FIT, LOT and XLOT.
Depending on the test type and available data, Shmin magnitude is usually estimated from the LOP,
ISIP and FCP using Equation 21 (Meyer, 2002; White et al., 2002). However, it should be noted that
the LOP is less reliable than ISIP or FCP because it is a measurement of fracture opening, and not
closing and thus may tend to over-estimate the magnitude of Shmin (Meyer, 2002; White et al., 2002).
33

Hence, when XLOT data, and thus FCP and ISIP values are available (particularly the FCP of
subsequent cycles), this data is generally considered to yield a more reliable estimation of the Shmin
(Meyer, 2002).
Shmin = FCP + (depth × mud weight × 9.81) (21)
Minifracture tests are similar to extended leak-off tests, but are conducted within a specifically
targeted and isolated section of the wellbore (and not restricted to being immediately below the casing
shoe). Similar to hydraulic fracture tests, expandable packers are used in order to separate the uncased
interval of the borehole (Figure 6) (Engelder, 1993; Meyer, 2002). The concept of a minifracture test
is similar to the XLOT, in which pumping continues until the fracture propagates several meters
beyond the near-wellbore stress field, and the test generally involves one or more full cycles of leak-
off, breakdown, propagation, ISIP and fracture closure being measured (Enever, 1993; Meyer, 2002).
The tensile rock strength is reduced to ~zero after the FBP in the first cycle of minifracture tests (and
XLOTs). Therefore, the fracture re-opening pressure of subsequent cycles is lower than FBP. In order
to estimate the Shmin from minifracture test, the fracture closure pressure is used that provide an
accurate estimate of Shmin magnitude (Engelder, 1993; Meyer, 2002; Tingay, 2003).
Figure 7: An ideal example of Extended Leak-Off Test that shows different stages in a time-pressure test (White et al., 2002).
34

2.4.4. Petroleum (Wellbore) Methods for Estimation of SHmax Magnitude
Estimation of the SHmax magnitude is the most challenging part of stress component because there is
no direct method in the petroleum industry for measuring this parameter (Bell, 1996a; King et al.,
2008; Meyer, 2002; Zoback, 2010). However, there are several methods that estimate the SHmax
magnitude, or a magnitude range, with some assumptions (Bell, 1996a; King et al., 2008; Meyer,
2002; Nelson and Hillis, 2005; Nelson et al., 2006; Tingay et al., 2009; Zoback, 2010).
2.4.4.1. SHmax Estimates from Extended Leak-Off and Minifracture Tests
Fracture reopening and/or fracture initiation pressures determined from XLOT and minifracture tests
can be used to estimate the SHmax magnitude (Bell, 1996a; Haimson and Fairhurst, 1967; Hubbert and
Willis, 1957; Meyer, 2002). These pressures are affected by the disturbed stress around the borehole
(Meyer, 2002). The minimum stress at the borehole wall is given by (Bell, 1990; Hubbert and Willis,
1957; Kirsch, 1898):
σθθmin = 3Shmin − SHmax − Pw − Pp (22)
where Pw is the borehole fluid pressure at fracture initiation and Pp is the pore pressure
As described in section 2, the tensile strength (T) in this thesis is considered as a negative value.
Hence, in order to have tensile fracture, the concentrated stress on the wellbore wall needs to be less
than tensile rock strength:
𝜎𝜎𝜃𝜃𝜃𝜃𝑚𝑚𝜃𝜃𝜃𝜃 = 3𝑆𝑆ℎ𝑚𝑚𝜃𝜃𝜃𝜃 − 𝑆𝑆𝐻𝐻𝑚𝑚𝐻𝐻𝐻𝐻 − 𝑃𝑃𝑤𝑤 − 𝑃𝑃𝑝𝑝 ≤ 𝑇𝑇 (23)
The fracture initiation pressure (Pw) is equivalent to the leak-off pressure (LOP):
3𝑆𝑆ℎ𝑚𝑚𝜃𝜃𝜃𝜃 − 𝑆𝑆𝐻𝐻𝑚𝑚𝐻𝐻𝐻𝐻 − 𝐿𝐿𝐿𝐿𝑃𝑃 − 𝑃𝑃𝑝𝑝 = 𝑇𝑇 (24)
Then, assuming that FCP determined from XLOT is equal to the Shmin (Equation 21):
𝑆𝑆𝐻𝐻𝑚𝑚𝐻𝐻𝐻𝐻 = 3𝐹𝐹𝐹𝐹𝑃𝑃 − 𝐿𝐿𝐿𝐿𝑃𝑃 − 𝑃𝑃𝑝𝑝 –𝑇𝑇 (25)
In this equation, the tensile strength can be determined from core samples in laboratories. However, if
the fracture reopening pressure (Pr) is determined from subsequent XLOT test cycles, it can be used
instead of FCP because the rock tensile strength has essentially become zero (Bredehoeft et al., 1976;
Meyer, 2002):
SHmax = 3FCP − Pr − Pp (26)
35

SHmax estimation from this method is subject to some uncertainties and errors (Meyer, 2002).
Generally, the presence of natural fractures affects the reliability of this method because the XLOTs,
as losses into these may make test data hard to interpret or be reactivated during the test. Furthermore,
this method assumes that the rocks are perfectly elastic, isotropic, homogeneous and impermeable –
none of which are fully valid assumptions, particularly for LOTs and XLOTs. It is also generally
assumed that the effect of tensile strength has been removed in the FCP of subsequent cycles, though
it is common to still see some residual strength effects, particularly in the second test cycle (Meyer,
2002). Finally, the Pr in some stress states, particularly the strike-slip tectonic stress regime, is small
and is difficult to interpret (Evans et al., 1989; Meyer, 2002).
2.4.4.2. SHmax Estimation from Frictional Limit Theory
The frictional limit theory assumes that the maximum to minimum effective stress ratio cannot be in
excess of that essential to cause slip on a cohesionless, pre-existing fault plane (Sibson, 1974). Hence,
the frictional limit can be expressed as (Jaeger and Cook, 1979):
S1−PpS3− Pp
≤ �(1 + µ2)12 + µ�
2 (27)
where the maximum and minimum principal stresses are represented by S1 and S3, μ is coefficient of
friction on a cohesionless, pre-existing fault, optimally orientated which can be considered as 0.6
(Byerlee, 1978; Zoback and Healey, 1984) and rewrite the Equation 27 to:
S1−PpS3− Pp
≤ 3.12 (28)
The frictional limit method assumes the existence of faults and estimates the upper bound for the
SHmax magnitude (McGarr, 1980; Meyer, 2002; Tingay et al., 2009; Zoback, 2010; Zoback and
Healey, 1984).
2.4.4.3. SHmax Estimation from the Occurrence of DIFs and Breakouts
Drilling-induced failures including DIFs and breakouts form due to concentration of stress at the
wellbore wall (Barton and Moos, 2010; Bell, 1996a) and, hence, can be used for estimation of SHmax
magnitude. As explained in section 2.3.2.2, the initiation of DIFs are similar to the formation of
induced hydraulic fracture (Bell, 1996a; Bell and Babcock, 1986; Engelder, 1993; Hubbert and Willis,
1957), but DIFs occur under mud weight conditions during drilling (Meyer, 2002). Therefore, for the
36

intervals that the DIFs are picked in wellbore image log, the Equation 18 can be used for the SHmax
estimation. If we assume that the mud weight under which DIFs form is known (a significant
challenge, as the mud pressure locally varies during drilling due to pumping, friction and wellbore
effects), then the only unknown parameter is tensile strength that can be ignored because the tensile
strength of rocks is too small and can be considered as zero (Brudy and Zoback, 1999; Zoback, 2010).
Similarly, the breakouts occur when stress on the wellbore wall exceeds the compressional rock
strength (Bell, 1996a; Bell and Gough, 1979; Zoback, 2010):
σθθmax = 3SHmax − Shmin − 2Pp ≥ C (29)
where σθθmax is the maximum hoop stress, Pp is pore fluid pressure and C is the compressional strength
of the rock.
The unknown parameter in Equation 29 is the compressional rock strength. Generally the uniaxial
compressive strength (C0) of rock sample is an appropriate value for C (Meyer, 2002). However, the
formation of breakouts is due to polyaxial conditions (Meyer, 2002; Wiebols and Cook, 1968). Note
that rocks are stronger in polyaxial conditions in comparison to uniaxial conditions, but under biaxial
conditions are weaker. Hence, the uniaxial (C0) and biaxial (Cb) relationship is (Meyer, 2002; Wiebols
and Cook, 1968):
𝐹𝐹𝑏𝑏 = 𝐹𝐹0(1.0 + 0.6𝜇𝜇) (30)
where μ is the friction of coefficient (Wiebols and Cook, 1968). Hence, assuming μ=0.6 the
applicable rock strength for the formation of the breakout is C0 ≤ C ≤ 1.36C0 (Balfour et al., 2005;
Byerlee, 1978; Moos and Zoback, 1990; Zoback, 2010).
2.4.4.4. Poroelastic Equations for the Estimation of Horizontal Stress Magnitude
Poroelastic equations for the continuous estimation of SHmax and Shmin magnitudes are generally used
in petroleum wells from well log and rock mechanical data (Blanton and Olson, 1999; Brooke-Barnett
et al., 2015; Johnson et al., 2010; Mildren et al., 2013; Thiercelin and Plumb, 1994). This strain-
derived method calculates stress magnitude using linear elasticity equations with estimates on the
tectonic strain (Blanton and Olson, 1999):
Shmin = ʋ1−ʋ
�Sv − α. Pp� + E1−ʋ2
. εh + Eʋ1− ʋ2
. εH + α. Pp (31)
SHmax = ʋ1−ʋ
�Sv − α. Pp� + E1−ʋ2
. εH + Eʋ1− ʋ2
. εh + α. Pp (32)
37

where Shmin and SHmax are the horizontal stress magnitudes, E is the Young’s Modulus, Pp is pore fluid
pressure, ʋ is Poisson’s ratio, Sv is vertical stress , α is Biot’s constant , εh and εH are the strain in the
orientation of horizontal stresses.
Note that the rock mechanical property in these equations needs to be ‘static’. However, in the
absence of static elastic properties, the log derived or ‘dynamic’ rock mechanical properties must be
calibrated and converted to static elastic properties. In addition, the presence of single point stress
data, inferred from LOTs and XLOTs, as well as interpreted drilling-induced fractures and breakout is
required for calibration of the poroelastically-estimated stress magnitudes (Brooke-Barnett et al.,
2015; Mildren et al., 2013).
2.5. Methods for Prediction of Three Dimensional Present-Day Stress: 3D Geomechanical-
Numerical Modelling
A part of this thesis aims to present a geomechanical-numerical model for the Australian continent
that contains both stress orientations and magnitudes. Hence, in this section, a brief literature review
on geomechanical-numerical modelling is presented, with a particular emphasis on the previous
studies for the Australian continent in the published literature.
Geomechanical-numerical modelling is the representation of stress state in a reservoir, field, basin,
continent or tectonic plate using numerical methods (Buchmann and Connolly, 2007; Coblentz et al.,
1995; Dyksterhuis et al., 2005; Fischer and Henk, 2013; Hergert et al., 2015; Reiter and Heidbach,
2014; Reynolds et al., 2002). The observational stress data in the earth’s crust are distributed sparsely
and all the methods explained in the previous sections aim to estimate the component of stress tensor
in a single point or in one-dimension. Hence, the component of stress tensor in the regions where
there is no stress information cannot be estimated, particularly in stable intraplate regions that are
characterised by low earthquake activity in comparison with plate boundaries (Clark et al., 2014;
Johnston et al., 1994). Interpolation of stress data using statistical methods is the easiest approach for
estimating stress in ‘data gaps’, but stress state depends on various geological factors such as faults
(Barton and Zoback, 1994; Bell, 1996b; Yale, 2003; Zoback, 2010), lithological contrasts
(Dyksterhuis et al., 2005; Zhang et al., 1994; Zhang et al., 1996) and detachment horizons (Tingay et
al., 2011, 2012; Tingay et al., 2006) and thus there can be significant issues in assessing whether or
not the results of statistical interpolation methods will be reliable.
2D geomechanical numerical modelling is an appropriate tool for geomechanical investigations at
large scales, such as tectonic plates, in order to examine the impact of gravitational potential energy
and plate boundary forces in the neotectonics of plate interiors (Cloetingh and Wortel, 1986; Coblentz
et al., 1995; Coblentz et al., 1998; Dyksterhuis et al., 2005; Dyksterhuis and Müller, 2008; Hillis et
38

al., 1997; Müller et al., 2012; Müller et al., 2015). In the published literature, there are almost 20
papers that involve predicting the SHmax orientation in the Australian continent using 2D
geomechanical-numerical methods (Burbidge, 2004; Cloetingh and Wortel, 1985, 1986; Coblentz et
al., 1995; Coblentz et al., 1998; Dyksterhuis et al., 2005; Dyksterhuis and Müller, 2008; Hillis et al.,
1997; Müller et al., 2012; Müller et al., 2015; Reynolds et al., 2003). These studies demonstrated that
the contemporary state of stress in Australia, at the first-order, is primarily controlled by large plate
tectonic forces generated at the boundary of the Indo-Australian Plate. However, one major concern is
that almost all the previously published models for the Australian stress pattern have aimed to
understand the stress pattern of a 3D heterogeneous body by using just a 2D homogeneous model
geometry (Dyksterhuis and Müller, 2008). Hence, Dyksterhuis et al. (2005) included realistic
geomechanical provinces into their 2D model and predicted the SHmax orientation across the Australian
continent. However, these models, even the complex ones, have been unable to satisfactorily estimate
the observed stress data in north-eastern Australia, where stress data displays a clear E-W orientation
of SHmax in the Cooper Basin and N-S SHmax trend in the Bowen and Amadeus basins. Furthermore,
present-day stress magnitude analyses indicates high horizontal differential stress magnitudes in the
Amadeus, Cooper, Otway and Gippsland basins, whilst numerical models typically predict relatively
low horizontal differential stress magnitudes in these regions (Dyksterhuis et al., 2005; Reynolds et
al., 2003). The poor correlation between observational stress data and published geomechanical
models suggest that more detailed 3D numerical models are required in order to more reliably
replicate the present-day stress orientations and magnitudes.
Three-dimensional geomechanical-modelling is proposed as an alternative approach at various
smaller scales, such as in sedimentary basins, reservoirs and wellbore, to predict 3D stress tensor and
understand the role of geological structures on the present-day stress field. These models typically
utilise the finite element method (FEM), which is suggested as being the best technique for the
prediction of the 3D stress tensor (Buchmann and Connolly, 2007; Fischer and Henk, 2013; Hergert
and Heidbach, 2010, 2011; Hergert et al., 2011; Hergert et al., 2015; Reiter and Heidbach, 2014). The
FEM is an appropriate discrete solution to investigate geomechanical characteristics. This method
enables us to define mechanical and structural heterogeneities by assigning various mechanical
properties throughout the model’s geometry (Hergert et al., 2015; Reiter and Heidbach, 2014).
There are several parameters that improve the reliability and predictions of geomechanical-numerical
models (Buchmann and Connolly, 2007; Fischer and Henk, 2013; Hergert and Heidbach, 2011; Reiter
and Heidbach, 2014).
1. The structural model or the realistic 3D geological model. Note that the complexity of the
model depends on its scale.
39

2. Definition of the initial stress field, which determines the pre-stress condition in the absence
of any lateral force (or push and pull).
3. The presence of model-independent stress data in order to calibrate the models.
In order to provide a 3D predictive model for the stress state of Australia, in this thesis I apply a
modelling strategy that has been tested in several case studies including the Rhine Graben in Germany
(Buchmann and Connolly, 2007), Marmara Sea in Turkey (Hergert and Heidbach, 2010, 2011),
Alberta Basin in Canada (Reiter and Heidbach, 2014) and Alpine foreland in Switzerland (Hergert et
al., 2015). This geomechanical-numerical modelling approach starts with construction of model
geometry from realistic lithospheric and/or geological structures. The 3D geometry is then discretised
into meshes in order to define different geomechanical characteristics (Young modulus, density and
Poisson’s ratio) for each layer. The initial stress state is the next step that is required to be included in
the model, in order to mimic the real pre-stress condition. In order to solve the “partial differential
equations of the equilibrium forces” (Equation 28), the Abaqus finite element software is
implemented because it connects the detached meshes, even with different sizes, by contact surfaces
(Reiter and Heidbach, 2014). The calculated stress tensor then needs to be compared with
observational data in order to present the best model with respect to both stress orientations and
magnitudes (Buchmann and Connolly, 2007; Reiter and Heidbach, 2014) using the equation:
∂σij∂xi
+ ρxi = zero (33)
where ∂σij is total stress changes, ∂x is the length changes, ρ is the density and ρx is the weight of the
rock volume.
2.6. The Stress State in the Earth’s Crust
Early studies on regional compilations of the present-day stress information aimed to understand the
relationship between plate boundary forces and crustal stress state. Hast (1969) performed in-situ
stress measurements in various locations, including Fennoscandian bed rock, Iceland, Ireland,
Portugal and Zambia, and highlighted the presence of compressive horizontal stresses and temporal
changes of stress during geological time . Since then, numerous researchers compiled the regional
stress pattern, in different regions worldwide, in order to examine the major sources of crustal stress
(Denham et al., 1979; Fitch et al., 1973; Haimson and Voight, 1977; McGarr and Gay, 1978; Ranalli
and Chandler, 1975; Sbar and Sykes, 1973; Worotnicki and Denham, 1976). The increasing
importance of the current-day stress, in various aspect of geoscience, led researchers to build a global
compilation of current-day stress data, with a particular emphasis on the SHmax orientation (Heidbach
et al., 2010; Sperner et al., 2003; Zoback, 1992). The first release of the World Stress Map (WSM)
40

project with ~7700 data records revealed that there is a significant consistency between the SHmax
azimuth and absolute plate motion in major stable continental regions such as North America,
Western Europe and South America (Zoback, 1992; Zoback et al., 1989). Consequently, these studies
concluded that large plate tectonic forces, including “ridge push” at mid-ocean ridges, “suction” at
trench zones, “slab pull” at subduction zones, “resistance forces” at collision zones, “gravitational
potential energy” at mountain belts and basal “shear traction” provide the major (first-order) control
on the crustal stress field (Zoback, 1992; Zoback et al., 1989). These studies also demonstrated there
are some local-scale controls on the stress pattern, such as buoyancy forces, lateral density changes in
the crust and topography that control the crustal stress at a second-order (Figure 8). Further studies by
the WSM team during the second (1995-2008) phase of the project provided 21750 SHmax data records
across the world (Figure 9) (Heidbach et al., 2008b, 2010) and highlighted that “the large plate
boundary forces are not enough” to explain the stress pattern of smaller scales. In addition, numerous
smaller scales studies, particularly in sedimentary basins, highlighted the role of second-order and
third-order sources of stress in the stress pattern (Table 4) (Heidbach et al., 2007; Müller et al., 2010;
Reinecker et al., 2010; Tingay et al., 2006; Tingay et al., 2005b). Figure 9 shows the 2008 release of
the WSM project with emphasis on Australia, New Zealand and Iceland, where this thesis aims to
present new in-situ stress information.
Figure 8: Controls on the contemporary tectonic stress. Major controls or first-order stress sources are shown by large blue arrows and local stress sources or second-order sources are shown by small blue arrows (Tingay et al., 2005b; Zoback et al., 1989).
41

Table 5: Controls on the present-day crustal stress (Heidbach et al. 2007; Reiter et al. 2014; Zoback 1992; Zoback et al. 1989; Tingay, 2006).
Order of Stress Sources
Extent Sources of the crustal stress Examples
First >500 (km)
Plate boundary forces: slab pull, ridge push, basal tractions of mantle convection, trench suction, mountain ranges and their gravitational potential energy.
(Coblentz et al., 1998; Ghosh and Holt, 2012; Ghosh et al., 2006; Heidbach et al., 2007; Heidbach et al., 2010; Lithgow-Bertelloni and Guynn, 2004; Richardson, 1992; Sperner et al., 2003; Steinberger et al., 2001; Zoback, 1992; Zoback et al., 1989)
Second 100-500 (km)
Seamount loading, isostatic compensation, sediment loading.
(Bott and Dean, 1972; Cloetingh and Wortel, 1986; Heidbach et al., 2008a; Heidbach et al., 2007; Zhang et al., 1998)
Lateral density and strength contrasts. (Dyksterhuis et al., 2005; Heidbach et al., 2007; Zhang et al., 1994; Zhang et al., 1996)
Large fault zones. (Mount and Suppe, 1987, 1992; Zoback et al., 1987)
Erosion and topography. (Coblentz et al., 1998; Heidbach et al., 2008a; Heidbach et al., 2007; Reinecker et al., 2010)
Basin geometry and basement topography.
(Brooke-Barnett et al., 2015; King et al., 2009; Tingay et al., 2005a; Tingay et al., 2006; Yassir and Zerwer, 1997)
Third <100 (km)
Fluid injection and withdrawal within the subsurface, man-made excavation, impoundment dams, lowering of the water table.
(Klose, 2007, 2008; Quinn et al., 2008)
Faults, diapirs and folds.
(Bell, 1996b; Heidbach et al., 2007; King et al., 2012; Morley, 2010; Mount and Suppe, 1987; Tingay et al., 2010b; Yale, 2003; Zoback, 1987, 2010)
Other geological structures such as basal detachment.
(Ask, 1997; Bell, 1996b; Brereton et al., 1991; Heidbach et al., 2007; Hillis and Nelson, 2005; Müller et al., 2010; Tingay et al., 2011, 2012; Tingay et al., 2006)
42

Figure 9: The 2008 version of the World Stress Map (Heidbach et al., 2008b, 2010) contain 21750 maximum horizontal stress (SHmax) data records. This thesis aims to investigate the stress pattern of three regions including Australia (a), New Zealand (b) and Iceland (c). The Australian continent which is the main objective of this thesis is presented as the Australian Stress Map (ASM) which originally developed by Hillis et al. (1998) and Hillis and Reynolds (2000, 2003). The latest release of the ASM contained 594 A-E quality (142 A-C) data records in 16 regions. However, the stress pattern of most eastern Australia is poorly understood. In this map, New Zealand (b) which is located at the boundary of Indo-Australian and Pacific plates is represented by 67 A-E quality (62 A-C) data records inferred from single focal mechanism solution of earthquakes. Iceland which is located at the border of the North American and Eurasian plates (on the Mid-Atlantic Ridge) contained 38 A-E quality (11 A-C) SHmax data records inferred from shallow engineering method.

2.7. References
Aadnoy, B.S., 1990a. In-situ stress directions from borehole fracture traces. Journal of Petroleum Science and Engineering 4, 143-153.
Aadnoy, B.S., 1990b. Inversion technique to determine the in-situ stress field from fracturing data. Journal of Petroleum Science and Engineering 4, 127-141.
Addis, M.A., Hanssen, T.H., Yassir, N., Willoughby, D.R., Enever, J., 1998. A Comparison Of Leak-Off Test And Extended Leak-Off Test Data For Stress Estimation, SPE/ISRM Rock Mechanics in Petroleum Engineering. Society of Petroleum Engineers, 8-10 July, Trondheim, Norway.
Amadei, B., Stephansson, O., 1997. Rock stress and its measurement. Chapman & Hall, London. Ameen, M.S., 2003. Fracture and in-situ stress characterization of hydrocarbon reservoirs: definitions and
introduction. Geological Society, London, Special Publications 209, NP. Anderson, E.M., 1905. The dynamics of faulting. Transactions of the Edinburgh Geological Society 8,
387–402. Anderson, E.M., 1951. The dynamics of faulting and dyke formation with applications to Britain. Oliver
and Boyd, Edinburgh. Angelier, J., 1984. Tectonic analysis of fault slip data sets. Journal of Geophysical Research: Solid Earth
89, 5835-5848. Anselmetti, F.S., Eberli, G.P., 1993. Controls on sonic velocity in carbonates. Pure Appl Geophys 141,
287-323. Arnold, R., Townend, J., 2007. A Bayesian approach to estimating tectonic stress from seismological
data. Geophys J Int 170, 1336-1356. Ask, M.V.S., 1997. In situ stress from breakouts in the Danish sector of the North Sea. Marine and
Petroleum Geology 14, 231-243. Babcock, E.A., 1978. Measurement of subsurface fractures from dipmeter logs. AAPG Bulletin 62, 1111-
1126. Balfour, N.J., Savage, M.K., Townend, J., 2005. Stress and crustal anisotropy in Marlborough, New
Zealand: evidence for low fault strength and structure-controlled anisotropy. Geophys J Int 163, 1073-1086.
Barton, C., Moos, D., Tezuka, K., 2009. Geomechanical wellbore imaging: Implications for reservoir fracture permeability. AAPG bulletin 93, 1551-1569.
Barton, C.A., Moos, D., 2010. Geomechanical wellbore imaging: key to managing the asset life cycle, in: Pöppelreiter, M., Garcia-Carballido, C., Kraaijveld, M. (Eds.), Dipmeter and Borehole Image Log Technology. American Association of Petroleum Geologists Memoir pp. 81-112.
Barton, C.A., Zoback, M.D., 1994. Stress perturbations associated with active faults penetrated by boreholes: Possible evidence for near-complete stress drop and a new technique for stress magnitude measurement. Journal of Geophysical Research: Solid Earth 99, 9373-9390.
Bates, R.L., Jackson, J.A., 1980. Glossary of geology, 2nd Edition ed. American Geological Institute, Virginia, USA.
Becker, A., 1993. An attempt to define a “neotectonic period” for central and northern Europe. Geol Rundsch 82, 67-83.
Bell, J.S., 1990. Investigating stress regimes in sedimentary basins using information from oil industry wireline logs and drilling records. Geological Society London, Special Publications 48, 305-325.
Bell, J.S., 1996a. Petro Geoscience 1. In situ stresses in sedimentary rocks (part 1): measurement techniques. Geoscience Canada 23, 85-100.
Bell, J.S., 1996b. Petro Geoscience 2. In situ stresses in sedimentary rocks (part 2): applications of stress measurements. Geoscience Canada 23, 135-153.
Bell, J.S., Babcock, E.A., 1986. The stress regime of the Western Canadian Basin and implications for hydrocarbon production. Bulletin of Canadian Petroleum Geology 34, 364-378.
Bell, J.S., Gough, D.I., 1979. Northeast-southwest compressive stress in Alberta evidence from oil wells. Earth and Planetary Science Letters 45, 475-482.
Blanton, T.L., Olson, J.E., 1999. Stress Magnitudes from Logs: Effects of Tectonic Strains and Temperature. SPE Reservoir Evaluation & Engineering 2, 62-68.
44

Blomberg, J.R., 1971. The Determination and Considerations of Induced Fracture Strike, SPE Eastern Regional Meeting Society of Petroleum Engineers, Charleston, West Virginia, p. 8.
Bloom, A., L., 1978. Geomorphology: A systematic analysis of Late Cenozoic landforms. Prentice-Hall, New Jersey.
Bott, M.H.P., 1959. The mechanics of oblique slip faulting. Geological Magazine 96, 109-117. Bott, M.H.P., Dean, D.S., 1972. Stress systems at young continental margins. Nature physical science
235, 23-25. Bredehoeft, J.D., Wolff, R.G., Keys, W.S., Shuter, E., 1976. Hydraulic fracturing to determine the
regional in situ stress field, Piceance Basin, Colorado. Geol Soc Am Bull 87, 250-258. Brereton, R., Muller, B., Hancock, P., Harper, T., Bott, M.H.P., Sanderson, D., Kusznir, N., 1991.
European Stress: Contributions from Borehole Breakouts [and Discussion]. Philosophical Transactions: Physical Sciences and Engineering 337, 165-179.
Brocher, T.M., 2005. Empirical Relations between Elastic Wavespeeds and Density in the Earth's Crust. B Seismol Soc Am 95, 2081-2092.
Brooke-Barnett, S., Flottmann, T., Paul, P.K., Busetti, S., Hennings, P., Reid, R., Rosenbaum, G., 2015. Influence of basement structures on in situ stresses over the Surat Basin, southeast Queensland. Journal of Geophysical Research: Solid Earth 120, 4946-4965.
Brudy, M., Zoback, M., Rummel, F., Fuchs, K., 1995. Application of the integrated stress measurement strategy to 9 km depth in the KTB boreholes, Workshop on Rock Stress in the North Sea. NTH and SINTEF, Trondheim, Norway, pp. 154-167.
Brudy, M., Zoback, M.D., 1999. Drilling-induced tensile wall-fractures: implications for determination of in-situ stress orientation and magnitude. International Journal of Rock Mechanics and Mining Sciences 36, 191-215.
Buchmann, T.J., Connolly, P.T., 2007. Contemporary kinematics of the Upper Rhine Graben: A 3D finite element approach. Global and Planetary Change 58, 287-309.
Burbidge, D.R., 2004. Thin plate neotectonic models of the Australian plate. Journal of Geophysical Research: Solid Earth 109, B10405.
Byerlee, J., 1978. Friction of rocks. Pure Appl Geophys 116, 615-626. Célérier, B., 2010. Remarks on the relationship between the tectonic regime, the rake of the slip vectors,
the dip of the nodal planes, and the plunges of the P, B, and T axes of earthquake focal mechanisms. Tectonophysics 482, 42-49.
Christensen, N.I., Stanley, D., 2003. 83 - Seismic Velocities and Densities of Rocks, in: William H.K. Lee, H.K.P.C.J., Carl, K. (Eds.), International Geophysics. Academic Press, pp. 1587-1594.
Clark, D., McPherson, A., Allen, T., 2014. Intraplate Earthquakes in Australia, in: Talwani, P. (Ed.), Intraplate Earthquakes. Cambridge University Press, p. 398.
Clark, D., McPherson, A., Van Dissen, R., 2012. Long-term behaviour of Australian stable continental region (SCR) faults. Tectonophysics 566–567, 1-30.
Clark, J.B., 1949. A Hydraulic Process for Increasing the Productivity of Wells. Journal of Petroleum Technology, 1-8.
Cloetingh, S., Wortel, R., 1985. Regional stress field of the Indian Plate. Geophysical Research Letters 12, 77-80.
Cloetingh, S., Wortel, R., 1986. Stress in the Indo-Australian plate. Tectonophysics 132, 49-67. Coblentz, D., Sandiford, M., Richardson, R.M., Zhou, S., Hillis, R., 1995. The origins of the intraplate
stress field in continental Australia. Earth and Planetary Science Letters 133, 299-309. Coblentz, D., Zhou, S., Hillis, R., Richardson, R.M., Sandiford, M., 1998. Topography, boundary forces,
and the Indo-Australian intraplate stress field. Journal of Geophysical Research: Solid Earth 103, 919-931.
Cornet, F., Magnenet, V., 2016. A non-tectonic origin for the present day stress field in the sedimentary Paris Basin, EGU General Assembly 2016, Vienna, Austria.
Cornet, F.H., 2015. Elements of crustal geomechanics. Cambridge University Press. Cox, J.W., 1970. The High Resolution Dipmeter Reveals Dip-Related Borehole And Formation
Characteristics, SPWLA 11th Annual Logging Symposium. Society of Petrophysicists and Well-Log Analysts, Los Angeles, California.
Cox, J.W., 1972. The High-Resolution Dipmeter Reveals Dip-Related Borehole And Formation Characteristics. Journal of Canadian Petroleum Technology 11, 46-57.
45

Cuddy, S.J., Glover, P.W.J., 2002. The Application of Fuzzy Logic and Genetic Algorithms to Reservoir Characterization and Modeling, in: Wong, P., Aminzadeh, F., Nikravesh, M. (Eds.), Soft Computing for Reservoir Characterization and Modeling. Physica-Verlag HD, Heidelberg, pp. 219-241.
Denham, D., Alexander, L.G., Worotnicki, G., 1979. Stresses in the Australian crust: evidence from earthquakes and in-situ stress measurements. BMR Journal of Australian Geology and Geophysics 67, 289-295.
Doornkamp, J.C., 1986. Geomorphological approaches to the study of neotectonics. Journal of the Geological Society 143, 335-342.
Dyksterhuis, S., Albert, R.A., Müller, R.D., 2005. Finite-element modelling of contemporary and palaeo-intraplate stress using ABAQUS™. Computers & geosciences 31, 297-307.
Dyksterhuis, S., Müller, R.D., 2008. Cause and evolution of intraplate orogeny in Australia. Geology 36, 495-498.
Ellis, D.V., Singer, J.M., 2007. Well Logging for Earth Scientists, 2 ed. Springer Netherlands. Enever, J.R., 1993. Case studies of hydraulic fracture stress measurement in Australia, in: A., H.J. (Ed.),
Comprehensive Rock Engineering. Pergamon Press, Oxford, pp. 497–532. Engelder, T., 1993. Stress regimes in the lithosphere. Princeton University Press, New Jersey. Engelder, T., 1994. Deviatoric stressitis: A virus infecting the Earth science community. Eos,
Transactions American Geophysical Union 75, 209-212. Engelder, T., Sbar, M.L., 1984. Near-surface in situ stress: Introduction. Journal of Geophysical
Research: Solid Earth 89, 9321-9322. Evans, K.F., Engelder, T., Plumb, R.A., 1989. Appalachian Stress Study: 1. A detailed description of in
situ stress variations in Devonian shales of the Appalachian Plateau. Journal of Geophysical Research: Solid Earth 94, 7129-7154.
Fairhurst, C., 1694. Measurement of in-situ rock stresses with particular reference to hydraulic fracturing. Felsmechanik und Ingenieurgeologie 2, 139-147.
Fairhurst, C., 1968. Methods of determining in situ rock stresses at great depths, Technical report - Missouri River Division, p. 115.
Finol, J., Ke Guo, Y., Jing, X.D., 2001. A rule based fuzzy model for the prediction of petrophysical rock parameters. Journal of Petroleum Science and Engineering 29, 97-113.
Fischer, K., Henk, A., 2013. A workflow for building and calibrating 3-D geomechanical models &ndash a case study for a gas reservoir in the North German Basin. Solid Earth 4, 347-355.
Fitch, T.J., Worthington, M.H., Everingham, I.B., 1973. Mechanisms of Australian earthquakes and contemporary stress in the Indian ocean plate. Earth and Planetary Science Letters 18, 345-356.
Gardner, G.H.F., Gardner, L.W., Gregory, A.R., 1974. Formation velocity and density; the diagnostic basics for stratigraphic traps. Geophysics 39, 770-780.
Gary, M., McAfee, R., Wolf, C.L., 1972. Glossary of Geology. American Geological Institute, Washington, DC.
Gaucher, E., Schoenball, M., Heidbach, O., Zang, A., Fokker, P.A., van Wees, J.-D., Kohl, T., 2015. Induced seismicity in geothermal reservoirs: A review of forecasting approaches. Renewable and Sustainable Energy Reviews 52, 1473-1490.
Gephart, J.W., Forsyth, D.W., 1984. An improved method for determining the regional stress tensor using earthquake focal mechanism data: Application to the San Fernando Earthquake Sequence. Journal of Geophysical Research: Solid Earth 89, 9305-9320.
Gerbova, V., Tikhomirov, V., 1982. Russian school contribution to the birth and development of neotectonics. Geol Rundsch 71, 513-518.
Ghosh, A., Holt, W.E., 2012. Plate Motions and Stresses from Global Dynamic Models. Science 335, 838-843.
Ghosh, A., Holt, W.E., Flesch, L.M., Haines, A.J., 2006. Gravitational potential energy of the Tibetan Plateau and the forces driving the Indian plate. Geology 34, 321-324.
Grünthal, G., 2014. Induced seismicity related to geothermal projects versus natural tectonic earthquakes and other types of induced seismic events in Central Europe. Geothermics 52, 22-35.
Haimson, B., Fairhurst, C., 1967. Initiation and extension of hydraulic fractures in rocks. Society of Petroleum Engineers Journal 7, 310 - 318.
Haimson, B., Voight, B., 1977. Crustal stress in Iceland. Pure Appl Geophys 115, 153-190. Hancock, P.L., Williams, G.D., 1986. Neotectonics. Journal of the Geological Society 143, 325-326.
46
Hast, N., 1969. The state of stress in the upper part of the earth's crust. Tectonophysics 8, 169-211. Heidbach, O., Iaffaldano, G., Bunge, H.-P., 2008a. Topography growth drives stress rotations in the
central Andes: Observations and models. Geophysical Research Letters 35, L08301. Heidbach, O., Reinecker, J., 2013. Analyse des rezenten Spannungsfeldes der Nordschweiz,
(Arbeitsbericht NAB 12-05 / nagra), Wettingen : Nationale Genossenschaft für die Lagerung radioaktiver Abfälle (nagra).http://www.nagra.ch/data/documents/database/dokumente/$default/Default%20Folder/Publikationen/NABs%202004-2012/d_nab12-005.pdf.
Heidbach, O., Reinecker, J., Tingay, M., Müller, B., Sperner, B., Fuchs, K., Wenzel, F., 2007. Plate boundary forces are not enough: Second- and third-order stress patterns highlighted in the World Stress Map database. Tectonics 26, TC6014.
Heidbach, O., Tingay, M., Barth, A., Reinecker, J., Kurfeß, D., Müller, B., 2008b. The World Stress Map database release 2008. URL: www.world-stress-map.org.
Heidbach, O., Tingay, M., Barth, A., Reinecker, J., Kurfeß, D., Müller, B., 2010. Global crustal stress pattern based on the World Stress Map database release 2008. Tectonophysics 482, 3-15.
Hergert, T., Heidbach, O., 2010. Slip-rate variability and distributed deformation in the Marmara Sea fault system. Nat Geosci 3, 132-135.
Hergert, T., Heidbach, O., 2011. Geomechanical model of the Marmara Sea region—II. 3-D contemporary background stress field. Geophys J Int 185, 1090-1102.
Hergert, T., Heidbach, O., Bécel, A., Laigle, M., 2011. Geomechanical model of the Marmara Sea region—I. 3-D contemporary kinematics. Geophys J Int 185, 1073-1089.
Hergert, T., Heidbach, O., Reiter, K., Giger, S.B., Marschall, P., 2015. Stress field sensitivity analysis in a sedimentary sequence of the Alpine foreland, Northern Switzerland. Solid Earth Discuss. 7, 711-756.
Hillis, R., 2001. Coupled changes in pore pressure and stress in oil fields and sedimentary basins. Petroleum Geoscience 7, 419-425.
Hillis, R., Meyer, J.J., Reynolds, S.D., 1998. The Australian stress map. Exploration Geophysics 29, 420-427.
Hillis, R., Nelson, E.J., 2005. In situ stresses in the North Sea and their applications: petroleum geomechanics from exploration to development. Geological Society, London, Petroleum Geology Conference series 6, 551-564.
Hillis, R., Reynolds, S.D., 2000. The Australian Stress Map. Journal of the Geological Society 157, 915-921.
Hillis, R., Reynolds, S.D., 2003. In situ stress field of Australia. Geological Society of America Special Papers 372, 49-58.
Hillis, R., Sandiford, M., Coblentz, D.D., Zhou, S., 1997. Modelling the contemporary stress field and its implications for hydrocarbon exploration. Exploration Geophysics 28, 88-93.
Hillis, R., Sandiford, M., Reynolds, S.D., Quigley, M.C., 2008. Present-day stresses, seismicity and Neogene-to-Recent tectonics of Australia's ‘passive’ margins: intraplate deformation controlled by plate boundary forces. Geological Society, London, Special Publications 306, 71-90.
Hubbert, M.K., Willis, D.G., 1957. Mechanics of hydraulic fracturing. Transactions of the American Institute of Mining, Metallurgical, and Petroleum Engineers 210, 153-166.
Jaeger, J.C., Cook, N.G.W., 1979. Fundamentals of rock mechanics. Chapman and Hall. Jaeger, J.C., Cook, N.G.W., Zimmerman, R., 2007. Fundamentals of rock mechanics, 4th ed. Wiley-
Blackwell, Oxford. Johnson, R.L., Glassborow, B., Datey, A., Pallikathekathil, Z.J., Meyer, J.J., 2010. Utilizing Current
Technologies to Understand Permeability, Stress Azimuths and Magnitudes and their Impact on Hydraulic Fracturing Success in a Coal Seam Gas Reservoir, SPE Asia Pacific Oil and Gas Conference and Exhibition. Society of Petroleum Engineers, Brisbane, Queensland, Australia
Johnston, A.C., Coppersmith, K.J., Kanter, L.R., Cornell, C.A., 1994. The earthquakes of stable continental regions. Electric Power Research Institute Report TR102261V1.
Kanamori, H., Brodsky, E.E., 2004. The physics of earthquakes. Reports on Progress in Physics 67, 1429. Keys, W.S., 1980. The application of the acoustic televiewer to the characterization of hydraulic fractures
in geothermal wells,, Geothermal Reservoir Stimulation Symposium, San Francisco, California pp. 176-202.
47

King, R., Backé, G., Tingay, M., Hillis, R., Mildren, S., 2012. Stress deflections around salt diapirs in the Gulf of Mexico. Geological Society, London, Special Publications 367, 141-153.
King, R.C., Hillis, R., Reynolds, S.D., 2008. In situ stresses and natural fractures in the Northern Perth Basin, Australia. Australian Journal of Earth Sciences 55, 685-701.
King, R.C., Hillis, R., Tingay, M.R.P., Morley, C.K., 2009. Present-day stress and neotectonic provinces of the Baram Delta and deep-water fold–thrust belt. Journal of the Geological Society 166, 197-200.
King, R.C., Neubauer, M., Hillis, R., Reynolds, S.D., 2010. Variation of vertical stress in the Carnarvon Basin, NW Shelf, Australia. Tectonophysics 482, 73-81.
Kirsch, E.G., 1898. Die Theorie der Elastizität und die Bedürfnisse der Festigkeitslehre. Zeitschrift des Vereines Deutscher Ingenieure 42, 797-807.
Klose, C.D., 2007. Geomechanical modeling of the nucleation process of Australia's 1989 M5.6 Newcastle earthquake. Earth and Planetary Science Letters 256, 547-553.
Klose, C.D., 2008. Reply to comments on: Geomechanical modeling of the nucleation process of the 1989 Newcastle earthquake in Australia. Earth and Planetary Science Letters 269, 303-307.
Kopecky, A., 1972. Main features of neotectonics in Czechoslovakia (In Czech). Sbor. geol. věd, Ř. A. (Prague) 6, 77-155.
Kraft, T., Deichmann, N., 2014. High-precision relocation and focal mechanism of the injection-induced seismicity at the Basel EGS. Geothermics 52, 59-73.
Leitner, B., Eberhart-Phillips, D., Anderson, H., Nabelek, J.L., 2001. A focused look at the Alpine fault, New Zealand: Seismicity, focal mechanisms, and stress observations. Journal of Geophysical Research: Solid Earth 106, 2193-2220.
Leonov, Y.G., 1972. Recent activization and Alpine orogeny (In Russian) Geotektonika 2, 3-14. Li, G., Lorwongngam, A., Roegiers, J.-C., 2009. Critical Review Of Leak-Off Test As A Practice For
Determination Of In-Situ Stresses, 43rd U.S. Rock Mechanics Symposium & 4th U.S. - Canada Rock Mechanics Symposium. American Rock Mechanics Association, Asheville, North Carolina.
Lithgow-Bertelloni, C., Guynn, J.H., 2004. Origin of the lithospheric stress field. Journal of Geophysical Research: Solid Earth 109, B01408.
Ludwig, L.E., Nafe, J.E., Drake, C.L., 1970. Seismic refraction, in: Maxwell, A.E. (Ed.), The Sea. Wiley Interscience, New York, pp. 53–84.
Lund, B., Townend, J., 2007. Calculating horizontal stress orientations with full or partial knowledge of the tectonic stress tensor. Geophys J Int 170, 1328-1335.
McCallum, R.E., Bell, J.S., 1994. Western Canada Sedimentary Basin borehole imagery analysis project: a summary of Mobil Phillps Sukunka D-70-I/93-P-4, Geological Survey of Canada, Open File 2934, p. 29.
McCallum, R.E., Bell, J.S., 1995. Diagnosing natural and drilling-induced fractures from borehole images of western Canadian wells, in: Bell, J.S., Bird, T.D., Hillier, T.L., Greener, P.L. (Eds.), Oil and Gas Forum '95 - Energy from Sediments. Geological Survey of Canada, Open File Report 3058, pp. 79-82.
McGarr, A., 1980. Some constraints on levels of shear stress in the crust from observations and theory. Journal of Geophysical Research: Solid Earth 85, 6231-6238.
McGarr, A., Gay, N.C., 1978. State of stress in the Earth's crust. Annu Rev Earth Pl Sc 6, 405-436. McKenzie, D.P., 1969. The relation between fault plane solutions for earthquakes and the directions of
the principal stresses. B Seismol Soc Am 59, 591-601. Meyer, J.J., 2002. The determination and applicatiuon of in situ stresses in petroleum exploration and
production, National Center for Petroleum Geology and Geophysics. The University of Adelaide, Adelaide, p. 237.
Michael, A.J., 1984. Determination of stress from slip data: Faults and folds. Journal of Geophysical Research: Solid Earth 89, 11517-11526.
Mildren, S.D., Clark, R., Holford, S., Titus, L., 2013. Characterisation of fracture permeability at Cow Lagoon-1, MacArthur Basin, Northern Territory, Australia and recommendations for development of the Greater Cow Lagoon Structure, SPE Unconventional Resources Conference and Exhibition-Asia Pacific. Society of Petroleum Engineers, Brisbane, Australia
Moos, D., Zoback, M.D., 1990. Utilization of Observations of Well Bore Failure to Constrain the Orientation and Magnitude of Crustal Stresses: Application to Continental, Deep Sea Drilling Project, and Ocean Drilling Program Boreholes. J. Geophys. Res. 95, 9305-9325.
48

Morley, C.K., 2010. Stress re-orientation along zones of weak fabrics in rifts: An explanation for pure extension in ‘oblique’ rift segments? Earth and Planetary Science Letters 297, 667-673.
Mount, V.S., Suppe, J., 1987. State of stress near the San Andreas fault: Implications for wrench tectonics. Geology 15, 1143-1146.
Mount, V.S., Suppe, J., 1992. Present-day stress orientations adjacent to active strike-slip faults: California and Sumatra. Journal of Geophysical Research: Solid Earth 97, 11995-12013.
Müller, B., Heidbach, O., Negut, M., Sperner, B., Buchmann, T., 2010. Attached or not attached—evidence from crustal stress observations for a weak coupling of the Vrancea slab in Romania. Tectonophysics 482, 139-149.
Müller, B., Heidbach, O., Tingay, M., 2006. The World Stress Map — A Freely Accessible Tool For Geohazard Assessment. AIP Conference Proceedings 825, 19-31.
Müller, B., Zoback, M.L., Fuchs, K., Mastin, L., Gregersen, S., Pavoni, N., Stephansson, O., Ljunggren, C., 1992. Regional patterns of tectonic stress in Europe. Journal of Geophysical Research: Solid Earth 97, 11783-11803.
Müller, R.D., Dyksterhuis, S., Rey, P., 2012. Australian paleo-stress fields and tectonic reactivation over the past 100 Ma. Australian Journal of Earth Sciences 59, 13-28.
Müller, R.D., Yatheesh, V., Shuhail, M., 2015. The tectonic stress field evolution of India since the Oligocene. Gondwana Research 28, 612-624.
Murawski, H., 1972. Geologisches Worterbuch. Enke, Stuttgart. Nelson, E.J., Hillis, R., 2005. In situ stresses of the West Tuna area, Gippsland Basin. Australian Journal
of Earth Sciences 52, 299-313. Nelson, E.J., Hillis, R., Sandiford, M., Reynolds, S., Mildren, S.D., 2006. Present-day state-of-stress of
southeast Australia. APPEA Journal 2006, 283-305. Niemann, J.C., 2002. Developing a more rigorous methodology for the determination of pressure from
resistivity measurements. In: Geopressure: conceptual advances, applications, and future challenges SEG/EAGE Workshop, Galveston.
Obert, L., 1962. In situ determination of stress in rock. Mining Engineer 14. Paillet, F.L., 1983. Acoustic Character Of Hydraulic Fractures In Granite, The 24th U.S. Symposium on
Rock Mechanics (USRMS). American Rock Mechanics Association, College Station, Texas, pp. 327-334.
Paillet, F.L., 1985. Applications Of Borehole-Acoustic Methods In Rock Mechanics, The 26th U.S. Symposium on Rock Mechanics (USRMS). American Rock Mechanics Association, Rapid City, South Dakota, pp. 207-220.
Plumb, R.A., Hickman, S.H., 1985. Stress-induced borehole elongation: A comparison between the four-arm dipmeter and the borehole televiewer in the Auburn Geothermal Well. Journal of Geophysical Research: Solid Earth 90, 5513-5521.
Quinn, C.D., Glen, R.A., Diessel, C.F.K., 2008. Discussion of “Geomechanical modeling of the nucleation process of Australia's 1989 M5.6 Newcastle earthquake” by C.D. Klose [Earth Planet. Sci. Lett. 256 (2007) 547–553]. Earth and Planetary Science Letters 269, 296-302.
Radan, K., 1992. A new view on neotectonics. GeoJournal 28, 413-415. Rajabi, M., Bohloli, B., Gholampour Ahangar, E., 2010. Intelligent approaches for prediction of
compressional, shear and Stoneley wave velocities from conventional well log data: A case study from the Sarvak carbonate reservoir in the Abadan Plain (Southwestern Iran). Computers & Geosciences 36, 647-664.
Raleigh, C.B., Healy, J.H., Bredehoeft, J.D., 1972. Faulting and Crustal Stress at Rangely, Colorado, in: Heard, H.C., Borg, I.Y., Carter, N.L., Raleigh, C.B. (Eds.), Flow and Fracture of Rocks. U.S. Geological Survey, Washington, D. C., pp. 275-284.
Ranalli, G., Chandler, T.E., 1975. The stress field in the upper crust as determined from in situ measurements. Geol Rundsch 64, 653-674.
Reinecker, J., Tingay, M., Müller, B., 2003. Borehole breakout analysis from four-arm caliper logs. http://dc-app3-14.gfz-potsdam.de/pub/guidelines/WSM_analysis_guideline_breakout_caliper.pdf.
Reinecker, J., Tingay, M., Müller, B., Heidbach, O., 2010. Present-day stress orientation in the Molasse Basin. Tectonophysics 482, 129-138.
49

Reinecker, J., Tingay, M.R.P., Müller, B., 2006. The use of the WSM database for rock engineers, in: Lu, M., Li, C.C., Kjorholt, H., Dahle, H. (Eds.), In-Situ Rock Stress: Measurement, interpretation and application. Taylor & Francis, London, pp. 505-510.
Reiter, K., Heidbach, O., 2014. 3-D geomechanical–numerical model of the contemporary crustal stress state in the Alberta Basin (Canada). Solid Earth 5, 1123-1149.
Reiter, K., Heidbach, O., Schmitt, D., Haug, K., Ziegler, M., Moeck, I., 2014. A revised crustal stress orientation database for Canada. Tectonophysics 636, 111-124.
Reynolds, S.D., 2001. Characterization and modelling of the regional in situ stress field of continental Australia, National Centre for Petroleum Geology and Geophysics. The University of Adelaide, Adelaide, p. 216.
Reynolds, S.D., Coblentz, D.D., Hillis, R., 2002. Tectonic forces controlling the regional intraplate stress field in continental Australia: Results from new finite element modeling. Journal of Geophysical Research: Solid Earth 107, ETG 1-1-ETG 1-15.
Reynolds, S.D., Coblentz, D.D., Hillis, R., 2003. Influences of plate-boundary forces on the regional intraplate stress field of continental Australia. Geological Society of America Special Papers 372, 59-70.
Richardson, R.M., 1978. Intraplate stress and the driving mechanism for plate tectonics, Department of Earth and Planetary Sciences. Massachusetts Institute of Technology, p. 372.
Richardson, R.M., 1992. Ridge forces, absolute plate motions, and the intraplate stress field. Journal of Geophysical Research: Solid Earth 97, 11739-11748.
Richardson, R.M., Solomon, S.C., Sleep, N.H., 1976. Intraplate stress as an indicator of plate tectonic driving forces. Journal of Geophysical Research 81, 1847-1856.
Richardson, R.M., Solomon, S.C., Sleep, N.H., 1979. Tectonic stress in the plates. Reviews of Geophysics 17, 981-1019.
Sandiford, M., Wallace, M., Coblentz, D.D., 2004. Origin of the in situ stress field in south-eastern Australia. Basin Research 16, 325-338.
Sbar, M.L., Barazangi, M., Dorman, J., Scholz, C.H., Smith, R.B., 1972. Tectonics of the Intermountain Seismic Belt, Western United States: Microearthquake Seismicity and Composite Fault Plane Solutions. GSA Bulletin 83, 13-28.
Sbar, M.L., Sykes, L.R., 1973. Contemporary Compressive Stress and Seismicity in Eastern North America: An Example of Intra-Plate Tectonics. Geol Soc Am Bull 84, 1861-1882.
Scheidegger, A.E., 1962. Stresses in the earth’s crust as determined from hydraulic fracturing data. Geologie und Bauwesen 272, 45-53.
Schmitt, D.R., Currie, C.A., Zhang, L., 2012. Crustal stress determination from boreholes and rock cores: Fundamental principles. Tectonophysics 580, 1-26.
Segall, P., 1989. Earthquakes triggered by fluid extraction. Geology 17, 942-946. Şengör, A.M.C., Tüysüz, O., İmren, C., Sakınç, M., Eyidoğan, H., Görür, N., Le Pichon, X., Rangin, C.,
2004. The North Anatolian Fault: a new look. Annu Rev Earth Pl Sc 33, 37-112. Sibson, R.H., 1974. Frictional constraints on thrust, wrench and normal faults. Nature 249, 542-544. Simpson, R.W., 1997. Quantifying Anderson's fault types. Journal of Geophysical Research: Solid Earth
102, 17909-17919. Sitdikov, B.B., 1979. The Lower Oligocene -a turn in the geotectonical history of Uzbekistan. (In
Russian) Uzbek, geol. Zhurn 6, 65-67. Slemmons, B., D., 1991. Introduction, in: Slemmons Burton, D., Engdahl, E.R., Zoback, M.D.,
Blackwell, D., D. (Eds.), Neotectonics of North America. Geological Society of America, p. 1. Sperner, B., Müller, B., Heidbach, O., Delvaux, D., Reinecker, J., Fuchs, K., 2003. Tectonic stress in the
Earth’s crust: advances in the World Stress Map project. Geological Society, London, Special Publications 212, 101-116.
Sperner, B., Zweigel, P., 2010. A plea for more caution in fault–slip analysis. Tectonophysics 482, 29-41. Steinberger, B., Schmeling, H., Marquart, G., 2001. Large-scale lithospheric stress field and topography
induced by global mantle circulation. Earth and Planetary Science Letters 186, 75-91. Steward, I., Hancock, P.L., 1994. Neotectonics, in: Hancock, P.L. (Ed.), Continental Deformation.
Pergamon Press, Oxford, New York, pp. 370-409.
50

Stock, J.M., Healy, J.H., 1988. Stress Field at Yucca Mountain, Nevada, Geologic and hydrologic investigations of a potential nuclear waste disposal site at Yucca Mountain, southern Nevada. U.S. Geological Survey Bulletin, Reston, VA, pp. 87-93.
Terzaghi, K., 1943. Theoretical soil mechanics. John Wiley and Sons, New York. Thiercelin, M.J., Plumb, R.A., 1994. A Core-Based Prediction of Lithologic Stress Contrasts in East
Texas Formations. SPE Formation Evaluation. Tingay, M., 2003. In Situ Stress and Overpressures of Brunei Darussalam, National Centre for Petroleum
Geology and Geophysics. The University of Adelaide, Adelaide, p. 271. Tingay, M., Bentham, P., De Feyter, A., Kellner, A., 2011. Present-day stress-field rotations associated
with evaporites in the offshore Nile Delta. Geol Soc Am Bull 123, 1171-1180. Tingay, M., Bentham, P., De Feyter, A., Kellner, A., 2012. Evidence for non-Andersonian faulting above
evaporites in the Nile Delta. Geological Society, London, Special Publications 367, 155-170. Tingay, M., Hillis, R., Swarbrick, R.E., Morley, C., 2005a. Origin and petrophysical log response of
overpressures in the Baram Delta Province, Brunei, Indonesian Petroleum Association. Annual Convention Indonesian Petroleum Association, Jakarta, Indionesia, pp. 381-390.
Tingay, M., Morley, C., King, R., Hillis, R., Coblentz, D.D., Hall, R., 2010a. Present-day stress field of Southeast Asia. Tectonophysics 482, 92-104.
Tingay, M., Muller, B., Reinecker, J., Heidbach, O., 2006. State and Origin of the Present-Day Stress Field in Sedimentary Basins: New Results from the World Stress Map Project, The 41st U.S. Symposium on Rock Mechanics (USRMS). American Rock Mechanics Association, Golden, Colorado
Tingay, M., Müller, B., Reinecker, J., Heidbach, O., Wenzel, F., Fleckenstein, P., 2005b. Understanding tectonic stress in the oil patch: The World Stress Map Project. The Leading Edge 24, 1276-1282.
Tingay, M.R.P., Hillis, R., Morley, C.K., King, R.C., Swarbrick, R.E., Damit, A.R., 2009. Present-day stress and neotectonics of Brunei: Implications for petroleum exploration and production. AAPG Bulletin 93, 75-100.
Tingay, M.R.P., Hillis, R., Morley, C.K., Swarbrick, R.E., Okpere, E.C., 2003. Variation in vertical stress in the Baram Basin, Brunei: tectonic and geomechanical implications. Marine and Petroleum Geology 20, 1201-1212.
Tingay, M.R.P., Morley, C.K., Hillis, R., Meyer, J., 2010b. Present-day stress orientation in Thailand's basins. Journal of Structural Geology 32, 235-248.
Twiss, R.J., Moores, E.M., 2007. Structural Geology Freeman, W. H. & Company, New York. Vita-Finzi, C., 1986. Recent earth movements: an introduction to neotectonics. Academic Press, London. Webb, T.H., Ferris, B.G., Harris, J.S., 1986. The Lake Taupo, New Zealand, earthquake swarms of 1983.
New Zeal J Geol Geop 29, 377-389. White, A.J., Traugott, M.O., Swarbrick, R.E., 2002. The use of leak-off tests as means of predicting
minimum in-situ stress. Petroleum Geoscience 8, 189-193. Wiebols, G.A., Cook, N.G.W., 1968. An energy criterion for the strength of rock in polyaxial
compression. International Journal of Rock Mechanics and Mining Sciences & Geomechanics Abstracts 5, 529-549.
Worotnicki, G., Denham, D., 1976. The state of stress in the upper part of the earth's crust in Australia according to measurements in mines and tunnels and from seismic observations, Symposium on Investigation of Stress in Rock: Advances in Rock Measurment Institution of Engineers, Australia., pp. 71-82.
Yale, D.P., 2003. Fault and stress magnitude controls on variations in the orientation of in situ stress. Geological Society, London, Special Publications 209, 55-64.
Yassir, N.A., Zerwer, A., 1997. Stress regimes in the Gulf Coast, offshore Louisiana; data from well-bore breakout analysis. AAPG Bulletin 81, 293-307.
Zang, A., Oye, V., Jousset, P., Deichmann, N., Gritto, R., McGarr, A., Majer, E., Bruhn, D., 2014. Analysis of induced seismicity in geothermal reservoirs – An overview. Geothermics 52, 6-21.
Zang, A., Stephansson, O., 2010. Stress Field of the Earth's Crust. Springer Dordrecht Heidelberg London New York, Springer.
Zemanek, J., Caldwell, R.L., Glenn, E.E., Jr., Holcomb, S.V., Norton, L.J., Straus, A.J.D., 1969. The Borehole TeleviewerA New Logging Concept for Fracture Location and Other Types of Borehole Inspection. Journal of Petroleum Technology 21, 762-774.
51

Zhang, Y.-Z., Dusseault, M.B., Yassir, N.A., 1994. Effects of rock anisotropy and heterogeneity on stress distributions at selected sites in North America. Engineering Geology 37, 181-197.
Zhang, Y., Scheibner, E., Hobbs, B.E., Ord, A., Drummond, B.J., Cox, S.J.D., 1998. Lithospheric Structure in Southeast Australia: a Model Based on Gravity, Geoid and Mechanical Analyses, Structure and Evolution of the Australian Continent. American Geophysical Union, pp. 89-108.
Zhang, Y., Scheibner, E., Ord, A., Hobbs, B., 1996. Numerical modelling of crustal stresses in the eastern Australian passive margin. Australian Journal of Earth Sciences 43, 161-175.
Zoback, M.D., 1987. New evidence on the state of stress of the San Andreas fault system. Science 238, 1105-1111.
Zoback, M.D., 2010. Reservoir geomechanics. Cambridge University Press, Cambridge. Zoback, M.D., Healey, J.H., 1984. Friction, faulting, and in-situ stress. Annales Geophysicae 2, 689-698. Zoback, M.D., Zoback, M.L., Mount, V.S., Suppe, J., Eaton, J.P., Healey, J.H., Oppenheimer, D.,
Reasenberg, P., Jones, L., Raleigh, C.B., Wong, I.G., Scotti, O., Wentworth, C., 1987. New Evidence on the State of Stress of the San Andreas Fault System. Science 238, 1105-1111.
Zoback, M.L., 1992. First- and second-order patterns of stress in the lithosphere: The World Stress Map Project. Journal of Geophysical Research: Solid Earth 97, 11703-11728.
Zoback, M.L., Zoback, M., 1980a. State of stress in the conterminous United States. Journal of Geophysical Research: Solid Earth 85, 6113-6156.
Zoback, M.L., Zoback, M.D., 1980b. Faulting patterns in north-central Nevada and strength of the crust. Journal of Geophysical Research: Solid Earth 85, 275-284.
Zoback, M.L., Zoback, M.D., Adams, J., Assumpcao, M., Bell, S., Bergman, E.A., Blumling, P., Brereton, N.R., Denham, D., Ding, J., Fuchs, K., Gay, N., Gregersen, S., Gupta, H.K., Gvishiani, A., Jacob, K., Klein, R., Knoll, P., Magee, M., Mercier, J.L., Muller, B.C., Paquin, C., Rajendran, K., Stephansson, O., Suarez, G., Suter, M., Udias, A., Xu, Z.H., Zhizhin, M., 1989. Global patterns of tectonic stress. Nature 341, 291-298.
52

3. The Present-Day Stress Field of Australia
3.1. Paper 1: Present-Day Stress Orientation in the Clarence-
Moreton Basin of New South Wales, Australia: A New High Density
Dataset Reveals Local Stress Rotations
Rajabi, M., Tingay, M., King, R., Heidbach, O., 2016. Present-day stress orientation in the
Clarence-Moreton Basin of New South Wales, Australia: a new high density dataset reveals
local stress rotations. Basin Research. DOI: http://dx.doi.org/10.1111/bre.12175.
53

54

Rajabi, M., Tingay, M., King, R. & Heidbach, O. (2016). Present-day stress orientation in the Clarence-Moreton Basin of New South Wales, Australia: a new high density dataset reveals local stress rotations. Basin Research, 29(S1), 622-640.
NOTE:
This publication is included on pages 55 - 73 in the print copy of the thesis held in the University of Adelaide Library.
It is also available online to authorised users at:
http://dx.doi.org/10.1111/bre.12175

3.2. Paper 2: The Present-Day Stress Field of New South Wales,
Australia
Rajabi, M., Tingay, M., Heidbach, O., 2016. The present-day stress field of New South
Wales, Australia. Australian Journal of Earth Sciences 63, 1-21.
DOI: http://dx.doi.org/10.1080/08120099.2016.1135821.
74

75

Rajabi, M., Tingay, M. & Heidbach, O. (2016). The present-day stress field of New South Wales, Australia. Australian Journal of Earth Sciences 63(1), 1-21.
NOTE:
This publication is included on pages 76 - 96 in the print copy of the thesis held in the University of Adelaide Library.
It is also available online to authorised users at:
http://dx.doi.org/10.1080/08120099.2016.1135821
3.3. Paper 3: The Present-Day State of Stress in the Darling Basin,
Australia: Implications for Exploration and Production.
Rajabi, M., Tingay, M., Heidbach, O., 2016. The present-day state of tectonic stress in the
Darling Basin, Australia: Implications for exploration and production. Marine and
Petroleum Geology 77, 776-790. DOI: http://dx.doi.org/10.1016/j.marpetgeo.2016.07.021.
97

98

vailable at ScienceDirect
Marine and Petroleum Geology 77 (2016) 776e790
Contents lists a
Marine and Petroleum Geology
journal homepage: www.elsevier .com/locate/marpetgeo
Research paper
:
The present-day state of tectonic stress in the Darling Basin, AustraliaImplications for exploration and productionMojtaba Rajabi a, *, Mark Tingay a, Oliver Heidbach b
a Australian School of Petroleum, University of Adelaide, Adelaide, SA, 5005, Australiab Helmholtz Centre Potsdam, German Research Centre for Geosciences GFZ, Telegrafenberg, 14473, Potsdam, Germany
henglyismty,gsin.hemer.inss
a r t i c l e i n f o
Article history:Received 19 February 2016Received in revised form10 July 2016Accepted 21 July 2016Available online 22 July 2016
Keywords:Australian stress fieldDarling BasinIn-situ stressPetroleum geomechanicsNeotectonic structuresStress magnitude
thalstcyicnterinbyalc-ic
d.
* Corresponding author.E-mail address: [email protected]
http://dx.doi.org/10.1016/j.marpetgeo.2016.07.0210264-8172/© 2016 Elsevier Ltd. All rights reserve
a b s t r a c t
Knowledge of the full present-day stress tensor and pore pressure has significant applications in texploration and production of conventional and unconventional hydrocarbon reservoirs. The DarliBasin of New South Wales, Australia, is an old sedimentary basin (Late Cambrian/Silurian to EarCarboniferous) in which there was limited information about the present-day stress field prior to thstudy. In this paper we evaluate the contemporary stress field of the Darling Basin using a dataset frorecent exploration wells and perform a geomechanical risk assessment with respect to borehole stabilifracture/fault generation and reactivation. Our interpretations of borehole failures in borehole image loreveal a prevailing east-west orientation of the maximum horizontal stress throughout the Darling BasThe estimates of the magnitudes for the vertical, minimum and maximum horizontal stress in tstudied wells indicate a transition between thrust and strike-slip faulting stress regime at 600e700depths, where the magnitude of vertical stress and minimum horizontal stress are close to each othHowever, the presence of borehole breakouts and drilling-induced tensile fractures, that we observethe image logs at greater depths (900e2100 m) indicate a transition into a strike-slip tectonic streregime below a depth range of approximately 700e900 m. These findings are in agreement wiovercoring stress measurements east and west of the investigated wells. Furthermore, there are severNeogene-to-Recent geological structures in the study area that indicate thrust faulting with an east-weoriented maximum horizontal stress orientation around this old sedimentary basin. The consistenbetween the orientation of maximum horizontal stress determined from wellbore data and neotectonstructures is significant, and implies that horizontal stress orientations derived from very recegeological features may be valuable inputs to geomechanical models in the absence of wellbore or othdata. However, the recent surface geological structures suggest a thrust faulting stress regime that isslight contrast to the transition between thrust and strike-slip stress regime (SH > Sh ~ Sv) indicatedpetroleum data, and highlights a potential pitfall of using neotectonic structures in geomechanicmodels. In particular, careful attention and verification should be made when using neotectonic strutures for input, calibration or confirmation of geomechanical models, especially in intraplate tectonsettings such as Australia.
© 2016 Elsevier Ltd. All rights reserve
asas,s,).
licti-dde-n-e-
1. Introduction
Geomechanics has been demonstrated over the past 20 yearshaving key importance in the hydrocarbon industry, and is used inrange of applications throughout the life cycle of geo-reservoirfrom early exploration to field abandonment (Barton and Moo2010; Bell, 1996b; Tingay et al., 2005b; Zoback, 2007
ofnd
u (M. Rajabi).
d.
99
Geomechanics controls the initiation and propagation of hydraufractures, and is thus an essential input for designing and opmizing hydraulic fracture stimulation (Bell, 1996b; Busetti anReches, 2014). The stability of wells, particularly deviated anhorizontal wells, is also controlled by the geomechanical paramters, with wellbore instability being the largest contributor to noproductive time in drilling operations (Dodson et al., 2004). Ptroleum geomechanics can also be used to assess the likelihoodfaults to be reactivated in the present-day stress field, which cahelp assess whether hydrocarbon traps may have been breache

anddu20petflofraseq20
weoripoorionbasnenstrmatenlatysitatet
str2020thrandsisAusho(CoHoandstrwi20etma
NevermeandDasedFirshoErosouetsousouonsigenc201regforGuweandDatha
(CldaynifitotheDageo20knpot
strratchapupredripreThhostrthrappoveearstrstrmista
2.
basweThsinin(Coand
ginGoNusettheSteoftheWahavexpSte(20sinOaeneflorocCOmaDic
Augio
M. Rajabi et al. / Marine and Petroleum Geology 77 (2016) 776e790 777
also to assess hazards associated with completions and pro-ction (Barton and Moos, 2010; Grünthal, 2014; Jones and Hillis,03; Mildren et al., 2002, 2005; Nicol et al., 2011). Furthermore,roleum geomechanics has additional applications for wateroding, sand production, enhancing production in naturallyctured reservoirs, drilling safety and well design, and CO2 geo-uestration (Barton and Moos, 2010; Bell, 1996b; Moos et al.,03; Rutqvist, 2012; Zoback, 2007).A comprehensive geomechanical investigation of petroleumlls includes evaluation of several components such as theentation and magnitude of stresses, rock mechanical properties,re pressure and their interaction; and the distribution andentation of faults and fractures. Assuming the vertical stress ise of the three principal stresses, the stress tensor in sedimentaryins is typically reduced to having four independent compo-ts: the vertical stress (SV) magnitude, maximum horizontal
ess (SHmax) magnitude, minimum horizontal stress (Shmin)gnitude and the orientation of the SHmax (Bell, 1996a). The stresssor varies throughout sedimentary basins, both in depth anderally, and thus, a key aspect of petroleum geomechanical anal-s is the mapping of variations in stress magnitudes and orien-ion within fields (e.g., Bell, 1996b; Heidbach et al., 2007; Rajabial., 2016a, 2016b; Tingay et al., 2005b; Zoback, 2007).To date, numerous studies have been carried out on the in-situess of Australia (e.g., Coblentz et al., 1998; Hillis and Reynolds,03; Hillis et al., 2008; Rajabi et al., 2016a; Reynolds et al.,06; Reynolds et al., 2005). The present-day stress orientationoughout Australia is the most variable of any major continent,, unlike other major tectonic plates, does not show any con-
tency with absolute plate motion despite the fact that the Indo-stralian Plate has the highest absolute plate motion whichuld lead to rather frictional stresses at the base of the plateblentz et al., 1998; Hillis and Reynolds, 2003; Richardson, 1992).wever, most of the studies focused on the orientation of SHmaxgenerally limited analyses are undertaken on the absolute
ess magnitude, other than in a few regions generally associatedth major hydrocarbon provinces (Bailey et al., 2012; King et al.,08, 2012; Mildren et al., 2002; Nelson et al., 2006; Reynoldsal., 2006). This study focuses on both the orientation andgnitude of the present-day stress in the Darling Basin region.The Darling Basin region is located in the central western part ofw South Wales (Fig. 1) and, prior to this study, contained onlyy limited stress information from three overcoring measure-nts in the east and west of the basin (Heidbach et al., 2010; HillisReynolds, 2003). The study of the present-day stress field in the
rling Basin, which is a Late Cambrian to Early Carboniferousimentary basin, is particularly important for several reasons.stly, the basin is located between five stress provinces that allw different stress orientations. For example, the Cooper-manga and Flinders stress provinces in the northwest andtheast display an east-west SHmax orientation (Fig. 1) (Reynoldsal., 2005), the Otway and Gippsland basins (Fig. 1) in thethwest and southeast of the Darling Basins display a northwest-theast SHmax orientation (Hillis and Reynolds, 2003) andshore sedimentary basins of New South Wales, in the east, shownificant perturbations of the SHmax orientation due to the pres-e of local stress sources (Hillis et al., 1999; Rajabi et al., 2016a,6b). The stress orientations observed in individual adjacentions have been proposed to be driven by far field plate boundaryces, particularly continental collision at New Zealand, Newinea and India (Reynolds et al., 2002; Sandiford et al., 2004), asll as being affected by local influences like basement structurefaulting (Hillis et al., 1999; Rajabi et al., 2016a, 2016b). The
rling Basin region also contains several neotectonic reverse faultst generally show east-west orientations for the palaeo-SHmax
100
ark et al., 2012; Geoscience Australia, 2016). Hence, the present-stress field interpreted from wellbore data herein is also sig-cant, as it can be compared with young geological informationsee if the geological structures can be used as reliable sources ofpresent-day stress in geomechanical assessment. Finally, the
rling Basin has potential for CO2 storage and petroleum/thermal exploration (e.g., Bunch, 2014; Cooney and Mantaring,07; HDR, 2010; Kobussen and Dick, 2011), for which theowledge of the stress tensor is essential in order to examine theential for fault reactivation and seal failure during CO2 injection.In this paper we determine the components of the reducedess tensor from petroleum data in three recently drilled explo-ion and stratigraphic wells in the Darling Basin and discuss thenges of the stress state with depth that are consistent withblished overcoring measurements. In particular, we interpretsent-day stress orientations from borehole breakouts andlling-induced tensile fractures (DIFs), and then compile poressure and density data as well as two extended leak-off tests.e data are used to estimate the magnitudes of the vertical andrizontal stresses. We demonstrate that the present-day tectonicess regime in the studied wells is at the transition betweenust and strike-slip stress regime (SHmax > Sv ~ Shmin) with anroximately east-west SHmax orientationwhich is consistent withrcoring measurements and focal mechanism solutions ofthquakes, but it is slightly different from surface neotectonicuctures that would be interpreted to have formed in reverseess regime. Finally, we show some implications of our deter-ned stress in the risk of fault/fracture reactivation and boreholebility in the region.
Geological setting and neotectonics of the Darling Basin
The Darling Basin is one of the largest onshore sedimentaryins in Australia that covers an area of over 100.000 km2 instern New South Wales (Fig. 1), (Cooney and Mantaring, 2007).e Late Cambrian (or Silurian) to Early Carboniferous Darling Ba-accommodated thick sedimentary sequences (mostly Devonian)several sedimentary sub-basins (Figs. 1 and 2) or troughsoney and Mantaring, 2007; Kobussen and Dick, 2011; StewartAdler, 1995).
The basin was probably formed in the Late Cambrian as a mar-al basin over a series of fault blocks along the eastern margin ofndwanaland (Khalifa and Mills, 2014; Stewart and Adler, 1995).merous orogenic events during Palaeozoic affected the tectonicting of the basin (Fig. 2) and changed it to a foreland basin andn to a non-marine sedimentary basin (Khalifa and Mills, 2014;wart and Adler, 1995). Hence, the basin contains a wide rangesediment types from alluvial to open marine (Fig. 2). AlthoughDarling Basin comprises a large area in western New Southles, it has not been explored extensively yet. Several studiese reported that the basin has potential for successful petroleumloration (e.g., Brown et al., 1982; Cooney and Mantaring, 2007;wart and Adler, 1995). For example, Cooney and Mantaring07) explained all elements of a petroleum system in this ba-. In addition, the Darling Basin, along with the Murray andklands basins, has been investigated for potential geothermalrgy generation (HDR, 2010), which highlighted that the heatw in these basins is almost 14% above of the global average forks with similar age.More recently, the basin has been studied for2 storage and the results revealed that some parts of the basiny have potential for carbon storage (Bunch, 2014; Kobussen andk, 2011).The Australian continent is located far away from the Indo-stralian Plate boundaries. However, unlike many intraplate re-ns, numerous studies have revealed that Australia has a high

2;).esseateyedersstalofsti-0;
estntsrk).isin
r-n-l.,itll.
Fig. 1. Location of the study area and wells with respect to the Australian continent. A) is published information about the present-day stress in the region from Heidbach et al.(2010) and Rajabi et al. (2016a). Note that there are five different stress orientations in different basins around the Darling Basin B) Neotectonic features in and around the DarlingBasin, along with the location of the studied wells in the basin. The red beach balls are earthquake focal mechanism solutions from Leonard et al. (2002), while the black beach ballis based on neotectonic fault movements for the Mundi Mundi Fault (Quigley et al., 2006). Green lines show the strike of neotectonic reverse faults in this region from Clark et al.(2012). The background image is the 9s digital elevation model of Australia (Geoscience Australia, 2008). C) Location of studied wells superimposed on the basement map of theDarling Basin region (Pearson, 2003), which clearly shows different troughs and fault-bounded basement highs within the basin. (For interpretation of the references to colour inthis figure legend, the reader is referred to the web version of this article.)
M. Rajabi et al. / Marine and Petroleum Geology 77 (2016) 776e790778
level of neotectonic faulting and seismicity (e.g., Clark et al., 201Hillis et al., 2008; Quigley et al., 2006; Sandiford et al., 2004Several neotectonic faults have been reported in and around thDarling Basin (Table 1), which generally show an east-west streregime (Clark et al., 2012; Quigley et al., 2006). The age of thyoungest deformed sediments by these faults (Table 1) suggest ththey are active in the present-day stress field. For example, Quiglet al. (2006) investigated the Mundi Mundi Fault, in the east of thDaring Basin, and clearly show that the SHmax orientation, inferrefrom field measurements, is approximately east-west (Fig. 1). ThDarling Basin is not seismically active in comparison to the Flindeand SE seismic zones (Hillis et al., 2008) that are located in the weand east of the basin respectively. However, we found three focmechanism solutions of earthquakes with M > 4.5 in the vicinitythe Darling Basin including the White Cliffs event (ML: 5.1), WeWyalong (ML: 4.6) and Temora earthquakes (5.2) that show varable tectonic stress regimes and orientations (Heidbach et al., 201Leonard et al., 2002).
10
It should be noted that almost all the neotectonic faults in thstudy region, and even in the Australian continent, show thrumovement, and that no pure active strike-slip faults have beereported. This is generally suggested to be due to strike-slip faulhaving not built sufficient topography to be distinguished (Claet al., 2012; Geoscience Australia, 2016; Quigley et al., 2006However, Quigley et al. (2006), in an extensive kinematic analyssuggested reverse-oblique fault movement on three major faultsthe vicinity of our study area, including the Mundi Mundi Fault.
3. Methodology used to determine the present-day stressfield of the Darling Basin
The quantification of the present-day stress tensor is an impotant part of petroleum exploration and production because it cotrols both natural and induced fluid flow (Bell, 1996b; Tingay et a2005b; Zoback, 2007). However, due to a lack of essential data,is often not possible to calculate the full stress tensor for each we
1

Forstrbustr201the199bri
3.1
anextcadZoberv
Fig. 2. Generalised stratigraphy of the Darling Basin region modified from Kobussen and Dick (2011). The tectonic events are from Pearson (2003). In this stratigraphy chart theSnake Cave Sandstone (used by Kobussen and Dick (2011)) now is superseded by the Wana Karnu Group, based on the Australian Stratigraphic Units Database (ASUD, 2015).Similarly, the Mootwingee Group is superseded by the Mutawintji Group.
M. Rajabi et al. / Marine and Petroleum Geology 77 (2016) 776e790 779
example, there are approximately 2250 wellbores with reliableess orientations in the World Stress Map database release 2008,t only 38 of these wells are assigned with a stress magnitude andess regime information (data extracted from Heidbach et al.,0). There are several methods to calculate the parameters ofstress tensor in petroleumwells (e.g., Amadei and Stephansson,7; Bell, 1996a; Engelder, 1993; Zoback, 2007). In this section weefly describe the methods which we applied in this study.
102
. Orientation of maximum horizontal stress
The orientation of maximum in-situ horizontal stress (SHmax) isimportant component of the stress tensor which has receivedensive attention in the petroleum industry in the last two de-es (Barton and Moos, 2010; Bell, 1996b; Tingay et al., 2005b;ack, 2007). It is a key parameter in fluid flow in fractured res-oirs (Barton et al., 1995; Finkbeiner et al., 1997b; Sibson, 1996),

3;b;gnax
esredll-inh,r-llb)es).
s,nalnr-oesi-d
nsse
Table 1Neotectonic features in and around the Darling Basin region (Geoscience Australia, 2016). These young geological structures show a predominantly reverse faulting stressregime. The confidence levels are from Geoscience Australia's ranking criteria for neotectonic faults based on demonstrable evidence of neotectonic movement (GeoscienceAustralia, 2016), in which A-level shows definite neotectonic feature, B- and C-levels are probable and possible neotectonic features.
Feature name Length Displacement Sense of movement Average strike Dip direction Age of the youngest deformed deposit Confidence level
Iona Ridge 96.2 65 Reverse 202 West Pliocene AKantappa Scarp 88 30 Reverse 357 East Quaternary AKinchega Scarp 21.9 20 Unknown 33 Unknown Early Pleistocene BMundi Mundi Fault 160 100 Reverse 11 East Pleistocene ANeckarboo Ridge 186 30 Reverse 216 West Pliocene AWalgett Scarp 34.5 4 Reverse 154 Southwest Quaternary C
M. Rajabi et al. / Marine and Petroleum Geology 77 (2016) 776e790780
borehole stability (Hillis and Williams, 1993; Moos et al., 200Zoback, 2007) and hydraulic fracture stimulation (Bell, 1996Seidle, 2011). Interpretation of stress-induced failures, includinbreakouts and DIFs, in borehole image logs is the most commomethod in petroleum wells to determine the orientation of SHm(Bell, 1996a; Bell and Gough, 1979; Zoback, 2007).
Borehole breakouts, which are spalling of rocks on opposite sidof the wellbore wall, form in those parts of the borehole whecircumferential stress exceeds compressive rock strength (Bell anGough, 1979; Kirsch, 1898). This causes an oval shape for the webore (in cross section) in which the long axis orients in the Shmorientation perpendicular to the SHmax orientation (Bell and Goug1979; Kirsch, 1898), (Fig. 3). However, DIFs form where circumfeential stress is less than tensile rock strength in the borehole wa(Aadnoy, 1990; Barton and Moos, 2010). The DIFs are two (suvertical fractures parallel to the wellbore axis on the opposite sidof the boreholewall (Fig. 3), (Aadnoy,1990; Barton andMoos, 2010
Fig. 3. Borehole failure characteristics and examples used in this study to determine thMena Murtee-1 and Tiltagoonah-1 respectively. As illustrated, the BOs (a and b) are orthblock diagram is modified from Anderson et al. (2003).
10
In this study we interpreted three borehole image logincluding two Compact Microimager (CMI) logs and one FormatioMicroimager (FMI) log (Table 2). Both CMI and FMI are electricimage logs which provide a picture of the borehole wall based oresistivity contrast of rock and fluids. Hence, breakouts are intepreted as pair of enlarged conductive zones while DIFs are twparallel and conductive fractures that are developed on both sidof the wellbore that are separated from each other by approxmately 180�. Fig. 3 shows examples of these features in the studiewells in the Darling Basin.
3.2. Vertical stress magnitude
The magnitude of vertical stress (Sv, lithostatic or overburdestress) is, generally assumed to be the easiest component of stretensor to determine (Bell, 1996a; Tingay et al., 2003) since it can bcalculated by integration of density logs:
e orientation of maximum horizontal stress (SHmax). The CMI and FMI examples are fromogonal to the SHmax direction while DIFs (c and d) are parallel to SHmax in a vertical well. The
3

Sv
whgra
denronspu‘detoMostr
3.3
inctes20(XL
perwewedetwiLeaisocrecomstowh(AdXLleafraetTilt
surpreFig
offoveHouse(Ad20areorhen199doest
Shm
Table 2Location of studied wells and other in-situ stress measurements in the Darling Basin region. Studied wells are those that indicated by having BO (breakout) or DIF (drilling-induced fracture) type of stress measurements. The Q (quality), count (number of stress indicators in each well), total length and S.D. (standard deviation) are included for eachwell, as recommended for using the World Stress Map (WSM) ranking system (Heidbach et al., 2010) to investigate the reliability of our stress measurements. The depth ofWhite Cliffs focal mechanism solution (FMS) is uncertain, as different sources show a range of 2e10 km (Leonard et al., 2002). In addition, the quality of two overcoring (OC)measurements (ZC Mine Broken Hill and North Broken Hill) were reassessed herein based on the WSM criteria and classified as C-quality (Hillis and Reynolds, 2003;Worotnicki and Denham, 1976).
Location Long. Lat. SHmax Azimuth (deg) Type Regime Q Depth (km) Count Total length (m) S.D. (deg)
Orientation Regime
Nyngynderry 1 143.306 �32.27 99 BO U A 1.4315 NA 158 584 12Mena Murtee 1 143.2 �31.246 88 BO TS A 1.791 0.753 81 157 4Tiltagoonah 1 144.758 �31.257 103 BO TS C 1.1665 0.568 17 24 5Tiltagoonah 1 144.758 �31.257 99 DIF TS D 1.03 0.568 10 6 10Mena Murtee 1 143.2 �31.246 96 DIF TS C 1.793 0.753 16 24 4Nyngynderry 1 143.306 �32.27 86 DIF U D 1.88 NA 5 6.7 13.5White Cliffs 143.52 �30.08 65 FMS NS C 2e10
(?)2e10 (?) e e e
Cobar/NSW 145.82 �31.5 98 OC TS B 0.439 0.439 e e 15ZC Mine Broken Hill 141.15 �31.95 77 OC TS C 0.743 0.743 e e 25North Broken Hill 141.43 �31.97 89 OC TS C 1.258 1.258 e e 11
M. Rajabi et al. / Marine and Petroleum Geology 77 (2016) 776e790 781
¼Zz
0
rðzÞg dz (1)
ere r (z) is the density, z is depth and g is acceleration due tovity (~9.81 ms-2).The studied wells in the Darling Basin are vertical wells and thesity logs are available from the near surface. We applied envi-mental corrections on the density logs in order to removerious data bya combinationoffilteringmethods such asusing thensity log correction curve’ (DRHO) and using caliper logs in orderremove unreliable density data particularly in washout zones.re details about density data conditioning methods and verticaless magnitude determination can be found in Tingay et al. (2003).
3.4
untheZobmeadd199usewe
forreoWitioXLHu
sqq
Whpre
Shm
SHm
Whis p
. Magnitude of minimum horizontal stress
There are several methods to determine the magnitude of Shminluding hydraulic fracturing tests, leak-off tests and mini-fracts (Addis et al., 1998; Bell, 1996a; Lee et al., 2004; White et al.,02). In this study we interpreted extended leak-off testsOT), which are summarized briefly below.Leak-off tests (LOT) are a ‘pumping pressure test’ primarilyformed below casing to estimate the upper limit of the mudight that can be used during drilling without fracturing thellbore wall (Addis et al., 1998; White et al., 2002), as well as forermining the maximum pore pressures that can be safely drilledthout compromising wellbore safety during a drilling ‘kick’.k-off tests involve increasing the mud pressure in an open andlated section of wellbore, below the casing shoe, in order toate a small tensile fracture (Bell, 1996a). The XLOTs are a moreprehensive and longer leak-off test in which pumping is not
pped immediately after the leak-off pressure is observed, andich is primarily conducted to obtain a fracture closure pressuredis et al., 1998; Bell, 1996a; Li et al., 2009; White et al., 2002). AOT will consist of one (and often two or more) complete cycles ofk-off, formation breakdown, fracture propagation, shut-in andcture closure (Addis et al., 1998; Bell, 1996a; Li et al., 2009;Whiteal., 2002). Fig. 4 shows the XLOT pressure-time data from theagoonah-1 well, with the XLOT stages marked.Depending on the type of the test (LOT or XLOT), leak-off pres-e (LOP), instantaneous shut-in pressure (ISIP) or fracture closuressure (FCP) can be used to estimate the magnitude of Shmin (see. 4 for the difference between these points). In general, the leak-
104
pressure is less reliable for estimating Shmin, and tends to slightlyr-estimate Shmin (Bell, 1996a; Breckels and van Eekelen, 1982).wever, when XLOT data is available, both FCP and ISIP can bed to provide more reliable information for calculation of Shmindis et al., 1998; Enever et al., 1996; King et al., 2008;White et al.,02). Particularly the FCP information from the subsequent cyclesmore reliable than the first cycle because the FCP of the secondthird cycles has removed the effect of tensile rock strength andce provide more accurate estimation of Shmin magnitude (Bell,6a). In this study, we use the FCP, interpreted with theuble-tangent method, derived from the third cycle (see Fig. 4) toimate the magnitude of Shmin as following:
in ¼ FCP þ ðmud weight � Depth � 9:81Þ (2)
. Magnitude of maximum horizontal stress
Estimation of the SHmax magnitude is the most difficult andcertain component of the stress tensor to determine becausere is no direct method to measure SHmax magnitude (Bell, 1996a;ack, 2007). Instead, it is common practice to utilise multiplethods to both constrain and estimate the SHmax magnitude usingitional information and assumptions (Amadei and Stephansson,7; Bell, 1996a; Cornet, 2015; Zoback, 2007). In this study, wed three methods to estimate the magnitude of SHmax in twolls of the Darling Basin.SHmax estimates from extended leak-off tests: the XLOTcan be usedestimation of SHmax magnitude from fracture initiation and/orpening pressure (Haimson and Fairhurst, 1967; Hubbert andllis, 1957). The minimum hoop or circumferential stress rela-nship around a vertical well, where the tensile failure during andOT has occurred, can be summarized as following (Bell, 1990;bbert and Willis, 1957):
min ¼ 3Shmin � SHmax � Pw � Pp � T (3)
ere Pw is wellbore fluid pressure at fracture initiation, Pp is poressure and T is tensile rock strength.Assuming that XLOT fracture closure pressure (FCP) is equal toin, Equation (3) can be rewritten based on the XLOT parameters:
ax ¼ 3FCP � LOP � Pp � T (4)
ere the LOP is fracture initiation pressure (leak-off pressure), Ppore pressure and T is tensile rock strength.

minh.ddes:
5)
c-mselter
6)
aloflt.d
7)
dasteegisg
ofeeh,eedeFsdinti-ckk,
ss
Fig. 4. An example of an extended leak off test (XLOT) and its terminology from one of the studied wells (Tiltagoonah-1). In this XLOT pressurising continued beyond the leak-offpressure in three cycles. The double tangent method was implemented to determine the FCP. Note the decrease of FCP from the first cycle to the third one.
M. Rajabi et al. / Marine and Petroleum Geology 77 (2016) 776e790782
In this equation, all the parameters except T can be found frothe XLOT pressure records (Fig. 4). In the studied wells and eventhe Darling Basin there is no information about tensile strengtHowever, the fracture reopening pressure (Pr) of XLOT can be usebecause the rock tensile strength has already been overcome, anreduced to near zero during the fracture re-opening cycl(Bredehoeft et al., 1976). Hence, Equation (4) can be rewritten as
SHmax ¼ 3FCP � Pr � Pp (
SHmax estimation from frictional limit theory: The theory of fritional limits assumes that the ratio of maximum to minimueffective stress cannot be more than the stress required to caufaulting on an optimally oriented, cohesionless, pre-existing fauplane (Sibson, 1974). The frictional limit to stress is given by Jaegand Cook (1979) as following:
S1 � PpS3 � Pp
���
1þ m2�1
2 þ m
�2(
Where S1 and S3 are the maximum and minimum principstresses respectively, Pp is pore pressure and m is coefficientfriction on an optimally oriented, cohesionless, pre-existing fauBy using a standard value of 0.6 for m, Equation (6) can be simplifieto (Byerlee, 1978; Zoback and Healey, 1984):
S1 � PpS3 � Pp
� 3:12 (
10
With the assumption of the stress tensor, S1¼SHmax anS3¼Shmin in a strike-slip stress regime, S1¼Sv and S3¼Shmin innormal faulting stress regime and S1¼SHmax and S3¼Sv in a thrufaulting stress regime. This method provides the upper limit for thmagnitude of SHmax, though can yield a good estimate of thmaximum principal stress magnitude in regions of active faultin(McGarr, 1980; Tingay et al., 2009; Zoback and Healey, 1984). Thapproach implicitly assumes that the crust contains pre-existinfaults and fractures of all orientations.
SHmax estimation from the occurrence of DIFs: the presencesstress-induced failures, including DIFs and breakouts, that providthe orientation of SHmax can also be used to estimate the magnitudof SHmax if the rockmechanical properties is known (Bell andGoug1979; Zoback, 2007). As described above, DIFs forms when thcircumferential stress is less than tensile strength of the rock in thborehole wall (Aadnoy, 1990; Barton and Moos, 2010; Brudy anZoback, 1999). The formation of DIFs has the similar concept to thcreation of tensile fracture during the XLOT but the initiation of DIis caused by the static mud column. Hence, Equation (3) can be useto estimate SHmax for those intervals that the DIFs are observedimage logs of vertical wells. The only unknown parameter to esmate the magnitude of SHmax in Equation (3) is the tensile rostrength which can be assumed to be negligible (Brudy and Zobac1999; Nelson et al., 2005; Wiprut et al., 1997).
3.5. Pore pressure
Pore pressure (Pp) is an important component of the stre
5

teneffThcoltarnuSwbouwekepflolinweappFurtesThavawe
4.
4.1
thrandwiweStrtheovepumeove(HeDean20orieas(Ta
SHmproanaaccfoutioonC-qexpcallenRaysigSHmoffbasbasoriclacatschinc
(20
menua gproorimerepetresStrcomRajatcongridefitoandThfulnatme(20
DaoridecstuwilocoriReyoridifThrecwhenc
traFuroldoriSpetheinfentetthewhthethe199CoslidstuneoQuSanstretrecrel
M. Rajabi et al. / Marine and Petroleum Geology 77 (2016) 776e790 783
sor, which is required to calculate stress magnitudes and theective stresses (Hubbert and Rubey, 1959; Tingay et al., 2009).e hydrostatic Pp is the pressure produced by the weight of staticumn of fluid (Mouchet and Mitchell, 1989). The Pp in sedimen-y basins is not always on the hydrostatic condition due tomerous sources (Mouchet and Mitchell, 1989; Osborne andarbrick, 1997). The easiest method to estimate the (uppernd of) Pp in petroleum wells is to assume that drilling mudight is a proxy for pore pressure, because drilling mud is usuallyt slightly greater than Pp in order to prevent subsurface fluids
wing into wells whilst maximising rate of penetration and dril-g efficiency (Mouchet and Mitchell, 1989; Tingay, 2015). Hence,use the mud weight in the study wells to estimate theroximate Pp in the intersected formations of the Darling Basin.thermore, a drill stem test (DST), which is a transient pressurets and provides the most reliable information of the Pp (Morton-ompson and Woods, 1992; Mouchet and Mitchell, 1989) isilable in one of the studied wells that warrants the use of mudight method.
Results and discussion
. The orientation of SHmax
Over four kilometres of electrical borehole image logs fromee vertical wells were analysed for interpretation of breakoutsDIFs in the Darling Basin. A total of 256 breakouts and 31 DIFs
th a combined length of 801.7 mwere interpreted in the studiedlls (Table 2). All the results were classified based on the WorldessMap ranking system (Heidbach et al., 2010), and indicate thatwells in the Darling Basin have reliable SHmax orientations withrall low standard deviation (Table 2). There were no priorblished stress orientation data available in Darling Basin sedi-nts prior to this study, though there is data from three shallowrcoring tests undertaken in primarily metamorphic sequencesidbach et al., 2010; Hillis and Reynolds, 2003; Worotnicki andnham, 1976) and an earthquake focal mechanism solution fromevent in August 1996 in the White Cliffs region (Leonard et al.,02), (see Fig. 1 for the location). Our new compilation of SHmaxentation for the Darling Basin region clearly shows a prevailingt-west orientation of the SHmax orientation for this areable 2).We applied two statistical approaches to evaluate the averageax orientation in the Darling Basin region, namely the stressvince method (Hillis and Reynolds, 2003) and wavelengthlysis (Heidbach et al., 2010). In order to define a stress provinceording to Hillis and Reynolds (2003), there should be at leastr A-C quality SHmax data records in a distinct geographic loca-n. In the next step the SHmax data records were weighted basedtheir quality inwhich A-quality receive a weight of four down touality that receive a weight of two. The circular statistics,lained by Mardia (1972) and Davis (2002), have been used toculate the mean SHmax orientation, standard deviation and thegth of resultant vector (R-value) for the stress data. Then, theleigh test (Mardia, 1972) was applied on the data to evaluate thenificance of the mean SHmax orientation. Finally, the number ofax data records and the calculated R-value is compared to cut-values of Mardia (1972) to classify the Darling stress provincesed on Hillis and Reynolds (2003) classification. The results,ed on eight A-C quality data, indicate that the mean SHmax
entation in the region is 091� ±11� and R-value of 0.93, which isssified as a ‘Type 1’ (most reliable) regional average stress indi-or, based on the Hillis and Reynolds (2003) classificationeme. A detailed explanation about the concept of stress prov-es can be found in Hillis and Reynolds (2003) and Rajabi et al.
106
16b).Wavelength analysis aims to determine the spatial pattern ofan SHmax orientation over a particular region according to thember and quality of the observed stress data; and the distance torid point (Heidbach et al., 2010; Reiter et al., 2014). This methodvides a smoothed stress map that shows the mean SHmaxentation (at a grid point), its reliability and thewavelength of thean SHmax. The wavelength is shown by different colour thatresents the spatial consistency of the stress pattern (Heidbachal., 2010; Reiter et al., 2014). In this paper, we incorporated theults of this study with all Australian stress data in the Worldess Map database (Heidbach et al., 2010) as well as a recentlypiled stress database for Australia (Brooke-Barnett et al., 2015;
abi et al., 2016a, 2016b) to calculate the mean SHmax orientationa spatial resolution of 0.5 � 0.5� for whole the Australiantinent. In this method, a node geometry based on the specifiedd (in our case 0.5�) is first defined over Australia. Then, wened a search radius of 1000 kmwhich is decreased step by step100 km. The mean SHmax orientation is calculated at each stepchecked to see whether the standard deviation is less than 25�.
is loop is recalculated over and over until the largest diameterfils our criterion (standard deviation � 25�). A detailed expla-ion about the methodology of the stress wavelength analysisthod can be found in Heidbach et al. (2010) and Reiter et al.14).Fig. 5 illustrates the results of wavelength analysis over therling Basin region, which shows a consistent east-west SHmax
entation in the study area. Furthermore, there is a gradualrease of the stress pattern wavelength from west to east in thedy area (Fig. 5 compares the long wavelength in thewestern sideth short wavelength in the eastern side). Hence, the basin isated in a transition zone from a long to a short wavelength stressentation, which is consistent with previous studies wherenolds et al. (2005) proposed that the dominant east-westentation of the SHmax in the Cooper-Eromanga Basins is due toferent plate boundary forces around the Indo-Australian Plate.e wavelength analysis results herein are also consistent withent studies in onshore basins throughout New South Wales,ich demonstrate significant perturbation of stress due to pres-e of geological structures (Hillis et al., 1999; Rajabi et al., 2016a).The present-day stress orientation is often compared and con-sted to major neotectonic structures, such as faults and folds.thermore, fault slip and volcanic vent alignments that are noter than Quaternary is usually used as indicators of the SHmaxentations in the World Stress Map database (Angelier, 1984;rner et al., 2003; Ziegler et al., 2016; Zoback, 1992). In general,re is often good consistency between the SHmax orientationerred from neotectonic structures, and present-day stress ori-ations (e.g., Hillis et al., 2008; Quigley et al., 2006; Sandifordal., 2004; Sperner et al., 2003; Ziegler et al., 2016). However,re are also notable examples of ‘non-Andersonian’ structures, inich present-day stress orientation contrasts significantly fromorientation suggested by neotectonic structures, such as alongSan Andreas and Great Sumatra faults (Mount and Suppe, 1987,2; Zoback et al., 1987); low-angle normal faults (Collettini, 2011;llettini and Sibson, 2001; Wernicke, 1981, 1995) and gravitying/gliding features (Tingay et al., 2012). In Australia, numerousdies have highlighted the consistency of present-day stress withtectonic structures (e.g., Clark et al., 2012; Hillis et al., 2008;igley et al., 2006; Sandiford et al., 2004). For example,diford et al. (2004) correlated the orientation of present-dayess in southeastern Australia with neotectonic structures. Hillisal. (2008) show the consistency of the SHmax pattern withent tectonic structures in passive margins of Australia. The cor-ation of SHmax orientation determined from recent tectonic

een-alals-
at.e.STgeorel)a/emen-a.1);at).e
e-hdrd
).ssb-6).ear-ealnttematy
ti-ssgeip
ine.s-o-tsicin
o-dgss
Fig. 5. The present-day stress map of the Darling Basin region with the mean SHmax orientation on a 0.5� grid (black lines) based on wavelength analysis of stress using A-C qualitydata records based on the World Stress Map quality ranking scheme, including quality and distance weighting (see Heidbach et al., 2010). The largest radii that fulfil the confidencecriteria (standard deviation of <25� and data records n � 4) are colour coded to show the wavelength of the stress pattern in the region. The orientation of reverse faultingneotectonic features in the study area (green lines) is consistent with the present-day SHmax orientation. (For interpretation of the references to colour in this figure legend, thereader is referred to the web version of this article.)
M. Rajabi et al. / Marine and Petroleum Geology 77 (2016) 776e790784
structures with wellbore data is particularly important in thDarling Basin, which is an old sedimentary basin located in thcentral part of Australia, far away tectonic plate margins. The cosistency of SHmax orientation fromwellbore data and the geologicinformation (i.e. neotectonic features) highlights the potentiusefulness of recent tectonic structures in geomechanical assesments of geo-reservoirs.
4.2. Pore pressure, stress magnitudes and tectonic stress regime
Pore pressure (Pp) estimated from mud weights indicates ththe Pp is probably at, or close to, hydrostatic in the studiedwells (iMena Murtee-1 and Tiltagoonah-1). This is confirmed by the Ddata in Mena Murtee-1 (Fig. 6), and is as expected given the old aof the basin, relatively shallow study depths, and lack of any majrecent depositional events (Osborne and Swarbrick, 1997). Thmagnitudes of the Sv and Shmin at 0.75 km below ground level (bgin the Mena Murtee-1 are 17.4 and 18.4 MPa (23.2 and 24.5 MPkm) respectively. While the lower and upper bounds for thmagnitude of SHmax in this well are 27.8 and 38.7 MPa at 0.75 kbgl respectively (37.1 and 51.6 MPa/km respectively; Fig. 6). Thcircumferential stress modelling for the occurrence of DIFs idicates that the magnitude of SHmax is 49.5 MPa/km in MenMurtee-1. In Tiltagoonah-1 the Sv and Shmin magnitudes are 14and 15 MPa at 0.57 km bgl (24.7 and 26.3 MPa/km respectivelyand the SHmax magnitude ranges between 23.7 and 31.7 MPa0.57 km bgl in this well (41.5 and 55.6 MPa/km respectively; Fig. 6In addition, the magnitude of SHmax in Tiltagoonah-1 using thpresence of DIFs was estimated to be 54 MPa/km.
The results of stress magnitudes in the studied wells is prsented in Fig. 6, and indicates that Sv and Shmin are close to eacother in both wells, suggesting a transition between thrust anstrike-slip stress regime (SH > Sh ~ Sv) based on the standa
10
Andersonian stress regime classification (Anderson, 1905Furthermore, the results show large differential horizontal stremagnitude in the studied wells, which is consistent with the pulished data in the Cooper-Eromanga Basins (Reynolds et al., 200located approximately 450 km to the northeast of our study area
Three shallow engineering stress measurements, from thovercoring method, in the Darling Basin region also indicatetransition between thrust and strike-slip stress regime. The ovecoring measurement in the Cobar area shows a value of 1.7 for thk-ratio (the ratio betweenmean horizontal stresses and the verticstress) at depth of 0.44 km. Two further overcoring measuremeeast of the Darling Basin (Broken Hill region, see Table 1) indicathat the k-ratio decreases with increasing depth (k ¼ 1.5 at 0.74 kdepth in the ZC Mine Broken Hill and k ¼ 1.37 at 1.26 km depthNorth Broken Hill). The decrease in k-ratio with depth indicated bovercoring tests is further support of the stress magnitude esmates from the three petroleum wells herein. Hence, all stremeasurements available in the region to date indicate a chanfrom a shallow thrust faulting stress regime to deeper strike-slfaulting stress regime below a depth of ~900 m.
As outlined in the previous sections, the neotectonic featuresthe study area are reverse or thrust fault scarps on the surfacWhilst these faults indicate horizontal stress orientations consitent with other measurements, the comparison of these netectonic features with present-day stress measurement highlighsome important issues about the usefulness of neotectongeological structures for indicating the present-day stress regimegeomechanical models.
i. There appears to be an inconsistency between surface netectonic faulting (suggesting a thrust faulting stress regime) anstress magnitudes from petroleum and shallow engineerindata that indicate a borderline thrust/strike-slip faulting stre
7

ii.
strBustunec201mofoupreetAu20(Kibesou
Fig. 6. Stress profile of the studied wells showing all components of the contemporary stress tensor, including magnitude of stresses and the orientation of maximum horizontalstress (SHmax). Black bars in the right side of each plot show the depth coverage of image log data, while red and blue points show the location of borehole breakouts and drillinginduced tensile fractures respectively. Rose diagrams are the mean orientation of SHmax in each well. (For interpretation of the references to colour in this figure legend, the reader isreferred to the web version of this article.)
M. Rajabi et al. / Marine and Petroleum Geology 77 (2016) 776e790 785
regime, with a deeper strike-slip stress regime. However, thisdiscrepancy probably highlights the change of stress regimeswith depth in the region from a thrust stress regime in theshallow depths to strike slip in the deeper parts. Indeed, achange in relative stress magnitudes from a shallow thrustregime to a deeper strike-slip regime, and sometimes an evendeeper normal faulting stress regime, has been reported innumerous different studies. For example, Heidbach andReinecker (2013) showed a similar change of stress regimewith depth in northern Switzerland. Rasouli et al. (2013) in anexploration well in the Perth Basin, Western Australia found areverse stress regime in the shallower intervals (less than900 m) which tends to be a predominant strike-slip regime inthe deeper intervals. More recently, Brooke-Barnett et al. (2015)reported the changes in stress regime from thrust to strike-slipwith depth in the Bowen-Surat Basins in eastern Australia.It should also be noted that it is possible that the neotectonicfeatures in the study area occurred in a transition betweenthrust and strike-slip stress regime, rather than pure thrustfaulting stress regime. Quigley et al. (2006) suggested a reverse-oblique fault movement for three fault scarps in the FlindersRanges in the vicinity of our studied area, whereas structures inthis region had previously been considered to only thrustfaulting. Furthermore, it can be very difficult to identify oblique
108
or strike-slip motion on surface features, as these motions donot build significant topography. Hence, it is possible thattranspressive structures may be misidentified as purely thrustfaulting features. Indeed, it is interesting to note that no pureactive strike-slip faults have been reported in the neotectonicdatabase of Australia, despite the likelihood that such structuresexist (Clark et al., 2012; Geoscience Australia, 2016; Quigleyet al., 2006).
Both situations described above indicate that young geologicaluctures can provide useful information about the stress regime.t, it should be noted that ‘depth’ is an important factor for thedy of the stress regimes, because the stress regime is notessarily constant at different depths (Brooke-Barnett et al.,5; Heidbach and Reinecker, 2013; Zang et al., 2012). Further-re, it should be noted that there are many studies that havend significant differences between neotectonic structures andsent-day stress magnitudes, such as in onshore Brunei (Tingayal., 2005a); the Otway and Gippsland basins of Southeaststralia (King et al., 2012; Nelson and Hillis, 2005; Nelson et al.,06; van Ruth et al., 2006) and Perth Basin of Western Australiang et al., 2008; Rasouli et al., 2013). Thus, particular care shouldtaken when using surface geological structures as the onlyrce of stress regime information for geomechanical models, as

ss
ntol.,t,),w
el.,ayogsktochtostnindm
M. Rajabi et al. / Marine and Petroleum Geology 77 (2016) 776e790786
surface faulting may not directly be indicative of deeper streregimes.
5. Implications for petroleum, geothermal exploration andproduction of the Darling Basin
5.1. Implications for enhancing reservoir productivity
Faults and fractures that are favourably aligned for reactivatiounder the present-day stress regime have been demonstratedhave greater ability to flow subsurface fluids (e.g., Barton et a1995; Finkbeiner et al., 1997a; Hillis, 1997). Indeed, this concepsometimes referred to as ‘structural permeability’ (Sibson, 1996has been well documented in petroleum reservoirs, with fluid flo
Fig. 7. Reactivation risk plots for the estimated stress state in Tiltagoonah-1 and Menmagnitude (SHmax) while the bottom plots are according to upper bounds of SHmax magni1 respectively. The red colours show high likelihood of faults/fracture reactivation and oto the Griffith-Coulomb failure envelope on the Mohr Circle. While the blue colours repstate. Our interpreted fractures and faults in image log are shown as pole to planes (blackfractures and faults regardless of their conductivity are prone to be reactivated in the preach diagram are highly prone to be reactivated. (For interpretation of the references t
10
being commonly enhanced in directions sub-parallel to thpresent-day maximum horizontal stress direction (Heffer et a1997; Heffer and Lean, 1991). The control of the present-dstress on subsurface fluid flow is particularly important for twpetroleum exploration and production issues, namely; enhancinproduction in naturally fractured reservoirs and assessing the riof fault seal breach. Whilst it is common in reservoir engineeringuse a stochastically populated fractured reservoir model, sumodels treat all fracture orientations as equal, and do not take inaccount that fractures suitably oriented for reactivation are mofavourably targeted for enhanced hydrocarbon production (Bartoet al., 1995; Sibson, 1996). Conversely, there are many instanceswhich potential hydrocarbon prospects have been compromiseand rendered uneconomic due to recent fault seal breach fro
a Murtee-1. The top plots are based on the lower bound of maximum horizontal stresstude. The plots are drawn at depth of 0.57 and 0.75 km for Tiltagoonah-1 and Mena Murtee-rientation of potential fracture generation based on the distance of the effective stress stateresent the low likelihood of reactivation for all possible fractures in the present-day stress: open fractures, grey: closed fracture and white: faults). As can be seen, most of interpretedesent-day stress regime. Particularly those fracture/faults that are in the circled regions ono colour in this figure legend, the reader is referred to the web version of this article.)
9

neoetentrisknathydpotHil
Cirriskshosinwisusrea(relowatturthetheincforthein
arethadic
HoabltivandRajimreais asucreg
5.2
enhreqimprotiobreplaaddhotraZobsueredWiImwe
Fig.regidiff
M. Rajabi et al. / Marine and Petroleum Geology 77 (2016) 776e790 787
tectonic fault reactivation (e.g., Jones and Hillis, 2003; Mildrenal., 2002, 2005). Hence, a comparison of existing fracture ori-ations with contemporary stresses can be used to examine theof present-day fracture reactivation, and thus used to identify
ural fracture populations that should be targeted for enhancedrocarbon production rates, or exploration prospects that shouldentially be avoided due to possible fault seal breach (Jones andlis, 2003; Mildren et al., 2002, 2005).In this study, we used ‘reactivation risk plots’, which use Mohr'scle criterion (Means, 1976; Mildren et al., 2002) to evaluate theof reactivation for all possible fracture orientations. Fig. 7
ws the fracture reactivation stereonet plots for the Darling Ba-wells, with fracture orientations plotted as pole of planes, andth different colours representing the relative ease of fractureceptibility as the amount of pore pressure increase required toctivate a fracture (King et al., 2008; Mildren et al., 2002). Warmd) and cold (blue) colours respectively indicate the highest andest risk of reactivation according to the estimated stress tensorthe given depth. We also interpreted the existing natural frac-es observed on image logs in the studied wells to test whethery are at risk of reactivation in the present-day stress tensor ofDarling Basin. Fig. 7 shows two different scenarios for each well,luding the risk of reactivation in our determined stress regimeslower and upper bounds of SHmax magnitude which show thatmajority of fractures (i.e. those that are plotted as pole of plane
the red zones in Fig. 7) are prone to be reactivated.The observed fractures are primarily oriented in directions thatfavourable for fracture reactivation, and it is interesting to notet most fractures are electrically conductive, which typically in-ates that they are hydraulically conductive and permeable.
8. Different wellbore trajectories and borehole stability issues in the Darling Basin. In theseme is shown as on the boundary on the thrust and strike-slip with two different stress regierential stresses (our results).
110
wever, it should also be noted that many resistive and presum-y closed fractures are also suitably oriented for fracture reac-ation, though these are likely filled with mineralisation (cement)can be considered as ‘stress-insensitive’ (Laubach et al., 2004;
abi et al., 2010). Several faults are also observed on the studiedage logs, and these are also primarily favourably oriented forctivation. If major sealing faults exist in these orientations, therepossibility that existing hydrocarbon traps have been breached,h as during the phases of neotectonic activity that created theional surface faulting.
. Implications for borehole stability
Directional, or deviated, drilling is extremely important forancing the production of hydrocarbon fields, for optimizinguired surface facilities and minimising surface environmentalpact. However, wellbore instability is a major cause of non-ductive time and increased cost in deviated drilling opera-ns. Mechanical collapse of wellbores due to excessive boreholeakout can cause issues such as hole cleaning difficulties, un-nned wiper trips, back-reaming, increased torque and drag,itional surface cutting management and, potentially, stuck pipe,
le collapse, fishing operations and hole abandonment/side-cking (e.g., Hillis and Williams, 1993; Moos et al., 2003;ack, 2007). A critical aspect of reducing wellbore instability is-s is the minimization of shear failure of the wellbore wall, viauction of the maximum circumferential stress (Hillis andlliams, 1993; McLellan and Hawkes, 2001; Zoback, 2007).proved wellbore stability can be achieved by raising the mudight used in drilling, but the amount by which the mud weight
diagrams the orientation of maximum horizontal stress is east-west and the stressme scenarios. The first is low differential stresses and the other one assumes high

k-g1;reee
list-ledal).ofintodlySvaaliseeints.atifinen
ofwalgstinmda,eee
nsteee-e-islyllr-thiccehta-s-h-atc-lylls
dreei-er
ntisdsoo-r-elof
es.
8.ti-e-
&
2.S.,N.,ev.
th
15.
tats
hes.),e-
lts
onec.
1):
2):
v-
ss
tooc.
R.,er0,
o-st.
nsch.
ge
ty:
an
M. Rajabi et al. / Marine and Petroleum Geology 77 (2016) 776e790788
can be raised is limited by the minimum horizontal stress and leaoff pressure, and higher mud weight also negatively affects drillinperformance and rate of penetration (McLellan and Hawkes, 200Moos et al., 1998, 2003). A reduction in shear failure of the wellbocan also be achieved by planning well trajectories to reduce thstress anisotropy acting on the wellbore, and thus reducing thmaximum circumferential stress acting on the borehole wall (Hiland Williams, 1993; Moos et al., 2003). Knowledge of the presenday stress tensor can be used to predict the relative risk of borehobreakout formation on all possible well trajectories, and thus useto identify the most favourable well designs to minimise potentiwellbore instability (Hillis and Williams, 1993; Moos et al., 2003
The Darling Basin is not explored extensively, but the statestress plays an important role in future well planning in this bas(Fig. 8). The full stress tensor determined in this study was usedpredict the risk of borehole breakout formation and associateborehole stability issues. The large differential stresses, particularthe large difference between the SHmax magnitude and both theand Shmin magnitudes, indicate that wellbore instability may bepotentially significant problemwhen drilling wells that are verticor deviated north-south in the Darling Basin (Fig. 8). Indeed, thishighlighted by the large number of breakouts observed in the thrvertical wells drilled to date in the basin, particularlyNyngynderry-1 where we interpreted more than 500 m breakouHence, the stress tensor analysis undertaken herein suggests thwells are less likely to experience wellbore instability issuesdeviated towards the east or west. Furthermore, wells deviatedthis most stable direction are also more likely to intersect thpredominate open fracture sets noted in the previous sectio(Fig. 8).
6. Conclusions
In this study we analysed and determined the componentsthe present-day stress tensor in the Darling Basin, western NeSouth Wales, Australia. The orientation of maximum horizontstress from interpretation of borehole breakouts and drillininduced tensile fractures demonstrate a predominant east-wetrend in the basin, which is consistent with other types of datathe region, such as overcoring measurements, focal mechanissolutions of earthquakes and the palaeo-SHmax orientation inferrefromneotectonic structures. Hence, in the absence of wellbore datneotectonic features are reliable sources of information for thorientation of SHmax even in an old sedimentary basin such as thDarling Basin. The consistency of mean SHmax orientation in thDarling Basin with that observed in the Cooper-Eromanga Basiand Flinders Ranges stress provinces indicates that far-field plaboundary forces are the primary control on stress orientation in thbasin. The magnitude of vertical and horizontal stresses from ptroleum data suggest that a transition between thrust and strikslip stress regime currently exists at shallow depths, and that thtransitions into strike-slip stress regime below approximate900 m depth. The stress regime determined from petroleum wedata is consistent with measurements from nearby shallow ovecoring measurements in primarily basement rocks, as well as wiearthquake focal mechanism solutions. However, the neotectonfault scarps infer a pure thrust faulting stress regime at the surfaand highlights that the surface neotectonic measurements mignot represent the stress tensor at depth. Fracture suitability digrams for our determined stress regime in the studied wells illutrate that fractures and faults striking north-northeast and soutsoutheast, and with any dip greater than 20� (except those thare plotted in the blue zones in Fig. 7), are more prone to be reativated in the current stress regime, and are thus more favourabtargeted for increased reservoir productivity. In addition, we
11
deviated to the east or west are suggested to be more stable, anless prone to costly wellbore instability issues, than wells that adrilled vertically or deviated to the north and south. Hence, wpropose that wells deviated in an approximately east or west drection are both likely to be more stable, and will intersect a highnumber of potentially open and productive natural fractures.
Acknowledgements
The authors gratefully thank the New South Wales Departmeof Resources and Energy for providing the data of this study. Thresearch forms part of ARC Discovery Project DP120103849 anASEG Research Foundation Project RF13P02. The authors alwould like to thank Ikon Science in Adelaide (formerly JRS Petrleum Research) for the use of their JRS suite. The maps are geneated with CASMI (Heidbach and H€ohne, 2008) and GMT (Wesset al., 2013). We also specially thank two anonymous reviewerthis article for their constructive comments.
References
Aadnoy, B.S., 1990. In-situ stress directions from borehole fracture tracJ. Petroleum Sci. Eng. 4, 143e153.
Addis, M.A., Hanssen, T.H., Yassir, N., Willoughby, D.R., Enever, J., 199A Comparison of Leak-off Test and Extended Leak-off Test Data for Stress Esmation, SPE/ISRM Rock Mechanics in Petroleum Engineering. Society of Ptroleum Engineers, Trondheim, Norway, 8e10 July.
Amadei, B., Stephansson, O., 1997. Rock Stress and its Measurement. ChapmanHall, London.
Anderson, E.M., 1905. The dynamics of faulting. Trans. Edinb. Geol. Soc. 8, 387e40Anderson, J., Simpson, M., Basinski, P., Beaton, A., Boyer, C., Bulat, D., Ray,
Reinheimer, D., Schlachter, G., Colson, L., Olsen, T., John, Z., Khan, R., Low,Ryan, B., Schoderbek, D., 2003. Producing natural gas from coal. Oilfield RAutumn 2003, 8e31.
Angelier, J., 1984. Tectonic analysis of fault slip data sets. J. Geophys. Res. Solid Ear89, 5835e5848.
ASUD, 2015. The Australian Stratigraphic Units Database retrieved, October 20http://dbforms.ga.gov.au/www/geodx.strat_units.int.
Bailey, A., King, R., Backe, G., 2012. Integration of structural, stress, and seismic dato define secondary permeability networks through deep-cemented sedimenin the Northern Perth Basin. APPEA J. 52, 455e474.
Barton, C., Moos, D., 2010. Geomechanical wellbore imaging: key to managing tasset life cycle. In: P€oppelreiter, M., Garcia-Carballido, C., Kraaijveld, M. (EdDipmeter and Borehole Image Log Technology. American Association of Ptroleum Geologists Memoir, pp. 81e112.
Barton, C.A., Zoback, M.D., Moos, D., 1995. Fluid flow along potentially active fauin crystalline rock. Geology 23, 683e686.
Bell, J.S., 1990. Investigating stress regimes in sedimentary basins using informatifrom oil industry wireline logs and drilling records. Geol. Soc. London SpPubl. 48, 305e325.
Bell, J.S., 1996a. Petro Geoscience 1. In situ stresses in sedimentary rocks (partmeasurement techniques. Geosci. Can. 23, 85e100.
Bell, J.S., 1996b. Petro Geoscience 2. In situ stresses in sedimentary rocks (partapplications of stress measurements. Geosci. Can. 23, 135e153.
Bell, J.S., Gough, D.I., 1979. Northeast-southwest compressive stress in Alberta eidence from oil wells. Earth Planet. Sci. Lett. 45, 475e482.
Breckels, I.M., van Eekelen, H.A.M., 1982. Relationship between horizontal streand depth in sedimentary basins. J. Petroleum Technol. 34, 2191e2199.
Bredehoeft, J.D., Wolff, R.G., Keys, W.S., Shuter, E., 1976. Hydraulic fracturingdetermine the regional in situ stress field, Piceance Basin, Colorado. Geol. SAm. Bull. 87, 250e258.
Brooke-Barnett, S., Flottmann, T., Paul, P.K., Busetti, S., Hennings, P., Reid,Rosenbaum, G., 2015. Influence of basement structures on in situ stresses ovthe Surat Basin, southeast Queensland. J. Geophys. Res. Solid Earth 124946e4965.
Brown, C.M., Jackson, K.S., Lockwood, K.L., Passmore, V.L., 1982. Source rock ptential and hydrocarbon prospectivity of the Darling Basin. NSW. BMR J. AuGeol. Geophys. 7, 23e33.
Brudy, M., Zoback, M.D., 1999. Drilling-induced tensile wall-fractures: implicatiofor determination of in-situ stress orientation and magnitude. Int. J. Rock MeMin. Sci. 36, 191e215.
Bunch, M., 2014. A live test of automated facies prediction at wells for CO2 storaprojects. Energy Procedia 63, 3432e3446.
Busetti, S., Reches, Z.e., 2014. Geomechanics of hydraulic fracturing microseismiciPart 2. Stress state determination. AAPG Bull. 98, 2459e2476.
Byerlee, J., 1978. Friction of rocks. Pure Appl. Geophys. 116, 615e626.Clark, D., McPherson, A., Van Dissen, R., 2012. Long-term behaviour of Australi
stable continental region (SCR) faults. Tectonophysics 566e567, 1e30.
1

Cob
Col
Col
Coo
CorDavDod
Ene
Eng
Fink
Fink
GeoGeo
Grü
Hai
HD
Hef
Hef
Hei
Hei
Hei
Hei
Hill
Hill
Hill
Hill
Hill
Hub
Hub
Jaeg
Jon
Kha
Kin
Kin
Kirs
Kob
Lau
Lee
Leo
Li, G
Ma
McG
McL
Me
Mil
Mil
Mo
Mo
Mo
Mo
Mo
Mo
Nel
Nel
Nel
Nic
Osb
Pea
Qui
Raja
Raja
Raja
Ras
Reit
Rey
M. Rajabi et al. / Marine and Petroleum Geology 77 (2016) 776e790 789
lentz, D.D., Zhou, S., Hillis, R.R., Richardson, R.M., Sandiford, M., 1998. Topog-raphy, boundary forces, and the Indo-Australian intraplate stress field.J. Geophys. Res. Solid Earth 103, 919e931.lettini, C., 2011. The mechanical paradox of low-angle normal faults: currentunderstanding and open questions. Tectonophysics 510, 253e268.lettini, C., Sibson, R.H., 2001. Normal faults, normal friction? Geology 29,927e930.ney, P.M., Mantaring, A.M., 2007. The petroleum potential of the Darling Basin.In: Munson, T.J., Ambrose, G.J. (Eds.), Central Australian Basins Symposium(CABS). Northern Territory Geological Survey, pp. 216e235. Alice Springs,Northern Territory.net, F.H., 2015. Elements of Crustal Geomechanics. Cambridge University Press.is, J.C., 2002. Statistics and Data Analysis in Geology, third ed. Wiley, New York.son, J., Dodson, T., Schmidt, V., 2004. Gulf of Mexico ‘trouble time’ creates majordrilling expenses: use of cost-effective technologies needed. Offshore 64,46e48.ver, J.R., Yassir, N., Willoughby, D.R., Addis, M.A., 1996. Recent experience withextended leak-off tests for in-situ stress measurement in Australia. APPEA J.528e535.elder, T., 1993. Stress Regimes in the Lithosphere. Princeton University Press,New Jersey.beiner, T., Barton, C.A., Zoback, M.D., 1997a. Relationships Among In-situ Stress,Fractures and Faults, and Fluid Flow, Monterey, Formation, Santa Maria Basin,California.beiner, T., Barton, C.A., Zoback, M.D., 1997b. Relationships among in-situ stress,fractures and faults, and fluid flow: monterey formation, Santa Maria Basin,California. Am. Assoc. Petroleum Geol. Bull. 81, 1975e1999.science Australia, 2008. GEODATA 9 Second Digital Elevation Model (DEM-9S).science Australia, 2016. Neotectonic Features - Geoscience Australia. http://www.ga.gov.au/earthquakes/staticPageController.do?page¼neotectonics.nthal, G., 2014. Induced seismicity related to geothermal projects versus naturaltectonic earthquakes and other types of induced seismic events in CentralEurope. Geothermics 52, 22e35.mson, B., Fairhurst, C., 1967. Initiation and extension of hydraulic fractures inrocks. Soc. Petroleum Eng. J. 7, 310e318.R, 2010. Geothermal Potential in the MurrayeDarling and Oaklands Basins ofNSW, a Report by Hot Dry Rocks Pty Ltd Commissioned by the NSW Depart-ment of Industry and Investment, p. 49.fer, K.J., Fox, R.J., McGill, C.A., Koutsabeloulis, N.C., 1997. Novel techniques showlinks between reservoir flow directionality, earth stress, fault structure andgeomechanical changes in mature waterfloods. SPE J. 2, 91e98.fer, K.J., Lean, J.C., 1991. Earth stress orientation - a control on, and guide to,flooding directionality in a majority of reservoirs. In: Linville, B. (Ed.), ReservoirCharacterization III. PennWell Books, Tulsa, pp. 799e822.dbach, O., H€ohne, J., 2008. CASMIdA visualization tool for the World Stress Mapdatabase. Comput. Geosciences 34, 783e791.dbach, O., Reinecker, J., 2013. Analyse des rezenten Spannungsfeldes derNordschweiz, (Arbeitsbericht NAB 12e05/nagra), Wettingen : Nationale Gen-ossenschaft für die Lagerung radioaktiver Abf€alle (nagra). http://www.nagra.ch/data/documents/database/dokumente/$default/Default%20Folder/Publikationen/NABs%202004-2012/d_nab12-005.pdf.dbach, O., Reinecker, J., Tingay, M., Müller, B., Sperner, B., Fuchs, K., Wenzel, F.,2007. Plate boundary forces are not enough: second- and third-order stresspatterns highlighted in the World Stress Map database. Tectonics 26, TC6014.dbach, O., Tingay, M., Barth, A., Reinecker, J., Kurfeß, D., Müller, B., 2010. Globalcrustal stress pattern based on the World Stress Map database release 2008.Tectonophysics 482, 3e15.is, R.R., 1997. Does the in situ stress field control the orientation of open naturalfractures in sub-surface reservoirs? Explor. Geophys. 28, 80e87.is, R.R., Enever, J.R., Reynolds, S.D., 1999. In situ stress field of eastern Australia.Aust. J. Earth Sci. 46, 813e825.is, R.R., Reynolds, S.D., 2003. In situ stress field of Australia. Geol. Soc. Am.Special Pap. 372, 49e58.is, R.R., Sandiford, M., Reynolds, S.D., Quigley, M.C., 2008. Present-day Stresses,Seismicity and Neogene-to-Recent Tectonics of Australia's ‘Passive’ Margins:Intraplate Deformation Controlled by Plate Boundary Forces. Geological Society,London, pp. 71e90. Special Publications 306.is, R.R., Williams, A.F., 1993. The stress field of the NorthWest Shelf and wellborestability. APPEA J. 33, 373e385.bert, M.K., Rubey, W.W., 1959. Role of fluid pressure in mechanics of overthrustfaulting I. Mechanics of fluid-filled porous solids and its application to over-thrust faulting. Geol. Soc. Am. Bull. 70, 115e166.bert, M.K., Willis, D.G., 1957. Mechanics of hydraulic fracturing. Trans. Am. Inst.Min. Metallurgical, Petroleum Eng. 210, 153e166.er, J.C., Cook, N.G.W., 1979. Fundamentals of Rock Mechanics. Chapman andHall.es, R.M., Hillis, R.R., 2003. An integrated, quantitative approach to assessingfault-seal risk. AAPG Bull. 87, 507e524.lifa, M.K., Mills, K.J., 2014. Seismic stratigraphic analysis and structural devel-opment of an interpreted upper Cambrian to middle Ordovician sequence theNW Blantyre Sub-basin, Darling Basin (western New SouthWales, Australia).J. Petroleum Geol. 37, 163e181.g, R., Holford, S.P., Hillis, R.R., Tuitt, A., Swierczek, E., Back�e, G., Tassone, D.R.,Tingay, M., 2012. Reassessing the in-situ stress regimes of Australia's petroleumbasins. APPEA J. 52, 415e425.
112
g, R.C., Hillis, R.R., Reynolds, S.D., 2008. In situ stresses and natural fractures inthe Northern Perth Basin, Australia. Aust. J. Earth Sci. 55, 685e701.ch, E.G., 1898. Die Theorie der Elastizit€at und die Bedürfnisse der Festigkeit-slehre. Z. Des. Vereines Dtsch. Ingenieure 42, 797e807.ussen, A.F., Dick, S., 2011. Assessment of Crbon Sorage Cpacity in NSW: theSientific Bsis, Ste Slection Citeria and Peliminary Wll Pognoses for RsearchDilling in the Drling Basin, Wstern NSW. NSW Division of Resources & Energy,NSW Department of Trade and Investment, Regional Infrastructure and Ser-vices, p. 25.bach, S.E., Olson, J.E., Gale, J.F.W., 2004. Are open fractures necessarily alignedwith maximum horizontal stress? Earth Planet. Sci. Lett. 222, 191e195., D., Bratton, T., Birchwood, R., 2004. Leak-off test interpretation and modelingwith application to geomechanics. In: 6th North America Rock MechanicsSymposium (NARMS). American Rock Mechanics Association, Houston, Texas,5e9 June.nard, M., Ripper, I.D., Yue, L., 2002. Australian Earthquake Fault Plane Solutions.Geoscience Australia, Record 2002/19.., Lorwongngam, A., Roegiers, J.-C., 2009. Critical review of leak-off test as apractice for determination of in-situ stresses. In: 43rd U.S. Rock MechanicsSymposium & 4th U.S. - Canada Rock Mechanics Symposium. American RockMechanics Association, Asheville, North Carolina.rdia, K.V., 1972. Statistics of Directional Data/K.V. Mardia. Academic Press, Lon-don ; New York.arr, A., 1980. Some constraints on levels of shear stress in the crust from ob-servations and theory. J. Geophys. Res. Solid Earth 85, 6231e6238.ellan, P., Hawkes, C., 2001. Borehole stability analysis for underbalanced drilling.J. Can. Petroleum Technol. 40, 31e38.ans, W.D., 1976. Stress and Strain: Basic Concepts of Continuum Mechanics forGeologists. Springer-Verlag, New York.dren, S.D., Hillis, R.R., Dewhurst, D.N., Lyon, P.J., Meyer, J.J., Boult, P.J., 2005. FAST:a new technique for geomechanical assessment of the risk of reactivation-related breach of fault seals. In: Boult, P.J., Kaldi, J. (Eds.), Evaluating Fault andCap Rock Seals: AAPG Hedberg Series, pp. 73e85.dren, S.D., Hillis, R.R., Kaldi, J., 2002. Calibrating predictions of fault seal rec-tivation in the Timor Sea. APPEA J. 42, 187e202.os, D., Peska, P., Finkbeiner, T., Zoback, M., 2003. Comprehensive wellbore sta-bility analysis utilizing Quantitative Risk Assessment. J. Petroleum Sci. Eng. 38,97e109.os, D., Peska, P., Zoback, M.D., 1998. Predicting the stability of horizontal wellsand multi-laterals - the role of in situ stress and rock properties. In: SPE In-ternational Conference on Horizontal Well Technology. Society of PetroleumEngineers, Calgary, Alberta, Canada, p. 12.rton-Thompson, D., Woods, A.M., 1992. Development Geology ReferenceManual: AAPG Methods in Exploration Series, No. 10. American Association ofPetroleum Geologists, Tulsa, Oklahoma, USA.uchet, J.-P., Mitchell, A., 1989. Abnormal Pressures while Drilling: Origins, Pre-diction, Detection, Evaluation. Editions Technip.unt, V.S., Suppe, J., 1987. State of stress near the San Andreas fault: implicationsfor wrench tectonics. Geology 15, 1143e1146.unt, V.S., Suppe, J., 1992. Present-day stress orientations adjacent to activestrike-slip faults: California and Sumatra. J. Geophys. Res. Solid Earth 97,11995e12013.son, E.J., Hillis, R.R., 2005. In situ stresses of the west tuna area, Gippsland basin.Aust. J. Earth Sci. 52, 299e313.son, E.J., Hillis, R.R., Sandiford, M., Reynolds, S., Mildren, S.D., 2006. Present-daystate-of-stress of southeast Australia. APPEA J. 2006, 283e305.son, E.J., Meyer, J.J., Hillis, R.R., Mildren, S.D., 2005. Transverse drilling-inducedtensile fractures in the West Tuna area, Gippsland Basin, Australia: implica-tions for the in situ stress regime. Int. J. Rock Mech. Min. Sci. 42, 361e371.ol, A., Carne, R., Gerstenberger, M., Christophersen, A., 2011. Induced seismicityand its implications for CO2 storage risk. Energy Procedia 4, 3699e3706.orne, M.J., Swarbrick, R.E., 1997. Mechanisms for generating overpressure insedimentary basins; a reevaluation. AAPG Bull. 81, 1023e1041.rson, P., 2003. Darling Basin SEEBASE™Project. SRK Project Code:MR701. Reportfor the New South Wales Geological Survay (CD-ROM).gley, M., Cupper, M., Sandiford, M., 2006. Quaternary faults of south-centralAustralia: palaeoseismicity, slip rates and origin. Aust. J. Earth Sci. 53, 285e301.bi, M., Sherkati, S., Bohloli, B., Tingay, M., 2010. Subsurface fracture analysis anddetermination of in-situ stress direction using FMI logs: an example from theSantonian carbonates (Ilam Formation) in the Abadan Plain, Iran. Tectonophy-sics 492, 192e200.bi, M., Tingay, M., Heidbach, O., 2016a. The present-day stress field of NewSouth Wales, Australia. Aust. J. Earth Sci. 63, 1e21.bi, M., Tingay, M., King, R., Heidbach, O., 2016b. Present-day Stress Orientationin the Clarence-Moreton Basin of New South Wales, Australia: a New HighDensity Dataset Reveals Local Stress Rotations. Basin Research. http://dx.doi.org/10.1111/bre.12175.ouli, V., Pervukhina, M., Müller, T.M., Pevzner, R., 2013. In-situ stresses in thesouthern Perth Basin at the GSWA Harvey-1 well site. Explor. Geophys. 44,289e298.er, K., Heidbach, O., Schmitt, D., Haug, K., Ziegler, M., Moeck, I., 2014. A revisedcrustal stress orientation database for Canada. Tectonophysics 636, 111e124.nolds, S.D., Coblentz, D.D., Hillis, R.R., 2002. Tectonic forces controlling theregional intraplate stress field in continental Australia: results from new finiteelement modeling. J. Geophys. Res. Solid Earth 107, 1e15. ETG 1-1-ETG.

ssns,
mfor
te
a-
in
ell,
a-
es.
3.ct.
th
ia.
n-ty,
ics
b.ct.
9.m
onm-
O2
pe
ys.
ng10.ns
ssts:in.
h'smd-
apcal
S.,
4.ys.
H.,O.,as
he
M. Rajabi et al. / Marine and Petroleum Geology 77 (2016) 776e790790
Reynolds, S.D., Mildren, S.D., Hillis, R.R., Meyer, J.J., 2006. Constraining stremagnitudes using petroleum exploration data in the CoopereEromanga BasiAustralia. Tectonophysics 415, 123e140.
Reynolds, S.D., Mildren, S.D., Hillis, R.R., Meyer, J.J., Flottmann, T., 2005. Maximuhorizontal stress orientations in the Cooper Basin, Australia: implicationsplate-scale tectonics and local stress sources. Geophys J. Int. 160, 331e343.
Richardson, R.M., 1992. Ridge forces, absolute plate motions, and the intraplastress field. J. Geophys. Res. Solid Earth 97, 11739e11748.
Rutqvist, J., 2012. The geomechanics of CO2 storage in deep sedimentary formtions. Geotechnical Geol. Eng. 1e27.
Sandiford, M., Wallace, M., Coblentz, D.D., 2004. Origin of the in situ stress fieldsouth-eastern Australia. Basin Res. 16, 325e338.
Seidle, J., 2011. Fundamentals of Coalbed Methane Reservoir Engineering. PennWTulsa, Oklahoma.
Sibson, R.H., 1974. Frictional constraints on thrust, wrench and normal faults. Nture 249, 542e544.
Sibson, R.H., 1996. Structural permeability of fluid-driven fault-fracture meshJ. Struct. Geol. 18, 1031e1042.
Sperner, B., Müller, B., Heidbach, O., Delvaux, D., Reinecker, J., Fuchs, K., 200Tectonic Stress in the Earth's Crust: Advances in the World Stress Map ProjeGeological Society, London, pp. 101e116. Special Publications 212.
Stewart, J.R., Adler, J.D., 1995. New South Wales Petroleum Potential. New SouWales Department of Mineral Resources, Sydney.
Tingay, M., 2015. Initial pore pressures under the Lusi mud volcano, IndonesInterpretation 3, SE33eSE49.
Tingay, M., Bentham, P., De Feyter, A., Kellner, A., 2012. Evidence for NoAndersonian Faulting above Evaporites in the Nile Delta. Geological SocieLondon, pp. 155e170. Special Publications 367.
Tingay, M., Hillis, R., Morley, C., Swarbrick, R., Drake, S., 2005a. 'Prograding'tectonin Brunei: Regional Implications for Fault Sealing.
Tingay, M., Müller, B., Reinecker, J., Heidbach, O., Wenzel, F., Fleckenstein, P., 2005Understanding tectonic stress in the oil patch: the World stress map ProjeLead. Edge 24, 1276e1282.
Tingay, M.R., Hillis, R.R., Morley, C.K., King, R.C., Swarbrick, R.E., Damit, A.R., 200Present-day stress and neotectonics of Brunei: implications for petroleuexploration and production. AAPG Bull. 93, 75e100.
11
Tingay, M.R.P., Hillis, R.R., Morley, C.K., Swarbrick, R.E., Okpere, E.C., 2003. Variatiin vertical stress in the Baram Basin, Brunei: tectonic and geomechanical iplications. Mar. Petroleum Geol. 20, 1201e1212.
van Ruth, P.J., Nelson, E.J., Hillis, R.R., 2006. Fault reactivation potential during Cinjection in the Gippsland basin, Australia. Explor. Geophys. 37, 50e59.
Wernicke, B., 1981. Low-angle normal faults in the Basin and Range Province: naptectonics in an extending orogen. Nature 291, 645e648.
Wernicke, B., 1995. Low-angle normal faults and seismicity: a review. J. GeophResearch Solid Earth 100, 20159e20174.
Wessel, P., Smith, W.H.F., Scharroo, R., Luis, J., Wobbe, F., 2013. Generic mappitools: improved version released. Eos. Trans. Am. Geophys. Union 94, 409e4
White, A.J., Traugott, M.O., Swarbrick, R.E., 2002. The use of leak-off tests as meaof predicting minimum in-situ stress. Pet. Geosci. 8, 189e193.
Wiprut, D., Zoback, M., Hanssen, T.-H., Peska, P., 1997. Constraining the full stretensor from observations of drilling-induced tensile fractures and leak-off tesapplication to borehole stability and sand production on the Norwegian margInt. J. Rock Mech. Min. Sci. 34, 365.e361-365.e312.
Worotnicki, G., Denham, D., 1976. The state of stress in the upper part of the eartcrust in Australia according to measurements in mines and tunnels and froseismic observations. In: Symposium on Investigation of Stress in Rock: Avances in Rock Measurment Institution of Engineers, Australia, pp. 71e82.
Zang, A., Stephansson, O., Heidbach, O., Janouschkowetz, S., 2012. World stress mdatabase as a resource for rock mechanics and rock engineering. GeotechniGeol. Eng. 30, 625e646.
Ziegler, M., Rajabi, M., Heidbach, O., Hersir, G.P., �Agústsson, K., �Arnad�ottir,Zang, A., 2016. The stress pattern of Iceland. Tectonophysics 674, 101e113.
Zoback, M.D., 2007. Reservoir Geomechanics. Stanford University, California, p. 46Zoback, M.D., Healey, J.H., 1984. Friction, faulting, and in-situ stress. Ann. Geoph
2, 689e698.Zoback, M.D., Zoback, M.L., Mount, V.S., Suppe, J., Eaton, J.P., Healey, J.
Oppenheimer, D., Reasenberg, P., Jones, L., Raleigh, C.B., Wong, I.G., Scotti,Wentworth, C., 1987. New evidence on the state of stress of the san Andrefault system. Science 238, 1105e1111.
Zoback, M.L., 1992. First- and second-order patterns of stress in the lithosphere: tWorld stress map Project. J. Geophys. Res. Solid Earth 97, 11703e11728.
3

3.4. Paper 4: New Constraints on the Contemporary Stress Pattern
of the Flinders and Mount Lofty Ranges, South Australia
Rajabi, M., Tingay, M., Belton, D., Balfour, N., Bendall, B., 2016. New constraints on the
contemporary stress pattern of the Flinders and Mount Lofty Ranges, South Australia.
Exploration Geophysics, DOI: http://dx.doi.org/10.1071/EG16076.
114

115

116

Rajabi, M., Tingay, M., Belton, D., Balfour, N. & Bendall, B. (2016). New constraints on the contemporary stress pattern of the Flinders and Mount Lofty Ranges, South Australia. Exploration Geophysics, 49(1), 111-124.
NOTE:
This publication is included on pages 117 - 130 in the print copy of the thesis held in the University of Adelaide Library.
It is also available online to authorised users at:
http://dx.doi.org/10.1071/EG16076

3.5. Paper 5: The Present-Day Stress Field of Australia
Rajabi, M., Tingay, M., Heidbach, O., Hillis, R., Reynolds, S., in-review. The present-day
stress field of Australia, Under-review in Earth-Science Reviews. (Submitted: 05/04/2016)
131

132

The present-day stress field of Australia
Authors: Mojtaba Rajabi1*, Mark Tingay1*, Oliver Heidbach2, Richard Hillis3, Scott Reynolds4
1 Australian School of Petroleum, the University of Adelaide, Adelaide, SA 5005, Australia
2 Helmholtz Centre Potsdam, GFZ German Research Centre for Geosciences, Telegrafenberg, 14473
Potsdam, Germany
3 Deep Exploration Technologies Cooperative Research Centre, 26 Butler Boulevard, Burbridge
Business Park, Adelaide, SA 5950, Australia
4 Ikon Science, Asia Pacific, Kuala Lumpur, Malaysia
* Corresponding authors:
Mojtaba Rajabi: Australian School of Petroleum, the University of Adelaide, Adelaide, SA 5005,
Australia
Email: [email protected]
Mark Tingay: Australian School of Petroleum, the University of Adelaide, Adelaide, SA 5005,
Australia
Email: [email protected]
133

Abstract
The present-day tectonic stress field in the Australian continent has been the subject of scientific debate for over 20 years. The orientation of maximum horizontal present-day stress (SHmax) in continental Australia is unlike all other major tectonic plates in that it is not oriented sub-parallel to the absolute plate motion direction. Previous studies on the stress field of Australia revealed that the complex stress pattern of the continent is controlled, at a first-order, by large-scale forces exerted at the plate boundaries. However, prior analysis of the contemporary Australian stress pattern has been unable to model or explain the stress pattern observed in most of eastern Australia, and has not extensively addressed the numerous smaller scale variations in stress orientation. The recent development of unconventional reservoirs in Australia has resulted in a greatly increased amount of new data for stress analysis in previously unstudied or poorly-constrained areas in eastern Australia. In addition, stress analysis in conventional hydrocarbon, mineral and geothermal exploration in all other parts of the continent provides the opportunity to review and update the Australian Stress Map (ASM). This study presents the new release of the ASM, with a total of 2140 stress data records in Australia (increased from 594 data records in 2003). The 2016 ASM contains 1354 data records determined from the interpretation of drilling-related stress indicators, 645 from earthquake focal mechanism solutions, 139 from shallow engineering measurements and two from geological indicators. The results reveal four distinct regional trends for the SHmax orientation in Australia including a NNE-SSW SHmax orientation in northern and northwestern Australia, which rotates to a prevailing E-W direction in most Western and South Australia. The orientation of SHmax in eastern Australia is primarily ENE-WSW and swings to NW-SE in southeastern Australia. A comparison between the new ASM database and neotectonic features further confirms the role of present-day stress in recent deformation of the Australian crust. The new 2016 ASM reveals significant discrepancies between newly observed SHmax orientations and predictions by published geomechanical-numerical models for the Australian continent. Forces generated at the boundary of Indo-Australian Plate remain the primary control on the regional pattern of stress in continental Australia, however, the increased data density, particularly in eastern Australia, reveals numerous local perturbations of the stress field that were not previously clearly captured. Hence, the key findings of the new release are that local (intra-plate) stress sources are more significant than previously recognized, particularly in eastern Australian basins, and cause substantial local scale deviations in the present-day stress pattern that have not been factored into existing Australian stress models.
Keywords: Australian Stress Map, intra-plate stress, plate boundary forces, plate tectonics, stress rotation, neotectonics.
1. Introduction
The contemporary state of stress in the upper part of the Earth’s lithosphere has major implications in various economical, scientific and societal aspects of human’s life (Bell, 1996b; Cornet, 2015; Engelder, 1993; Reiter et al., 2014; Zoback, 2010). The present-day stress field controls neotectonic deformation and seismicity and can be used to better understand earthquakes and seismic recurrence rates (Hillis et al., 2008; Sandiford et al., 2004; Seeber and Armbruster, 2000; Sibson et al., 2011; Sibson, 1992; Sibson et al., 2012; Stein, 1999). The crustal stress is a primary cause of collapse of subsurface structures, and is thus vital knowledge in order to create safe and stable tunnels, mines
134

and boreholes (Bell, 1996b; Zang and Stephansson, 2010; Zoback, 2010). The in-situ stress is the key control on hydraulically induced fractures, and that knowledge of the stress field has been critical in the rapid increase of unconventional hydrocarbon production seen globally, and particularly in the USA, Canada and Australia in the past 10 years (Bell, 1996b; Bell, 2006; Fisher and Warpinski, 2012; King, 2010; Olsen et al., 2007; Palmer, 2010).
Regional compilations of the present-day stress data at continental and plate scales, along with the first phase of the World Stress Map (WSM) project, revealed that plate tectonics forces provide the major controls on the contemporary stress field of the Earth’s lithosphere. These forces are the ‘ridge push’ at mid-ocean ridges, ‘slab pull’ at subduction zones, ‘suction’ at trench zones, ‘resistance forces’ at collision zones, ‘shear traction’ at base of the lithosphere and the ‘gravitational potential energy’ at mountain belts (Coblentz et al., 1995; Coblentz et al., 1998; Ghosh et al., 2009; Ghosh et al., 2006; Hast, 1969; McGarr and Gay, 1978; Müller et al., 1992; Ranalli and Chandler, 1975; Richardson, 1992; Richardson et al., 1979; Sbar and Sykes, 1973; Sykes and Sbar, 1973; Zoback, 1992; Zoback and Zoback, 1980; Zoback et al., 1989). Hence, Zoback et al., (1989) and Richardson (1992) revealed that the regional orientation of maximum horizontal stress (SHmax) in major continental plates, including Western Europe, North America and South America, is sub-parallel to the absolute plate motion (APM), resulting in the general hypothesis that the present-day stress field on the plate interior is primarily controlled by the same plate boundary forces that control and drive tectonic plate motion.
Since the first release of the WSM, there has been a dramatic increase in analysis of the present-day stress field at smaller scales, such as the basin, field and wellbore scales, due the numerous applications of present-day stress data in petroleum exploration and production (Barton and Moos, 2010; Bell, 1996b; Reiter and Heidbach, 2014; Tingay et al., 2006; Tingay et al., 2005a; Zoback, 2010). Several studies have already demonstrated that the orientation of SHmax in a sedimentary basin can be consistent with plate tectonic forces, such as Alberta Basin (Bell, 1996b; Bell and Gough, 1979; Reiter et al., 2014), or can be complex and perturbed due to basin geometry (King et al., 2009; Rajabi et al., 2016b; Tingay et al., 2005b; Yassir and Zerwer, 1997), detachment zones (Ask, 1997; Bell, 1996b; Brereton et al., 1991; Heidbach et al., 2007; Hillis and Nelson, 2005; Müller et al., 2010; Roth and Fleckenstein, 2001; Tingay et al., 2011; Tingay et al., 2012; Tingay et al., 2006), topography and the presence of geological structures such as faults, fractures and geological contrasts (Bell, 1996b; Heidbach et al., 2007; Mount and Suppe, 1987; Rajabi et al., 2016b; Rajabi et al., 2016c; Tingay et al., 2010; Yale, 2003; Zoback, 2010; Zoback et al., 1987). The detailed studies of stress in basins during the second phase of the WSM project revealed that plate boundary forces are not enough to explain the state of stress at smaller scales (Heidbach et al., 2007; Heidbach et al., 2010; Sperner et al., 2003; Tingay et al., 2005a; Zoback et al., 1989).
The old and fast-moving Australian continent is located in the Indo-Australia Plate which is a plate of extremes (Keep and Schellart, 2012) in which the Himalaya (the highest mountain range on Earth) is located in the northwestern margin of the plate, the Sunda subduction zones (one of the largest subduction zones) is the northeastern boundary of the Indo-Australian Plate, the Tonga-Kermadec-Hikurangi subduction, one of the fastest subduction zones on Earth (Bevis et al., 1995), is the eastern boundary of the plate (Figure 1). The present-day stress pattern in Australia is unique amongst major tectonic plates as being the only major plate in which the present-day SHmax orientation is not broadly aligned to absolute plate motion (Heidbach et al., 2010; Hillis and Reynolds, 2000; Hillis and Reynolds, 2003; Richardson, 1992; Zoback et al., 1989). This significant paradox has motivated numerous researchers to investigate the state and origin of the stress pattern in stable continental Australia for over 20 years (Burbidge, 2004; Cloetingh and Wortel, 1986; Coblentz et al.,
135

1995; Coblentz et al., 1998; Dyksterhuis et al., 2005a; Müller et al., 2012; Reynolds et al., 2002; Sandiford et al., 2004). The crustal stress pattern of Australia has been examined from a wide range of different perspectives, including stress data compilation (Hillis et al., 1999; Hillis et al., 1998; Hillis and Reynolds, 2000; Hillis and Reynolds, 2003; Rajabi et al., 2016b; Rajabi et al., 2015; Rajabi et al., 2016c), geomechanical-numerical modelling (Burbidge, 2004; Cloetingh and Wortel, 1985; Coblentz et al., 1995; Coblentz et al., 1998; Dyksterhuis et al., 2005a; Müller et al., 2012; Reynolds et al., 2002; Sandiford et al., 2004) and detailed analysis of neotectonic features (Clark et al., 2012; Hillis et al., 2008; Quigley et al., 2010; Quigley et al., 2006; Sandiford, 2003; Sandiford et al., 2004). Furthermore, recent high resolution stress orientation datasets compiled for eastern Australian basins have revealed that these regions contain numerous and striking stress perturbations from the basin to the wellbore scale in association with different geological structures. As such, continental Australia provides a unique natural laboratory to examine the controls of stress fields at all scales, from the plate scale (100s-1000s of km) to the wellbore scale (1-100m).
This paper is organised in eight sections. In the first section we explain the tectonic setting of Australia. We then review 25 years of studies on the pattern of stress in the Australian continent from different perspectives and highlight what we have learnt and what questions still remained to be investigated. In the third section, we explain the new release of the ASM, in terms of SHmax orientation and tectonic stress regime. This is the first update of the ASM in 13 years, and documents an increase in the stress data in the continent from 594 to 2140 data records, as well as an increase in the number of defined ‘stress provinces’ to 30 (from 16 provinces in 2003) We also compare and show the consistency of the Australian present-day stress pattern with neotectonic features across the continent. Our extensive analysis of stress with high resolution data documents the significant stress perturbations in the Indo-Australian Plate at different scales. Hence, we compare the regional stress pattern of Australia with published Australian stress models and discuss the stress pattern of Australia from continental to wellbore scales. We highlight that the observed stress at any point results from the combination of all forces acting from plate to local scale. Finally, in the last part of the paper we explain the application of our newly compiled data in numerous earth-science disciplines.
2. Tectonic setting, neotectonics and seismicity of the Australian continent
The tectonically and geologically complex Indo-Australian Plate (IAP) represents an ideal natural laboratory to investigate the interaction of different plate boundary forces in the pattern of SHmax orientation (Coblentz et al., 1998; Reynolds et al., 2002). It contains many different types of plate boundaries (Figure 1); from active spreading centres to the south and west (mid-ocean ridge systems that separates the IAP from the Antarctic and African Plates), to different continental collisional boundaries and subduction zones in the east and north (Coblentz et al., 1998; Reynolds et al., 2002). Australia, which is entirely located within the IAP, is often considered to be a tectonically and seismically stable continent, dominated by ancient flat landscapes, located far away from plate boundaries and having comparatively low earthquake occurrence rates; (Johnston et al., 1994; Schulte and Mooney, 2005). Yet, this common perception of a tectonically quiescent Australia is in stark contrast to the widespread observations of seismicity and major neotectonic structures documented in the last 10 years (Clark et al., 2014; Clark et al., 2015; Clark et al., 2012; Hillis et al., 2008; Quigley et al., 2006; Sandiford, 2003; Sandiford et al., 2004). Large inversion related features and significant late Cenozoic uplift has been observed along Australia’s southern, northern and north-western margins (Hillis et al., 2008; Holford et al., 2011; Sandiford, 2003; Tassone et al., 2014; Tassone et al., 2012).
136

For example, over ten inversion related anticlines are identified in the offshore Otway Basin, some of which witness up to one kilometre of exhumation since the Miocene-Pliocene (Holford et al., 2011). The Mount Lofty and Flinders Ranges contain numerous outcrop examples of recently active faults, such as the Milendella Fault near Cambrai that displays Cambrian rocks thrust over Quaternary sediments (Hillis et al., 2008; Sandiford, 2003).
The analysis of recently active faults in southeastern Australia suggests that earthquakes with M > 7 are possible, however, with a low occurrence probability on short time scales due to the low seismic strain rates of 10-16 to 10-17 s-1; (Sandiford et al., 2004). Leonard and Clark (2011) also show that most of fault scarps in Western Australia indicate that seismicity with magnitudes of >6.5 has occurred in the last 100 ka. Indeed, large earthquakes are commonly observed in regions, both in Australia and worldwide, that displayed little prior seismicity. For example, the 1988 magnitude 6.3-6.7 events in Tennant Creek (Northern Territory, Australia), the 1941 magnitude 7.1 Meeberrie event (Western Australia), the 1906 magnitude 7.2 in offshore Geraldton, western Australia (Leonard, 2008; McCue, 1990; McCue, 2014; McEwin et al., 1976) and the 1811-1812 magnitude 7.0-8.1 events that struck New Madrid (and are still the largest earthquakes ever observed in eastern United States). Hence, it is possible that regions of Australia near recently active faults, such as Adelaide, Newcastle and Perth, may be at greater seismic hazard than currently recognized.
3. An overview on earlier studies on in-situ stress field of Australia3.1. Early studies before the initiation of the Australian Stress Map project (pre-1996)
The first measurement of in-situ stress in the Australian continent was carried out in an underground power project in eastern Australia by the flat jack method (Alexander and Worotnicki, 1957; Worotnicki and Denham, 1976). The flat jack method (since 1957) and overcoring method (since 1963) were the main tools to determine the in-situ stress at engineering sites, and were the first data used to broadly examine stress in the Australian continent (Worotnicki and Denham, 1976). In one of the earliest studies on the global stress pattern by Ranalli and Chandler (1975), Australia was represented by only four stress-relief measurements, which was then increased to eight by Richardson et al. (1979).
Along with these measurements at engineering sites, which provide stress information at shallower parts of the crust, many researchers analysed earthquake focal mechanism solutions at various locations to infer the orientation and relative magnitudes of tectonic stresses in the deeper part of the Australian crust (Bock and Denham, 1983; Cleary, 1962; Cleary et al., 1964; Denham, 1980; Denham et al., 1979; Denham et al., 1980; Denham et al., 1982; Denham et al., 1985; Denham et al., 1981; Everingham and Smith, 1979; Fitch, 1976; Fitch et al., 1973; Fredrich et al., 1988; Greenhalgh et al., 1994; Greenhalgh and Singh, 1988; Gregson and Denham, 1987; Lambeck et al., 1984; McCaffrey, 1989; McCue et al., 1990a; McCue et al., 1990b; McCue, 1989; McCue and Sutton, 1979). The majority of in-situ stress information in the Australian continent prior to 1990 was either from shallow engineering methods or deep focal mechanism solutions of earthquakes (Denham et al., 1979; Lambeck et al., 1984; Worotnicki and Denham, 1976). The first extensive study on the orientation of SHmax in the Australian continent based on drilling-related stress indicators was carried out by Blumling (1986) using the interpretation of borehole breakouts in 22 wells across Australia. The petroleum industry of Australia then was introduced to the link between present-day stress orientations and the occurrence of ‘borehole breakouts’ (Denham and Windsor, 1991; Hillis, 1991; Kingsborough et al., 1991; Lowry, 1990) and, since then, drilling-related stress indicators have been
137

the predominant source of crustal stress information in Australia (Denham and Windsor, 1991; Hillis et al., 1999; Hillis and Reynolds, 2000; Hillis and Reynolds, 2003; Mildren and Hillis, 2000; Rajabi et al., 2016b). In the first compilation of the World Stress Map (WSM) project, initiated in 1986, the contemporary state of stress in the Australian continent was poorly understood (Zoback, 1992; Zoback et al., 1989). Whilst the first 1992 release of the WSM contained large datasets for many major continental areas, particularly North America and Europe, this stress compilation only contained 95 reliable stress data records in Australia, suggesting a highly variable stress pattern (Figure 2a), (Zoback, 1992; Zoback et al., 1989).
3.2. Early phases of the Australian Stress Map project (1996-2003)
Even the small compilation of stress data for Australia in the first release of the WSM revealed a complex stress pattern for the continent than midplate North America or Western Europe. The Australian Stress Map (ASM) project was started in 1996 to collect the SHmax orientation from different sources and build a freely available database to investigate causes and consequences of the present-day tectonic stress pattern in Australia. Studies were primarily investigating the enigmatic pattern of stress in the Australian continent, with a particular emphasis on the petroleum basins in North West Shelf of Western Australia and the Otway Basin of South Australia (Hillis et al., 1997; Hillis et al., 1995; Hillis and Williams, 1993a; Hillis and Williams, 1993b; Mildren et al., 1994).
The first release of the ASM, published by Hillis et al., (1998), contained 357 SHmax data records with some new data from Bonaparte, Carnarvon, Amadeus, Cooper-Eromanga and Otway basins (Figure 2b). Hillis et al. (1999) compiled extensive stress data from coal mines in eastern Australia, based on hydraulic fracturing and overcoring methods. These data revealed a prevailing thrust faulting stress regime in the Bowen and Sydney basins and showed a N-S SHmax orientation in the Bowen Basin and a NE-SW SHmax orientation (with significant deviations) in the Sydney Basin. Further studies in the Perth Basin of Western Australia by Reynolds et al. (2000), resulted in the second release of the ASM project by Hillis and Reynolds (2000) and further documented the regional variability of the SHmax orientation across the Australian continent (Figure 2c). Extensive data compilation based on several studies (Clark and Leonard, 2003; Leonard et al., 2002; Mildren and Hillis, 2000; Mildren et al., 2002; Reynolds, 2001) resulted the most recent prior release of the ASM project, containing 594 data records (Figure 2d) (Hillis and Reynolds (2003). The 2003 version of ASM, which was the most comprehensive stress map of Australia prior to this study, revealed a heterogeneous stress pattern in Australia where the SHmax orientation in north and northwestern Australia is NE-SW to N-S, and SHmax is approximately E-W in the Perth and Carnarvon basins of Western Australia. A regional NW-SE SHmax is observed in southeastern Australia and a ‘horse-shoe shape’ in northeastern Australia, including a N-S SHmax in the Amadeus Basin, E-W SHmax in the Cooper-Eromanga Basins and N-S SHmax in the Bowen Basins (Figure 2d).
During the second phase of the WSM project by Heidbach et al., (2008; 2010) the Australian continent was not investigated significantly (Figure 2e), however, some additional data records for Australia were included from published studies in the Gippsland, Cooper and Perth basins (King et al., 2008; Nelson et al., 2006; Reynolds et al., 2005). Along with the WSM and ASM projects, numerous researchers have studied the enigmatic pattern of the present-day stress in the Australian continent by using geomechanical-numerical modelling to investigate the principal sources of stress in the continent, and to predict the stress pattern in those parts of Australia where there is no, or sparse, stress information (Cloetingh and Wortel, 1985; Cloetingh and Wortel, 1986; Coblentz et al., 1995;
138

Coblentz et al., 1998; Dyksterhuis et al., 2005a; Dyksterhuis et al., 2005b; Müller et al., 2012; Reynolds et al., 2002; Reynolds et al., 2003; Zhao and Müller, 2003). Despite the complex stress field observed throughout Australia, the results of these studies suggested that the complex plate boundary forces around the IAP control, at the first-order, the intraplate SHmax orientation (see more discussion in section 6.3).
3.3. New phases of the ASM project (2012-present)
Despite the extensive and widespread stress analysis undertaken in the early phases of the ASM project, the stress field for many parts of Australia, and particularly Eastern Australia, remained poorly resolved, with the dataset primarily comprised of shallow engineering test data and predictions based on numerous numerical geomechanical models (Hillis and Reynolds, 2003; Reynolds et al., 2002). Whilst many other major continental areas had an extensive set of petroleum, earthquake and engineering data, one of the most significant obstacles in understanding the present-day state of stress in the Australian continent is that previously compiled stress data was largely confined to just ten mature petroleum provinces. Hence, the ASM was largely composed of high density stress data in ten sedimentary basins, but with large gaps of almost no stress data throughout most of the continent (Figure 2d and 2e). The recent increase in unconventional petroleum reservoirs and geothermal exploration in Australia has resulted in a greatly increased amount of new data for stress analysis in previously unstudied or poorly-constrained areas in Queensland, Northern Territory, New South Wales and South Australia. Furthermore, the use of petroleum technologies in mineral wells in areas including South Australia and central Victoria, thus providing opportunities to investigate, re-assess and update the present-day stress pattern throughout far more of the Australian continent. In the past four years, we compiled an extensive new stress dataset from all these different methods across the Australian continent (discussed below) to document the stress pattern of Australia in vastly improved detail.
4. Crustal stress indicators in the Australian Stress Map database
There are a variety of methods that provide the information of crustal present-day stress from specific depth ranges (Bell, 1996a; Engelder, 1993; Zang and Stephansson, 2010; Zoback, 2010). We compiled and interpreted the in-situ stresses from five well-known methods suggested by the WSM project (Heidbach et al., 2010; Sperner et al., 2003; Zoback et al., 1989) to investigate the orientation of SHmax from the near surface down to 40 km depth in the lithosphere in the Australian continent. In order to assign qualities to the result of each stress indicator and to facilitate the comparison between different methods, all the stress indicators in the database were ranked based on the WSM quality ranking system from A to E quality, in which A-quality data indicate the SHmax orientation accurate to within ±15o, B-quality to within ±20o, C-quality to within ±25o, D-quality to within ±40o and E-quality indicates no reliable information (Heidbach et al., 2010). In addition, the standard Andersonian stress regime classification has been implemented, wherever possible, to classify the stress state as being either thrust (SHmax>Shmin>Sv), strike-slip (SHmax>Sv>Shmin) or normal (Sv>SHmax>Shmin) faulting stress regime (Anderson, 1905). The methods used for determination of the present-day stress are briefly summarised below, with an emphasis on the drilling-related stress indicators that compose the bulk of new stress data interpreted herein.
139

4.1. Borehole breakouts and drilling-induced tensile fractures
Drilling-related stress indicators are considered as well-established methods that provide reliable in-situ stress information from the upper five km of the Earth’s crust (Bell, 1996a; Schmitt et al., 2012; Zoback, 2010). Borehole breakouts and drilling-induced tensile fractures (DIFs) are common stress-induced failures of the wellbore wall and form due to the stress concentration that develops around a borehole as it is drilled (Bell, 1996a; Bradley, 1979; Kirsch, 1898). Borehole breakouts are ‘ovalisation’ of borehole and form due to compressive shear failure of the borehole wall (Bell and Gough, 1979; Kirsch, 1898). In vertical wells, breakouts form parallel to the orientation of Shmin and can be interpreted by oriented-caliper and borehole image logs (Bell, 1990; Bell and Gough, 1979; Plumb and Hickman, 1985; Tingay et al., 2008b; Zoback, 2010). DIFs form parallel to the SHmax orientation in vertical wells when the stress concentration on the borehole wall is less than tensile rock strength (Aadnoy, 1990; Aadnoy and Bell, 1998; Bell, 1996a; McCallum and Bell, 1994a; McCallum and Bell, 1994b; McCallum and Bell, 1994c). In image logs in sub-vertical wells (<20° deviation), borehole breakouts appear as a pair of elongated zones parallel to the well axis while DIFs appear as a pair of narrow vertical fractures (Figure 3). In this study, different types of borehole image logs (acoustic, density and resistivity) are used to directly interpret borehole breakouts and DIFs in 717 Australian wells, based on the WSM interpretation guidelines and quality ranking system (Heidbach et al., 2010).
4.2. Focal mechanism solution of earthquakes
Earthquakes observed at a sufficiently high number of stations can be used to generate focal mechanisms solutions (FMS) to infer the orientation of the SHmax and the stress regime (Heidbach et al., 2010; McKenzie, 1969; Sbar and Sykes, 1973; Zoback, 1992). Indeed, FMS is usually the only stress indicator that provides data on the tectonic stress state at depths greater than five kilometres and thus deeper than is examined by borehole data (Heidbach et al., 2010; Zoback, 1992).
According to the WSM project, three types of data records from focal mechanism solutions of earthquakes are available in the ASM database. Single focal mechanism solutions (FMS) estimate the SHmax orientation using three principal strain axes (Barth et al., 2008; McKenzie, 1969; Raleigh et al., 1972), and do not receive a WSM quality better than C (±25o) due to ambiguity of the two perpendicular nodal planes of the focal mechanism (Barth et al., 2008; Célérier et al., 2012; McKenzie, 1969). Composite or average focal mechanism solutions (FMA) combine several FMSs and generally do not receive the WSM quality of better than D (Heidbach et al., 2010). Formal stress inversion of focal mechanism solutions (FMF) minimise the difference between the slip direction of earthquakes and the maximum shear stress (Bott, 1959; Heidbach et al., 2010), which can provide better quality data records (A and B) according to the WSM quality ranking criteria (Barth et al., 2008; Heidbach et al., 2010).
4.3. Hydraulic fracturing measurements and overcoring
Shallow present-day stress information is often obtained in mines to assess pillar and slope stability (Amadei and Stephansson, 1997; Leeman, 1964; Zang and Stephansson, 2010). This information is typically collected through two well-established methods: hydraulic fracturing (HF)
140

and overcoring (Enever et al., 1984; Engelder, 1993; Haimson and Cornet, 2003; Hubbert and Willis, 1957; Leeman, 1964; McGarr and Gay, 1978; Sjöberg et al., 2003). Overcoring is a technique to determine the components of the reduced stress tensor based on the strain relief of the rock mass (Amadei and Stephansson, 1997; Engelder, 1993; Sjöberg et al., 2003). The overcoring technique measures the expansion of cored rock by a strain gauge after it is removed from subsurface stresses, then the measured strain is converted to estimated stresses by using the mechanical properties of the rock sample (Amadei and Stephansson, 1997; Sjöberg et al., 2003). The overcoring technique needs to be implemented close to free surfaces, and hence provide (local rather than regional) stress information from the shallower part of the Earth’s crust (Zoback, 1992).
Hydraulic fracture tests provide in-situ stress information at greater depths in comparison with overcoring technique. This method involves isolating a short section of the wellbore between rubber packers and increasing the hydraulic pressure within the isolated section until a small tensile fracture is initiated, typically parallel to the SHmax (Bell, 1996a; Hubbert and Willis, 1957). The orientation of the induced hydraulic fracture needs to be observed and interpreted by running an image log or oriented impression packer over the fracture zone (Amadei and Stephansson, 1997; Bell, 1996a; Bell and Babcock, 1986; Blomberg, 1971; Paillet, 1985). It should be noted that shallow stress data determined from overcoring and HF techniques must be carefully analysed, as they can be strongly affected by topography or geological structures (Bell, 1996a; Zoback, 1992).
5. The new Australian Stress Map database (release-2016)
The last prior release of the ASM by Hillis and Reynolds (2003) compiled 549 (A-E quality) SHmax data records (Figure 2) and successfully constrained the SHmax orientation in 16 stress provinces through Australia and Papua New Guinea. However, the pattern of stress in many areas of Australia, particularly eastern Australian basins and many parts of South Australia were not investigated extensively due to lack of data. In the past four years, we conducted extensive stress analysis throughout the continent to study the present-day stress pattern of Australia.
In this latest phase of the ASM project, we mainly focused on the interpretation of borehole image and oriented caliper logs in major active petroleum basins of Australia, with a particular emphasis on poorly constrained regions such as recent unconventional and conventional petroleum, geothermal and mineral wells in eastern Australia, South Australia and the Northern Territory. We conducted extensive analysis of borehole image and oriented-caliper logs and provide 733 in-situ stress data records in various parts of New South Wales (Clarence-Moreton, Gunnedah, Bowen-Surat, Gloucester and Sydney, Darling basins), Queensland (Surat, Bowen, Galilee and Cooper-Eromanga basins), South Australia (Officer, Cooper and Eromanga basins and mineral/geothermal wells), Western Australia (Browse Basin), Northern Territory (McArthur and Pedirka basins), Victoria and Tasmania (Gippsland, Otway, Bass and Sorell basins).
In addition, we compiled literature data from analysis of borehole image logs in the Perth and Carnarvon basins of Western Australia (Bailey et al., 2014; Bailey et al., 2016; Jepson, 2014), Gippsland Basin of Victoria (Swierczek et al., 2015), Surat Basin of Queensland (Brooke-Barnett et al., 2015), as well as recent analysis in other sedimentary basins of Australia (Klee et al., 2011; MacGregor, 2002; MacGregor, 2003; MacGregor and Gale, 2000; Rasouli et al., 2013; Tassone et al., 2014). Hence, our compilation provides 934 new present-day stress data records from wellbore information. In order to investigate the present-day stress in other regions of the continent, we
141

extensively compiled all earthquake focal mechanism solutions in and around Australia from different sources including Global CMT (Dziewonski et al., 1981; Ekström et al., 2012), GEOFON (GEOFON Data Centre, 1993), SLU (SLU Earthquake Center, 2015) and USGS (USGS, 2015), as well as all related published papers (Balfour et al., 2015; Leonard et al., 2002; Revets et al., 2009; Sippl et al., 2015).
The 2016 ASM database has been increased from 549 (A-E quality) to 2140 (A-E quality) present-day stress data records (Figures 2f and 4). The database contains 1354 (A-E quality) SHmax orientations from borehole stress indicators (breakouts and DIFs), 645 (A-E quality) data records from focal mechanism solutions of earthquakes, 139 (A-E quality) records from engineering methods (HF and overcoring) and two E-quality SHmax orientations inferred from geological information. The details of the ASM database can be found in Figures 4 and 5, Table 1 and supplementary online information. The wellbore stress indicators (breakouts and DIFs) provide the majority of intraplate stress information; while stress indicators near plate boundaries are dominated by earthquake focal mechanism solutions (Figure 4). Our knowledge about the crustal stress in the continental Australia at shallower depths comes from overcoring, HF and drilling-related stress data records (in shallow coal seam gas wells), while breakouts and DIF provide stress information at intermediate depths (less than five km). Earthquake focal mechanism solutions are the only sources of information at any depths more than five km in the continent (Figure 5). In addition, almost 37% of the data in the 2016 ASM database were assigned a tectonic stress regime (Figure 5) according to the Andersonian classification (Anderson, 1905), which enables us to assess the variability of the relative stress magnitudes, i.e. the stress regime, with depth. Two statistical approaches were used to analyse the regional pattern of stress at the continental scale, namely defining stress provinces and mapping of stress trajectories, both of which were used in the early phases of the ASM project by Hillis and Reynolds (2000) and thus facilitate comparison between the prior and current database.
5.1. Analysis of stress provinces
The concept of stress provinces in the Australian continent (Hillis and Reynolds, 2000) is based on directional statistics and the Rayleigh test, which is a well-known method to determine the dispersion and significance of directional vectors (Davis, 2002; Mardia, 1972). The use of Rayleigh test to evaluate whether the stress data are distributed systematically or randomly was first used by (Coblentz and Richardson, 1995) to quantify the global pattern of the present-day stress based on the first release of the WSM project. A minimum of four A-C quality SHmax data records in a distinct geographic region (predominately a sedimentary basin) is required to define a stress province. All SHmax indicators within a province are weighted according to their WSM quality ranking. The most reliable A-quality SHmax data records receive a weight of ‘four’, down to D-quality data records that receive a weight of ‘one’. Finally, the mean SHmax orientation and length of the mean resultant vector (R-value) are determined by a directional statistics method at each stress province (Davis, 2002; Mardia, 1972). The Rayleigh test was used to test the randomness of the mean SHmax orientation at each province. We consider the null hypothesis that ‘SHmax orientations in a province are random’. Six types of stress province classifications are used (Hillis and Reynolds, 2003) where a type 1 stress province indicates that the null hypothesis can be rejected at the 99.9% confidence level, type 2 at the 99% level, type 3 at the 97.5% level, type 4 at the 95% level, and type 5 at the 90% level. A type 6 stress province indicates that the null hypothesis cannot be rejected at the 90% confidence level, and which is regarded as a high standard deviation for the stress data.
142

In this study, we update all previously defined 16 stress provinces and derive 14 new stress provinces in different parts of the Australian continent. Among the new provinces, nine provinces are located in eastern Australia (Queensland, New South Wales and Victoria), two provinces in South Australia, two in Western Australia and one in the Northern Territory. The details and locations of the stress provinces are shown in Table 2 and Figures 6 and 7.
Analysis of stress provinces throughout the Australian continent reveals four major SHmax orientations (Figure 7). The mean SHmax orientation in the northern, northwestern and northeastern Australia, including the Papua New Guinea, MacArthur Basin region, Bonaparte, Canning and some parts of the Bowen-Surat basins, is approximately NE-SW. A prevailing E-W SHmax orientation exists in the Browse Basin in the North West Shelf, the southern half of Western Australia (Carnarvon and Perth basins), and most parts of South Australia (Flinders Ranges, Officer and Cooper-Eromanga basins). The mean SHmax orientation in most parts of eastern Australia is approximately ENE-WSW (Figure 7) in different sedimentary basins (including the Clarence-Moreton, Gunnedah, Sydney, Bowen and Surat basins), and SHmax rotates to approximately NW-SE in southeastern Australia (Figure 7) within the Gippsland, Otway and eastern Bight basins. The statistical analysis of the stress provinces shows that the mean SHmax orientation in 25 provinces is of type 1 or 2, and thus considered highly reliable (Table 2 and Figure 7). The majority of stress provinces in the western half of the continent, as well as in southeastern Australia show low standard deviations (Table 2), while most of stress provinces in eastern Australia show higher standard deviation indicating a higher variability of the SHmax orientation in these regions (Brooke-Barnett et al., 2015; Hillis et al., 1999; Rajabi et al., 2016b; Rajabi et al., 2016c). In addition, the Flinders Ranges (s.d.: 29o), Southern Carnarvon (s.d.: 43o) and SE seismogenic zone (s.d.: 41o), which are based on focal mechanism solutions of earthquakes, all show significant deviations of the SHmax orientation that are probably due to the inherent uncertainty with SHmax determined from the FMS method (Figures 6 and 7) or due to neotectonic activity that represent localised stress perturbations.
5.2. Analysis of the SHmax stress pattern
The concept of stress provinces determines the mean SHmax orientation and its reliability in a particular geographic region. However, this method does not examine or predict the stress pattern throughout the entire continent. In order to calculate the continental scale stress pattern, and filter the effect of local stresses perturbations, we used the smoothing algorithms following the methods proposed by Hansen and Mount (1990) and Müller et al. (2003). The stress trajectories method developed by Hansen and Mount (1990) aims to show the mean SHmax orientation at each point on the trajectories. Different weighting terms are used in this algorithm, including quality weight, distance weight and robustness weight (Hansen and Mount, 1990; Hillis and Reynolds, 2003; Müller et al., 2003). We incorporated the A-C quality data, with a weight of 1 for A, 0.75 for B and 0.5 for C-quality, to calculate stress trajectories. Herein, we applied the distance weighted algorithm following the method developed by Müller et al. (2003), including a fixed number of nearest neighbours (FNN) and fixed search radius (FSR). The FNN method is based on data density in the area of interest and uses local weights, while the FSR algorithm uses a global weight that is dependent on the Euclidean distance. More details about the smoothing methods used in this study can be found in Hansen and Mount (1990) and Müller et al. (2003). Figure 8 shows the stress trajectories and smoothed stress pattern of the continent for a search radius of r=750 km and a minimum number of data records within the search radius of n≥3. The new trajectory stress map of Australia is significantly different from that
143

was calculated by Hillis and Reynolds (2003), particularly in eastern and Western Australia where we compiled a significantly expanded SHmax orientation dataset (compare Figure 2d with Figure 2f).
5.3. Present-day stress regimes throughout the Australian continent
790 data records (37%) in the 2016 ASM dataset also provide the information on the tectonic stress regime (relative stress magnitude) based on the standard Anderson (1905) classification into thrust, strike-slip and normal faulting regimes (Figures 4 and 5). The tectonic stress regimes in the ASM database are from focal mechanism solutions of earthquakes, shallow engineering measurements and, to a lesser extent, from geomechanical data in petroleum wells (Figures 4 and 5) that indicate a prevailing thrust and strike-slip stress regime (Figure 5).
The majority of the data records with stress regime information come from FMS data records that are clustered around plate boundaries. In order to investigate the intra-plate variability of the stress regime with depth, we filtered the ASM database and used only the data records that are >100 km away from any plate boundary (Heidbach et al., 2010). Furthermore, we only used data from the upper five km of the Australian lithosphere, as this constitutes the majority of the stress orientation data and is considered the depth range of most interest in petroleum, geothermal and mining industries. The resulting data set, which represent the intra-plate present-day stress regime of the continent in upper five kilometre, reveals a prevailing thrust faulting stress regime in the shallower part (< 2 km) of the crust that changes to strike-slip in the deeper part (Figure 9). The changes of stress regimes with depth have been reported in different sedimentary basins of Australia (Brooke-Barnett et al., 2015; Rajabi et al., 2016a; Rasouli et al., 2013) and support the results highlighted by the ASM database.
6. Pattern of present-day stress in the Australian continent6.1. Regional orientation of SHmax across Australia
In this study, different techniques have been implemented to determine and clarify the continental-wide SHmax orientation. Both stress provinces and smoothing algorithms methods provide consistent results for the regional SHmax orientation in continental Australia (Figures 7 and 8). The north and northwest of Australia (Bonaparte and Canning basins, McArthur Basin region, New Guinea and Irian Jaya stress provinces) is characterised by a NNE-SSW SHmax orientation which is rotates to E-W in most parts of Western Australia, including Browse, Carnarvon and Perth basins as well as the SW seismogenic zone (Figure 7 and 8). The SHmax orientation in central Australia (Amadeus Basin) is NNE-SSW, which seems to be the transition between N-S SHmax orientation (in the northern parts of the Australian continent) and the E-W SHmax orientation to the east and west of the basin. However, it should be noted that there is a slight inconsistency between the SHmax orientation inferred from wellbore and earthquake data around the Amadeus Basin. The Cooper-Eromanga, eastern Officer and Darling basins and the Flinders Ranges, show a significant E-W orientation for the SHmax that changes to ENE-WSW in most of eastern Australia (Figures 7 and 8). Southeastern Australia (Gippsland, Otway, Bass and eastern Bight basins) exhibits a significant NW-SE SHmax orientation (Figures 7 and 8), as has been observed in previous studies, particularly Sandiford et al., (2004) who concluded that the NW-SE SHmax pattern of this region is a result of New Zealand continental collision.
144

6.2. Comparison of present-day stress field and neotectonic features
The Australian continent has a rich neotectonic record, despite the common perception that it is a highly stable continent (Clark et al., 2012; Geoscience Australia, 2016; Hillis et al., 2008; Quigley et al., 2006; Sandiford, 2003). Figure 10 shows and compares young geological structures with the orientation of SHmax orientation across the Australian continent. The majority of neotectonic structures in the continent indicate a thrust faulting stress regime, which is in agreement with the orientation of SHmax. Even the variability of regional SHmax orientation between stress provinces is consistent with neotectonic features and further confirms that the present-day stress field is a primary control on intraplate deformation throughout the continent (Clark et al., 2012; Hillis et al., 2008). The new database suggests that the tectonic stress regime in the upper five km depth of the Australian crust often exhibits a thrust faulting tectonic stress regime at the shallowest upper parts (upper one km), but that this changes to a strike-slip stress regime in the deeper parts (Figure 9). The orientation of SHmax and prevailing thrust faulting stress regime in the shallowest parts of much of the Australian crust (i.e. upper one km) is in agreement with the neotectonic database of Australia (Figures 9 and 10). However, as indicated in Figures 9 and 10 the stress regime is depth-dependent, and the thrust faulting stress regime inferred from surface neotectonic features may not correlate with deeper parts in which a strike-slip regime is prevailing. Furthermore, a large number of petroleum industry stress studies have often suggested that a normal faulting stress regime is present in many Australian sedimentary basins (Bailey et al., 2012; Berard et al., 2008; Jepson, 2014; King et al., 2012). Hence, there are potentially significant pitfalls in using shallow neotectonic features to help constrain the stress state at the depths of petroleum, geothermal or CO2 reservoirs. Changes in stress regime with depth have been reported in several case studies in Australia (Brooke-Barnett et al., 2015; Klee et al., 2011; Rajabi et al., 2016a; Rasouli et al., 2013) and worldwide (Heidbach and Reinecker, 2013; Zang et al., 2012).
7. Potential stress sources in Australia
Extensive studies by the WSM and ASM projects in the past 30 years have revealed different stress sources in spatial and temporal scales. The first-orders of stress sources control the present-day stress at plate scale (Figure 11). However, there are other stress sources that influence the stress pattern at smaller scales (second, third and fourth orders, Figure 11). The first release of the WSM project by Zoback (1992), and further studies by Richardson (1992), revealed a poor correlation between the SHmax orientation and absolute plate motion (APM) in the IAP in general and the Australian continent in particular. The first release of the WSM contained only 95 reliable SHmax orientations for Australia. Now that the Australian continent has over 10 times more reliable data records, we re-visited the question of whether there is a correlation between the SHmax orientation and the absolute plate motion azimuth. Figure 12 compares the orientation of SHmax orientation and APM based on ‘hotspot-3’ inferred from NUVEL1A model (Gripp and Gordon, 2002). The results further confirm and indicate poor correlation between APM and SHmax orientation in the Australian continent.
Although there is a poor correlation between the SHmax orientation and APMs in the continent (Figure 12), numerous 2D and 2.5D geomechanical-numerical modelling studies suggested that the regional stress pattern of the continent can be primarily explained by the relative interactions of
145

complex boundary forces acting on the IAP (Figure 13). In the published literature, there are over ten papers that investigated the controls on the Australian stress pattern and predicted the SHmax orientation for the continent. The majority of these models applied different boundary conditions on the IAP with a homogenous elastic rheology and fitted the model predictions with observational data (Cloetingh and Wortel, 1985; Cloetingh and Wortel, 1986; Coblentz et al., 1995; Coblentz et al., 1998; Dyksterhuis et al., 2005a; Dyksterhuis et al., 2005b; Reynolds et al., 2002; Reynolds et al., 2003; Zhang et al., 1996). A few studies divided the Australian continent in different geomechanical provinces (fold-belts, basins and cratons) and assigned to these individual elastic properties (Dyksterhuis et al., 2005a; Dyksterhuis et al., 2005b; Müller et al., 2012). Burbidge (2004) investigated the plate-scale stress pattern with a model that used visco-elastic-plastic rheology using the 2.5D finite-element code of SHELLS that originally developed by Bird (1999). In addition, some other researchers investigated the effect of local structures (Zhang et al., 1998; Zhang et al., 1996; Zhao and Müller, 2001; Zhao and Müller, 2003), temporal effect and New Zealand continental collision on the pattern of stress in southeastern Australia (Sandiford et al., 2004).
In almost all the previous published models, the general NNE-SSW SHmax orientation in north and northwest of Australia, E-W orientation of SHmax in Western Australia, the Cooper, Darling and Officer basins and Flinders Ranges, and the NW-SE SHmax orientation in southeastern Australia have been explained by the combination of different plate boundary forces acting on the IAP (Figure 13), (Burbidge, 2004; Coblentz et al., 1995; Coblentz et al., 1998; Dyksterhuis et al., 2005a; Müller et al., 2012; Reynolds et al., 2002; Reynolds et al., 2003; Sandiford et al., 2004). However, there are significant deviations between the model predictions and newly compiled stress data, particularly in eastern Australia (Figure 13) where Brooke-Barnett et al., (2015) Rajabi et al., (2016b) and Rajabi et al., (2016c) showed a significant inconsistency between different model predictions and new observations in New South Wales. Indeed, Rajabi et al. (2016b) and Rajabi et al. (2016c) suggested two possible reasons for the inconsistencies, including overly simplified modelling strategies in the previous published models and lack of model-independent data for model calibrations in the previous attempts at geomechanical-numerical modelling of the Australian stress field. Hence, these regional inconsistencies could be resolved by imparting boundary conditions on the previous models while the local inconsistencies need to be investigated by high resolution 3D geomechanical-numerical models as highlighted by numerous studies worldwide (Hergert and Heidbach, 2011a; Hergert et al., 2015; Reiter and Heidbach, 2014).
As outlined above, most of the Australian stress pattern can be explained as being the result of plate boundary forces. However, the stress pattern in northeastern Australia and the numerous perturbations of SHmax at different scales in several sedimentary basins are significant, and lead us to consider smaller scale stress sources (Figure 11). Numerous studies have reported the variation of the present-day stress due to different geological structures in eastern Australian sedimentary basins (Brooke-Barnett et al., 2015; Enever et al., 1999; Flottmann et al., 2014; Gale et al., 1984; Hillis et al., 1999; Rajabi et al., 2016b; Rajabi et al., 2016c). Second and third order of stress sources are particularly used to explain the stress pattern between and within sedimentary basins respectively, and are likely the reason why the Bowen, Surat, Gunnedah, Clarence-Moreton and Sydney basins of eastern Australia have high standard deviations in stress province analysis (Figure 6; Table 2). In addition to second and third-order of stresses, numerous localised stress perturbations are observed at the wellbore scale in association with geological features such as lithological contrasts, faults and fractures (Figures 11 and 14). Hence, we suggest that fourth-order stress sources, associated with localised elastic rock property contrasts, are responsible for these small scale variations (Figures 11 and 14). These wellbore scale stress variations only act to deviate the stress orientation at small scales,
146
but have significant applications in unconventional and geothermal exploration, as well as CO2 geo-sequestration (Figures 11 and 14). More details about the role and significance of the localised SHmax perturbations at wellbore scales can be found in Rajabi et al. (2016b) and Rajabi et al. (2016c).
8. Comparison of regional SHmax orientation with SV azimuthal anisotropy pattern
Until recently, extensive work has been done to define the pattern of azimuthal anisotropy for SV wave in the Australian continent (Debayle, 1999; Debayle et al., 2005; Debayle and Kennett, 2000; Debayle and Kennett, 2003; Kennett et al., 2004). Both regional (Debayle, 1999; Debayle and Kennett, 2000; Debayle and Kennett, 2003) and global studies (Debayle et al., 2005) demonstrated the presence of two layers of seismic anisotropy beneath the Australian continent. The upper layer (shallower than 100 to 150 km) reveals variable direction of SV anisotropy similar to the SHmax pattern. The lower layer (deeper than 150 to 200 km) shows a significant NNE-SSW pattern for the SV which is subparallel to the absolute plate motion (Debayle et al., 2005; Debayle and Kennett, 2003). Debayle and Kennett (2003) and Debayle et al. (2005) proposed “frozen deformation” for the upper layer, while present-day deformation due to shearing at the base of the IAP is proposed for the lower layer. Hillis and Reynolds (2003) discussed that the consistency of APM and SV azimuth at the bottom layer reflects the asthenosphere process with the NNE motion of the IAP. However, they suggested that the similarity between the SHmax and SV orientations in the upper layer show the role of present-day plate dynamic and the impact of stress-aligned fluid-saturated microcracks (Hillis and Reynolds, 2003). It means both layers reflect the present-day plate dynamics, with the difference between decoupling between lithospheric and asthenosphere stresses (Hillis and Reynolds, 2003). As Hillis and Reynolds (2003) highlighted, if the present-day plate dynamics and present-day stress control both asthenospheric and lithospheric SV anisotropy then it would be expected to see a parallelism between APM and SV in asthenosphere and lithosphere. Furthermore, if lithospheric SV anisotropy is different, as seen in Australia, it means the seismic anisotropy is controlled by pre-existing structures. Hence, extensive dataset is required to investigate these ideas. Strong correlation between SV anisotropy and SHmax orientation in the Australian continent suggest that these orientations at the first order are controlled by present-day plate dynamics (Hillis and Reynolds, 2003).
9. Applications of the Australian Stress Map database
Crustal stresses are important to both natural and anthropogenic processes (Figure 11). Constraining the contemporary state of stress is significant for a wide range of earth science disciplines.
i. Knowledge of the in-situ stress is essential for understanding the forces that drive tectonicplates (Heidbach et al., 2010; Hergert and Heidbach, 2011b; Richardson, 1992; Zoback,1992).
ii. Stress and its link to deformation play a critical role in neotectonic evolution and intraplatedeformation (Heidbach et al., 2010; Hillis et al., 2008; Sandiford, 2003; Sandiford et al., 2004).
147

iii. Earthquakes and stress are interconnected, and earthquake hazard is a function of subsurfacestresses and rock failure criteria (Heidbach and Ben-Avraham, 2007; Holdgate et al., 2003;Sandiford et al., 2004; Seeber and Armbruster, 2000; Sibson et al., 2012; Stein, 1999). This isparticularly important in zones with low seismic recurrence rates, such as Australia.
iv. In-situ stresses can be used to produce fault slip tendency maps and these have implicationsfor seismic hazard and for recognising whether palaeo-hydrocarbon accumulations may havebeen breached due to fault reactivation (Ferrill et al., 1999; Tingay et al., 2009).
v. In-situ stress controls the stability of mines, tunnels and boreholes (Reinecker et al., 2006;Zang et al., 2012).
vi. Fluid flow in subsurface aquifers, oil reservoirs, geothermal fields (Heffer et al., 1997; Hefferand Lean, 1991), as well as the formation of some mineral deposits, is controlled by in situstresses (Micklethwaite et al., 2010; Weatherley and Henley, 2013).
vii. The orientation of hydraulically-induced fractures is controlled by the contemporary stress(Bell, 1996b; Zoback, 2010).
viii. The potential for induced seismicity associated with either subsurface fluid injection (e.g.CO2, enhanced oil recovery) or fluid withdrawal (e.g. from oil or geothermal reservoirs), iscontrolled by the in-situ stress (Grünthal, 2014; Hillis, 2001; Kraft and Deichmann, 2014;Segall, 1989; Zang et al., 2014).
This study has greatly improved our understanding about the present-day stress field in Australia. Such knowledge is directly applicable to all of the above issues in the Australian continent and other regions worldwide. At the continental scale, the pattern of stress in Australia, and its inconsistency with the APMs (Figure 12), can be used to investigate the relative contribution of different plate boundary forces on intraplate deformation and the stress field (Coblentz et al., 1998; Dyksterhuis et al., 2005a; Müller et al., 2012; Reynolds et al., 2003). Although various studies have already investigated this issue for the Australian continent, the new release of the ASM database reveals significant deviations between published models and the observed data in eastern Australia (Figure 13) due to either modelling strategies or lack of observed stress data for model calibrations in previous studies (Rajabi et al., 2016b; Rajabi et al., 2016c). Hence, the new ASM database can be used as a valuable source of information for model calibration, which is a key step in any geomechanical-numerical modelling (Buchmann and Connolly, 2007; Reiter and Heidbach, 2014). At regional scales, where there are perturbations of stress owing to second order of stresses, the database can be used to improve our understanding and methodologies for new high-resolution and 3D geomechanical-numerical models to investigate the intraplate sources of stresses (Hergert and Heidbach, 2010; Hergert et al., 2015; Reiter and Heidbach, 2014).
The key finding of this study is the significant perturbation of stress in smaller scales due to third and fourth order of stress sources (Figures 11 and 14). The orientation and magnitude of stress have significant implications in petroleum exploration and production, mining, geothermal energy extraction and CO2 sequestration (Figures 11), (Bell, 1996b; Zang et al., 2014; Zoback, 2010). The present-day stress field is a primary control on the stability of all underground openings, including boreholes, mines and tunnels (Amadei and Stephansson, 1997; Reinecker et al., 2006; Zang et al., 2012). Hence, the perturbation of the SHmax orientation and changes of stress regime with depth needs a particular attention in any geomechanical studies at smaller scales.
The neotectonic features suggest a prevailing reverse stress regime in the Australian continent and the shallow stress regime inferred from the ASM database (upper one km) is in agreement with these features (Figure 10). However, the ASM database indicates a change of stress regime with depth, and thus potential errors when attempting to infer the present-day stress regime from young
148

and shallow geological features. In particular, erroneous assessment of present-day stresses can lead to expensive instability or collapse of boreholes, such as recent experience of Geodynamics Limited’s with Habanero-2 geothermal well (Wyborn, 2012) and some other examples in Western Australia (Borthwick, 2010; Hayes, 2012; Kingsborough et al., 1991; Willson, 2012). The present-day stress also controls the creation of fractures, and associated permeability, in the subsurface. For example, hydraulic fractures open against the least principle stress and commonly propagate parallel to the present-day SHmax (Bell, 1996b; Engelder, 1993; Zoback, 2010). Thus, knowledge of the stress field is vital for hydraulic fracture stimulation procedures used in hydrocarbon and geothermal energy production (Bell, 1996b; Gaucher et al., 2015; Warpinski et al., 2008).
The present-day stress field is a primary control on seismicity and the reactivation of faults in the subsurface. Fault reactivation occurs when stresses exceed the rock strength. In particular, the injection of fluids into the subsurface, such as during geothermal power production, CO2 sequestration or enhanced oil recovery, reduces the effective stresses and can result in fault reactivation with associated destructive seismicity or the surface release of hazardous material such as oil, CO2 or mud. For example, the Habanero fracture stimulation in the Cooper Basin of South Australia caused seismic events up to 3.7 magnitude (Asanuma et al., 2005; Hunt, 2006; Morelli, 2009). the Paralana-2 well stimulation caused several events up to 2.5 magnitude in eastern South Australia (Albaric et al., 2014). Geothermal activity in Basel, Switzerland induced several seismic events of up to 3.4 in magnitude resulting in the cancellation of the project and a drawback of geothermal research in Europe in general (Grünthal, 2014). Similarly, the 2006 blowout of the Banjar Panji-1 well in Sidoarjo (Indonesia) has been suggested to have triggered reactivation of the nearby Watukosek fault that resulted in the ongoing Lusi mud flow (Tingay et al., 2015). The Lusi disaster has claimed 17 lives, flooded a 8 km2 area of the city and displaced 40,000 people with an estimated damage of over $767 million (Tingay et al., 2008a). The influence of the stress field on fault reactivation and associated seismicity highlights the critical importance of understanding controls on stress in risking natural hazards.
10. Conclusions
The state of stress in the Australian continent has been the subject of considerable debate since the first global compilation of in-situ stress information. The early phases of the ASM project, published by Hillis and Reynolds (2003) contained 549 (A-E) data records, identified average stress orientations in 16 stress provinces and successfully constrained the first-order of the contemporary tectonic stress within the Australian continent. Recent unconventional and geothermal exploration in eastern and South Australia, and the running of borehole image tools in existing mineral wells in basement rocks of South Australia and Victoria, provide the opportunity to update the pattern of present-day tectonic stress in the Australian continent. The new 2016 release of the ASM database contains 2140 (A-E) data records, including average SHmax orientations for 30 stress provinces, and has made significant improvements in both quality and quantity of the Australian present-day stress field. Of particular importance is the new, and sometimes the first, detailed contemporary stress maps for several basins in eastern Australia, as well as the data collected from minerals wells in basement rocks of South Australia, and exploration wells in different basins including Darling, McArthur and Officer basins and offshore Tasmania. This new dataset combined with newly complied data in almost all conventional petroleum basins of Australia in Western Australia, South Australia, Victoria and
149

Queensland, provide the most up to date stress map of Australia. The analyses of stress data, along with directional statistics reveal four major approximate SHmax trends in the Australian continent.
i. NNE-SSW in north and northwest of Australia.ii. E-W in most Western Australia as well as South Australia and western side of New South
Wales.iii. ENE-WSW in most of eastern Australian sedimentary basins.iv. NW-SE in southeastern Australia.
The new ASM stress data further confirms the role of plate boundary forces as the main intraplate sources of stress in the Australian continent. However, detailed analysis of borehole image logs in numerous wells revealed extensive localised perturbations of stress due to the presence of geological structures such as fractures, faults, lithological density and strength contrasts and intraplate volcanism. Most of these localised stress perturbations are in eastern Australian basins (Surat, Bowen, Clarence-Moreton, Gunnedah and Sydney basins) that contain vast unconventional reserves and, hence, the state of stress is critical for exploration and production in these regions. Although the state of present-day stress regime is not determined in as much detail as the SHmax orientation, the compiled stress regime data from the upper five km of the crust obtained from numerous sources (shallow engineering methods, intermediate-depth wellbore information and earthquake focal mechanism solution) clearly show that the shallower part of the Australian crust is primarily characterized by a present-day thrust faulting stress regime that changes to a prevailing strike-slip stress regime at depth.
Acknowledgements
This work funded by the ARC Discovery Project (DP120103849) and ASEG Research Foundation Project (RF13P02). For updates on the Australian Stress Map visit www.asp.adelaide.edu.au/asm. We would like to thank the Ikon Science in Adelaide (formerly JRS Petroleum Research) for the use of their JRS Suite. Adam Baily, Gilby Jepson and Ernest Swierczek are thanked for providing new stress measurements for the Perth, Carnarvon and Gippsland basins. Jeremy Meyer, Scott Mildren, Oliver Bartdorff, Moritz Ziegler and Karsten Reiter are thanked for their support and their times to answer numerous technical questions of the first author. The following organisations are thanked for providing raw data for this study: the New South Wales Department of Resources and Energy; the Geological Survey of Queensland (Department of Natural Resources and Mines); Department for Manufacturing, Innovation, Trade, Resources and Energy (South Australia); the Department of Mines and Energy of Northern Territory; the Department of Mines and Petroleum of Western Australia; Mineral Resources Tasmania; and Australian Geophysical Observing System (AGOS) project. The first author wishes to thank the Formation Evaluation Society of Australia (for the Hugh Crocker Scholarship), Elsevier and International Association for Mathematical Geosciences (for the Computers & Geosciences Research Scholarship). The maps are generated with CASMI (Heidbach and Höhne, 2008) and GMT (Wessel et al., 2013).
Supplementary Information
The 2016 release of the Australian Stress Map database
150

Table and Figure Captions
Table 1: Data type and quality of the present-day stress data records in the Australian stress map database and a comparison between the latest release of the project in 2003 and the new database.
2003's release of ASM New ASM database Data type A-E A-C A-E A-C
FMF 1 1 2 2 FMS 122 95 638 546 FMA 5 0 5 0 BO 258 146 1024 424 DIF 27 24 330 100 HF 78 59 81 62 OC 56 6 58 5
GVA 2 0 2 0 Total 549 331 2140 1139
A-C and A-E: Quality assignment from the World Stress Map quality ranking scheme for the orientation of maximum horizontal stress (Heidbach et al., 2010). FMF: formal inversion of focal mechanism solutions, FMS: single focal mechanism solutions, FMA: composite or average focal mechanism solutions, BO: borehole breakouts, DIF: drilling induced-tensile fractures, HF: hydraulic fracture measurements, OC: overcoring, GVA: geological volcanic alignments.
Table 2: Present-day stress provinces across continental Australia and Papua New Guinea.
A-C: data quality according to the World Stress Map ranking scheme (Heidbach et al., 2010). BO: borehole breakouts, DIF: drilling induced tensile fractures, FMS: focal mechanism solutions of earthquakes, HF: hydraulic fracture measurements, OC: overcoring. Mean SHmax: mean orientation of maximum horizontal stress in each province using statistics for bipolar data, SD: standard deviation of the mean SHmax in each province, R: length of the mean resultant vector for the SHmax (Davis, 2002; Mardia, 1972), Conf. confidence level that show the type of stress provinces based on cut of values explained in the text. Note that the bold rows are newly defined stress provinces.
151

Province No. A-C
Type (A-C) Quality Statistics using A-C quality data records Province's
Type BO DIF FMS HF OC A B C D Mean SHmax
s.d. R Conf.
Amadeus Basin Region 16 11 0 5 0 0 1 7 8 9 25 31 0.56 99.00% 2 Bight Basin 4 4 0 0 0 0 0 1 3 1 134 19 0.81 90.00% 5 Northern Bonaparte Basin 55 34 19 2 0 0 11 25 19 35 47 16 0.85 99.90% 1 Southern Bonaparte Basin 4 4 0 0 0 0 3 1 0 1 57 4 0.99 99.00% 2 Bowen-Surat 1 64 17 13 3 31 0 7 22 35 89 32 30 0.58 99.90% 1 Bowen-Surat 2 52 49 3 0 0 0 5 16 31 124 65 33 0.51 99.90% 1 Browse Basin 28 17 10 1 0 0 8 13 7 11 92 24 0.70 99.90% 1 Canning Basin 10 7 0 2 1 0 2 2 6 1 53 11 0.93 99.90% 1 Northern Carnarvon Basin 60 48 6 6 0 0 12 23 25 68 108 24 0.71 99.90% 1 Sothern Carnarvon Basin 16 0 0 16 0 0 0 0 16 0 109 43 0.32 <90% 6 Clarence-Moreton Basin 21 21 0 0 0 0 1 16 4 12 69 23 0.71 99.90% 1 Cooper-Eromanga Basins 78 62 16 0 0 0 28 30 20 58 99 14 0.89 99.90% 1 Darling Region 8 2 1 1 1 3 2 1 5 2 91 11 0.93 99.90% 1 Flinders Ranges 17 3 13 0 1 0 2 2 13 61 90 29 0.59 99.00% 2 Galilee-Eromanga 5 2 2 0 0 1 1 1 3 1 87 8 0.96 99.00% 2 Gippsland Basin 17 15 2 0 0 0 4 3 10 21 133 23 0.72 99.90% 1 Gloucester Basin 5 5 0 0 0 0 0 2 3 6 34 52 0.19 <90% 6 Gunnedah Basin 30 25 3 2 0 0 1 6 23 61 57 33 0.51 99.90% 1 Irian Jaya 1 135 0 0 135 0 0 0 0 135 0 18 29 0.60 99.90% 1 Irian Jaya 2 99 0 0 99 0 0 0 0 99 0 40 21 0.76 99.90% 1 McArthur Region 6 3 0 0 2 1 2 3 1 5 26 9 0.95 99.90% 1 New Guinea 1 151 0 0 151 0 0 0 0 151 0 40 23 0.73 99.90% 1 New Guinea 2 63 0 0 63 0 0 0 0 63 0 25 27 0.64 99.90% 1 SA Otway Basin 17 13 4 0 0 0 6 4 7 14 132 13 0.90 99.90% 1 Vic Otway Basin 8 5 3 0 0 0 4 3 1 6 137 5 0.98 99.90% 1 Officer Basin 5 3 2 0 0 0 1 1 3 3 89 7 0.97 99.00% 2 Perth Region 64 40 15 8 1 0 8 23 33 25 88 18 0.82 99.90% 1 SE Seismogenic Zone 14 0 0 12 2 0 0 1 13 15 122 41 0.37 <90% 6 North Sydney Basin 32 12 0 4 16 0 2 11 19 77 65 40 0.39 99.00% 2 South Sydney Basin 11 3 0 2 6 0 1 2 8 20 41 35 0.48 90.00% 5

Figure 1: Indo-Australian Plate tectonic setting including the type of boundaries (different colours) around the plate and plate motion from Bird (2003). CCB: continental convergent boundary, CTF: continental transform fault, CRB: continental rift boundary, OSR: oceanic spreading ridge, OTF: oceanic transform fault, OCB: oceanic convergent boundary and SUB: subduction zone. The background image is land topography and ocean bathymetry based on ETOPO1 model from Amante and Eakins (2009).
153

Figure 2: The state of stress in the Australian continent by six different release of World Stress Map (WSM) and Australian Stress Map (ASM) projects. (a) Shows the first release of WSM by Zoback et al., (1992) with only 95 reliable orientation of maximum horizontal stress (SHmax). (b, c and d) Show three different release of the ASM project by Hillis et al. (1998), Hillis and Reynolds (2000 and 2003). The most recent prior (2003) release of the Australian stress map and the calculated stress trajectories (grey lines) show the regional stress pattern of the continent (Hillis and Reynolds, 2003). The database contained 549 in-situ stress data records based on different stress indicators (see legend). (e) Show the 2008 release of the WSM project by Heidbach et al. (2010) that show lack of stress information in most of eastern Australia. (f) The 2016 release of ASM (this study) with 1139 most reliable orientations of SHmax and the calculated stress trajectories (grey lines). Different colours in these maps show different stress regimes (NF: normal, SS: strike-slip, TF: thrust and U: undefined tectonic stress regime), length of the lines indicate the quality and reliability of the SHmax orientation based on the WSM quality ranking scheme. The azimuth of each line shows the orientation of SHmax in each location. Note that only A-C quality SHmax data records are plotted on the maps.
154

Figure 3: Typical examples of drilling-related stress indicators including borehole breakouts (BOs) and drilling induced tensile fracture (DIF) in borehole image logs. The image is an acoustic one that provides a picture of the borehole wall based on the acoustic contrasts. In vertical wells, BOs and DIFs occur parallel to wellbore axis and in the opposite sides of the borehole. The BOs are interpreted as a wide pairs of low-amplitude zones (that shows elongations) and show the orientation of minimum horizontal stress, while the DIFs are identified as a narrow pairs of low-amplitude zones in acoustic image logs and indicate the orientation of maximum horizontal stress. The grey sinusoids show natural fractures with different dips in this interval. This snapshot is from well ‘Ichthys Deep’ in the Browse Basin sediments of Western Australia.
155

Figure 4: The new (2016) release of the Australian Stress Map with all 2140 (A-E) data records. Different colours in the map show different stress regimes (NF: normal, SS: strike-slip, TF: thrust and U: undefined tectonic stress regimes.), The azimuth of each line shows the orientation of maximum horizontal stress (SHmax) in each location; length of the lines indicate the quality and reliability of SHmax orientations based on the World Stress Map quality ranking scheme.
156

Figure 5: Distribution of present-day stress data in the Australian Stress Map (ASM) database. (a) Data type that shows the drilling-related stress indictors comprise the majority of the database. (b) Data quality of ASM based on the WSM quality ranking scheme. (d) Shows the tectonic stress regime of the data records in the database. (d, e, and f) show the distribution of A-D quality data records versus depth. (d) Shows the percentage of each data type and their distributions with depth. The majority of the data are from borehole-related stress indicators that provide the stress information from near surface down to five km. (e) Indicate the frequency and distribution of data quality in the ASM database. (f) Presents the frequency and distribution of tectonic stress regime in the database.
Figure 6: Location of stress provinces in the continental Australia and Papua New Guinea. Only the A-C quality data are used to define the stress provinces and at least four stress data records with A-C quality are required to define the province in a particular geographical region.
157

Figure 7: Mean orientation of maximum horizontal stress (SHmax) at the centre of 30 defined stress provinces in the Australian continent. A-C quality data that do not belong to each stress province are also shown. The background image is land topography and ocean bathymetry based on ETOPO1 model (Amante and Eakins, 2009).
Figure 8: Stress trajectories (a) and smoothed stress pattern (b) based on the 2016 Australian Stress Map database following the method explained by (Hansen and Mount, 1990) and (Müller et al., 2003). The search radius is r=750 km and the minimum number of data records required within the search radius to calculate the mean is n=3.
158

Figure 9: Variation of tectonic stress regime versus depth in the upper five km of the Australian crust based on the Australian Stress Map database. Note that we used only the data records that are > 100 km away from any plate boundary in this diagram to show the variation of stress regime only for the intraplate setting. The resulting dataset contains 211 data records assigned with tectonic stress regime in the upper five km, 39 data records are from FMS and 172 from borehole data. A change of stress regime with depth is clear where the thrust faulting stress regime is prevailing in shallower intervals which change to strike-slip in the deeper intervals.
Figure 10: Compilation of neotectonic features (from (Geoscience Australia, 2016)) and the present-day stress regime in upper five km of the Australian continent. Different colours show different stress regimes. TF: thrust, Sin./Dex. TF: sinistral and dextral thrust, NF: normal, U: undefined, TS: predominantly thrust with strike-slip component, NS: predominantly normal with strike-slip component. White lines show the smoothed mean orientation of maximum horizontal stress orientation (SHmax) from Figure 8. The majority of neotectonic features show thrust faulting stress regime that is consistent with the orientation of SHmax across the Australian continent. However, there are some inconsistencies between the stress regimes in the upper five km with neotectonic information. According to Figure 9, the ASM database shows a predominant thrust faulting stress regime in the upper one km, which is consistent with neotectonic structures. However, the tectonic regime is depth-dependant and changes to strike-slip or normal at deeper intervals.
159

Figure 11: Classification of various orders of crustal stress sources with spatial and temporal effects, as well as major implications and some Australian examples (modified and complied from (Heidbach et al., 2007; Rajabi et al., 2016b; Reiter et al., 2014; Tingay et al., 2006; Zoback et al., 1989). According to this classification, the orders of stress in the Earth’s lithosphere can be explained by interaction of different sources. (a) Plate boundary forces are the first-order control on the stress field of continental Australia. (b) and (c) show significant rotation of stress orientations due to presence of second and third order of stress sources (basement structures, faults and lithological contrasts) in the Surat and Gunnedah basins in eastern Australia. (d) Shows an example of stress rotation at wellbore scale owing to fourth-order of stress sources (faults and fractures).
160

Figure 12: Comparison of maximum horizontal stress (SHmax) orientation and azimuth of absolute plate motion (APM). The SHmax orientations are based on the algorithm introduced by (Müller et al., 2003) for smoothing the stress pattern and APM is from HS3 reference frame based on NUVEL 1A model (Gripp and Gordon, 2002). The histogram shows the distribution of misfit angle between APM and SHmax orientation for each stress data record in the Australian Stress Map database. SHmax orientations in the Australian continent show no correlation with the APM. The distribution curve shows the typical trend for stable North America (Richardson, 1992).
161

Figure 13: Comparison between regional orientation of maximum horizontal stress (SHmax) inferred from our study and predicted SHmax orientation by published geomechanical-numerical models. Black arrows in panel (a) show the observed SHmax orientation at each stress provinces across Australia. Blue and red arrows (in panel b-f) show the pseudo-stress provinces inferred from published stress models. (b) SHmax prediction from plate-scale and 2D model by Reynolds et al. (2003) that considered the Indo-Australian Plate as an elastic and homogenous. (c) Blue and red arrows are predictions by Burbidge (2004) that suggest a NE-SW orientation for eastern Australia however this model predicted a prevailing normal tectonic stress regime (red) for this region which is inconsistent with observational data. (d and e) blue arrows show the result of plate-scale model by Dyksterhuis et al. (2005a) that considered the Australian continent as homogenous (d) and heterogeneous (e) body based on realistic geomechanical properties for craton, fold belts and basins as different. (f) SHmax Prediction by Müller et al. (2012). Most of the models predicted a NW-SE for the eastern Australia while the observational data suggest an ENE-WSW orientation.
162

Figure 14: Schematic diagram that shows the control on the stress pattern at each location based on different forces at different scales (modified from Tingay, 2009). In this case, first-order stress sources (e.g. ridge push) generate a significant east-west SHmax orientation for the region. However, second, third and fourth orders of stress sources perturb the stress pattern. Hence, stress orientation at each location is the result of superposition and summation of all forces acting at hundreds of kilometres to couple of meters.
163

References
Aadnoy, B.S., 1990. In-situ stress directions from borehole fracture traces. Journal of Petroleum Science and Engineering, 4(2): 143-153.
Aadnoy, B.S. and Bell, J.S., 1998. Classification of drilling-induced fractures and their relationship to in-situ stress directions. The Log Analyst, 39(6): 27-42.
Albaric, J., Oye, V., Langet, N., Hasting, M., Lecomte, I., Iranpour, K., Messeiller, M. and Reid, P., 2014. Monitoring of induced seismicity during the first geothermal reservoir stimulation at Paralana, Australia. Geothermics, 52(0): 120-131.
Alexander, L.G. and Worotnicki, G., 1957. Rock stress tests in Tumut 2 exploratory tunnel, Snowy Mountains Hydro-Electric Authority.
Amadei, B. and Stephansson, O., 1997. Rock stress and its measurement. Chapman & Hall, London. Amante, C. and Eakins, B.W., 2009. ETOPO1 1 arc-minute global relief model procedures, data
sources and analysis. NOAA Technical Memorandum NESDIS NGDC-24. National Geophysical Data Center, NOAA. .
Anderson, E.M., 1905. The dynamics of faulting. Transactions of the Edinburgh Geological Society, 8: 387–402.
Asanuma, H., Soma, N., Kaieda, H., Kumano, Y., Izumi, T., Tezuka , K., Niitsuma, H. and Wyborn, D., 2005. Microseismic Monitoring of Hydraulic Stimulation at the Australian HDR Project in Cooper Basin World Geothermal Congress 2005, Antalya, Turkey, pp. 5.
Ask, M.V.S., 1997. In situ stress from breakouts in the Danish sector of the North Sea. Marine and Petroleum Geology, 14(3): 231-243.
Bailey, A., King, R. and Backe, G., 2012. Integration of structural, stress, and seismic data to define secondary permeability networks through deep-cemented sediments in the Northern Perth Basin. APPEA Journal, 52: 455-474.
Bailey, A., King, R., Holford, S., Sage, J., Hand, M. and Backe, G., 2014. Defining structural permeability in Australian sedimentary basins. APEA JOURNAL, 2015: 119-147.
Bailey, A.H.E., King, R.C., Holford, S.P. and Hand, M., 2016. Incompatible stress regimes from geological and geomechanical datasets: Can they be reconciled? An example from the Carnarvon Basin, Western Australia. Tectonophysics, 683: 405-416.
Balfour, N.J., Cummins, P.R., Pilia, S. and Love, D., 2015. Localization of intraplate deformation through fluid-assisted faulting in the lower-crust: The Flinders Ranges, South Australia. Tectonophysics, 655: 97-106.
Barth, A., Reinecker, J. and Heidbach, O., 2008. Stress derivation from earthquake focal mechanisms World Stress Map Project Guidelines, (12pp). Available on: http://dc-app3-14.gfz-potsdam.de/pub/guidelines/WSM_analysis_guideline_focal_mechanisms.pdf.
Barton, C.A. and Moos, D., 2010. Geomechanical wellbore imaging: key to managing the asset life cycle. In: M. Pöppelreiter, C. Garcia-Carballido and M. Kraaijveld (Editors), Dipmeter and Borehole Image Log Technology. American Association of Petroleum Geologists Memoir pp. 81-112.
Bell, J.S., 1990. Investigating stress regimes in sedimentary basins using information from oil industry wireline logs and drilling records. Geological Society London, Special Publications, 48(1): 305-325.
Bell, J.S., 1996a. Petro Geoscience 1. In situ stresses in sedimentary rocks (part 1): measurement techniques. Geoscience Canada, 23(2): 85-100.
Bell, J.S., 1996b. Petro Geoscience 2. In situ stresses in sedimentary rocks (part 2): applications of stress measurements. Geoscience Canada, 23(3): 135-153.
Bell, J.S., 2006. In-situ stress and coal bed methane potential in Western Canada. Bulletin of Canadian Petroleum Geology, 54(3): 197-220.
Bell, J.S. and Babcock, E.A., 1986. The stress regime of the Western Canadian Basin and implications for hydrocarbon production. Bulletin of Canadian Petroleum Geology, 34(3): 364-378.
Bell, J.S. and Gough, D.I., 1979. Northeast-southwest compressive stress in Alberta evidence from oil wells. Earth and Planetary Science Letters, 45(2): 475-482.
164

Berard, T., Sinha, B.K., van Ruth, P., Dance, T., John, Z. and Tan, C.P., 2008. Stress Estimation at the Otway CO2 Storage Site, Australia, SPE Asia Pacific Oil and Gas Conference and Exhibition. Society of Petroleum Engineers, Perth, Australia, pp. 26.
Bevis, M., Taylor, F.W., Schutz, B.E., Recy, J., Isacks, B.L., Helu, S., Singh, R., Kendrick, E., Stowell, J., Taylor, B. and Calmantli, S., 1995. Geodetic observations of very rapid convergence and back-arc extension at the Tonga arc. Nature, 374(6519): 249-251.
Bird, P., 2003. An updated digital model of plate boundaries. Geochemistry, Geophysics, Geosystems, 4(3): 1027.
Bird, P. and Liu, Z., 1999. Global finite-element model makes a small contribution to intraplate seismic hazard estimation. Bulletin of the Seismological Society of America, 89(6): 1642-1647.
Blomberg, J.R., 1971. The Determination and Considerations of Induced Fracture Strike, SPE Eastern Regional Meeting Society of Petroleum Engineers, Charleston, West Virginia, pp. 8.
Blumling, P., 1986. In situ Spannungsmessungen in Tiefbohrungen mit Hilfe von Bohrlochrandausbrnchen und die Spannungsverteilung in der Kruste Mitteleuropas und Australiens, University of Karlsruhe, Karlsruhe, Germany, 135 pp.
Bock, G. and Denham, D., 1983. Recent earthquake activity in the Snowy Moutains region and its relationship to major faults. Journal of the Geological Society of Australia, 30(3-4): 423-429.
Borthwick, D., 2010. The Report of the Montara Commission of Inquiry. Montara Commission of Inquiry, Canberra (2010) http://www.industry.gov.au/AboutUs/CorporatePublications/MontaraInquiryResponse/Documents/Montara-Report.pdf (accessed 22.03.16).
Bott, M.H.P., 1959. The mechanics of oblique slip faulting. Geological Magazine, 96(2): 109-117. Bradley, W.B., 1979. Failure of Inclined Boreholes. Journal of Energy Resources Technology, 101(4):
232-239. Brereton, R., Muller, B., Hancock, P., Harper, T., Bott, M.H.P., Sanderson, D. and Kusznir, N., 1991.
European Stress: Contributions from Borehole Breakouts [and Discussion]. Philosophical Transactions: Physical Sciences and Engineering, 337(1645): 165-179.
Brooke-Barnett, S., Flottmann, T., Paul, P.K., Busetti, S., Hennings, P., Reid, R. and Rosenbaum, G., 2015. Influence of basement structures on in situ stresses over the Surat Basin, southeast Queensland. Journal of Geophysical Research: Solid Earth, 120(7): 4946-4965.
Buchmann, T.J. and Connolly, P.T., 2007. Contemporary kinematics of the Upper Rhine Graben: A 3D finite element approach. Global and Planetary Change, 58(1–4): 287-309.
Burbidge, D.R., 2004. Thin plate neotectonic models of the Australian plate. Journal of Geophysical Research: Solid Earth, 109(B10): B10405.
Célérier, B., Etchecopar, A., Bergerat, F., Vergely, P., Arthaud, F. and Laurent, P., 2012. Inferring stress from faulting: From early concepts to inverse methods. Tectonophysics, 581: 206-219.
Clark, D. and Leonard, M., 2003. Principal stress orientations from multiple focal-plane solutions: new insight into the Australian intraplate stress field. Geological Society of America Special Papers, 372: 91-105.
Clark, D., McPherson, A. and Allen, T., 2014. Intraplate Earthquakes in Australia. In: P. Talwani (Editor), Intraplate Earthquakes. Cambridge University Press, pp. 398.
Clark, D., McPherson, A., Cupper, M., Collins, C.D.N. and Nelson, G., 2015. The Cadell Fault, southeastern Australia: a record of temporally clustered morphogenic seismicity in a low-strain intraplate region. Geological Society, London, Special Publications, 432.
Clark, D., McPherson, A. and Van Dissen, R., 2012. Long-term behaviour of Australian stable continental region (SCR) faults. Tectonophysics, 566–567(0): 1-30.
Cleary, J.R., 1962. Near earthquake studies in south-eastern Australia, Australian National University. Cleary, J.R., Doyle, H.A. and Moye, D.G., 1964. Seismic activity in the snowy mountains region and
its relationship to geological structures. Journal of the Geological Society of Australia, 11(1): 89-106.
Cloetingh, S. and Wortel, R., 1985. Regional stress field of the Indian Plate. Geophysical Research Letters, 12(2): 77-80.
Cloetingh, S. and Wortel, R., 1986. Stress in the Indo-Australian plate. Tectonophysics, 132(1–3): 49-67.
165

Coblentz, D. and Richardson, R.M., 1995. Statistical trends in the intraplate stress field. Journal of Geophysical Research: Solid Earth, 100(B10): 20245-20255.
Coblentz, D., Sandiford, M., Richardson, R.M., Zhou, S. and Hillis, R., 1995. The origins of the intraplate stress field in continental Australia. Earth and Planetary Science Letters, 133(3–4): 299-309.
Coblentz, D., Zhou, S., Hillis, R., Richardson, R.M. and Sandiford, M., 1998. Topography, boundary forces, and the Indo-Australian intraplate stress field. Journal of Geophysical Research: Solid Earth, 103(B1): 919-931.
Cornet, F.H., 2015. Elements of crustal geomechanics. Cambridge University Press, 490 pp. Davis, J.C., 2002. Statistics and data analysis in geology. Wiley, New York, 656 pp. Debayle, E., 1999. SV-wave azimuthal anisotropy in the Australian upper mantle: preliminary results
from automated Rayleigh waveform inversion. Geophysical Journal International, 137(3): 747-754.
Debayle, E., Kennett, B. and Priestley, K., 2005. Global azimuthal seismic anisotropy and the unique plate-motion deformation of Australia. Nature, 433(7025): 509-512.
Debayle, E. and Kennett, B.L.N., 2000. Anisotropy in the Australasian upper mantle from Love and Rayleigh waveform inversion. Earth and Planetary Science Letters, 184(1): 339-351.
Debayle, E. and Kennett, B.L.N., 2003. Surface-wave studies of the Australian region. Geological Society of America Special Papers, 372: 25-40.
Denham, D., 1980. The 1961 Robertson earthquake - more evidence for compressive stress in Southeast Australia. BMR Journal of Australian Geology & Geophysics(5): 153-156.
Denham, D., Alexander, L.G. and Worotnicki, G., 1979. Stresses in the Australian crust: evidence from earthquakes and in-situ stress measurements. BMR Journal of Australian Geology and Geophysics, 67(4): 289-295.
Denham, D., Alexander, L.G. and Worotnicki, G., 1980. The stress field near the sites of the Meckering (1968) and Calingiri (1970) earthquakes, Western Australia. Tectonophysics, 67(3–4): 283-317.
Denham, D., Bock, G. and Smith, R.S., 1982. The Appin (New SouthWales) earthquake of 15 November 1981. BMR Journal of Geology & Geophysics, 28: 323-332.
Denham, D., Jones, T. and Weekes, J., 1985. The 1982 Wyalong earthquakes (NSW) and recent crustal deformation. BMR Journal of Australian Geology & Geophysics, 9: 255-260.
Denham, D., Weekes, J. and Krayshek, C., 1981. Earthquake evidence for compressive stress in the southeast Australian crust. Journal of the Geological Society of Australia, 28(3-4): 323-332.
Denham, D. and Windsor, C.R., 1991. The crustal stress pattern in the Australian continent. Exploration Geophysics, 22(1): 101-106.
Dyksterhuis, S., Albert, R.A. and Müller, R.D., 2005a. Finite-element modelling of contemporary and palaeo-intraplate stress using ABAQUS™. Computers & geosciences, 31(3): 297-307.
Dyksterhuis, S., Müller, R.D. and Albert, R.A., 2005b. Paleostress field evolution of the Australian continent since the Eocene. Journal of Geophysical Research: Solid Earth, 110(B5): B05102.
Dziewonski, A.M., Chou, T.A. and Woodhouse, J.H., 1981. Determination of earthquake source parameters from waveform data for studies of global and regional seismicity. Journal of Geophysical Research: Solid Earth, 86(B4): 2825-2852.
Ekström, G., Nettles, M. and Dziewoński, A.M., 2012. The global CMT project 2004–2010: Centroid-moment tensors for 13,017 earthquakes. Physics of the Earth and Planetary Interiors, 200–201: 1-9.
Enever, J.R., Gale, W. and Fabjanczvk, M., 1999. A Study of the Variability of the Horizontal Stress Field In a Sedimentary Basin, 9th ISRM Congress. International Society for Rock Mechanics, Paris, France, pp. 1257-1260.
Enever, J.R., Hattersley, P. and Wooltorton, B., 1984. In situ rock stress measurements using the hydraulic fracturing technique for the proposed Sydney Ocean outfalls project, Fifth Australian Tunnelling Conference: State of the Art in Underground Development and Construction. Institution of Engineers, Australia, Barton, ACT, pp. 114-121.
Engelder, T., 1993. Stress regimes in the lithosphere. Princeton University Press, New Jersey.
166

Everingham, I.B. and Smith, R.S., 1979. Implications of fault-plane solutions for Australian earthquakes of 4 July 1977, 6 May 1978 and 25 November 1978. BMR Journal of Australian Geology & Geophysics, 4: 297-301.
Ferrill, D.A., Stamatakos, J.A. and Sims, D., 1999. Normal fault corrugation: implications for growth and seismicity of active normal faults. Journal of Structural Geology, 21(8–9): 1027-1038.
Fisher, M.K. and Warpinski, N.R., 2012. Hydraulic-Fracture-Height Growth: Real Data. SPE Production & Operations, 27(01): 8-19.
Fitch, T.J., 1976. The Picton earthquake of 9 March 1973: A seismic view of the source. In: D. Denham (Editor), Seismicity and earthquake risk in eastern Australia. Department of National Resources, Burea of mineral resources, geology and geophysics, Canberra.
Fitch, T.J., Worthington, M.H. and Everingham, I.B., 1973. Mechanisms of Australian earthquakes and contemporary stress in the Indian ocean plate. Earth and Planetary Science Letters, 18(2): 345-356.
Flottmann, T., Brooke-Barnett, S., Trubshaw, R., Naidu, S.-K., Kirk-Burnnand, E., Paul, P., Busetti, S. and Hennings, P., 2014. Influence of in-situ stresses on fracture stimulations in the Surat Basin, southeast Queensland, SPE Unconventional Resources Conference and Exhibition-Asia Pacific. SPE-167064-MS, Brisbane, Australia pp. 14 pages.
Fredrich, J., McCaffrey, R. and Denham, D., 1988. Source Parameters of Seven Large Australian Earthquakes Determined By Body Waveform Inversion. Geophysical Journal International, 95(1): 1-13.
Gale, W.J., Enever, J.R., Blackwood, R.L. and McKay, J., 1984. An investigation of the effect of a fault /monocline structure on the in-situ stress field and mining conditions at Nattai Bulli Colliery NSW, Australia, . CSIRO Australia, Division of Geomechanics, Geomechanics of Coal Mining Report No. 48.
Gaucher, E., Schoenball, M., Heidbach, O., Zang, A., Fokker, P.A., van Wees, J.-D. and Kohl, T., 2015. Induced seismicity in geothermal reservoirs: A review of forecasting approaches. Renewable and Sustainable Energy Reviews, 52: 1473-1490.
GEOFON Data Centre, 1993. GEOFON Seismic Network. doi:10.14470/TR560404. Geoscience Australia, 2016. Neotectonic features - Geoscience Australia:
http://www.ga.gov.au/earthquakes/staticPageController.do?page=neotectonics. Ghosh, A., Holt, W.E. and Flesch, L.M., 2009. Contribution of gravitational potential energy
differences to the global stress field. Geophysical Journal International, 179(2): 787-812. Ghosh, A., Holt, W.E., Flesch, L.M. and Haines, A.J., 2006. Gravitational potential energy of the
Tibetan Plateau and the forces driving the Indian plate. Geology, 34(5): 321-324. Greenhalgh, S.A., Love, D., Malpas, K. and McDougall, R., 1994. South Australian earthquakes,
1980–92. Australian Journal of Earth Sciences, 41(5): 483-495. Greenhalgh, S.A. and Singh, R., 1988. The seismicity of the Adelaide Geosyncline, South Australia.
Bulletin of the Seismological Society of America, 78(1): 243-263. Gregson, P.J. and Denham, D., 1987. Australian Seismological Report 1983. Dept. of Primary Ind.
and Energy, Canberra, ACT, Australia - Report 280. Gripp, A.E. and Gordon, R.G., 2002. Young tracks of hotspots and current plate velocities.
Geophysical Journal International, 150(2): 321-361. Grünthal, G., 2014. Induced seismicity related to geothermal projects versus natural tectonic
earthquakes and other types of induced seismic events in Central Europe. Geothermics, 52: 22-35.
Haimson, B.C. and Cornet, F.H., 2003. ISRM Suggested Methods for rock stress estimation—Part 3: hydraulic fracturing (HF) and/or hydraulic testing of pre-existing fractures (HTPF). International Journal of Rock Mechanics and Mining Sciences, 40(7–8): 1011-1020.
Hansen, K.M. and Mount, V.S., 1990. Smoothing and extrapolation of crustal stress orientation measurements. Journal of Geophysical Research: Solid Earth, 95(B2): 1155-1165.
Hast, N., 1969. The state of stress in the upper part of the earth's crust. Tectonophysics, 8(3): 169-211. Hayes, J., 2012. Operator competence and capacity – Lessons from the Montara blowout. Safety
Science, 50(3): 563-574.
167

Heffer, K.J., Fox, R.J., McGill, C.A. and Koutsabeloulis, N.C., 1997. Novel Techniques Show Links between Reservoir Flow Directionality, Earth Stress, Fault Structure and Geomechanical Changes in Mature Waterfloods. SPE Journal, 2(02): 91-98.
Heffer, K.J. and Lean, J.C., 1991. Earth stress orientation - a control on, and guide to, flooding directionality in a majority of reservoirs. In: B. Linville (Editor), Reservoir Characterization III. PennWell Books, Tulsa, pp. 799-822.
Heidbach, O. and Ben-Avraham, Z., 2007. Stress evolution and seismic hazard of the Dead Sea Fault System. Earth and Planetary Science Letters, 257(1–2): 299-312.
Heidbach, O. and Höhne, J., 2008. CASMI—A visualization tool for the World Stress Map database. Computers & Geosciences, 34(7): 783-791.
Heidbach, O. and Reinecker, J., 2013. Analyse des rezenten Spannungsfeldes der Nordschweiz, (Arbeitsbericht NAB 12-05 / nagra), Wettingen : Nationale Genossenschaft für die Lagerung radioaktiver Abfälle (nagra).http://www.nagra.ch/data/documents/database/dokumente/$default/Default%20Folder/Publikationen/NABs%202004-2012/d_nab12-005.pdf.
Heidbach, O., Reinecker, J., Tingay, M., Müller, B., Sperner, B., Fuchs, K. and Wenzel, F., 2007. Plate boundary forces are not enough: Second- and third-order stress patterns highlighted in the World Stress Map database. Tectonics, 26(6): TC6014.
Heidbach, O., Tingay, M., Barth, A., Reinecker, J., Kurfeß, D. and Müller, B., 2008. The World Stress Map database release 2008. URL: www.world-stress-map.org.
Heidbach, O., Tingay, M., Barth, A., Reinecker, J., Kurfeß, D. and Müller, B., 2010. Global crustal stress pattern based on the World Stress Map database release 2008. Tectonophysics, 482(1–4): 3-15.
Hergert, T. and Heidbach, O., 2010. Slip-rate variability and distributed deformation in the Marmara Sea fault system. Nature Geosci, 3(2): 132-135.
Hergert, T. and Heidbach, O., 2011a. Geomechanical model of the Marmara Sea region—II. 3-D contemporary background stress field. Geophysical Journal International, 185(3): 1090-1102.
Hergert, T. and Heidbach, O., 2011b. Geomechanical model of the Marmara Sea region - II. 3-D contemporary background stress field. Geophys. J. Int.: doi:10.1111/j.1365-246X.2011.04992.x, 1090-1102.
Hergert, T., Heidbach, O., Reiter, K., Giger, S.B. and Marschall, P., 2015. Stress field sensitivity analysis in a sedimentary sequence of the Alpine foreland, Northern Switzerland. Solid Earth Discuss., 7(1): 711-756.
Hillis, R., 1991. Australia-Banda Arc collision and in situ stress in the Vulcan Sub-basin (Timor Sea) as revealed by borehole breakout data. Exploration Geophysics, 22(1): 189-194.
Hillis, R., 2001. Coupled changes in pore pressure and stress in oil fields and sedimentary basins. Petroleum Geoscience, 7(4): 419-425.
Hillis, R., Enever, J.R. and Reynolds, S.D., 1999. In situ stress field of eastern Australia. Australian Journal of Earth Sciences, 46(5): 813-825.
Hillis, R., Meyer, J.J. and Reynolds, S.D., 1998. The Australian stress map. Exploration Geophysics, 29(4): 420-427.
Hillis, R., Mildren, S.D., Pigram, C.J. and Willoughby, D.R., 1997. Rotation of horizontal stresses in the Australian North West continental shelf due to the collision of the Indo-Australian and Eurasian Plates. Tectonics, 16(2): 323-335.
Hillis, R., Monte, S.A., Tan, C.P. and Willoughby, D.R., 1995. The contemporary stress field of the Otway Basin, South Australia: implications for hydrocarbon exploration and production. Australian Petroleum Exploration Association Journal,, 35: 494-506.
Hillis, R. and Nelson, E.J., 2005. In situ stresses in the North Sea and their applications: petroleum geomechanics from exploration to development. Geological Society, London, Petroleum Geology Conference series, 6: 551-564.
Hillis, R. and Reynolds, S.D., 2000. The Australian Stress Map. Journal of the Geological Society, 157(5): 915-921.
Hillis, R. and Reynolds, S.D., 2003. In situ stress field of Australia. Geological Society of America Special Papers, 372: 49-58.
168

Hillis, R., Sandiford, M., Reynolds, S.D. and Quigley, M.C., 2008. Present-day stresses, seismicity and Neogene-to-Recent tectonics of Australia's ‘passive’ margins: intraplate deformation controlled by plate boundary forces. Geological Society, London, Special Publications, 306(1): 71-90.
Hillis, R. and Williams, A.F., 1993a. The contemporary stress field of the Barrow-Dampier Sub-Basin and its implications for horizontal drilling. Exploration Geophysics, 24(4): 567-576.
Hillis, R.R. and Williams, A.F., 1993b. The stress field of the North West Shelf and wellbore stability. APPEA Journal, 33: 373-385.
Holdgate, G.R., Wallace, M.W., Gallagher, S.J., Smith, A.J., J.B., K., Moore, D. and Shafil, S., 2003. Plio-Pleistocene tectonics and eustasy in the Gippsland Basin, southeast Australia: evidence from magnetic imagery and marine geological data. Australian Journal of Earth Sciences, 50: 403-426.
Holford, S.P., Hillis, R., Duddy, I.R., Green, P.F., Stoker, M.S., Tuitt, A.K., Backé, G., Tassone, D.R. and MacDonald, J., 2011. Cenozozic post-breakup compressional deformation and exhumation of the Southern Australian Margin. APPEA Journal, 51: 613-638.
Hubbert, M.K. and Willis, D.G., 1957. Mechanics of hydraulic fracturing. Transactions of the American Institute of Mining, Metallurgical, and Petroleum Engineers, 210: 153-166.
Hunt, S.P.M., C.P., 2006. Cooper Basin HDR hazard evaluation: Predictive modelling of local stress changes due to HFR geothermal energy operations in South Australia. South Australia. Department of Primary Industries and Resources. Report Book 2006/16.
Jepson, G., 2014. In-situ stress and natural fracture networks in the Carnarvon Basin, North West Shelf, Australia, University of Adelaide, Adelaide.
Johnston, A.C., Coppersmith, K.J., Kanter, L.R. and Cornell, C.A., 1994. The earthquakes of stable continental regions. Electric Power Research Institute Report TR102261V1.
Keep, M. and Schellart, W.P., 2012. Introduction to the thematic issue on the evolution and dynamics of the Indo-Australian plate. Australian Journal of Earth Sciences, 59(6): 807-808.
Kennett, B.L.N., Fishwick, S. and Heintz, M., 2004. Lithospheric structure in the Australian region - a synthesis of surface wave and body wave studies. Exploration Geophysics, 35(4): 242-250.
King, G.E., 2010. Thirty Years of Gas Shale Fracturing: What Have We Learned?, SPE Annual Technical Conference and Exhibition. Society of Petroleum Engineers (SPE-133456-MS), Florence, Italy, pp. 50.
King, R., Holford, S.P., Hillis, R., Tuitt, A., Swierczek, E., Backé, G., Tassone, D.R. and Tingay, M., 2012. Reassessing the in-situ stress regimes of Australia's petroleum basins. APPEA Journal, 52: 415-425.
King, R.C., Hillis, R. and Reynolds, S.D., 2008. In situ stresses and natural fractures in the Northern Perth Basin, Australia. Australian Journal of Earth Sciences, 55(5): 685-701.
King, R.C., Hillis, R., Tingay, M.R.P. and Morley, C.K., 2009. Present-day stress and neotectonic provinces of the Baram Delta and deep-water fold–thrust belt. Journal of the Geological Society, 166(2): 197-200.
Kingsborough, R.H., Williams, A.F. and Hillis, R., 1991. Borehole Instability on the Northwest Shelf of Australia, SPE Asia-Pacific Conference Society of Petroleum Engineers, Perth. Australia, pp. 653-662.
Kirsch, E.G., 1898. Die Theorie der Elastizität und die Bedürfnisse der Festigkeitslehre. Zeitschrift des Vereines Deutscher Ingenieure, 42: 797-807.
Klee, G., Bunger, A., Meyer, G., Rummel, F. and Shen, B., 2011. In Situ Stresses in Borehole Blanche-1/South Australia Derived from Breakouts, Core Discing and Hydraulic Fracturing to 2 km Depth. Rock Mechanics and Rock Engineering, 44(5): 531-540.
Kraft, T. and Deichmann, N., 2014. High-precision relocation and focal mechanism of the injection-induced seismicity at the Basel EGS. Geothermics, 52: 59-73.
Lambeck, K., McQueen, H., Stephenson, R. and Denham, D., 1984. The state of stress within the Australian continent, Annales Geophysicae. Gauthier-Villars, pp. 723-741.
Leeman, E.R., 1964. The measurement of stress in rock - Parts I, II and III. Journal of the Southern African Institute of Mining and Metallurgy, 65: 45–114, 254–284.
Leonard, M., 2008. One hundred years of earthquake recording in Australia. Bulletin of the Seismological Society of America, 98(3): 1458-1470.
169

Leonard, M. and Clark, D., 2011. A record of stable continental region earthquakes from Western Australia spanning the late Pleistocene: Insights for contemporary seismicity. Earth and Planetary Science Letters, 309(3–4): 207-212.
Leonard, M., Ripper, I.D. and Yue, L., 2002. Australian earthquake fault plane solutions. Geoscience Australia, Record 2002/19.
Lowry, D., 1990. Breakouts in oil wells. PESA Journal, 17: 43-44. MacGregor, S., 2002. Acoustic scanner analysis of borehole breakout to define the stress field across
mine sites in the Sydney and Bowen Basins, Australia 21st International Conference on Ground Control in Mining Morgantown, WV, USA, pp. 278-287.
MacGregor, S., 2003. Maximising in situ stress measurement data from borehole breakout using acoustic scanner and wireline tools, Final report ACARP Project C10009.
MacGregor, S. and Gale, W., 2000. In situ stress measurement using acoustic scanner analysis of borehole breakout, Bowen Basin Symposium, pp. 97-106.
Mardia, K.V., 1972. Statistics of directional data / K.V. Mardia. Probability and mathematical statistics. Academic Press, London ; New York.
McCaffrey, R., 1989. Teleseismic investigation of the January 22, 1988 Tennant Creek, Australia, earthquakes. Geophysical Research Letters, 16(5): 413-416.
McCallum, R.E. and Bell, J.S., 1994a. Western Canada Sedimentary Basin borehole imagery analysis project: a summary of Mobil Phillps Sukunka D-70-I/93-P-4, Geological Survey of Canada, Open File 2934.
McCallum, R.E. and Bell, J.S., 1994b. Western Canada Sedimentary Basin borehole imagery analysis project: a summary of PETRO CANADA Murray River C-40-H/93-I-14, Geological Survey of Canada, Open File 2906.
McCallum, R.E. and Bell, J.S., 1994c. Western Canada Sedimentary Basin borehole imagery analysis project: a summary of TOTAL CONWEST Cypress C-50-B/94-B-15, Geological Survey of Canada, Open File 2945.
McCue, K., 1990. Australia's large earthquakes and Recent fault scarps. Journal of Structural Geology, 12(5–6): 761-766.
McCue, K., 2014. Historical earthquakes in Western Australia. Australian Earthquake Engineering Society, Canberra: 46.
McCue, K., Gibson, G. and Wesson, V., 1990a. The earthquake near Nhill, western Victoria, on 22 December 1987 and the seismicity of eastern Australia. BMR Journal of Australian Geology and Geophysics, 11(4): 415-420.
McCue, K., Wesson, V. and Gibson, G., 1990b. The Newcastle, New South Wales, earthquake of 28 December 1989. BMR Journal of Australian Geology and Geophysics, 11(4): 559-567.
McCue, K.F., 1989. Australian Seismological Report 1985. Dept. of Primary Ind. and Energy, Canberra, ACT, Australia, Canberra, Australia - Report 285: 50.
McCue, K.F. and Sutton, D.J., 1979. South Australian earthquakes during 1976 and 1977. Journal of the Geological Society of Australia, 26(5-6): 231-236.
McEwin, A., Underwood, R. and Denham, D., 1976. Earthquake risk in Australia. BMR Journal of Australian Geology and Geophysics, 1(1): 15-21.
McGarr, A. and Gay, N.C., 1978. State of stress in the Earth's crust. Annual Review of Earth and Planetary Sciences, 6: 405-436.
McKenzie, D.P., 1969. The relation between fault plane solutions for earthquakes and the directions of the principal stresses. Bulletin of the Seismological Society of America, 59(2): 591-601.
Micklethwaite, S., Sheldon, H.A. and Baker, T., 2010. Active fault and shear processes and their implications for mineral deposit formation and discovery. Journal of Structural Geology, 32(2): 151-165.
Mildren, S.D. and Hillis, R., 2000. In situ stresses in the Southern Bonaparte Basin, Australia: Implications for first- and second-order controls on stress orientation. Geophysical Research Letters, 27(20): 3413-3416.
Mildren, S.D., Hillis, R., Fett, T. and Robinson, P.H., 1994. Contemporary stresses in the Timor Sea: implications for fault trap integrity. In: P.G. Purcell and R.R. Purcell (Editors), Petroleum Exploration Society of Australia Symposium: The Sedimentary Basins of Western Australia, Perth, Western Australia, pp. 291-300.
170

Mildren, S.D., Hillis, R. and Kaldi, J., 2002. Calibrating predictions of fault seal rectivation in the Timor Sea. APPEA Journal, 42: 187-202.
Morelli, C.P., 2009. Analysis and management of seismic risks associated with engineered geothermal system operations in South Australia, Report Book 2009/11, Petroleum and Geothermal Group, Department of Primary Industries and Resources South Australia, Adelaide.
Mount, V.S. and Suppe, J., 1987. State of stress near the San Andreas fault: Implications for wrench tectonics. Geology, 15(12): 1143-1146.
Müller, B., Heidbach, O., Negut, M., Sperner, B. and Buchmann, T., 2010. Attached or not attached—evidence from crustal stress observations for a weak coupling of the Vrancea slab in Romania. Tectonophysics, 482(1–4): 139-149.
Müller, B., Wehrle, V., Hettel, S., Sperner, B. and Fuchs, K., 2003. A new method for smoothing orientated data and its application to stress data. Geological Society, London, Special Publications, 209(1): 107-126.
Müller, B., Zoback, M.L., Fuchs, K., Mastin, L., Gregersen, S., Pavoni, N., Stephansson, O. and Ljunggren, C., 1992. Regional patterns of tectonic stress in Europe. Journal of Geophysical Research: Solid Earth, 97(B8): 11783-11803.
Müller, R.D., Dyksterhuis, S. and Rey, P., 2012. Australian paleo-stress fields and tectonic reactivation over the past 100 Ma. Australian Journal of Earth Sciences, 59(1): 13-28.
Nelson, E.J., Hillis, R., Sandiford, M., Reynolds, S. and Mildren, S.D., 2006. Present-day state-of-stress of southeast Australia. APPEA Journal, 2006: 283-305.
Olsen, T.N., Bratton, T.R., Tanner, K.V., donald, A. and Koepsell, R., 2007. Application of Indirect Fracturing for efficient Stimulation of Coalbed Methane, Rocky Mountain Oil & Gas Technology Symposium. Society of Petroleum Engineers, Denver, Colorado, .
Paillet, F.L., 1985. Applications Of Borehole-Acoustic Methods In Rock Mechanics, The 26th U.S. Symposium on Rock Mechanics (USRMS). American Rock Mechanics Association, Rapid City, South Dakota, pp. 207-220.
Palmer, I., 2010. Coalbed methane completions: A world view. International Journal of Coal Geology, 82(3–4): 184-195.
Plumb, R.A. and Hickman, S.H., 1985. Stress-induced borehole elongation: A comparison between the four-arm dipmeter and the borehole televiewer in the Auburn Geothermal Well. Journal of Geophysical Research: Solid Earth, 90(B7): 5513-5521.
Quigley, M., Clark, D. and Sandiford, M., 2010. Tectonic geomorphology of Australia. Geological Society of London Special Publications, 346: 243-265.
Quigley, M., Cupper, M. and Sandiford, M., 2006. Quaternary faults of south-central Australia: palaeoseismicity, slip rates and origin. Australian Journal of Earth Sciences, 53(2): 285-301.
Rajabi, M., Tingay, M. and Heidbach, O., 2016a. The present-day state of tectonic stress in the Darling Basin, Australia: Implications for exploration and production. Marine and Petroleum Geology, 77: 776-790.
Rajabi, M., Tingay, M. and Heidbach, O., 2016b. The present-day stress field of New South Wales, Australia. Australian Journal of Earth Sciences, 63(1): 1-21.
Rajabi, M., Tingay, M., King, R. and Cooke, D., 2015. The present-day stress field of Australia: New release of the Australian Stress Map. ASEG Extended Abstracts, 2015(1): 1-3.
Rajabi, M., Tingay, M., King, R. and Heidbach, O., 2016c. Present-day stress orientation in the Clarence-Moreton Basin of New South Wales, Australia: a new high density dataset reveals local stress rotations. Basin Research.
Raleigh, C.B., Healy, J.H. and Bredehoeft, J.D., 1972. Faulting and Crustal Stress at Rangely, Colorado. In: H.C. Heard, I.Y. Borg, N.L. Carter and C.B. Raleigh (Editors), Flow and Fracture of Rocks. U.S. Geological Survey, Washington, D. C., pp. 275-284.
Ranalli, G. and Chandler, T.E., 1975. The stress field in the upper crust as determined from in situ measurements. Geologische Rundschau, 64(1): 653-674.
Rasouli, V., Pervukhina, M., Müller, T.M. and Pevzner, R., 2013. In-situ stresses in the Southern Perth Basin at the GSWA Harvey-1 well site. Exploration Geophysics, 44(4): 289-298.
Reinecker, J., Tingay, M.R.P. and Müller, B., 2006. The use of the WSM database for rock engineers. In: M. Lu, C.C. Li, H. Kjorholt and H. Dahle (Editors), In-Situ Rock Stress: Measurement, interpretation and application. Taylor & Francis, London, pp. 505-510.
171

Reiter, K. and Heidbach, O., 2014. 3-D geomechanical–numerical model of the contemporary crustal stress state in the Alberta Basin (Canada). Solid Earth, 5(2): 1123-1149.
Reiter, K., Heidbach, O., Schmitt, D., Haug, K., Ziegler, M. and Moeck, I., 2014. A revised crustal stress orientation database for Canada. Tectonophysics, 636: 111-124.
Revets, S.A., Keep, M. and Kennett, B.L.N., 2009. NW Australian intraplate seismicity and stress regime. Journal of Geophysical Research: Solid Earth, 114(B10): B10305.
Reynolds, S.D., 2001. Characterization and modelling of the regional in situ stress field of continental Australia, The University of Adelaide, Adelaide, 216 pp.
Reynolds, S.D., Coblentz, D.D. and Hillis, R., 2002. Tectonic forces controlling the regional intraplate stress field in continental Australia: Results from new finite element modeling. Journal of Geophysical Research: Solid Earth, 107(B7): ETG 1-1-ETG 1-15.
Reynolds, S.D., Coblentz, D.D. and Hillis, R., 2003. Influences of plate-boundary forces on the regional intraplate stress field of continental Australia. Geological Society of America Special Papers, 372: 59-70.
Reynolds, S.D. and Hillis, R., 2000. The in situ stress field of the Perth Basin, Australia. Geophysical Research Letters, 27(20): 3421-3424.
Reynolds, S.D., Mildren, S.D., Hillis, R., Meyer, J.J. and Flottmann, T., 2005. Maximum horizontal stress orientations in the Cooper Basin, Australia: implications for plate-scale tectonics and local stress sources. Geophysical Journal International, 160(1): 331-343.
Richardson, R.M., 1992. Ridge forces, absolute plate motions, and the intraplate stress field. Journal of Geophysical Research: Solid Earth, 97(B8): 11739-11748.
Richardson, R.M., Solomon, S.C. and Sleep, N.H., 1979. Tectonic stress in the plates. Reviews of Geophysics, 17(5): 981-1019.
Roth, F. and Fleckenstein, P., 2001. Stress orientations found in north-east Germany differ from the West European trend. Terra Nova, 13(4): 289-296.
Sandiford, M., 2003. Neotectonics of southeastern Australia: linking the Quaternary faulting record with seismicity and in situ stress. Geological Society of America Special Papers, 372: 107-119.
Sandiford, M., Wallace, M. and Coblentz, D.D., 2004. Origin of the in situ stress field in south-eastern Australia. Basin Research, 16(3): 325-338.
Sbar, M.L. and Sykes, L.R., 1973. Contemporary Compressive Stress and Seismicity in Eastern North America: An Example of Intra-Plate Tectonics. Geological Society of America Bulletin, 84(6): 1861-1882.
Schmitt, D.R., Currie, C.A. and Zhang, L., 2012. Crustal stress determination from boreholes and rock cores: Fundamental principles. Tectonophysics, 580(0): 1-26.
Schulte, S.M. and Mooney, W.D., 2005. An updated global earthquake catalogue for stable continental regions: reassessing the correlation with ancient rifts. Geophysical Journal International, 161(3): 707-721.
Seeber, L. and Armbruster, J.G., 2000. Earthquakes as beacons of stress change. Nature, 407(6800): 69-72.
Segall, P., 1989. Earthquakes triggered by fluid extraction. Geology, 17(10): 942-946. Sibson, R., Ghisetti, F. and Ristau, J., 2011. Stress Control of an Evolving Strike-Slip Fault System
during the 2010–2011 Canterbury, New Zealand, Earthquake Sequence. Seismological Research Letters, 82(6): 824-832.
Sibson, R.H., 1992. Implications of Fault-Valve Behavior for Rupture Nucleation and Recurrence. Tectonophysics, 211(1-4): 283-293.
Sibson, R.H., Ghisetti, F.C. and Crookbain, R.A., 2012. Andersonian wrench faulting in a regional stress field during the 2010–2011 Canterbury, New Zealand, earthquake sequence. Geological Society, London, Special Publications, 367(1): 7-18.
Sippl, C., Kennett, B.L.N., Tkalčić, H., Spaggiari, C.V. and Gessner, K., 2015. New constraints on the current stress field and seismic velocity structure of the eastern Yilgarn Craton from mechanisms of local earthquakes. Australian Journal of Earth Sciences, 62(8): 921-931.
Sjöberg, J., Christiansson, R. and Hudson, J.A., 2003. ISRM Suggested Methods for rock stress estimation—Part 2: overcoring methods. International Journal of Rock Mechanics and Mining Sciences, 40(7–8): 999-1010.
172

SLU Earthquake Center, 2015. Saint Louis University Earthquake Center. URL:http://www.eas.slu.edu/eqc/.
Sperner, B., Müller, B., Heidbach, O., Delvaux, D., Reinecker, J. and Fuchs, K., 2003. Tectonic stress in the Earth’s crust: advances in the World Stress Map project. Geological Society, London, Special Publications, 212(1): 101-116.
Stein, R.S., 1999. The role of stress transfer in earthquake occurrence. Nature, 402(6762): 605-609. Swierczek, E., Holford, S. and Backe, G., 2015. Stress orientation and subsurface natural fracture
heterogeneity along northern margin of Gippsland Basin, Australia, Geology of Geomechanics. The Geological Society of London, London.
Sykes, L.R. and Sbar, M.L., 1973. Intraplate Earthquakes, Lithospheric Stresses and the Driving Mechanism of Plate Tectonics. Nature, 245(5424): 298-302.
Tassone, D.R., Holford, S.P., Duddy, I.R., Green, P.F. and Hillis, R., 2014. Quantifying Cretaceous–Cenozoic exhumation in the Otway Basin, southeastern Australia, using sonic transit time data: Implications for conventional and unconventional hydrocarbon prospectivity. AAPG Bulletin, 98(1): 67-117.
Tassone, D.R., Holford, S.P., Hillis, R. and Tuitt, A.K., 2012. Quantifying Neogene plate-boundary controlled uplift and deformation of the southern Australian margin. Geological Society, London, Special Publications, 367(1): 91-110.
Tingay, M., 2009. State and origin of present-day stress fields in sedimentary basins. ASEG Extended Abstracts, 2009(1): 1-10.
Tingay, M., Bentham, P., De Feyter, A. and Kellner, A., 2011. Present-day stress-field rotations associated with evaporites in the offshore Nile Delta. Geological Society of America Bulletin, 123(5-6): 1171-1180.
Tingay, M., Bentham, P., De Feyter, A. and Kellner, A., 2012. Evidence for non-Andersonian faulting above evaporites in the Nile Delta. Geological Society, London, Special Publications, 367(1): 155-170.
Tingay, M., Heidbach, O., Davies, R. and Swarbrick, R., 2008a. Triggering of the Lusi mud eruption: Earthquake versus drilling initiation. Geology, 36(8): 639-642.
Tingay, M., Muller, B., Reinecker, J. and Heidbach, O., 2006. State and Origin of the Present-Day Stress Field in Sedimentary Basins: New Results from the World Stress Map Project, The 41st U.S. Symposium on Rock Mechanics (USRMS). American Rock Mechanics Association, Golden, Colorado
Tingay, M., Müller, B., Reinecker, J., Heidbach, O., Wenzel, F. and Fleckenstein, P., 2005a. Understanding tectonic stress in the oil patch: The World Stress Map Project. The Leading Edge, 24(12): 1276-1282.
Tingay, M., Reinecker, J. and Müller, B., 2008b. Borehole breakout and drilling-induced fracture analysis from image logs. world Stress Map Project Guidelines. Available on: http://www.world-stress-map.org: 12.
Tingay, M.R.P., Hillis, R., Morley, C.K., King, R.C., Swarbrick, R.E. and Damit, A.R., 2009. Present-day stress and neotectonics of Brunei: Implications for petroleum exploration and production. AAPG Bulletin, 93(1): 75-100.
Tingay, M.R.P., Hillis, R., Morley, C.K., Swarbrick, R.E. and Drake, S.J., 2005b. Present-day stress orientation in Brunei: a snapshot of ‘prograding tectonics’ in a Tertiary delta. Journal of the Geological Society, 162(1): 39-49.
Tingay, M.R.P., Morley, C.K., Hillis, R. and Meyer, J., 2010. Present-day stress orientation in Thailand's basins. Journal of Structural Geology, 32(2): 235-248.
Tingay, M.R.P., Rudolph, M.L., Manga, M., Davies, R.J. and Wang, C.-Y., 2015. Initiation of the Lusi mudflow disaster. Nature Geosci, 8(7): 493-494.
USGS, 2015. United States Geological Survey’s (USGS) Earthquake Hazards Program. URL:http://earthquake.usgs.gov/.
Warpinski, N.R., Mayerhofer, M.J., Vincent, M.C., Cipolla, C.L. and Lolon, E., 2008. Stimulating Unconventional Reservoirs: Maximizing Network Growth While Optimizing Fracture Conductivity, SPE Unconventional Reservoirs Conference. Society of Petroleum Engineers, Keystone, Colorado, USA.
173

Weatherley, D.K. and Henley, R.W., 2013. Flash vaporization during earthquakes evidenced by gold deposits. Nature Geosci, 6(4): 294-298.
Wessel, P., Smith, W.H.F., Scharroo, R., Luis, J. and Wobbe, F., 2013. Generic Mapping Tools: Improved Version Released. Eos, Transactions American Geophysical Union, 94(45): 409-410.
Willson, S.M., 2012. A Wellbore Stability Approach For Self-Killing Blowout Assessment, SPE Deepwater Drilling and Completions Conference. Society of Petroleum Engineers, Galveston, Texas, USA, pp. 16.
Worotnicki, G. and Denham, D., 1976. The state of stress in the upper part of the earth's crust in Australia according to measurements in mines and tunnels and from seismic observations, Symposium on Investigation of Stress in Rock: Advances in Rock Measurment Institution of Engineers, Australia., pp. 71-82.
Wyborn, D., 2012. The Innamincka Enhanced Geothermal System (EGS) – dealing with the overpressures. In: H.-H. C. and G. E. (Editors), The 2012 Australian Geothermal Energy Conference. Geoscience Australia (Record 2012/73), Coogee Beach, Sydney, pp. 251-258.
Yale, D.P., 2003. Fault and stress magnitude controls on variations in the orientation of in situ stress. Geological Society, London, Special Publications, 209(1): 55-64.
Yassir, N.A. and Zerwer, A., 1997. Stress regimes in the Gulf Coast, offshore Louisiana; data from well-bore breakout analysis. AAPG Bulletin, 81(2): 293-307.
Zang, A., Oye, V., Jousset, P., Deichmann, N., Gritto, R., McGarr, A., Majer, E. and Bruhn, D., 2014. Analysis of induced seismicity in geothermal reservoirs – An overview. Geothermics, 52: 6-21.
Zang, A. and Stephansson, O., 2010. Stress Field of the Earth's Crust. Springer Dordrecht Heidelberg London New York, Springer, 322 pp.
Zang, A., Stephansson, O., Heidbach, O. and Janouschkowetz, S., 2012. World Stress Map Database as a Resource for Rock Mechanics and Rock Engineering. Geotechnical and Geological Engineering, 30(3): 625-646.
Zhang, Y., Scheibner, E., Hobbs, B.E., Ord, A., Drummond, B.J. and Cox, S.J.D., 1998. Lithospheric Structure in Southeast Australia: a Model Based on Gravity, Geoid and Mechanical Analyses, Structure and Evolution of the Australian Continent. American Geophysical Union, pp. 89-108.
Zhang, Y., Scheibner, E., Ord, A. and Hobbs, B., 1996. Numerical modelling of crustal stresses in the eastern Australian passive margin. Australian Journal of Earth Sciences, 43(2): 161-175.
Zhao, S. and Müller, R.D., 2001. The tectonic stress field in eastern Australia, Eastern Australasian Basins Symposium, A Refocussed Energy Perspective for the Future. Petroleum Exploration Society of Australia Special Publication, pp. 61-70.
Zhao, S. and Müller, R.D., 2003. Three-dimensional finite-element modelling of the tectonic stress field in continental Australia. Geological Society of America Special Papers, 372: 71-89.
Zoback, M.D., 2010. Reservoir geomechanics. Cambridge University Press, Cambridge, 461 pp. Zoback, M.D., Zoback, M.L., Mount, V.S., Suppe, J., Eaton, J.P., Healey, J.H., Oppenheimer, D.,
Reasenberg, P., Jones, L., Raleigh, C.B., Wong, I.G., Scotti, O. and Wentworth, C., 1987. New Evidence on the State of Stress of the San Andreas Fault System. Science, 238(4830): 1105-1111.
Zoback, M.L., 1992. First- and second-order patterns of stress in the lithosphere: The World Stress Map Project. Journal of Geophysical Research: Solid Earth, 97(B8): 11703-11728.
Zoback, M.L. and Zoback, M., 1980. State of stress in the conterminous United States. Journal of Geophysical Research: Solid Earth, 85(B11): 6113-6156.
Zoback, M.L., Zoback, M.D., Adams, J., Assumpcao, M., Bell, S., Bergman, E.A., Blumling, P., Brereton, N.R., Denham, D., Ding, J., Fuchs, K., Gay, N., Gregersen, S., Gupta, H.K., Gvishiani, A., Jacob, K., Klein, R., Knoll, P., Magee, M., Mercier, J.L., Muller, B.C., Paquin, C., Rajendran, K., Stephansson, O., Suarez, G., Suter, M., Udias, A., Xu, Z.H. and Zhizhin, M., 1989. Global patterns of tectonic stress. Nature, 341(6240): 291-298.
174

3.6. Paper 6: Prediction of the Present-Day Stress Field in the
Australian Continental Crust Using 3D Geomechanical-Numerical
Models
Rajabi, M., Heidbach, O., Tingay, M., Reiter, K., in-review. Prediction of the present-day
stress field in the Australian continental crust using 3D geomechanical-numerical models.
Australian Journal of Earth Sciences, in-review.
175

176

Prediction of the present-day stress field in the Australian continental crust
using 3D geomechanical-numerical models
Mojtaba Rajabi1*, Oliver Heidbach2, Mark Tingay1, Karsten Reiter3
1 Australian School of Petroleum, the University of Adelaide, Adelaide, SA 5005, Australia
2 Helmholtz Centre Potsdam, German Research Centre for Geosciences GFZ, Potsdam, Germany
3 TU Darmstadt, Institute of Applied Geosciences, Schnittspahnstr. 9, 64287, Darmstadt, Germany
Abstract
The Australian continent has an enigmatic present-day stress pattern and shows considerable regional variability in maximum horizontal stress (SHmax) orientation. Previous attempts to estimate the Australian SHmax orientation with geomechanical-numerical models indicate that plate boundary forces provide the major controls on the contemporary stress orientations. However, these models cannot satisfactorily predict the observed stress orientation in major basins throughout eastern Australia, where the knowledge of the present-day crustal stress information is of vital importance for development and management of different types of geo-reservoirs. In addition, a new comprehensive stress data compilation in Australia, which is the key dataset for model calibration, motivated us to construct a new geomechanical-numerical model for Australia. Herein, we present a 3D geomechanical-numerical model that predicts the first-order SHmax orientation for the whole Australian continent, as well as relative stress magnitudes (tectonic stress regime). The new stress database compilation has 1354 data records determined from the interpretation of drilling-related stress indicators, 645 from earthquake focal mechanism solutions, 139 from shallow engineering measurements and two from geological indicators to define the regional stress pattern of Australia in 30 stress provinces. Our best-fit model in most areas is in good agreement with observed SHmax orientations and the stress regime, and shows a much better fit in areas where the stress pattern was unable to be predicted by previous published attempts. Interestingly, the best-fit model requires a significant push from the western boundary of Australian continental model which is possible supporting evidence for the east-west oriented mantle drag postulated by state-of-the-art global convection models, or may be generated by the excess of gravitational potential energy from Tibetan Plateau, transferred through the Indo-Australian Plate. Hence, our modelling results provides a good first-order prediction of the stress field for areas where no stress information is currently available, and it can be used to derive initial and boundary conditions for local and reservoir-scale 3D geomechanical models across Australia.
Keywords: Australian stress field, geomechanical-numerical model, Indo-Australian Plate, petroleum geomechanics, present-day stress field, tectonic stress regime
1. Introduction
Crustal present-day stress field has numerous applications in a range of earth science disciplines, particularly as a critical input for geomechanics of geo-reservoirs (Barton & Moos, 2010; Bell, 1996b; Cornet, 2015; M. D. Zoback, 2010). The present-day stress field controls the stability and trajectory of wellbores (Altmann, Müller, Müller, Tingay, & Heidbach, 2010; Hillis & Williams, 1993; Rajabi,
177

Tingay, & Heidbach, 2016a; M. D. Zoback, 2010). Induced hydraulic fractures form parallel to the orientation of maximum horizontal stress (SHmax) and develop horizontally and vertically depending on the tectonic stress regime (Bell, 1996b; King, 2010). Geomechanics also provides significant information about the probability of fault reactivation due to natural (Heidbach & Ben-Avraham, 2007; Hergert, Heidbach, Bécel, & Laigle, 2011) and induced processes (Moeck & Backers, 2011; Schoenball, Müller, Müller, & Heidbach, 2010), as well as for hazard assessment related to wellbore completions and production (Barton & Moos, 2010; Hakimhashemi, Schoenball, Heidbach, Zang, & Grünthal, 2014; Jones & Hillis, 2003; Mildren et al., 2005; Mildren, Hillis, & Kaldi, 2002). Furthermore, the state of stress, and particularly the orientation of SHmax, strongly affect fluid flow in naturally fractured reservoirs (Barton, Zoback, & Moos, 1995; Sibson, 1996), water-flooding patterns and reservoir drainage (Heffer, Fox, McGill, & Koutsabeloulis, 1997; Heffer & Lean, 1991). Present-day stress information is also necessary for safe and sustainable fluid injection (e.g. CO2 sequestration, geothermal production and nuclear waste repositories) and fluid withdrawal in petroleum and geothermal production (Gaucher et al., 2015; Grünthal, 2014; Kraft & Deichmann, 2014; Segall, 1989; M. D. Zoback, 2010).
Due to numerous implications of the present-day stress field, significant attentions have been given in the past 30 years to estimate the components of stress tensor (Bell, 1996a; Engelder, 1993; Jaeger, Cook, & Zimmerman, 2007; M. D. Zoback, 2010). Major projects such as the World Stress Map (WSM) and the Australian Stress Map (ASM) provide the most comprehensive stress data compilation for the World and Australia, respectively, (Heidbach et al., 2007; Heidbach et al., 2010; Hillis & Reynolds, 2000, 2003; Sperner et al., 2003; M. L. Zoback, 1992; M. L. Zoback et al., 1989). The 2016 releases of these projects revealed that the crustal stress state is generally sparsely resolved in the earth’s crust (Heidbach, Rajabi, Ziegler, & Reiter, 2016). For example, the stress data density, in 100 × 100 km2, for global continental areas and the Australian continent is 1.4 and 1.7 data records, respectively (Heidbach et al., 2016). More importantly, the majority of these data only show the SHmax orientation and, hence, the stress information on the 3D stress tensor, which describes the stress state at a point with six independent components, is sparse and incomplete for most regions (Heidbach et al., 2016; Rajabi, Tingay, Heidbach, Hillis, & Reynolds, under-review). Therefore, physical-based models, such as 3D geomechanical-numerical modelling, are required in order to provide a continuous description of the crustal in-situ stress field in areas where no stress data are available (Gunzburger & Magnenet, 2014; Henk, 2005; Hergert, Heidbach, Reiter, Giger, & Marschall, 2015; Reiter & Heidbach, 2014).
Australia is, arguably, the most extensively studied and debated continent in the world with regards to present-day stress analysis and modelling. The first phase of the WSM project highlighted that Australia was the only major continent in which SHmax was widely variable, and showed no large-scale correlation with absolute plate motion (Richardson, 1992; M. L. Zoback et al., 1989). These anomalous observations motivated numerous researchers to investigate the sources of the contemporary stress field in Australia. To date, over 20 papers have been published to predict the Australian stress pattern, with a particular emphasis on the stress sources of Australia as an intraplate region (Burbidge, 2004; Cloetingh & Wortel, 1985; Coblentz, Sandiford, Richardson, Zhou, & Hillis, 1995; Coblentz, Zhou, Hillis, Richardson, & Sandiford, 1998; Dyksterhuis, Albert, & Müller, 2005; Müller, Dyksterhuis, & Rey, 2012; Reynolds, Coblentz, & Hillis, 2002). The main purpose of these published studies was to investigate the relative importance of the plate boundary forces that act at the borders of the Indo-Australian Plate (IAP), in order to best-fit the observed SHmax orientation. In almost all published papers to date, 2D geomechanical-numerical plate-scale models have revealed that the present-day stress field of Australia is, at the first-order, controlled by plate boundary forces.
178

However, these models do not fit the new stress pattern derived from a recent comprehensive update of the ASM database, particularly in most of eastern Australia (Brooke-Barnett et al., 2015; Rajabi, Tingay, & Heidbach, 2016b; Rajabi et al., under-review). Furthermore, the tectonic stress regime, which has significant importance in geomechanics of geo-reservoirs, cannot be directly determined from these 2D geomechanical-numerical models.
Nowadays, 3D geomechanical-numerical models are the state-of-the-art approach to predict the present-day stress tensor at large scales (Buchmann & Connolly, 2007; Hergert & Heidbach, 2010, 2011; Hergert et al., 2011; Reiter & Heidbach, 2014) and small scales (Hergert et al., 2015). The complexity of structural models, definition of initial stress state and model calibration with respect to stress orientations and the stress regime determine the result of 3D geomechanical-numerical models (Reiter & Heidbach, 2014). Hence, in this paper we propose a 3D continental-scale geomechanical-numerical model that predicts the first-order present-day stress field for whole the Australian continent. In contrast to previous models, that mainly focused on the quantification of the relative contribution of the plate boundary forces, we aim to find the best-fit crustal stress model with respect to all the available stress data. Herein, we first briefly review the state of contemporary crustal stress in the Australian continent based on a new compilation of 2140 data records. We then review the previous stress models for Australia and compare their results with the new ASM database. Finally, we present our 3D model approach and discuss the results of our best-fit model that is calibrated against the new ASM database.
2. The state of present-day stress in Australia
Analysis of the regional variability of the present-day tectonic stress in the Australian continent has been the subject of scientific debates over 25 years (Denham & Windsor, 1991; Hillis & Reynolds, 2000, 2003; Rajabi et al., under-review; M. L. Zoback et al., 1989). The study of the present-day stress in Australia originally began by using shallow engineering methods in underground projects (Alexander & Worotnicki, 1957; Worotnicki & Denham, 1976). Prior to 1963, most of the Australian in-situ stress information was from flat jack and overcoring methods at engineering sites (Worotnicki & Denham, 1976). Along with these shallow stress measurements, analysis of earthquake focal mechanism solutions provided the state of stress in deeper parts of the Australian crust (Allen, Gibson, & Cull, 2005; Clark & Leonard, 2003; Denham, Alexander, & Worotnicki, 1979; Fitch, Worthington, & Everingham, 1973; Leonard, Ripper, & Yue, 2002; Spassov, 1998). Bell and Gough (1979) demonstrated how dipmeter logs could be used to determine the SHmax orientation in petroleum wells, and this was then first conducted in Australia by Blumling (1986) using four arm caliper logs in 22 wells.
In 1990, the Australian petroleum industry had widely recognized that borehole breakouts were a common feature, and associated with numerous drilling problems (Denham & Windsor, 1991; Hillis, 1991; Lowry, 1990). Since then, numerous researchers analysed different types of oriented caliper and wellbore image logs to map the pattern of stress across the Australian continent (Camac, Hunt, & Boult, 2006; Hillis, Meyer, & Reynolds, 1998; Hillis, Mildren, Pigram, & Willoughby, 1997; Hillis & Reynolds, 2000, 2003; Hillis & Williams, 1992; Mildren, Hillis, Fett, & Robinson, 1994; Nelson, Hillis, Sandiford, Reynolds, & Mildren, 2006; Rajabi, Tingay, et al., 2016a, 2016b; Rajabi, Tingay, King, & Heidbach, 2016; Reynolds & Hillis, 2000; Reynolds, Mildren, Hillis, Meyer, & Flottmann, 2005). In the first global compilation of stress data, Australia was poorly represented by only 95 reliable data records (M. L. Zoback, 1992; M. L. Zoback et al., 1989). Hence, Hillis et al. (1998)
179
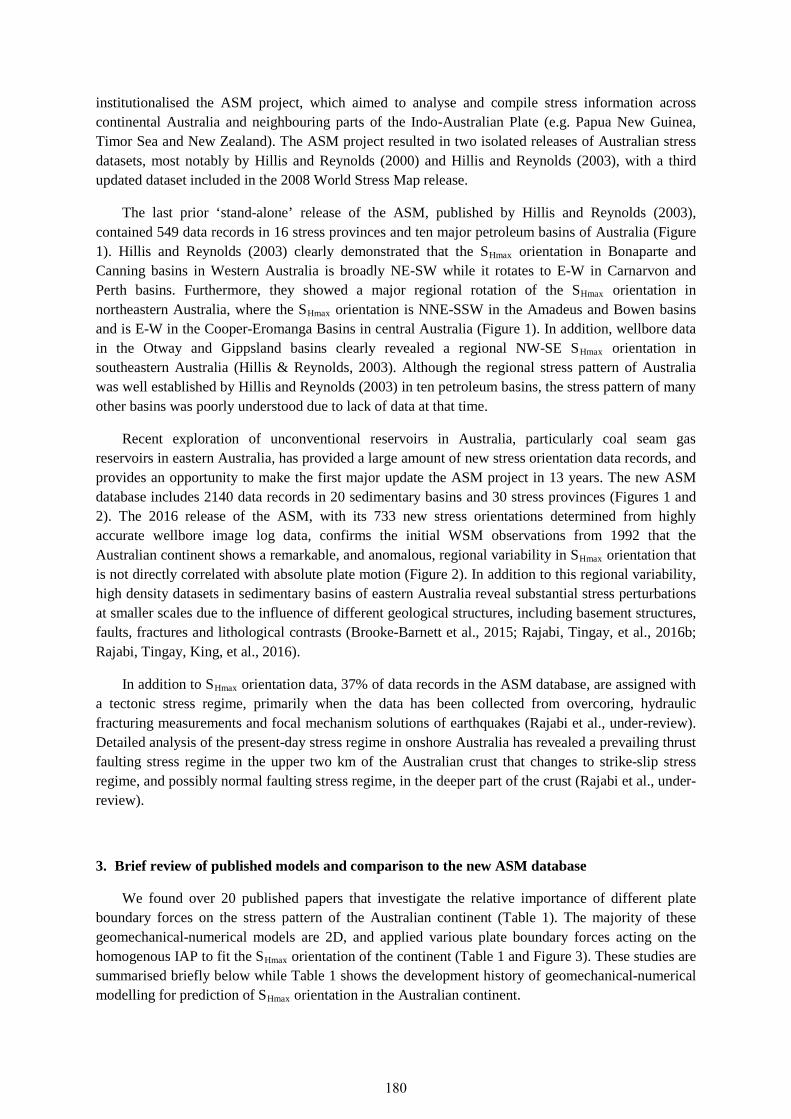
institutionalised the ASM project, which aimed to analyse and compile stress information across continental Australia and neighbouring parts of the Indo-Australian Plate (e.g. Papua New Guinea, Timor Sea and New Zealand). The ASM project resulted in two isolated releases of Australian stress datasets, most notably by Hillis and Reynolds (2000) and Hillis and Reynolds (2003), with a third updated dataset included in the 2008 World Stress Map release.
The last prior ‘stand-alone’ release of the ASM, published by Hillis and Reynolds (2003), contained 549 data records in 16 stress provinces and ten major petroleum basins of Australia (Figure 1). Hillis and Reynolds (2003) clearly demonstrated that the SHmax orientation in Bonaparte and Canning basins in Western Australia is broadly NE-SW while it rotates to E-W in Carnarvon and Perth basins. Furthermore, they showed a major regional rotation of the SHmax orientation in northeastern Australia, where the SHmax orientation is NNE-SSW in the Amadeus and Bowen basins and is E-W in the Cooper-Eromanga Basins in central Australia (Figure 1). In addition, wellbore data in the Otway and Gippsland basins clearly revealed a regional NW-SE SHmax orientation in southeastern Australia (Hillis & Reynolds, 2003). Although the regional stress pattern of Australia was well established by Hillis and Reynolds (2003) in ten petroleum basins, the stress pattern of many other basins was poorly understood due to lack of data at that time.
Recent exploration of unconventional reservoirs in Australia, particularly coal seam gas reservoirs in eastern Australia, has provided a large amount of new stress orientation data records, and provides an opportunity to make the first major update the ASM project in 13 years. The new ASM database includes 2140 data records in 20 sedimentary basins and 30 stress provinces (Figures 1 and 2). The 2016 release of the ASM, with its 733 new stress orientations determined from highly accurate wellbore image log data, confirms the initial WSM observations from 1992 that the Australian continent shows a remarkable, and anomalous, regional variability in SHmax orientation that is not directly correlated with absolute plate motion (Figure 2). In addition to this regional variability, high density datasets in sedimentary basins of eastern Australia reveal substantial stress perturbations at smaller scales due to the influence of different geological structures, including basement structures, faults, fractures and lithological contrasts (Brooke-Barnett et al., 2015; Rajabi, Tingay, et al., 2016b; Rajabi, Tingay, King, et al., 2016).
In addition to SHmax orientation data, 37% of data records in the ASM database, are assigned with a tectonic stress regime, primarily when the data has been collected from overcoring, hydraulic fracturing measurements and focal mechanism solutions of earthquakes (Rajabi et al., under-review). Detailed analysis of the present-day stress regime in onshore Australia has revealed a prevailing thrust faulting stress regime in the upper two km of the Australian crust that changes to strike-slip stress regime, and possibly normal faulting stress regime, in the deeper part of the crust (Rajabi et al., under-review).
3. Brief review of published models and comparison to the new ASM database
We found over 20 published papers that investigate the relative importance of different plate boundary forces on the stress pattern of the Australian continent (Table 1). The majority of these geomechanical-numerical models are 2D, and applied various plate boundary forces acting on the homogenous IAP to fit the SHmax orientation of the continent (Table 1 and Figure 3). These studies are summarised briefly below while Table 1 shows the development history of geomechanical-numerical modelling for prediction of SHmax orientation in the Australian continent.
180

Cloetingh and Wortel (1985, 1986) investigated the relative contribution of different plate boundary forces around the IAP using a 2D homogenous elastic model. Their models predicted extensional forces along the New Hebrides and Solomon subduction zones in the east on New Guinea and, hence, predicted a substantial ENE-WSW extension for eastern Australia. In addition, they found significant perturbation of regional stress along passive margins of Australia, and suggested a major role of local stress sources, such as the weight of sediments, as a possible factor for this stress variation (Cloetingh & Wortel, 1985, 1986). Coblentz et al. (1995) examined the stress pattern of Australia by using 2.5D elastic geomechanical-numerical models and evaluated three primary sources of stress, including ridge push and buoyancy forces that produce gravitational potential energy (GPE) and drag forces at the base of the IAP. They demonstrated that the stress pattern of Australia can be explained by two major types of plate boundary forces, namely ridge push forces (and initiated topography) and collisional resistance at the boundaries of Papua New Guinea, Himalaya and New Zealand. Although, their modelling was unable to explain the role of subduction zones in the Australian stress field, they suggested that GPE had the dominant controlling role in generating the Australian stress pattern. Zhang, Scheibner, Ord, and Hobbs (1996) demonstrated the role of density structure and gravity in E-W resultant compression using 2D cross sectional geomechanical-numerical models in the eastern Australian passive margin.
Hillis, Sandiford, Coblentz, and Zhou (1997) applied different plate boundary forces on a uniform 2D elastic IAP and produced four models based on different well constrained (ridge and continental margin push) and poorly understood boundary conditions (i.e. basal drag, subduction and collisional boundaries). They compared the model predictions with observational stress data and concluded that, although the different models have different boundary conditions, three out of the four produced models could predict the stress pattern of Australia reliably. Coblentz et al. (1998) evaluated the relative contribution of different plate boundary forces on the stress pattern of the IAP with 2D elastic geomechanical-numerical models. They implemented various sets of boundary conditions on four models and concluded that the torque, due to ridge push and continental topography forces, provides the major impact on the stress pattern of IAP. Furthermore, they explained that basal drag and associated forces with subduction zones are not required to fit the stress pattern of the plate. Model 4 of Coblentz et al. (1998) was their best model for Australia, providing a satisfactory fit to the stress pattern of most of Western Australia, but was still unable to predict the stress pattern in eastern Australia.
Zhao and Müller (2001, 2003) investigated the stress pattern of Australia using a relatively coarse 3D geomechanical-numerical model that has two layers with 2640 linear finite elements to reflect two different rheological layers. They suggested that plate boundary and ridge push forces can explain the stress pattern of Australia, but that geomechanical lithospheric provinces can change the regional stress pattern in eastern Australia. Reynolds et al. (2002); Reynolds, Coblentz, and Hillis (2003) examined a variety of plate boundary forces to predict the contemporary stress pattern of Australia with a 2D elastic geomechanical-numerical model. The modelling results by Reynolds et al. (2002, 2003) proposed compressional forces along the Solomon and New Hebrides subduction zones, where all previous studies suggested extensional forces. The best fit model presented by Reynolds et al. (2002, 2003) strongly argued that the complex plate boundary forces acting on the IAP can explain the first-order stress pattern of Australia. However, their model was unable to explain the complex stress pattern of northeastern Australia where the SHmax orientation rotates from N-S in the Bowen and Amadeus basins to E-W in the Cooper-Eromanga Basins (Figure 3).
A more complex 2.5D geomechanical-numerical model of the Australian Plate was constructed by Burbidge (2004) using the thin shell finite element code of Bird (1999). This visco-elastoplastic
181

model was made to predict the stress and strain pattern of the continent by incorporating different input data. Although the best-fit model of Burbidge (2004) satisfactorily predicts the SHmax orientation of eastern Australia, it was unable to fit the SHmax orientation in the southern half of Australia, nor in the Browse and Amadeus basins in western and eastern Australia. More importantly, Burbidge (2004) predicted a dominant normal faulting stress regime throughout northeastern Australia, which is inconsistent with the observed thrust faulting stress regime in the Bowen and Sydney basins (Figure 3) (Hillis, Enever, & Reynolds, 1999).
Sandiford, Wallace, and Coblentz (2004) investigated the stress pattern of southeastern Australia with an extensive dataset that included in-situ stress data, young geological structures and a 2D geomechanical-numerical modelling approach. The plate-scale model of Sandiford et al. (2004) explained that the NW-SE SHmax orientation of southeastern Australia is primarily the result of continental collision in New Zealand’s South Island. They proposed that the stress generated due to continental collision is transmitted by oceanic lithosphere between Australia and New Zealand, and is responsible for the present-day stress field and active faulting in south Victoria, Flinders and Mount Lofty Ranges.
Dyksterhuis, Albert, et al. (2005); Dyksterhuis and Müller (2004); Dyksterhuis, Müller, and Albert (2005) examined the present-day and paleo (since Miocene) stress pattern of the Australian continent by applying different plate boundary forces on 2D geomechanical-numerical models. They clearly proposed that including different geomechanical provinces, to represent different mechanical properties of cratons, fold belts and sedimentary basins, is more realistic, and demonstrated that these heterogeneities have significant impact on the stress pattern of Australia. Furthermore, they proposed substantial local perturbations of stress in the vicinity of geomechanical provinces. However, these models were also unable to predict the observed SHmax pattern satisfactorily (Figure 3). Dyksterhuis and Müller (2008) expanded on their earlier work and described the role of plate boundary forces and heterogeneity of the IAP in intraplate orogeny using 2D elastic heterogeneous geomechanical-numerical models. Dyksterhuis and Müller (2008) proposed that orogenies in southeastern Australia result from the transmission of plate boundary forces into the plate interior, where stress can then be deflected significantly by the juxtaposed variable geomechanical provinces.
Müller et al. (2012) evaluated the stress pattern of the Australian continent since the Cretaceous with 2D elastic and heterogeneous geomechanical models. Müller et al. (2012) presented models attempting to replicate the temporal and spatial changes of the Australian stress pattern resulting from variable geometry of IAP and different plate boundary forces acting on the IAP over time. In addition, Müller et al. (2012) concluded that reactivation of intraplate weak zones, such as the Flinders Ranges and Faulted Northwest Shelf occurred during periods of favourable stress regime. More recently, the contemporary stress pattern of IAP has been predicted with 2D elastic geomechanical numerical model as a part of analysing the Indian stress evolution (Müller, Yatheesh, & Shuhail, 2015).
The primary focus of all of these previous geomechanical-numerical models was to assess the relative importance of plate boundary forces on the regional pattern of SHmax in the Australian continent. The common conclusion is that the observed high variability of the Australian stress pattern is due to the complex superposition of different plate boundary forces. In addition, the results of these models indicated that regional density and strength contrasts probably have significant impact on the Australian stress pattern in some regions (Dyksterhuis, Albert, et al., 2005; Reynolds et al., 2002, 2003). However, questions and uncertainties still remain, particularly regarding the state of stress in throughout eastern Australia, for which these published models do not fit with the new observed SHmax orientations. Figure 3 shows the comparison of the observed SHmax orientation in the Australian
182

continent with the five ‘best’ previously published models. In order to assess the previous published models quantitatively, we defined pseudo stress provinces of Rajabi et al. (under-review) (showed in Figure 2) to compare the model predictions with the latest ASM dataset (Table 2). The results reveal that all models have mean absolute deviation > 30°, except Reynolds et al. (2002) model that has the lowest mean deviation of 27°.
In addition, the published models (except the Burbidge’s model) do not provide any information on the tectonic the stress regime, which is now available in the new ASM database. Hence, a new modelling technique with higher resolution for the heterogeneity of the rock properties is required in order to attempt to replicate the present-day stress regime and orientation for the Australian continent.
4. Modelling setup 4.1. Model assumptions and general workflow
In contrast to previously published models that investigated the role of plate boundary forces in the Australian stress pattern, our focus is to provide a best-fit prediction of the full 3D stress tensor in areas where no stress data are available. We calibrate our model with stress orientation data and stress regime information inferred from the most comprehensive ASM database. It means our model is a physics-based prediction of the 3D stress tensor, for application purposes, rather than scientific research on the stress sources. Nevertheless our model is constructed based on the experience and results of the plate-scale models in which rock heterogeneity and lateral density contrasts provide significant control on the present-day stress pattern. Hence, similar to most of previous published models, we assume that a linear elastic rheology is sufficient to capture the first-order effects. We also assume that the contemporary in-situ stress is a superposition of gravity-induced stresses and plate boundary forces. In addition, inherited stresses from earlier tectonic processes might contribute on the present-day stress pattern. Therefore, multiple sets of initial (gravity-induced) and boundary conditions (plate boundary forces that are parametrized as finite displacements) are used in our modelling strategy and calibration to fit the model-independent data (Figure 4).
Our 3D geomechanical-numerical modelling workflow is illustrated in Figure 4, and has previously been used in several prior studies (Buchmann & Connolly, 2007; Hergert & Heidbach, 2010, 2011; Hergert et al., 2011; Hergert et al., 2015; Reiter & Heidbach, 2014). We first create the 3D model geometry using the relevant structures that represent strength or density contrasts, such as topography, basement surface and Moho depths. The model is then populated with elastic rock properties and densities. In our approach, the plate boundary forces at the model boundaries are parametrized with finite displacements. The gravity-induced initial stresses are implemented as initial stress conditions and we assume that accelerations can be neglected and, thus, we solve the 3D partial differential equation of the equilibrium of forces. Since an analytical solution cannot be achieved, we discretise the model volume into finite elements to find a numerical solution. In order to find the best-fit model, we change the displacement boundary conditions of the model to minimise the differences between predicted and observed stress data (Figure 4). This best-fit model can then be used as the reference regional-scale model that provides boundary conditions of smaller scale models (Figure 5).
183

4.2. Model geometry
To define our model geometry, we chose the model boundaries such that they are approximately perpendicular to the direction of major plate boundary forces. Hence, the model boundary is either parallel or perpendicular to the prevailing observed stress pattern that results in a pentagonal shape of the model boundary (Figure 6). The internal model geometry is based on the relevant geological structures that reflect either strength or density contrasts (Figures 6, 7 and 8), as described below.
The lower boundary of the model is set to a constant value of 200 km depth. The next layer is the physical base of the earth’s crust, which is characterised by the Mohorovicic discontinuity (Moho) (Salmon, Kennett, Stern, & Aitken, 2013). The Moho depth across Australia is variable (Figure 7) and ranges from approximately 30 km deep, such as beneath the Pilbara craton (Western Australia), to approximately 50 km deep, such as beneath the Tennant Creek block (central Australia) and Lachlan fold (southeastern Australia) (Salmon, Kennett, & Saygin, 2013; Salmon, Kennett, Stern, et al., 2013). To create a smoothed Moho surface, we used a high resolution Australian Moho dataset from the AuSREM model (Salmon, Kennett, & Saygin, 2013; Salmon, Kennett, Stern, et al., 2013). We also used the gravity-derived Moho depth (Aitken, Salmon, & Kennett, 2013) for the regions that are included in our model, but are not covered by Salmon, Kennett, Stern, et al. (2013).
Basement surface (depth to basement rocks) is an important crustal feature that is believed to control the crustal stress pattern in some parts of eastern Australia (Brooke-Barnett et al., 2015; Rajabi, Tingay, et al., 2016b). We incorporated the OZSEEBASE model (FrOG Tech, 2006), which is the most comprehensive and reliable basement map of Australia. Finally, the ETOPO1 digital elevation model (Amante & Eakins, 2009), which includes land topography and ocean bathymetry, was used as topography of our 3D geometry (Figure 7). The materials between topography and basement surfaces represent the sedimentary rocks, which are key targets for petroleum exploration and production, and a vital part of our model (for application and calibration purposes) (Figure 8).
4.3. Model discretization and rock mechanical properties
Model discretisation or division of the model into finite elements is necessary for numerical methods in general, and the finite element method in particular (Buchmann & Connolly, 2007; Dyksterhuis, Albert, et al., 2005; Hergert & Heidbach, 2011; Hergert et al., 2011; Reiter & Heidbach, 2014; Stephansson & Berner, 1971). The size of elements has significant impacts on the calculated stress by geomechanical-numerical models, however, very small element sizes in large-scale models increase the computation times. The state of stress in the upper five kilometres of the earth’s crust has significant implications in exploration and production of geo-reservoirs and stability of underground opening such as tunnels, mines and boreholes (Jaeger et al., 2007; M. D. Zoback, 2010). Hence, in geomechanical-numerical modelling particular attentions are paid to discretise sediments with appropriate mesh type and size (Hergert et al., 2015; Reiter & Heidbach, 2014). In this study, we used different types of elements, including hexahedron, tetrahedron, prism and pyramid, to discretise the whole model (Figure 9). The sediments and basements in our model have the smallest size and highest resolution of the 3D elements, while the element size and thickness in the mantle are relatively larger and increases with depth (Figure 9).
In this study we consider elastic material properties including Young’s modulus (E), Poisson’s ratio (v) and density (ρ) for each layer of the model to calculate the stress and body forces (Table 3). In our 3D model, all elements between topography and basement surfaces are defined as sediments,
184

basement rocks are the elements between basement and Moho surfaces, and upper mantle elements are those below the Moho surface down to 200 km depth (Figure 8). Note that a layer of elements are also defined around the Australian continent to represent water with a density of 1030 (kgm-3).
4.4. Initial and boundary conditions
To define the initial stress state, we follow the procedure as explained in Buchmann and Connolly (2007), Reiter and Heidbach (2014) and Hergert et al. (2015). Instead of a uniaxial stress state, where the ratio of the mean horizontal to the vertical stress (k-ratio) results in an unrealistic value of k≈0.33 (with v=0.25), we implement a k-ratio that is higher in the upper few kilometre (1 < k < 2) and then decreases towards a lithostatic stress state with depth (k≈1). In order to simulate the plate boundary forces, the geometry of the 3D geomechanical-numerical model lateral boundaries is designed in a way that the lateral finite displacements can simulate the far-field forces (Buchmann & Connolly, 2007; Hergert & Heidbach, 2010; Hergert et al., 2011; Reiter & Heidbach, 2014). Figure 8 illustrates our pentagonal model, where its edges are parallel or perpendicular to regional plate boundary forces predicted by the best plate-scale model (Table 2), i.e. Reynolds et al. (2002). These assumptions enable us to apply lateral displacements on the model edges to best fit the model predictions to observational stress field data in the Australian continent. The best fit-model of Reynolds et al. (2002) is characterised by compressional forces around the IAP, except in the Java subduction zone (our BC4), which are characterised by tensional forces (Figure 6). Hence, we pushed our 3D model at all edges, except BC4, with different amounts of horizontal displacement, to simulate these compressional forces. Note that the bottom of the model is fixed in the z direction, while lateral displacement along x and y directions are allowed along the lateral model box.
5. Model calibration5.1. Calibration of SHmax orientation
In this study, the 3D geomechanical-numerical model of the Australian continent, which contains full stress tensor, is calibrated with model-independent data in terms of regional SHmax orientation and stress regime. Australian stress provinces (Figure 2) are used as stress domains for comparison between model predictions and observational data. We applied different sets of pulling-pushing around each side of the model and compared the model predictions with regional stress pattern of the Australian continent in order to fit the SHmax azimuth.
Among the Australian stress provinces, 26 of them are located in Australia (Figure 2) and, hence, the following method is used for each province to calibrate the regional SHmax orientation.
∆𝑆𝑆𝑆𝑆𝑆𝑆𝑆𝑆𝑆𝑆= 𝑃𝑃𝑃𝑃𝑃𝑃𝑃𝑃𝑃𝑃𝑃𝑃𝑃𝑃𝑃𝑃𝑃𝑃𝑆𝑆𝑆𝑆𝑆𝑆𝑆𝑆𝑆𝑆 − 𝑂𝑂𝑂𝑂𝑂𝑂𝑃𝑃𝑃𝑃𝑂𝑂𝑃𝑃𝑃𝑃𝑆𝑆𝑆𝑆𝑆𝑆𝑆𝑆𝑆𝑆𝑆𝑆 (1)
Where ΔSHmax is the difference between predicted SHmax and observed SHmax orientation in each stress province in azimuthal degree.
5.2. Calibration of stress regime
The present-day stress regime of our model is represented by the Regime Stress Ratio (RSR), originally defined by (Simpson, 1997). The RSR is a combination of tectonic ‘stress regime number’
185

and the ‘stress ratio’. The ‘stress regime number’ in this method is represented by index n, inferred from standard classification of Anderson (1905) who defined three types of faulting stress regimes, including n=0 for normal (Sv>SHmax>Shmin), n=1 for strike-slip (SHmax>Sv>Shmin) and n=2 for a thrust (SHmax>Shmin>Sv) faulting stress regime. The ‘stress ratio’ (Bott, 1959) in the RSR method is defined by ratio of differential stress magnitudes as:
𝑅𝑅 = �𝑆𝑆2 − 𝑆𝑆3𝑆𝑆1 − 𝑆𝑆3� � (2)
Where S1, S2 and S3 denote the magnitude of minimum, intermediate and maximum principal stresses respectively.
The RSR is then summarised as (Simpson, 1997):
𝑅𝑅𝑆𝑆𝑅𝑅 = (𝑛𝑛 + 0.5) + (−1)𝑛𝑛(𝑅𝑅 − 0.5) (3)
The RSR provide a continuous scale from 0 to 3 for different Andersonian stress regimes whereby RSR=0.5 for normal faulting, RSR=1.5 for strike-slip faulting and RSR=2.5 for thrust faulting stress regimes. The use of the continuous RSR scale is a significant highlight of this method, because it aids in distinguishing transitional stress regimes, such as transpressional and transtensional stress regimes (Buchmann & Connolly, 2007; Hergert & Heidbach, 2011). There are 211 stress regime data records for onshore Australia in the ASM database (Rajabi et al., under-review), with the majority of them (148 data records) from the upper one km of the Australian crust. These shallow stress regimes (<1 km) are derived from a variety of measurement techniques, including hydraulic fracturing tests (79), overcoring measurements (52), earthquake focal mechanism solutions (12) and petroleum wellbore data (5). Hence, in this study we compared the shallow observed stress regime with predicted RSR values at one km depth, in addition to stress orientations, to calibrate our 3D model.
6. Results and discussion6.1. Orientation of SHmax
The plate-scale model of Reynolds et al. (2002), which is considered the best previously published plate-scale model of Australia (Table 2), has predicted compressional forces around the IAP except in the Java subduction zone (Figure 6). Hence, in order to fit the SHmax orientation with observational SHmax orientation we need to push and pull the model margins orthogonally to simulate compressional and tensional forces (Figure 6). The first step in model calibration is fitting the SHmax orientation using horizontal displacements of the model edges. Numerous sets of lateral displacement were applied on each side to find the best-fit model. The best-fit model is the model that satisfactorily predicts the SHmax orientation with the least amount of ΔSHmax (Equation. 1). In our model sensitivity testing, we found that the BC3 boundary (Figure 6) is the most critical side of the model, and most significantly controls the predicted SHmax orientation. However, pushes from BC1, BC2 and BC5 boundaries are required to have a better predicted SHmax orientation. We examined both push and pull on the BC4 boundary to fit the SHmax orientation in Western Australia. The results revealed that slight pulling is more appropriate on the BC4 boundary in order to have a predicted SHmax that fits the orientations in the Bonaparte and Canning basins of Western Australia. The predicted SHmax orientations inferred from our best-fit model are shown in Figure 10. Pseudo-stress provinces are extracted from our 3D model to compare the predicted and observed SHmax orientation (Figure 10).
186

Generally, the model satisfactorily predicts the regional SHmax orientation across Australia (Table 2), without any major changes in the SHmax orientation with depth. However, there are some inconsistencies, particularly in the Browse Basin (Western Australia), where our model predicts NE-SW SHmax orientation while observational data shows an E-W SHmax orientation.
The wellbore derived SHmax orientation in the Browse Basin shows two sub-trends, including an ENE-WSW SHmax orientation where the basin is attached to the Bonaparte Basin (in the north) and an E-W SHmax orientation in the southern part, which follows the trend of Carnarvon Basin (Figure 2). These two trends are almost parallel to the shape of the plate boundary (Figure 2), which is an arcuate line in that region. In addition, because these two trends are sub-parallel and sub-perpendicular to the edge of our model, we cannot predict both orientations with this model geometry. Pushing the model on one side to fit the E-W SHmax trend of the southern Browse Basin would mean that it is not possible to then also fit the NE-SW SHmax trend in the Bonaparte Basin, Canning Basin and northern parts of the Browse Basin. The other inconsistency between our model and observed SHmax orientation is in the Gloucester Basin and southern Sydney Basin, where the observed SHmax orientation is NE-SW, while the predicted SHmax is more E-W (Figure 10). The observational stress data in these two basins show significant standard deviations (>35°) according to ASM database (Rajabi et al., under-review). Furthermore, our predicted SHmax orientation in the adjacent basins, such as Clarence-Moreton, Gunnedah and northern Sydney basins are consistent with the observational data. Hence, we assume that the predicted ENE-WSW SHmax orientation in the southern Sydney and Gloucester reflect the regional stress pattern of that region, whereas the observed SHmax orientations are strongly affected by local structures such as faults, fractures and lithological contrasts, as reported by Hillis et al. (1999) and Rajabi, Tingay, et al. (2016b). Note that these two basins are classified as ‘low quality’ type 5 and 6 stress provinces, in which stress observations show significant scatter and, hence, are not considered as reliable in Hillis and Reynolds (2000) and Rajabi et al. (under-review).
The aim of this study was to provide a 3D predictive continental-scale model, containing full stress tensor information, which can provide appropriate displacement or stress boundary conditions for smaller reservoir-scale geomechanical-numerical models (Figure 5). However, the significant role of boundary BC3 in the overall predicted stress pattern of the Australian continent is quite interesting. We believe that our 3D model is unable to find the sources of the proposed significant E-W compression at boundary BC3. But published literatures have suggested two possible sources, namely the gravitational potential energy (GPE) due to the Himalayas and Tibetan Plateau (Coblentz et al., 1998; Ghosh, Holt, & Flesch, 2009; Ghosh, Holt, Flesch, & Haines, 2006); or the combination of dynamic topography and mantle forces (Steinberger, Schmeling, & Marquart, 2001). Detailed analysis of these forces is beyond the scope of this modelling work, but could be investigated in more detail by means of a more comprehensive plate-scale model in future studies.
This is the first 3D model that contains both stress regime and orientation for whole the Australian continent, and thus has potential applications within various earth science research fields. The model predicts two significant spatial SHmax perturbations around the Surat-Bowen (Queensland) and Sorell-Bass Basins (Tasmania); (Figure 9). This variation of the SHmax orientation is consistent with the basement topography, where two types of rocks, including sediments and basement, are juxtaposed. Interestingly, the significant rotation of the SHmax orientation in the Bowen-Surat Basins of Queensland is recently reported by Brooke-Barnett et al. (2015) and Rajabi et al. (under-review), (Figure 1). Furthermore, the predicted variable pattern of SHmax orientation in the Sorell-Bass Basins (between Tasmania and Victoria) is visible in the observed data from the ASM database (Figure 1). Rajabi, Tingay, et al. (2016b) and Rajabi, Tingay, King, et al. (2016) highlighted the occurrence of significant regional and local-scale SHmax variations in the Gunnedah, Sydney, Clarence-Moreton and
187

Gloucester basins, which are considered to be generated by faults, fractures and lithological contrasts. Our 3D model does not predict these localised perturbations because the model is a regional model, and does not include major faults, fractures and intra-basinal sedimentary sequences. Such smaller scale stress variations would need to be examined using a sub-modelling approach (Figure 5), formerly suggested by Reiter, Heidbach, and Moeck (2013). Such small sub-models would be able to use the continental scale model herein to derive boundary conditions, and these models would have significant implications in unconventional reservoirs.
6.2. Tectonic stress regime
The second step in the model calibration is fitting the tectonic stress regime in the Australian continent. In this step, the boundary conditions of our model were proportionally modified by different amounts of pull and push in order to maintain the SHmax azimuth and change the stress regime. In contrast to the SHmax orientation, the ASM database is spatially poor in terms of stress magnitude data. For example, the most up-to-date ASM database contains only 211 relative stress magnitude data (i.e. stress regime) and the majority of these data (148) are from shallow depths (<1 km) derived from overcoring and hydraulic fracturing tests. However, there is a published rich neotectonic database for Australia (Clark, McPherson, & Van Dissen, 2012; Hillis, Sandiford, Reynolds, & Quigley, 2008; Quigley, Cupper, & Sandiford, 2006; Sandiford, 2003), as well as earthquake focal mechanism solutions, that all suggest a dominant thrust faulting stress regime in the near surface, which changes to strike-slip stress regime (and possibly normal faulting stress regime) in the deeper part of the Australian crust (Rajabi et al., under-review). Therefore, we calibrated our model to the stress regime for the upper one km of the Australian crust (Figure 11), and predicted the changes of stress regime with depth that are consistent with the ASM database (Figures 11, 12 and 13). The predicted stress regime in the upper one km of the model is compared with observed stress regime in Figure 11. The model predominantly predicts thrust faulting, or, more specifically, predicts a thrust faulting stress regime with a minor strike-slip component (a transpressional stress regime) and, to a lesser extent, a strike-slip faulting stress regime in the upper one km of the Australian crust. The predicted stress regime in deeper parts of the crust is primarily in transition between thrust and strike-slip stress regimes (comparing RSR values at 3 km depth in Figure 12 with Figure 13). Note that actual stress observations indicate a predominantly normal faulting stress regime, with minor strike-slip component, at 3 km depth (and deeper) in some regions, including the Otway Basin, some parts of eastern Australia, central and Western Australia (Figure 13). As outlined above, lack of stress magnitude data in the Australian crust does not allow us to robustly check the model predictions in the same manner as can be done with the extensive SHmax azimuth observational data. Whilst we have made our best efforts to match these observations, the general lack of stress regime information in Australia highlights the need to compile more stress magnitude information throughout Australian basins and cratonic areas.
7. Conclusions
This study investigated the contemporary stress field of the Australian crust using a 3D geomechanical-numerical modelling approach. The model presented in this study contains relevant and high-resolution lithospheric strength contrasts, including surfaces representing the Moho, top of basement and topography. In addition, this is the first 3D continental-scale geomechanical-numerical
188

model that predicts the SHmax orientation and stress regime in the Australian crust. The presented best-fit model in this study predicts SHmax orientations better that all previous (primarily 2D) published models, particularly in eastern Australia where all prior models were unable to estimate the SHmax pattern satisfactorily. However, the best-fit model herein suggests that a significant westerly push from the west of Australia, through the Indian Ocean, is required to fit the present-day stress pattern of the continent. Such E-W compression could possibly reflect gravitation potential energy forces (transmitted through the Indo-Australian Plate from Himalayas and Tibetan Plateau) and/or mantle drag forces. In terms of the stress regime, the 3D model suggests a significant thrust faulting stress regime in the upper 1km of the Australian crust, which changes to a transpressional and strike slip regime in the deeper parts of the Australian crust. Although the ASM database is not rich in stress magnitude (and stress regime) data, in comparison to SHmax orientation data, the model predictions are consistent with neotectonic data, focal mechanism solutions of earthquakes and the stress regime derived from shallow wellbores. Hence, we suggest this large-scale predictive 3D model of Australia can provide appropriate displacement or stress boundary condition for high-resolution smaller scale (basin and reservoir) models, and also be used in its current state to better estimate regional stress tensors in parts of Australia that do not yet have any observational stress data.
Acknowledgments
This work funded by the ARC Discovery Project (DP120103849) and ASEG Research Foundation Project (RF13P02). For updates on the Australian Stress Map project and the presented model in this paper visit www.asp.adelaide.edu.au/asm.
189

Figure 1: (a) The most recent prior (2003) release of the Australian Stress Map (ASM) and the calculated stress trajectories (black lines) show the regional stress pattern of the continent (Hillis & Reynolds, 2003). (b) The new release of the ASM and calculated stress trajectories. The database contained 2140 in-situ stress data records. Different colours indicate different tectonic stress regime (NF: normal, SS: strike-slip, TF: thrust and U: undefined). The length of the different indicators represents the stress orientation quality based on the world stress map ranking system. The stress trajectories in both maps are calculated based on the method developed by Hansen and Mount (1990). Note the changes in stress trajectories particularly in eastern Australia.
190
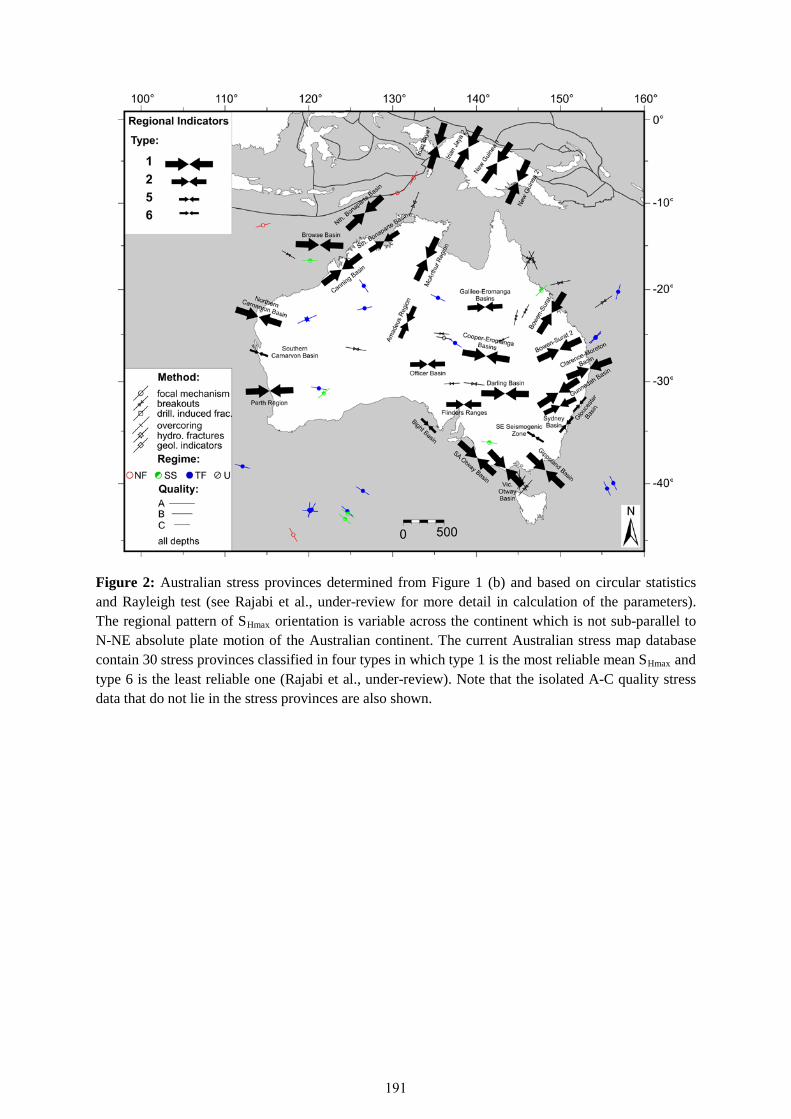
Figure 2: Australian stress provinces determined from Figure 1 (b) and based on circular statistics and Rayleigh test (see Rajabi et al., under-review for more detail in calculation of the parameters). The regional pattern of SHmax orientation is variable across the continent which is not sub-parallel to N-NE absolute plate motion of the Australian continent. The current Australian stress map database contain 30 stress provinces classified in four types in which type 1 is the most reliable mean SHmax and type 6 is the least reliable one (Rajabi et al., under-review). Note that the isolated A-C quality stress data that do not lie in the stress provinces are also shown.
191
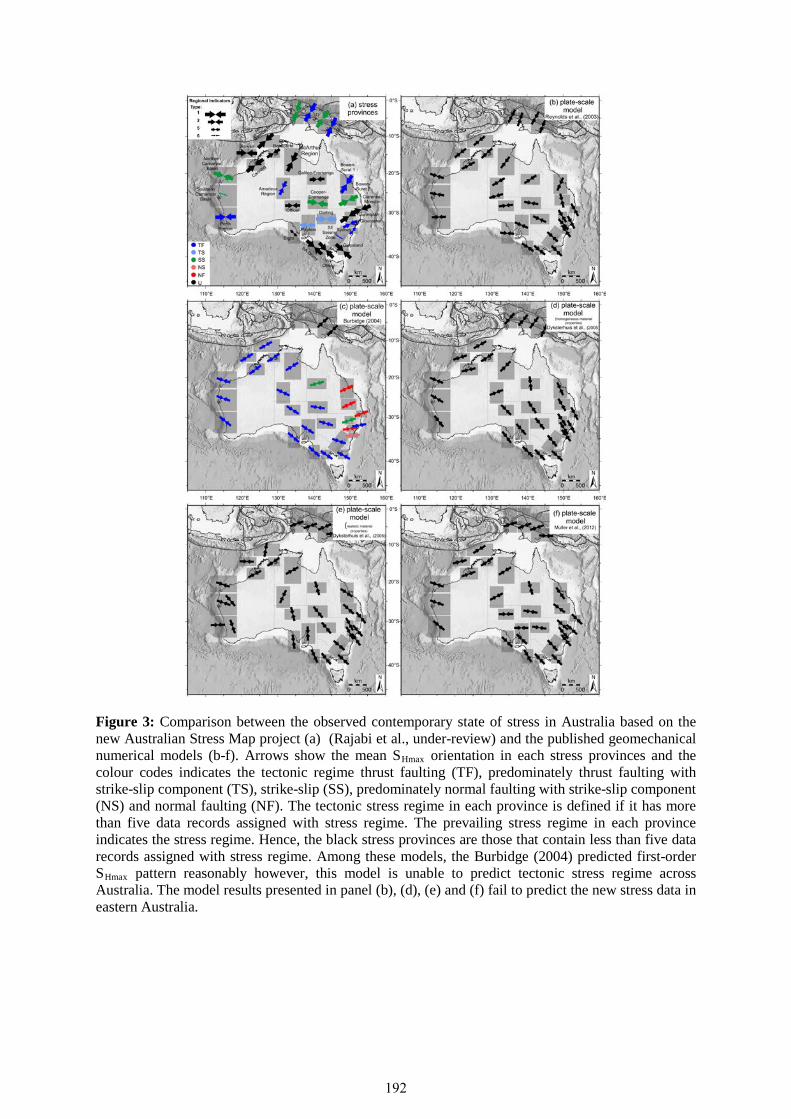
Figure 3: Comparison between the observed contemporary state of stress in Australia based on the new Australian Stress Map project (a) (Rajabi et al., under-review) and the published geomechanical numerical models (b-f). Arrows show the mean SHmax orientation in each stress provinces and the colour codes indicates the tectonic regime thrust faulting (TF), predominately thrust faulting with strike-slip component (TS), strike-slip (SS), predominately normal faulting with strike-slip component (NS) and normal faulting (NF). The tectonic stress regime in each province is defined if it has more than five data records assigned with stress regime. The prevailing stress regime in each province indicates the stress regime. Hence, the black stress provinces are those that contain less than five data records assigned with stress regime. Among these models, the Burbidge (2004) predicted first-order SHmax pattern reasonably however, this model is unable to predict tectonic stress regime across Australia. The model results presented in panel (b), (d), (e) and (f) fail to predict the new stress data in eastern Australia.
192

Figure 4: 3D geomechanical-numerical modelling strategy implemented in this study (modified from Reiter and Heidbach (2014)). The strategy starts with model geometry and definition of initial stress state. We used Young’s modulus, density and Poisson’s ratio as elastic material properties of the discretised model. Relevant boundary conditions are applied on the model to calculate the stress tensor. At the final stage we calibrate the model with Australian stress map database and modified material properties and boundary conditions until we found the best-fit model.
Figure 5: Sub-modelling approach proposed for the modelling of the smaller scale stress field at any location in Australia (modified from Reiter et al. (2013)). In this study we modelled and predicted the stress field at regional scale. However, our large scale model can provide appropriate boundary conditions for local and reservoirs scale models. Note that the resolution and reliability of the models are increased in the smaller scale models in which realistic sedimentary sequences and geological structures can be included in the smaller scale models. We propose this methodology because definition of boundary conditions for smaller scale models is always a challenging task.
193

Figure 6: Tectonic setting of the Indo-Australian Plate with types of plate boundaries (Bird, 2003). CCB: continental convergent boundary, CTF: continental transform fault, CRB: continental rift boundary, OSR: oceanic spreading ridge, OTF: oceanic transform fault, OCB: oceanic convergent boundary and SUB: subduction zone. Inward black arrows show the regional orientation of maximum horizontal stress orientation (SHmax) across Australia. The pentagonal shape is the geometry of our 3D geomechanical-numerical model and white arrows show the boundary conditions of our best-fit model. The background image is land topography and ocean bathymetry based on ETOPO1 model from Amante and Eakins (2009).
Figure 7: Relevant crustal structures for 3D geomechanical-numerical model of Australia. The land topography and ocean bathymetry is from ETOPO model (Amante & Eakins, 2009), the basement surface of Australia is based on OZSEEBASE model (FrOG Tech, 2006). The Australia’s Moho surface is based on Salmon, Kennett, Stern, et al. (2013) and Aitken et al. (2013). Note that the vertical locations of the surfaces are not in scale.
194

Figure 8: The 3D model volume of the Australian continent contains mantle (below the Moho), crustal basement (between Moho and basement surface), and sediments (between topography and basement). Note that the vertical exaggeration of the model is 10 times. Different rock properties are assigned to each layer to represent different types of rocks (see Table 2).
Figure 9: Discretised mantle and basement on the model viewed from east. The basement which is based on OZSEEBASE (FrOG Tech, 2006) are filled with sediments in order to define sedimentary rocks.
195

Figure 10: (a) Predicted maximum horizontal stress orientation (SHmax) across the Australian continent with our 3D continental scale model at depth 2.5 km. The arrows in (a) are the regional mean SHmax orientation across Australia, i.e. stress provinces (Figure 2). The model predicts the SHmax orientation satisfactorily in the continent. The boundary condition of this model which is the best-fit model is shown in Figure 6. Note that we did not observe any significant changes of the SHmax orientation with depth in the model. (b) Shows the pseudo stress provinces derived from our best-fit model. The histogram shows the misfit angle between observed and predicted SHmax orientation at Australian stress provinces. The major inconsistency in the SHmax orientation by our model is in the Browse Basin in Western Australia where the observation data suggest E-W SHmax orientation while the model predicted NE-SW orientation (refer to the text for more details). The values of mean SHmax orientations and differences are presented in Table 2.
196

Figure 11: The Regime Stress Ratio (RSR) for the best fit model at depth 1 km (below the sea level) of the Australian crust. The RSR is continues scale for tectonic stress regime in which the normal faulting is defined by RSR=0.5, strike-slip as RSR=1.5 and thrust faulting as RSR=2.5. The model predicts a significant TF (thrust faulting) and TS (predominantly thrust with strike-slip component) faulting at 1 km depth of the Australian crust. Coloured points show the observed stress regime in upper 1 km of the Australian crust according to the Australian stress map database (Figure 1).
197

Figure 12: Distribution of RSR (representative of stress regime) at 3 km depth of the Australian crust according our 3D continental-scale model. According to the model, TF (thrust faulting), SS (strike-slip), TS (predominantly thrust with strike-slip component) are dominant at this depth. Note the presence of NS faulting (predominantly normal with strike-slip component) in the Otway Basin, eastern, central and Western Australia.
198

Figure 13: Distribution of RSR (representative of stress regime) at 4 km depth of the Australian crust according our 3D continental-scale model. According to the model, TF (thrust faulting), SS (strike-slip), TS (predominantly thrust with strike-slip component) are dominant at this depth. Note the presence of NF (normal faulting) and NS faulting (predominantly normal with strike-slip component) in the Otway Basin, eastern, central and Western Australia.
199

Table 1: An overview on the previous studies on the geomechanical-numerical modelling of the Australian stress pattern. Most of the published models are 2D and only aimed to predict the SHmax orientation by plate-scale models. Details of these studies are explained in the text. E: Young’s modulus, ʋ: Poisson’s ratio, ASM: Australian Stress Map, WSM: World Stress Map, IAP: Indo-Australian Plate.
Author Dimension Numerical resolution Properties Calibration data
Cloetingh and Wortel (1985)
2D 485 triangular membrane elements for the IAP. The maximum grid size is 5°. Constant lithospheric thickness of 100 km.
Elastic – homogeneous (E = 7 × 10¹⁰ Nm-2 and ʋ = 0.25).
28 FMS for the whole IAP.
Cloetingh and Wortel (1986)
2D 485 triangular membrane elements for the IAP. The maximum grid size is 5°. Constant lithospheric thickness of 100 km.
Elastic – homogeneous (E = 7 × 10¹⁰ Nm-2 and ʋ = 0.25).
44 FMS for the whole IAP.
Coblentz et al. (1995) 2D 2527 strain elements and 1374 nodes for whole the IAP. Spatial resolution ~ 2° for both latitude and longitude. Constant lithospheric thickness of 100 km.
Elastic – homogeneous (E = 7 × 10¹⁰ Nm-2 and ʋ = 0.25).
Smoothed stress pattern on by Coblentz and Richardson (1995) based on the WSM database- release 1992.
Zhang et al. (1996) 2D – local scale
The model includes an E-W cross section 700km long and 150 km deep.
Elastic – inhomogeneous Variable elastic property for different part of the model.
-
Hillis, Sandiford, et al. (1997)
2D Similar to Coblentz et al. (1995). Similar to Coblentz et al. (1995). Smoothed stress pattern on by Coblentz and Richardson (1995) based on the WSM database- release 1992.
Coblentz et al. (1998) 2D Similar to Coblentz et al. (1995). Similar to Coblentz et al. (1995). Smoothed stress pattern on by Coblentz and Richardson (1995) based on the WSM database- release 1992.
Zhang et al. (1998) 2D Similar to Zhang et al. (1996). Similar to Zhang et al. (1996). - Zhao and Müller (2001) 3D Two layers with 2640 linear finite elements to reflect two
different rheological layers. Spatial resolution 1° × 1° × 50 km. Elastic – different elastic property for major tectonic blocks.
WSM and ASM databases consisting 33 A-B quality data for eastern Australia.
Reynolds et al. (2002) 2D Similar to Coblentz et al. (1995). Similar to Coblentz et al. (1995). Australian stress provinces based on ASM release 2000 (Hillis & Reynolds, 2000).
Zhao and Müller (2003) 3D Two layers with 2640 linear finite elements to reflect two different rheological layers. Spatial resolution 90 × 90 × 50 km.
Elastic – different elastic property for major tectonic blocks.
WSM and ASM databases consisting 163 A-B quality data for eastern Australia.
Reynolds et al. (2003) 2D Similar to Coblentz et al. (1995). Similar to Coblentz et al. (1995). Australian stress provinces based on ASM release 2003 (Hillis & Reynolds, 2003).
Burbidge (2004) 2D thin shell finite element code of Bird (1999). Visco-elastoplastic. - Sandiford et al. (2004) 2D Similar to Coblentz et al. (1995) with a particular emphasis on
southeastern Australia and New Zealand collision. Similar to Coblentz et al. (1995). ASM database (Hillis & Reynolds, 2003) as well as
neotectonic structures. Dyksterhuis and Müller (2004)
2D 24400 elements for whole the IAP. Spatial resolution ~ 2° for both latitude and longitude. Constant lithospheric thickness of 100 km.
Elastic – homogeneous. A-C quality data of ASM database (Hillis & Reynolds, 2003). Elastic - inhomogeneous: different rock
mechanical properties for sedimentary basins, fold bets and cratons.
Dyksterhuis, Albert, et al. (2005)
2D Similar to Dyksterhuis and Müller (2004). Similar to Dyksterhuis and Müller (2004). A-C quality data of ASM database (Hillis & Reynolds, 2003).
Dyksterhuis, Müller, et al. (2005)
2D Similar to Dyksterhuis and Müller (2004). Elastic – inhomogeneous similar to Dyksterhuis and Müller (2004).
A-C quality data of ASM database (Hillis & Reynolds, 2003).
Dyksterhuis and Müller (2008)
2D Similar to Dyksterhuis and Müller (2004). With a particular emphasis on the intraplate orogeny.
Elastic – inhomogeneous similar to Dyksterhuis and Müller (2004).
A-B quality data of ASM database (Hillis & Reynolds, 2003).
Müller et al. (2012) 2D Similar to Dyksterhuis and Müller (2004). Elastic – inhomogeneous similar to Dyksterhuis and Müller (2004).
ASM database (Hillis & Reynolds, 2003).
Müller et al. (2015) 2D Similar to Dyksterhuis and Müller (2004). Elastic – inhomogeneous similar to Dyksterhuis and Müller (2004).
WSM database release 2008 (Heidbach et al., 2008).

Table 2: The mean SHmax orientations in Australian stress provinces in comparison with predicted SHmax orientations by different published models as well as this study. The differences show the absolute values of differences between observed and predicted SHmax orientation by each geomechanical-numerical models. Among the plate-scale models, model by Reynolds et al. (2002) provide the least differences which is used as the plate-scale reference model for our 3D continental-scale model. The last column shows the result of this study in terms of mean SHmax orientation in each stress provinces and the differences. Note that the Burbidge (2004) model is excluded from this table due to poor predictions in tectonic stress regime.
Australian Stress Provinces Mean SHmax orientation of provinces
Pseudo-stress provinces by published plate-scale geomechanical-numerical models Model presented in this studyReynolds et al. (2002) Dyksterhuis, Albert, et al. (2005) –
homogenous model Dyksterhuis, Albert, et al. (2005) –
heterogeneous model Müller et al. (2012)
Mean SHmax
Differences Mean SHmax
Differences Mean SHmax Differences Mean SHmax
Differences Mean SHmax Differences
Amadeus Basin Region 25 60 35 69 44 25 0 63 38 40 15
Bight Basin 134 95 39 142 8 173 39 134 0 110 24
Northern Bonaparte Basin 47 51 4 60 13 10 37 58 11 45 2
Southern Bonaparte Basin 57 47 10 57 0 57 0 57 0 47 10
Bowen-Surat 1 32 24 8 156 56 123 89 145 67 76 13
Bowen-Surat 2 65 167 78 150 85 132 67 126 61 50 11
Browse Basin 92 52 40 72 20 92 0 77 15 50 42
Canning Basin 53 61 8 77 24 63 10 71 18 52 1
Northern Carnarvon Basin 108 108 0 112 4 108 0 108 0 85 23
Sothern Carnarvon Basin 109 100 9 121 12 109 0 109 0 85 24
Clarence-Moreton Basin 69 150 81 152 83 140 71 135 66 80 11
Cooper-Eromanga Basins 99 99 0 147 48 141 42 99 0 90 9
Darling Region 91 115 24 141 50 141 50 99 8 105 14
Flinders Ranges 90 113 23 139 49 2 88 133 43 100 10
Galilee-Eromanga 87 56 31 174 87 164 77 164 77 67 20
Gippsland Basin 133 134 1 133 0 133 0 136 3 131 2
Gloucester Basin 34 152 62 150 64 140 74 132 82 78 44
Gunnedah Basin 57 148 89 147 90 151 86 132 75 80 23
McArthur Region 26 37 11 45 19 61 35 58 32 38 12
SA Otway Basin 132 125 7 135 3 155 23 150 18 121 11
Vic Otway Basin 137 130 7 137 0 141 4 137 0 128 9
Officer Basin 89 85 4 136 47 166 77 271 2 80 9
Perth Region 88 88 0 142 54 88 0 130 42 85 3
SE Seismogenic Zone 122 133 11 141 19 131 9 132 10 118 4
North Sydney Basin 65 137 72 147 82 151 86 140 75 75 10
South Sydney Basin 41 144 77 143 78 146 75 140 81 75 34
Sum of differences 691 1039 1039 824 390
Absolute Mean Deviation 27° 40° 40° 32° 15°

Table 3: Assigned material properties for the 3D Australian geomechanical-numerical model.
Model layer Young modulus (Pa) Poisson’s ratio Density (kgm-3)
Sediments 4.0˟1010 0.15 2500 Basement 7.0˟1010 0.3 2850 Mantle 1.5 ˟1011 0.4 3300 Water - - 1030
202

References:
Aitken, A. R. A., Salmon, M. L., & Kennett, B. L. N. (2013). Australia's Moho: A test of the usefulness of gravity modelling for the determination of Moho depth. Tectonophysics, 609(0), 468-479. doi: http://dx.doi.org/10.1016/j.tecto.2012.06.049
Alexander, L. G., & Worotnicki, G. (1957). Rock stress tests in Tumut 2 exploratory tunnel Engineering Physics Report: Snowy Mountains Hydro-Electric Authority.
Allen, T. I., Gibson, G., & Cull, J. P. (2005). Stress-field constraints from recent intraplate seismicity in southeastern Australia. Australian Journal of Earth Sciences, 52(2), 217-230. doi: 10.1080/08120090500139380
Altmann, J. B., Müller, T. M., Müller, B. I. R., Tingay, M. R. P., & Heidbach, O. (2010). Poroelastic contribution to the reservoir stress path. International Journal of Rock Mechanics and Mining Sciences, 47(7), 1104-1113. doi: http://dx.doi.org/10.1016/j.ijrmms.2010.08.001
Amante, C., & Eakins, B. W. (2009). ETOPO1 1 arc-minute global relief model procedures, data sources and analysis. NOAA Technical Memorandum NESDIS NGDC-24. National Geophysical Data Center, NOAA. doi: doi:10.7289/V5C8276M
Anderson, E. M. (1905). The dynamics of faulting. Transactions of the Edinburgh Geological Society, 8, 387–402.
Barton, C. A., & Moos, D. (2010). Geomechanical wellbore imaging: key to managing the asset life cycle. In M. Pöppelreiter, C. Garcia-Carballido, & M. Kraaijveld (Eds.), Dipmeter and Borehole Image Log Technology (pp. 81-112): American Association of Petroleum Geologists Memoir
Barton, C. A., Zoback, M. D., & Moos, D. (1995). Fluid flow along potentially active faults in crystalline rock. Geology, 23(8), 683-686. doi: 10.1130/0091-7613(1995)023<0683:ffapaf>2.3.co;2
Bell, J. S. (1996a). Petro Geoscience 1. In situ stresses in sedimentary rocks (part 1): measurement techniques. Geoscience Canada, 23(2), 85-100.
Bell, J. S. (1996b). Petro Geoscience 2. In situ stresses in sedimentary rocks (part 2): applications of stress measurements. Geoscience Canada, 23(3), 135-153.
Bell, J. S., & Gough, D. I. (1979). Northeast-southwest compressive stress in Alberta evidence from oil wells. Earth and Planetary Science Letters, 45(2), 475-482. doi: http://dx.doi.org/10.1016/0012-821X(79)90146-8
Bird, P. (1999). Thin-plate and thin-shell finite-element programs for forward dynamic modeling of plate deformation and faulting1. Computers & geosciences, 25(4), 383-394. doi: http://dx.doi.org/10.1016/S0098-3004(98)00142-3
Bird, P. (2003). An updated digital model of plate boundaries. Geochemistry, Geophysics, Geosystems, 4(3), 1027. doi: 10.1029/2001GC000252
Blumling, P. (1986). In situ Spannungsmessungen in Tiefbohrungen mit Hilfe von Bohrlochrandausbrnchen und die Spannungsverteilung in der Kruste Mitteleuropas und Australiens. (PhD), University of Karlsruhe, Karlsruhe, Germany.
Bott, M. H. P. (1959). The mechanics of oblique slip faulting. Geological Magazine, 96(2), 109-117. Brooke-Barnett, S., Flottmann, T., Paul, P. K., Busetti, S., Hennings, P., Reid, R., & Rosenbaum, G. (2015).
Influence of basement structures on in situ stresses over the Surat Basin, southeast Queensland. Journal of Geophysical Research: Solid Earth, 120(7), 4946-4965. doi: 10.1002/2015JB011964
Buchmann, T. J., & Connolly, P. T. (2007). Contemporary kinematics of the Upper Rhine Graben: A 3D finite element approach. Global and Planetary Change, 58(1–4), 287-309. doi: http://dx.doi.org/10.1016/j.gloplacha.2007.02.012
Burbidge, D. R. (2004). Thin plate neotectonic models of the Australian plate. Journal of Geophysical Research: Solid Earth, 109(B10), B10405. doi: 10.1029/2004JB003156
Camac, B. A., Hunt, S. P., & Boult, P. J. (2006). Local Rotations in Borehole Breakouts—Observed and Modeled Stress Field Rotations and Their Implications for the Petroleum Industry. International Journal of Geomechanics, 6(6), 399-410. doi: doi:10.1061/(ASCE)1532-3641(2006)6:6(399)
Clark, D., & Leonard, M. (2003). Principal stress orientations from multiple focal-plane solutions: new insight into the Australian intraplate stress field. Geological Society of America Special Papers, 372, 91-105. doi: 10.1130/0-8137-2372-8.91
Clark, D., McPherson, A., & Van Dissen, R. (2012). Long-term behaviour of Australian stable continental region (SCR) faults. Tectonophysics, 566–567(0), 1-30. doi: http://dx.doi.org/10.1016/j.tecto.2012.07.004
Cloetingh, S., & Wortel, R. (1985). Regional stress field of the Indian Plate. Geophysical Research Letters, 12(2), 77-80. doi: 10.1029/GL012i002p00077
Cloetingh, S., & Wortel, R. (1986). Stress in the Indo-Australian plate. Tectonophysics, 132(1–3), 49-67. doi: http://dx.doi.org/10.1016/0040-1951(86)90024-7
203

Coblentz, D., & Richardson, R. M. (1995). Statistical trends in the intraplate stress field. Journal of Geophysical Research: Solid Earth, 100(B10), 20245-20255. doi: 10.1029/95JB02160
Coblentz, D., Sandiford, M., Richardson, R. M., Zhou, S., & Hillis, R. (1995). The origins of the intraplate stress field in continental Australia. Earth and Planetary Science Letters, 133(3–4), 299-309. doi: http://dx.doi.org/10.1016/0012-821X(95)00084-P
Coblentz, D., Zhou, S., Hillis, R., Richardson, R. M., & Sandiford, M. (1998). Topography, boundary forces, and the Indo-Australian intraplate stress field. Journal of Geophysical Research: Solid Earth, 103(B1), 919-931. doi: 10.1029/97JB02381
Cornet, F. H. (2015). Elements of crustal geomechanics: Cambridge University Press. Denham, D., Alexander, L. G., & Worotnicki, G. (1979). Stresses in the Australian crust: evidence from
earthquakes and in-situ stress measurements. BMR Journal of Australian Geology and Geophysics, 67(4), 289-295.
Denham, D., & Windsor, C. R. (1991). The crustal stress pattern in the Australian continent. Exploration Geophysics, 22(1), 101-106.
Dyksterhuis, S., Albert, R. A., & Müller, R. D. (2005). Finite-element modelling of contemporary and palaeo-intraplate stress using ABAQUS™. Computers & geosciences, 31(3), 297-307.
Dyksterhuis, S., & Müller, R. D. (2004). Modelling the contemporary and palaeo stress field of Australia using finite-element modelling with automatic optimisation. Exploration Geophysics, 35(4), 236-241. doi: http://dx.doi.org/10.1071/EG04236
Dyksterhuis, S., & Müller, R. D. (2008). Cause and evolution of intraplate orogeny in Australia. Geology, 36(6), 495-498.
Dyksterhuis, S., Müller, R. D., & Albert, R. A. (2005). Paleostress field evolution of the Australian continent since the Eocene. Journal of Geophysical Research: Solid Earth, 110(B5), B05102. doi: 10.1029/2003JB002728
Engelder, T. (1993). Stress regimes in the lithosphere. New Jersey: Princeton University Press. Fitch, T. J., Worthington, M. H., & Everingham, I. B. (1973). Mechanisms of Australian earthquakes and
contemporary stress in the Indian ocean plate. Earth and Planetary Science Letters, 18(2), 345-356. doi: http://dx.doi.org/10.1016/0012-821X(73)90075-7
FrOG Tech. (2006). OZ SEEBASE Proterozoic Basins Study, Report to Geoscience Australia by FrOG Tech Pty Ltd.
Gaucher, E., Schoenball, M., Heidbach, O., Zang, A., Fokker, P. A., van Wees, J.-D., & Kohl, T. (2015). Induced seismicity in geothermal reservoirs: A review of forecasting approaches. Renewable and Sustainable Energy Reviews, 52, 1473-1490. doi: http://dx.doi.org/10.1016/j.rser.2015.08.026
Ghosh, A., Holt, W. E., & Flesch, L. M. (2009). Contribution of gravitational potential energy differences to the global stress field. Geophysical Journal International, 179(2), 787-812. doi: 10.1111/j.1365-246X.2009.04326.x
Ghosh, A., Holt, W. E., Flesch, L. M., & Haines, A. J. (2006). Gravitational potential energy of the Tibetan Plateau and the forces driving the Indian plate. Geology, 34(5), 321-324. doi: 10.1130/g22071.1
Grünthal, G. (2014). Induced seismicity related to geothermal projects versus natural tectonic earthquakes and other types of induced seismic events in Central Europe. Geothermics, 52, 22-35. doi: http://dx.doi.org/10.1016/j.geothermics.2013.09.009
Gunzburger, Y., & Magnenet, V. (2014). Stress inversion and basement-cover stress transmission across weak layers in the Paris basin, France. Tectonophysics, 617, 44-57. doi: http://dx.doi.org/10.1016/j.tecto.2014.01.016
Hakimhashemi, A. H., Schoenball, M., Heidbach, O., Zang, A., & Grünthal, G. (2014). Forward modelling of seismicity rate changes in georeservoirs with a hybrid geomechanical–statistical prototype model. Geothermics, 52, 185-194. doi: http://dx.doi.org/10.1016/j.geothermics.2014.01.001
Hansen, K. M., & Mount, V. S. (1990). Smoothing and extrapolation of crustal stress orientation measurements. Journal of Geophysical Research: Solid Earth, 95(B2), 1155-1165. doi: 10.1029/JB095iB02p01155
Heffer, K. J., Fox, R. J., McGill, C. A., & Koutsabeloulis, N. C. (1997). Novel Techniques Show Links between Reservoir Flow Directionality, Earth Stress, Fault Structure and Geomechanical Changes in Mature Waterfloods. SPE Journal, 2(02), 91-98. doi: 10.2118/30711-PA
Heffer, K. J., & Lean, J. C. (1991). Earth stress orientation - a control on, and guide to, flooding directionality in a majority of reservoirs. In B. Linville (Ed.), Reservoir Characterization III (pp. 799-822): PennWell Books, Tulsa.
Heidbach, O., & Ben-Avraham, Z. (2007). Stress evolution and seismic hazard of the Dead Sea Fault System. Earth and Planetary Science Letters, 257(1–2), 299-312. doi: http://dx.doi.org/10.1016/j.epsl.2007.02.042
204

Heidbach, O., Rajabi, M., Ziegler, M., & Reiter, K. (2016). The World Stress Map Database Release 2016 - Global Crustal Stress Pattern vs. Absolute Plate Motion (EGU2016-4861). Paper presented at the European Geosciences Union (EGU) General Assembly 2016, Vienna, Austria.
Heidbach, O., Reinecker, J., Tingay, M., Müller, B., Sperner, B., Fuchs, K., & Wenzel, F. (2007). Plate boundary forces are not enough: Second- and third-order stress patterns highlighted in the World Stress Map database. Tectonics, 26(6), TC6014. doi: 10.1029/2007TC002133
Heidbach, O., Tingay, M., Barth, A., Reinecker, J., Kurfeß, D., & Müller, B. (2008). The World Stress Map database release 2008. URL: www.world-stress-map.org.
Heidbach, O., Tingay, M., Barth, A., Reinecker, J., Kurfeß, D., & Müller, B. (2010). Global crustal stress pattern based on the World Stress Map database release 2008. Tectonophysics, 482(1–4), 3-15. doi: http://dx.doi.org/10.1016/j.tecto.2009.07.023
Henk, A. (2005). Pre-drilling prediction of the tectonic stress field with geomechanical models. First break, 23(11), 53-57. doi: 10.3997/1365-2397.2005021
Hergert, T., & Heidbach, O. (2010). Slip-rate variability and distributed deformation in the Marmara Sea fault system. Nature Geosci, 3(2), 132-135. doi:http://www.nature.com/ngeo/journal/v3/n2/suppinfo/ngeo739_S1.html
Hergert, T., & Heidbach, O. (2011). Geomechanical model of the Marmara Sea region—II. 3-D contemporary background stress field. Geophysical Journal International, 185(3), 1090-1102. doi: 10.1111/j.1365-246X.2011.04992.x
Hergert, T., Heidbach, O., Bécel, A., & Laigle, M. (2011). Geomechanical model of the Marmara Sea region—I. 3-D contemporary kinematics. Geophysical Journal International, 185(3), 1073-1089. doi: 10.1111/j.1365-246X.2011.04991.x
Hergert, T., Heidbach, O., Reiter, K., Giger, S. B., & Marschall, P. (2015). Stress field sensitivity analysis in a sedimentary sequence of the Alpine foreland, Northern Switzerland. Solid Earth Discuss., 7(1), 711-756. doi: 10.5194/sed-7-711-2015
Hillis, R. (1991). Australia-Banda Arc collision and in situ stress in the Vulcan Sub-basin (Timor Sea) as revealed by borehole breakout data. Exploration Geophysics, 22(1), 189-194. doi: http://dx.doi.org/10.1071/EG991189
Hillis, R., Enever, J. R., & Reynolds, S. D. (1999). In situ stress field of eastern Australia. Australian Journal of Earth Sciences, 46(5), 813-825.
Hillis, R., Meyer, J. J., & Reynolds, S. D. (1998). The Australian stress map. Exploration Geophysics, 29(4), 420-427. doi: http://dx.doi.org/10.1071/EG998420
Hillis, R., Mildren, S. D., Pigram, C. J., & Willoughby, D. R. (1997). Rotation of horizontal stresses in the Australian North West continental shelf due to the collision of the Indo-Australian and Eurasian Plates. Tectonics, 16(2), 323-335. doi: 10.1029/96TC02943
Hillis, R., & Reynolds, S. D. (2000). The Australian Stress Map. Journal of the Geological Society, 157(5), 915-921. doi: 10.1144/jgs.157.5.915
Hillis, R., & Reynolds, S. D. (2003). In situ stress field of Australia. Geological Society of America Special Papers, 372, 49-58. doi: 10.1130/0-8137-2372-8.49
Hillis, R., Sandiford, M., Coblentz, D. D., & Zhou, S. (1997). Modelling the contemporary stress field and its implications for hydrocarbon exploration. Exploration Geophysics, 28(2), 88-93. doi: http://dx.doi.org/10.1071/EG997088
Hillis, R., Sandiford, M., Reynolds, S. D., & Quigley, M. C. (2008). Present-day stresses, seismicity and Neogene-to-Recent tectonics of Australia's ‘passive’ margins: intraplate deformation controlled by plate boundary forces. Geological Society, London, Special Publications, 306(1), 71-90. doi: 10.1144/sp306.3
Hillis, R., & Williams, A. F. (1992). Borehole breakouts and stress analysis in the Timor Sea. Geological Society, London, Special Publications, 65(1), 157-168. doi: 10.1144/gsl.sp.1992.065.01.11
Hillis, R., & Williams, A. F. (1993). The stress field of the North West Shelf and wellbore stability. Australian Petroleum Exploration Association Journal, 33(373-385).
Jaeger, J. C., Cook, N. G. W., & Zimmerman, R. (2007). Fundamentals of rock mechanics (4th ed.). Oxford: Wiley-Blackwell.
Jones, R. M., & Hillis, R. (2003). An integrated, quantitative approach to assessing fault-seal risk. AAPG Bulletin, 87(3), 507-524. doi: 10.1306/10100201135
King, G. E. (2010). Thirty Years of Gas Shale Fracturing: What Have We Learned? Paper presented at the SPE Annual Technical Conference and Exhibition, Florence, Italy.
Kraft, T., & Deichmann, N. (2014). High-precision relocation and focal mechanism of the injection-induced seismicity at the Basel EGS. Geothermics, 52, 59-73. doi: http://dx.doi.org/10.1016/j.geothermics.2014.05.014
205

Leonard, M., Ripper, I. D., & Yue, L. (2002). Australian earthquake fault plane solutions. Geoscience Australia, Record 2002/19.
Lowry, D. (1990). Breakouts in oil wells. PESA Journal, 17, 43-44. Mildren, S. D., Hillis, R., Dewhurst, D. N., Lyon, P. J., Meyer, J. J., & Boult, P. J. (2005). FAST: A new
technique for geomechanical assessment of the risk of reactivation-related breach of fault seals. In P. J. Boult & J. Kaldi (Eds.), Evaluating fault and cap rock seals: AAPG Hedberg Series (Vol. 2, pp. 73-85).
Mildren, S. D., Hillis, R., Fett, T., & Robinson, P. H. (1994). Contemporary stresses in the Timor Sea: implications for fault trap integrity. Paper presented at the Petroleum Exploration Society of Australia Symposium: The Sedimentary Basins of Western Australia, Perth, Western Australia.
Mildren, S. D., Hillis, R., & Kaldi, J. (2002). Calibrating predictions of fault seal rectivation in the Timor Sea. APPEA Journal, 42, 187-202.
Moeck, I., & Backers, T. (2011). Fault reactivation potential as a critical factor during reservoir stimulation. First break, 29(5), 73-80. doi: 10.3997/1365-2397.2011014
Müller, R. D., Dyksterhuis, S., & Rey, P. (2012). Australian paleo-stress fields and tectonic reactivation over the past 100 Ma. Australian Journal of Earth Sciences, 59(1), 13-28.
Müller, R. D., Yatheesh, V., & Shuhail, M. (2015). The tectonic stress field evolution of India since the Oligocene. Gondwana Research, 28(2), 612-624. doi: http://dx.doi.org/10.1016/j.gr.2014.05.008
Nelson, E. J., Hillis, R., Sandiford, M., Reynolds, S., & Mildren, S. D. (2006). Present-day state-of-stress of southeast Australia. APPEA Journal, 2006, 283-305.
Quigley, M., Cupper, M., & Sandiford, M. (2006). Quaternary faults of south-central Australia: palaeoseismicity, slip rates and origin. Australian Journal of Earth Sciences, 53(2), 285-301.
Rajabi, M., Tingay, M., & Heidbach, O. (2016a). The present-day state of tectonic stress in the Darling Basin, Australia: Implications for exploration and production. Marine and Petroleum Geology, 77, 776-790. doi: http://dx.doi.org/10.1016/j.marpetgeo.2016.07.021
Rajabi, M., Tingay, M., & Heidbach, O. (2016b). The present-day stress field of New South Wales, Australia. Australian Journal of Earth Sciences, 63(1), 1-21. doi: 10.1080/08120099.2016.1135821
Rajabi, M., Tingay, M., Heidbach, O., Hillis, R., & Reynolds, S. (under-review). The present-day stress field of Australia, Under-review in Earth-Science Reviews.
Rajabi, M., Tingay, M., King, R., & Heidbach, O. (2016). Present-day stress orientation in the Clarence-Moreton Basin of New South Wales, Australia: a new high density dataset reveals local stress rotations. Basin Research. doi: 10.1111/bre.12175
Reiter, K., & Heidbach, O. (2014). 3-D geomechanical–numerical model of the contemporary crustal stress state in the Alberta Basin (Canada). Solid Earth, 5(2), 1123-1149. doi: 10.5194/se-5-1123-2014
Reiter, K., Heidbach, O., & Moeck, I. (2013). Stress field modelling in the Alberta Basin, Canada. International Workshop on Geomechanics and Energy – The Ground as Energy Source and Storage Lausanne, Switzerland, 26-28 November 2013, We 01 08.
Reynolds, S. D., Coblentz, D. D., & Hillis, R. (2002). Tectonic forces controlling the regional intraplate stress field in continental Australia: Results from new finite element modeling. Journal of Geophysical Research: Solid Earth, 107(B7), ETG 1-1-ETG 1-15. doi: 10.1029/2001JB000408
Reynolds, S. D., Coblentz, D. D., & Hillis, R. (2003). Influences of plate-boundary forces on the regional intraplate stress field of continental Australia. Geological Society of America Special Papers, 372, 59-70. doi: 10.1130/0-8137-2372-8.59
Reynolds, S. D., & Hillis, R. (2000). The in situ stress field of the Perth Basin, Australia. Geophysical Research Letters, 27(20), 3421-3424. doi: 10.1029/2000GL011538
Reynolds, S. D., Mildren, S. D., Hillis, R., Meyer, J. J., & Flottmann, T. (2005). Maximum horizontal stress orientations in the Cooper Basin, Australia: implications for plate-scale tectonics and local stress sources. Geophysical Journal International, 160(1), 331-343. doi: 10.1111/j.1365-246X.2004.02461.x
Richardson, R. M. (1992). Ridge forces, absolute plate motions, and the intraplate stress field. Journal of Geophysical Research: Solid Earth, 97(B8), 11739-11748. doi: 10.1029/91JB00475
Salmon, M., Kennett, B. L. N., & Saygin, E. (2013). Australian Seismological Reference Model (AuSREM): crustal component. Geophysical Journal International, 192(1), 190-206. doi: 10.1093/gji/ggs004
Salmon, M., Kennett, B. L. N., Stern, T., & Aitken, A. R. A. (2013). The Moho in Australia and New Zealand. Tectonophysics, 609(0), 288-298. doi: http://dx.doi.org/10.1016/j.tecto.2012.07.009
Sandiford, M. (2003). Neotectonics of southeastern Australia: linking the Quaternary faulting record with seismicity and in situ stress. Geological Society of America Special Papers, 372, 107-119. doi: 10.1130/0-8137-2372-8.107
Sandiford, M., Wallace, M., & Coblentz, D. D. (2004). Origin of the in situ stress field in south-eastern Australia. Basin Research, 16(3), 325-338. doi: 10.1111/j.1365-2117.2004.00235.x
206

Schoenball, M., Müller, T. M., Müller, B. I. R., & Heidbach, O. (2010). Fluid-induced microseismicity in pre-stressed rock masses. Geophysical Journal International, 180(2), 813-819. doi: 10.1111/j.1365-246X.2009.04443.x
Segall, P. (1989). Earthquakes triggered by fluid extraction. Geology, 17(10), 942-946. doi: 10.1130/0091-7613(1989)017<0942:etbfe>2.3.co;2
Sibson, R. H. (1996). Structural permeability of fluid-driven fault-fracture meshes. Journal of Structural Geology, 18(8), 1031-1042.
Simpson, R. W. (1997). Quantifying Anderson's fault types. Journal of Geophysical Research: Solid Earth, 102(B8), 17909-17919. doi: 10.1029/97JB01274
Spassov, E. (1998). The stress field in Australia from composite fault plane solutions of the strongest earthquakes in the continent. Journal of Seismology, 2(2), 173-178. doi: 10.1023/A:1008004424443
Sperner, B., Müller, B., Heidbach, O., Delvaux, D., Reinecker, J., & Fuchs, K. (2003). Tectonic stress in the Earth’s crust: advances in the World Stress Map project. Geological Society, London, Special Publications, 212(1), 101-116. doi: 10.1144/gsl.sp.2003.212.01.07
Steinberger, B., Schmeling, H., & Marquart, G. (2001). Large-scale lithospheric stress field and topography induced by global mantle circulation. Earth and Planetary Science Letters, 186(1), 75-91. doi: http://dx.doi.org/10.1016/S0012-821X(01)00229-1
Stephansson, O., & Berner, H. (1971). The finite element method in tectonic processes. Physics of the Earth and Planetary Interiors, 4(4), 301-321. doi: http://dx.doi.org/10.1016/0031-9201(71)90014-8
Worotnicki, G., & Denham, D. (1976, Aug, 1976 ). The state of stress in the upper part of the earth's crust in Australia according to measurements in mines and tunnels and from seismic observations. Paper presented at the Symposium on Investigation of Stress in Rock: Advances in Rock Measurment
Zhang, Y., Scheibner, E., Hobbs, B. E., Ord, A., Drummond, B. J., & Cox, S. J. D. (1998). Lithospheric Structure in Southeast Australia: a Model Based on Gravity, Geoid and Mechanical Analyses Structure and Evolution of the Australian Continent (pp. 89-108): American Geophysical Union.
Zhang, Y., Scheibner, E., Ord, A., & Hobbs, B. (1996). Numerical modelling of crustal stresses in the eastern Australian passive margin. Australian Journal of Earth Sciences, 43(2), 161-175.
Zhao, S., & Müller, R. D. (2001). The tectonic stress field in eastern Australia. Paper presented at the Eastern Australasian Basins Symposium, A Refocussed Energy Perspective for the Future.
Zhao, S., & Müller, R. D. (2003). Three-dimensional finite-element modelling of the tectonic stress field in continental Australia. Geological Society of America Special Papers, 372, 71-89. doi: doi:10.1130/0-8137-2372-8.71
Zoback, M. D. (2010). Reservoir geomechanics. Cambridge: Cambridge University Press. Zoback, M. L. (1992). First- and second-order patterns of stress in the lithosphere: The World Stress Map
Project. Journal of Geophysical Research: Solid Earth, 97(B8), 11703-11728. doi: 10.1029/92JB00132 Zoback, M. L., Zoback, M. D., Adams, J., Assumpcao, M., Bell, S., Bergman, E. A., . . . Zhizhin, M. (1989).
Global patterns of tectonic stress. Nature, 341(6240), 291-298.
207

3.7. Conference Papers for the Australian Stress Research
1) Rajabi, M., Tingay, M., King, R., Cooke, D., 2015. The present-day stress field of Australia: New release
of the Australian Stress Map. ASEG Extended Abstracts 2015, 3 pages.
DOI: http://dx.doi.org/10.1071/ASEG2015ab303.
2) Rajabi, M., Tingay, M., Heidbach, O., King, R., 2015. The role of faults and fractures in local and regional
perturbation of present-day horizontal stresses - an example from the Clarence-Moreton Basin, eastern
Australia, 77th EAGE Conference & Exhibition 2015. EAGE, IFEMA Madrid, Spain, 5 pages.
DOI: http://dx.doi.org/10.3997/2214-4609.201413346.
3) Rajabi, M., Tingay, M., 2016. Pattern and origin of the present-day tectonic stress in the Australian
sedimentary basins. ASEG-PESA 2016, ASEG extended abstracts, 5 pages.
DOI: http://dx.doi.org/10.1071/ASEG2016ab275.
4) Rajabi, M., Tingay, M., Heidbach, O., King, R., 2015. The Pattern of In Situ Stress in Onshore Basins of
New South Wales, AAPG International Conference & Exhibition. AAPG Datapages, Melbourne, Australia.
DOI: http://dx.doi.org/10.1190/ice2015-2210249.
5) Rajabi, M., Tingay, M., Heidbach, O., King, R., Cooke, D., 2015. The New Release of the Australian
Stress Map: Controls on the Stress Pattern From the Plate to Field Scale, AAPG International Conference &
Exhibition. AAPG, Melbourne, Australia.: DOI: http://dx.doi.org/10.1190/ice2015-2210754.
6) Rajabi, M., Tingay, M., Heidbach, O., King, R., 2015. The contemporary state of stress in Australia from
regional to local scale, Presented in: the Geology of Geomechanics. The Geological Society of London,
London.
7) Rajabi, M., Tingay, M., Heidbach, O., 2016. The present-day tectonic stress pattern of Australia: the new
release of the Australian stress map project, Neotectonics on the Australian Plate. Presented in invited
symposium: New Science for Energy, Mineral and Groundwater Systems, and Hazard Assessment.
Geoscience Australia, Canberra, Australia.
8) Rajabi, M., Tingay, M., 2013. Applications of intelligent systems in petroleum geomechanics - prediction
of geomechanical properties in different types of sedimentary rocks, International Workshop on
Geomechanics and Energy – The Ground as Energy Source and Storage. EAGE, Lausanne, Switzerland. 5
pages. DOI: http://dx.doi.org/10.3997/2214-4609.20131949.
208

Rajabi, M., Tingay, M., King, R., Cooke, D., (2015). The present-day stress field of Australia: New release of the Australian Stress Map. ASEG Extended Abstracts 2015(1), 1-3.
NOTE:
This publication is included on pages 209 - 211 in the print copy of the thesis held in the University of Adelaide Library.
It is also available online to authorised users at:
http://dx.doi.org/10.1071/ASEG2015ab303

Rajabi, M., Tingay, M., Heidbach, O., King, R., (2015). The role of faults and fractures in local and regional perturbation of present-day horizontal stresses - an example from the Clarence-Moreton Basin, eastern Australia, 77th EAGE Conference & Exhibition 2015. EAGE, IFEMA Madrid, Spain, 5 pages.
NOTE:
This publication is included on pages 212 - 216 in the print copy of the thesis held in the University of Adelaide Library.
It is also available online to authorised users at:
http://dx.doi.org/10.3997/2214-4609.201413346

Rajabi, M., Tingay, M., (2016). Pattern and origin of the present-day tectonic stress in the Australian sedimentary basins. ASEG-PESA 2016, ASEG extended abstracts, 5 pages.
NOTE:
This publication is included on pages 217 - 221 in the print copy of the thesis held in the University of Adelaide Library.
It is also available online to authorised users at:
http://dx.doi.org/10.1071/ASEG2016ab275

Rajabi, M., Tingay, M., Heidbach, O., King, R., (2015). The Pattern of In Situ Stress in Onshore Basins of New South Wales, AAPG International Conference & Exhibition. AAPG Datapages, Melbourne, Australia.
NOTE:
This publication is included on page 222 in the print copy of the thesis held in the University of Adelaide Library.
It is also available online to authorised users at:
http://dx.doi.org/10.1190/ice2015-2210249

Rajabi, M., Tingay, M., Heidbach, O., King, R., Cooke, D., (2015). The New Release of the Australian Stress Map: Controls on the Stress Pattern From the Plate to Field Scale, AAPG International Conference & Exhibition. AAPG, Melbourne, Australia.
NOTE:
This publication is included on page 223 in the print copy of the thesis held in the University of Adelaide Library.
It is also available online to authorised users at:
http://dx.doi.org/10.1190/ice2015-2210754

Geology of Geomechanics 28-29 October 2015 The Geological Society of London
The contemporary state of stress in Australia from regional to local scale
Mojtaba Rajabi1, Mark Tingay1, Oliver Heidbach2, Rosalind King3
1Australian School of Petroleum, University of Adelaide, Adelaide, SA 5005, Australia
2GFZ German Research Centre for Geosciences, Telegrafenberg, 14473 Potsdam, Germany
3School of Earth and Environmental Sciences, University of Adelaide, Adelaide, SA 5005, Australia
The Australian Stress Map (ASM) project was started in 1996 to compile a public data set of maximum horizontal present-day tectonic stress (SHmax) in the Australian continent. The early phases of the ASM project revealed that plate boundary forces provide the first-order control on the regional pattern of the SHmax orientation. However, the small scale variations of SHmax, which are of particular importance in CO2 sequestration, petroleum and geothermal exploration, are poorly constrained in the previous phases of the project.
The ASM project was restarted in 2012 and aims to improve our understanding of the stress pattern in parts of the continent that previously had sparse or no published stress data. Since 2012, we have interpreted over 600 borehole image logs in coal seam gas, mineral, geothermal and conventional petroleum wells. The 2015 ASM database now contains more than 1000 A-C quality data records, which all have been ranked based on the World Stress Map quality ranking scheme.
In order to determine the regional state of stress throughout the continent, different techniques including definition of stress provinces, wavelength analysis of stress orientation and mapping of stress trajectories have been applied. The new release of the ASM has 25 stress provinces that are located in different sedimentary basins. Statistical analysis of stress provinces in eastern Australia reveals high variability of SHmax orientations, which are consistent with local perturbation of stress due to presence of different geological features (i.e. faults, fractures and lithological contrasts).
Numerous geomechanical-numerical models have been used to predict the present-day state of stress in the Australian continent. Almost all these models evaluated the relative importance of complex boundary forces acting on the Indo-Australian plate. However, some regional deviations between the model predictions and the stress data could not be solved particularly in the eastern, central and north-eastern Australia. The new ASM stress data compilation confirms these regional deviations and revealed numerous local perturbations, which are probably the result of geological structures such as fractures, faults, lithological density and strength contrasts as well as intraplate volcanism. These second- and third-order sources of the in situ stress act in particular in the sedimentary basin in eastern Australia. We also compare the new release of the ASM with the Australian neotectonic database and show the consistency between SHmax orientation and neotectonics in different regions of the continent, which confirms that the present-day stress field is a primary control on intraplate deformation throughout the continent.
224

THE PRESENT-DAY TECTONIC STRESS PATTERN OF AUSTRALIA: THE NEW RELEASE OF THE AUSTRALIAN STRESS MAP PROJECT
Rajabi, Mojtaba1; Tingay, Mark
1; Heidbach, Oliver
2
1Australian School of Petroleum, the University of Adelaide, Adelaide, SA 5005, Australia
2 GFZ German Research Centre for Geosciences, Telegrafenberg, 14473 Potsdam, Germany
The Australian Stress Map (ASM) project was started in 1996 to compile a public data set for the
orientation of maximum horizontal present-day tectonic stress (SHmax) in the Australian continent. The last
public release of the project, by Richard Hillis and Scott Reynolds in 2003, comprised of 549 SHmax data
records and successfully constrained the SHmax orientation in 16 stress provinces through Australia and
Papua New Guinea. In addition, numerous geomechanical-numerical models highlighted that the stress
pattern of continental Australia, at the first order, is controlled by complex plate boundary forces around
the Indo-Australian Plate.
The ASM project was re-started in 2012 with a primary emphasis on compiling stress information in areas
previously absent or sparsely populated by stress data. Particular focus was made to compile stress
information using the recent increase in unconventional and geothermal exploration in New South Wales,
Queensland, Northern Territory and South Australia. In the past four years, we extensively analysed and
compiled new stress data and herein present the most up-to-date ASM database, with 2140 SHmax data
records from variety of stress indicators at different depths. The new release of the ASM has 30 stress
provinces that show four major SHmax orientations in the Australian continent. The SHmax orientation in
northern and northwestern Australia is NNE-SSW, it rotates to a prevailing E-W orientation in southern half
of Western Australia and most part of South Australia. The regional trend of the SHmax in eastern Australia
is ENE-WSW which swings to NW-SE in southeastern Australia. Comparisons between the observed
orientations and Australian stress models in the available literature reveal that published geomechanical-
numerical models are unable to satisfactorily predict the state of stress in most of eastern Australia. In
addition, we found significant localised perturbations of stress at different scales due to second and third
order of stress sources. The new findings suggest that, although the plate boundary forces and gravitational
potential energy have the major roles in the long wavelength stress pattern of the continent, local stress
sources due to different geological structures are also significant and can lead to substantial changes in the
orientation of the SHmax at the basin, field and well scale.
The new ASM database suggests a thrust faulting stress regime typically exists in the upper one km of the
crust. This regime changes to a prevailing strike-slip faulting stress regime in deeper parts. A comparison
between the Australian neotectonic database and the new ASM database further confirm the consistency
between the SHmax orientation and the strike of neotectonic structures. However, the majority of
neotectonic structures suggest a thrust faulting stress regime, which is in agreement with shallow stress
information but is different with tectonic stress regime at depths of more than one km. Hence, the depth-
dependency of stress regime highlights a potential pitfall of using neotectonic structures in geomechanical
assessment of geo-reservoirs.
NEOTECTONICS ON THE AUSTRALIAN PLATENEW SCIENCE FOR ENERGY, MINERAL AND GROUNDWATER
SYSTEMS, AND HAZARD ASSESSMENTINVITED SYMPOSIUM
Venue: Geoscience Australia, ACT, Australia - 29 February- 1 March, 2016
225

Rajabi, M., Tingay, M., (2013). Applications of intelligent systems in petroleum geomechanics – prediction of geomechanical properties in different types of sedimentary rocks, International Workshop on Geomechanics and Energy – The Ground as Energy Source and Storage. EAGE, Lausanne, Switzerland. 5 pages.
NOTE:
This publication is included on pages 226 - 230 in the print copy of the thesis held in the University of Adelaide Library.
It is also available online to authorised users at:
http://dx.doi.org/10.3997/2214-4609.20131949

4. The Present-Day Stress Field of New Zealand
4.1. Paper 7: Contemporary Tectonic Stress Pattern of the Taranaki
Basin, New Zealand
Rajabi, M., Ziegler, M., Tingay, M., Heidbach, O., Reynolds, S., 2016. Contemporary
tectonic stress pattern of the Taranaki Basin, New Zealand. Journal of Geophysical Research:
Solid Earth 121, 6053–6070. DOI: http://dx.doi.org/10.1002/2016JB013178.
231

232

Contemporary tectonic stress pattern of the TaranakiBasin, New ZealandMojtaba Rajabi1, Moritz Ziegler2,3, Mark Tingay1, Oliver Heidbach2, and Scott Reynolds4
1Australian School of Petroleum, University of Adelaide, Adelaide, South Australia, Australia, 2Helmholtz Centre Potsdam,German Research Centre for Geosciences GFZ, Potsdam, Germany, 3Institute of Earth and Environmental Science,University of Potsdam, Potsdam, Germany, 4Ikon Science Asia Pacific, Kuala Lumpur, Malaysia
Abstract The present-day stress state is a key parameter in numerous geoscientific research fieldsincluding geodynamics, seismic hazard assessment, and geomechanics of georeservoirs. The TaranakiBasin of New Zealand is located on the Australian Plate and forms the western boundary of tectonicdeformation due to Pacific Plate subduction along the Hikurangi margin. This paper presents the firstcomprehensive wellbore-derived basin-scale in situ stress analysis in New Zealand. We analyze boreholeimage and oriented caliper data from 129 petroleum wells in the Taranaki Basin to interpret the shapeof boreholes and determine the orientation of maximum horizontal stress (SHmax). We combine these data(151 SHmax data records) with 40 stress data records derived from individual earthquake focal mechanismsolutions, 6 from stress inversions of focal mechanisms, and 1 data record using the average of several focalmechanism solutions. The resulting data set has 198 data records for the Taranaki Basin and suggests aregional SHmax orientation of N068°E (±22°), which is in agreement with NW-SE extension suggested bygeological data. Furthermore, this ENE-WSW average SHmax orientation is subparallel to the subductiontrench and strike of the subducting slab (N50°E) beneath the central western North Island. Hence, we suggestthat the slab geometry and the associated forces due to slab rollback are the key control of crustal stress inthe Taranaki Basin. In addition, we find stress perturbations with depth in the vicinity of faults in some of thestudied wells, which highlight the impact of local stress sources on the present-day stress rotation.
1. Introduction
Subduction zones and their associated forces are supposed to provide the first-order control, amongst otherplate boundary forces, on the regional pattern of crustal stress in intraplate and near-plate boundary zones[Coblentz et al., 1998; Heidbach et al., 2010; Lithgow-Bertelloni and Guynn, 2004; Tingay et al., 2010; Zoback,1992; Zoback et al., 1989]. However, there are several mechanisms and features associated with subductionthat affect the neotectonic activity of adjacent plates and generate complex stress patterns, particularly inthe overriding plate [Heidbach et al., 2010; Lallemand et al., 2005; Zoback, 1992]. Understanding of thesemechanisms, and their roles on the present-day stress pattern, has numerous applications in Earth sciences,including geodynamics, neotectonic deformation, seismic hazard assessment, mitigating induced seismicity,and enhancing production from hydrocarbon reservoirs [Bell, 1996b; Engelder, 1993; Richardson, 1992; Sibsonet al., 2012; Zoback, 2007].
The Taranaki Basin of New Zealand is located ~400 km west of the Hikurangi margin, where the oblique sub-duction of the Pacific Plate actively occurs (west southwestward) beneath the (Indo-) Australian Plate(Figure 1) [Beavan et al., 2002; DeMets et al., 2010]. The basin originally formed in the Late Cretaceous as arifted basin due to the Gondwana breakup and is now considered to mark the western limit of tectonic defor-mation related to the Hikurangi subduction zone [Giba et al., 2010; King and Thrasher, 1996; Reilly et al., 2015].The Taranaki Basin has had a complex structural and geological history, right from its earliest initiation upuntil the present day, and currently displays active tectonics, volcanism, and seismicity [Anderson andWebb, 1994; Giba et al., 2010; Neall et al., 1986; Robinson et al., 1976; Sherburn andWhite, 2005; 2006]. The com-plex geological and structural history of the Taranaki Basin makes it ideally prospective for hydrocarbons, as itcontains all the required elements of a commercial petroleum system [King and Thrasher, 1996; Stagpoole andFunnell, 2001]. Indeed, the Taranaki Basin is the only petroleum-producing basin in New Zealand, with over400 onshore and offshore drilled wells [King and Thrasher, 1996].
Despite the considerable level of interest in neotectonic deformation and seismic hazard assessment in NewZealand, as well as the economic importance of the Taranaki Basin, there are surprisingly few in situ stress
RAJABI ET AL. STRESS MAP OF TARANAKI BASIN 6053
PUBLICATIONSJournal of Geophysical Research: Solid Earth
RESEARCH ARTICLE10.1002/2016JB013178
Key Points:• The first detailed wellbore-derivedbasin-scale in situ stress analysis inNew Zealand
• Interpretation and analysis ofpresent-day stress in the TaranakiBasin with 198 data records
• Slab geometry and associated forcesare the key control of crustal stress inthe Taranaki Basin
Supporting Information:• Supporting Information S1
Correspondence to:M. Rajabi,[email protected]
Citation:Rajabi, M., M. Ziegler, M. Tingay,O. Heidbach, and S. Reynolds (2016),Contemporary tectonic stress patternof the Taranaki Basin, New Zealand,J. Geophys. Res. Solid Earth, 121,6053–6070, doi:10.1002/2016JB013178.
Received 16 MAY 2016Accepted 11 JUL 2016Accepted article online 13 JUL 2016Published online 3 AUG 2016
©2016. American Geophysical Union.All Rights Reserved.
233

Figure 1. (a) Simplified tectonic setting of New Zealand which is located at the boundary of Pacific and (Indo-) AustralianPlate (IAP). Pacific Plate Subduction beneath the IAP is the key control of the tectonic setting of overriding plate. In thesouth, the IAP is subducting beneath the Pacific Plate along Puysgur Margin. These two large subduction zones are linkedto each other by the strike-slip Alpine Fault. The tectonic plate boundaries and their types are from Bird [2003]. The TaranakiBasin in western North Island is considered as the western limit of deformation due to subduction zone [Giba et al., 2010;Nicol and Wallace, 2007; Sherburn and White, 2006]. (b) Regional cross section across North Island and the Taranaki Basinthat show the position of subduction along the Hikurangi margin [Giba et al., 2010].
Journal of Geophysical Research: Solid Earth 10.1002/2016JB013178
RAJABI ET AL. STRESS MAP OF TARANAKI BASIN 6054
234

data in the published literature for the region. For example, the 2008 release of the World Stress Map (WSM)database, which is the most comprehensive worldwide compilation of the stress data, contains no stressinformation at all in and around the Taranaki Basin [Heidbach et al., 2008; 2010]. The only published studythe authors could find on the in situ stress of the Taranaki Basin was carried out by Sherburn and White[2006], which was based on 39 individual focal mechanism solutions (FMS) and two formal inversion of earth-quake focal mechanisms (FMF) of deep (>7.5 km) earthquakes, and suggested an E-W orientation of themax-imum horizontal stress (SHmax). In addition, Townend et al. [2012] published the most comprehensive stressmap of New Zealand and also suggested an E-W SHmax orientation for the region based on four FMF datarecords and the results of Sherburn and White [2006].
Borehole imaging technology and oriented caliper data provide information on the shape of boreholewall and are well established methods for determination of the present-day SHmax orientation [Bell,1996a; Zoback, 2007]. In this study we compile and interpret different types of borehole image log,Schlumberger’s high-resolution dipmeter tool, and oriented caliper data from 129 wells to determine theorientation of the SHmax across the Taranaki Basin. We also compile FMS and FMF data of earthquakes fromthe published literature to present the first comprehensive stress map of the Taranaki Basin. We use twocommon circular statistical methods to analyze the regional pattern of SHmax and compare the present-daystress pattern with different geological information in and around the Taranaki Basin. On a large scale, wecompare the SHmax pattern with the geometry of the Hikurangi margin subduction zone east of the basinand propose that subduction processes control the stress pattern of the Taranaki Basin at the first order.On smaller scales, we highlight some local stress perturbations in the vicinity of faults and describe thesignificant implications of both the regional and highly localized, stress orientations for petroleum explora-tion and production in the Taranaki Basin.
2. Tectonic and Geological Setting of the Taranaki Basin
The mostly offshore and partly onshore Taranaki Basin is located on the western side of New Zealand’s NorthIsland and covers an area of 330,000 km2 (Figure 1) [Salazar et al., 2015]. The basin has a complex tectonichistory, including two major phases of extension and one of compression since the Late Cretaceous [Gibaet al., 2010; King and Thrasher, 1996; Nicol et al., 2005; Reilly et al., 2015]. During the Late Cretaceous-latePaleocene, the Taranaki Basin was initiated as an intracontinental rifted basin due to the breakup of easternGondwana and the opening of the Tasman Sea [Giba et al., 2010; King and Thrasher, 1996]. This first phase ofextension was followed by an Eocene (or Oligocene) and younger phase of compression and then by asecond NW-SE extensional phase that has been ongoing from the Plio-Pleistocene (or late Miocene) topresent day [Giba et al., 2010; Holt and Stern, 1994; King and Thrasher, 1996; Nicol et al., 2005; Reilly et al.,2015; Stern and Davey, 1990]. Synchronous extension and shortening at the present day occurs in thenorth and south of the Taranaki Basin, respectively, due to clockwise block rotation around a southwardmigrating vertical axis [Giba et al., 2010; King and Thrasher, 1996; Reilly et al., 2015]. The Taranaki Basin isnow considered an active marginal basin and forms the western limit of tectonic deformation related toPacific Plate subduction beneath the Australian Plate along the Hikurangi margin (Figures 1 and 2) [Hill et al.,2004; King and Thrasher, 1996; Palmer and Bulte, 1991; Stagpoole and Funnell, 2001; Stagpoole et al., 2004;Webster et al., 2011].
The present-day Taranaki Basin is characterized by two structural blocks, termed the western stable platform(passive margin) and eastern mobile belt (active margin) (Figure 2) [King and Thrasher, 1996]. The westernstable platform is relatively undeformed, while the active part of the basin (i.e., eastern mobile belt) is char-acterized by a variety of different structures, including thrust and overthrust features, inversion structures,extensional features, and a belt of stratovolcanoes [Giba et al., 2010; King and Thrasher, 1996; Reilly et al.,2015]. The Taranaki Fault and the Cape Egmont Fault Zone (CEFZ), respectively, define the eastern and wes-tern boundaries of the eastern mobile belt that has accommodated the thick sedimentary sequences andpetroleum plays of the Taranaki Basin (Figure 2) [King and Thrasher, 1996; Muir et al., 2000]. The CEFZ is agroup of extensional and compressional active faults with a regional NE-SW orientation. However, the N-Sstriking Taranaki Fault is a major Tertiary structure that forms the boundary of Mesozoic basement andCretaceous-Tertiary rocks and has regionally accommodated much of the large-scale plate convergencedisplacement (Figure 2) [Nicol et al., 2004; Stagpoole et al., 2004].
Journal of Geophysical Research: Solid Earth 10.1002/2016JB013178
RAJABI ET AL. STRESS MAP OF TARANAKI BASIN 6055
235

Figure 2. Structural elements of the Taranaki Basin and location of the studied wells. Western Stable Platform and Eastern Mobile Belt are twomajor structural blocks[King and Thrasher, 1996]. Faults and the location of different oil and gas fields across the basin are from King and Thrasher [1996]. Detailed location of the studiedwells can be found in the supporting information.
Journal of Geophysical Research: Solid Earth 10.1002/2016JB013178
RAJABI ET AL. STRESS MAP OF TARANAKI BASIN 6056
236

The Taranaki Basin is considered as a marine basin that is floored by extended continental crust and accom-modates thick sequences of Cretaceous and younger sedimentary rocks in several depocenters [King andThrasher, 1996]. The complex history of the Taranaki Basin provided all elements of petroleum systems forgeneration and accumulation of hydrocarbons in several trap types (Figure 2) [King and Thrasher, 1996].Late Cretaceous to Paleogene coals and mudstones are the primary source rocks, while Paleocene toPliocene sandstone formations are the principal reservoir rocks of the basin. Different mudstone and marlyunits (Late Cretaceous to Neogene) are the major top seals, with hydrocarbons trapped by faults, folds,and stratigraphic features across the basin [King and Thrasher, 1996].
3. Methods to Determine the Present-Day Stress Orientation
The in situ stress tensor is described with a symmetric second-degree tensor and thus consists of six indepen-dent components [Engelder, 1993; Jaeger et al., 2007; Zoback, 2007]. Assuming that the overburden stress (Sv)is one of the three principal stresses, the stress tensor in the Earth’s crust can be explained by four indepen-dent components, termed the Sv magnitude, maximum horizontal stress (SHmax) magnitude, minimum hor-izontal stress (Shmin) magnitude, and the SHmax orientation [Bell, 1996a; Engelder, 1993; Jaeger et al., 2007;Zoback, 2007]. Of all the components of the present-day stress tensor, the orientation of SHmax has receivedsignificant attention in the past 30 years due to its important implications for a wide variety of Earth scienceand engineering issues [Bell, 1996b; Engelder, 1993; Heidbach et al., 2010; Tingay et al., 2005; Zoback, 2007].Herein we determined the orientation of the SHmax in vertical sections of the studied wells based on theWSM guidelines and criteria [Heidbach et al., 2010; Sperner et al., 2003; Zoback, 1992]. Wherever possible,we also determined the relative magnitude of the principal stresses, to define the tectonic stress regimebased on the standard Anderson [1905] classification. In this study, we investigated the present-day stateof crustal stress (from 0 to 40 km depth), and particularly the SHmax orientation, in the Taranaki Basin from fourwell-known methods, namely, borehole breakouts, drilling-induced fractures (DIFs), formal stress inversionsof focal mechanisms (FMF), and focal mechanism solutions of earthquakes (FMS).
3.1. Determination of the SHmax Orientation From Drilling-Induced Fractures and Borehole Breakouts
The analyses of borehole breakouts and DIFs are well-known methods for interpretation of horizontal in situstress orientations in boreholes [Bell, 1996a; Zoback, 2007; Zoback et al., 1989]. Borehole breakouts formwhere the hoop stress acting on the wellbore wall exceeds the compressive strength of rock and causes shearfailure and spalling off of the rocks forming the wellbore wall [Bell and Gough, 1979]. In a vertical wellbore,borehole breakouts cause an enlargement of the hole diameter in the Shmin orientation, which gives theborehole cross section an approximately oval shape, with the long axis of the ellipse aligned parallel toShmin [Bell and Gough, 1979]. The orientation of borehole breakouts, and thus the orientation of present-day SHmax, can be interpreted from borehole image logs and oriented four-arm or six-arm caliper logs [Bell,1996a; Plumb and Hickman, 1985; Zoback, 2007].
It should be noted that borehole breakouts can be difficult to interpret from oriented caliper logs, as theyneed to be carefully distinguished from other types of non-stress-related borehole enlargements, such askey seats and washouts [Plumb and Hickman, 1985]. In this study, we used the commonly made assumptionthat one of the principal stresses is vertical. Therefore, in order to interpret the breakouts from caliper logs,wells with deviations<10° were used. In wells with deviations>5°, breakouts were ignored if they coincidedwith the deviation direction, in order to filter out potential key seating. Hence, in this study we used the stan-dard methodology introduced by Plumb and Hickman [1985] and Bell [1990], and expanded by Reinecker et al.[2003], to interpreted breakouts in the studied wells (Figure 3). Borehole image logs produce a 360° coveredimage of wellbore wall based on petrophysical property contrasts (e.g., resistivity or acoustic properties) andprovide a more reliable interpretation of breakouts. In borehole image logs, breakouts are observed as rela-tively wide, “blobby” (often poorly resolved) zones of either high conductivity (in electrical image logs) or low-amplitude/high borehole radius (in acoustic image logs) appearing on opposite sides of the wellbore wall(Figure 3).
DIFs are created when the minimum principal effective stress, in the disturbed stress zone around the well-bore, becomes negative (in tension) and below the tensile strength (circumferential stress< T< 0). Hence, itcauses zones of tensile failure on the wellbore wall that are aligned in the SHmax orientation [Aadnoy, 1990;
Journal of Geophysical Research: Solid Earth 10.1002/2016JB013178
RAJABI ET AL. STRESS MAP OF TARANAKI BASIN 6057
237

Bell, 1996a; Zoback, 2007]. DIFs can be analyzed via borehole image logs as a subset of conductive andsubvertical fractures that are observed on opposite sides of the borehole (Figure 3). DIFs cannot be inter-preted from oriented caliper logs. In this study, breakout and DIF orientations were corrected for magneticdeclination in order to plot the orientations with respect to true north.
3.2. SHmax Orientation From Earthquake Focal Mechanism Solutions
Natural seismic events (i.e., earthquakes) also provide important information on the state of crustal stress[Heidbach et al., 2010; McKenzie, 1969; Raleigh et al., 1972; Zoback, 1992]. Three types of seismological indica-tors are employed in the WSM database to infer the stress state, including single focal mechanisms (FMS), for-mal stress inversions using several focal mechanisms (FMF), and average or composite focal mechanisms(FMA). The main difference between these indicators is the reliability of the derived stress.
In the FMS method, the orientation of the P, B, and T axes of a focal mechanism solution represents the prox-imate stress field orientation [McKenzie, 1969]. However, the P, B, and T axes are not equal to the principalstress orientations [Célérier, 2010; Heidbach et al., 2010;McKenzie, 1969]. Assuming that the friction coefficientof the rupture plane is 0.6, the largest principal stress orientation is ~30° off from the rupture plane. Since it isgenerally not clear which of the two nodal planes is the rupture plane for strike-slip events, the P axis bisect-ing the compressional quadrant of the focal mechanism is used as a proxy for the SHmax orientation. For theother faulting regimes the other principal axis of the moment tensor are used (see Zoback [1992] for moredetails). However, theoretically the orientation of the largest principal stress can be anywhere within thecompressional quadrant [Arnold and Townend, 2007; McKenzie, 1969], and thus using the P axis as proxyfor the stress orientation allows for potentially large uncertainties. Hence, for the WSM database the SHmax
orientation derived from FMS method is assumed to have a standard deviation of ±25° (i.e., C quality
Figure 3. Typical examples of drilling-induced tensile fractures (DIFs) and borehole breakouts (BOs) in acoustic and resistivity borehole image tools. (a) An example ofUltrasonic Borehole Imager (UBI) log from Tekirii-2 well and (b) an example of Fullbore Formation MicroImager (FMI) from Turangi-1 well. In borehole image logs, BOsare defined as poorly resolved wide zones (low-amplitude or conductive zones) due to invasion of drilling mud in the conjugate shear fractures that make an ovalshape for the borehole. Note that the BOs and DIFs in vertical wells form in the opposite side of borehole wall. (c) A typical example of BOs in four-arm caliper log inKupe South well which is characterized by enlargement in one diametrical direction (shown by caliper 1), while the other caliper is similar to bit size. P1AZ is theazimuth of pad 1 relative to magnetic north. Note that interpretation of BOs in caliper logs need particular attention to be distinguished from other types of boreholeenlargements (see Plumb and Hickman [1985] and Reinecker et al. [2003] for more details).
Journal of Geophysical Research: Solid Earth 10.1002/2016JB013178
RAJABI ET AL. STRESS MAP OF TARANAKI BASIN 6058
238

Figure 4. The in situ stress map of the Taranaki Basin. In situ stress data are shown based on the type indicators (FM: focal mechanism solution of earthquakes andstress inversions; DIF: drilling-induced fractures; BO: borehole breakouts) and tectonic stress regime (U: undefined, SS: strike-slip, NF: normal). Lines show theorientation of the SHmax, and the length of the lines indicates the data quality based on the World Stress Map quality ranking criteria [Heidbach et al., 2010]. Faultsand petroleum fields in the Taranaki Basin are from King and Thrasher [1996]. Note that the strike-slip stress regime for wellbore data are fromMildren et al. [2001] andGMI [2010].
Journal of Geophysical Research: Solid Earth 10.1002/2016JB013178
RAJABI ET AL. STRESS MAP OF TARANAKI BASIN 6059
239

according to the WSM ranking criteria); [Heidbach et al., 2010; Zoback, 1992]. The average of P, B, and T axes ofseveral mechanism solutions (i.e., FMA data records [Leitner et al., 2001; Sbar and Sykes, 1973; Webb et al.,1986; Zoback and Zoback, 1980]) or the composites [Sbar et al., 1972] are less reliable, and thus these datarecords are assumed to have a higher standard deviation of ±40° and thus receive a D quality in the latestupdate of the WSM database [Heidbach et al., 2010].
A more accurate stress estimation of the principal stress orientations can be achieved with a set of focalmechanism solutions assuming that they are caused by the same stress tensor. Furthermore, this so-calledformal stress inversion (FMF) assumes that the earthquake slip direction occurs in the maximum shear stressdirection (Wallace-Bott hypothesis [Bott, 1959]). Thus, the stress inversion provides the three principal stres-ses orientation by minimizing the average difference between the slip direction and the maximum shearstress on the inverted faults [Angelier, 1984; Gephart and Forsyth, 1984;Michael, 1984]. This misfit angle is usedin the WSM database to assign the data record quality. More recently, Arnold and Townend [2007] implemen-ted a probabilistic approach to determine the principal stress axes orientations from earthquake observa-tions. Different inversion methods result in a deviatoric stress tensor, with four parameters including thethree principal stress axes orientations and the relative magnitudes of the intermediate principal stress withrespect to the minimum and maximum principal stresses. To compare the results of the formal stress inver-sion with the other data records, the WSM database uses the approach of Lund and Townend [2007] to derivethe SHmax orientation from the orientation of the three principal stresses. The stress regime is again assignedusing the classification and limits of Zoback [1992]. Generally, the SHmax data records derived from formalinversion of stress receive an A or B quality assignment in the WSM database [Heidbach et al., 2010;Zoback, 1992].
4. Results: SHmax Orientation of the Taranaki Basin
In this study we analyzed various types of wellbore image logs, dipmeters, and oriented caliper tools in 129wells in the Taranaki Basin (Figure 2) to derive the orientation of SHmax from the interpretation of boreholebreakouts and DIFs from 0.8 km to 5 km depths. This analysis results in 151 new A–E quality data recordsacross the basin. In addition, we compiled 40 (A–E quality) FMS data records in the region from publishedpapers by Webb and Anderson [1998] and Sherburn and White [2006], two FMF data records from Sherburnand White [2006], one FMA from Reyners [2010], and four FMF data records from Townend et al. [2012]. Thecombination of extensive drilling-induced stress information and focal mechanism solutions of earthquakesallows us to present the first comprehensive contemporary stress map of the Taranaki Basin based on 198stress indicators. We classified all data records according to the WSM quality ranking criteria, which classifiesstress orientations from A to E quality, with A quality being the most reliable and the E quality the leastreliable [Heidbach et al., 2010]. The details of the Taranaki Basin stress map can be found in Figure 4,Table 1, and the online supporting information.
The earthquake FMS/FMF suggests a deep SHmax that is generally ranging from E-W to ENE-WSW and indi-cates both normal and strike-slip stress regimes. The stress orientations from earthquakes are broadly consis-tent with that observed from breakouts and DIFs, which indicates that SHmax is usually ~ ENE-WSWthroughout the basin but does range from NNE-SSW to E-W in individual wells and fields (Figure 4). In thestudied wells, we observed localized rotation of breakouts in the vicinity of fractures and faults in the
Table 1. In Situ Stress Data Indicators in the Taranaki Basin Based on Their Quality and Data Typesa
Data Type
Quality
TotalA B C D E
Borehole breakouts 18 13 15 19 64 129Drilling-induced tensile fracture - 4 5 13 - 22Focal mechanism solution of earthquakes - - 17 16 7 40Stress inversion of focal mechanisms 2 2 - - 2 6Average focal mechanism solutions - - - 1 - 1Total 20 19 37 49 73 198
aThe A to E quality is according to the WSM ranking criteria [Heidbach et al., 2010].
Journal of Geophysical Research: Solid Earth 10.1002/2016JB013178
RAJABI ET AL. STRESS MAP OF TARANAKI BASIN 6060
240

Taranaki Basin (Figure 5). Such a local perturbation of the SHmax was previously reported in the Taranaki Basin[Camac et al., 2005], and other regions worldwide, due to juxtaposition of different types of rocks, slip onactive faults, and changes in the rock mechanical properties owing to high density of fractures [Rajabiet al., 2016a, 2016b; Zoback, 2007]. It should be noted that local perturbations of breakouts in the studiedwells occur in very short intervals (e.g., 10–15m; Figure 5) and do not have a significant impact on the meanSHmax orientation.
In order to analyze the pattern of the mean basin-wide SHmax orientation, we applied two different methods,including stress province determination from Rayleigh test [Hillis and Reynolds, 2000; Rajabi et al., 2016b] andthe stress smoothing technique [Coblentz and Richardson, 1995; Hansen and Mount, 1990; Heidbach et al.,2010; Müller et al., 2003; Reiter et al., 2014]. In the stress province method demonstrated by Hillis andReynolds [2000], the data records in the basin are weighted based on their quality. The most reliable SHmax
data record, A quality data, received a weight of 4 down to D quality that received a weight of 1. Often, onlythe A–C quality data are considered as reliable data records, while D quality data records are less reliablebecause D quality data have a higher probability to reflect local perturbations of the SHmax orientation ratherthan long-wavelength SHmax orientation [Heidbach et al., 2010]. However, there are several examples thatdemonstrate the potential reliability of D quality data records in different regions worldwide. For example,Tingay et al. [2010], Reiter et al. [2014], and Ziegler et al. [2016] clearly demonstrated that the inclusion of Dquality data records does not increase the overall stress variability compared to only A–C data interpretationand that the inclusion of D quality data can yield a more representative regional stress orientation in
Figure 5. Localized rotation of borehole breakouts (BOs) near faults and fractures in Trapper A-1 well. In this example,(a) blue sinusoids show the interpreted fractures, and (b) green lines indicate the orientation of BOs which is perpendicularto the maximum horizontal stress orientation (SHmax). The SHmax orientation is deviated almost 30° in a 10m depth intervaldue to presence of faults or high density of natural fractures.
Journal of Geophysical Research: Solid Earth 10.1002/2016JB013178
RAJABI ET AL. STRESS MAP OF TARANAKI BASIN 6061
241

sedimentary basins. However, it should also be noted that some other studies have suggested that it can beunreliable to include D quality data for the understanding of regional stress pattern, as these data can resultin an increase in stress variability due to presence of local structures that show the local pattern of stress[Rajabi et al., 2016a; Rajabi et al., 2016b]. Extreme caution needs to be exercised to refrain from filtering ofdata records, simply because they do or do not “fit” preconceived expectations. As a rule of thumb, high-quality borehole image logs, which may only include a few meters of stress indicators, often provide locallyhighly reliable stress information even though the individual stress data record is assigned a D quality, usingthe WSM criteria, because of the small number or short length of observed stress indicators.
In order to assess the reliability of D quality data in the Taranaki Basin, we calculated the mean SHmax orienta-tion, length of the mean resultant vector (R bar), and the standard deviation (SD) with and without D qualitydata. We then applied the Rayleigh test [Coblentz and Richardson, 1995; Davis, 2002; Mardia, 1972] on differ-ent sets of stress data records to check if the mean SHmax orientations across the Taranaki Basin are distrib-uted randomly or systematically. The result of the stress province calculations are presented in Figure 6and show a prevailing ENE-WSW SHmax orientation across the Taranaki Basin with generally low SD valuesregardless of the inclusion of D quality data in the statistical calculations. Thus, we conclude that the D qualitydata reliably show the SHmax orientation across the basin and hence we included them for smoothing analysisin the following section.
Figure 6. Statistical analysis of the mean orientation of SHmax across the Taranaki Basin. (a) Different rose diagrams show the distribution of SHmax orientations fordifferent data sets [Heidbach et al., 2010] which show consistent SHmax orientation with and without D quality data. Plot in Figure 6a shows the Rayleigh test for thedata records in the Taranaki Basin. Different lines in this plot are based on the cutoff values of Mardia [1972]. In order to do this statistical test, we first calculatedlength of resultant vector for each data set and plotted it versus number of data records. As can be seen, in all situations (using different WSM qualities) the meanSHmax orientation across the Taranaki Basin is statistically significant because they pass the highest line (i.e., 99.9%). (b) Smoothing the mean SHmax orientation on a0.1° grid as described by Heidbach et al. [2010]. See text for the details of this method. Note the local deviation due to the topography of the Egmont Volcano (MountTaranaki) where the smoothed mean SHmax orientation has more than 25° SD and, hence, is not plotted.
Journal of Geophysical Research: Solid Earth 10.1002/2016JB013178
RAJABI ET AL. STRESS MAP OF TARANAKI BASIN 6062
242

The smoothing analysis of stress pattern calculates the mean SHmax orientation, and its variability, on a gridmap for different search radii [Heidbach et al., 2010;Müller et al., 2003; Reiter et al., 2014]. In this study, we usedthe algorithms developed by Heidbach et al. [2010] to calculate the smoothed SHmax pattern across theTaranaki Basin on a 0.1° grid. Each data record was weighted according to its quality and the inverse distancefrom each grid point. We plotted the mean SHmax orientation at the grid point when at least three SHmax
orientations were within the search radius and when the SD is < 25°. Figure 6 illustrates the smoothed stresspattern across the study area from this analysis, which confirms the general ENE-WSW SHmax trend for theTaranaki Basin region. It should be noted that each plotted mean SHmax orientation is reliable within ± 25°.
5. Discussions5.1. The Pattern of In Situ Stress in the Taranaki Basin
Previous studies of the stress pattern of the Taranaki Region were based mainly on the earthquake FMS data[Cavill et al., 1997; Reyners, 1980; Sherburn and White, 2006; Townend et al., 2012; Webb and Anderson, 1998]and with particular emphasis on the seismicity of the Egmont Volcano (Mount Taranaki). Sherburn andWhite [2006] suggested an east-west SHmax orientation in the Taranaki region based on 39 FMS data andtwo FMF analyses, despite this direction not being consistent with the NW-SE extension inferred from recentgeological data. Thus, they suggested that the volcanic activity of Mount Taranaki was possibly perturbingthe stress field in the area [Sherburn and White, 2006]. Furthermore, they noted a high angle between theirregional E-W SHmax and the strike of the CEFZ (~N45°E), and concluded that this fault system must containhigh pore fluid pressure or have a low coefficient of friction [Sherburn and White, 2006]. According to ouranalysis, based on 129 wellbore and 47 FMS/FMF/FMA data, the regional pattern of stress across the basinis N68°E (±22°) which is slightly different from what was suggested by Sherburn and White [2006] and is morebroadly consistent with both the regional extension direction and the strike of the CEFZ.
In this study, we assessed the FMS data of Sherburn and White [2006] using the WSM quality ranking criteria[Heidbach et al., 2010]. This led to seven data records receiving E quality because no clear tectonic regimecould be established according to Zoback [1992]. This means that the P, B, and T axes are rather oblique,which prevents a conclusive derivation of a tectonic stress regime, and hence no assignment of a SHmax ispossible. Therefore, these data records are not included in our database. We then compared the meanSHmax orientation of the region inferred from FMS, FMF, and wellbore data separately to see if these threedifferent methods provide similar results. To calculate the mean SHmax orientation for these three differentdata sets, we first calculated the mean SHmax for all the data regardless of their quality (unweighted inTable 2). We then put more weight on more reliable data records (A = 4, B = 3, C = 2 and D= 1) and calculatedthe mean SHmax orientation (weighted in Table 2). The results reveal similar values for the mean SHmax orien-tation derived from A–C quality wellbore and FMF and FMS data (Table 2). However, D quality FMS datarecords result in more standard deviations on the mean SHmax orientation. Hence, putting lower weight onthe poor quality data (such as D quality FMS) is recommended for the calculation of mean SHmax orientations.The comparison between wellbore and earthquake data has been investigated before in otherregions, such as Italy as convergent plate boundaries [Pierdominici and Heidbach, 2012], Iceland asdivergent plate boundaries [Ziegler et al., 2016], and southwest of Iran as a continental collision zone
Table 2. Comparison Between the Calculated Maximum Horizontal Stress Orientations (SHmax) Inferred From SingleFocal Mechanism Solutions of Earthquakes (FMS), Stress Inversions of Focal Mechanisms (FMF), and Wellbore Dataa
Data Records
No. of Data RecordsMean SHmax
(A–C Quality Data Records)Mean SHmax
(A–D Quality Data Records)
A B C D Weighted Unweighted Weighted Unweighted
Wellbore indicators 18 17 20 32 068° (±19°) 067° (±20°) 067° (±21°) 066° (±24°)FMF 2 2 0 0 069° (±13°) 069° (±13°) 069° (±13°) 069° (±13°)FMS and FMA 0 0 17 17 067° (±27°) 067° (±27°) 072° (±30°) 076° (±33°)
aTo calculate the weighted mean SHmax orientation, A quality receives a weight of 4 down to D quality which receivesweight of 1. The mean SHmax orientations (calculated by bipolar statistics) show similar results between wellbore andFMS/FMF data. However, D quality FMS data increases standard deviation, and, hence, lower weight should be put onthese data records. Note that A–D qualities are the World Stress Map quality ranking [Heidbach et al., 2010].
Journal of Geophysical Research: Solid Earth 10.1002/2016JB013178
RAJABI ET AL. STRESS MAP OF TARANAKI BASIN 6063
243

[Rajabi et al., 2010, 2014]. Therefore,our results, that is, from the near sub-duction zone, confirm that these twovery different methods result in thesame mean SHmax orientation withinthe standard deviation.
5.2. Comparisons Between the StressPattern and Geological Data in theTaranaki Basin
There have been extensive studies onthe geometry and kinematics of faultsin the North Island and the TaranakiBasin [Giba et al., 2010, 2013; Reillyet al., 2015; Seebeck et al., 2013, 2014].For example, Giba et al. [2010], in adetailed study on the evolution of thenorthern Taranaki Basin, suggested aregional NE-SW strike for Late Mioceneand younger faults. Furthermore, theydocumented a southward migration ofnormal faults in the northern TaranakiBasin, where older faults (formedbetween 12 and 4Ma) in the north showa regional trend of ~N19°E, whileyounger faults (<4Ma) in the southshow a regional trend of ~N41°E [Gibaet al., 2010]. In addition, kinematic ana-lyses of normal fault outcrops alongthe northern Taranaki coast suggestNW-SE extension for the faults that wereactive between 0.3 and 5Ma, which isconsistent with regional fault strikes[Giba et al., 2010].
Townsend et al. [2010] characterized the recurrence rate, timing, and magnitude of six active normal faults tothe southwest of Mount Taranaki. These active faults show a regional NE-SW to ENE-WSW trend (variesbetween N35°E and N65°E) and indicate paleoseismicity with magnitudes of> 6 for these faults. The tectonicor volcanic origin of these faults was discussed by Townsend et al. [2010], and they suggested that the faultswere formed due to tectonic activity because they were probably active before the volcanic activity. The con-sistency between our determined SHmax orientation and the trend of these faults further supports a tectonicorigin for these faults (Figure 7). Reilly et al. [2015] showed NNE-SSW and ENE-WSW trending normal faultswest and east of the CEFZ, respectively. The presence of NE-SW reverse faults was also reported in the south-west of North Island and north of South Island which is consistent with NW-SE to WNW-ESE SHmax orientationfor that region determined by Townend et al. [2012]. Seebeck et al. [2014] also suggested a NE-SW trend foractive normal faults of the Taupo Rift Zone (east of the Taranaki Basin), where kinematic data show a meanextension of S43°E (±23). Generally, most of the studies in the Taranaki Basin, and active intra-arc rift in thecentral North Island, suggest significant NW-SE extension on the NE trending faults, which is consistent withthe regional N68°E (±22°) SHmax orientation determined in his study (Figure 7).
According to the earthquake FMS data, a strike-slip tectonic stress regime primarily exists in the region butwith some suggestions of a normal faulting stress regime, particularly in the eastern part of the basin, andthese stress regimes are consistent with the rifting nature of the central North Island. For example,McNamara et al. [2015] suggested a NE-SW SHmax orientation and normal stress regime in the eastern sideof the Taranaki region in three geothermal wells in the Rotokawa Geothermal Field, which the predicted
Figure 7. Summary and comparison between observed maximumhorizontal stress orientation (SHmax) and other azimuthal data in andaround the Taranaki Basin. Each line shows the mean azimuth, and theshaded areas are standard deviation. The optimum failure angle isdetermined as the mean SHmax orientation ±30°. Strike of normal faults inTaranaki Basin and south of Taranaki Peninsula are from Giba et al. [2010]and Townsend et al. [2010], respectively. The geometry of slab and strikeof Taupo rift are from Seebeck et al. [2013, 2014]. All these azimuthalfeatures are interrelated because they are caused by or are consequencesof the in situ stress field and the plot shows that most of the data areconsistent with each other.
Journal of Geophysical Research: Solid Earth 10.1002/2016JB013178
RAJABI ET AL. STRESS MAP OF TARANAKI BASIN 6064
244

SHmax is subparallel to the active rift axis. Several unpublished petroleum reports determined stress regimein different parts of the Taranaki Basin. For example, Mildren et al. [2001] predicted a broadly strike-slipstress regime in the normally and mildly overpressure zones of the Pohokura Field (offshore of thenorthern Taranaki Basin). However, their predicted SHmax magnitude in the overpressure zone is similarto Sv (SHmax/Sv = 1.03), and thus this stress regime may be better classified as a borderline strike-slip/normalfaulting stress regime. Mildren and Meyer [2006] determined a strike-slip stress regime in Moana Prospect(northern Taranaki Graben). Mildren [2009] investigated the stress regime in the Mangatoa area (northernTaranaki) and found that the magnitude of Sv and SHmax are similar above the overpressure zone, andstress conditions verge on the transition between normal and strike-slip stress regimes. Similarly,GeoMechanics International Inc. (GMI) [2010] also predicted a strike-slip faulting regime for the Te KiriProspect in the Western Taranaki Peninsula (Figure 4). Hence, petroleum data also suggest a generallystrike-slip regime and, in some cases, a transition from strike-slip to normal stress regime. The accommo-dation of strike-slip component on the normal faults in the Taupo Rift Zone (east of Taranaki Basin) hasalso been suggested and is consistent with petroleum data [Acocella et al., 2003; Lamarche et al., 2005;Nairn and Cole, 1981; Seebeck et al., 2013; Spinks et al., 2005].
5.3. Controls on the Stress Pattern of the Taranaki Basin
Deformation and tectonic setting of the North Island is mainly controlled by the Pacific Plate subductionbeneath the Indo-Australian Plate [Nicol and Beavan, 2003; Nicol et al., 2007; Nicol and Wallace, 2007;Townend et al., 2012; Wallace et al., 2004]. The process of the subduction in the North Island can be tracedby several features such as folds and faults in the eastern portion (fore arc), active intra-arc rift (and associatedvolcanism in the Taupo rift zones) and back-arc spreading in the central and central western part of NorthIsland [Nicol and Beavan, 2003; Nicol et al., 2007; Nicol and Wallace, 2007; Townend et al., 2012; Wallaceet al., 2004]. The convergence of the plates at the Hikurangi margin is oblique and, due to slab rollback,induces trench-parallel and trench-perpendicular suction forces that control the stress state of the overridingplate [Barnes et al., 1998; Townend et al., 2012; Wallace et al., 2004].
As outlined in the previous section, comprehensive studies on the evolution of volcanism, rifting, and faultingin the Taranaki Basin suggest NE-SW trending active and recent normal faults that are broadly consistent withour observed SHmax orientation. Although most of the faults in the northern part of the Taranaki Basin show aNE-SW trend, Giba et al. [2010] clearly demonstrated that normal faults with NNE-SSW orientation were activebetween 12 and 4Ma, while younger faults (0–4Ma) that are primarily present in the southern part of thebasin show clockwise changes in their strikes. In the northern Taranaki Basin, Giba et al. [2010] determineda regional trend of N39°E (±25°) for the normal faults, which is generally consistent with our determinedN68°E (±22°) SHmax orientation (Figure 7). Furthermore, this ENE-WSW SHmax orientation is fully consistentwith the trend of normal faults at the southern Taranaki Basin [Reilly et al., 2015] and outcrop normal faultsin the southeast of the Taranaki Peninsula [Townsend et al., 2010] (Figure 7). Note that most of the active faultsin the Taranaki Basin were originally initiated during past tectonic phases and have been reactivated due toepisodic extensions and contractions [Giba et al., 2010; Giba et al., 2013; King and Thrasher, 1996; Reilly et al.,2015; Sherburn and White, 2006]. Hence, their orientation of active faults may not be optimally oriented withthe exact present-day SHmax orientation [Sherburn and White, 2006].
The regional ENE-WSW orientation of SHmax in the Taranaki Basin is subparallel to the relative motion ofPacific and Australian plates (Figure 7). If we consider the transmission of this relative motion as the mainsource of the contemporary tectonic stress in the Taranaki Basin, we would predict that a prevailingthrust stress regime exists in the region. However, as outlined above, most of the Taranaki Basin (exceptin the northernmost of part of South Island) shows a strike-slip to normal stress regime. At a tectonicplate scale, the strike of the subducted slab beneath the central western North Island is N40°E–N50°E(Figure 7) [Seebeck et al., 2013; Seebeck et al., 2014]. The trend of the slab in the vicinity of theTaranaki Basin (~N50°E) is almost subparallel with the pattern of SHmax orientation (N68°E). Similar effectsof slab orientation on stress patterns are observed in other subduction zones such as Hellenic Arc in theMediterranean [Doutsos and Kokkalas, 2001; Heidbach et al., 2010; Meijer and Wortel, 1997] and Cascadiasubduction zone [Balfour et al., 2011; Wang, 2000] where there is a margin-normal SHmax orientation atthe subduction front and a margin-parallel SHmax orientation farther from the trench and in theback-arc region.
Journal of Geophysical Research: Solid Earth 10.1002/2016JB013178
RAJABI ET AL. STRESS MAP OF TARANAKI BASIN 6065
245

The standard deviation of our determined SHmax orientation is ±22° and can explain the ~20° differencebetween regional strike of the slab and the SHmax orientation (Figure 7). However, two other stress sourcescan also be suggested to explain this ~20° difference. First, the clockwise rotation of the North Island arounda vertical axis could be an alternative cause of this ~20° difference (Figure 7). Several studies have proposedclockwise rotation of the North Island around a vertical axis due to a variable rollback process of the subduct-ing plate and the southward transition of subduction to continental collision along the Hikurangi margin. Inthis region, the Pacific Plate is being subducted in the northern part of the margin (slab rollback dominant),while there is a continental collision zone in the southern part due to the presence of a buoyant indenter andthe unsubductable Chatham Rise [Beavan and Haines, 2001; Nicol et al., 2007; Nicol and Wallace, 2007;Walcott,1987; Wallace et al., 2004, 2009]. Second, Stern et al. [2013] suggested mantle dripping in the western NorthIsland where there are sharp lithospheric changes across the Taranaki-Ruapehu line. These sharp changes arealso present in the recent Moho map of New Zealand [Salmon et al., 2013] where the Moho depth insouthwest of North Island is thicker than the Moho in the Taranaki region. These lithospheric changes alongwith mantle dripping probably provide gravitational instabilities and can affect the stress pattern of theTaranaki Basin.
Seebeck et al. [2013] comprehensively investigated the geometry and strike of the subducted Pacific Platebeneath the Australian Plate in the last 20Ma and suggested a consistent trend for the slab since 16Ma,which is not in agreement with clockwise rotation of the overriding plate. Consequently, Seebeck et al.[2013] proposed that the clockwise rotation of the North Island is independent of the subducted slab andoccurs due to decoupling deformation between the plates owing to the accommodation of the majority ofrelative plate motion by subduction thrust at Hikurangi margin. Hence, similar to Seebeck et al. [2014], whoconcluded that the geometry of the subducted slab provides the major control on the geometry of rift faultsin the Taupo Rift Zone, we suggest that the state of in situ stress in the Taranaki Basin is mainly controlled byrollback of the subducting slab and the associated force of subduction suction.
5.4. Implications for Petroleum Exploration
The Taranaki Basin has significant economic importance because it is the major petroleum province of NewZealand. The implications of the present-day stress, particularly the SHmax orientation, have been demon-strated in numerous studies from early exploration to field abandonment [Bell, 1996b; Tingay et al., 2005;Zoback, 2007]. The information of the present-day stress has major applications in wellbore stability, fault sealand fracture permeability, sand production prediction, and subsurface fluid flow [Barton et al., 1995; Bell,1996b; Heffer et al., 1997; Tingay et al., 2005; Zoback, 2007]. The understanding of the present-day stress inthe Taranaki Basin is particularly important because it is a rifted basin, where faults and fractures play criticalroles in different aspects of the petroleum exploration and production. Generally, the concept of structuralpermeability [Sibson, 1996] demonstrates the fluid-flow ability of fractures and faults that are orientedsubparallel to the orientation of the SHmax [Barton et al., 1995; Zoback, 2007]. The failure angle is definedas the angle between the SHmax orientation and strike of faults, which Sibson [1985] suggested as being22.5–30° for typical friction coefficients of 0.6–1.0 [Byerlee, 1978]. In a normal stress regime, the optimal orien-tated faults are parallel to SHmax orientation. Sherburn andWhite [2006] considered the strike of CEFZ as N45°Eand determined an east-west orientation for the SHmax across the Taranaki Basin. Hence, they found a largefailure angle for the Taranaki region (i.e.,>30°) and concluded high pore fluid pressure or a low coefficient offriction of the faults in the region.
Our refined stress map of the Taranaki Basin suggests that interpreted faults are in the optimum range offailure angle (Figure 7). In addition, neotectonic information generally suggests a normal faulting stressregime in the Taranaki Basin [Giba et al., 2010; Litchfield et al., 2013; Townsend et al., 2010], while unpublishedwellbore data [GMI, 2010; Mildren, 2009; Mildren and Meyer, 2006] and earthquake FMS data [Sherburn andWhite, 2006] suggest both strike-slip and normal stress regimes in the basin. We did not observe any systema-tic changes of stress regime in the Taranaki Basin laterally and with depth. Hence, the presence of two tec-tonic stress regimes across the basin possibly is due to the existence of geological structures, densitycontrasts, mantle dripping, and the Mount Taranaki activity. The existence of normal and strike-slip stressregime have significant implications for wellbore stability of the Taranaki Basin, where erroneous assessmentof present-day stresses can lead to expensive instability or collapse of boreholes [Tingay et al., 2015;Zoback, 2007].
Journal of Geophysical Research: Solid Earth 10.1002/2016JB013178
RAJABI ET AL. STRESS MAP OF TARANAKI BASIN 6066
246

The orientation of the SHmax can be deviated from the regional trend, laterally and with depth, due to thepresence of geological features [Rajabi et al., 2016a, 2016b; Zoback, 2007]. The Taranaki Basin shows a signif-icant ENE-WSW SHmax orientation except the west of Mount Taranaki where a number of close by indicatorsshow rotations from the regional trend possibly owing to density contrast and magmatism as previouslyhighlighted by Sherburn and White [2006]. Localized perturbation of stress, with depth, has been previouslyreported in the vicinity of intersected faults in the Taranaki Basin [Camac et al., 2005]. We also observed thesesmall-scale stress rotations at short intervals in some of the studied wells (Figure 5). These localized stress var-iations can have significant implications in geomechanical characterization of georeservoirs [Bell, 1996b;Rajabi et al., 2016b; Zoback, 2007]. The orientation of SHmax is an important issue in the initiation of inducedhydraulic fractures and an effective method for stimulation of hydrocarbon and geothermal reservoirs[Bell, 1996b; Zoback, 2007]. Hence, localized deviation of stress due to small-scale stress sources can initiatecomplex and ineffective hydraulic fracture stimulations [Maxwell et al., 2009; Rajabi et al., 2016b]. This issueis particularly important for the Taranaki Basin where hydraulic fracturing stimulation is implemented toextract oil from reservoir rocks in some fields [Green et al., 2006].
6. Conclusions
This paper presents the first comprehensive contemporary stress map of the Taranaki Basin of New Zealand,which is located on the Australian Plate adjacent to the Pacific-Australian plate boundary. The interpretationof wellbore and earthquake data provides a mean SHmax orientation of N68°E (±22°) across the Taranaki Basin,which is consistent with NW-SE extension of the region suggested by subsurface and outcrop publishedgeological data. The mean SHmax orientation is almost parallel to the strike of the subduction trench andthe subducting slab, indicating that the subduction process of the Pacific Plate is the most likely key controlon the pattern of stress in the Taranaki Basin. In addition to the dominant regional stress orientation driven bythe adjacent subduction zone, we also observed small-scale stress perturbations (localized rotation of break-outs) in the vicinity of small-scale geological sources, as well as close to the density contrast of the EgmontVolcano (Mount Taranaki). The regional and local stress orientation, which has numerous implications in geo-mechanical studies, is important to explain the impact of smaller-scale sources of stress even in the presenceof large-scale plate boundary forces.
ReferencesAadnoy, B. S. (1990), In-situ stress directions from borehole fracture traces, J. Pet. Sci. Eng., 4(2), 143–153, doi:10.1016/0920-4105(90)90022-U.Acocella, V., K. Spinks, J. Cole, and A. Nicol (2003), Oblique back arc rifting of Taupo Volcanic Zone, New Zealand, Tectonics, 22(4), 1045,
doi:10.1029/2002TC001447.Anderson, E. M. (1905), The dynamics of faulting, Trans. Edinb. Geol. Soc., 8, 387–402.Anderson, H., and T. Webb (1994), New Zealand seismicity: Patterns revealed by the upgraded National Seismograph Network, New Zeal. J.
Geol. Geop., 37(4), 477–493, doi:10.1080/00288306.1994.9514633.Angelier, J. (1984), Tectonic analysis of fault slip data sets, J. Geophys. Res., 89(B7), 5835–5848, doi:10.1029/JB089iB07p05835.Arnold, R., and J. Townend (2007), A Bayesian approach to estimating tectonic stress from seismological data, Geophys. J. Int., 170(3),
1336–1356, doi:10.1111/j.1365-246X.2007.03485.x.Balfour, N. J., J. F. Cassidy, S. E. Dosso, and S. Mazzotti (2011), Mapping crustal stress and strain in southwest British Columbia, J. Geophys. Res.,
116, B03314, doi:10.1029/2010JB008003.Barnes, P. M., B. M. de Lépinay, J.-Y. Collot, J. Delteil, and J.-C. Audru (1998), Strain partitioning in the transition area between oblique
subduction and continental collision, Hikurangi margin, New Zealand, Tectonics, 17(4), 534–557, doi:10.1029/98TC00974.Barton, C. A., M. D. Zoback, and D. Moos (1995), Fluid flow along potentially active faults in crystalline rock, Geology, 23(8), 683–686,
doi:10.1130/0091-7613(1995)023<0683:ffapaf>2.3.co;2.Beavan, J., and J. Haines (2001), Contemporary horizontal velocity and strain rate fields of the Pacific-Australian plate boundary zone through
New Zealand, J. Geophys. Res., 106(B1), 741–770, doi:10.1029/2000JB900302.Beavan, J., P. Tregoning, M. Bevis, T. Kato, and C. Meertens (2002), Motion and rigidity of the Pacific Plate and implications for plate boundary
deformation, J. Geophys. Res., 107(B10), 2261, doi:10.1029/2001JB000282.Bell, J. S. (1990), Investigating stress regimes in sedimentary basins using information from oil industry wireline logs and drilling records,
Geol. Soc. London Spec. Pub., 48(1), 305–325, doi:10.1144/gsl.sp.1990.048.01.26.Bell, J. S. (1996a), Petro Geoscience 1. In situ stresses in sedimentary rocks (part 1): Measurement techniques, Geosci. Can., 23(2), 85–100.Bell, J. S. (1996b), Petro Geoscience 2. In situ stresses in sedimentary rocks (part 2): Applications of stressmeasurements,Geosci. Can., 23(3), 135–153.Bell, J. S., and D. I. Gough (1979), Northeast-southwest compressive stress in Alberta evidence from oil wells, Earth Planet. Sci. Lett., 45(2),
475–482, doi:10.1016/0012-821X(79)90146-8.Bird, P. (2003), An updated digital model of plate boundaries, Geochem. Geophys. Geosyst., 4(3), 1027, doi:10.1029/2001GC000252.Bott, M. H. P. (1959), The mechanics of oblique slip faulting, Geol. Mag., 96(2), 109–117.Byerlee, J. (1978), Friction of rocks, Pure Appl. Geophys., 116(4-5), 615–626, doi:10.1007/BF00876528.Camac, B., S. P. Hunt, C. E. Gilbert, and D. P. Anthony (2005), Using 3D distinct element method to predict stress distribution – Kupe Field,
Taranaki Basin, New Zealand, in 67th EAGE Conference & Exhibition, 5 pp., Madrid, Spain.
Journal of Geophysical Research: Solid Earth 10.1002/2016JB013178
RAJABI ET AL. STRESS MAP OF TARANAKI BASIN 6067
AcknowledgmentsThe authors gratefully thank the NewZealand Petroleum & Minerals, Ministryof Business, Innovation & Employment(http://www.nzpam.govt.nz) forproviding the raw data of this study.This research forms part of ARCDiscovery Project DP120103849 andASEG Research Foundation ProjectRF13P02. The authors also would like tothank the Ikon Science in Adelaide(formerly JRS Petroleum Research) forthe use of their JRS suite. M. Giba isthanked for providing the fault data inthe Taranaki Basin. We also speciallythank Martha Savage, John Townend,and an anonymous reviewer of thisarticle for their constructive comments.
247

Cavill, A. W., J. Cassidy, and B. J. Brennan (1997), Results from the new seismic monitoring network at Egmont Volcano, New Zealand:Tectonic and hazard implications, New Zeal. J. Geol. Geop., 40(1), 69–76, doi:10.1080/00288306.1997.9514741.
Célérier, B. (2010), Remarks on the relationship between the tectonic regime, the rake of the slip vectors, the dip of the nodal planes, and theplunges of the P, B, and T axes of earthquake focal mechanisms, Tectonophysics, 482(1–4), 42–49, doi:10.1016/j.tecto.2009.03.006.
Coblentz, D. D., and R. M. Richardson (1995), Statistical trends in the intraplate stress field, J. Geophys. Res., 100(B10), 20,245–20,255,doi:10.1029/95JB02160.
Coblentz, D. D., S. Zhou, R. R. Hillis, R. M. Richardson, and M. Sandiford (1998), Topography, boundary forces, and the Indo-Australianintraplate stress field, J. Geophys. Res., 103(B1), 919–931, doi:10.1029/97JB02381.
Davis, J. C. (2002), Statistics and Data Analysis in Geology, 3rd ed., pp. 656, Wiley, New York.DeMets, C., R. G. Gordon, and D. F. Argus (2010), Geologically current plate motions, Geophys. J. Int., 181(1), 1–80, doi:10.1111/
j.1365-246X.2009.04491.x.Doutsos, T., and S. Kokkalas (2001), Stress and deformation patterns in the Aegean region, J. Struct. Geol., 23(2–3), 455–472, doi:10.1016/
S0191-8141(00)00119-X.Engelder, T. (1993), Stress Regimes in the Lithosphere, Princeton Univ. Press, New Jersey.Gephart, J. W., and D. W. Forsyth (1984), An improved method for determining the regional stress tensor using earthquake focal mechanism
data: Application to the San Fernando Earthquake Sequence, J. Geophys. Res., 89(B11), 9305–9320, doi:10.1029/JB089iB11p09305.Giba, M., A. Nicol, and J. J. Walsh (2010), Evolution of faulting and volcanism in a back-arc basin and its implications for subduction processes,
Tectonics, 29, TC4020, doi:10.1029/2009TC002634.Giba, M., J. J. Walsh, A. Nicol, V. Mouslopoulou, and H. Seebeck (2013), Investigation of the spatio-temporal relationship between normal
faulting and arc volcanism on million-year time scales, J. Geol. Soc., 170(6), 951–962, doi:10.1144/jgs2012-121.GeoMechanics International Inc. (GMI) (2010), Te Kiri prospect geomechanical analysis, PEP 51149, Ministry of Economic Development New
Zealand Unpublished Petroleum Report PR4278, 127.Green, D., K. Seanard, and A. N. Martin (2006), Hydraulic fracturing of Miocene and Oligocene sandstones in the Taranaki Basin, New Zealand,
in SPE Asia Pacific Oil & Gas Conference and Exhibition, edited, Society of Petroleum Engineers, Adelaide, Australia, doi:10.2118/101121-MS.Hansen, K. M., and V. S. Mount (1990), Smoothing and extrapolation of crustal stress orientation measurements, J. Geophys. Res., 95(B2),
1155–1165, doi:10.1029/JB095iB02p01155.Heffer, K. J., R. J. Fox, C. A. McGill, and N. C. Koutsabeloulis (1997), Novel techniques show links between reservoir flow directionality, Earth
stress, fault structure and geomechanical changes in mature waterfloods, SPE J., 2(02), 91–98, doi:10.2118/30711-PA.Heidbach, O., M. Tingay, A. Barth, J. Reinecker, D. Kurfeß, and B. Müller (2008), The World Stress Map database release 2008,
doi:10.1594/GFZ.WSM.Rel2008.Heidbach, O., M. Tingay, A. Barth, J. Reinecker, D. Kurfeß, and B. Müller (2010), Global crustal stress pattern based on the World Stress Map
database release 2008, Tectonophysics, 482(1–4), 3–15, doi:10.1016/j.tecto.2009.07.023.Hill, K. C., N. Hoffman, G. Channon, S. Courteney, R. D. Kendrick, and J. T. Keetlei (2004), Structural styles and hydrocarbon traps in the onshore
Taranaki Fold Belt, New Zealand, paper presented at PESA’s Eastern Australasian Basin Symposium II, Petroleum Exploration Society ofAustralia, Adelaide, Australia, 19-22 September.
Hillis, R. R., and S. D. Reynolds (2000), The Australian stress map, J. Geol. Soc., 157(5), 915–921, doi:10.1144/jgs.157.5.915.Holt, W. E., and T. A. Stern (1994), Subduction, platform subsidence, and foreland thrust loading: The late Tertiary development of Taranaki
Basin, New Zealand, Tectonics, 13(5), 1068–1092, doi:10.1029/94TC00454.Jaeger, J. C., N. G. W. Cook, and R. Zimmerman (2007), Fundamentals of Rock Mechanics, 4th ed., Wiley-Blackwell, Oxford.King, P. R., and G. P. Thrasher (1996), Cretaceous-Cenozoic geology and petroleum systems of the Taranaki Basin, New Zealand, Institute of
Geological and Nuclear Sciences monograph 13, 243 p, 246 enclosures, Lower Hutt, New Zealand: Institute of Geological & Nuclear SciencesLimited.
Lallemand, S., A. Heuret, and D. Boutelier (2005), On the relationships between slab dip, back-arc stress, upper plate absolute motion, andcrustal nature in subduction zones, Geochem. Geophys. Geosyst., 6, Q09006, doi:10.1029/2005GC000917.
Lamarche, G., J.-N. Proust, and S. D. Nodder (2005), Long-term slip rates and fault interactions under low contractional strain, WanganuiBasin, New Zealand, Tectonics, 24, TC4004, doi:10.1029/2004TC001699.
Leitner, B., D. Eberhart-Phillips, H. Anderson, and J. L. Nabelek (2001), A focused look at the Alpine fault, New Zealand: Seismicity, focalmechanisms, and stress observations, J. Geophys. Res., 106(B2), 2193–2220, doi:10.1029/2000JB900303.
Litchfield, N. J., et al. (2013), A model of active faulting in New Zealand, New Zeal. J. Geol. Geop., 57(1), 32–56, doi:10.1080/00288306.2013.854256.
Lithgow-Bertelloni, C., and J. H. Guynn (2004), Origin of the lithospheric stress field, J. Geophys. Res., 109(B1), B01408, doi:10.1029/2003JB002467.Lund, B., and J. Townend (2007), Calculating horizontal stress orientations with full or partial knowledge of the tectonic stress tensor,
Geophys. J. Int., 170(3), 1328–1335, doi:10.1111/j.1365-246X.2007.03468.x.Mardia, K. V. (1972), Statistics of Directional Data/K.V. Mardia, Academic Press, London.Maxwell, S. C., U. Zimmer, R. W. Gusek, and D. J. Quirk (2009), Evidence of a horizontal hydraulic fracture from stress rotations across a thrust
fault, SPE Prod. Oper., 24(2), 312–319, doi:10.2118/110696-PA.McKenzie, D. P. (1969), The relation between fault plane solutions for earthquakes and the directions of the principal stresses, B. Seismol. Soc.
Am., 59(2), 591–601.McNamara, D. D., C. Massiot, B. Lewis, and I. C. Wallis (2015), Heterogeneity of structure and stress in the Rotokawa Geothermal Field, New
Zealand, J. Geophys. Res.: Solid Earth, 120, 1243–1262, doi:10.1002/2014JB011480.Meijer, P. T., and M. J. R. Wortel (1997), Present-day dynamics of the Aegean region: A model analysis of the horizontal pattern of stress and
deformation, Tectonics, 16(6), 879–895, doi:10.1029/97TC02004.Michael, A. J. (1984), Determination of stress from slip data: Faults and folds, J. Geophys. Res., 89(B13), 11,517–11,526, doi:10.1029/
JB089iB13p11517.Mildren, S. (2009), Mangatoa wellbore stability and fracture susceptibility assessment, Ministry of Business, Innovation & Employment (MBIE),
New Zealand Unpublished Petroleum Report PR4011, 68.Mildren, S., and J. Meyer (2006), Moana prospect cross-fault pressure difference analysis. Northern Taranaki Graben, New Zealand,Ministry of
Economic Development New Zealand Unpublished Petroleum Report PR3647, 14.Mildren, S., J. Meyer, and R. Hillis (2001), Pohokura ERD wellbore stability study, Ministry of Economic Development New Zealand Unpublished
Petroleum Reports PR2651, 70.Muir, R. J., J. D. Bradshaw, S. D. Weaver, and M. G. Laird (2000), The influence of basement structure on the evolution of the Taranaki Basin,
New Zealand, J. Geol. Soc., 157(6), 1179–1185, doi:10.1144/jgs.157.6.1179.
Journal of Geophysical Research: Solid Earth 10.1002/2016JB013178
RAJABI ET AL. STRESS MAP OF TARANAKI BASIN 6068
248

Müller, B., V. Wehrle, S. Hettel, B. Sperner, and K. Fuchs (2003), A newmethod for smoothing orientated data and its application to stress data,Geol. Soc. London, Spec. Pub., 209(1), 107–126, doi:10.1144/gsl.sp.2003.209.01.11.
Nairn, I. A., and J. W. Cole (1981), Basalt dikes in the 1886 Tarawera Rift, New Zeal J Geol Geop, 24(5-6), 585–592, doi:10.1080/00288306.1981.10421534.
Neall, V. E., R. B. Stewart, and I. E. M. Smith (1986), History and petrology of the Taranaki Volcanoes. Late Cenozoic volcanism in New Zealand,R. Soc. N. Z. Bull., 23, 251–264.
Nicol, A., and J. Beavan (2003), Shortening of an overriding plate and its implications for slip on a subduction thrust, central Hikurangi Margin,New Zealand, Tectonics, 22(6), 1070, doi:10.1029/2003TC001521.
Nicol, A., C. Mazengarb, F. Chanier, G. Rait, C. Uruski, and L. Wallace (2007), Tectonic evolution of the active Hikurangi subduction margin,New Zealand, since the Oligocene, Tectonics, 26, TC4002, doi:10.1029/2006TC002090.
Nicol, A., V. Stagpoole, and G. Maslen (2004), Structure and petroleum potential of the Taranaki fault play, in 2004 New Zealand PetroleumConference, edited, p., Wellington, Crown Minerals, Ministry of Economic Development, pp. 9.
Nicol, A., and L. M. Wallace (2007), Temporal stability of deformation rates: Comparison of geological and geodetic observations, Hikurangisubduction margin, New Zealand, Earth Planet. Sci. Lett., 258(3–4), 397–413, doi:10.1016/j.epsl.2007.03.039.
Nicol, A., J. Walsh, K. Berryman, and S. Nodder (2005), Growth of a normal fault by the accumulation of slip over millions of years, J. Struct.Geol., 27(2), 327–342.
Palmer, J., and G. Bulte (1991), Taranaki Basin, New Zealand, in Active Margin Basins—AAPG Memoir, edited by K. Biddle, pp. 262–282,AAPG, Tulsa, Okla.
Pierdominici, S., and O. Heidbach (2012), Stress field of Italy—Mean stress orientation at different depths and wave-length of the stresspattern, Tectonophysics, 532–535(0), 301–311, doi:10.1016/j.tecto.2012.02.018.
Plumb, R. A., and S. H. Hickman (1985), Stress-induced borehole elongation: A comparison between the four-arm dipmeter and the boreholeteleviewer in the Auburn Geothermal Well, J. Geophys. Res., 90(B7), 5513–5521, doi:10.1029/JB090iB07p05513.
Rajabi, M., S. Sherkati, B. Bohloli, and M. Tingay (2010), Subsurface fracture analysis and determination of in-situ stress direction using FMIlogs: An example from the Santonian carbonates (Ilam Formation) in the Abadan Plain, Iran, Tectonophysics, 492(1–4), 192–200,doi:10.1016/j.tecto.2010.06.014.
Rajabi, M., M. Tingay, and O. Heidbach (2014), The present-day stress pattern in the Middle East and Northern Africa and their importance:The World Stress Map database contains the lowest wellbore information in these petroliferous areas, in International PetroleumTechnology Conference, edited, International Petroleum Technology Conference, Doha, Qatar, doi:10.2523/IPTC-17663-MS.
Rajabi, M., M. Tingay, and O. Heidbach (2016a), The present-day stress field of New South Wales, Australia, Aust. J. Earth Sci., 63(1), 1–21,doi:10.1080/08120099.2016.1135821.
Rajabi, M., M. Tingay, R. King, and O. Heidbach (2016b), Present-day stress orientation in the Clarence-Moreton Basin of New South Wales,Australia: A new high density dataset reveals local stress rotations, Basin Res., doi:10.1111/bre.12175.
Raleigh, C. B., J. H. Healy, and J. D. Bredehoeft (1972), Faulting and crustal stress at Rangely, Colorado, in Flow and Fracture of Rocks, edited byH. C. Heard et al., pp. 275–284, U.S. Geological Survey, Washington, D. C., doi:10.1029/GM016p0275.
Reilly, C., A. Nicol, J. J. Walsh, and H. Seebeck (2015), Evolution of faulting and plate boundary deformation in the southern Taranaki Basin,New Zealand, Tectonophysics, 651–652(0), 1–18, doi:10.1016/j.tecto.2015.02.009.
Reinecker, J., M. Tingay, and B. Müller (2003), Borehole breakout analysis from four-arm caliper logs. [Available at http://dc-app3-14.gfz-potsdam.de/pub/guidelines/WSM_analysis_guideline_breakout_caliper.pdf.]
Reiter, K., O. Heidbach, D. Schmitt, K. Haug, M. Ziegler, and I. Moeck (2014), A revised crustal stress orientation database for Canada,Tectonophysics, 636, 111–124, doi:10.1016/j.tecto.2014.08.006.
Reyners, M. (1980), A microearthquake study of the plate boundary, North Island, New Zealand, Geophys. J. Roy. Ast.r S., 63(1), 1–22,doi:10.1111/j.1365-246X.1980.tb02607.x.
Reyners, M. (2010), Stress and strain from earthquakes at the southern termination of the Taupo Volcanic Zone, New Zealand, J. Volcanol.Geotherm. Res., 190(1–2), 82–88, doi:10.1016/j.jvolgeores.2009.02.016.
Richardson, R. M. (1992), Ridge forces, absolute plate motions, and the intraplate stress field, J. Geophys. Res., 97(B8), 11,739–11,748,doi:10.1029/91JB00475.
Robinson, R., I. M. Calhaem, and A. A. Thomson (1976), The Opunake, New Zealand, earthquake of 5 November 1974, N. Z. J. Geol. Geop., 19(3),335–345, doi:10.1080/00288306.1976.10423563.
Salazar, M., L. Moscardelli, and L. Wood (2015), Utilising clinoform architecture to understand the drivers of basin margin evolution: A casestudy in the Taranaki Basin, New Zealand, Basin Res., doi:10.1111/bre.12138.
Salmon, M., B. L. N. Kennett, T. Stern, and A. R. A. Aitken (2013), The Moho in Australia and New Zealand, Tectonophysics, 609(0), 288–298,doi:10.1016/j.tecto.2012.07.009.
Sbar, M. L., M. Barazangi, J. Dorman, C. H. Scholz, and R. B. Smith (1972), Tectonics of the Intermountain Seismic Belt, Western United States:Microearthquake seismicity and composite fault plane solutions, GSA Bull., 83(1), 13–28.
Sbar, M. L., and L. R. Sykes (1973), Contemporary compressive stress and seismicity in eastern North America: An example of intra-platetectonics, Geol. Soc. Am. Bull., 84(6), 1861–1882, doi:10.1130/0016-7606(1973)84<1861:ccsasi>2.0.co;2.
Seebeck, H., A. Nicol, M. Giba, J. Pettinga, and J. Walsh (2013), Geometry of the subducting Pacific plate since 20 Ma, Hikurangi margin, NewZealand, J. Geol. Soc., doi:10.1144/jgs2012-145.
Seebeck, H., A. Nicol, P. Villamor, J. Ristau, and J. Pettinga (2014), Structure and kinematics of the Taupo Rift, New Zealand, Tectonics, 33(6),1178–1199, doi:10.1002/2014TC003569.
Sherburn, S., and R. S. White (2005), Crustal seismicity in Taranaki, New Zealand using accurate hypocentres from a dense network, Geophys.J. Int., 162(2), 494–506, doi:10.1111/j.1365-246X.2005.02667.x.
Sherburn, S., and R. S. White (2006), Tectonics of the Taranaki region, New Zealand: Earthquake focal mechanisms and stress axes, N. Z. J.Geol. Geop., 49(2), 269–279, doi:10.1080/00288306.2006.9515165.
Sibson, R. H. (1985), Stopping of earthquake ruptures at dilational fault jogs, Nature, 316(6025), 248–251.Sibson, R. H. (1996), Structural permeability of fluid-driven fault-fracture meshes, J. Struct. Geol., 18(8), 1031–1042.Sibson, R. H., F. C. Ghisetti, and R. A. Crookbain (2012), Andersonian wrench faulting in a regional stress field during the 2010–2011
Canterbury, New Zealand, earthquake sequence, Geol. Soc. London Spec. Publ., 367(1), 7–18, doi:10.1144/sp367.2.Sperner, B., B. Müller, O. Heidbach, D. Delvaux, J. Reinecker, and K. Fuchs (2003), Tectonic stress in the Earth’s crust: Advances in the World
Stress Map project, Geol. Soc. London Spec. Publ., 212(1), 101–116, doi:10.1144/gsl.sp.2003.212.01.07.Spinks, K. D., V. Acocella, J. W. Cole, and K. N. Bassett (2005), Structural control of volcanism and caldera development in the transtensional
Taupo Volcanic Zone, New Zealand, J. Volcanol. Geotherm. Res., 144(1–4), 7–22, doi:10.1016/j.jvolgeores.2004.11.014.
Journal of Geophysical Research: Solid Earth 10.1002/2016JB013178
RAJABI ET AL. STRESS MAP OF TARANAKI BASIN 6069
249

Stagpoole, V., and R. Funnell (2001), Arc magmatism and hydrocarbon generation in the northern Taranaki Basin, New Zealand, Pet. Geosci.,7(3), 255–267, doi:10.1144/petgeo.7.3.255.
Stagpoole, V., R. Funnell, and A. Nicol (2004), Overview of the structure and associated petroleum prospectivity of the Taranaki fault, NewZealand, in PESA’s Eastern Australian Basins Symposium II, edited by P. J. Boult, D. R. Johns, and S. C. Lang, pp. 197–206, PetroleumExploration Society of Australia, Adelaide, South Australia.
Stern, T., G. Houseman, M. Salmon, and L. Evans (2013), Instability of a lithospheric step beneath western North Island, New Zealand, Geology,41(4), 423–426.
Stern, T. A., and F. J. Davey (1990), Deep seismic expression of a foreland basin: Taranaki basin, New Zealand, Geology, 18(10), 979–982,doi:10.1130/0091-7613(1990)018<0979:dseoaf>2.3.co;2.
Tingay, M., C. Morley, R. King, R. R. Hillis, D. D. Coblentz, and R. Hall (2010), Present-day stress field of Southeast Asia, Tectonophysics, 482(1–4),92–104, doi:10.1016/j.tecto.2009.06.019.
Tingay, M., B. Müller, J. Reinecker, O. Heidbach, F. Wenzel, and P. Fleckenstein (2005), Understanding tectonic stress in the oil patch: TheWorld Stress Map Project, Leading Edge, 24(12), 1276–1282, doi:10.1190/1.2149653.
Tingay, M. R. P., M. L. Rudolph, M. Manga, R. J. Davies, and C.-Y. Wang (2015), Initiation of the Lusi mudflow disaster, Nat. Geosci., 8(7), 493–494,doi:10.1038/ngeo2472.
Townend, J., S. Sherburn, R. Arnold, C. Boese, and L. Woods (2012), Three-dimensional variations in present-day tectonic stress along theAustralia–Pacific plate boundary in New Zealand, Earth Planet. Sci. Lett., 353–354(0), 47–59, doi:10.1016/j.epsl.2012.08.003.
Townsend, D., et al. (2010), Palaeoearthquake histories across a normal fault system in the southwest Taranaki Peninsula, New Zealand, N. Z.J. Geol. Geop., 53(4), 375–394, doi:10.1080/00288306.2010.526547.
Walcott, R. I. (1987), Geodetic strain and the deformation history of the North Island of New Zealand during the late Cainozoic, Philos. Trans. R.Soc. London Ser. A, 321, 163–181.
Wallace, L. M., J. Beavan, R. McCaffrey, and D. Darby (2004), Subduction zone coupling and tectonic block rotations in the North Island, NewZealand, J. Geophys. Res., 109, B12406, doi:10.1029/2004JB003241.
Wallace, L. M., S. Ellis, and P. Mann (2009), Collisional model for rapid fore-arc block rotations, arc curvature, and episodic back-arc rifting insubduction settings, Geochem. Geophys. Geosyst., 10, Q05001, doi:10.1029/2008GC002220.
Wang, K. (2000), Stress–strain ‘paradox’, plate coupling, and forearc seismicity at the Cascadia and Nankai subduction zones, Tectonophysics,319(4), 321–338, doi:10.1016/S0040-1951(99)00301-7.
Webb, T. H., and H. Anderson (1998), Focal mechanisms of large earthquakes in the North Island of New Zealand: Slip partitioning at anoblique active margin, Geophys. J. Int., 134(1), 40–86, doi:10.1046/j.1365-246x.1998.00531.x.
Webb, T. H., B. G. Ferris, and J. S. Harris (1986), The Lake Taupo, New Zealand, earthquake swarms of 1983, N. Z. J. Geol. Geop., 29(4), 377–389,doi:10.1080/00288306.1986.10422160.
Webster, M., S. O’Connor, B. Pindar, and R. Swarbrick (2011), Overpressures in the Taranaki Basin: Distribution, causes, and implications forexploration, AAPG Bull., 95(3), 339–370, doi:10.1306/06301009149.
Ziegler, M., M. Rajabi, O. Heidbach, G. P. Hersir, K. Ágústsson, S. Árnadóttir, and A. Zang (2016), The stress pattern of Iceland, Tectonophysics,674, 101–113, doi:10.1016/j.tecto.2016.02.008.
Zoback, M. D. (2007), Reservoir Geomechanics, pp. 464, Stanford University, California.Zoback, M. L. (1992), First- and second-order patterns of stress in the lithosphere: The World Stress Map Project, J. Geophys. Res., 97(B8),
11,703–11,728, doi:10.1029/92JB00132.Zoback, M. L., and M. D. Zoback (1980), Faulting patterns in north-central Nevada and strength of the crust, J. Geophys. Res., 85(B1), 275–284,
doi:10.1029/JB085iB01p00275.Zoback, M. L., et al. (1989), Global patterns of tectonic stress, Nature, 341(6240), 291–298.
Journal of Geophysical Research: Solid Earth 10.1002/2016JB013178
RAJABI ET AL. STRESS MAP OF TARANAKI BASIN 6070
250

4.2. Paper 8: Present-Day Stress Pattern of New Zealand
Rajabi, M., Tingay, M., Heidbach, O., Ziegler, M., in-prep. Present-day stress pattern of
New Zealand. in-preparation.
251

252

Present-day stress pattern of New Zealand
Mojtaba Rajabi1, Mark Tingay1, Oliver Heidbach2, Moritz Zeigler2, 3 1Australian School of Petroleum, University of Adelaide, Adelaide, SA 5005, Australia
2 Helmholtz Centre Potsdam, German Research Centre for Geosciences GFZ, Potsdam, Germany
3 University of Potsdam, Institute of Earth and Environmental Science, Potsdam-Golm, Germany
Abstract
The interaction of the Indo-Australian and Pacific plates at New Zealand provides an ideal location to investigate the contemporary stress field at both active subduction and continental collision plate boundaries. Prior to this study, the majority of stress information in New Zealand was confined to interpretation of focal mechanism solutions in deeper (>10 km) parts of the crust. However, hydrocarbon exploration in several sedimentary basins of New Zealand, including the Taranaki, East Coast and Canterbury Basins, provide an opportunity to evaluate the stress pattern in the upper five km of the crust in New Zealand. In this study we compiled extensive in-situ stress data from six established methods to investigate the stress pattern of New Zealand in the upper 40 km of the crust. Our compiled database comprises data records from interpretation of borehole breakouts and drilling-induced fractures in various part of New Zealand. This database comprises 183 data records from petroleum and geothermal wells, 332 well-constrained single-event focal mechanism solutions, 125 data records from formal inversion of focal mechanism solutions, nine data records from average focal mechanism solutions and three stress orientations from volcanic vent alignments. The regional stress pattern of New Zealand reveals a consistent ESE-WNW maximum horizontal stress (SHmax) orientation in much of the South Island. The SHmax orientation throughout the South Island is at a high angle to the strike of major active strike-slip faults (Alpine and Marlborough Faults), providing further evidence that major strike-slip plate boundaries are mechanically weak features. The SHmax pattern in the North Island is variable, and is affected by the active subduction of Pacific plate beneath the Indo-Australian Plate, but is observed to be consistent with normal and thrust faults in most part of this micro-continent.
Keywords: present-day tectonic stress, New Zealand, Australia-Pacific plate boundary
1. Introduction
Stress mapping is appropriate common approach to examine the crustal stress sources at different spatial scales, and to examine the dynamics of plate boundaries (Heidbach et al., 2010; Palano, 2015; Rajabi et al., 2016a; Sperner et al., 2003; Tingay et al., 2010; Zoback, 1992). The most large-scale stress mapping has been done to understand intra-plate stress pattern (Assumpção et al., 2016; Barth and Wenzel, 2010; Hillis and Reynolds, 2000, 2003; Rajabi et al., under-review). However, there are significant concerns about the applicability of stress mapping on plate boundaries, especially stress derived from single earthquake focal mechanism solutions (FMS). For example, it has been noted that the calculation of maximum horizontal stress (SHmax) orientations from single-event FMS near plate boundaries have a higher potential to be inaccurate, especially near strike-slip plate boundaries such as seen throughout the South Island of New Zealand (Heidbach et al., 2010). Such data points are classified as ‘plate boundary events’ in the World Stress Map project (WSM) and there is still debate
253

about their reliability and whether they should be used in stress studies (Heidbach et al., 2010). Therefore, analysis of SHmax orientation from different methods and comparison with SHmax derived from FMS providing a possible way to assess the reliability of FMS data near plate boundaries.
New Zealand has a complex tectonic setting and it is located at the border of Indo-Australian and Pacific plates where two subduction zones in north and south are linked by the Alpine fault (King, 2000). The present-day stress state of New Zealand is poorly represented, with the 2008 release of the WSM project containing only 58 data records for the entire micro-continent (Heidbach et al., 2008, 2010). The bulk of this sparse dataset is from deep (> 10 km) single-event FMSs, which might not represent the crustal stress pattern at shallower depth intervals and also may potentially reflect spurious stress orientations, termed plate boundary events as outlined above (Heidbach et al., 2010). Townend et al. (2012) undertook extensive formal inversion of focal mechanism solutions in 100 locations in central New Zealand and suggested a uniform ESE-WNW orientation for SHmax in New Zealand’s South Island. In addition, Townend et al. (2012) suggested that the SHmax orientation in the Hawke’s Bay (eastern North Island) is sub-parallel to the subducted slab. However, almost 60% of stress data compiled by Townend et al. (2012) is from deeper than 41 km and may not reliably represent the crustal stress pattern of New Zealand, especially given that the Moho depth in the North Island and northern half of the South Island is less than 40 km (Salmon et al., 2013). Along with these studies, numerous attempts have been carried out to infer the stress pattern in New Zealand using analysis of earthquake focal mechanism solutions (Balfour et al., 2005; Holt et al., 2013; Sherburn and White, 2006; Webb and Anderson, 1998).
Formal stress inversion from several earthquake focal mechanism solutions, which have been used by Townend et al. (2012), generally provide reliable information on the crustal stress pattern, however, in-situ stress is not necessarily consistent with depth due to presence of various geological structures (Heidbach et al., 2007; Rajabi et al., 2016a; Rajabi et al., 2016b; Tingay et al., 2011). Hence, it is important to examine stress orientations determined from other methods in order to more reliably assess the stress field in New Zealand. There are several methods to estimate in-situ stress in different depth ranges of the crust including near surface geological indicators, shallow depth (< 1km) civil engineering and mining measurements and intermediate depth (< 5 km) wellbore stress indicators (Amadei and Stephansson, 1997; Engelder, 1993). These different methods along with deep earthquake information (> 5 km) can be quality ranked with the WSM ranking criteria in order to investigate the stress pattern in different depth intervals (Heidbach et al., 2010; Sperner et al., 2003; Zoback, 1992). Furthermore, these shallow stress measurement (< 5 km) methods are not susceptible to the same potential errors as single-event FMS derived SHmax orientations, and thus can be used to better assess the reliability of earthquake-derived stress data near plate boundaries. In this study we compiled 652 data records from various sources to present the most comprehensive and quality ranked stress map of New Zealand. In this paper we first explain the tectonic setting of New Zealand and present our stress database. We then explain the regional stress pattern of New Zealand in nine stress provinces and present the smoothed stress map of this tectonically active region. We also explain the controls on the New Zealand stress pattern and, finally, we compare stress state inferred from our database and active faults to investigate their relationship in New Zealand.
2. Tectonic setting of New Zealand
The tectonics of New Zealand has been mainly shaped by the complex interaction of the Indo-Australian and Pacific plates (Bird, 2003; King, 2000; Lamb, 2015; Liu and Bird, 2002; Wallace et
254

al., 2009b). The geology of North Island is mainly controlled by the westward motion of the Pacific Plate, at a rate of 41-48 mm/yr., which is subducted beneath the Indo-Australian Plate (IAP) along the Hikurangi margin (Figure 1) (Wallace et al., 2009a; Wallace et al., 2009b). This oblique subduction has produced several key characteristics throughout the overriding plate. In the most eastern part of the IAP, the margin-normal component of this oblique convergence is accommodated by thrust faults, while the margin parallel component is accommodated by strike-slip faults in the forearc. The intra-arc region in characterised by active rifting and volcanism through the Taupo volcanic zone (Seebeck et al., 2014), while back-arc spreading has generated normal faults in the central western North Island (Nicol and Wallace, 2007; Townend et al., 2012; Wallace et al., 2004). The Eastern Mobile Belt of the Taranaki Basin, in the westernmost portion of the North Island, marks the western limit of neotectonic deformation related to this subduction (Giba et al., 2010; King and Thrasher, 1996).
This oblique subduction zone in the North Island transitions to oblique transpression in the north of the South Island, where the deformation is accommodated by Marlborough strike-slip fault system (Figure 1) (Balfour et al., 2005; Townend et al., 2012; Wallace et al., 2012), and then transitions to oblique continent-continent collision throughout most of the South Island, with deformation centred along the 500km long Alpine Fault (Figure 1) (Norris and Toy, 2014; Sutherland et al., 2013; Sutherland et al., 2012). South of New Zealand, the plate boundary again transitions to subduction, but with the oceanic crust of the Indo-Australian plate being subducted below the oceanic crust of the Pacific plate along the Puysegur Margin at rates of 30-35mm/yr. (Anderson et al., 1993; Clark et al., 2011; Townend et al., 2012; Walcott, 1987). Figure 1 illustrates the tectonic setting of New Zealand, where the micro-continent is trapped in a ‘subduction sandwich’.
3. Methods for estimation of the present-day SHmax
The crustal stress tensor is commonly described using four components (Figure 2), namely the orientation of SHmax, magnitude of vertical stress (Sv) and the magnitude of the two horizontal principal stresses (maximum and minimum; SHmax and Shmin respectively) (Engelder, 1993; Zoback, 2010). In this study, we investigate the stress pattern of New Zealand by compiling stress information from six well-known methods, namely single-event focal mechanism solutions of earthquakes (FMS), formal stress inversion from several earthquake focal mechanism solutions (FMF), average focal mechanism solutions (FMA), wellbore breakouts, drilling-induce fractures (DIF) and volcanic vent alignments (GVA). The primary aim of this study is to determine the orientation of SHmax; however, the majority of the data are from earthquake focal mechanism solutions and, hence, also enabled us to assign a tectonic stress regime in much of the data. In this study we use the Andersonian classification (Anderson, 1905) to classify the stress regimes into reverse (SHmax > Shmin > Sv), strike-slip (SHmax > Sv > Shmin) and normal (Sv > SHmax > Shmin) faulting stress regimes. The estimation of SHmax using seismological and wellbore indicators is described below. In this study, all the SHmax orientations are classified according to the WSM quality ranking criteria from A to E quality (Heidbach et al., 2010; Sperner et al., 2003; Zoback, 1992).
3.1. Stress derivations from seismological methods
Earthquake focal mechanism solutions are the most common source of stress information in the earth’s lithosphere (Heidbach et al., 2010; McKenzie, 1969; Raleigh et al., 1972; Zoback, 1992). Generally these sources of information can be interpreted by three methods to estimate the stress state.
255

The main difference in these methods is their reliability, in which the most reliable information is always obtained from the FMF method (Heidbach et al., 2010; Zoback, 1992) that use several events in a closed geographical region to derive present-day stress. In the FMF method, the stress state is estimated by minimising the difference between the maximum shear stress and slip direction of earthquakes (Angelier, 1984; Bott, 1959; Gephart and Forsyth, 1984; Michael, 1984). In the WSM ranking system, the FMF method receives A- and B-quality if at least 15 and eight events are used for the stress inversion respectively (Heidbach et al., 2010).
The FMS method uses the P-, B- and T-axes orientation of single earthquake events as a proxy for the stress orientation (McKenzie, 1969). However, the orientation of these axes might not be equal to the principal stress orientation and, hence, this method at best situations (well-constrained M > 2.5 event that is recorded at least 20 by stations) receive C-quality according to the WSM ranking system (Heidbach et al., 2010; Zoback, 1992). The stress state can also be determined from FMA method using composite (Sbar et al., 1972) or average (Leitner et al., 2001; Webb et al., 1986; Zoback and Zoback, 1980) of P-, B-, and T- axes for several earthquakes. This method is less reliable, in comparison to FMF and FMS and, usually receive a D-quality in the WSM ranking scheme (Heidbach et al., 2010).
3.2. Wellbore methods for estimation of the SHmax orientation
Interpretation of wellbore breakouts and drilling induced fractures (DIF) in borehole image and oriented-caliper logs are considered as the most reliable sources of SHmax information the upper five kilometres of the earth’s crust (Amadei and Stephansson, 1997; Bell, 1996; Zoback, 2010). Breakouts occur when the hoop stress on the borehole wall exceeds compressive rock strength and, hence, is oriented to the azimuth of Shmin (Bell and Gough, 1979). The formation of breakouts causes an oval shape for the wellbore and can be interpreted using wellbore image and oriented-caliper logs (Figure 2). DIFs forms when the concentrated stress on the borehole wall is less than tensile rock strength (Aadnoy, 1990a, b; Bell, 1996). These features are opened against the minimum principal stress (parallel to the SHmax) and can be interpreted by borehole image logs (Figure 2). Note that these features need to be interpreted in vertical wells for reliable determination of SHmax orientation; however, if the wellbore deviation is more than 10° (for caliper logs) or 20° (for image logs) additional transformation is required for the accurate estimation of SHmax orientation (Mastin, 1988; Peška and Zoback, 1995).
4. Results and Discussions4.1. The New Zealand stress map database
In this study we compiled 652 quality-ranked data records across New Zealand to map the present-day stress pattern of this tectonically active region. We particularly focused on the interpretation of breakouts and DIFs in petroleum wells in the Taranaki (western North Island), East Coast (eastern North Island) and Canterbury (eastern South Island) Basins, as well as the Ohai Coalfield (southern South Island). This wellbore data was then combined with four additional wellbore stress data points (McNamara et al., 2015; Sibson et al., 2012). In total, the New Zealand stress map database has 183 (A-E) quality data records from wellbores, which is a significant increase in comparison to only one E-quality data point in the 2008 release of the WSM project (Heidbach et al., 2008, 2010).
256

We also complied 332 (A-E quality) well-constrained FMS data records from Geofon (GEOFON Data Centre, 1993), the global CMT catalogue (Ekström et al., 2012) and published literature (Anderson et al., 1993; Doser et al., 1999; Heidbach et al., 2008; Leitner et al., 2001; Sherburn and White, 2006; Webb and Anderson, 1998). FMF method comprises 125 (A-E) records in our database, which are from published literature and reassessed based on the WSM quality ranking system (Balfour et al., 2005; Boese et al., 2012; Holt et al., 2013; Leitner et al., 2001; Reyners et al., 2002; Sherburn and White, 2006; Townend et al., 2012). We also found nine (A-E quality) FMA data records based on Webb et al. (1986), Leitner et al. (2001) and Reyners (2010) and ranked them accordingly. In addition, three volcanic vent alignment data records were included in the database, as inferred from Nairn and Cole (1981) according to Sperner et al. (2003) ranking criteria. Figure 3 shows the stress map of New Zealand with 652 data records in the upper 40 kilometres of the crust. The majority of the data records (395) were assigned a tectonic stress regime (Figure 3) according to the Andersonian classification (Anderson, 1905). The details of the database can be found in Table 1 and digital supplementary information.
4.2. Regional pattern of New Zealand and their controls
In order to define the regional stress pattern of New Zealand, two statistical approaches, namely ‘stress province using Ryleigh test’ (Hillis and Reynolds, 2000; Tingay et al., 2010) and ‘search-radii wavelength’ were used (Heidbach et al., 2010; Müller et al., 2003). The concept of stress provinces in this study is similar to Tingay et al. (2010) in which there should be at least four A-D quality SHmax data records in a proximate geographical, and geologically consistent, region to define a stress province. All the data records in each province are weighted based on their reliability, such that A-, B-, C- and D-quality data receive a weight of ‘four’, ‘three’, ‘two’ and ‘one’, respectively. Circular statistical parameters (Davis, 2002; Mardia, 1972), including the mean SHmax orientation, standard deviation (s.d.) and the length of resultant vector (R-value), are calculated for each province (Davis, 2002; Hillis and Reynolds, 2000; Mardia, 1972). Finally, the R-value and the number of data records in each province is compared with cut-off values of Mardia (1972) in order to evaluate the reliability of mean SHmax in each province (i.e. Rayleigh test). In this study we defined nine stress provinces across New Zealand (Figure 4, Table 2). These stress provinces are assigned with a tectonic stress regime if at least 80% data records in each province have similar tectonic stress regime (Figure 4). The analysis of stress provinces across the North Island reveal some major trends, including a NE-SW SHmax orientation in three North Island provinces (Taupo Volcanic Zone, Northeast of North Island, and East Coast-2), a ENE-WSW SHmax in the Taranaki region and a ESE-WNW SHmax in the East Coast-1 province (Rajabi et al., 2016c).
As outlined above, the tectonic setting and deformation of the North Island is controlled by the oblique subduction along the Hikurangi Margin. The majority of our stress data in the East Coast-1 province exhibits a thrust faulting stress regime with a trench-perpendicular SHmax orientation, and which is likely to be accommodating the normal component of the oblique subduction. Further west and in the East-Coast-2 province, we observe nine NE-SW SHmax orientations (with normal stress regime), similar to Taupo Volcanic Zone that show trench-parallel SHmax orientation. The stress pattern in the East Coast-1 province is somehow different from Townend et al. (2012), where they suggested a trench-parallel SHmax orientation inferred from three ENE-WSW strike-slip in the southern Hawke’s Bay (latitude -40°). Our stress data compilation in the East-Coast stress province is inferred from 10 FMS stress indicators as well as three reliable wellbore measurements. In addition, this pattern of SHmax orientation (trench-perpendicular at the subduction front and trench-parallel in
257

the back-arc region) is also observed in other major subduction zones, such as Cascadia (Balfour et al., 2011; Wang, 2000) and Hellenic Arc (Doutsos and Kokkalas, 2001; Meijer and Wortel, 1997). Hence, the stress pattern of the North Island is interpreted to be directly linked to, and controlled by, forces exerted by the subduction process.
The SHmax pattern in much of the South Island is uniform in terms of orientation and stress regime, with the Marlborough, Christchurch and Alpine stress provinces all displaying a ESE-WNW average SHmax orientation Figure 4 and Table 2). This SHmax orientation is similar to that described in prior stress analyses by Balfour et al. (2005), Townend et al. (2012), Sibson et al. (2012) and Holt et al. (2013). This SHmax orientation is sub-parallel to absolute plate motion inferred from the hotspot-3 model (Gripp and Gordon, 2002), and is interpreted as a first-order stress pattern (Townend et al., 2012). Further south, and in the Pusegur margin, there is an E-W SHmax orientation with a prevailing thrust faulting stress regime, which is consistent with the dynamics of this subduction zone (Figure 4).
The second statistical approach, i.e. ‘search-radii’ method (Heidbach et al., 2010) aims to calculate the mean SHmax orientation and its standard deviation on a regular grid. The results of this algorithm are plotted based on the wavelength of the SHmax orientation, meaning that long wavelength pattern shows consistent SHmax orientation over a large area, while short wavelength indicates a locally variable stress pattern (Heidbach et al., 2010). In this study, we calculated the ‘search-radii’ algorithm on a 0.5° grid map that is defined over New Zealand (Figure 4). The algorithm starts with a radius of 1000 km to find at least 4 data records that have standard deviation < 25°. This radius decreases by 50 km, in each step, to find our criteria (minimum four data records with s.d. < 25°). The smoothed stress map of New Zealand (Figure 4) clearly shows a long wavelength stress pattern (consistent SHmax orientation) in much of the South Island, but short wavelength SHmax patterns throughout the North Island that are similar in orientation to the earlier defined stress provinces (Figure 4).
4.3. Comparison between the present-day stress and active faults
High tectonic activity across New Zealand has resulted in a rich active faults database (Langridge et al., 2016). In this paper we have compared the present-day stress field of New Zealand with the active fault database of Langridge et al. (2016), which contains those faults that have deformed the ground surface in the last 125,000 years. The comparison between active faults and our stress database is shown in Figure 5. Generally, the SHmax orientation is consistent with the pattern of normal and thrust faults observed throughout most of New Zealand. For example, there is a good agreement between SHmax pattern and the active faults in the Taranaki (Rajabi et al., 2016c). Further east, and in the Taupo Volcanic Zone, the present-day stress pattern is consistent with the active normal faults of the region (Figure 2). NE-SW thrust faults in the eastern portion of the North Island, and the southeastern and northwestern parts of the South Island, are consistent with ESE-WNW SHmax pattern in these regions (Figure 5). However, there are significant inconsistencies between SHmax orientation and the trend of major strike-slip faults in New Zealand, including in the southeastern parts of the North Island, as well as in the Alpine fault and Marlborough regions (in the South Island). The strike-slip faults in these regions have strikes that are at a high angle (~60°) to the SHmax orientation, and are inconsistent with classic Andersonian faulting (Anderson, 1905). Such a large angle between SHmax and fault strike has been seen on other major plate boundary strike-slip faults, such as the San Andreas Fault (Hickman and Zoback, 2004; Townend and Zoback, 2004) and Great Sumatran Fault (Mount and Suppe, 1992), and has often been considered to indicate that these faults must be weak (Balfour et al., 2005; Hickman and Zoback, 2004; Townend et al., 2012; Townend and Zoback, 2004). Whilst it is
258

possible for faulting to occur in non-optimally oriented stress states, it is often hypothesized that this will only happen on such major features if they have an extremely low coefficient of friction, such as <0.2, which is well below the 0.6-1.0 normal range of rock coefficient of friction found by Byerlee (1978). It is also possible that such faults are able to be active under non-optimally aligned stress states due to the presence of extremely high fluid pressures (overpressures) (Sibson, 1990). To date, no conclusive evidence for either high pore fluid pressures or regionally extensive low mechanical coefficients of friction have been observed in attempts to drill into the San Andreas Fault or Alpine Fault (Balfour et al., 2005; Fulton et al., 2004; Hickman and Zoback, 2004; Lachenbruch and Sass, 1992; Townend and Zoback, 2004) However, the stress data compiled herein provides further strong confirmation that present-day stresses in the South Island of New Zealand oriented at a high angle to the strike of major strike-slip faults, and support the hypothesis that “plate-bounding strike-slip faults are frictionally weak” (Balfour et al., 2005; Hickman and Zoback, 2004; Townend et al., 2012; Townend and Zoback, 2004).
5. Conclusions
We have compiled the first comprehensive stress map of New Zealand, with 652 quality-ranked data records, determined from six well-known methods. We defined nine stress provinces, assigned with a predominant stress regime, across New Zealand. The regional stress pattern of the North Island is primarily controlled by the subduction of the Pacific Plate along the Hikurangi margin. There are two regional patterns for the SHmax orientation in the North Island, one normal and another perpendicular to the trench, which highlights the role of the subducting slab in controlling the stress pattern in the overriding plate. The analysis of four stress provinces in the South Island showed a consistent stress pattern with a strike-slip stress regime (except along the Pusegur subduction zone), which is subparallel to the absolute plate motion. The comparison of stress pattern and active faults show a good consistency between SHmax and the trend of normal and thrust faults in different parts across New Zealand. However, there are significant inconsistences between stress and fault orientation for major strike-slip faults, with the present-day SHmax commonly at a high angle (~60°) to the strike of the major Alpine and Marlborough faults. The high angle between SHmax and major strike-slip faults is consistent with that seen on other major strike-slip plate boundary faults, and further supports the hypothesis that these faults are mechanically weak.
Acknowledgments
The authors gratefully thank the ‘New Zealand Petroleum & Minerals, Ministry of Business, Innovation & Employment (http://www.nzpam.govt.nz)’ for providing the raw wellbore data used in this study. This research forms part of ARC Discovery Project DP120103849, and ASEG Research Foundation Project RF13P02. The authors also would like to thank the Ikon Science in Adelaide (formerly JRS Petroleum Research) for the use of their JRS suite.
Supplementary information
A file has been submitted as supplementary data, which represent the New Zealand stress map database.
259

Table 1: The New Zealand stress map database based on the data type and quality. A to E denote the
quality ranking system of the World Stress Map (Heidbach et al., 2010).
Data type Quality
Total A B C D E
Focal mechanism solution of earthquakes 0 0 282 22 28 332
Formal stress inversion of focal mechanisms 36 75 0 0 14 125
Composite/average focal mechanisms 0 0 0 9 0 9
Borehole breakouts 20 16 20 23 76 155
Drilling-induced fractures 2 5 5 16 0 28
Volcanic vent alignments 1 0 2 0 0 3
Total 59 96 309 70 118 652
Table 2: Stress provinces of New Zealand. The type of stress provinces is according to Hillis and
Reynolds (2000) classification. In this method which is based on the Rayleigh test the number of data
records in each provinces and the mean resultant vector (R-value) is compared to cut-off value to
determine the confidence level (Conf.). A stress province is highly reliable if it passes the conf. of
99.9 %. Hence, all the stress provinces of New Zealand are statistically significant and show the
regional SHmax orientation accurately. Stress regime in each province is defined based on the
prevailing stress regime (> 80%) of data records.
Province No. of A-D
quality data
Mean
SHmax
s.d. R-value Conf. Type Stress
Regime
Taranaki Basin 125 068° ±22° 0.74 99.9 % 1 U
Taupo Volcanic Zone 25 043° ±22° 0.74 99.9 % 1 NF
East Coast Region -1 18 103° ±21° 0.75 99.9 % 1 TF
East Coast Region -2 (NF) 9 060° ±18° 0.81 99.9 % 1 NF
Marlborough 35 107° ±11° 0.93 99.9 % 1 SS
Alpine 80 113° ±20° 0.78 99.9 % 1 SS
Christchurch 90 118° ±13° 0.90 99.9 % 1 SS
Puysegur 65 093° ±13° 0.90 99.9 % 1 TF
North East of North Island 24 034° ±21° 0.76 99.9 % 1 NF
260

Figure 1: Regional tectonic setting of New Zealand that shows two subduction zones, in the north and
south, that are connected to each other with the long transform fault system. In this figure the plate
boundaries are from Bird (2003) and the background image is ETOPO-1 from Amante and Eakins
(2009).
261

Figure 2: Schematic diagram to show the crustal stress components that is commonly described as
four parameters including the magnitude of vertical stress (Sv) minimum horizontal (Shmin) and
maximum horizontal (SHmax) stresses. This example shows the stress components in a vertical well
with borehole breakouts (BO) and drilling-induced fractures (DIF). The yellow cylinder is an acoustic
image log that illustrates the BO, DIF and their relationships with the horizontal stresses.
262
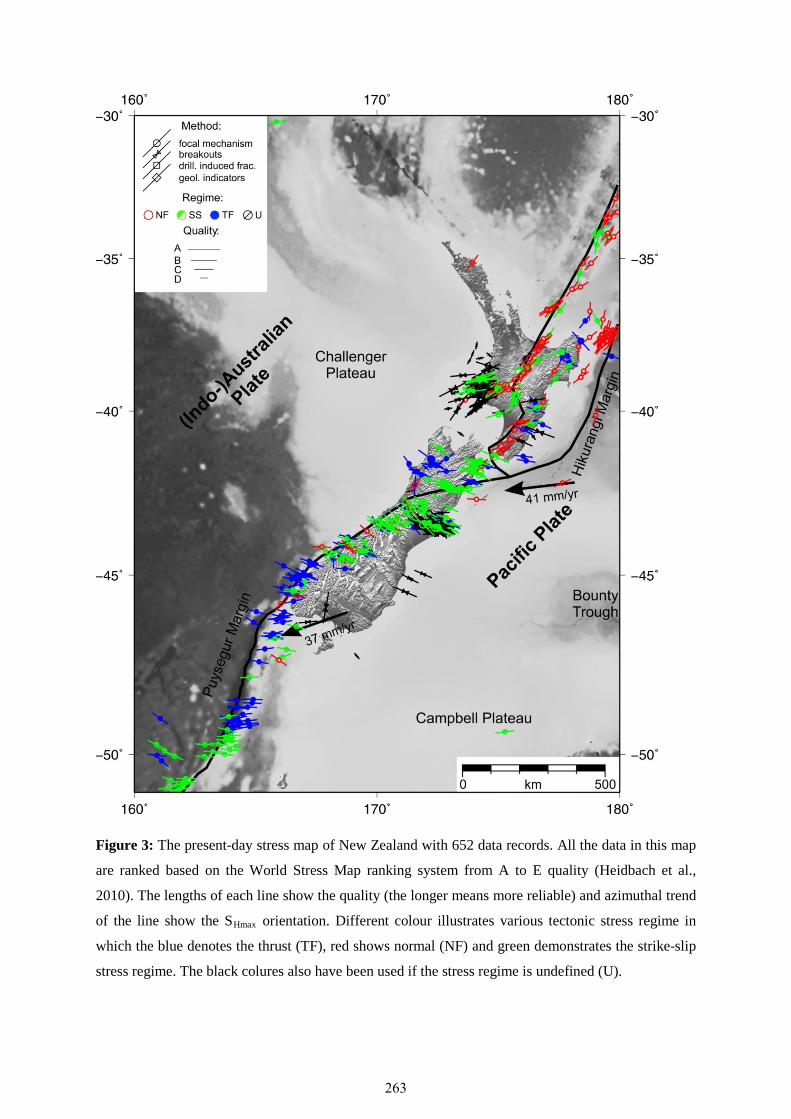
Figure 3: The present-day stress map of New Zealand with 652 data records. All the data in this map
are ranked based on the World Stress Map ranking system from A to E quality (Heidbach et al.,
2010). The lengths of each line show the quality (the longer means more reliable) and azimuthal trend
of the line show the SHmax orientation. Different colour illustrates various tectonic stress regime in
which the blue denotes the thrust (TF), red shows normal (NF) and green demonstrates the strike-slip
stress regime. The black colures also have been used if the stress regime is undefined (U).
263
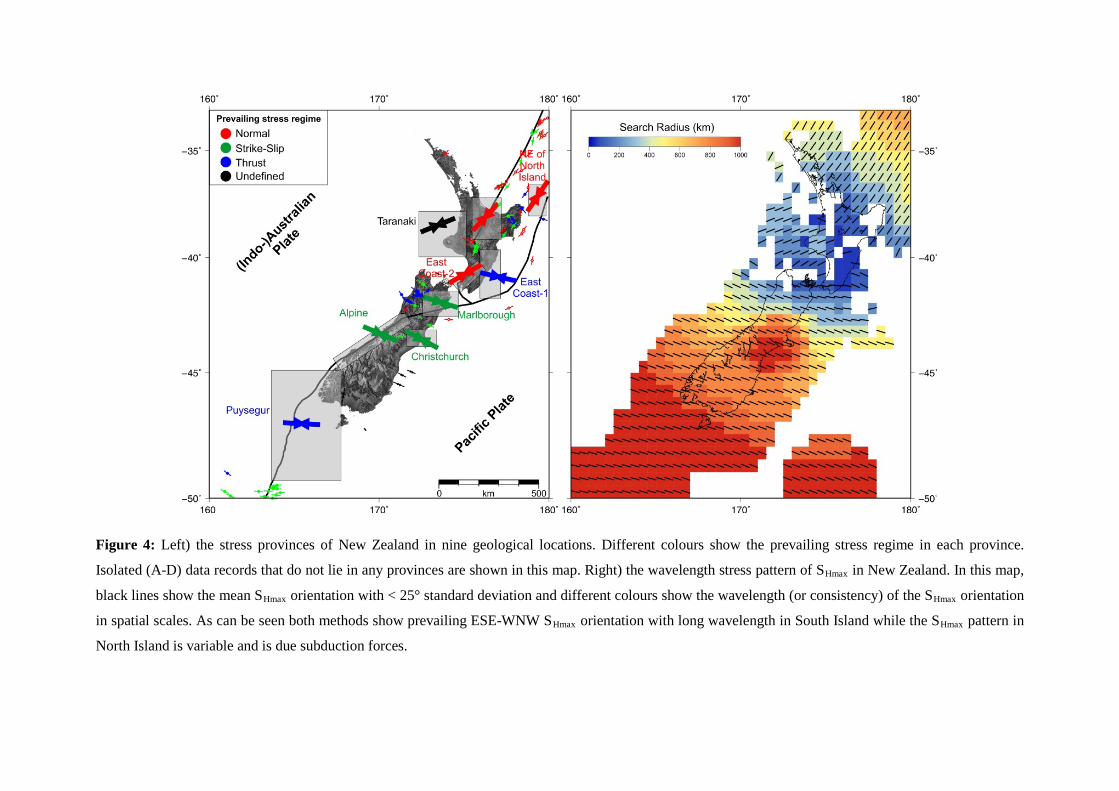
Figure 4: Left) the stress provinces of New Zealand in nine geological locations. Different colours show the prevailing stress regime in each province.
Isolated (A-D) data records that do not lie in any provinces are shown in this map. Right) the wavelength stress pattern of SHmax in New Zealand. In this map,
black lines show the mean SHmax orientation with < 25° standard deviation and different colours show the wavelength (or consistency) of the SHmax orientation
in spatial scales. As can be seen both methods show prevailing ESE-WNW SHmax orientation with long wavelength in South Island while the SHmax pattern in
North Island is variable and is due subduction forces.

Figure 5: Comparison between contemporary stress pattern and active faults (Langridge et al., 2016) in New Zealand. The mean SHmax orientation is consistent with normal
faults in North Island as well as thrust faults in the south Island. However, the SHmax orientations have a large angle difference with the trend of strike-slip faults and highlight
them as ‘weak’ faults.

References:
Aadnoy, B.S., 1990a. In-situ stress directions from borehole fracture traces. Journal of Petroleum Science and Engineering 4, 143-153.
Aadnoy, B.S., 1990b. Inversion technique to determine the in-situ stress field from fracturing data. Journal of Petroleum Science and Engineering 4, 127-141.
Amadei, B., Stephansson, O., 1997. Rock stress and its measurement. Chapman & Hall, London. Amante, C., Eakins, B.W., 2009. ETOPO1 1 arc-minute global relief model procedures, data sources and
analysis. NOAA Technical Memorandum NESDIS NGDC-24. National Geophysical Data Center, NOAA. .
Anderson, E.M., 1905. The dynamics of faulting. Transactions of the Edinburgh Geological Society 8, 387–402.
Anderson, H., Webb, T., Jackson, J., 1993. Focal mechanisms of large earthquakes in the South Island of New Zealand: implications for the accommodation of Pacific-Australia plate motion. Geophys J Int 115, 1032-1054.
Angelier, J., 1984. Tectonic analysis of fault slip data sets. Journal of Geophysical Research: Solid Earth 89, 5835-5848.
Assumpção, M., Dias, F.L., Zevallos, I., Naliboff, J.B., 2016. Intraplate stress field in South America from earthquake focal mechanisms. Journal of South American Earth Sciences.
Balfour, N.J., Cassidy, J.F., Dosso, S.E., Mazzotti, S., 2011. Mapping crustal stress and strain in southwest British Columbia. Journal of Geophysical Research: Solid Earth 116, n/a-n/a.
Balfour, N.J., Savage, M.K., Townend, J., 2005. Stress and crustal anisotropy in Marlborough, New Zealand: evidence for low fault strength and structure-controlled anisotropy. Geophys J Int 163, 1073-1086.
Barth, A., Wenzel, F., 2010. New constraints on the intraplate stress field of the Amurian plate deduced from light earthquake focal mechanisms. Tectonophysics 482, 160-169.
Bell, J.S., 1996. Petro Geoscience 1. In situ stresses in sedimentary rocks (part 1): measurement techniques. Geoscience Canada 23, 85-100.
Bell, J.S., Gough, D.I., 1979. Northeast-southwest compressive stress in Alberta evidence from oil wells. Earth and Planetary Science Letters 45, 475-482.
Bird, P., 2003. An updated digital model of plate boundaries. Geochemistry, Geophysics, Geosystems 4, 1027.
Boese, C.M., Townend, J., Smith, E., Stern, T., 2012. Microseismicity and stress in the vicinity of the Alpine Fault, central Southern Alps, New Zealand. Journal of Geophysical Research: Solid Earth 117, n/a-n/a.
Bott, M.H.P., 1959. The mechanics of oblique slip faulting. Geological Magazine 96, 109-117. Byerlee, J., 1978. Friction of rocks. Pure Appl Geophys 116, 615-626. Clark, K.J., Johnson, P.N., Turnbull, I.M., Litchfield, N.J., 2011. The 2009 Mw 7.8 earthquake on the
Puysegur subduction zone produced minimal geological effects around Dusky Sound, New Zealand. New Zeal J Geol Geop 54, 237-247.
Davis, J.C., 2002. Statistics and data analysis in geology, 3rd ed. Wiley, New York. Doser, D.I., Webb, T.H., Maunder, D.E., 1999. Source parameters of large historical (1918–1962)
earthquakes, South Island, New Zealand. Geophys J Int 139, 769-794. Doutsos, T., Kokkalas, S., 2001. Stress and deformation patterns in the Aegean region. Journal of
Structural Geology 23, 455-472. Ekström, G., Nettles, M., Dziewoński, A.M., 2012. The global CMT project 2004–2010: Centroid-
moment tensors for 13,017 earthquakes. Physics of the Earth and Planetary Interiors 200–201, 1-9. Engelder, T., 1993. Stress regimes in the lithosphere. Princeton University Press, New Jersey. Fulton, P.M., Saffer, D.M., Harris, R.N., Bekins, B.A., 2004. Re-evaluation of heat flow data near
Parkfield, CA: Evidence for a weak San Andreas Fault. Geophysical Research Letters 31, n/a-n/a. GEOFON Data Centre, 1993. GEOFON Seismic Network. doi:10.14470/TR560404. Gephart, J.W., Forsyth, D.W., 1984. An improved method for determining the regional stress tensor
using earthquake focal mechanism data: Application to the San Fernando Earthquake Sequence. Journal of Geophysical Research: Solid Earth 89, 9305-9320.
266

Giba, M., Nicol, A., Walsh, J.J., 2010. Evolution of faulting and volcanism in a back-arc basin and its implications for subduction processes. Tectonics 29, n/a-n/a.
Gripp, A.E., Gordon, R.G., 2002. Young tracks of hotspots and current plate velocities. Geophys J Int 150, 321-361.
Heidbach, O., Reinecker, J., Tingay, M., Müller, B., Sperner, B., Fuchs, K., Wenzel, F., 2007. Plate boundary forces are not enough: Second- and third-order stress patterns highlighted in the World Stress Map database. Tectonics 26, TC6014.
Heidbach, O., Tingay, M., Barth, A., Reinecker, J., Kurfeß, D., Müller, B., 2008. The World Stress Map database release 2008. URL: www.world-stress-map.org.
Heidbach, O., Tingay, M., Barth, A., Reinecker, J., Kurfeß, D., Müller, B., 2010. Global crustal stress pattern based on the World Stress Map database release 2008. Tectonophysics 482, 3-15.
Hickman, S., Zoback, M., 2004. Stress orientations and magnitudes in the SAFOD pilot hole. Geophysical Research Letters 31, L15S12 11-14.
Hillis, R., Reynolds, S.D., 2000. The Australian Stress Map. Journal of the Geological Society 157, 915-921.
Hillis, R., Reynolds, S.D., 2003. In situ stress field of Australia. Geological Society of America Special Papers 372, 49-58.
Holt, R.A., Savage, M.K., Townend, J., Syracuse, E.M., Thurber, C.H., 2013. Crustal stress and fault strength in the Canterbury Plains, New Zealand. Earth and Planetary Science Letters 383, 173-181.
King, P.R., 2000. Tectonic reconstructions of New Zealand: 40 Ma to the Present. New Zeal J Geol Geop 43, 611-638.
King, P.R., Thrasher, G.P., 1996. Cretaceous-Cenozoic geology and petroleum systems of the Taranaki Basin, New Zealand. Institute of Geological and Nuclear Sciences monograph 13, 243 p, 246 enclosures, Lower Hutt, New Zealand: Institute of Geological & Nuclear Sciences Limited.
Lachenbruch, A.H., Sass, J.H., 1992. Heat flow from Cajon Pass, fault strength, and tectonic implications. Journal of Geophysical Research: Solid Earth 97, 4995-5015.
Lamb, S., 2015. Kinematics to dynamics in the New Zealand Plate boundary zone: implications for the strength of the lithosphere. Geophys J Int 201, 552-573.
Langridge, R.M., Ries, W.F., Litchfield, N.J., Villamor, P., Van Dissen, R.J., Barrell, D.J.A., Rattenbury, M.S., Heron, D.W., Haubrock, S., Townsend, D.B., Lee, J.M., Berryman, K.R., Nicol, A., Cox, S.C., Stirling, M.W., 2016. The New Zealand Active Faults Database. New Zeal J Geol Geop 59, 86-96.
Leitner, B., Eberhart-Phillips, D., Anderson, H., Nabelek, J.L., 2001. A focused look at the Alpine fault, New Zealand: Seismicity, focal mechanisms, and stress observations. Journal of Geophysical Research: Solid Earth 106, 2193-2220.
Liu, Z., Bird, P., 2002. Finite element modeling of neotectonics in New Zealand. Journal of Geophysical Research: Solid Earth 107, ETG 1-1-ETG 1-18.
Mardia, K.V., 1972. Statistics of directional data / K.V. Mardia. Academic Press, London ; New York. Mastin, L., 1988. Effect of borehole deviation on breakout orientations. Journal of Geophysical
Research: Solid Earth 93, 9187-9195. McKenzie, D.P., 1969. The relation between fault plane solutions for earthquakes and the directions of
the principal stresses. B Seismol Soc Am 59, 591-601. McNamara, D.D., Massiot, C., Lewis, B., Wallis, I.C., 2015. Heterogeneity of structure and stress in the
Rotokawa Geothermal Field, New Zealand. Journal of Geophysical Research: Solid Earth 120, 1243-1262.
Meijer, P.T., Wortel, M.J.R., 1997. Present-day dynamics of the Aegean region: A model analysis of the horizontal pattern of stress and deformation. Tectonics 16, 879-895.
Michael, A.J., 1984. Determination of stress from slip data: Faults and folds. Journal of Geophysical Research: Solid Earth 89, 11517-11526.
Mount, V.S., Suppe, J., 1992. Present-day stress orientations adjacent to active strike-slip faults: California and Sumatra. Journal of Geophysical Research: Solid Earth 97, 11995-12013.
Müller, B., Wehrle, V., Hettel, S., Sperner, B., Fuchs, K., 2003. A new method for smoothing orientated data and its application to stress data. Geological Society, London, Special Publications 209, 107-126.
Nairn, I.A., Cole, J.W., 1981. Basalt dikes in the 1886 Tarawera Rift. New Zeal J Geol Geop 24, 585-592.
267

Nicol, A., Wallace, L.M., 2007. Temporal stability of deformation rates: Comparison of geological and geodetic observations, Hikurangi subduction margin, New Zealand. Earth and Planetary Science Letters 258, 397-413.
Norris, R.J., Toy, V.G., 2014. Continental transforms: A view from the Alpine Fault. Journal of Structural Geology 64, 3-31.
Palano, M., 2015. On the present-day crustal stress, strain-rate fields and mantle anisotropy pattern of Italy. Geophys J Int 200, 967-983.
Peška, P., Zoback, M.D., 1995. Compressive and tensile failure of inclined well bores and determination of in situ stress and rock strength. Journal of Geophysical Research: Solid Earth 100, 12791-12811.
Rajabi, M., Tingay, M., Heidbach, O., 2016a. The present-day stress field of New South Wales, Australia. Australian Journal of Earth Sciences 63, 1-21.
Rajabi, M., Tingay, M., Heidbach, O., Hillis, R., Reynolds, S., under-review. The present-day stress field of Australia, Under-review in Earth-Science Reviews.
Rajabi, M., Tingay, M., King, R., Heidbach, O., 2016b. Present-day stress orientation in the Clarence-Moreton Basin of New South Wales, Australia: a new high density dataset reveals local stress rotations. Basin Research.
Rajabi, M., Ziegler, M., Tingay, M., Heidbach, O., Reynolds, S., 2016c. Contemporary tectonic stress pattern of the Taranaki Basin, New Zealand. Journal of Geophysical Research: Solid Earth 121, 6053–6070.
Raleigh, C.B., Healy, J.H., Bredehoeft, J.D., 1972. Faulting and Crustal Stress at Rangely, Colorado, in: Heard, H.C., Borg, I.Y., Carter, N.L., Raleigh, C.B. (Eds.), Flow and Fracture of Rocks. U.S. Geological Survey, Washington, D. C., pp. 275-284.
Reyners, M., 2010. Stress and strain from earthquakes at the southern termination of the Taupo Volcanic Zone, New Zealand. Journal of Volcanology and Geothermal Research 190, 82-88.
Reyners, M., Robinson, R., Pancha, A., McGinty, P., 2002. Stresses and strains in a twisted subduction zone—Fiordland, New Zealand. Geophys J Int 148, 637-648.
Salmon, M., Kennett, B.L.N., Stern, T., Aitken, A.R.A., 2013. The Moho in Australia and New Zealand. Tectonophysics 609, 288-298.
Sbar, M.L., Barazangi, M., Dorman, J., Scholz, C.H., Smith, R.B., 1972. Tectonics of the Intermountain Seismic Belt, Western United States: Microearthquake Seismicity and Composite Fault Plane Solutions. GSA Bulletin 83, 13-28.
Seebeck, H., Nicol, A., Villamor, P., Ristau, J., Pettinga, J., 2014. Structure and kinematics of the Taupo Rift, New Zealand. Tectonics 33, 1178-1199.
Sherburn, S., White, R.S., 2006. Tectonics of the Taranaki region, New Zealand: Earthquake focal mechanisms and stress axes. New Zeal J Geol Geop 49, 269-279.
Sibson, R.H., 1990. Conditions for Fault-Valve Behavior. Geol Soc Spec Publ 54, 15-28. Sibson, R.H., Ghisetti, F.C., Crookbain, R.A., 2012. Andersonian wrench faulting in a regional stress
field during the 2010–2011 Canterbury, New Zealand, earthquake sequence. Geological Society, London, Special Publications 367, 7-18.
Sperner, B., Müller, B., Heidbach, O., Delvaux, D., Reinecker, J., Fuchs, K., 2003. Tectonic stress in the Earth’s crust: advances in the World Stress Map project. Geological Society, London, Special Publications 212, 101-116.
Sutherland, R., Eberhart-Phillips, D., Harris, R.A., Stern, T., Beavan, J., Ellis, S., Henrys, S., Cox, S., Norris, R.J., Berryman, K.R., Townend, J., Bannister, S., Pettinga, J., Leitner, B., Wallace, L., Little, T.A., Cooper, A.F., Yetton, M., Stirling, M., 2013. Do Great Earthquakes Occur on the Alpine Fault in Central South Island, New Zealand?, A Continental Plate Boundary: Tectonics at South Island, New Zealand. American Geophysical Union, pp. 235-251.
Sutherland, R., Toy, V.G., Townend, J., Cox, S.C., Eccles, J.D., Faulkner, D.R., Prior, D.J., Norris, R.J., Mariani, E., Boulton, C., Carpenter, B.M., Menzies, C.D., Little, T.A., Hasting, M., De Pascale, G.P., Langridge, R.M., Scott, H.R., Lindroos, Z.R., Fleming, B., Kopf, A.J., 2012. Drilling reveals fluid control on architecture and rupture of the Alpine fault, New Zealand. Geology 40, 1143-1146.
Tingay, M., Bentham, P., De Feyter, A., Kellner, A., 2011. Present-day stress-field rotations associated with evaporites in the offshore Nile Delta. Geol Soc Am Bull 123, 1171-1180.
Tingay, M., Morley, C., King, R., Hillis, R., Coblentz, D.D., Hall, R., 2010. Present-day stress field of Southeast Asia. Tectonophysics 482, 92-104.
268

Townend, J., Sherburn, S., Arnold, R., Boese, C., Woods, L., 2012. Three-dimensional variations in present-day tectonic stress along the Australia–Pacific plate boundary in New Zealand. Earth and Planetary Science Letters 353–354, 47-59.
Townend, J., Zoback, M.D., 2004. Regional tectonic stress near the San Andreas fault in central and southern California. Geophysical Research Letters 31, n/a-n/a.
Walcott, R.I., 1987. Geodetic strain and the deformation history of the North Island of New Zealand during the late Cainozoic. Philosphical Transactions of the Royal Society of London, Series A 321, 163–181.
Wallace, L.M., Barnes, P., Beavan, J., Van Dissen, R., Litchfield, N., Mountjoy, J., Langridge, R., Lamarche, G., Pondard, N., 2012. The kinematics of a transition from subduction to strike-slip: An example from the central New Zealand plate boundary. Journal of Geophysical Research: Solid Earth 117, n/a-n/a.
Wallace, L.M., Beavan, J., McCaffrey, R., Darby, D., 2004. Subduction zone coupling and tectonic block rotations in the North Island, New Zealand. Journal of Geophysical Research: Solid Earth 109, n/a-n/a.
Wallace, L.M., Ellis, S., Mann, P., 2009a. Collisional model for rapid fore-arc block rotations, arc curvature, and episodic back-arc rifting in subduction settings. Geochemistry, Geophysics, Geosystems 10, n/a-n/a.
Wallace, L.M., Reyners, M., Cochran, U., Bannister, S., Barnes, P.M., Berryman, K., Downes, G., Eberhart-Phillips, D., Fagereng, A., Ellis, S., Nicol, A., McCaffrey, R., Beavan, R.J., Henrys, S., Sutherland, R., Barker, D.H.N., Litchfield, N., Townend, J., Robinson, R., Bell, R., Wilson, K., Power, W., 2009b. Characterizing the seismogenic zone of a major plate boundary subduction thrust: Hikurangi Margin, New Zealand. Geochemistry, Geophysics, Geosystems 10, n/a-n/a.
Wang, K., 2000. Stress–strain ‘paradox’, plate coupling, and forearc seismicity at the Cascadia and Nankai subduction zones. Tectonophysics 319, 321-338.
Webb, T.H., Anderson, H., 1998. Focal mechanisms of large earthquakes in the North Island of New Zealand: slip partitioning at an oblique active margin. Geophys J Int 134, 40-86.
Webb, T.H., Ferris, B.G., Harris, J.S., 1986. The Lake Taupo, New Zealand, earthquake swarms of 1983. New Zeal J Geol Geop 29, 377-389.
Zoback, M.D., 2010. Reservoir geomechanics. Cambridge University Press, Cambridge. Zoback, M.L., 1992. First- and second-order patterns of stress in the lithosphere: The World Stress Map
Project. Journal of Geophysical Research: Solid Earth 97, 11703-11728. Zoback, M.L., Zoback, M.D., 1980. Faulting patterns in north-central Nevada and strength of the crust.
Journal of Geophysical Research: Solid Earth 85, 275-284.
269

5. The Present-Day Stress Field of Iceland
5.1. Paper 9: The Stress Pattern of Iceland
Ziegler, M., Rajabi, M., Heidbach, O., Hersir, G.P., Ágústsson, K., Árnadóttir, S., Zang, A.,
2016. The stress pattern of Iceland. Tectonophysics 674, 101-113.
DOI: http://dx.doi.org/10.1016/j.tecto.2016.02.008.
270

271

272

Tectonophysics 674 (2016) 101–113
Contents lists available at ScienceDirect
Tectonophysics
j ourna l homepage: www.e lsev ie r .com/ locate / tecto
The stress pattern of Iceland
Moritz Ziegler a,b,⁎, Mojtaba Rajabi c, Oliver Heidbach a, Gylfi Páll Hersir d, Kristján Ágústsson d,Sigurveig Árnadóttir d, Arno Zang a,b
a Helmholtz Centre Potsdam, German Research Centre for Geosciences, Telegrafenberg, 14473 Potsdam, Germanyb University of Potsdam, Institute of Earth and Environmental Science, Karl-Liebknecht-Str. 24–25, 14476 Potsdam-Golm, Germanyc Australian School of Petroleum, The University of Adelaide, Adelaide, SA 5005, Australiad Iceland GeoSurvey (ÍSOR), Grensásvegur 9, 108 Reykjavík, Iceland
⁎ Corresponding author.E-mail address: [email protected] (M. Ziegler
http://dx.doi.org/10.1016/j.tecto.2016.02.0080040-1951/© 2016 Elsevier B.V. All rights reserved.
a b s t r a c t
a r t i c l e i n f oArticle history:Received 13 August 2015Received in revised form 29 January 2016Accepted 2 February 2016Available online 12 February 2016
Iceland is located on the Mid-Atlantic Ridge which is the plate boundary between the Eurasian and the NorthAmerican plates. It is one of the few places on earth where an active spreading centre is located onshore butthe stress pattern has not been extensively investigated so far. In this paper we present a comprehensive compi-lation of the orientation ofmaximumhorizontal stress (SHmax). In particular we interpret borehole breakouts anddrilling induced fractures from borehole image logs in 57 geothermalwells onshore Iceland. The borehole resultsare combined with other stress indicators including earthquake focal mechanism solutions, geological informa-tion and overcoringmeasurements resulting in a dataset with 495 data records for the SHmax orientation. The re-liability of each indicator is assessed according to the quality criteria of the World Stress Map project.The majority of SHmax orientation data records in Iceland is derived from earthquake focal mechanism solutions(35%) and geological fault slip inversions (26%). 20% of the data are borehole related stress indicators. In additionminor shares of SHmax orientations are compiled, amongst others, from focalmechanism inversions and the align-ment of fissure eruptions. The results show that the SHmax orientations derived from different depths and stressindicators are consistent with each other.The resulting pattern of the present-day stress in Iceland has four distinct subsets of SHmax orientations. The SHmax
orientation is parallel to the rift axes in the vicinity of the active spreading regions. It changes fromNE–SW in theSouth to approximately N–S in central Iceland and NNW–SSE in the North. In theWestfjords which is located faraway from the ridge the regional SHmax rotates and is parallel to the plate motion.
© 2016 Elsevier B.V. All rights reserved.
Keywords:IcelandStress fieldStress patternBorehole image logs
1. Introduction
The regional stress pattern along divergent plate boundaries has notbeen studied extensively yet due to the inaccessibility of submergedMid Oceanic Ridges. Few and scattered earthquake focal mechanism so-lutions are the only sources of stress orientation in these areas in theWorld Stress Map (WSM) database (Heidbach et al., 2008; Heidbachet al., 2010). These indicators generally show a ridge parallel maximumhorizontal stress (SHmax) orientation (Zoback et al., 1989; Zoback, 1992).In intraplate regions the orientation of SHmax is often parallel to the ab-solute plate motion in a first order approximation and therefore gener-ally normal to the ridges and subduction zones (e.g. Richardson, 1992;Müller et al., 1992; Grünthal and Stromeyer, 1992; Zoback, 1992;Zoback et al., 1989). A systematic rotation of SHmax from ridge parallelto ridge normal has been observed close to ridges in the Indian Ocean(Wiens and Stein, 1984) and at Mid Oceanic Ridges in general (Sykes,1967; Sykes and Sbar, 1974).
).
273
Iceland is one of the few places on the Earth with an onshore diver-gent plate boundary (e.g. Ward, 1971; Sæmundsson, 1979; Einarsson,1991; Einarsson, 2008; Bird, 2003). It is in a unique geological and tec-tonic setting, where an oceanic ridge (theMid-Atlantic Ridge) traversesa (purported)mantle plume (e.g. Lawver andMüller, 1994;Wolfe et al.,1997; Allen et al., 2002). The rift zones in and around Iceland are dom-inated by various volcanic systems of different extents and activities(Thordarson and Larsen, 2007; Jóhannesson and Sæmundsson, 1998).Induced by the hotspot the plumbing of the volcanic systems is extend-ed compared to a usual divergent plate boundary (Allen et al., 2002). Asthe plate boundary crosses the hotspot, it breaks up into a complex se-ries of segments. Purely divergent segments are the Northern VolcanicZone (NVZ) in North Iceland, and the sub-parallel Western and EasternVolcanic Zones (WVZ, EVZ) in South Iceland which are generally as-sumed to be the expression of a ridge jump (Sæmundsson, 1979;Einarsson, 1991; Einarsson, 2008). In the South, the South IcelandSeismic Zone (SISZ) is the connecting segment between the Reykjanespeninsula and the Eastern Volcanic Zone (Sæmundsson, 1974;Sæmundsson, 1979; Einarsson, 1991; Stefánsson et al., 2008). In theNorth the Tjörnes Fracture Zone (TFZ) connects the NVZ to the southern

102 M. Ziegler et al. / Tectonophysics 674 (2016) 101–113
end of the submarine Kolbeinsey Ridge (Sæmundsson, 1974;Sæmundsson, 1979; Einarsson, 1991; Stefánsson et al., 2008). TheWVZ and NVZ are joined by a transverse E–W zone across centralIceland. Outside of the immediate plate boundary, volcanism occurs inthe South Iceland Volcanic Zone, the Snæfellsnes Volcanic Zone andthe Öræfajökull Volcanic Zone (e.g. Jakobsson, 1979; Sæmundsson,1978; Sæmundsson, 1986).
This volcano-tectonic setting has received a particular attention inthe first compilation of the present-day crustal stress by Hast (1969).Since then, several researchers investigated the state of stress in differ-ent parts of Iceland. An extensive campaign of in-situ stress measure-ments from shallow overcorings was carried out by Haimson andRummel (1982) conducted hydro-fracturing experiments in six
Reykjavík
North AmericanPlate
Hreppa
−25° −20°
SHmax: 19 ± 34Quality: A-CN = 188
SHmax: 17 ± 39Quality: A-D
N = 318
Fig. 1. Thefirst comprehensive stressmap of Icelandwith 318 data recordswith A–D quality accLines represent the orientation of maximum horizontal stress SHmax with the length proportiontermination. The colour coding is according to the stress regime with red indicating normal faufor unknown regimes. The plate boundaries according to Bird (2003) and Einarsson (2008) areA–C and A–D quality data respectively. Mean SHmax orientations and their standard deviations aof the references to colour in this figure legend, the reader is referred to the web version of th
27
onshore boreholes. Furthermore, extensive field campaigns to collectgeological fault slip data provide information on the current andpalaeo-stress field in Iceland as well as its temporal evolution(Gudmundsson et al., 1996; Bergerat and Angelier, 1998; Garcia andDhont, 2005; Angelier et al., 2008; Plateaux et al., 2012). In total, thecompilation of stress data records in theWorld StressMap (WSM)data-base 2008 resulted in 38 data records of the contemporary SHmax orien-tation and the stress regime (9 focal mechanism solutions, 5 hydro-fracturing orientations, and 24 overcoring measurements, (Heidbachet al., 2008; Heidbach et al., 2010)). However, this small data set is notsufficient to reveal the presumably high variability of the stress fieldpattern of Iceland. This is especially important since Iceland's peculiarlocation causes extensive interactions between tectonic and volcanic
0 100 km
Egilsstaðir
Akureyri
Vík
Eurasian Plate
r Plate
65°
66°
67°
68°
Method:
focal mechanismbreakoutsdrill. induced frac.borehole slotterovercoringhydro. fracturesgeol. indicators
Regime:
NF SS TF U
Quality:ABCD
ording to theWorld StressMap quality criteria (Sperner et al., 2003; Heidbach et al., 2010).al to quality. The symbols in the middle of the lines display the method used for stress de-lting, green indicating strike slip faulting, blue indicating thrust/reverse faulting, and blackindicated in grey. Two rose diagrams display the unweighted frequency distribution of there calculatedwith the circular statistics of bi-polar data (Mardia, 1972). (For interpretationis article.)
4

Sv
SHmax
DIF
103M. Ziegler et al. / Tectonophysics 674 (2016) 101–113
processeswhich influence the local stress field (e.g. Sæmundsson, 1979;Gudmundsson, 2006; Andrew and Gudmundsson, 2008).
In this paper we present a new comprehensive compilation of thecontemporary SHmax orientation for Iceland with 495 data records(Fig. 1). In particular, we analysed 37 km of borehole acoustic imagelogs from 57 geothermal wells to interpret present-day stress indica-tors, i.e. borehole breakouts (BOs) and drilling induced fractures(DIFs). Furthermore, we revised the 38 data records from the WSM2008 and conducted an extensive literature study to compile publishedfocal mechanism solutions and geological stress indicators, e.g. fault slipinversions or the alignment of volcanic vents and fissures. All data re-cords are quality ranked according to the WSM quality ranking system(Zoback, 1992; Sperner et al., 2003; Heidbach et al., 2010). We identifythe regional pattern of the SHmax orientation by four different stressprovinces with different mean SHmax orientations on Iceland.
BO
Shmin
SHmax
Fig. 2. A vertical borehole section with stress indicator pairs. Top: Drilling inducedfractures (DIFs) are narrow vertical fractures which indicate the orientation of SHmax.Bottom: Borehole breakouts (BOs) are broad vertical widened zones of the boreholewhich indicate the orientation of Shmin. These two features occur diametrically on bothsides of the borehole wall.
2. Stress data compilation
The first comprehensive compilation of the contemporary SHmax ori-entation was made by Sbar and Sykes (1973) who mapped the stresspattern in North America. This effort was later institutionalised byZoback et al. (1989)) in the framework of the WSM project (e.g.Müller et al., 1992; Heidbach et al., 2010). In the literature there are sev-eral methods to determine the orientation of SHmax in a rock volume(Ljunggren et al., 2003; Zoback et al., 1989; Zang and Stephansson,2010). However, these different methods may result in different orien-tations due to the depth of the phenomena, different reliability, or su-perposition of different forces at different scales (Heidbach et al.,2007). Hence, comparison between the SHmax from different indicatorshave received a particular attention to establish a quality rankingscheme for the WSM database (Zoback and Zoback, 1991; Zoback,1992; Zoback et al., 1989; Sperner et al., 2003; Heidbach et al., 2010).Following this scheme each data record is assigned a quality fromA (re-liability of orientation±15°), B (±15–20°), C (±20–25°), D (±25–40°)up to E (N±40°) (Heidbach et al., 2010). A detailed description of theWSM quality ranking scheme for individual stress indicators can befound in Zoback (1992), Sperner et al. (2003)), and Heidbach et al.(2010).
Our stress data compilation extends from 62° to 68° northernlatitude and from −11° to −26° longitude. The image log data fromthe 57 geothermal wells resulted in 36 new A–D stress data records.In addition, we estimated 17 SHmax orientations from crater rows of fis-sure eruptions of different volcanic systems. Furthermore, an extensiveliterature review resulted in 374 new stress data records which aremainly from focal mechanism solutions of earthquakes. These newdata records are fromdifferent earthquake catalogues such as theGlobalCMT (Ekström et al., 2012), (Dziewonski et al., 1981), Geofon Potsdam(Centre, 1993) and Zurich Moment Tensors. Furthermore data recordswere included from published papers by Angelier et al. (2004),Batir (2011), Bergerat et al. (1990), Bergerat and Angelier (1998),Bergerat et al. (1998), Bergerat and Plateaux (2012), Bjarnason andEinarsson (1991), Einarsson (1979) Einarsson (1987), Forslundand Gudmundsson (1991), Garcia et al. (2002), Garcia (2003), Greenet al. (2014), Gudmundsson et al. (1992), Gudmundsson (1995),Gudmundsson et al. (1996); Jakobsson (1979), Jefferis and Voight(1981), Hagos et al. (2008), Haimson and Voight (1977), Keiding et al.(2009), Khodayar and Franzson (2007), Kristjánsdóttir (2013), Lundand Slunga (1999), Lund and Bödvarsson (2002), Nakamura (1977),Plateaux et al. (2014), Rögnvaldsson and Slunga (1994); Roth et al.(2000), Schäfer and Keil (1979), Sigmundsson et al. (2005) Sigurdsson(1970), Soosalu and Einarsson (1997), Stefánsson (1966), Tibaldi et al.(2013), and Villemin et al. (1994). The detailed dataset of the Icelandstress map is provided in the supplementary material. In the followingsections we briefly describe each individual stress indicator used forthe Iceland stress dataset.
275
2.1. Borehole data
The possibility to determine the in-situ stress orientation from fail-ure of borehole walls was first recognised by Bell and Gough (1979) inAlberta, Canada. They showed that if the stresses around a borehole ex-ceed the strength of the rock, some pieces of the borehole wall spall offand the borehole is elongated in one orientation. According to Kirsch(1898) and Scheidegger (1962) the highest stresses around a circularhole are encountered perpendicular to the orientation of maximumcompression (SHmax). These resulting broad elongated zones of so calledborehole breakouts (BO, see Fig. 2) indicate the orientation ofminimumhorizontal stress (Shmin) which is perpendicular to SHmax under the as-sumption that the vertical stress (Sv) is one of the principal stresses(Bell and Gough, 1979).
Furthermore, if the minimum circumferential stress around a bore-holewall is smaller than the tensile strength of the rock, drilling inducedfractures (DIF, see Fig. 2) occur (Aadnoy, 1990; Aadnoy and Bell, 1998).Therefore drilling induced fractures are recognised as an indicator forthe orientation of SHmax as well (Wiprut et al., 1997; Bell, 1996;Sperner et al., 2003).
Acoustic image logs provide a picture of the borehole wall based onacoustic contrast of boreholewall andfluids. Borehole breakouts usuallyappear as broad vertical zones of a low acoustic amplitude on oppositesides of the borehole wall (separated by 180°) while drilling inducedfractures are indicated by narrow vertical zones of low amplitude(Fig. 3). A pair of DIFs or BOs on opposite sides of the borehole wall isconsidered as a single feature. Since the shapes of BOs and DIFs dependon rock strength and the elastic properties of rocks and these featuresare time dependent, incipient breakouts form at the initial stage of theformation of borehole breakouts (Aadnoy and Bell, 1998).

1085.0
1086.0
1087.0
1088.0
540.0
541.0
542.0
543.0
0° 90° 180° 270° 360° 0° 90° 180° 270° 360°
Amplitudelow high
Borehole Breakouts (BO) Drilling induced tensile fractures (DIF)
Dep
th [m
] Depth [m
]
Fig. 3. Borehole related stress indicators in acoustic image logs. Left: Borehole breakouts (BOs) in well ST-16 Sigtún close to Akureyri. The inferred overall orientation of SHmax from BOs is127° in this well. Right: Drilling induced fractures (DIFs) inwell HJ-20 Hjalteyri close to Akureyri. The inferred overall orientation of SHmax from DIFs is 144° in this well. The location of thetwo wells is shown in Fig. 4.
104 M. Ziegler et al. / Tectonophysics 674 (2016) 101–113
Iceland's volcano-tectonic setting results in large geothermal re-sources which are extracted by various boreholes (Ragnarsson, 2015).In 2002 through 2015 the Iceland GeoSurvey (ÍSOR) ran boreholeimage logs in 57 geothermal and scientific boreholes mainly in theSouth Iceland Lowlands and around Akureyri and Krafla in the North(see Fig. 4 for locations). From these data we collected and analysed37 km of acoustic image logs. Most of them are slightly deviated from
Reykjavík
Akureyri
ST-16
HJ-20
RN-34
Fig. 4. The location of geothermal boreholes with acoustic image logs. The black and greytriangles denote the location of boreholeswith andwithout stress indicators (based onourimage log analysis) respectively. The white triangles show the location of borehole HJ-20Hjalteyri, ST-16 Sigtún (Fig. 3) as well as in RN-34 Reykjanes.
27
vertical (b10°)which still allows the interpretation of stress related fea-tures in every stress regime (Mastin, 1988; Tingay et al., 2005; Peškaand Zoback, 1995).
27 boreholes contained at least one BO or one DIF (Table 1, Fig. 4). Inthe case that both BOs andDIFs are found in the samewell, the indepen-dently inferred SHmax orientations are generally in good agreementwitheach other (Table 1). In addition to the newly analysed borehole images3 BOs and 1 DIF from published articles were included. In the analysedboreholes stress indicators are mainly found between the surface and1 km depth. Some few BOs/DIFs are located in deeper sections of theboreholes with a maximum depth of 2.34 km in well RN-34 on theReykjanes peninsula (Fig. 4). Thus borehole stress data bridge the gapbetween shallow stress indicators from geological data and focal mech-anism solutions at greater depth.
Table 1 shows the results of image log interpretation and observedBOs/DIFs in the studied wells. 11 data records have an A–C quality and25 data records have a D quality. The high number of low quality datarecords is partly related to the challenges of well-logging in a high tem-perature and igneous environment resulting in a partly poor imagequality. Special tools adapted to high temperatures are required andcan only remain in the well for a short time period (Ásmundssonet al., 2014). In addition, in some of the studied wells image toolswere not centralised and produced low quality images with numerousvertical artefactswhichdo not allow a reliable detection of BOs andDIFs.
2.2. Focal mechanism solutions
Focal mechanism solutions of earthquakes have been used to inferstress information, both orientation and relative magnitudes, in thedeeper part of the earth's crust which is beyond common drilling
6

Table 1Stress indicators from the analysed acoustic borehole images of A–D Quality. All the information required for theWSM quality ranking is included in the Table. Azimuth: Interpreted ori-entation of SHmax. Number: The amount of recognised feature pairs (BOs or DIFs) in a single well. S.D.: Standard deviation calculated according to the circular statistics of bi-polar data by(Mardia, 1972) with a weighting depending of the length (short: L) of the feature. Length: The added length of the fractured borehole sections. Top and Bottom: The depth of the upper-most and lowermost stress indicator found in the borehole. Depth: The mean between top and bottom. Date: Date of the tool run.
BoreholeID
Latitude Longitude Azimuth Type Depth[km]
Quality Location Date Number S.D. Length[m]
Weighting Top[m]
Bottom[m]
HH-08 63.425023 −20.25904 133 BO 1.05 C Vestmannaeyjar 20050415 11 13 22 L 789 1719RN-34 63.83951 −22.660869 36 BO 1.95 C Reykjanes 20150328 15 12 25 L 1412 2628RN-34 63.83951 −22.660869 47 DIF 2.45 B Reykjanes 20150328 20 9 40 L 2317 2612KH-34 63.98881 −20.44006 67 BO 0.04 D Kaldárholt 20050322 1 0 2 L 38 40KH-34 63.98881 −20.44006 109 DIF 0.2 D Kaldárholt 20050322 2 2 3 L 55 390SO-01 63.995165 −21.13729 47 DIF 0.32 D Sogn/Ölfus 20050322 3 13 6 L 314 325HE-21 64.008906 −21.3438 41 BO 1.67 D Hellisheiði 20060215 11 14 16 L 1608 1748HE-21 64.008906 −21.3438 67 DIF 1.35 B Hellisheiði 20060215 53 14 123 L 912 1812HE-58 64.033132 −21.376734 35 DIF 1.9 D Hellisheiði 20150830 3 15 5 L 1609 2200HN-01 64.026124 −21.45102 45 BO 0.9 C Hellisheiði 20050405 20 22 26 L 866 977HN-01 64.026124 −21.45102 44 DIF 0.85 D Hellisheiði 20050405 7 18 10 L 768 977HK-15 64.041 −20.81377 8 BO 0.1 C Grímsnes 20060303 33 15 25 L 37 183HN-12 64.044597 −21.38636 84 DIF 1.5 D Hellisheiði 20101021 7 21 11 L 1152 1878HN-16 64.045106 −21.3862 86 DIF 2.06 D Hellisheiði 20101018 6 12 9 L 2021 2187NJ-28 64.098521 −21.270345 107 DIF 1.05 D Nesjavellir 20150625 5 9 11 L 1029 1057HF-01 64.391916 −15.34195 151 DIF 0.6 D Hoffell 20130221 10 11 17 L 424 805ASK-29 64.393293 −15.343563 130 BO 0.11 D Hoffell 20120926 6 16 6 L 103 123ASK-57 64.393898 −15.34267 4 BO 0.28 D Hoffell 20120926 1 0 1 L 283 284ASK-122 64.393778 −15.33175 65 DIF 0.35 D Hoffell 20150924 7 14 13 L 338 375HO-02 65.04501 −22.77176 60 BO 0.36 D Stykkishólmur 20070215 1 0 4 L 366 370ST-16 65.5519 −18.07022 127 BO 0.35 C Sigtún/Eyjafjörður 20050126 28 9 37 L 111 671ST-16 65.5519 −18.07022 140 DIF 0.4 D Sigtún/Eyjafjörður 20050126 5 7 16 L 329 508BO-3 65.562966 −18.10464 107 DIF 0.07 D Botn 20130122 3 13 10 L 60 80KV-01 65.692163 −16.81934 29 BO 1.43 D Krafla 20060803 1 0 1 L 1435 1437KV-01 65.692163 −16.81934 164 DIF 1.43 D Krafla 20060803 2 8 2 L 1432 1435K-18 65.702026 −16.73063 17 BO 0.74 D Krafla 20081118 2 4 6 L 733 750HJ-17 65.855115 −18.2105 151 DIF 0.15 D Hjalteyri 20020221 2 11 2 L 122 170HJ-13 65.855337 −18.21303 145 DIF 0.06 D Hjalteyri 20020220 1 0 3 L 62 65HJ-20 65.856089 −18.21142 141 BO 1 D Hjalteyri 20050202 4 8 12 L 784 1176HJ-20 65.856089 −18.21142 144 DIF 0.75 A Hjalteyri 20050202 60 11 136 L 352 1346HJ-15 65.859457 −18.21754 154 DIF 0.2 D Hjalteyri 20020223 1 0 2 L 204 207ARS-32 65.931479 −18.33783 163 BO 0.75 D Árskógsströnd 20060608 6 19 6 L 668 842ARS-32 65.931479 −18.33783 173 DIF 0.55 C Árskógsströnd 20060608 17 14 36 L 206 713SK-28 65.997822 −19.33668 143 BO 0.5 C Hrolleifsdalur 20051008 55 25 137 L 240 821SD-01 66.127507 −18.96229 146 BO 0.45 D Skarðdalur/Tröllaskagi 20100925 2 3 3 L 430 537SD-01 66.127507 −18.96229 140 DIF 0.5 B Skarðdalur/Tröllaskagi 20100925 20 11 69 L 319 687
105M. Ziegler et al. / Tectonophysics 674 (2016) 101–113
plans (Sbar and Sykes, 1973; Gephart and Forsyth, 1984; Zoback, 1992;Heidbach et al., 2010). The orientation of SHmax is estimated from theprincipal strain axes of the double couple components of the focalmechanism (McKenzie, 1969; Barth et al., 2008). However, these axesare not necessarily reliable proxies for the stress axis orientation(McKenzie, 1969; Célérier, 2010; Heidbach et al., 2010). Therefore, sin-gle focalmechanism solutions are never eligible for a quality better thanC in the WSM database (Heidbach et al., 2010; Barth et al., 2008). Astress determination though the averaging of several focal mechanism'sP, B, and T axes (FMA) is less reliable and is hence assigned D quality.
Between 1994 through 2007 250,000 seismic events were recordedby the IcelandMeteorological Officewith 11 events of M N 5 (Einarsson,1991; Einarsson, 2008; Jakobsdóttir et al., 2002; Jakobsdóttir, 2008;Einarsson et al., 1977; Keiding et al., 2009). The detection threshold inthis time frame has been between M l=2 and M l=0 depending onthe region (Jakobsdóttir, 2008). Focalmechanismsolutionswere public-ly available for only a fraction of the recorded seismic events.
Presumably especially in Iceland many seismic events are related tovolcanic eruptions or dyke intrusions and thus are potentially spatiallyand temporally restricted manifestations of the stress field (e.g.Roman et al., 2004; Sánchez et al., 2004; Einarsson, 1991; White et al.,2011). Hence they do not necessarily represent the long-term stressfield but only short-term fluctuations of a perturbed regional stressfield. In addition, such events may have a low double-couple and highcompensated linear vector dipole (CLVD) component (Nettles andEkström, 1998). That means themain strain component is due to an in-flation or deflation above some pressure source in contrast to a double-
277
couple mechanism (Nettles and Ekström, 1998; Ekström, 1994). There-fore events which can be spatially and temporally attributed to a volca-nic eruption or rifting event are assigned E quality. However, seismicevents which are only located at a volcano but cannot be linked to aneruption remain with a quality C. In the Vatnajökull area several thrustfaulting events were recorded during an inter-volcanic period. Nettlesand Ekström (1998) and Einarsson (1991) suggest that these eventsare a movement of the Barðabunga caldera rim. Hence they are not di-rectly temporarily related to a volcanic eruption and assigned the qual-ity C.
Furthermore, the phenomenon of induced seismicity in geothermalreservoirs is reported in Iceland (Flóvenz et al., 2015). The stressfield in geothermal or hydrocarbon reservoirs can change significantlydue to depletion and/or reinjection (Segall and Fitzgerald, 1998;Martnez-Garzón et al., 2013). Hence, focal mechanisms of seismicity lo-cated in the vicinity or within active reservoirs are prone to exhibit aperturbed stress state compared to the virgin in-situ stress state. There-fore seismic events which are in spatial and temporal proximity to e.g.dams or geothermal power plants are identified as potentially inducedand are assigned E quality as well.
In addition to single focal mechanism solutions (FMS) or an averageof FMS (FMA), inversions of focal mechanisms (FMF) can be performed(e.g. Gephart and Forsyth, 1984; Angelier, 1984). Generally results frominversions provide high quality (A or B) stress data records (e.g. Keidinget al., 2009; Kristjánsdóttir, 2013). However, the inversions of focalmechanism solutions performed by Bergerat et al. (1998), Garcia et al.(2002), Angelier et al. (2004) and Plateaux et al. (2014)) show the

106 M. Ziegler et al. / Tectonophysics 674 (2016) 101–113
existence of two spatially or temporally different local stress fields. Dueto the high quality of the inversions they are included in the databaseanyway but assigned E quality since these two stress fields cannot bedistinguished.
2.3. Geological indicators
Geological indicators of past fault slip events can also provide infor-mation on the stress state and the data reliability is equal in comparisonto other methods (Sperner et al., 2003). However, to prevent a mix ofpalaeo-stress and contemporary stress data records, geological indica-tors are generally not allowed to be older than Quaternary, i.e. notolder than 2.85 Ma (Zoback, 1992). Sometimes the age of a fault slipor dyke intrusion is measured (e.g. radiocarbon dating), the relativeage deduced by the stratigraphy (e.g. in Bergerat and Angelier, 1998),or the maximum age of the rock is otherwise known (e.g. in Bergeratand Plateaux, 2012). If this is not the case geological maps can provideinformation of the age of the indicators. Note that the rule applies tothe age of the fault slip and not the age of the rock, in case where theycan be distinguished.
In the new Iceland Stress Map a large amount of data records areprovided by geological indicators, i.e. stress tensors inferred from faultslip data. This is due to the extensive work on the stress inversions offault data (GFI) by J. Angelier, F. Bergerat &A. Guðmundsson undertakenin Iceland (e.g. Bergerat et al., 1990; Bergerat et al., 1998; Angelier et al.,2004).
We assessed geological indicators (GFI) following strictly the WSMquality ranking scheme (Heidbach et al., 2010; Sperner et al., 2003).Zoback (1992) discusses thepossible necessity to alter the age restrictionaccording to the tectonic setting. In case two ormore different temporal-ly successive stress states are inferred in the exact same location andboth originate in the Quaternary only the youngest can be taken into ac-count in this compilation (as is the case in e.g. Bergerat and Angelier,1998). In several instances, stress indicators from fault slip data are inclose proximity to similarly oriented stress indicatorswhich are definite-ly from the currently active stress field (e.g. a borehole breakout or focalmechanism solution). Their similar orientation is at least an indicatorthat the age restriction also applies in Iceland. Even though local stressperturbations do occur due to the presence of local structures (Rajabiet al., 2016; Heidbach et al., 2007) hence different SHmax orientations inclose spatial proximity must not be judged as unreliable.
Table 2Newly included volcanic vent and fissure alignments (GVAs) which are also shown in Hjartarsothe age of themost recent eruption of the associated (central) volcano is listed. Number: The amare considered. In case of parallel alignments the standard deviation is calculated according to
Latitude Longitude Azimuth Quality Location
63.43 −20.2 45 C Vestmannaeyjar63.82 −18.83 18 C Eldgjá (South)63.9 −21.8 56 B Reykjanes63.94 −18.65 43 C Eldgjá (Middle)64.1 −18.3 35 C Eldgjá (North)64.25 −18.6 33 B Veiðivötn64.29 −20.84 43 C Þjófahraun64.4 −20.5 47 C Langjökull64.75 −16.6 30 C Kverkfjöll64.8 −17.3 22 B Dyngjuháls65 −17.15 29 C Trölladyngja/Frambruni65.15 −16.6 21 C Askja65.4 −16.8 9 C Fremrinámur65.5 −16.45 8 C Nýjahraun65.6 −16.8 8 B Reykjahlíð65.7 −16.8 6 C Krafla65.9 −16.35 11 C Hólssandur
aThordarson and Larsen (2007), bHaflidason et al. (2000), cSinton et al. (2005), dSigurdsson andSæmundsson (2014).
27
2.4. Vent alignments
Nakamura (1977)) was one of the first to recognise the alignment ofvolcanic vents, eruptive fissures, and dykes (GVAs) as stress indicators.GVAs are always related to volcanic eruptionswhich tend to be easier todate compared to fault slip, since often the age of volcanic eruptions areknown.
Thehigh volcanic activity in Iceland allows inclusion of young eruptivefissures, vent alignments and dykes from the Quaternary. We thereforeincluded 17 GVAs produced by recent volcanic activities (even in historictimes, Thordarson and Larsen, 2007). The data originates in geologicalmapping campaigns and is also displayed in the Geologic Map ofIceland — Bedrock (Hjartarson and Sæmundsson, 2014). Table 2 showsthe stress orientations inferred from eruptive fissures mainly deducedfrom geologic mapping also presented in the map by Hjartarson andSæmundsson (2014). They are quality ranked according to the WSMcriteria shown in Table 3.
2.5. Further stress indicators
In total 25 overcoring (OC) stress measurements are availablethroughout Iceland. Due to their shallow depth (0–30 m) the inferredstress state may be highly influenced by local topography or strengthcontrasts. Therefore the data records are assigned to E quality. Previousdata records from theWSM2008whichwere assigned a different qual-ity according to an outdated version of the ranking scheme wereupdated.
In addition 9 SHmax orientations are available from hydraulic-fracturing (HF). Previously listed HF data records were revisited andassigned a quality according to themost recent quality ranking scheme.
3. Stress map & pattern of Iceland
The new compilation of stress data for Iceland has 495 data recordswith 318 having A–D and 188 A–C quality (Table 4, Figs. 1 & 5). Most ofthe A–D quality data records are from focal mechanism solutions (35%)and geological fault inversions (26%). Borehole related indicators (BOs,DIFs, HFs) have a share of 20% while the alignments of volcanic vents,fissures and craters contribute with 8%. The inversion of several focalmechanism solutions make up 7% of the dataset.
56% of the data records are from the depth range of 0 to 1.25 km(Fig. 5). These are mainly geological stress indicators which are either
n and Sæmundsson (2014). The required information for theWorld Stress Map as well asount of parallel vent/fissure alignments. Vents: The overall number of vents/fissureswhichthe circular statistics of bi-polar data by Mardia (1972).
Number S.D. Vents Type Last eruption/rifting event
1 5 Vents 1973 A.D.a
1 6 Fissures 934–940 A.D.a
4 5 21 Vents 1231 A.D.b
1 5 Fissures 934–940 A.D.a
1 9 Fissures 934–940 A.D.a
4 13 67 Fissures 1477 A.D.a
1 11 Fissures 3600 B.P.c
2 3 10 Vents 950 A.D.c
1 7 Fissures 9000 B.P.b
3 6 28 Fissures 1902–1903 A.D.e
1 8 Fissures 1300 A.D.f
1 14 Vents 1961 A.D.b
1 9 Vents 4000 B.P.d
2 6 16 Fissures 1874–75 A.D.d
4 2 16 Fissures 1975–1984 A.D.a
1 10 Fissures 1975–1984 A.D.a
1 7 Fissures Holoceneg
Sparks (1978), eBjörnsson and Einarsson (1990), fHjartarson (2003), and gHjartarson and
8

Table 3TheWorld StressMapquality ranking schemeversion 2008 for borehole breakouts anddrilling induced fractures from image logs and volcanic vent alignments (Heidbach et al., 2010). S.D.=standard deviation.
Stress indicator ASHmax ±15°
BSHmax ±15–20°
CSHmax ±20–25°
DSHmax ±25–40°
ESHmax N±40°
Boreholebreakouts
≥10 distinct breakout zonesand combined length ≥ 100 min a single well with S.D. ≤ 12°
≥6 distinct breakout zones andcombined length ≥ 40 m in asingle well with S.D. ≤ 20°
≥4 distinct breakouts andcombined length ≥ 20 m withS.D. ≤ 25°
b4 distinct breakouts or b20 mcombined length in a singlewell with S.D. ≤ 40°
Wells withoutreliable breakoutsor S.D. N 40°
Drilling inducedfractures
≥10 distinct fracture zones in asingle well with a combinedlength ≥ 100 m and S.D. ≤ 12°
≥6 distinct fracture zones in asingle well with a combinedlength ≥ 40 m and S.D. ≤ 20°
≥4 distinct fracture zones in asingle well with a combinedlength ≥ 20 m and S.D. ≤ 25°
b4 distinct fracture zones in asingle well or a combinedlength b 20 m and S.D. ≤ 40°
Wells withoutfracture zones orS.D. N 40°
Volcanic ventalignment
≥5 Quaternary ventalignments or “parallel” dikeswith S.D. ≤ 12°
≥3 Quaternary ventalignments or “parallel” dikeswith S.D. ≤ 20°
Single well-exposedQuaternary dike or singlealignment with ≥5 vents
Volcanic alignment inferredfrom b5 vents
107M. Ziegler et al. / Tectonophysics 674 (2016) 101–113
exhumed faults or surface manifestations of the stress field. Most bore-hole indicators are in the same depth range. Even some very shallowfocal mechanism solutions and inversions of several focal mechanismsare located in that depth range. Around 2.5 km depth stress indicatorsfrom deep boreholes and earthquake related indicators are equallyabundant. Below that depth, focal mechanism solutions of seismicevents are the only available stress indicators. The peak of eventsaround 10 km is artificial becausemany focalmechanisms of smallmag-nitude seismic events are assigned this depth as a default value if thedepth cannot be estimated otherwise.
Some stress indicators (e.g. focal mechanism solutions, fault inver-sions) allow characterisation of the Andersonian faulting type of thestress field (Anderson, 1905; Anderson, 1951). The method to derivethe type of faulting is described by (Zoback, 1992). Fig. 5 shows thatnormal faulting prevails at the surface. However, within the firstkilometre this changes. In the following topmost 10 km a strike slip re-gime is dominant. With a further increase in depth the normal faultingregime prevails. Indicators for a reverse faulting regime are observed inall depths in a relatively small abundance. Nevertheless, around 1 kmand 10 km depth they have a significant share.
The prevailing orientation of SHmax in Iceland inferred from A–Cquality ranked data records is determined according to circular statisticsof bipolar data (Mardia, 1972) which shows amean SHmax orientation of18°±35° for the entire dataset. A closer look at Fig. 1 demonstrates fourpredominant regional orientations of SHmax. In the Southwest and theSouthern Iceland Lowlands SHmax is oriented approximately NE–SW(Fig. 6). In theNorthern Volcanic Zone (north of the Vatnajökull glacier)which is presently the active rift zone, SHmax has almost N–S orientation(Fig. 7). SHmax is rotated by about 20° to NNE–SSW in the easternmostpart of Iceland (Fig. 7). In Northern Iceland SHmax is rotated from theN–S orientation in the Northern Volcanic Zone to a predominantNNW–SSE orientation (Fig. 8). Finally in the Westfjords the SHmax
trend is approximately NW–SE oriented (Fige. 9). For these four subsets
Table 4An overview of the quality and type of all stress indicators in the designated area (N: 62°–68°, W: 11°–26°). They include the revisited and re-ranked data from the WSM 2008 aswell as the newly analysed data from acoustic image logs, the alignments of volcanic cra-ters and fissures, and data records from literature research.
Quality
A B C D E Total
Type FMF 15 7 – – 14 36FMS – – 63 22 90 175FMA – – – 9 – 9BO – – 6 13 30 49DIF 1 3 1 15 1 21HF – 1 2 6 – 9OC – – – – 25 25GFI 1 11 40 63 14 129GVA 1 11 25 2 3 42Total 18 33 137 130 177 495
279
the standard deviation for A–D quality data is between 19° and 29°which is comparable to other regional stress investigations (e.g.Pierdominici and Heidbach, 2012; Reiter et al., 2014; Reinecker et al.,2010).
Generally the standard deviation of the mean SHmax orientation ofstress data records with A–C quality is found to be within ±25° (seerose diagrams in Figs. 1, 6–9). If D quality data records are includedthe mean SHmax orientation changes by ≤4°. The standard deviation in-creases by approximately 5° reflecting that D quality data introducesmore noise to the dataset. Therefore D quality data should not be usedindividually for a local stress field analysis. Surprisingly the standard de-viation decreases by 1° with the introduction of 11 D quality data re-cords in North Iceland. 10 of these data records are from boreholesand their quality depends on the short length of the feature and/ormiss-ing information on the standard deviation. These circumstances showthat awell-picked distinct single feature in a borehole provides valuableinformation on the orientation of SHmax.
The types of available stress indicators varies in the different subsets.While all types of indicators are represented close to the plate boundary,in the Westfjords and Eastfjords the stress state is mainly derived fromgeological indicators and boreholes. That means that in those regionsthe information on the stress field is based mainly on shallow data.
Apart from lateral variations of the orientation of SHmax, the possibil-ity of a vertical layering exists (Cornet and Röckel, 2012; Gudmundsson,2002; Heidbach et al., 2007). In some regions, mainly sedimentary ba-sins, moderate (Reiter et al., 2014; Reiter and Heidbach, 2014) or signif-icant (Röckel and Lempp, 2003; Roth and Fleckenstein, 2001; Rajabiet al., 2016) stress rotations occur with depth. For example, Rajabiet al. (2016) reported significant rotation of the SHmax orientation withdepth in the Clarence-Moreton Basin of eastern Australia due to pres-ence of geological structures including intrusions of igneous rocks intosedimentary successions.
It is indicated by the propagation of dykes, that such a layering alsoexists in Iceland on a local scale (Gudmundsson, 2002; Gudmundsson,2003). To find regional-scale depth-dependent differences in the SHmax
orientationwe compiled surface data (GFI, GVA) aswell as intermediate(0.2–2 km) borehole indicators (BO, DIF) and deep (2–20 km) focalmechanism solutions (Fig. 5). In all areas where more than one type ofindicator is available, the orientation of SHmax remains consistent withdepthwhichhighlights the independence from the type of stress indica-tor and the vertical homogeneity of SHmax throughout the crust. Thus apotential regional-scale depth-dependency of SHmax is not observed.
4. Discussion
This study presents thefirst comprehensive and systematic compila-tion of the present-day tectonic stress in Iceland where all results areranked based on a quality ranking scheme for the in-situ stress state.A high density of data records is achieved on the Reykjanes peninsula,in South Iceland, East Iceland, and the Akureyri area and TjörnesFracture Zone in North Iceland (Fig. 1). Few or no data records are

100
0
2.5
5
7.5
10
12.5
15
17.5
20
Dep
th [k
m]
Dep
th [k
m]
0 %255075
Number of indicators A-D0 50 100 150 200 250
0
2.5
5
7.5
10
12.5
15
17.5
20
FMSFMFBO/DIF/HFGVAGFI
NormalMethod: Regime:
Strike-Slip
Reverse
Fig. 5. The depth distribution of the 318 stress indicators (A–D quality) is displayed here. The cluster of seismic events around a depth of 10 km is biased sincemany of the events with anuncertain depthwere assigned this depth arbitrarily. The data is colour coded according to the type of the indicator. Thewidth of the bar indicates the quality of the data fromA (thick/left)to D (thin/right). Please note that the colour coding is independent of the width of the bar in this plot. In addition the variation of the stress regimewith depth is shown on the right side.(For interpretation of the references to colour in this figure legend, the reader is referred to the web version of this article.)
108 M. Ziegler et al. / Tectonophysics 674 (2016) 101–113
available aroundHofsjökull, Langjökull in thewesternHighlands, on theSnæfellsnes peninsula, and in theWestfjords (Fig. 1). Based on the avail-able data from this compilation the orientation of the maximum com-pressive stress (SHmax) in Iceland is organised in four subsets and isconsistent with themain plate boundaries in the region. This highlightsthe role of different plate boundary forces in the stress pattern of Iceland(Fig. 10). Furthermore the highly dynamic geological setting of Icelandis reflected in the stress field by effects of eruptions, geothermal activity,and rifting events.
4.1. Regional stress pattern
In the South-West a ridge parallel SHmax orientation can be observedalong the Reykjanes Ridge (Fig. 1) which has the Eurasian plate to the
RPR
Reykjavík
−23°
Iceland
SHmax: 36 ± 23Quality: A-CN = 73
SHmax: Qua
Fig. 6. The orientation of SHmax (A–D quality) on the Reykjanes peninsula ridge (RPR), the tranLegend is the same as in Fig. 1.
28
East and the North American plate to the West (Einarsson, 2008; Bird,2003). At the Reykjanes peninsula where the ridge makes landfallSHmax remains mostly ridge parallel (Figs. 1 & 6). This pattern of SHmax
is consistent with observations by e.g. Sykes (1967) and Wiens andStein (1984) who show ridge parallel SHmax close to the spreading cen-tre along divergent plate boundaries in general and especially in theIndian Ocean.
Ridge parallel stress is also indicated further to the North along theWVZ (Fig. 1). The western boundary of the Hreppar microplate is atthe WVZ and its northern boundary is the quietest Central Iceland Vol-canic Zone (CIVZ) which is not represented by stress indicators here(Einarsson, 2008).
In the South the Hreppar microplate meets the Eurasian plate at thetransform SISZ (Einarsson, 2008). This is one of the two areas with the
0 50
km
SISZ
WVZ
Hella
Vestmannaeyjar
−20° −19°
63.5°
64°
38 ± 29lity: A-DN = 126
sform South Iceland Seismic Zone (SISZ), and parts of the Western Volcanic Zone (WVZ).
0

−17˚ −16˚ −15˚
64.5˚
65˚
65.5˚
66˚
66.5˚
0 20 40
km
Egilsstaðir
Höfn
SHmax: 9 ± 19Quality: A-CN = 36
SHmax: 8 ± 25Quality: A-D
N = 78
Iceland
Fig. 7. The orientation of SHmax (A–D quality) in the Eastern Highlands/Northern Volcanic Zone and the East Fjords. Legend is the same as in Fig. 1. Note that mainly surface geologicalindicators are available in this area.
109M. Ziegler et al. / Tectonophysics 674 (2016) 101–113
largest seismic events (M= 7.2) in Iceland (e.g. Stefánsson et al., 2000;Bergerat and Angelier, 2001). In the SISZ the SHmax is NNE to NE (Fig. 6)which is consistent with the surface ruptures of large earthquakes (e.g.Árnadóttir et al., 2003; Einarsson, 2008).
In the North-East of the SISZ the EVZ and the NVZ are the currentlyactive rift zones (Einarsson, 2008). Most of the rifting events (Laki,Eldgjá, Krafla fires, Holuhraun) and volcanic eruptions (Grimsvötn,Gjálp, Askja, Hekla, Barðabunga) are in these two zones (Sigmundssonet al., 2015; Thordarson and Larsen, 2007). This activity is related tothe current location of the centre of the hotspot which is consideredto be beneath the Vatnajökull glacier at the transition from the EVZ tothe NVZ (e.g. Wolfe et al., 1997; Ito et al., 2003), Fig. 10). The SHmax isfound to follow the orientation of the EVZ and NVZ which are consid-ered as the plate boundary from NE–SW in the South to N–S in theNorth (Fig. 1). This pattern is also observed at some distance along theIcelandic east coast (Fig. 7).
281
In the North, the TFZ connects the NVZ with the Kolbeinsey Ridgenorth of Iceland (Sæmundsson, 1974; Sæmundsson, 1979; Einarsson,1991; Garcia, 2003; Stefánsson et al., 2008). The spreading is distributedbetween the Dalvík Zone (DZ), the Húsavík-Flatey-Zone (HFZ) and theGrimsey Oblique Rift (GOR) (Sæmundsson, 1974). This is the secondarea with large magnitude seismic events in Iceland (Jakobsdóttir,2008) and shows a NNW–SSE trend for the SHmax orientation which ismainly inferred from focal mechanism solutions (Fig.8).
In the Westfjords which are the oldest part of Iceland (10–16 Ma,Moorbath et al., 1968; McDougall et al., 1984) and also partly on theSnæfellsnes peninsula a rotation of SHmax from ridge parallel towardsridge perpendicular is observed (Figs. 9 & 1). This rotation is interpretedas the transition from the ridge parallel stress orientation to the com-mon intraplate stress orientation (Wiens and Stein, 1984; Sykes, 1967;Sykes and Sbar, 1974; Müller et al., 1992; Grünthal and Stromeyer,1992; Gudmundsson et al., 1996). This rotation is expected in some

HFZ
GOR
DZ
65.5˚
66˚
66.5˚
−20˚ −19˚ −18˚ −17˚
Sauðárkrókur
Húsavík
Akureyri
0 20 40
km
Iceland
SHmax: 155 ± 22Quality: A-CN = 28
SHmax: 151 ± 21
Quality: A-DN = 39
Fig. 8. The orientation of SHmax (A–D quality) in Northern Iceland. Displayed is the Tjörnes Fracture Zone with the Grimsey oblique rift (GOR), the Húsavík-Flatey-Zone (HFZ), and theDalvík Zone (DZ). Legend is the same as in Fig. 1.
66˚
65.5˚
−24˚ −23˚ −22˚ −21˚ −20˚
SHmax: 136 ± 12Quality: A-CN = 4
SHmax: 137 ± 17Quality: A-D
N = 18
ður
ðurHólmavík
0 50
km
Iceland
Fig. 9. The orientation of SHmax (A–D quality) in theWestfjords. In the oldest area of Iceland (10–16 Ma, Moorbath1968, McDougall1984) SHmax is rotated from rift parallel to rift normal.Legend is the same as in Fig. 1. Note that only surface geological indicators are available in this area.
110 M. Ziegler et al. / Tectonophysics 674 (2016) 101–113
282

KR
GORHFZ
NVZ
EVZ
WVZ
SISZ
RPR
RR
DZ
North American Plate
Eurasian Plate
HrepparPlate
Plate motion
SHmax
orientation
0 100
km
20.2
19.9
19.3
18.9
Fig. 10.A simplified tectonicmapof Icelandwith themean orientations of SHmax in the fourstress provinces estimated from A–D quality data records (black lines). The standard devi-ation from A–C quality is shown by the large dark grey areas while the light grey areasshow the standard deviation from A–D quality. The plate boundaries are from Einarsson(2008) & Bird (2003)). The plate motion (mm/yr) is indicated by black arrows relativeto the fixed North American plate (Geirsson et al., 2006). The continental plates and theapproximate location of the hotspot (grey circle,Wolfe et al., 1997) are indicated. Further-more the tectonic features are labelled as follows according to Einarsson (2008): RR:Reykjanes Ridge, RPR: Reykjanes peninsula ridge, WVZ: Western Volcanic Zone, SISZ:South Iceland Seismic Zone, EVZ: Eastern Volcanic Zone, NVZ: Northern Volcanic Zone,DZ: Dalvík Zone, HFZ: Húsavík-Flatey-Zone, GOR: Grimsey-Oblique-Ridge, and KR:Kolbeinsey Ridge.
111M. Ziegler et al. / Tectonophysics 674 (2016) 101–113
distance from the spreading centre which depends mainly on the com-position of the rock and only partly on the age and distance from theridge (Wiens and Stein, 1984). Such a rotation is also expected tooccur off the Icelandic east coast to meet the overall trend of SHmax ob-served in Europe (e.g. Grünthal and Stromeyer, 1992; Müller et al.,1992; Heidbach et al., 2007).
Many of the stress indicators recognised in the applied quality rank-ing, e.g. focal mechanism solutions or borehole breakouts, are manifes-tations of a stress field which generally can be assumed as the currentlyactive in-situ stress field. Still, seismic events and volcanic eruptionsmay change the local stress field in a very short time interval (e.g.Reasenberg and Simpson, 1992; King et al., 1994; Dieterich et al.,2000). Albeit, these changes induced by seismic events are generallysmaller than the regional stress magnitude (Hardebeck, 2010). Hencethey are assumed to be within the uncertainty of SHmax ±15° of eventhe highest quality stress indicators. As well the isostatic reboundfromdeglaciation is not expected to have an immediate impact on stressorientation (Plateaux et al., 2014).
4.2. Comparison with other observations
A comparison of the orientation of SHmax with the direction of platemotion (Geirsson et al., 2006) shows that they are in quite large areasperpendicular to each other (Fig. 10). In a more local study (Keidinget al., 2009) compared the stress and strain in the Reykjanes peninsula.The stress is determined from the inversion of focal mechanism fromearthquake swarms while the strain is derived from GPS data. Keidinget al. (2009) conclude that theminimumhorizontal stress Shmin is paral-lel to the maximum horizontal strain _∈Hmax. This also holds for detailedGPS data provided by Árnadóttir et al. (2009). In the Westfjords the
283
orientation of SHmax is sub-parallel to the plate motion (Fig. 9 andÁrnadóttir et al., 2009, Figs. 3 & 4).
Extensive maps of surface fissure swarms are available for Iceland(e.g. Gudmundsson, 1987; Clifton and Kattenhorn, 2006; Hjartardóttiret al., 2009; Einarsson, 2010; Hjartardottir et al., 2015). Even thougheruptive fissures can be used as stress indicators, surfacefissure swarmsdo not provide information on the stress field but on the deformation(Hjartardottir et al., 2015). The fissure swarms are very similarly orient-ed to the orientation of the SHmax. Especially in the NVZ the orientationof the fissure swarms are well in agreement with eruptive fissures andother stress indicators (e.g. Hjartardottir et al., 2015).
5. Conclusion
In this paper we present the first comprehensive and quality rankedcompilation of the contemporary stress data in Iceland including theanalysis of image logs from 57 geothermal boreholes. In total we com-piled 495 SHmax orientations from different stress indicators. The maincontributions to the newly compiled database are from171 surface geo-logical information, 61 geothermalwells (intermediate-depth), and 175indicators from focal mechanism solutions of earthquakes (deep). Thetwo key findings of this compilation are: (1) no significant depth-dependent variation in the SHmax orientation (±25°) is observed whilethe stress regime changes with depth. (2) four distinct contemporarystress provinces are present in Iceland. The stress provinces are in agree-ment with the large-scale regional tectonic setting.
Acknowledgement
The authors would like to thank Romain Plateaux and two anony-mous reviewers for their comments which significantly improved themanuscript. Furthermore the authors would like to thank OrkuveitaReykjavíkur, RARIK, Norðurorka, Landsvirkjun, HS Orka, andSkagafjarðarveitur for the permission to publish the televiewer data.The research leading to these results has received funding from theEuropean Community's Seventh Framework Programme under grantagreement No. 608553 (Project IMAGE). With respect to this we liketo thank David Bruhn and Ólafur G. Flóvenz. The maps are generatedwith CASMI (Heidbach and Höhne, 2008) and GMT (Wessel et al.,2013) with topographic data from ETOPO1 (Amante and Eakins,2009) and bathymetric data from the GEBCO_2014 Grid, www.gebco.net. We also would like to thank Kristján Sæmundsson and MaryamKhodayar who read the manuscript as well as John Reinecker andSebastian Specht for their support in technical issues. Mojtaba Rajabi’scontribution forms TRaX record #344.
Appendix A. Supplementary data
Supplementary data to this article can be found online at http://dx.doi.org/10.1016/j.tecto.2016.02.008.
References
Aadnoy, B.S., 1990. Inversion technique to determine the in-situ stress field from fractur-ing data. J. Pet. Sci. Eng. 4, 127–141.
Aadnoy, B., Bell, J., 1998. Classification of drilling-induced fractures and their relationshipto in-situ stress directions. Log. Anal. 27–42.
Allen, R.M., Nolet, G., Morgan, W.J., Vogfjörd, K., Nettles, M., Ekström, G., Bergsson, B.H.,Erlendsson, P., Foulger, G., Jakobsdóttir, S., Julian, B.R., Pritchard, M., Ragnarsson, S.,Ragnar, S., 2002. Plume-driven plumbing and crustal formation in Iceland. Journalof Geophysical Research: Solid Earth (1978–2012) 107, ESE–4.
Amante, C., Eakins, B., 2009. ETOPO1 1 Arc-Minute Global Relief Model: Procedures, DataSources and Analysis. NOAA Technical Memorandum NESDIS NGDC-24. NationalGeophysical Data Center, NOAA.
Anderson, E., 1905. The dynamics of faulting. Trans. Edinb. Geol. Soc. 8, 387–402.Anderson, E., 1951. The dynamics of faulting. Oliver and Boyd, Edinburgh. 2 ed.Andrew, R.E., Gudmundsson, A., 2008. Volcanoes as elastic inclusions: their effects on the
propagation of dykes, volcanic fissures, and volcanic zones in Iceland. J. Volcanol.Geotherm. Res. 177, 1045–1054.
Angelier, J., 1984. Tectonic analysis of fault slip data sets. J. Geophys. Res. 89, 5835.

112 M. Ziegler et al. / Tectonophysics 674 (2016) 101–113
Angelier, J., Slunga, R., Bergerat, F., Stefánsson, R., Homberg, C., 2004. Perturbation of stressand oceanic rift extension across transform faults shown by earthquake focal mech-anisms in Iceland. Earth Planet. Sci. Lett. 219, 271–284.
Angelier, J., Bergerat, F., Stefánsson, R., Bellou, M., 2008. Seismotectonics of a newlyformed transform zone near a hotspot: earthquake mechanisms and regional stressin the South Iceland seismic zone. Tectonophysics 447, 95–116.
Árnadóttir, T., Jónsson, S., Pedersen, R., Gudmundsson, G.B., 2003. Coulomb stress changesin the South Iceland seismic zone due to two large earthquakes in June 2000.Geophys. Res. Lett. 30, 1205.
Árnadóttir, T., Lund, B., Jiang, W., Geirsson, H., Björnsson, H., Einarsson, P., Sigurdsson, T.,2009. Glacial rebound and plate spreading: results from the first countrywide GPSobservations in Iceland. Geophys. J. Int. 177, 691–716.
Ásmundsson, R., Pezard, P., Sanjuan, B., Henninges, J., Deltombe, J.L., Halladay, N., Lebert,F., Gadalia, A., Millot, R., Gibert, B., Violay, M., Reinsch, T., Naisse, J.M., Massiot, C.,Azas, P., Mainprice, D., Karytsas, C., Johnston, C., 2014. High temperature instrumentsand methods developed for supercritical geothermal reservoir characterisation andexploitation — the HiTI project. Geothermics 49, 90–98.
Barth, A., Reinecker, J., Heidbach, O., 2008. Stress derivation from earthquake focal mech-anisms. Technical Report. World Stress Map Project.
Batir, J., 2011. Stress Field Characterization of the Hellisheiði Geothermal Field and Possi-bilities to Improve Injection Capabilities Master thesis RES — The School for Renew-able Energy Science.
Bell, J., 1996. In situ stresses in sedimentary rocks (part 1): measurement techniques.Geosci. Can. 23.
Bell, J., Gough, D., 1979. Northeast-southwest compressive stress in Alberta — evidencefrom oil wells. Earth Planet. Sci. Lett. 45, 475–482.
Bergerat, F., Angelier, J., 1998. Fault systems and paleostresses in the vestfirdir peninsula.relationships with the tertiary paleo-rifts of skagi and snaefells (Northwest Iceland).Geodin. Acta 11, 105–118.
Bergerat, F., Angelier, J., 2001. Mechanisms of the faults of 17 and 21 June 2000 earth-quakes in the South Iceland seismic zone from the surface traces of the árnes andhestfjall faults. Comptes Rendus de l'Académie des Sciences - Series IIA - Earth andPlanetary Science. 333, pp. 35–44.
Bergerat, F., Plateaux, R., 2012. Architecture and development of (Pliocene to Holocene)faults and fissures in the East Volcanic zone of Iceland. Compt. Rendus Geosci. 344,191–204.
Bergerat, F., Angelier, J., Villemin, T., 1990. Fault systems and stress patterns on emergedoceanic ridges: a case study in Iceland. Tectonophysics 179, 183–197.
Bergerat, F., Gudmundsson, A., Angelier, J., Rögnvaldsson, S., 1998. Seismotectonics of thecentral part of the South Iceland seismic zone. Tectonophysics 298, 319–335.
Bird, P., 2003. An updated digital model of plate boundaries. Geochem. Geophys. Geosyst.4, 1–52.
Bjarnason, I.T., Einarsson, P., 1991. Source mechanism of the 1987 Vatnafjöll earthquakein South Iceland. J. Geophys. Res. 96, 4313–4324.
Björnsson, H., Einarsson, P., 1990. Volcanoes beneath Vatnajökull, Iceland: evidence fromradio echo-sounding, earthquakes and jökulhlaups. Jökull 22.
Célérier, B., 2010. Remarks on the relationship between the tectonic regime, the rake ofthe slip vectors, the dip of the nodal planes, and the plunges of the P, B, and T axesof earthquake focal mechanisms. Tectonophysics 482, 42–49.
Centre, G.D., 1993. GEOFON Seismic Network. Other/Seismic Network.Clifton, A.E., Kattenhorn, S.A., 2006. Structural architecture of a highly oblique divergent
plate boundary segment. Tectonophysics 419, 27–40.Cornet, F.H., Röckel, T., 2012. Vertical stress profiles and the significance of ”stress
decoupling”. Tectonophysics 581, 193–205.Dieterich, J., Cayol, V., Okubo, P., 2000. The use of earthquake rate changes as a stress
meter at Kilauea volcano. Nature 408, 457–460.Dziewonski, A.M.M., Chou, T.A., Woodhouse, J.H., 1981. Determination of earthquake
source parameters from waveform data for studies of global and regional seismicity.J. Geophys. Res. 86, 2825.
Einarsson, P., 1979. Seismicity and earthquake focal mechanisms along the mid-Atlantic plate boundary between Iceland and the Azores. Tectonophysics 55,127–153.
Einarsson, P., 1987. Compilation of earthquake fault plane solutions in the North Atlanticand Arctic Oceans. Recent Plate Movements and Deformation, pp. 47–62.
Einarsson, P., 1991. Earthquakes and present-day tectonism in Iceland. Tectonophysics189, 261–279.
Einarsson, P., 2008. Plate boundaries, rifts and transforms in Iceland. Jökull 35–58.Einarsson, P., 2010. Mapping of Holocene surface ruptures in the South Iceland seismic
zone. Jökull 60, 121–138.Einarsson, P., Klein, F., Björnsson, S., 1977. The Borgarfjördur earthquakes of 1974 inWest
Iceland. Bull. Seismol. Soc. Am. 67, 187–208.Ekström, G., 1994. Anomalous earthquakes on volcano ring-fault structures. Earth Planet.
Sci. Lett. 128, 707–712.Ekström, G., Nettles, M., Dziewonski, A., 2012. The Global CMT Project 2004–2010:
centroid-moment tensors for 13,017 earthquakes. Phys. Earth Planet. Inter.200-201, 1–9.
Flóvenz, Ó.G., Ágústsson, K., Guðnason, E.Á., Kristjánsdóttir, S., 2015. Reinjection and in-duced seismicity in geothermal fields in Iceland. Proceedings World GeothermalCongress 2015, Melbourne, Australia, pp. 1–15.
Forslund, T., Gudmundsson, A., 1991. Crustal spreading due to dikes and faults in South-west Iceland. J. Struct. Geol. 13, 443–457.
Garcia, S., 2003. Implications d'un Saut de Rift et Du Fonctionnement d'une ZoneTransformante Sur les Deformations Du Nord de l'Islande (Phd-thesis) UniversitéPierre et Marie Curie.
Garcia, S., Dhont, D., 2005. Structural analysis of the Húsavík-flatey transform fault and itsrelationships with the rift system in Northern Iceland. Geodin. Acta 18, 31–41.
28
Garcia, S., Angelier, J., Bergerat, F., Homberg, C., 2002. Tectonic analysis of an oceanictransform fault zone based on fault-slip data and earthquake focal mechanisms: theHúsavík-flatey fault zone, Iceland. Tectonophysics 344, 157–174.
Geirsson, H., Árnadóttir, T., Völksen, C., Jiang, W., Sturkell, E., Villemin, T., Einarsson, P.,Sigmundsson, F., Stefánsson, R., 2006. Current plate movements across the mid-Atlantic Ridge determined from 5 years of continuous GPS measurements inIceland. J. Geophys. Res. 111, B09407.
Gephart, J.W., Forsyth, D.W., 1984. An improved method for determining the regionalstress tensor using earthquake focal mechanism data: application to the SanFernando earthquake sequence. J. Geophys. Res. 89, 9305.
Green, R.G.,White, R.S., Greenfield, T., 2014. Motion in the North Iceland volcanic rift zoneaccommodated by bookshelf faulting. Nat. Geosci. 7, 29–33.
Grünthal, G., Stromeyer, D., 1992. The recent crustal stress field in central Europe:trajectories and finite element modeling. J. Geophys. Res. 97, 11805–11820.
Gudmundsson, A., 1987. Tectonics of the Thingvellir fissure swarm, SW Iceland. J. Struct.Geol. 9, 61–69.
Gudmundsson, A., 1995. Infrastructure and mechanics of volcanic systems in Iceland.J. Volcanol. Geotherm. Res. 64.
Gudmundsson, A., 2002. Emplacement and arrest of sheets and dykes in centralvolcanoes. J. Volcanol. Geotherm. Res. 116, 279–298.
Gudmundsson, A., 2003. Surface stresses associated with arrested dykes in rift zones. Bull.Volcanol. 65, 606–619.
Gudmundsson, A., 2006. How local stresses control magma-chamber ruptures, dyke in-jections, and eruptions in composite volcanoes. Earth Sci. Rev. 79, 1–31.
Gudmundsson, A., Bergerat, F., Angelier, J., Villemin, T., 1992. Extensional tectonics ofSouthwest Iceland. Bull. Soc. Geol. Fr. 163, 561–570.
Gudmundsson, A., Bergerat, F., Angelier, J., 1996. Off-rift and rift-zone palaeostresses inNorthwest Iceland. Tectonophysics 255, 211–228.
Haflidason, H., Eiriksson, J., Kreveld, S.V., 2000. The tephrochronology of Iceland and theNorth Atlantic region during the middle and late quaternary: a review. J. Quat. Sci.15, 3–22.
Hagos, L., Shomali, H., Lund, B., Böðvarsson, R., Roberts, R., 2008. An application of relativemoment tensor inversion to aftershocks of the June 1998 hengill earthquake inSouthwest Iceland. Bull. Seismol. Soc. Am. 98, 636–650.
Haimson, B., Rummel, F., 1982. Hydrofracturing stress measurements in the Icelandresearch drilling project drill hole at Reyðarfjörður, Iceland. J. Geophys. Res. 87,6631–6649.
Haimson, B., Voight, B., 1977. Crustal stress in Iceland. Pageoph 115, 153–190.Hardebeck, J., 2010. Aftershocks are well aligned with the background stress field, contra-
dicting the hypothesis of highly heterogeneous crustal stress. J. Geophys. Res. 115,B12308.
Hast, N., 1969. The state of stress in the upper part of the earth's crust. Tectonophysics 8,169–211.
Heidbach, O., Höhne, J., 2008. CASMI — A visualization tool for the World stress map da-tabase. Comput. Geosci. 34, 783–791.
Heidbach, O., Reinecker, J., Tingay, M., Müller, B., Sperner, B., Fuchs, K., Wenzel, F., 2007.Plate boundary forces are not enough: second- and third-order stress patternshighlighted in the World stress map database. Tectonics 26, 1–19.
Heidbach, O., Tingay, M., Barth, A., Reinecker, J., Kurfeß, D., Müller, B., 2008. The 2008 Re-lease of the World Stress Map.
Heidbach, O., Tingay, M., Barth, A., Reinecker, J., Kurfeß, D., Müller, B., 2010. Global crustalstress pattern based on the World stress map database release 2008. Tectonophysics482, 3–15.
Hjartardóttir, Á.R., Einarsson, P., Sigurdsson, H., 2009. The fissure swarm of the askjavolcanic system along the divergent plate boundary of N Iceland. Bull. Volcanol. 71,961–975.
Hjartardottir, A.R., Einarsson, P., Magnusdottir, S., Bjornsdottir, T., Brandsdottir, B., 2015.Fracture Systems of the Northern Volcanic Rift Zone, Iceland: an onshore part ofthe Mid-Atlantic Plate Boundary. Geological Society. Special Publications, London.
Hjartarson, Á., 2003. Postglacial lava production in Iceland. The Skagafjörður unconformi-ty, North Iceland, and its geological history. Geological Museum. University of Copen-hagen, Copenhagen, pp. 95–108 PhD thesis.
Hjartarson, Á., Sæmundsson, K., 2014. GeologicMap of Iceland. Bedrock. 1: 600 000. Tech-nical Report. Iceland GeoSurvey.
Ito, G., Lin, J., Graham, D., 2003. Observational and theoretical studies of the dynamics ofmantle plume-mid-ocean ridge interaction. Rev. Geophys. 41, 1017.
Jakobsdóttir, S., 2008. Seismicity in Iceland: 1994–2007. Jökull (1994–2007).Jakobsdóttir, S., Gudmundsson, G., Stefánsson, R., 2002. Seismicity in Iceland 1991–2000
monitored by the SIL seismic system. Jökull 87–94.Jakobsson, S., 1979. Petrology of recent basalts of the Eastern Volcanic zone. Iceland. Acta
Natiuralia Islandica 26.Jefferis, R., Voight, B., 1981. Fracture analysis near the mid-ocean plate boundary,
Reykjavík-Hvalfjörður area, Iceland. Tectonophysics 76, 171–236.Jóhannesson, H., Sæmundsson, K., 1998. Geological map of Iceland, 1:500,000. Bedrock
Geology. Technical Report. Icelandic Institute of Natural History and Icelandic Geo-detic Survey, Reykjavík.
Keiding, M., Lund, B., Árnadóttir, T., 2009. Earthquakes, stress, and strain along an oblique-ly divergent plate boundary: Reykjanes peninsula, Southwest Iceland. J. Geophys. Res.114, B09306.
Khodayar, M., Franzson, H., 2007. Fracture pattern of Thjórsárdalur central volcano withrespect to rift-jump and a migrating transform zone in South Iceland. J. Struct. Geol.29, 898–912.
King, G., Stein, R., Lin, J., 1994. Static stress changes and the triggering of earthquakes. Bull.Seismol. Soc. Am. 84, 935–953.
Kirsch, E.G., 1898. Die theorie der Elastizität und die Bedürfnisse der festigkeitslehre.Z. Ver. Dtsch. Ing. 42, 797–807.
4

113M. Ziegler et al. / Tectonophysics 674 (2016) 101–113
Kristjánsdóttir, S., 2013. Microseismicity in the Krýsuvk Geothermal Field, SW Iceland,from May to October 2009 (Master thesis) University of Iceland.
Lawver, L., Müller, R., 1994. Iceland hotspot track. Geology 22, 311–314.Ljunggren, C., Chang, Y., Janson, T., Christiansson, R., 2003. An overview of rock stress
measurement methods. Int. J. Rock Mech. Min. Sci. 40, 975–989.Lund, B., Bödvarsson, R., 2002. Correlation of microearthquake body-wave spectral ampli-
tudes. Bull. Seismol. Soc. Am. 92, 2419–2433.Lund, B., Slunga, R., 1999. Stress tensor inversion using detailed microearthquake infor-
mation and stability constraints: application to ölfus in Southwest Iceland.J. Geophys. Res. 104, 14947.
Mardia, K., 1972. Statistics of Directional Data: Probability and Mathematical Statistics.Academic Press, London.
Martnez-Garzón, P., Bohnhoff, M., Kwiatek, G., Dresen, G., 2013. Stress tensor changes re-lated to fluid injection at the geysers geothermal field. Calif. Geophys. Res. Lett. 40,2596–2601.
Mastin, L., 1988. Effect of borehole deviation on breakout orientations. J. Geophys. Res. 93,9187.
McDougall, I., Kristjánsson, L., Sæmundsson, K., 1984. Magnetostratigraphy and geochro-nology of Northwest Iceland. J. Geophys. Res. 89, 7029–7060.
McKenzie, D., 1969. The relation between fault plane solutions for earthquakes and thedirections of the principal stresses. Bull. Seismol. Soc. Am. 59, 591–601.
Moorbath, S., Sigurdsson, H., Goodwin, R., 1968. K–Ar ages of the oldest exposed rocks inIceland. Earth Planet. Sci. Lett. 4, 197–205.
Müller, B., Zoback, M., Fuchs, K., 1992. Regional patterns of tectonic stress in Europe.J. Geophys. Res. Solid Earth 97, 11783–11803.
Nakamura, K., 1977. Volcanoes as possible indicators of tectonic stress orientation —principle and proposal. J. Volcanol. Geotherm. Res. 2, 1–16.
Nettles, M., Ekström, G., 1998. Faulting mechanism of anomalous earthquakes nearBarðabunga volcano, Iceland. J. Geophys. Res. 103, 17973–17983.
Peška, P., Zoback, M.D., 1995. Compressive and tensile failure of inclined well bores anddetermination of in situ stress and rock strength. J. Geophys. Res. 100, 12791.
Pierdominici, S., Heidbach, O., 2012. Stress field of Italy — mean stress orientation at dif-ferent depths and wave-length of the stress pattern. Tectonophysics 532–535,301–311.
Plateaux, R., Bergerat, F., Béthoux, N., Villemin, T., Gerbault, M., 2012. Implications of frac-turing mechanisms and fluid pressure on earthquakes and fault slip data in the EastIceland rift zone. Tectonophysics 581, 19–34.
Plateaux, R., Béthoux, N., Bergerat, F., Mercier de Lépinay, B., 2014. Volcano-tectonic inter-actions revealed by inversion of focal mechanisms: stress field insight around and be-neath the Vatnajökull ice cap in Iceland. Front. Earth Sci. 2, 1–21.
Ragnarsson, Á., 2015. Geothermal development in Iceland 2010–2014. ProceedingsWorldGeothermal Congress 2015, Melbourne, p. 15.
Rajabi, M., Tingay, M., King, R., Heidbach, O., 2016. Present-day stress orientation in theClarence-Moreton Basin of New South Wales, Australia: a new high density datasetreveals local stress rotations. Basin Res.
Reasenberg, P.A., Simpson, R.W., 1992. Response of regional seismicity to the static stresschange produced by the Ioma Prieta earthquake. Science 255, 1687–1690.
Reinecker, J., Tingay, M., Müller, B., Heidbach, O., 2010. Present-day stress orientation inthe Molasse Basin. Tectonophysics 482, 129–138.
Reiter, K., Heidbach, O., 2014. 3-D geomechanical-numerical model of the contemporarycrustal stress state in the Alberta Basin (Canada). Solid Earth 5, 1123–1149.
Reiter, K., Heidbach, O., Schmitt, D., Haug, K., Ziegler, M., Moeck, I., 2014. A revised crustalstress orientation database for Canada. Tectonophysics 636, 111–124.
Richardson, R.M., 1992. Ridge forces, absolute plate motions, and the intraplate stressfield. J. Geophys. Res. 97, 11739.
Röckel, T., Lempp, C., 2003. Der Spannungszustand im norddeutschen becken. ErdölErdgas Kohle 119, 73–80.
Rögnvaldsson, S., Slunga, R., 1994. Single and joint fault plane solutions for microearth-quakes in South Iceland. Tectonophysics 237, 73–80.
Roman, D.C., Moran, S., Power, J., Cashman, K., 2004. Temporal and spatial variation oflocal stress fields before and after the 1992 eruptions of crater peak vent, MountSpurr volcano. Alaska Bull. Seismol. Soc. Am. 94, 2366–2379.
Roth, F., Fleckenstein, P., 2001. Stress orientations found in North-East Germany differfrom the West European trend. Terra Nova 13, 289–296.
Roth, F., Henneberg, K., Fleckenstein, P., Palmer, J., Stefanssson, V., Gudlaugsson, S., 2000.Ergebnisse von bohrloch-spannungsmessungen in der SüdisländischenSeismizitätszone. Mitt./Nachr. Deut. Geol. Ges. 3, 49–50.
Sæmundsson, K., 1974. Evolution of the axial rifting zone in Northern Iceland and theTjörnes fracture zone. Geol. Soc. Am. Bull. 85, 495–504.
Sæmundsson, K., 1978. Fissure swarms and central volcanoes of the neovolcanic zones ofIceland. Geol. J. Spec 10, 415–432.
Sæmundsson, K., 1979. Outline of the geology of Iceland. Jökull 29, 7–28.Sæmundsson, K., 1986. Subaerial volcanism in the western north Atlantic. Geol. N. Am.
1000, 69–86.Sánchez, J.J., Wyss, M., McNutt, S.R., 2004. Temporal–spatial variations of stress at redoubt
volcano, Alaska, inferred from inversion of fault plane solutions. J. Volcanol.Geotherm. Res. 130, 1–30.
Sbar, M.L., Sykes, L.R., 1973. Contemporary compressive stress and seismicity in easternNorth America: an example of intra-plate tectonics. Geol. Soc. Am. Bull. 84, 1861–1882.
285
Schäfer, K., Keil, S., 1979. In situ gesteinsspannungsermittlungen in island. MesstechnischeBriefe 15, 35–46.
Scheidegger, A., 1962. Stresses in the earth's crust as determined from hydraulic fractur-ing data. Geologie und Bauwesen 27, 1.
Segall, P., Fitzgerald, S.D., 1998. A note on induced stress changes in hydrocarbon and geo-thermal reservoirs. Tectonophysics 289, 117–128.
Sigmundsson, F., Einarsson, P., Halldorson, P., Jakobsdottir, S., Vogfjörd, K., Sigbjörnsson,R., Snaebjörnsson, J.T., 2005. Earthquakes and Faults in the Kárahnjúkar Area. Techni-cal Report March, Jardvisindastofnun Haskolans.
Sigmundsson, F., Hooper, A., Hreinsdóttir, S., Vogfjörd, K.S., Ófeigsson, B.G., Heimisson,E.R., Dumont, S., Parks, M., Spaans, K., Gudmundsson, G.B., Drouin, V., Árnadóttir, T.,Jónsdóttir, K., Gudmundsson, M.T., Högnadóttir, T., Fridriksdóttir, H.M., Hensch, M.,Einarsson, P., Magnússon, E., Samsonov, S., Brandsdóttir, B., White, R.S.,Ágústsdóttir, T., Greenfield, T., Green, R.G., Hjartardóttir, Á.R., Pedersen, R., Bennett,R.A., Geirsson, H., La Femina, P.C., Björnsson, H., Pálsson, F., Sturkell, E., Bean, C.J.,Möllhoff, M., Braiden, A.K., Eibl, E.P.S., 2015. Segmented lateral dyke growth in arifting event at Bardarbunga volcanic system, Iceland. Nature 517, 191–195.
Sigurdsson, H., 1970. Structural origin and plate tectonics of the snaefellsnes volcaniczone. Western Iceland Earth Planet. Sci. Lett. 10, 129–135.
Sigurdsson, H., Sparks, R.S.J., 1978. Rifting episode in North Iceland in 1874–1875 and theeruptions of Askja and Sveinagja. Bull. Volcanol. 41, 149–167.
Sinton, J., Grönvold, K., Sæmundsson, K., 2005. Postglacial eruptive history of theWesternVolcanic Zone, Iceland. Geochem. Geophys. Geosyst. 6 (n/a–n/a).
Soosalu, H., Einarsson, P., 1997. Seismicity around the Hekla and Torfajökull volcanoes,Iceland, during a volcanically quiet period, 1991–1995. Bull. Volcanol. 59, 36–48.
Sperner, B., Muller, B., Heidbach, O., Delvaux, D., Reinecker, J., Fuchs, K., 2003. Tectonicstress in the Earth's crust: advances in the World stress map project. Geol. Soc.Lond. Spec. Publ. 212, 101–116.
Stefánsson, R., 1966. Methods of focal mechanism studies with application to two Atlanticearthquakes. Tectonophysics 3, 209–243.
Stefánsson, R., Gudmundsson, G.B., Halldórsson, P., 2000. The two large earthquakes inthe South Iceland Seismic Zone on June 17 and 21, 2000. Technical Report July.Icelandic Meterological Organisation. Reykjavk.
Stefánsson, R., Gudmundsson, G.B., Halldorsson, P., 2008. Tjörnes fracture zone. New andold seismic evidences for the link between the North Iceland rift zone and theMid-Atlantic ridge. Tectonophysics 447, 117–126.
Sykes, L.R., 1967. Mechanism of earthquakes and nature of faulting on the mid-oceanicridges. J. Geophys. Res. 72, 2131–2153.
Sykes, L., Sbar, M., 1974. Focal mechanism solutions of intraplate earthquakes and stressesin the lithosphere. In: Kristjansson, L. (Ed.), Geodynamics of Iceland and the NorthAtlantic Area. D. Reidel Publishing Company, Dordrecht-Holland, pp. 207–224.
Thordarson, T., Larsen, G., 2007. Volcanism in Iceland in historical time: volcano types,eruption styles and eruptive history. J. Geodyn. 43, 118–152.
Tibaldi, A., Bonali, F.L., Pasquaré, F.A., Rust, D., Cavallo, A., D'Urso, A., 2013. Structure ofregional dykes and local cone sheets in the midhyrna-lysuskard area, snaefellsnespeninsula (NW Iceland). Bull. Volcanol. 75, 764.
Tingay, M., Müller, B., Reinecker, J., Heidbach, O., Wenzel, F., Fleckenstein, P., 2005. Under-standing tectonic stress in the oil patch: theWorld Stress Map Project. Lead. Edge 24,1276–1282.
Villemin, T., Bergerat, F., Angelier, J., Lacasse, C., 1994. Brittle deformation and fracturepatterns on oceanic rift shoulders: the Esja Peninsula, SW Iceland. J. Struct. Geol.16, 1641–1654.
Ward, P., 1971. New interpretation of the geology of Iceland. Geol. Soc. Am. Bull. 82,2991–3012.
Wessel, P., Smith,W.H.F., Scharroo, R., Luis, J., Wobbe, F., 2013. Generic mapping tools: im-proved version released. EOS Trans. Am. Geophys. Union 94, 409–410.
White, R.S., Drew, J., Martens, H.R., Key, J., Soosalu, H., Jakobsdóttir, S.S., 2011. Dynamics ofdyke intrusion in the mid-crust of Iceland. Earth Planet. Sci. Lett. 304, 300–312.
Wiens, D.A., Stein, S., 1984. Intraplate seismicity and stresses in young oceanic litho-sphere. J. Geophys. Res. 89, 11442.
Wiprut, D., Zoback, M., Hanssen, T., Peska, P., 1997. Constraining the full stress tensor fromobservations of drilling-induced tensile fractures and leak-off tests: application toborehole stability and sand production on the. Int. J. Rock Mech. Min. Sci. 34, 3–4.
Wolfe, C.J., Bjarnason, I.Th., VanDecar, J.C., Solomon, S.C., 1997. Seismic structure of theIceland mantle plume. Nature 385, 245–247.
Zang, A., Stephansson, O., 2010. Stress Field of the Earth's Crust. Springer Netherlands,Dordrecht.
Zoback, M.L., 1992. First- and second-order patterns of stress in the lithosphere: theWorld Stress Map Project. J. Geophys. Res. 97, 11703.
Zoback, M., Zoback, M., 1991. Tectonic stress field of North America and relative platemo-tions. In: Slemmons, D., Engdahl, E. (Eds.), Neotectonics of North America. GeologicalSociety of America, Boulder, Colorado, pp. 339–366.
Zoback, M.L., Zoback, M.D., Adams, J., Assumpção, M., Bell, S., Bergman, E.A., Blümling, P.,Brereton, N.R., Denham, D., Ding, J., Fuchs, K., Gay, N., Gregersen, S., Gupta, H.K.,Gvishiani, A., Jacob, K., Klein, R., Knoll, P., Magee, M., Mercier, J.L., Müller, B.C.,Paquin, C., Rajendran, K., Stephansson, O., Suarez, G., Suter, M., Udias, A., Xu, Z.H.,Zhizhin, M., 1989. Global patterns of tectonic stress. Nature 341, 291–298.

5.2. Conference Papers related to Iceland Stress Pattern
1) Ziegler, M., Heidbach, O., Rajabi, M., Páll Hersir, G., Ágústsson, K., Árnadóttir, S., Zang, A., 2015. The
stress pattern of Iceland, in: Manzella, A., Nardini, I. (Eds.), IMAGE (Integrated Methods for Advanced
Geothermal Exploration) Mid-Term Conference, Advanced Exploration Concepts for Geothermal Systems
CNR, Pisa, Italy.
2) Ziegler, M., Rajabi, M., Heidbach, O., Hersir, G.P., Ágústsson, K., Árnadóttir, S., Zang, A., 2016. The
Stress Pattern of Iceland, European Geosciences Union (EGU) General Assembly 2016. EGU, Vienna,
Austria.
286

Mid-Term-Conference, Pisa 12-13/10/2015
The Stress Pattern of Iceland Moritz Ziegler1,2, Oliver Heidbach1, Mojtaba Rajabi3, Gylfi Páll Hersir4, Kristján Ágústsson4, Sigurveig Árnadóttir4 and Arno Zang1,2 1Helmholtz Centre GFZ, Potsdam, D; 2University of Potsdam, Potsdam, D; 3Australian School of Petroleum, The University of Adelaide, Adelaide, SA 5005, AUS;4 ÍSOR, Iceland GeoSurvey, Reykjavík, IS. In the framework of the IMAGE project we compiled the first comprehensive stress map of Iceland from different stress indicators and new analyis of data from 51 Icelandic geothermal boreholes. In total we interpreted ~34 km of acoustic image logs for stress indicators, i.e. borehole breakouts and drilling induced tensile fractures. Furthermore we revised the existing 38 data records for Iceland in the World Stress Map and conducted an extensive literature research to compile all available focal mechanism solutions and geological stress indicators. The new stress compilation consists of 444 data records for the orientation of the maximum horizontal stress (SHmax) in and around Iceland with 307 data records of A-D qualities according to the World Stress Map ranking scheme (Fig. 1). Most of the A-D quality data records are from geological fault inversions (38%) and focal mechanism solutions (27%). Borehole related indicators (breakouts, drilling induced fractures, hydro-fractures) have a share of 14% while data from the alignments of volcanic vents, fissures and craters contribute with 12%. The inversion of several focal mechanism solutions make up 9% of the dataset. The mean orientation of SHmax is 16° +/- 39° for all A-D quality data. A closer look at subregions reveals four different provinces with fairly consistent SHmax orientation. They are in the Capital area and Southern Lowlands (mean SHmax = 38° +/- 29°), the eastern Highlands and Eastfjords (mean SHmax = 9° +/- 25°), the Tjörnes Fracture Zone and Akureyri (mean SHmax = 152° +/- 21°), and the Westfjords (mean SHmax = 137° +/- 17°). This distribution of SHmax orientations is in agreement with the prevailing structural geology. At the spreading ridges Reykjanes and Kolbeinsey in the South and North respectively an orientation of SHmax parallel to the plate boundary is observed. The same is observed in the Northern and Eastern Volcanic Zones and it is also indicated by the few indicators associated with the Western Volcanic Zone. In the transform South Iceland Seismic Zone and Tjörnes Fracture Zone which produce Icelands largest earthquakes, SHmax is at an angle of approximately 20° to 60° to the transform faults which define the plate boundary. A rotation from ridge parallel to the general intraplate ridge normal SHmax is expected at some distance from the plate boundary. Such a rotation is observed in the Westfjords, NW-Iceland.
Fig. 2: Stress indicator of quality A-D in Iceland. The lines represent the orientation of SHmax. Major tectonic features are shown.
287

Geophysical Research AbstractsVol. 18, EGU2016-3834, 2016EGU General Assembly 2016© Author(s) 2016. CC Attribution 3.0 License.
The Stress Pattern of IcelandMoritz Ziegler (1,2), Mojtaba Rajabi (3), Oliver Heidbach (1), Gylfi Páll Hersir (4), Kristján Ágústsson (4),Sigurveig Árnadóttir (4), Arno Zang (1,2)(1) Helmholtz Centre Potsdam, German Research Centre for Geosciences, Telegrafenberg, 14473 Potsdam, Germany, (2)University of Potsdam, Institute of Earth and Environmental Science, Karl-Liebknecht-Str. 24-25, 14476 Potsdam-Golm,Germany, (3) Australian School of Petroleum, The University of Adelaide, Adelaide, SA 5005, Australia, (4) IcelandGeoSurvey (ÍSOR), Grensásvegur 9, 108 Reykjavík, Iceland
Iceland is one of the few places on earth where an active spreading can be observed onshore, yet the contemporarycrustal stress state has not been investigated intesively. We compiled the first comprehensive stress map of Icelandfrom different stress indicators and analysed data from 57 Icelandic geothermal boreholes. In total we interpretedappox. 37 km of acoustic image logs for stress indicators, i.e. borehole breakouts and drilling induced tensilefractures. Furthermore we revised the 38 data records for Iceland from the World Stress Map 2008 and conductedan extensive literature research to compile all available focal mechanism solutions and geological stress indicators.
The new stress compilation consists of 495 data records for the orientation of the maximum horizontal stress(SHmax) in and around Iceland with 318 data records of A-D qualities according to the World Stress Map rankingscheme. Most of the data records are derived from focal mechanism solutions (35%) and geological fault inversions(26%). Borehole related indicators (breakouts, drilling induced fractures, hydro-fractures) have a share of 20%.Minor contributions to the dataset are provided by the alignment of volcanic vents and fissures and overcoringmeasurements.
The mean orientation of SHmax is 17˚ ± 39˚ for all A-D quality data. A closer look at subregions reveals fourdifferent provinces with fairly consistent SHmax orientation. They are in the Capital area and Southern Lowlands(mean SHmax = 38˚ ± 29˚), the eastern Highlands and Eastfjords (mean SHmax = 8˚ ± 25˚), the Tjörnes FractureZone and Akureyri (mean SHmax = 151˚ ± 21˚), and the Westfjords (mean SHmax = 137˚ ± 17˚).
This distribution of SHmax orientations is in agreement with the prevailing tectonic structure. At the spreadingridges Reykjanes and Kolbeinsey in the South and North respectively an orientation of SHmax parallel to the plateboundary is observed. The same is observed in the Northern and Eastern Volcanic Zones and it is also indicatedby the few indicators associated with the Western Volcanic Zone. In the transform South Iceland Seismic Zoneand Tjörnes Fracture Zone which produce Icelands largest earthquakes, SHmax is at an angle of approximately20˚ to 60˚ to the transform faults which define the plate boundary. A rotation from ridge parallel to the generalintraplate ridge normal SHmax is expected at some distance from the plate boundary. Such a rotation is observedin the Westfjords, NW-Iceland.
288

6. Conference Papers Related to the World Stress Map-2016
1) Rajabi, M., Tingay, M., Heidbach, O., 2014. The Present-day stress pattern in the Middle East and Northern
Africa and their importance: The World Stress Map database contains the lowest wellbore information in these
petroliferous areas, International Petroleum Technology Conference. International Petroleum Technology
Conference, Doha, Qatar. DOI: http://dx.doi.org/10.2523/IPTC-17663-MS.
2) Heidbach, O., Rajabi, M., Ziegler, M., Reiter, K., WSM-Team, 2015. The World Stress Map Project – an
ILP Success Story in: Rudloff, A., Scheck-Wenderoth, M. (Eds.), 35 Years of ILP "Celebrating excellence in
solid earth sciences", ILP’s Third Potsdam Conference (Potsdam 2015). GFZ German Research Centre for
Geosciences, Potsdam, Germany. DOI: http://dx.doi.org/10.2312/GFZ.ILP.2015.
3) Heidbach, O., Rajabi, M., Ziegler, M., Reiter, K., Team, t.W., 2016. The World Stress Map Database
Release 2016 - Global Crustal Stress Pattern vs. Absolute Plate Motion (EGU2016-4861), European
Geosciences Union (EGU) General Assembly 2016. EGU, Vienna, Austria.
4) Heidbach, O., Custodio, S., Kingdon, A., Mariucci, M.T., Montone, P., Müller, B., Simona, P., Rajabi, M.,
Reinecker, J., Reiter, K., Tingay, M., Williams, J., Ziegler, M., 2016. New crustal stress map of the
Mediterranean and Central Europe (EGU2016-4851), European Geosciences Union (EGU) General Assembly
2016. EGU, Vienna, Austria.
5) Heidbach, O., Rajabi, M., Ziegler, M., Reiter, K., WSM-Team, 2016. The World Stress Map Database
Release 2016 - Global Crustal Stress Pattern vs. Absolute Plate Motion Arthur Holmes Meeting 2016 – The
Wilson Cycle: Plate Tectonic and Structural Inheritance During Continental Deformation. Geological Society of
London, London, Great Britain, Abstract Book Page 129.
289

The World Stress Map Database Release 2016 - Global Crustal Stress Pattern vs.
Absolute Plate Motion
This part of the thesis examines the new (2016) release of the WSM project, and in particular,
looks at whether the WSM database still shows a link between SHmax orientation and absolute plate
motion, given the significant stress variations documented in prior chapters, and thus tests whether
the key finding of the WSM project, that the crustal stress field is primarily controlled by plate
boundary forces, is still valid. This chapter briefly summarizes results and work that has already
been presented at three conferences, including 35 Years of International Lithosphere Program-
Celebrating Excellence in Solid Earth Sciences (in Potsdam, Germany), the General Assembly-2016
of the European Geosciece Union (in Vienna), and the Arthur Holmes Meeting-2016 (at the
Geological Society of London).
The World Stress Map (WSM) Project was initiated in 1986 under the auspices of the
International Lithosphere Program in order to compile the global database of the contemporary
crustal stress state. The project has had three major phases so far.
1. The first phase of the project (1986-1992), which contained ~7700 data records.
2. The second phase of the project (1995-2008), which produced a WSM consisting of 21750
data records.
3. The third phase (2009-2016), resulting in a WSM with 42870 data records.
This year marks the end of the third phase of the WSM project, and also the 30th anniversary of
the project. The new release of the WSM project contains approximately double the information of
the 2008 release, with 42,870 data records from various sources of information from across the
world (Table 1). In particular the new database contain more than 3500 new data records from deep
boreholes in China, Australia and New Zealand as well as new stress information from places that
previously had limited data such as Eastern South America, Africa and Iceland (including over 1300
wellbore indicators either analysed by the author, or compiled by the author from published
sources).
One of the key findings of the first phase of the WSM project was the observation that SHmax was
generally oriented parallel to absolute plate motion in stable parts of North America, Europe and
South America (Richardson, 1992). This observation was instrumental in reaching the first major
conclusion fo the WSM Project, namely that plate boundary forces provide the primary control on
the plate-wide stress pattern (Zoback, 1992; Zoback et al., 1989). However, since these original
findings in 1992, there has been extensive improvements in plate motion analysis, such as the advent
of GPS, which has drastically changed the absolute plate motion models in some areas. Furthermore,
the WSM database now contains over 10 times more A-C quality data records than was available in
290

1992, and this data covers more continental regions, and at much higher data density, than could be
studied previously. Finally, the increase in stress data density in the WSM has resulted in the
recogniton that stress orientation can vary significantly at regional and local scales (Heidbach et al.,
2010), such as the numerous examples presented in earlier chapters of this thesis. Hence, the 2016
release of the WSM project provides a fantastic opportunity, and clear rationale, for re-visiting the
comparison between SHmax orientation and absolute plate motion, and to again test whether the
present-day SHmax orientation is primarily driven by plate boundary forces.
In this study, absolute plate motion (APM) is inferred from the HS3-NUVEL1A model (Gripp
and Gordon, 2002), and is compared to the mean orientation of SHmax. In order to provide the mean
SHmax orienation, A-C quality data were smoothed on a 1° regular grid with a search radius of 500
km. The angular difference between SHmax and APM on each 1° grid was calculated, and is shown
on Figure (1) by the histograms for six major tectonic plates. The results indicate that there is now
only a reasonable correlation between APM and SHmax orientation in North and South America. The
Eurasia and Australian plates show poor correlation between SHmax and APM. The Pacific and
Africa plates also show poor corrolations between SHmax and APM, but it should be noted that stress
data is quite sparse in these two plates, and thus the comparison may not be reliable.
The mis-match between SHmax and APM seen in most tectonic plates might suggest that plate
boundary forces are not the primary control on the present-day stress field. However, it is also
possible, and I consider it likely, that the WSM data still indicates that plate boundary forces do
control the present-day stress field at the first order. For example, geomechanical-numerical
modelling indicates that plate boundary forces are a primary control on the intra-plate stress field in
Australia, despite their being no clear relationship between SHmax and APM. Indeed, while North
America and South America have plate boundary forces that largely push or pull in one direction,
and thus show a SHmax-APM correlation, the plate boundaries of other major plates are generally
more complex, and so there is less likely to be a simple SHmax-APM correlation. However, the
observations from this thesis, combined with the widespread recognition of ‘third-order’ and
‘fourth-order’ stress patterns (Bell, 1996; Heidbach et al., 2007; Tingay et al., 2006), do indicate that
the stress orientation at any point is controlled by a wide range of stress sources, ranging from plate
boundary forces right down to highly localised sources tat may only influence the stress orientation
at the scale of metres.
291

Table1. Number of stress data records according to stress indicator and data quality. WSM 2008 new data records WSM 2016a
A-E A-C A-E A-Cc A-E A-Cb Focal Mechanisms Single (FMS) 14,477 13,081 16,519 14,274 30,341 26,730
Focal M. Inversion/Average (FMF, FMA) 1212 878 508 298 1720 1166 Borehole Breakouts (BO, BOC, BOT) 4125 2168 2640 1204 6301 2962
Drilling Induced Fracture (DIF) 278 82 663 352 941 430 Hydrofracs (HF, HFG, HFM, HFP) 349 228 566 129 907 341
Geological (GFI, GFM, GFS, GVA) 654 429 947 277 1601 704 Overcoring (OC) 611 94 338 18 927 88
Other (BS, PC, SWB, SWL, SWS) 44 9 88 35 132 44 Sum 21,750 16,969 22,269 16,587 42,870 32,465
a Sum of data records from the WSM 2008 database release and new data does not equal the total number since double entries of focal mechanisms and erroneous data entries were deleted from the WSM 2008 database. Furthermore, completely revised data records in particular for borehole data from China and Switzerland were also marked as new data entries since they were partly completely re-analysed from raw data.
b 11,809 of these FMS data records are flagged as Possible Plate Boundary events (PBE) which indicates that they have a higher possibility not to show within the given C-quality (± 25°) assignment the SHmax orientation.
c 6201 of these new FMS data records are flagged as Possible Plate Boundary events (PBE) which indicates that they have a higher possibility not to show within the given C-quality (± 25°) assignment the SHmax orientation.
292

Figure 1: World Stress Map based on the new data compilation with 20464 A-C quality data records. Note that in this map A-C quality data that are < 100 km away from any plate boundary were not shown (PBE of Heidbach, et. al., 2010). Lines represent the orientation of maximum horizontal stress (SHmax) and their length show proportional to data quality. Different colours indicate stress regimes with red for normal faulting (NF), green for strike-slip faulting (SS), blue for thrust faulting (TF), and black for unknown stress regime (U). Histograms show the deviation between the absolute plate motion azimuth from HS3-NUVEL and the mean SHmax orientation. The mean SHmax orientation is calculated on a 1° grid using a search radius 500 km and applying a weighted by data quality and distance to the grid point.

References
Bell, J.S., 1996. Petro Geoscience 2. In situ stresses in sedimentary rocks (part 2): applications of stress measurements. Geoscience Canada 23, 135-153.
Gripp, A.E., Gordon, R.G., 2002. Young tracks of hotspots and current plate velocities. Geophys J Int 150, 321-361.
Heidbach, O., Reinecker, J., Tingay, M., Müller, B., Sperner, B., Fuchs, K., Wenzel, F., 2007. Plate boundary forces are not enough: Second- and third-order stress patterns highlighted in the World Stress Map database. Tectonics 26, TC6014.
Heidbach, O., Tingay, M., Barth, A., Reinecker, J., Kurfeß, D., Müller, B., 2010. Global crustal stress pattern based on the World Stress Map database release 2008. Tectonophysics 482, 3-15.
Richardson, R.M., 1992. Ridge forces, absolute plate motions, and the intraplate stress field. Journal of Geophysical Research: Solid Earth 97, 11739-11748.
Tingay, M., Muller, B., Reinecker, J., Heidbach, O., 2006. State and Origin of the Present-Day Stress Field in Sedimentary Basins: New Results from the World Stress Map Project, The 41st U.S. Symposium on Rock Mechanics (USRMS). American Rock Mechanics Association, Golden, Colorado
Zoback, M.L., 1992. First- and second-order patterns of stress in the lithosphere: The World Stress Map Project. Journal of Geophysical Research: Solid Earth 97, 11703-11728.
Zoback, M.L., Zoback, M.D., Adams, J., Assumpcao, M., Bell, S., Bergman, E.A., Blumling, P., Brereton, N.R., Denham, D., Ding, J., Fuchs, K., Gay, N., Gregersen, S., Gupta, H.K., Gvishiani, A., Jacob, K., Klein, R., Knoll, P., Magee, M., Mercier, J.L., Muller, B.C., Paquin, C., Rajendran, K., Stephansson, O., Suarez, G., Suter, M., Udias, A., Xu, Z.H., Zhizhin, M., 1989. Global patterns of tectonic stress. Nature 341, 291-298.
294

Rajabi, M., Tingay, M., & Heidbach, O., (2014). The Present-day stress pattern in the Middle East and Northern Africa and their importance: The World Stress Map database contains the lowest wellbore information in these petroliferous areas, International Petroleum Technology Conference. International Petroleum Technology Conference, Doha, Qatar.
NOTE:
This publication is included on pages 295 - 303 in the print copy of the thesis held in the University of Adelaide Library.
It is also available online to authorised users at:
http://dx.doi.org/10.2523/IPTC-17663-MS

ILP Celebrating 35 Years, 21-23 September 2015
ILP, 3rd Potsdam Meeting - eBook - Page 31 of 48
The World Stress Map Project – an ILP Success Story
Heidbach, Oliver (1); Rajabi, Mojtaba (2); Ziegler, Moritz (1); Reiter, Karsten (3), and
the WSM Team
(1) GFZ German Research Centre for Geosciences, Telegrafenberg, 14473, Potsdam, GERMANY
(2) Australian School of Petroleum, The University of Adelaide, Adelaide, SA 5005, AUSTRALIA
(3) TU Darmstadt, Institute of Applied Geosciences, Schnittspahnstr. 9, 64287 Darmstadt, GERMANY
The World Stress Map (WSM) Project was initiated in 1986 under the auspices of the
International Lithosphere Program. Focus of the first WSM phase was to characterize
the intraplate stress field pattern and to publish an open access database of the
contemporary crustal stress information. In 1992 the final project results were
published in a special volume of the Journal of Geophysical Research [Zoback 1992]
with the scientific results based on the WSM database with over 7300 data records.
The key finding of the first phase is that for a number of major tectonic plates the
orientation of the maximum horizontal stress SHmax is sub-parallel to absolute plate
motion. The second phase of the WSM project lasted from 1996 until 2008 as a
project of the Heidelberg Academy of Sciences and Humanities, located at the
Geophysical Institute, Karlsruhe University. At the end of this phase the WSM
database has increased to 21,750 data records. With this compilation regional and
local deviations from the first-order plate-wide trend were identified and published in
a special issue of Tectonophysics [Heidbach et al. 2010]. Since 2009 the WSM project
is located at the GFZ Potsdam and a new database release is in preparation for the
30th anniversary of the WSM project in 2016. We present preliminary results of the
new database release and two examples that show the practical use the WSM for the
calibration of 3D geomechanical-numerical models; one represents a large scale
model of the entire Alberta basin in Canada and the other is of smaller scale
simulating the 3D in situ stress state of a potential waste disposal site in northern
Switzerland.
DOI: http://doi.org/10.2312/GFZ.ILP.2015
304
Geophysical Research AbstractsVol. 18, EGU2016-4861, 2016EGU General Assembly 2016© Author(s) 2016. CC Attribution 3.0 License.
The World Stress Map Database Release 2016 - Global Crustal StressPattern vs. Absolute Plate MotionOliver Heidbach (1), Mojtaba Rajabi (2), Moritz Ziegler (1,3), Karsten Reiter (4), and the WSM Team(1) Helmholtz Centre Potsdam, GFZ German Research Centre for Geosciences, Section 2.6 Earthquake Hazard and StressField, Potsdam, Germany ([email protected]), (2) Australian School of Petroleum, The University of Adelaide,Adelaide, SA 5005, Australia , (3) University of Potsdam, Institute of Earth and Environmental Science, Karl-Liebknecht-Str.24-25, 14476 Potsdam-Golm, Germany, (4) TU Darmstadt, Institute of Applied Geosciences, Schnittspahnstr. 9, 64287Darmstadt, Germany
The World Stress Map (WSM) Project was initiated in 1986 under the auspices of the International LithosphereProgram in order to compile the global information on the contemporary crustal stress state. The data come froma wide range of stress indicators such as borehole data (e.g. hydraulic fracturing, borehole breakouts), earthquakefocal mechanism solutions, engineering methods (e.g. overcoring), and geological data (e.g. inversion of fault slipmeasurements). To guarantee the comparability of the different data sources each data record is assessed withthe WSM quality ranking scheme. For the 30th anniversary we compiled a new WSM database with 42,410 datarecords which is an increase by >20,000 data records compared to the WSM 2008 database. In particular we addednew data from more than 3,500 deep boreholes and put special emphasis on regions which previously had sparse orno published stress data such as China, Australia, Brazil, Southern Africa, Middle East and Iceland. Furthermore,we fully integrated the Chinese stress database and the Australian stress database. The resulting data increasereveals several areas with regional and local variability of the stress pattern. In particular we re-visited the questionwhether the plate boundary forces are the key control of the plate-wide stress pattern as indicated by the first releaseof the WSM in 1989 [Zoback et al, 1989]. As the WSM has now more than 10 times data records and thus a betterspatial coverage we first filter the long-wave length stress pattern on a regular grid. We determine at these gridpoints the difference between absolute plate motion azimuth using the global plate model HS3-NUVEL1A [Grippand Gordon, 2002] and the mean orientation of the maximum horizontal stress. The preliminary results show thatthe earlier findings are still valid in principal. However, all plates show in some parts significant deviations fromthis general trend; some plates such as the Australian Plate show hardly any correlation at all. These deviationsseem to be either due to mantle drag forces, different plate boundary forces acting in different directions, additionalinternal body forces or major structural inhomogeneity’s.
305

Geophysical Research AbstractsVol. 18, EGU2016-4851, 2016EGU General Assembly 2016© Author(s) 2016. CC Attribution 3.0 License.
New Crustal Stress Map of the Mediterranean and Central EuropeOliver Heidbach (1), Susana Custodio (2), Andrew Kingdon (3), Maria Teresa Mariucci (4), Paola Montone (4),Birgit Müller (5), Simona Pierdominicini (1), Mojtaba Rajabi (6), John Reinecker (7), Karsten Reiter (8), MarkTingay (6), John Williams (3), Moritz Ziegler (1,9)(1) Helmholtz Centre Potsdam, GFZ German Research Centre for Geosciences, Section 2.6 Earthquake Hazard and StressField, Potsdam, Germany ([email protected]), (2) Instituto Dom Luiz, Faculdade de Ciencias, Universidade deLisboa, Lisbon, Portugal, (3) British Geological Survey, Environmental Science Centre, Keyworth, Nottingham NG12 5GG,UK, (4) Instituto Nazionale di Geofisica e Vulcanologia, Via di Vigna Murata 605, 00143 Rome, Italy, (5) Institute of AppliedGeosciences, KIT, Adenauerring 20b, 76131 Karlsruhe, Germany, (6) Australian School of Petroleum, The University ofAdelaide, Adelaide, SA 5005, Australia , (7) GeoThermal Engineering GmbH, Baischstr. 8, 76133 Karlsruhe, Germany, (8)TU Darmstadt, Institute of Applied Geosciences, Schnittspahnstr. 9, 64287 Darmstadt, Germany, (9) University of Potsdam,Institute of Earth and Environmental Science, Karl-Liebknecht-Str. 24-25, 14476 Potsdam-Golm, Germany
The World Stress Map (WSM) Project was initiated in 1986 under the auspices of the International LithosphereProgram in order to compile globally the information on the contemporary crustal stress state. For the 30th an-niversary the WSM database has been updated and increased the number of data records from 21,750 to 42,410worldwide. For the Mediterranean and Central European stress map the number of data records has increased from3877 to 8192. The data come from a wide range of stress indicators such as borehole data (e.g. hydraulic fracturing,drilling induced tensile fractures, borehole breakouts), earthquake focal mechanism solutions and stress inversionsfrom these, engineering methods (overcoring, borehole slotter) and geological data (e.g. volcanic alignment, in-version of fault slip data). To guarantee the comparability of the different stress indicator the resulting data arequality-ranked using the WSM quality ranking scheme. The new data set has a better coverage and enables us toidentifying the regional and local variability of the stress pattern. For the Mediterranean and Central Europe weanalysed the wave-length of the stress pattern by determining the mean orientation of the maximum horizontalstress SHmax on a regular grid using an updated version of the hybrid approach of Heidbach et al. [2010]. Thepreliminary results show that the Africa-Eurasia plate convergence is a key control of the overall stress pattern.However, given the complex tectonic setting in particular due to the indentation/collision of the Adriatic microblock, the Alpine topography as well as forces that control the movement of the Anatolian and Aegean block, thestress pattern shows in these regions significant changes in the mean SHmax orientation as well as in the tectonicregime.
306

Arthur Holmes Meeting 2016
23-25 May 2016
The World Stress Map Database Release 2016 - Global Crustal Stress Pattern vs. Absolute Plate Motion
O. Heidbach1, M. Rajabi
2, M. Ziegler
1,3, K. Reiter
4 and the WSM Team
1 Helmholtz Centre Potsdam GFZ German Research Centre for Geosciences, Telegrafenberg, 14473
Potsdam, Germany 2 Australian School of Petroleum, The University of Adelaide, Adelaide, SA 5005, Australia
3 University of Potsdam, Institute of Earth and Environmental Science, Karl-Liebknecht-Str. 24-25,
14476 Potsdam-Golm, Germany 4 TU Darmstadt, Institute of Applied Geosciences, Schnittspahnstr. 9, 64287 Darmstadt, Germany
The World Stress Map (WSM) Project was initiated in 1986 under the auspices of the International Lithosphere Program in order to compile the global information on the contemporary crustal stress state. The data come from a wide range of stress indicators such as borehole data (e.g. hydraulic fracturing, borehole breakouts), earthquake focal mechanism solutions, engineering methods (e.g. overcoring), and geological data (e.g. inversion of fault slip measurements). To guarantee the comparability of the different data sources each data record is assessed with the WSM quality ranking scheme. For the 30th anniversary we compiled a new WSM database with 42,410 data records which is an increase by >20,000 data records compared to the WSM 2008 database. In particular we added new data from more than 3,500 deep boreholes and put special emphasis on regions which previously had sparse or no published stress data such as China, Australia, Brazil, Southern Africa, Middle East and Iceland. Furthermore, we fully integrated the Chinese stress database and the Australian stress database. The resulting data increase reveals several areas with regional and local variability of the stress pattern. In particular we re-visited the question whether the plate boundary forces are the key control of the plate-wide stress pattern as indicated by the first release of the WSM in 1989 [Zoback et al, 1989]. As the WSM has now more than 10 times data records and thus a better spatial coverage we first filter the long-wave length stress pattern on a regular grid. We determine at these grid points the difference between absolute plate motion azimuth using the global plate model HS3-NUVEL1A [Gripp and Gordon, 2002] and the mean orientation of the maximum horizontal stress. The preliminary results show that the earlier findings are still valid in principal. However, all plates show in some parts significant deviations from this general trend; some plates such as the Australian Plate show hardly any correlation at all. These deviations seem to be either due to mantle drag forces, different plate boundary forces acting in different directions, additional internal body forces or major structural inhomogeneity’s.
References Gripp, A. E., & Gordon, R. G. (2002). Young tracks of hotspots and current plate velocities. Geophysical
Journal International, 150(2), 321-361. Zoback, M. L., Zoback, M. D., Adams, J., Assumpcao, M., Bell, S., Bergman, E. A., and others. (1989).
Global patterns of tectonic stress. Nature, 341(6240), 291-298.
307

7. Concluding Statement
The aim of this thesis was to investigate the pattern of crustal stress at different spatial scales in
order to better evaluate the causes and consequences of present-day stress in the earth’s crust. The
research conducted in this thesis resulted in nine stress-related journal publications or manuscripts,
as well as greatly contributing to the 2016 release of the World Stress Map (WSM) project. The
results and key conclusions for each part of the thesis are stated in each paper. Herein, I summarize
the major outcomes of this thesis.
This thesis provided significant advancement in understanding the stress state of Australia, New
Zealand and Iceland, and particularly in regions where there were no or sparse stress data. These
new stress maps, that are included in the WSM-2016 database, are shown in Figure 1. In the
introduction of the thesis, I stated that in-situ stress is a scale-dependant parameter, meaning that the
study of stress depends on the scale of the study. The analysis of stress conducted in this thesis
revealed that large scale stress analyses do not necessarily represent the in-situ stress pattern at
smaller scales. Similarly, the analyses of just a couple of borehole measurements in one area might
not be a good representation of the regional stress pattern. For example, the regional pattern of
maximum horizontal stress (SHmax) in the Gunnedah and Clarence-Moreton basins (eastern
Australia) is ENE-WSW. However, stress analyses at smaller, basin and wellbore, scales revealed
variable SHmax orientations, that can even be perpendicular to the regional trend.
Interestingly, all the stress sources, acting from the plate to the wellbore scale, are inter-related to
each other, so that the in-situ stress at any given point in the earth's crust is the resultant of all these
different stress sources. Hence, the analysis of stress in this thesis resulted in the introduction of
‘fourth-order’ stress sources that control the stresses at very small scales (< 1km), and which
compliments the already established classification of first-, second- and third-order stress sources
published by numerous other authors. These fourth-order stress sources are particularly important
for geothermal and petroleum production applications, such as where hydraulic fracturing is crucial
for the safe and economic development of reservoirs. Figure 2 illustrates the updated classification
of stress-sources in the earth’s crust.
Stress investigations at different spatial scales in Australia, New Zealand and Iceland also provide
significant conclusions about the analysis and interpretation of stress data.
1. Interpretation of in-situ stresses, particularly at larger scales such as tectonic plate scales,
requires a significant knowledge about regional tectonics and geodynamics.
2. Regional geological understanding is an important part of any stress analysis, particularly at
basin and wellbore scales.
308

3. In-situ stress in intraplate regions can be uniform (directly linked to plate boundary forces),
or highly scattered due to the presence of complex plate boundaries and the presence of
local stress sources.
4. All stress sources are inter-related, and what we see at any given point in the earth's crust
is the resultant of different sources.
5. The many methods for stress measurement involve significantly different concepts, and
need to be carefully ranked in terms of their reliability. Interpretation of stress data without
any quality ranking or weighting can provide misleading results.
This research, along with new updates by the WSM project, provide the most comprehensive global
stress database available, and represent our greatest understanding of the crustal stress field to date.
However, there are still several places in which the WSM contains no, or sparse, data (Figure 1).
Whilst geomechanical-numerical models and interpolation methods may provide insight into the
likely stress orientations in these regions, the results of this thesis highlight the great importance of
having high quality in-situ stress data, and sufficient data density, in order to reliably assess the
stress field. Furthermore, the results of this thesis, and the WSM in general, can be compared with
geological settings in order to make predictions about the regional orientation, and likely degree of
local variation, in unstudied areas. For example, the SHmax orientations in active intra-arc regions
(such as New Zealand’s North Island) are generally sub parallel to the rift axis, while the SHmax
orientation in active foreland settings is generally perpendicular to the mountain belt (e.g. Papua
New Guinea and the Molasse Basin in Europe). Hence, by developing and understanding the links
between geological settings and SHmax orientations in the WSM, and particularly studying the stress
orientation on a range of scales, we can potentially predict the regional and in-situ stress pattern
throughout the Earth’s crust.
309

Figure 1: The 2016 version of the World Stress Map (WSM) contain 42870 maximum horizontal stress (SHmax) data records. This thesis conducted the stress analysis in
Australia (a), New Zealand (b) and Iceland (c). Compare this map with the 2008 release of the WSM (Figure 9 in Chapter 2). The 2016 release of the ASM contained 2140
A-E quality data records in 30 regions. In the new version of the WSM map, New Zealand is represented by 652 A-E quality. Iceland (c) contains 495 A-E quality SHmax data
records.

Figure 2: Classification of various orders of crustal stress sources with spatial and temporal effects, as well as major implications and some Australian examples. According to this classification, the orders of stress in the earth’s lithosphere can be explained by interaction of different sources. (a) Plate boundary forces are the first-order control on the stress field of continental Australia. (b) and (c) show significant rotation of stress orientations due to presence of second and third order of stress sources (basement structures, faults and lithological contrasts) in the Surat and Gunnedah basins in eastern Australia. (d) Shows an example of stress rotation at wellbore scale owing to fourth-order of stress sources (faults and fractures).
311

8. Contribution to Additional Papers
8.1. Journal Paper:
Paper 10: The Effect of Magmatic Intrusions on Coalbed Methane
Reservoir Characteristics: A Case Study from the Hoskissons
Coalbed, Gunnedah Basin, Australia
Salmachi, A., Rajabi, M., Reynolds, P., Yarmohammadtooski, Z., Wainman, C. 2016. The
effect of magmatic intrusions on coalbed methane reservoir characteristics: A case study from
the Hoskissons coalbed, Gunnedah Basin, Australia. International Journal of Coal Geology
165, 278-289. DOI: http://dx.doi.org/10.1016/j.coal.2016.08.025.
312

313

International Journal of Coal Geology 165 (2016) 278–289
Contents lists available at ScienceDirect
International Journal of Coal Geology
j ourna l homepage: www.e lsev ie r .com/ locate / i j coa lgeo
The effect of magmatic intrusions on coalbed methane reservoircharacteristics: A case study from the Hoskissons coalbed, GunnedahBasin, Australia
Alireza Salmachi ⁎, Mojtaba Rajabi, Peter Reynolds, Zahra Yarmohammadtooski, Carmine WainmanAustralian School of Petroleum, University of Adelaide, Adelaide, SA 5005, Australia
⁎ Corresponding author.E-mail address: [email protected] (A. S
http://dx.doi.org/10.1016/j.coal.2016.08.0250166-5162/© 2016 Elsevier B.V. All rights reserved.
a b s t r a c t
a r t i c l e i n f oArticle history:Received 4 April 2016Received in revised form 24 August 2016Accepted 26 August 2016Available online 28 August 2016
Magmatic intrusions can deteriorate coalbedmethane reservoir quality by precipitating minerals in natural frac-ture and cleat system. To date, the effect of magmatic intrusions on coal rank and maturity has been studied ex-tensively. However, their impact on fluid flow capacity and gas content is poorly investigated. This studyevaluates the impact of magmatic intrusions on reservoir characteristics of the Hoskissons coal interval in theGunnedah Basin (eastern Australia) where numerous coal-intrusion associations exist. Drill stem test (DST),borehole image logs and core data are used to determine fluid flow characteristics, gas content and quality in14 wells across the Gunnedah Basin. The integration of borehole image logs and DST data analysis enables usto determine the existence, openness, and hydraulic conductivity of natural fracture and cleat systems in theHoskissons coal interval. In addition, available desorption canister data, gas composition data, and conventionalwell logs are interpreted to investigate probable thermal effect on gas content.Our analyses of different datasets reveal that the thickness of intrusions and their positions with respect to theHoskissons coal interval are variable in the studied wells. Permeability varies from 1091 mD down to zeroowing to heterogeneous fracture and cleat systems. Interpreted natural fracture/cleat systems arewell correlatedwith measured permeability from DST data analysis. This highlights the role of open natural fractures/cleats influid flow characteristics of the Hoskissons coal interval. Results indicate that the mineralizing effect of hydro-thermal fluids derived either frommagmatic intrusions or coal itself is not a controlling factor in fluid flow capac-ity of the Hoskissons coal interval in the studied wells. This is described by either the distance between coalsection and major intrusions in some wells or perhaps emplacement of intrusive bodies prior to developmentof cleat and natural fracture networks. The destructive impact of intrusions on permeability is observed in oneof the studied wells in which in-situ stress perturbation is large (due to presence of magmatic intrusions in sed-imentary rocks). Variable in-situ stress orientation can decrease fracture connectivity and consequentlyfluidflowproperties are affected. Gas content largely varies in heat affected coal intervals. This signature is the result ofthermal effect fading with distance and is more pronounced when intrusions are in close proximity to coal inter-vals. Gas composition is variable in the studied wells. Gas composition data indicate that high quality desorbedgas with methane concentration higher than 90% could be found even in coal intervals which are heavilyintruded.
© 2016 Elsevier B.V. All rights reserved.
Keywords:Coalbed methane (CBM)Gas contentFluid flow characteristicsMagmatic intrusionsDrill stem testBorehole image log
1. Introduction
Intrusive magmatic systems can be composed of interconnectedbodies of magma, such as sills, dykes and laccoliths (Duff and Holmes,1993). These features often preferentially exploit structural weaknessessuch as faults (Magee et al., 2013) aswell as focusing alongmechanical-ly weak lithologies (Schofield et al., 2012). Magmatic intrusions intrud-ing into coalbed can play an important role in coalbed methanereservoir properties (Cooper et al., 2007; Golab et al., 2007). The effect
almachi).
31
of magmatic intrusions on coalbeds can include changes in geochemicaland petrographic properties, coal rank, vitrinite reflectance, micro- andmeso-pore structure, and fluid flow characteristics. These effects havebeen investigated in various regions and basins worldwide such as theKaroo Basin in South Africa, Sangatta coal deposit of East Kalimantanin Indonesia, Bukit Asam deposit of Sumatra, Pennsylvanian coals inthe Illinois Basin in the United States, and coalbeds of the GunnedahBasin, Australia (Amijaya and Littke, 2006; Gröcke et al., 2009; Gurbaand Weber, 2001; Mastalerz et al., 2009; Moore, 2012; Rimmer et al.,2009).
The extent of the altered zone in coal depends on temperature andsize of the igneous bodies as well as cooling mechanisms (Barker et
4

279A. Salmachi et al. / International Journal of Coal Geology 165 (2016) 278–289
al., 1998; Bostick and Pawlewicz, 1984; Crelling and Dutcher, 1968).Hence, it is explained as a function of intrusion thickness and can varyfrom only a fraction of intrusion thickness up to several times the intru-sion thickness (Aghaei et al., 2015; Golab et al., 2007; Jones and Creaney,1977; Mastalerz and Jones, 1988; Stewart et al., 2005).
Temperature at close contact between coal and intrusions can bepossibly higher than 600 °C for a fairly short period of time (Stewartet al., 2005). This temperature is higher than typical temperatures re-quired for normal coalification condition (Rimmer et al., 2009). Typicaltemperatures for normal coalification process are less than170 °C for bi-tuminous coals and less than 250 °C for anthracite coals (Taylor et al.,1998). This results in increase in vitrinite reflectance, fixed carbon,and ash content followed by decline in volatile matter content(Rimmer et al., 2009; Stewart et al., 2005; Yoksoulian et al., 2016).Mastalerz et al. (2009) described increase in vitrinite reflectance from0.62% up to 5.03% over a distance of 5 m from a large dike, and from0.63% up to 3.71% within a distance of 3.3 m from a small dike forcoals in the Illinois Basin. Yoksoulian et al. (2016) also indicated thatcoal rank changes from high volatile bituminous rank (vitrinite reflec-tance of 0.6–0.7%) to meta-anthracite rank (vitrinite reflectance of5.3%) within a distance of 10 m from a dike. Adjacent to an intrusion,volatilematter (VM) content of the coal decreaseswhereasfixed carbon(FC) and ash content can increase (Rahman and Rimmer, 2014; Rimmeret al., 2009; Yoksoulian et al., 2016).
Gas storage and quality and geo-mechanical and fluid flow proper-ties could also change in intruded coals (Gurba and Ward, 1998;Gurba and Weber, 2001; Rajabi et al., 2016b). Variation in gas contentis a function of several parameters including coal rank, coal depth, prox-imity to magmatic intrusions, and the sealing capacity of overlying for-mations (Gurba and Weber, 2001; Moore, 2012; Salmachi et al., 2015).Gas desorption canister tests assist to evaluate gas storability of the coaland also its quality. High concentration of inert gases including carbondioxide and nitrogen affects the economic value of the produced gas.High carbon dioxide content in coals of the Sydney Basin in Australiais believed to have roots in shallow seated magmatic intrusions (Faizet al., 2007). High concentration of carbon dioxide maybe related tocontact metamorphism effects or degassing of magma (Moore, 2012).
Hydrothermal circulation systems triggered by magmatic intrusionsat shallow depth are highlymineralizing (Holford et al., 2013). These sys-tems can play an important role in fluid flow characteristics of coal sec-tions, through precipitating minerals and infilling fractures and cleats(Golab et al., 2007). This impairs coal permeability and deteriorates con-ditions for gas production from coalbeds. Fracture and cleat filling withminerals has been stated in literature for various magmatic intrusion-coal associations (Golab et al., 2007; Mastalerz et al., 2009). The intensityof mineralization increases with proximity to the intrusion. Due to varia-tion in cleat and natural fracture systems, coal permeability shows signif-icant variability even in a specific coalbed in a region (Ayers, 2002;Laubach et al., 1998; Palmer, 2010). Hence, along with gas content, gasquality and coal thickness, comprehensive permeability measurement isof significant importance to generate themap of sweet spots and fairwaysin coalbed methane reservoirs (Ayers, 2002; Palmer, 2010).
Magmatic intrusions are able to act as seals or barriers to gas migra-tion from underlying coal deposits and affect coal gas contents acrossthe reservoir. For example, Gurba and Weber (2001) demonstratedthat coals which are located beneath large sills have high gas contentcompared to those on top of the sills in the Gunnedah Basin in easternAustralia. The sealing capacity of intrusions is related to their lateral ex-tent, thickness, and the abundance of cooling joints, fractures and inter-connected gas vesicles (Holford et al., 2013; Rateau et al., 2013). Hence,extensive dataset including intrusion morphology, dynamics of magmaflow, depth of emplacement, well logs and core data are required fordetailed analysis of intrusion impacts on coalbed methane reservoirproperties. The study of intrusionmorphology and emplacementmech-anisms is commonly undertaken using 3D seismic data (Schofield et al.,2012; Thomson, 2007) and/or field observations (Hutton, 2009).
315
Source rock related properties (gas content and gas quality) alongwith fluid flow ability (coal permeability) of coalbeds are crucial for ex-ploration and production of these self-sourcing reservoirs (Ayers, 2002;Moore, 2012). Hence, in this paperwe aim to investigate the effect of in-trusions and their associated hydrothermal circulations on fluid flowcharacteristics of the coalbed in the Gunnedah Basin, eastern Australia.We first investigate the presence of magmatic intrusions in the studiedwells using wellbore data. Then, we interpret DST data and boreholeimage logs in 14 wells that are located from north to south of theGunnedah Basin to explain fluid flow characteristics of the Hoskissonscoalbed. We particularly study the quality of the natural fracture/cleatsystems, absolute permeability, gas content and gas quality using differ-ent type of analyses and data. Finally, we show and explain the consis-tency of the results and highlight the role of magmatic intrusions onreservoir characteristics.
2. Geological setting of the study area
The Gunnedah Basin is one of the major coal Basins in eastern Aus-tralia that covers an area of over 15,000 km2 in northeastern NewSouth Wales (Stewart et al., 1995). The Permo-Triassic GunnedahBasin accommodates up to 1200 m marine and non-marine sedimentsand has considerable potential for coalbed gas exploration and produc-tion (Othman et al., 2001; Stewart et al., 1995; Tadros, 1993). The basinis a part of the Sydney-Gunnedah-Bowen Basin system which initiatedin an extensional tectonic setting (rift basin) during the Late Carbonifer-ous to Early Permian (Glen, 2005; Tadros, 1993). Due to extensional set-ting of the basin, significant rift volcanic covered the basement rocks ofthe Lachlan Fold Belt and produced several troughs that are filled by(coal bearing) sediments (Danis et al., 2010; Tadros, 1993). Fig. 1shows the simplified geological map of the Gunnedah Basin and the lo-cation of the studied wells to assess prospective gas production fromcoals of the Gunnedah Basin. During and at the end of the Late Permian,the Sydney-Gunnedah-Bowen Basin system converted to a coal-bearingforeland basin dominated by compressional regime, uplift and erosion(Danis et al., 2010; Glen, 2005; Tadros, 1993). The Surat Basin formedover the northern and western parts of the Gunnedah Basin duringthe Jurassic-Cretaceous. More details about the geology and tectonicsetting of the Gunnedah Basin can be found in Tadros (1993), Glen(2005), and Danis et al. (2010).
The Late PermianHoskissons coalmeasure is one of themost impor-tant coalbeds in the Gunnedah Basin and has significant potential formethane extraction (Tadros, 1993). The coal measures contain a num-ber of magmatic intrusions which have been intersected by drill holes,particularly in the southeast of the Basin (Gurba and Ward, 1998;Gurba andWeber, 2001). These intrusionswhich range from a few cen-timeters to some tens ofmeters in thickness, are of basic and intermedi-ate composition and are Late Triassic to Tertiary in age (Gurba andWeber, 2001). Contact metamorphism associated with the intrusionshas resulted in the generation of hydrocarbons (Gurba and Weber,2001; Othman et al., 2001).
3. Methodology
The methods and techniques assist to characterize the Hoskissonscoalbed are listed in Fig. 2. Reservoir characterization is placed intotwo categories of fluid flow characteristics and gas content and quality.Gas content and gas quality are studied using available desorption can-ister data. Fluid flow characteristics (absolute permeability and qualityof natural fracture/cleat systems) are studied by DST data analysis andborehole image logs interpretation.
The thickness and interaction of magmatic intrusions with theHoskissons coalbed are identified at wellbore-scale usingwell log inter-pretation, core analysis, and well completion reports. Due to lack ofhigh-resolution 2D and 3D seismic data, we are not able to investigatethe 3D morphology of intrusions. However, the position of major

Fig. 1. Simplified geological map of the Gunnedah Basin and the location of the studiedwells. Themajority of the basement in the Gunnedah Basin ismetasediments andmetavolcanics ofthe Lachlan Fold Belt (Tadros, 1993).
280 A. Salmachi et al. / International Journal of Coal Geology 165 (2016) 278–289
intrusions with respect to the Hoskisson coal intervals are obtainedfrom wellbore data. Fig. 3 shows major magmatic intrusions and theHoskissons coalbed intersected in the studied wells. Magmatic intru-sions are emplaced either in close proximity or farther distances to theHoskissons coal intervals. Due to proximity to intrusions, coal intervalsin Lake Goran 1 and Kahlua 1 are heat affected (see Fig. 3). As demon-strated in Fig. 3, Lake Goran 1 has the thickest intrusion (126m in thick-ness) and the Hoskissons coal interval is sandwiched betweenintrusions. Coal interval in Kahlua 1 is intruded by a 3-m thick intrusionand as a result, coal is heat affected close to the intrusion.
31
3.1. Gas content and quality
Gas desorption analysis has been performed on core samples in thestudy area to investigate gas storage capability of coalbeds of theGunnedah Basin. The total gas content including lost gas (Q1), desorbedgas (Q2), and residual gas (Q3) are obtained from the New SouthWalesDepartment of Resources and Energy database. The lost gas (Q1) is esti-mated using Smith and William method (Smith and Williams, 1984).Desorbed gas (Q2) is obtained bymeasuring the amount of gas releasedfrom core samples in canister using the method specified in Australian
6

Coalbed methane reservoir
charactrization
Gas content and quality
Desorption
analysis
Gas content Gas composition
Core and well log
analysis
Coal rank
Fluid flow
characterstics
DST analysis
Permeability
Borehole image
log analysis
Natural fracture/cleat
network
Fig. 2. The workflow to study reservoir characteristics of the Hoskissons coalbed. Gas content and its quality are studied by desorption canister data. Fluid flow characteristics of the coalintervals are studied by DST data analysis and borehole image log interpretation.
281A. Salmachi et al. / International Journal of Coal Geology 165 (2016) 278–289
Standards (Standards, 1999). Waiting time for desorption period variesbetween 30 days to 90 days. Total gas content is explained in dry, ashfree basis (DAF) for comparison purposes. Gas composition samplesare normally taken from desorption canister immediately after finalcanister reading. The results used in this study are based on an air-freebasis assuming only the measured constituents are present.
Fig. 3. Position of nearby intrusions with respect to the Hoskissons coal interval in the studiedwleft blank for better visualization.
317
3.2. Drill stem test data analysis
Drill stem test is generally run in a well being drilled to evaluate theflowpotential for an unknown formation of interest (Earlougher, 1977).DST provides a temporary completion for thewell by isolating the targetformation from the wellbore using downhole packers (Earlougher,
ells. Onlymajor intrusions and Hoskissons coal intervals are shown. Other formations are

282 A. Salmachi et al. / International Journal of Coal Geology 165 (2016) 278–289
1977). Formation fluid is produced through drill string and bottom-holepressures and temperatures are recorded using downhole gauges. DSTtests usually include two flow periods and two shut-in periods. Finalflow and shut-in periods are generally longer than initial flow andshut-in periods. Hence; they are more reliable for data analysis(Hackbarth, 1978; Matthews and Russell, 1967). Analysis of DST dataassists to estimate two fundamental flow properties including perme-ability (K) and skin factor (S). The DST data of studiedwells have gener-ally final flow periods (second flow period) of 30 to 90 min and finalshut-in periods of 2 to 12 h.
In this study, the final shut-in period data (second build up test) areanalyzed to determine coalbed permeability. Shut-in pressures are ex-tracted from second pressure signal (pressures recorded after the sec-ond flow period until the end of the test). The diagnostic plotsincluding the plots of ΔP and its logarithmic derivative versus Δ t arecalculated and used to identify radial flow regime in these tests. Oncelogarithmic derivative ofΔP versusΔt in logarithmic scale stabilizes, ra-dial flow regime may be identified. On the Horner plot, the slope of thestraight-line section is used to calculate absolute permeability (relativepermeability to water). Coalbed permeability is calculated fromstraight-line section of theHorner plot using Eq. (1) (Earlougher, 1977):
K mDð Þ ¼ −162:6� qw � Bw � μw
mhð1Þ
where K is permeability in millidarcy, qw is the average water flow rateduring the flow period in barrels per day, Bw is the water formation vol-ume factor, μw is the water viscosity at the reservoir temperature incentipoise (μ), h is the coalbed thickness in feet, and m is the slope ofthe straight-line section in the Horner plot.
3.3. Borehole image log
Borehole image logs provide a 360° picture of the borehole wall andprovide valuable sources of information for fracture interpretation, in-situ stress and palaeo-stress analysis, sedimentary facies analysis andreservoir modelling (Finkbeiner et al., 1997; Prensky, 1999; Rajabi etal., 2010, 2016a; Wilson et al., 2013). In the petroleum industry thereare variety of borehole image logs that investigate different physicalproperties of rock and fluid on the borehole wall including resistivity,acoustic and density. In this study, we analyzed acoustic boreholeimage logs of 14 wells in which ultrasonic waves are sent to the bore-hole wall and travel time and amplitude of reflected signals are
Fig. 4.Gas content range (minimumandmaximum) for the Hoskissons coal section in the studiHeat affected coals aremarkedwith red rectangles. NoDSTwas run in Culgoora 1a; therefore, p
31
recorded (Prensky, 1999). Generally different materials have differentacoustic properties particularly open fractures/cleats. Open fractures/cleats invaded by drilling mud have low-amplitudes and can be distin-guished from rock matrix by their different acoustic properties. In thisstudy, acoustic borehole image log is employed to investigate the qual-ity of natural fracture/cleat systemwith particular emphasis on the frac-ture/cleat frequency in coal section and their openness. Borehole imagelog interpretations combined with permeability measurement usingDSTdata analysis provide a robust practice to assess fluidflow capabilityof the coal section.
4. Analysis and discussion
4.1. Gas content and quality
Gas content measurements of the Hoskissons coalbed in the studiedwells are summarized in Fig. 4. The difference between minimum andmaximum gas contents is an indication of variability of gas content inthe coal interval. Generally, the variability of gas content in theHoskissons coal interval is significant when coal is heat affected (seeFig. 4). The maximum gas content measured in the Hoskissons coal in-terval of Lake Goran 1 and Kahlua 1 are approximately 3 to 4 timeshigher than their minimum gas content.
LakeGoran 1 is the examplewell inwhich coal is confinedwithmag-matic intrusions. This well is heavily intruded and the Hoskissons coalsection is sandwiched between an upper 126 m-thick intrusion (258-384m) and a threemeter thick intrusion toward the base of the section.Core analysis indicates that the upper intrusion is dark green to purpleand black, crystalline, and has high strength. The upper intrusion isemplaced approximately 16 m away from top of the Hoskissons coalsection. The minor intrusion (415–418.6 m) at the base of the coal sec-tion is separated by a thin bedof siltstone. Fig. 5 is the gas content profilefor Lake Goran 1, constructed based on available desorption canisterdata. Gas content profile includes coalbeds of the Trinkey Formation(100.0–218.1 m), the Breeza coal Member (385.1–386.7 m), and theHoskissons coal interval (405.6–414.3 m). Gas content of the individualcoalbed (197.4–198.2 m) situated close to the top of the first major in-trusion (200-240 m) is elevated compared to upper coalbeds in theTrinkey Formation. Coalbeds of Breeza Member (385–385.7 m and386.3–387m) are at close proximity to the base of the secondmajor in-trusion (see Fig. 5) and their gas contents are also elevated. As the dis-tance between coalbed and intrusion increases gas content rapidlydecreases. Although thick intrusions exist on top of the Hoskissons
edwells. Coal permeability, calculated by DST data analysis, has been labeled for eachwell.ermeability is not available (NA).
8
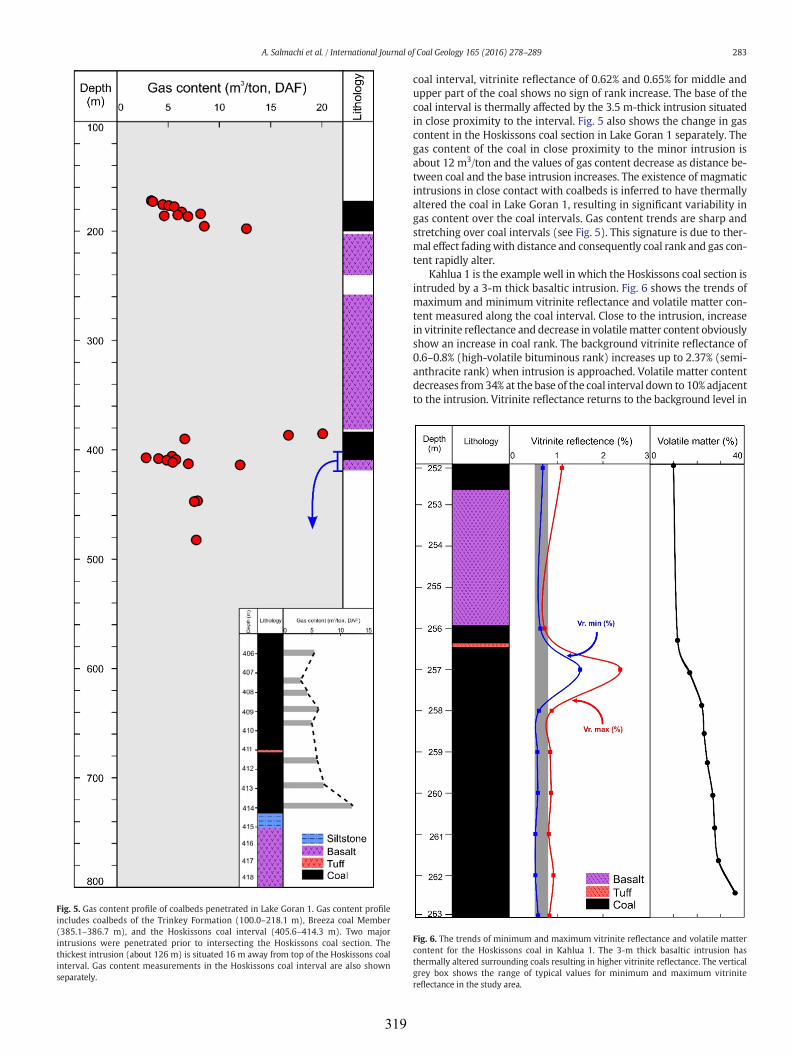
Fig. 5. Gas content profile of coalbeds penetrated in Lake Goran 1. Gas content profileincludes coalbeds of the Trinkey Formation (100.0–218.1 m), Breeza coal Member(385.1–386.7 m), and the Hoskissons coal interval (405.6–414.3 m). Two majorintrusions were penetrated prior to intersecting the Hoskissons coal section. Thethickest intrusion (about 126 m) is situated 16 m away from top of the Hoskissons coalinterval. Gas content measurements in the Hoskissons coal interval are also shownseparately.
283A. Salmachi et al. / International Journal of Coal Geology 165 (2016) 278–289
319
coal interval, vitrinite reflectance of 0.62% and 0.65% for middle andupper part of the coal shows no sign of rank increase. The base of thecoal interval is thermally affected by the 3.5 m-thick intrusion situatedin close proximity to the interval. Fig. 5 also shows the change in gascontent in the Hoskissons coal section in Lake Goran 1 separately. Thegas content of the coal in close proximity to the minor intrusion isabout 12 m3/ton and the values of gas content decrease as distance be-tween coal and the base intrusion increases. The existence of magmaticintrusions in close contact with coalbeds is inferred to have thermallyaltered the coal in Lake Goran 1, resulting in significant variability ingas content over the coal intervals. Gas content trends are sharp andstretching over coal intervals (see Fig. 5). This signature is due to ther-mal effect fadingwith distance and consequently coal rank and gas con-tent rapidly alter.
Kahlua 1 is the example well in which the Hoskissons coal section isintruded by a 3-m thick basaltic intrusion. Fig. 6 shows the trends ofmaximum and minimum vitrinite reflectance and volatile matter con-tent measured along the coal interval. Close to the intrusion, increasein vitrinite reflectance and decrease in volatilematter content obviouslyshow an increase in coal rank. The background vitrinite reflectance of0.6–0.8% (high-volatile bituminous rank) increases up to 2.37% (semi-anthracite rank) when intrusion is approached. Volatile matter contentdecreases from34% at the base of the coal interval down to 10% adjacentto the intrusion. Vitrinite reflectance returns to the background level in
Fig. 6. The trends of minimum and maximum vitrinite reflectance and volatile mattercontent for the Hoskissons coal in Kahlua 1. The 3-m thick basaltic intrusion hasthermally altered surrounding coals resulting in higher vitrinite reflectance. The verticalgrey box shows the range of typical values for minimum and maximum vitrinitereflectance in the study area.

Table 1Gas composition analysis for the Hoskissons coal interval in the studied wells.
Well nameSample meandepth (m)
Methane(%CH4)
Carbon dioxide(%CO2)
Other gases(%)
Blue Hills 2 674.6 25.94 72.06 2676.36 9.67 85.51 4.82678.68 23.16 75.26 1.58
Culgoora 1a 743.895 92.02 5.09 2.89746.05 96.61 3.05 0.34747.425 97.44 2.32 0.24748.9 97.69 2.1 0.21
Culgoora 2 742.75 50.98 48.95 0.07743.555 54.83 45.11 0.06744.8 84.17 15.71 0.12749 88.03 11.81 0.16749.8 63.94 35.98 0.08
Brigalow park 2 475.065 98.91 1 0.09476.925 98.94 0.89 0.17479.32 99.45 0.47 0.08480.575 99.25 0.69 0.06483.275 99.02 0.9 0.08
Yallambee 2 737.53 15.96 83.94 0.1739.085 15.26 84.65 0.09741.765 16.5 83.39 0.11
Dewhurst 19 446.655 25.15 74.78 0.07448.67 26.1 71.83 2.07451.845 22.16 77.77 0.07
Kahlua 1 251.32 72.9 21.14 5.96256.25 94 0.5 5.5257.05 90.6 4 5.4257.85 92.1 3.3 4.6258.55 93.8 2.8 3.4259.25 86.6 9.4 4260.05 90.4 3.9 5.7260.85 92 2.6 5.4
Lake Goran 1 405.94 93.4 0.59 6.01407.345 95.1 0.78 4.12408.04 93.5 0.67 5.83408.905 91.6 0.6 7.8409.615 94.2 0.89 4.91411.505 90.8 0.85 8.35412.84 91.6 0.57 7.83413.905 93.6 0.73 5.67
Glasserton 1 316.66 96.1 3.87 0.03319.37 97.4 2.54 0.06321 95 4.99 0.01322.84 87.5 12.47 0.03324.345 94.4 5.56 0.04
Maroo 1503.11 28.6 71.39 0.01504.61 18.77 81.20 0.03
Bomera East 1 708.395 15.4 84.58 0.02709.865 14 85.95 0.05715.69 15 84.95 0.05716.73 12.8 87.17 0.03
Kerawah 1 775.385 5.67 94.19 0.14776.28 5.25 94.75 0777.025 5.17 94.81 0.02777.745 5.75 94.24 0.01779.46 6.1 93.76 0.14780.165 6.32 93.67 0.01780.895 6.35 93.63 0.02782.205 5.97 94.01 0.02782.925 6.45 93.45 0.1783.645 6.42 93.57 0.01784.36 6.33 93.66 0.01785.085 6.07 93.92 0.01785.815 5.93 94.06 0.01
Slacksmith 1 333.37 10.5 1.12 88.38334.04 6.1 2.58 91.32335.98 7.4 3.06 89.54338.31 4.5 2.22 93.28340.47 6.6 3.26 90.14342.26 16.4 1.06 82.54
Warrah 1 986.13 93 5.28 1.72987.16 91 8.24 0.76988.44 94.3 4.96 0.74989.24 94.1 5.14 0.76989.935 95 4.29 0.71
Table 1 (continued)
Well nameSample meandepth (m)
Methane(%CH4)
Carbon dioxide(%CO2)
Other gases(%)
991.26 77.5 10.51 11.99993.04 95 4.35 0.65994.44 94.5 4.75 0.75995.83 91.7 7.68 0.62996.71 92.2 6.97 0.83
Source: The New South Wales Department of Resources and Energy database.
284 A. Salmachi et al. / International Journal of Coal Geology 165 (2016) 278–289
32
the study area over a distance of about 2 m. Gas contents of thermallyaltered coals (10 m3/ton) are approximately two times higher thangas contents of unaltered coals (~5 m3/ton) located toward the base ofthe coal interval. As distance between coal and intrusion increases, ther-mal alteration fades and consequently vitrinite reflectance decreases.This is in agreement with the previous studies conducted on the effectof intrusions on prospective coal rank and vitrinite reflectance in theGunnedah Basin (Gurba and Ward, 1998; Gurba and Weber, 2001).Magmatic intrusions had favorable impact on reservoir quality of theHoskissons coalbed by elevating gas content in both Lake Goran 1 andKahlua 1. High gas content of coals at vicinity of magmatic intrusionsin the Gunnedah Basin contradicts with the findings of Mastalerz et al.(2009) for Pennsylvanian coals in the vicinity of dykes in the IllinoisBasin. Mastalerz et al. (2009) reported extreme reduction of micro-and meso-pore volumes for coals at proximity of intrusions which isan unfavorable condition for gas sorption. The contradiction is perhapsrelated to the scales at which these studies have been conducted. Thisstudy is conducted at a large scale to evaluate prospective gas produc-tion from heat affected coals while the study conducted by Mastalerzet al. (2009) is at a much smaller scale.
Gas quality is also an important factor to take into account the eco-nomic viability of CBM producers. In this study, gas quality is assessedby concentration of productive gases; predominantly methane. Gascomposition of desorbed gas samples for the Hoskissons coal intervalin the studiedwells is shown in Table 1. The number of gas compositiondata available for each well depends on the number of desorbed gassamples collected. Fig. 7 shows the gas composition (methane and car-bon dioxide concentrations) trends along the coal intervals in Kahlua 1and Lake Goran 1. Despite an abundance of intrusions close to theHoskisson coal interval in Lake Goran 1, methane concentration ishigher than 90% in all the desorbed gas samples. Gas composition anal-ysis also shows coal gas is rich in methane in Kahlua 1. Gas contents atclose proximity to intrusions have been elevated in Lake Goran 1 andKahlua 1 and gas composition analysis indicates desorbed gases arerich in methane. This suggests magmatic intrusions did not downgradethe quality of coal gas in these two wells.
Gas composition and desorbed gas analyses in Blue Hills 2 indicatescoal has high gas content and carbon dioxide is the dominant compo-nent. High gas content in some of the studied wells is explained byhigh concentrations of carbon dioxide in desorbed gas samples. A labo-ratory study on Australian coals suggests that coal storage capacity ofcarbon dioxide is about twice that of methane (Faiz et al., 2007). Con-centration of carbon dioxide in all gas composition samples is higherthan 70% in Blue Hills 2 (see Table 1) indicating no potential for meth-ane extraction. High concentration of carbon dioxide in desorbed gassamples of Blue Hills 2 might have roots in intrusions which are at im-mediate contact with the coal interval (see Fig. 3). The link betweenmagmatic intrusion andhigh concentration of carbon dioxide in coalbedgas is still not well understood (Moore, 2012) and requires further in-depth research.
4.2. Fluid flow characteristics
Interpretation of open natural fractures and cleat systems incoalbeds via borehole image logs enables us to predict the productivityof coalbed in the studied wells. However there are several examples in
0

Table 2Permeability of the Hoskissons coal interval in the studied wells.
Well name Seam depth (m) Absolute permeability (mD)
Blue hills 2 674.31–682.29 0Culgoora 1aa 742.8–748.78 Not availableCulgoora 2 742.58–750.94 0Brigalow Park 2 473.58–486.00 4.53Yallambee 2 737.02–745.86 0Dewhurst 19 446.19–452.25 986Kahlua 1 247.91–264.60 376Lake Goran 1 405.6–414.3 0.0225Glasserton 1 316.2–324.7 1091Maroo 1 503.5–506.5 23Bomera East 1 701.7–718.8 6Kerawah 1 775–786.3 1.075Slacksmith 1 330–344.5 33.2Warrah 1 984.4–998.7 0
a No DST was run in Culgoora 1a; hence, coal permeability is not available.
Fig. 7. Gas composition (only methane and carbon dioxide) trends in the Hoskissons coal interval in Kahlua 1 and Lake Goran 1. Gas contents have been elevated in close proximity tointrusions and desorbed gas is rich in methane.
285A. Salmachi et al. / International Journal of Coal Geology 165 (2016) 278–289
the published literature that show the interpreted open fractures inimage logs may not hydraulically open due to the presence of frac-ture-filling material (Bailey et al., 2014; Dewhurst and Jones, 2002;Laubach et al., 2004). Hence, correlating natural fracture system withpermeability data calculated by DST data analysis can further confirmwhether interpreted open fractures in the coal section are hydraulicallyopen and contribute to fluid flow or not. Permeability of the Hoskissonscoal section along with quality of natural fracture and cleat systems arestudied to investigate the probable impact of magmatic intrusions andtheir associated hydrothermal circulations on fluid flow characteristics.
The DST data analysis has been performed for all the studied wellsthat had available and mechanically successful drill stem tests. Perme-ability of Hoskissons coal interval is calculated in each well and is sum-marized in Table 2. Permeability varies from 1091 mD down to almostzero. Fig. 8 shows DST data analysis for two of the studied wells;Slacksmith 1 and Glasserton 1. The entire pressure profiles, diagnosticplots, and the Horner plots are shown in Fig. 8. DST data analysis is per-formed based on single phase flow of water from the coal interval. Theexistence of a permeable formation isolated between downhole packersduring the test may affect calculations and results in overestimation ofpermeability. Hence; lithology has been investigated in the studiedwells to ensure the produced water, collected during the test, onlyflows from the coal interval. For example, in Slacksmith 1, impermeablebeds of siltstone are interbedded with the coal section in the tested in-terval. Hence, produced water most probably flows from coal section.Results indicate that the Hoskissons coal permeability (relative perme-ability to water) is higher than 1 Darcy in Glasserton 1. The second flowperiod in the pressure profile of Glasserton 1 is sharp and looks different
321
from the one observed in Slacksmith 1. The rapid increase in pressure isan indication of strong hydraulic conductivity.
Generally, the deeper the Hoskissons coalbed, the lower the perme-ability is. The variability in coal permeability is attributed to the hetero-geneous nature of cleat and fracture systems. Fig. 9 shows thecorrelation between borehole image logs and coal permeability calcu-lated by DST data analysis for selected wells. Dewhurst 19, Kahlua 1,Slacksmith 1, and Glasserton 1 have the highest permeability amongthe studied wells. They spot a fairway for the Hoskissons coal in theGunnedah Basin (see Fig. 1 for location of high permeable wells marked
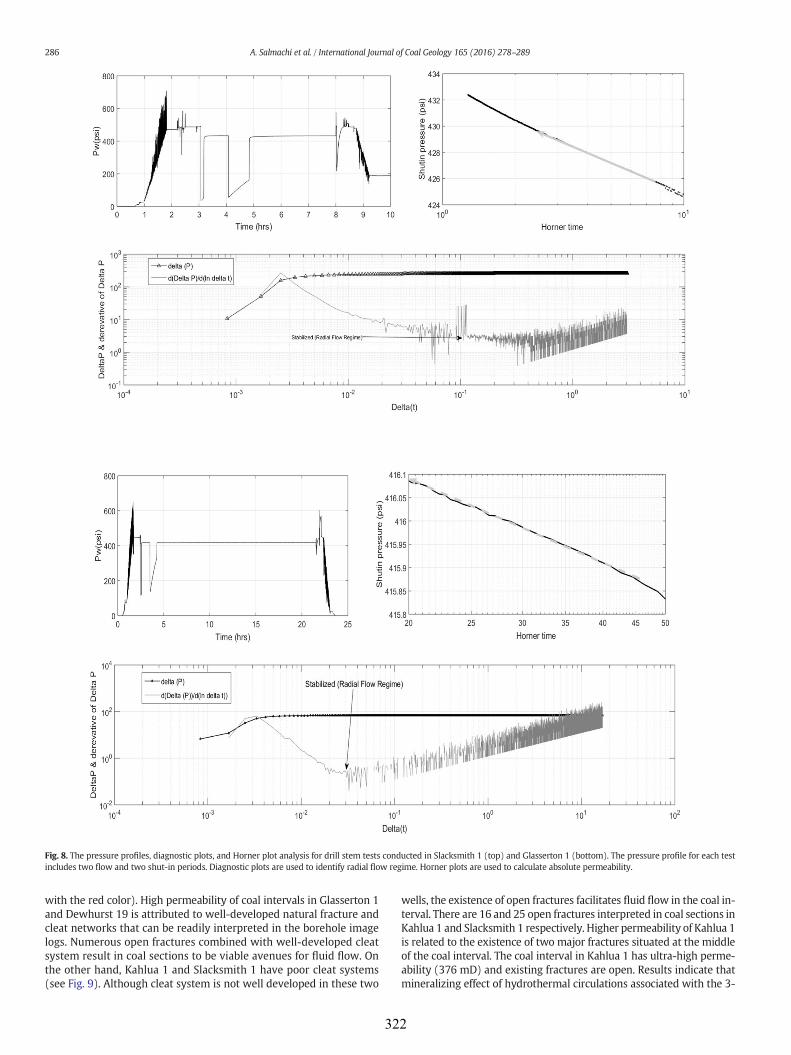
Fig. 8. The pressure profiles, diagnostic plots, and Horner plot analysis for drill stem tests conducted in Slacksmith 1 (top) and Glasserton 1 (bottom). The pressure profile for each testincludes two flow and two shut-in periods. Diagnostic plots are used to identify radial flow regime. Horner plots are used to calculate absolute permeability.
286 A. Salmachi et al. / International Journal of Coal Geology 165 (2016) 278–289
with the red color). High permeability of coal intervals in Glasserton 1and Dewhurst 19 is attributed to well-developed natural fracture andcleat networks that can be readily interpreted in the borehole imagelogs. Numerous open fractures combined with well-developed cleatsystem result in coal sections to be viable avenues for fluid flow. Onthe other hand, Kahlua 1 and Slacksmith 1 have poor cleat systems(see Fig. 9). Although cleat system is not well developed in these two
32
wells, the existence of open fractures facilitates fluid flow in the coal in-terval. There are 16 and 25 open fractures interpreted in coal sections inKahlua 1 and Slacksmith 1 respectively. Higher permeability of Kahlua 1is related to the existence of two major fractures situated at the middleof the coal interval. The coal interval in Kahlua 1 has ultra-high perme-ability (376 mD) and existing fractures are open. Results indicate thatmineralizing effect of hydrothermal circulations associated with the 3-
2

Fig. 9. Borehole image logs for selected wells in the study area. Borehole image logs show natural fracture/cleat intensity in the Hoskisson coal section. Coal permeability calculated by DST data analysis is well correlated with fracture/cleat networkquality interpreted by borehole image logs.
A.Salm
achietal./InternationalJournalofCoalGeology
165(2016)
278–289

288 A. Salmachi et al. / International Journal of Coal Geology 165 (2016) 278–289
m thick intrusion (emplaced within the coal interval) had negligible ef-fect on fluid flow capacity of the coal interval. Intrusion emplacementprior to fracture developmentmay describe the negligible impact of hy-drothermal circulation on fluid flow capability of the coal interval in thisparticular case.
The destructive impact of intrusions on coal permeability is observedin Lake Goran 1. This well is located in the direction of high permeablewells identified in the study area but coal interval has very low perme-ability. Although there are open fractures in the coal interval, DST dataanalysis indicates very low fluid flow which can be interpreted as lowhydraulic connectivity among fractures. Low hydraulic connectivitymaybe due to the stresses induced by extensive intrusions propagatedaround the coal interval. In-situ stress analysis in Lake Goran 1 byRajabi et al. (2016b) reveals that variable orientation of maximum hor-izontal stress (~40° standard deviation) in this well is due to the pres-ence of magmatic intrusions and associated faults. The orientation ofmaximum horizontal stress is an important factor in fluid flow of frac-tured reservoirs (Barton et al., 1995; Finkbeiner et al., 1997; Rajabi etal., 2010; Rajabi et al., 2016a). Hence, fracture connectivity may be im-paired due to large stress perturbation and as a result, permeability isreduced.
Hoskissons coal interval is intersected at higher depth (701.7–718.8 m) in Bomera East 1 compared to the other wells presented inFig. 9. Eight open fractures are identified and coal permeability is esti-mated to be 6mD. Lowpermeability of coal interval ismost probably re-lated to higher depth of the coal interval resulting in higher compactionand lower fluid conductivity. During the drill stem test, a clean andcoarse to very coarse sandstone formation (about two meters in thick-ness) was isolated in the tested interval. Hence, water flow from sand-stone formation could have affected the test and coal permeabilitymaybe overestimated in Bomera East 1.
Permeability measurement in the studied wells indicates the rela-tionship between coal permeability and depth follows the most likelypattern expected; the higher the depth, the lower the permeability is.Themineralizing effect of hydrothermal fluids derived either frommag-matic intrusions or coal itself is not observed to be a controlling factor influid flow capability of coal intervals in the studied wells. Boreholeimage log interpretation indicates very limited numbers of fracturesare closed in the Hoskissons coal interval. Considering the fact thatHoskissons coal coexists with extensive magmatic intrusions in theGunnedah Basin, it is of great importance that coal hydraulic conductiv-ity is not damaged by hydrothermal circulations. One proposal is thatthe magmatic intrusions were emplaced prior to development of natu-ral fracture and cleat systems. Understanding the time ofmagmatic em-placement and time of cleat development requires further research toconfirm this proposal. The other explanation is the distance between in-trusions and coal interval. The separation between coal and intrusionmakes it difficult for hydrothermal fluids to reach to coal interval insomewells. Hence, precipitation ofminerals in fractures and cleats asso-ciated with hydrothermal circulations is not considerable.
5. Conclusions
An extensive dataset from 14 core wells in the Gunnedah Basin wasused to study the impact of magmatic intrusions on reservoir character-istics of the Hoskissons coalbed. Reservoir characteristics include per-meability, quality of natural fractures and cleats, gas content and itsquality. A number of intrusions are intersected prior to the Hoskissonscoal interval in the studied wells. The thickness of intrusions is variablefrom only a few centimeters up to tens of meters. The Hoskissons coalsection is sandwiched between intrusions in Lake Goran 1 and is intrud-ed in Kahlua 1. Thermal effects associatedwith intrusions have elevatedgas content in heat affected coals in Lake Goran 1 and Kahlua 1. Gascomposition analysis also indicates desorbed gas samples in thesewells are rich in methane. Therefore, magmatic intrusions had a favor-able impact on coal gas storability in these two wells.
32
Coal permeability significantly varies in the area from 1091 mDdown to approximately zero. The deeper the Hoskissons coalbed, thelower the permeability is. Significant variability in coal permeability isattributed to heterogeneous fracture and cleat systems. Hydraulic con-ductivity of natural fracture/cleat systemswas not impaired bymineral-izing effect of hydrothermal circulations. This is inferred frominterpreted open natural fracture/cleat systemswhich arewell correlat-ed with coal permeability. This is explained by the distance betweenmajor intrusions and coal section in somewells whichmakes it difficultfor hydrothermal fluids to access the fracture/cleat systems. Emplace-ment of intrusions prior to development of fracture/cleat systems mayalso describe low impact of mineralizing effect of hydrothermal circula-tions on coal permeability especially in coal intervals which are in closeproximity to intrusions (for example Kahlua 1). The destructive impactof intrusions on coal permeability is observed in LakeGoran 1where theintrusions have affected the orientation of in-situ stress. Large stressperturbation can have detrimental effect on fracture connectivity andas a result, fluid flow capability of the coal is affected.
Acknowledgements
The authors would like to acknowledge the ‘New South Wales De-partment of Resources and Energy’ for providing the data of thisstudy.Wealsowould like to thank the Ikon Science of Adelaide (former-ly JRS Petroleum Research) for the use of their JRS Suite.
References
Aghaei, H., Gurba, L.W., Ward, C.R., Hall, M., Mahmud, S.A., 2015. Effects of igneous intru-sions on thermal maturity of carbonaceous fluvial sediments: a case study of theEarly Cretaceous Strzelecki Group in west Gippsland, Victoria, Australia. Int. J. CoalGeol. 152 (Part A), 68–77.
Amijaya, H., Littke, R., 2006. Properties of thermally metamorphosed coal from TanjungEnim Area, South Sumatra Basin, Indonesia with special reference to the coalificationpath of macerals. Int. J. Coal Geol. 66, 271–295.
Ayers Jr., W.B., 2002. Coalbed gas systems, resources, and production and a review of con-trasting cases from the San Juan and Powder River basins. AAPG Bull. 86, 1853–1890.
Bailey, A., King, R., Holford, S., Sage, J., Backe, G., Hand, M., 2014. Remote sensing of sub-surface fractures in the Otway Basin, South Australia. J. Geophys. Res. Solid Earth119, 6591–6612.
Barker, C.E., Bone, Y., Lewan, M.D., 1998. Fluid inclusion and vitrinite-reflectancegeothermometry compared to heat-flow models of maximum paleotemperaturenext to dikes, western onshore Gippsland Basin, Australia. Int. J. Coal Geol. 37,73–111.
Barton, C.A., Zoback, M.D., Moos, D., 1995. Fluid flow along potentially active faults incrystalline rock. Geology 23, 683–686.
Bostick, N., Pawlewicz, M., 1984. Paleotemperatures based on vitrinite reflectance ofshales and limestones in igneous dike aureoles in the Upper Cretaceous PierreShale, Walsenburg, Colorado. In: Woodward, J.G., Meissner, F.F., Clayton, J.L. (Eds.),Hydrocarbon Source Rocks of the Greater Rocky Mountain Region, Rocky MountainAssociation of Geologists, pp. 387–392.
Cooper, J.R., Crelling, J.C., Rimmer, S.M., Whittington, A.G., 2007. Coal metamorphism byigneous intrusion in the Raton Basin, CO and NM: implications for generation of vol-atiles. Int. J. Coal Geol. 71, 15–27.
Crelling, J.C., Dutcher, R.R., 1968. A petrologic study of a thermally altered coal from thePurgatoire River Valley of Colorado. Geol. Soc. Am. Bull. 79, 1375–1386.
Danis, C., O'Neill, C., Lackie, M.A., 2010. Gunnedah Basin 3D architecture and upper crustaltemperatures. Aust. J. Earth Sci. 57, 483–505.
Dewhurst, D.N., Jones, R.M., 2002. Geomechanical, microstructural, and petrophysicalevolution in experimentally reactivated cataclasites: applications to fault seal predic-tion. AAPG Bull. 86, 1383–1405.
Duff, P.M.D., Holmes, A., 1993. Holmes' Principles of Physical Geology. Taylor & Francis.Earlougher, R.C., 1977. Advances in Well Test Analysis. Henry L. Doherty Memorial Fund
of AIME.Faiz, M., Saghafi, A., Barclay, S., Stalker, L., Sherwood, N., Whitford, D., Scientific, C., 2007.
Evaluating geological sequestration of CO2 in bituminous coals: the southern SydneyBasin, Australia as a natural analogue. Int. J. Greenhouse Gas Control 1, 223–235.
Finkbeiner, T., Barton, C.A., Zoback, M.D., 1997. Relationships among in-situ stress, frac-tures and faults, and fluid flow: Monterey formation, Santa Maria Basin, California.Am. Assoc. Pet. Geol. Bull. 81, 1975–1999.
Glen, R.A., 2005. The Tasmanides of eastern Australia. Geol. Soc. Lond., Spec. Publ. 246,23–96.
Golab, A.N., Hutton, A.C., French, D., 2007. Petrography, carbonate mineralogy and geo-chemistry of thermally altered coal in Permian coal measures, Hunter Valley, Austra-lia. Int. J. Coal Geol. 70, 150–165.
Gröcke, D.R., Rimmer, S.M., Yoksoulian, L.E., Cairncross, B., Tsikos, H., van Hunen, J., 2009.No evidence for thermogenic methane release in coal from the Karoo-Ferrar large ig-neous province. Earth Planet. Sci. Lett. 277, 204–212.
4

289A. Salmachi et al. / International Journal of Coal Geology 165 (2016) 278–289
Gurba, L.W., Ward, C.R., 1998. Vitrinite reflectance anomalies in the high-volatile bitumi-nous coals of the Gunnedah Basin, New South Wales, Australia. Int. J. Coal Geol. 36,111–140.
Gurba, L.W., Weber, C.R., 2001. Effects of igneous intrusions on coalbed methane poten-tial, Gunnedah Basin, Australia. Int. J. Coal Geol. 46, 113–131.
Hackbarth, D., 1978. Application of the drill-stem test to hydrogeology. Groundwater 16,5–11.
Holford, S., Schofield, N., Jackson, C., Magee, C., Green, P., Duddy, I., 2013. Impacts of Igne-ous Intrusions on Source and Reservoir Potential in Prospective Sedimentary BasinsAlong the Western Australian Continental Margin, West Australian Basins Sympo-sium 18–21 August 2013.
Hutton, D., 2009. Insights into magmatism in volcanic margins: bridge structures and anew mechanism of basic sill emplacement–Theron Mountains, Antarctica. Pet.Geosci. 15, 269–278.
Jones, J., Creaney, S., 1977. Optical character of thermally metamorphosed coals of north-ern England. J. Microsc. 109, 105–118.
Laubach, S., Marrett, R., Olson, J., Scott, A., 1998. Characteristics and origins of coal cleat: areview. Int. J. Coal Geol. 35, 175–207.
Laubach, S.E., Olson, J.E., Gale, J.F.W., 2004. Are open fractures necessarily aligned withmaximum horizontal stress? Earth Planet. Sci. Lett. 222, 191–195.
Magee, C., Jackson, C.A.-L., Schofield, N., 2013. The influence of normal fault geometry onigneous sill emplacement and morphology. Geology 41, 407–410.
Mastalerz, M., Jones, J., 1988. Coal rank variation in the Intrasudetic Basin, SW Poland. Int.J. Coal Geol. 10, 79–97.
Mastalerz, M., Drobniak, A., Schimmelmann, A., 2009. Changes in optical properties,chemistry, and micropore and mesopore characteristics of bituminous coal at thecontact with dikes in the Illinois Basin. Int. J. Coal Geol. 77, 310–319.
Matthews, C.S., Russell, D.G., 1967. Pressure Buildup and Flow Tests in Wells. Society ofpetroleum engineers of AIME Dallas, TX.
Moore, T.A., 2012. Coalbed methane: a review. Int. J. Coal Geol. 101, 36–81.Othman, R., Arouri, K.R., Ward, C.R., McKirdy, D.M., 2001. Oil generation by igneous intru-
sions in the northern Gunnedah Basin, Australia. Org. Geochem. 32, 1219–1232.Palmer, I., 2010. Coalbed methane completions: a world view. Int. J. Coal Geol. 82,
184–195.Prensky, S.E., 1999. Advances in borehole imaging technology and applications. Geol. Soc.
Lond., Spec. Publ. 159, 1–43.Rahman, M.W., Rimmer, S.M., 2014. Effects of rapid thermal alteration on coal: geochem-
ical and petrographic signatures in the Springfield (No. 5) Coal, Illinois Basin. Int.J. Coal Geol. 131, 214–226.
Rajabi, M., Sherkati, S., Bohloli, B., Tingay,M., 2010. Subsurface fracture analysis and deter-mination of in-situ stress direction using FMI logs: an example from the Santoniancarbonates (Ilam Formation) in the Abadan Plain, Iran. Tectonophysics 492, 192–200.
325
Rajabi, M., Tingay, M., Heidbach, O., 2016a. The present-day state of tectonic stress in theDarling Basin, Australia: implications for exploration and production. Mar. Pet. Geol.77, 776–790.
Rajabi, M., Tingay, M., Heidbach, O., 2016b. The present-day stress field of New SouthWales, Australia. Aust. J. Earth Sci. 63, 1–21.
Rateau, R., Schofield, N., Smith, M., 2013. The potential role of igneous intrusions on hy-drocarbon migration, West of Shetland. Pet. Geosci. 19, 259–272.
Rimmer, S.M., Yoksoulian, L.E., Hower, J.C., 2009. Anatomy of an intruded coal, I: effect ofcontact metamorphism on whole-coal geochemistry, Springfield (No. 5) (Pennsylva-nian) coal, Illinois Basin. Int. J. Coal Geol. 79, 74–82.
Salmachi, A., Wainman, C.C., Rajabi, M., McCabe, P., 2015. Effect of volcanic intrusions andmineral matters on desorption characteristics of coals (case study), SPE Asia PacificUnconventional Resources Conference and Exhibition. Society of Petroleum Engi-neers, SPE-176841, Brisbane, Australia.
Schofield, N.J., Brown, D.J., Magee, C., Stevenson, C.T., 2012. Sill morphology and compar-ison of brittle and non-brittle emplacement mechanisms. J. Geol. Soc. 169, 127–141.
Smith, D.M., Williams, F.L., 1984. Diffusion models for gas production from coals: applica-tion to methane content determination. Fuel 63, 251–255.
Standards, A., 1999. Guide to the Determination of Gas Content of Coal - Direct DesorptionMethod.
Stewart, J.R., Alder, D., Wales, N.S., 1995. New South Wales Petroleum Potential. Depart-ment of Mineral Resources.
Stewart, A.K., Massey, M., Padgett, P.L., Rimmer, S.M., Hower, J.C., 2005. Influence of abasic intrusion on the vitrinite reflectance and chemistry of the Springfield (No. 5)coal, Harrisburg, Illinois. Int. J. Coal Geol. 63, 58–67.
Tadros, N., 1993. The Gunnedah Basin, New South Wales. Department of Mineral Re-sources, Coal & Petroleum Geology Branch.
Taylor, G.H., Teichmüller, M., Davis, A., Diessel, C., Littke, R., Robert, P., 1998. Organic Pe-trology. Gebrüder Borntraeger, Berlin.
Thomson, K., 2007. Determiningmagma flow in sills, dykes and laccoliths and their impli-cations for sill emplacement mechanisms. Bull. Volcanol. 70, 183–201.
Wilson, M.E.J., Lewis, D., Yogi, O.K., Holland, D., Hombo, L., Goldberg, A., 2013. Develop-ment of a Papua New Guinean onshore carbonate reservoir: a comparative boreholeimage (FMI) and petrographic evaluation. Mar. Pet. Geol. 44, 164–195.
Yoksoulian, L.E., Rimmer, S.M., Rowe, H.D., 2016. Anatomy of an intruded coal, II: effect ofcontact metamorphism on organic δ13C and implications for the release of thermo-genic methane, Springfield (No. 5) Coal, Illinois Basin. Int. J. Coal Geol. 158, 129–136.

8. Contribution to Additional Papers
8.2. Conference Papers
1) Salmachi, A., Wainman, C.C., Rajabi, M., McCabe, P., 2015. Effect of Volcanic
Intrusions and Mineral Matters on Desorption Characteristics of Coals (Case Study), SPE
Asia Pacific Unconventional Resources Conference and Exhibition. Society of Petroleum
Engineers, Brisbane, Australia, 13 pages (SPE-176841-MS).
DOI: http://dx.doi.org/10.2118/176841-MS.
2) Burgin, H., Amrouch, K., Rajabi, M., 2016. 4D fracture distribution as a signature of
structural evolution in the Otway Basin, Australian Earth Science Convention (AESC) -
Uncover Earth’s Past to Discover our Future. Geological Society of Australia, Adelaide,
South Australia, p. 63.
326

Salmachi, A., Wainman, C.C., Rajabi, M. & McCabe, P. (2015). Effect of Volcanic Intrusions and Mineral Matters on Desorption Characteristics of Coals (Case Study), SPE Asia Pacific Unconventional Resources Conference and Exhibition. Society of Petroleum Engineers, Brisbane, Australia, 13 pages (SPE-176841-MS).
NOTE:
This publication is included on pages 327 - 339 in the print copy of the thesis held in the University of Adelaide Library.
It is also available online to authorised users at:
http://dx.doi.org/10.2118/176841-MS

4D Fracture Distribution as a Signature of Structural Evolution in the Otway Basin
Hugo Burgin1, Khalid Amrouch1 and Mojtaba Rajabi1
1: Australian School of Petroleum, The University of Adelaide, Australia
An understanding of the distribution of natural fractures throughout time and space within sedimentary basins can enable the optimisation of exploration and production methods. Additionally insights into the structural and tectonic evolution of a region can also be obtained. Natural fractures within the Otway Basin (South East Australia) have been identified via wellbore image log data (from the Penola Trough) and outcrop analysis (along the Great Ocean Road), and have been catalogued with regard to their direction of dip, degree of dip and inferred chronological regime of paleo-stress. Evidence for up to four paleo-tectonic stress regimes within the study area have been identified, with 8 individual fracture sets detected in well data and 6 sets detected from outcrop analysis at twelve localities within the study area. Once detected, each individual fracture set was assigned a conjugate pair based upon an inferred paleo-stress regime. Following the integration of well and field data sets, relative chronology between conjugate fracture pairs was determined via: the presence or absence of fracture sets within consecutive stratigraphic units, cross cutting relationships observed in the field and bedding / fracture orientation relationships. The result was a more complete understanding of the history of regional tectonics within the Otway Basin. Initial extension within the Otway Basin was in all likelihood orientated NE-SW, occurring over a prolonged period (Berriasian-Albian) during the Early Cretaceous. Followed by a basin inversion within the Otway that occurred during the Mid-Cretaceous (Cenomanian-Turonian), orientated NE-SW and then by renewed extension in a NW-SE orientation. Lastly a change to a NW-SE compressional regime from the Eocene-Recent was recorded and it is consistent with the measured in situ stress found to be approximately NW-SE as well.
340

9. Appendix:
This thesis provides the stress information in various regions. Hence, the
databases including stress map of Australia, New Zealand and Iceland are
presented in an attached CD-ROM as the appendix of this thesis.
341