Mapping and monitoring carbon stocks with satellite observations: a comparison of methods
7
BioMed Central Page 1 of 7 (page number not for citation purposes) Carbon Balance and Management Open Access Review Mapping and monitoring carbon stocks with satellite observations: a comparison of methods Scott J Goetz*, Alessandro Baccini, Nadine T Laporte, Tracy Johns, Wayne Walker, Josef Kellndorfer, Richard A Houghton and Mindy Sun Address: Woods Hole Research Center, 149 Woods Hole Road, Falmouth, MA 02540, USA Email: Scott J Goetz* - [email protected]; Alessandro Baccini - [email protected]; Nadine T Laporte - [email protected]; Tracy Johns - [email protected]; Wayne Walker - [email protected]; Josef Kellndorfer - [email protected]; Richard A Houghton - [email protected]; Mindy Sun - [email protected] * Corresponding author Abstract Mapping and monitoring carbon stocks in forested regions of the world, particularly the tropics, has attracted a great deal of attention in recent years as deforestation and forest degradation account for up to 30% of anthropogenic carbon emissions, and are now included in climate change negotiations. We review the potential for satellites to measure carbon stocks, specifically aboveground biomass (AGB), and provide an overview of a range of approaches that have been developed and used to map AGB across a diverse set of conditions and geographic areas. We provide a summary of types of remote sensing measurements relevant to mapping AGB, and assess the relative merits and limitations of each. We then provide an overview of traditional techniques of mapping AGB based on ascribing field measurements to vegetation or land cover type classes, and describe the merits and limitations of those relative to recent data mining algorithms used in the context of an approach based on direct utilization of remote sensing measurements, whether optical or lidar reflectance, or radar backscatter. We conclude that while satellite remote sensing has often been discounted as inadequate for the task, attempts to map AGB without satellite imagery are insufficient. Moreover, the direct remote sensing approach provided more coherent maps of AGB relative to traditional approaches. We demonstrate this with a case study focused on continental Africa and discuss the work in the context of reducing uncertainty for carbon monitoring and markets. Background The monitoring requirements for reducing emissions from deforestation and forest degradation have been widely discussed and documented in a range of publica- tions, including overviews of the general requirements to meet policy needs [1] as well as a variety of papers on the technical aspects and limitations of various monitoring approaches [2-5]. The general consensus of these docu- ments is that monitoring of forest cover change using sat- ellite remote sensing is practical and feasible for determining baseline deforestation rates against which future rates of change can be based, provided that ade- quate validation and accuracy assessments are conducted and documented. The type of monitoring and baseline approach used has been the subject of much discussion, with a range of modifications proposed to deal with Published: 25 March 2009 Carbon Balance and Management 2009, 4:2 doi:10.1186/1750-0680-4-2 Received: 13 January 2009 Accepted: 25 March 2009 This article is available from: http://www.cbmjournal.com/content/4/1/2 © 2009 Goetz et al; licensee BioMed Central Ltd. This is an Open Access article distributed under the terms of the Creative Commons Attribution License (http://creativecommons.org/licenses/by/2.0 ), which permits unrestricted use, distribution, and reproduction in any medium, provided the original work is properly cited.
-
Upload
independent -
Category
Documents
-
view
1 -
download
0
Transcript of Mapping and monitoring carbon stocks with satellite observations: a comparison of methods
BioMed CentralCarbon Balance and Management
ss
Open AcceReviewMapping and monitoring carbon stocks with satellite observations: a comparison of methodsScott J Goetz*, Alessandro Baccini, Nadine T Laporte, Tracy Johns, Wayne Walker, Josef Kellndorfer, Richard A Houghton and Mindy SunAddress: Woods Hole Research Center, 149 Woods Hole Road, Falmouth, MA 02540, USA
Email: Scott J Goetz* - [email protected]; Alessandro Baccini - [email protected]; Nadine T Laporte - [email protected]; Tracy Johns - [email protected]; Wayne Walker - [email protected]; Josef Kellndorfer - [email protected]; Richard A Houghton - [email protected]; Mindy Sun - [email protected]
* Corresponding author
AbstractMapping and monitoring carbon stocks in forested regions of the world, particularly the tropics,has attracted a great deal of attention in recent years as deforestation and forest degradationaccount for up to 30% of anthropogenic carbon emissions, and are now included in climate changenegotiations. We review the potential for satellites to measure carbon stocks, specificallyaboveground biomass (AGB), and provide an overview of a range of approaches that have beendeveloped and used to map AGB across a diverse set of conditions and geographic areas. Weprovide a summary of types of remote sensing measurements relevant to mapping AGB, and assessthe relative merits and limitations of each. We then provide an overview of traditional techniquesof mapping AGB based on ascribing field measurements to vegetation or land cover type classes,and describe the merits and limitations of those relative to recent data mining algorithms used inthe context of an approach based on direct utilization of remote sensing measurements, whetheroptical or lidar reflectance, or radar backscatter. We conclude that while satellite remote sensinghas often been discounted as inadequate for the task, attempts to map AGB without satelliteimagery are insufficient. Moreover, the direct remote sensing approach provided more coherentmaps of AGB relative to traditional approaches. We demonstrate this with a case study focused oncontinental Africa and discuss the work in the context of reducing uncertainty for carbonmonitoring and markets.
BackgroundThe monitoring requirements for reducing emissionsfrom deforestation and forest degradation have beenwidely discussed and documented in a range of publica-tions, including overviews of the general requirements tomeet policy needs [1] as well as a variety of papers on thetechnical aspects and limitations of various monitoringapproaches [2-5]. The general consensus of these docu-
ments is that monitoring of forest cover change using sat-ellite remote sensing is practical and feasible fordetermining baseline deforestation rates against whichfuture rates of change can be based, provided that ade-quate validation and accuracy assessments are conductedand documented. The type of monitoring and baselineapproach used has been the subject of much discussion,with a range of modifications proposed to deal with
Published: 25 March 2009
Carbon Balance and Management 2009, 4:2 doi:10.1186/1750-0680-4-2
Received: 13 January 2009Accepted: 25 March 2009
This article is available from: http://www.cbmjournal.com/content/4/1/2
© 2009 Goetz et al; licensee BioMed Central Ltd. This is an Open Access article distributed under the terms of the Creative Commons Attribution License (http://creativecommons.org/licenses/by/2.0), which permits unrestricted use, distribution, and reproduction in any medium, provided the original work is properly cited.
Page 1 of 7(page number not for citation purposes)
Carbon Balance and Management 2009, 4:2 http://www.cbmjournal.com/content/4/1/2
equity issues among countries with different historicalrates of deforestation. Methods to map and monitor forestdegradation, in which only a portion of the forest stock isremoved, have also been developed. These range fromstraightforward visual interpretation of satellite imagery atmultiple spatial scales (grain sizes) [6] to semi-automatedalgorithmic techniques that require technical expertise toimplement [7]. Mapping and monitoring of carbonstocks, on the other hand, has often been regarded asbeyond the current capability of satellite remote sensingtechnology, despite great need [8], partly because much ofthe research on this topic has historically focused on fieldsampling approaches [9]. Nonetheless, mapping carbonstocks over large areas without satellite data is clearlyproblematic [10].
Basing UNFCCC (United Nations Framework Conven-tion on Climate Change) REDD (Reduced Emissions fromDeforestation and Degradation) policies on a carbonstock mapping approach would have a number of benefitsrelative to approaches based solely on field sampling andforest inventories. This is true not only in terms of improv-ing estimates of carbon stored in forests for the emergingcarbon markets, by providing spatially explicit informa-tion on the location of carbon stocks, but also with respectto avoiding the ambiguities, uncertainties and outrightdifferences among land cover type classifications [11]. Acarbon stock approach could allow countries to report ata higher IPCC (Intergovernmental Panel on ClimateChange) reporting tier by providing country-specific dataand advanced methods and data for land conversions,even at a Tier 3 level which is defined in the Good PracticeGuidance (GPG) as including "models and inventorymeasurement systems tailored to address national circum-stances, repeated over time, and driven by high-resolutionactivity data and disaggregated at sub-national to fine gridscales (GPG 3.17)" [12]. A carbon stock monitoringapproach is directly linked with biomass dynamics. Sincesuch an approach does not depend upon the determina-tion of land use/cover types as a step in estimating bio-mass, the uncertainty associated with these classificationsis removed. Land classifications may still be applied to thebiomass map for the purposes of accounting and report-ing, but they are no longer a necessary step in the determi-nation of the biomass of the land area. A carbon stockmonitoring approach will introduce different, and per-haps additional, sources of uncertainty than other moretraditional methods, but can reduce the overall uncer-tainty level below Tier 1 methods, and depending on thespecific situation, is also likely to reduce uncertaintiesbelow Tier 2 methods, in addition to providing geograph-ically explicit information on changes in carbon stocks.This approach could be used to obtain estimates forabove-ground biomass (AGB) in all of the categories ofLULUCF (Land Use, Land Use Change and Forestry)reporting, including categories where land classification
remains the same (i.e. Forest Land Remaining ForestLand) and in categories defining changes in land use (i.e.Land Converted to Forest Land). Additionally, thisapproach would also allow a Tier 2 key category analysis(GPG 5.30), as it can provide specific uncertainty esti-mates for each category measured with this approach.
In the remainder of this overview we use carbon stock andabove-ground biomass terminology interchangeably(biomass is typically 50% carbon). We recognize that car-bon stocks can refer to below-ground and soil carbon aswell, neither of which are directly discussed here.
Overview of Satellite Measurements useful for Carbon Stock MappingSynthetic Aperture Radar (SAR)Since the 1960's, SAR has been used to produce images ofearth-surface features based on the principles of radiodetection and ranging (RADAR, often used as a synonymfor SAR) and has been widely used to map AGB [13,14].SAR systems are active, which means they transmit micro-wave energy and measure the amount of that energyreflected back to the sensor. As a result, SAR sensors canoperate day or night while penetrating through haze,smoke, and clouds. The microwave energy transmitted bya SAR also penetrates into forest canopies, with theamount of backscattered energy largely dependent on thesize and orientation of canopy structural elements, such asleaves, branches and stems. The sensitivity of SAR sensorsto different AGB components is a function of the wave-length of the sensor, with shorter-wavelengths (X and Cband) being sensitive to smaller canopy elements (leavesand small branches) and longer wavelengths (L and Pband) sensitive to large branches and stems. Measuringthe orientation (polarization) of the transmitted andreceived electro-magnetic waves allows for further sensi-tivity to AGB measurements. Also, the application ofinterferometric SAR (InSAR) is employed to improveretrievals of AGB through proxies of vegetation height[15]. Extensive analyses with existing SAR sensors, mostlyL-band, suggest the sensitivity of radar backscatter "satu-rates" around 100 – 150 tons ha-1 [13]. A number of radarsatellites are currently in operation, including the Cana-dian RADARSAT 1/2 (C-band), the Japanese ALOS/PAL-SAR (L-band), the European ENVISAT/ASAR (C-band),the German TerraSAR-X (X-band), and the Italian Cosmo/SkyMed (X-Band). Several others are planned for launchwithin 5–10 years, including the ALOS follow-on mission(L-Band), the NASA DESDynI (L-band), the EuropeanBIOMASS (P-band), the German Tandem-X (X-bandInSAR), and the German/Brazilian MAPSAR (L-Band).
Light Detection and Ranging (lidar)Like radar, lidar is based on the concept of actively sensingthe vegetation using a pulse of energy, in this case from alaser operating at optical wavelengths (rather than at radio
Page 2 of 7(page number not for citation purposes)
Carbon Balance and Management 2009, 4:2 http://www.cbmjournal.com/content/4/1/2
wavelengths). Lidar does not penetrate clouds but has theunique capability of measuring the three-dimensionalvertical structure of vegetation in great detail, sometimeswith hundreds of measurements in the vertical dimensionfor each location on the Earth [16]. Whereas lidar has onlybeen widely used for a little more than a decade, primarilyfor forestry operations using aircraft-based sensors, it hasrevolutionized the way vegetation, particularly biomass, ismeasured from satellites [17-21]. There are few lidarinstruments currently operating from satellite platforms,and none that were designed specifically for vegetationcharacterization. At least one such mission, a lidar onDESDynI, is planned for launch in the next few years. Acurrently operating satellite lidar sensor originallydesigned for monitoring ice dynamics, the GeoscienceLaser Altimetry System (GLAS) onboard ICESAT, is beingused for vegetation analysis despite having limited spatialcoverage and a relatively large (ca 70 m) ground footprint.
OpticalOptical remote sensing, i.e., passive sensing of visible andnear-infrared reflectance from the earth, forms the basisfor much of current global scale mapping (GoogleEarth,for example, is based on a combination of observationsfrom the Landsat and Quickbird series of satellites). Opti-cal measurements have been widely used in studies thatlink AGB measurements from the field to satellite obser-vations, based on sensitivity of the optical reflectance tovariations in canopy structure, but these have not provento be consistent over large areas because surface condi-tions may change more rapidly than the repeat time of thecloud-free satellite observations, producing artefacts inthe derived maps. This has been overcome using frequentrepeat measurements from sensors such as the ModerateResolution Imaging Sensors (MODIS) onboard the AQUAand TERRA satellites [20,22]. Despite some issues with thecontinuity of optical satellite missions [23] a wide rangeof sensors are expected to be operational well into thefuture.
Multi-sensor SynergyNo single sensor on any satellite mission, whether radar,lidar or optical, can be expected to provide consistentlyinfallible estimates of biomass, but use of these measure-ments in a synergistic fashion can potentially overcomethe limitations of each (whether radar saturation, lidarsampling modes, or optical temporal mismatches). More-over, some remote sensing observations may be more sen-sitive to AGB in specific environments (e.g. opticalradiometry in more arid areas) or in areas with differentAGB densities (e.g. lidar in dense humid forest).
Comparison of Methods to Map Carbon StocksA number of approaches have been developed to map car-bon stocks and AGB from the satellite observations
described above. Each of the approaches relies on calibrat-ing the satellite measurements to in situ estimates of AGBat field study plots. AGB is often determined using a com-bination of well documented allometric relationshipsbetween simple plot-level measurements (e.g. stem diam-eter, density and sometimes canopy height and/or depth)and AGB, where the latter is determined from trees thathave been dissected, oven-dried and weighed [9,24,25].This type of allometry has a long history and is used indaily forestry operations worldwide, although refine-ments are always needed and ongoing. We cannotdescribe all of the possible approaches to estimating AGBfrom satellite observations which include, for example,spatial interpolation and kriging of field measurements,but focus instead here on the most commonly used.
Stratify & Multiply (SM) ApproachThe simplest approach to derive carbon stock maps is toassign a single value (or a range of values) to each of anumber of land cover, vegetation type, or other thematicmap classes that have been derived from satellite data (orother map sources) and placed into categories (such asEvergreen Lowland Forest, Deciduous Forest, and thelike). These thematic class areas are then multiplied by theassigned values to estimate total carbon stock values. Landcover maps are widely available from a number of sources,with the most consistent and best-documented effort todate being the Global Land Cover 2000 maps producedby a broad consortium of research groups [26]. This "strat-ify & multiply" approach is limited in a number of ways,but primarily by the wide range of AGB variability withinany given thematic type class, and by ambiguities in thedefinition of those type classes (which is difficult to makeuniversal and thus has consumed the better part of manyworkshops over the years).
Combine & Assign (CA) ApproachAn extension of the stratify & multiply approach is a"combine & assign" approach, which essentially makesuse of a wider range of data sets and spatial informationto extend the field AGB estimates. For example, popula-tion estimates (or maps derived from interpolating popu-lation location data) can be used together with vegetationtype classes and any of a number of other spatial data lay-ers in a geographic information system (GIS) to providefiner-grained units over which the field data can beapplied (given that adequate field data exist to character-ize each of the basic map units). A substantial advantageto this approach, besides finer spatial units of aggregation,is that different weights can be applied to various data lay-ers in order to capture information that is known (such aslocations where forests are more degraded around settledareas) or to average gradients across large areas (such asvariations in vegetation density within type classes).Another advantage of this type of simplified GIS "model-
Page 3 of 7(page number not for citation purposes)
Carbon Balance and Management 2009, 4:2 http://www.cbmjournal.com/content/4/1/2
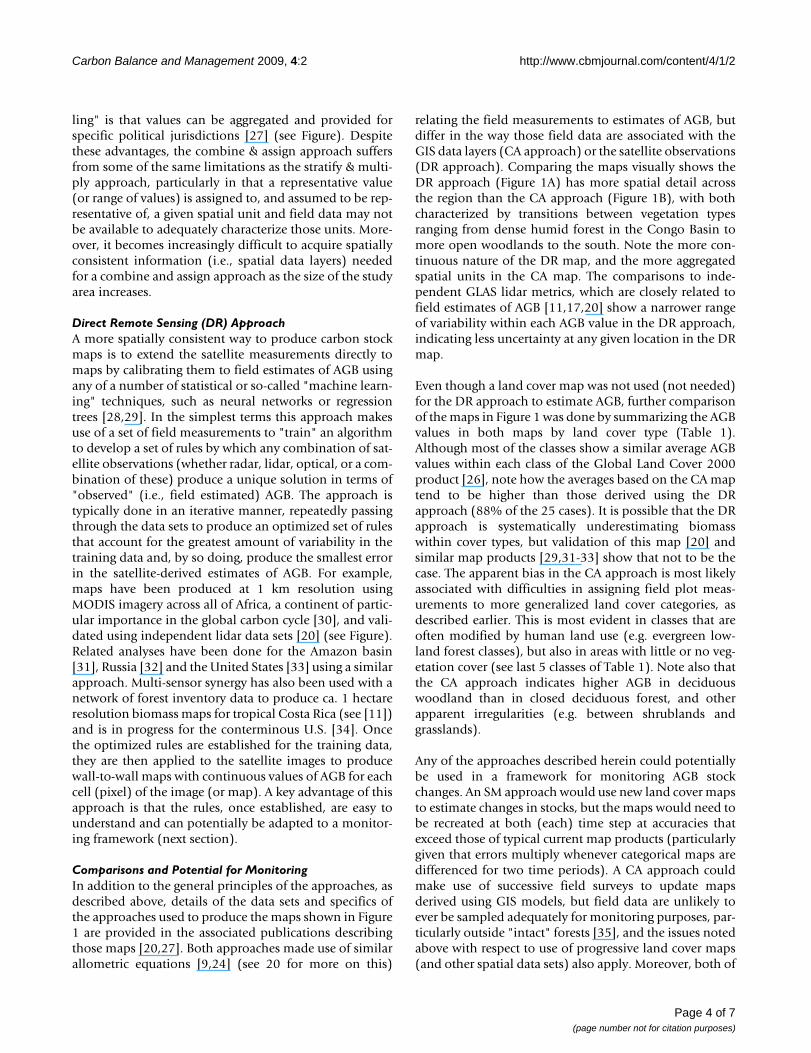
ling" is that values can be aggregated and provided forspecific political jurisdictions [27] (see Figure). Despitethese advantages, the combine & assign approach suffersfrom some of the same limitations as the stratify & multi-ply approach, particularly in that a representative value(or range of values) is assigned to, and assumed to be rep-resentative of, a given spatial unit and field data may notbe available to adequately characterize those units. More-over, it becomes increasingly difficult to acquire spatiallyconsistent information (i.e., spatial data layers) neededfor a combine and assign approach as the size of the studyarea increases.
Direct Remote Sensing (DR) ApproachA more spatially consistent way to produce carbon stockmaps is to extend the satellite measurements directly tomaps by calibrating them to field estimates of AGB usingany of a number of statistical or so-called "machine learn-ing" techniques, such as neural networks or regressiontrees [28,29]. In the simplest terms this approach makesuse of a set of field measurements to "train" an algorithmto develop a set of rules by which any combination of sat-ellite observations (whether radar, lidar, optical, or a com-bination of these) produce a unique solution in terms of"observed" (i.e., field estimated) AGB. The approach istypically done in an iterative manner, repeatedly passingthrough the data sets to produce an optimized set of rulesthat account for the greatest amount of variability in thetraining data and, by so doing, produce the smallest errorin the satellite-derived estimates of AGB. For example,maps have been produced at 1 km resolution usingMODIS imagery across all of Africa, a continent of partic-ular importance in the global carbon cycle [30], and vali-dated using independent lidar data sets [20] (see Figure).Related analyses have been done for the Amazon basin[31], Russia [32] and the United States [33] using a similarapproach. Multi-sensor synergy has also been used with anetwork of forest inventory data to produce ca. 1 hectareresolution biomass maps for tropical Costa Rica (see [11])and is in progress for the conterminous U.S. [34]. Oncethe optimized rules are established for the training data,they are then applied to the satellite images to producewall-to-wall maps with continuous values of AGB for eachcell (pixel) of the image (or map). A key advantage of thisapproach is that the rules, once established, are easy tounderstand and can potentially be adapted to a monitor-ing framework (next section).
Comparisons and Potential for MonitoringIn addition to the general principles of the approaches, asdescribed above, details of the data sets and specifics ofthe approaches used to produce the maps shown in Figure1 are provided in the associated publications describingthose maps [20,27]. Both approaches made use of similarallometric equations [9,24] (see 20 for more on this)
relating the field measurements to estimates of AGB, butdiffer in the way those field data are associated with theGIS data layers (CA approach) or the satellite observations(DR approach). Comparing the maps visually shows theDR approach (Figure 1A) has more spatial detail acrossthe region than the CA approach (Figure 1B), with bothcharacterized by transitions between vegetation typesranging from dense humid forest in the Congo Basin tomore open woodlands to the south. Note the more con-tinuous nature of the DR map, and the more aggregatedspatial units in the CA map. The comparisons to inde-pendent GLAS lidar metrics, which are closely related tofield estimates of AGB [11,17,20] show a narrower rangeof variability within each AGB value in the DR approach,indicating less uncertainty at any given location in the DRmap.
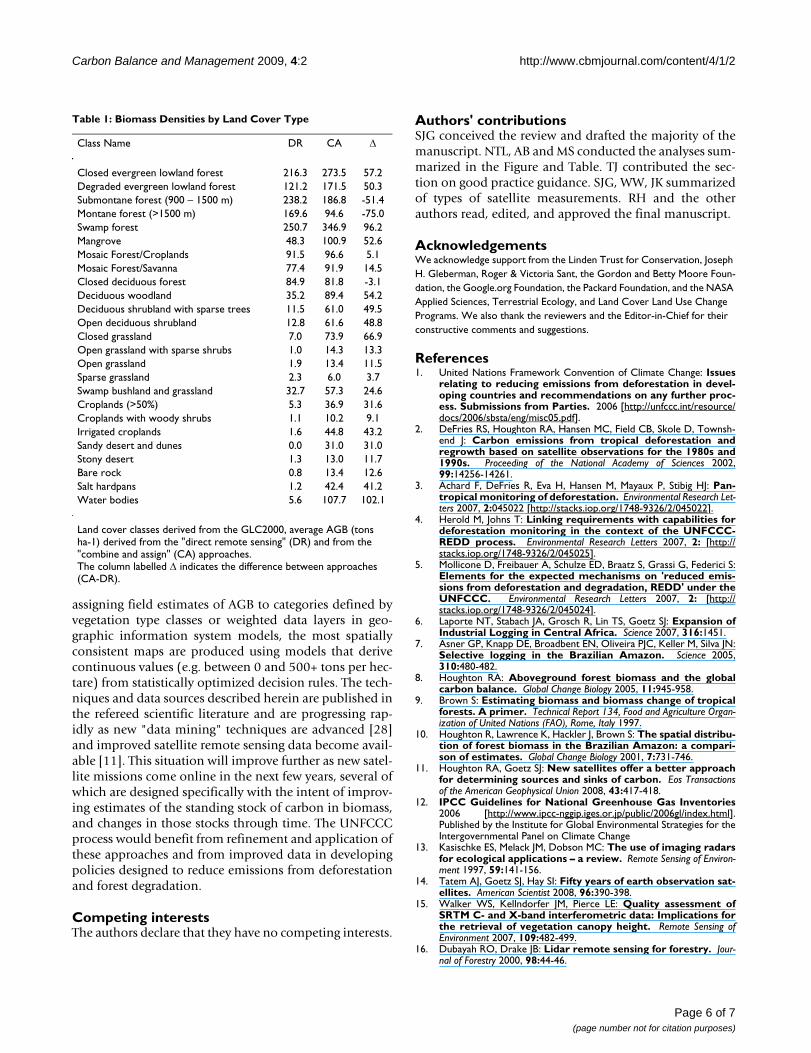
Even though a land cover map was not used (not needed)for the DR approach to estimate AGB, further comparisonof the maps in Figure 1 was done by summarizing the AGBvalues in both maps by land cover type (Table 1).Although most of the classes show a similar average AGBvalues within each class of the Global Land Cover 2000product [26], note how the averages based on the CA maptend to be higher than those derived using the DRapproach (88% of the 25 cases). It is possible that the DRapproach is systematically underestimating biomasswithin cover types, but validation of this map [20] andsimilar map products [29,31-33] show that not to be thecase. The apparent bias in the CA approach is most likelyassociated with difficulties in assigning field plot meas-urements to more generalized land cover categories, asdescribed earlier. This is most evident in classes that areoften modified by human land use (e.g. evergreen low-land forest classes), but also in areas with little or no veg-etation cover (see last 5 classes of Table 1). Note also thatthe CA approach indicates higher AGB in deciduouswoodland than in closed deciduous forest, and otherapparent irregularities (e.g. between shrublands andgrasslands).
Any of the approaches described herein could potentiallybe used in a framework for monitoring AGB stockchanges. An SM approach would use new land cover mapsto estimate changes in stocks, but the maps would need tobe recreated at both (each) time step at accuracies thatexceed those of typical current map products (particularlygiven that errors multiply whenever categorical maps aredifferenced for two time periods). A CA approach couldmake use of successive field surveys to update mapsderived using GIS models, but field data are unlikely toever be sampled adequately for monitoring purposes, par-ticularly outside "intact" forests [35], and the issues notedabove with respect to use of progressive land cover maps(and other spatial data sets) also apply. Moreover, both of
Page 4 of 7(page number not for citation purposes)

Carbon Balance and Management 2009, 4:2 http://www.cbmjournal.com/content/4/1/2
these approaches are prone to missing changes at grainsizes finer than the thematic map units, including forestdegradation and afforestation (regrowth) at time scalesthat are meaningful to the UNFCCC process. These issuesare unlikely to impact the DR approach for monitoringpurposes because land cover maps are not required, thespatial unit is typically much smaller than the otherapproaches (i.e. the pixel size), and the data sets used (sat-ellite observations) are not only more current but alsomore consistent through time (via routine calibrationefforts). Unlike land cover or land use maps, the satelliteobservations used in the DR approach are sensitive tochanges at the pixel level, thus even fine-scale changesassociated with degradation and afforestation can bedetected [11]. Nonetheless, more work needs to be done
with the DR approach in order to refine the process,reduce uncertainty (error), and better quantify therequirements (in terms of sample sizes and spatialextents) for field data sets needed to calibrate and validatethe models. This topic is the focus of both appliedresearch for the UNFCCC process and basic researchdesigning the next generation of satellite missions thatwill provide the essential data sets needed for any moni-toring system relevant to reducing emissions from defor-estation and forest degradation.
ConclusionWell documented techniques and satellite data enablereliable mapping of carbon stocks over large areas.Although a number of relatively simple methods exist for
Comparison of Central Africa Biomass MapsFigure 1Comparison of Central Africa Biomass Maps. Map of above ground biomass (AGB) across Africa produced using a "Direct Remote Sensing" approach (A) [20] and a "Combine and Assign" approach (B) [27]. The top images show maps of AGB for the tropical forest regions of Africa, with boxes indicating those areas shown in the bottom images. The inset line graphs in the top images show how the range of AGB relates to independent lidar metrics that are closely related to field estimates of AGB. Less variability in the lidar height metric for each associated AGB value in the maps indicates lower uncertainty and error.
Page 5 of 7(page number not for citation purposes)
Carbon Balance and Management 2009, 4:2 http://www.cbmjournal.com/content/4/1/2
assigning field estimates of AGB to categories defined byvegetation type classes or weighted data layers in geo-graphic information system models, the most spatiallyconsistent maps are produced using models that derivecontinuous values (e.g. between 0 and 500+ tons per hec-tare) from statistically optimized decision rules. The tech-niques and data sources described herein are published inthe refereed scientific literature and are progressing rap-idly as new "data mining" techniques are advanced [28]and improved satellite remote sensing data become avail-able [11]. This situation will improve further as new satel-lite missions come online in the next few years, several ofwhich are designed specifically with the intent of improv-ing estimates of the standing stock of carbon in biomass,and changes in those stocks through time. The UNFCCCprocess would benefit from refinement and application ofthese approaches and from improved data in developingpolicies designed to reduce emissions from deforestationand forest degradation.
Competing interestsThe authors declare that they have no competing interests.
Authors' contributionsSJG conceived the review and drafted the majority of themanuscript. NTL, AB and MS conducted the analyses sum-marized in the Figure and Table. TJ contributed the sec-tion on good practice guidance. SJG, WW, JK summarizedof types of satellite measurements. RH and the otherauthors read, edited, and approved the final manuscript.
AcknowledgementsWe acknowledge support from the Linden Trust for Conservation, Joseph H. Gleberman, Roger & Victoria Sant, the Gordon and Betty Moore Foun-dation, the Google.org Foundation, the Packard Foundation, and the NASA Applied Sciences, Terrestrial Ecology, and Land Cover Land Use Change Programs. We also thank the reviewers and the Editor-in-Chief for their constructive comments and suggestions.
References1. United Nations Framework Convention of Climate Change: Issues
relating to reducing emissions from deforestation in devel-oping countries and recommendations on any further proc-ess. Submissions from Parties. 2006 [http://unfccc.int/resource/docs/2006/sbsta/eng/misc05.pdf].
2. DeFries RS, Houghton RA, Hansen MC, Field CB, Skole D, Townsh-end J: Carbon emissions from tropical deforestation andregrowth based on satellite observations for the 1980s and1990s. Proceeding of the National Academy of Sciences 2002,99:14256-14261.
3. Achard F, DeFries R, Eva H, Hansen M, Mayaux P, Stibig HJ: Pan-tropical monitoring of deforestation. Environmental Research Let-ters 2007, 2:045022 [http://stacks.iop.org/1748-9326/2/045022].
4. Herold M, Johns T: Linking requirements with capabilities fordeforestation monitoring in the context of the UNFCCC-REDD process. Environmental Research Letters 2007, 2: [http://stacks.iop.org/1748-9326/2/045025].
5. Mollicone D, Freibauer A, Schulze ED, Braatz S, Grassi G, Federici S:Elements for the expected mechanisms on 'reduced emis-sions from deforestation and degradation, REDD' under theUNFCCC. Environmental Research Letters 2007, 2: [http://stacks.iop.org/1748-9326/2/045024].
6. Laporte NT, Stabach JA, Grosch R, Lin TS, Goetz SJ: Expansion ofIndustrial Logging in Central Africa. Science 2007, 316:1451.
7. Asner GP, Knapp DE, Broadbent EN, Oliveira PJC, Keller M, Silva JN:Selective logging in the Brazilian Amazon. Science 2005,310:480-482.
8. Houghton RA: Aboveground forest biomass and the globalcarbon balance. Global Change Biology 2005, 11:945-958.
9. Brown S: Estimating biomass and biomass change of tropicalforests. A primer. Technical Report 134, Food and Agriculture Organ-ization of United Nations (FAO), Rome, Italy 1997.
10. Houghton R, Lawrence K, Hackler J, Brown S: The spatial distribu-tion of forest biomass in the Brazilian Amazon: a compari-son of estimates. Global Change Biology 2001, 7:731-746.
11. Houghton RA, Goetz SJ: New satellites offer a better approachfor determining sources and sinks of carbon. Eos Transactionsof the American Geophysical Union 2008, 43:417-418.
12. IPCC Guidelines for National Greenhouse Gas Inventories2006 [http://www.ipcc-nggip.iges.or.jp/public/2006gl/index.html].Published by the Institute for Global Environmental Strategies for theIntergovernmental Panel on Climate Change
13. Kasischke ES, Melack JM, Dobson MC: The use of imaging radarsfor ecological applications – a review. Remote Sensing of Environ-ment 1997, 59:141-156.
14. Tatem AJ, Goetz SJ, Hay SI: Fifty years of earth observation sat-ellites. American Scientist 2008, 96:390-398.
15. Walker WS, Kellndorfer JM, Pierce LE: Quality assessment ofSRTM C- and X-band interferometric data: Implications forthe retrieval of vegetation canopy height. Remote Sensing ofEnvironment 2007, 109:482-499.
16. Dubayah RO, Drake JB: Lidar remote sensing for forestry. Jour-nal of Forestry 2000, 98:44-46.
Table 1: Biomass Densities by Land Cover Type
Class Name DR CA Δ
Closed evergreen lowland forest 216.3 273.5 57.2Degraded evergreen lowland forest 121.2 171.5 50.3Submontane forest (900 – 1500 m) 238.2 186.8 -51.4Montane forest (>1500 m) 169.6 94.6 -75.0Swamp forest 250.7 346.9 96.2Mangrove 48.3 100.9 52.6Mosaic Forest/Croplands 91.5 96.6 5.1Mosaic Forest/Savanna 77.4 91.9 14.5Closed deciduous forest 84.9 81.8 -3.1Deciduous woodland 35.2 89.4 54.2Deciduous shrubland with sparse trees 11.5 61.0 49.5Open deciduous shrubland 12.8 61.6 48.8Closed grassland 7.0 73.9 66.9Open grassland with sparse shrubs 1.0 14.3 13.3Open grassland 1.9 13.4 11.5Sparse grassland 2.3 6.0 3.7Swamp bushland and grassland 32.7 57.3 24.6Croplands (>50%) 5.3 36.9 31.6Croplands with woody shrubs 1.1 10.2 9.1Irrigated croplands 1.6 44.8 43.2Sandy desert and dunes 0.0 31.0 31.0Stony desert 1.3 13.0 11.7Bare rock 0.8 13.4 12.6Salt hardpans 1.2 42.4 41.2Water bodies 5.6 107.7 102.1
Land cover classes derived from the GLC2000, average AGB (tons ha-1) derived from the "direct remote sensing" (DR) and from the "combine and assign" (CA) approaches.The column labelled Δ indicates the difference between approaches (CA-DR).
Page 6 of 7(page number not for citation purposes)
Carbon Balance and Management 2009, 4:2 http://www.cbmjournal.com/content/4/1/2
Publish with BioMed Central and every scientist can read your work free of charge
"BioMed Central will be the most significant development for disseminating the results of biomedical research in our lifetime."
Sir Paul Nurse, Cancer Research UK
Your research papers will be:
available free of charge to the entire biomedical community
peer reviewed and published immediately upon acceptance
cited in PubMed and archived on PubMed Central
yours — you keep the copyright
Submit your manuscript here:http://www.biomedcentral.com/info/publishing_adv.asp
BioMedcentral
17. Lefsky MA, Harding DJ, Keller M, Cohen WB, Carabajal CC, Del BomEspirito-Santo F, Hunter MO, de Oliveira R: Estimates of forestcanopy height and aboveground biomass using ICESat. Geo-physical Research Letters 2005, 32:.
18. Hurtt GC, Dubayah R, Drake J, Moorcroft PR, Pacala SW, Blair JB,Fearon M: Beyond potential vegetation: combining lidar dataand a height-structured model for carbon studies. GlobalChange Biology 2004, 14:873-883.
19. Drake BJ, Dubayah RO, Knox RG, Clark DB, Blair JB: Sensitivity oflarge-footprint lidar to canopy structure and biomass in aneotropical rainforest. Remote Sensing of Environment 2002,81:378-392.
20. Baccini A, Laporte N, Goetz SJ, Sun M, Dong H: A first map ofTropical Africa's above-ground biomass derived from satel-lite imagery. Environmental Research Letters 2008:045011 [http://stacks.iop.org/1748-9326/3/045011].
21. Sun G, Ranson KJ, Kimes DS, Blair JB, Kovacs K: Forest verticalstructure from GLAS: An evaluation using LVIS and SRTMdata. Remote Sensing of Environment 2008, 112:107-117.
22. Hansen MC, Stehman SV, Potapov PV, Loveland TR, Townshend JRG,DeFries RS, Pittman KW, Arunarwati B, Stolle F, Steininger MK, Car-roll M, DiMiceli C: Humid tropical forest clearing from 2000 to2005 quantified by using multitemporal and multiresolutionremotely sensed data. Proceedings of the National Academy of Sci-ences 2008, 105(27):9439-9444.
23. Goetz S: Crisis in Earth Observation. Science 2007,315(5820):1767.
24. Brown S, Gillespie A, Lugo AE: Biomass estimation methods fortropical forests with application to forest inventory data. For-est Science 1989, 35:881-902.
25. Chave J, Andalo C, Brown S, Cairns MA, Chambers JQ, Eamus D, Fol-ster H, Fromard F, Higuchi N, Kira T, Lescure JP, Ogawa BWNH, PuigH, Riera B, Yamakura T: Tree allometry and improved estima-tion of carbon stocks and balance in tropical forests. Oecologia2005, 145:87-99.
26. Mayaux P, Bartholome E, Fritz S, Belward A: A new land-covermap of Africa for the year 2000. Journal of Biogeography 2004,31:1-17.
27. Gibbs HK, Brown S, Niles JO, Foley JA: Monitoring and estimat-ing tropical forest carbon stocks: making REDD a reality.Environmental Research Letters 2007, 2:1-13 [http://stacks.iop.org/1748-9326/2/045022].
28. Breiman L: Random forests. Machine Learning 2001, 45:5-32.29. Baccini A, Friedl M, Woodcock C, Warbinghton R: Forest biomass
estimation over regional scales using multisource data. Geo-physical Research Letters 2004, 31:L10501.
30. Williams C, Hanan N, Neff J, Scholes R, Berry J, Denning AS, Baker D:Africa and the global carbon cycle. Carbon Balance and Manage-ment 2007, 2:3.
31. Saatchi SS, Houghton RA, dos Santos Alvala RC, Soares JV, Yu Y: Dis-tribution of aboveground live biomass in the Amazon basin.Global Change Biology 2007, 13:816-837.
32. Houghton RA, Butman D, Bunn AG, Krankina ON, Schlesinger P,Stone TA: Mapping Russian forest biomass with data from sat-ellites and forest inventories. Environmental Research Letters 2007,2:045032. (doi:10.1088/1748-9326/2/4/045032).
33. Blackard JA, Finco MV, Helmer EH, Holden GR, Hoppus ML, JacobsDM, Lister AJ, Moisen GG, Nelson MD, Riemann R, Ruefenacht B,Salajanu D, Weyermann DL, Winterberger KC, Brandeis TJ, Cza-plewski RL, McRoberts RE, Patterson PL, Tymcio RP: Mapping U.S.forest biomass using nationwide forest inventory data andmoderate resolution information. Remote Sensing of Environment2008, 112:1658-1677.
34. National Carbon and Biomass Database [http://www.whrc.org/nbcd/]
35. Lewis SL, Lopez-Gonzalez G, Sonke B, Affum-Baffoe K, Baker TR, OjoLO, Phillips OL, Reitsma JM, White L, Comiskey JA, Djuikouo M,Ewango CEN, Feldpausch TR, Hamilton AC, Gloor M, Hart T, HladikA, Lloyd J, Lovett JC, Makana J-R, Malhi Y, Mbago FM, Ndangalasi HJ,Peacock J, Peh KSH, Sheil D, Sunderland T, Swaine MD, Taplin J, Tay-lor D, Thomas SC, Votere R, Woll H: Increasing carbon storagein intact African tropical forests. Nature 2009, 457:1003-1006.
Page 7 of 7(page number not for citation purposes)