Wnt-Related Molecules and Signaling Pathway Equilibrium in Hematopoiesis
Upload
khangminh22Category
view
1download
0
Qin et al. Cell Discovery (2021) 7:2 Cell Discoveryhttps://doi.org/10.1038/s41421-020-00223-4 www.nature.com/celldisc
ART ICLE Open Ac ce s s
Integrated decoding hematopoiesis andleukemogenesis using single-cell sequencing andits medical implicationPengfei Qin1, Yakun Pang2,3, Wenhong Hou1, Ruiqing Fu 1, Yingchi Zhang2,3,4, Xuefei Wang1, Guofeng Meng5,Qifa Liu6, Xiaofan Zhu2,3,4, Ni Hong1, Tao Cheng 2,3 and Wenfei Jin 1
AbstractSingle-cell RNA sequencing provides exciting opportunities to unbiasedly study hematopoiesis. However, ourunderstanding of leukemogenesis was limited due to the high individual differences. Integrated analyses ofhematopoiesis and leukemogenesis potentially provides new insights. Here we analyzed ~200,000 single-celltranscriptomes of bone marrow mononuclear cells (BMMCs) and its subsets from 23 clinical samples. We constructed acomprehensive cell atlas as hematopoietic reference. We developed counterpart composite index (CCI; available atGitHub: https://github.com/pengfeeei/cci) to search for the healthy counterpart of each leukemia cell subpopulation,by integrating multiple statistics to map leukemia cells onto reference hematopoietic cells. Interestingly, we foundleukemia cell subpopulations from each patient had different healthy counterparts. Analysis showed the trajectories ofleukemia cell subpopulations were similar to that of their healthy counterparts, indicating that developmentaltermination of leukemia initiating cells at different phases leads to different leukemia cell subpopulations thusexplained the origin of leukemia heterogeneity. CCI further predicts leukemia subtypes, cellular heterogeneity, andcellular stemness of each leukemia patient. Analyses of leukemia patient at diagnosis, refractory, remission and relapsevividly presented dynamics of cell population during leukemia treatment. CCI analyses showed the healthycounterparts of relapsed leukemia cells were closer to the root of hematopoietic tree than that of other leukemia cells,although single-cell transcriptomic genetic variants and haplotype tracing analyses showed the relapsed leukemia cellwere derived from an early minor leukemia cell population. In summary, this study developed a unified framework forunderstanding leukemogenesis with hematopoiesis reference, which provided novel biological and medicalimplication.
IntroductionEarly studies suggested hematopoiesis occurs through a
stepwise process from pluripotent, to multipotent, to
oligopotent, to unipotent progenitors and finally to matureblood cells based on dissecting their differentiation poten-tials ex vivo and in vitro settings1,2. However, the hemato-poiesis model has to be constantly revised to fit conflictingbranches arisen from later studies3–6. Single-cell RNAsequencing (scRNA-seq) provides unbiased gene expressionprofiling of individual cells that is highly complementary tothe immunological phenotyping approaches7. Recent mas-sively parallel scRNA-seq enabled routine analyses of a largenumber of single cells for inferring cellular heterogeneityand developmental trajectories8–12. In particular, single-cellanalysis of hematopoietic stem and progenitor cells (HSPCs)
© The Author(s) 2020OpenAccessThis article is licensedunder aCreativeCommonsAttribution 4.0 International License,whichpermits use, sharing, adaptation, distribution and reproductionin any medium or format, as long as you give appropriate credit to the original author(s) and the source, provide a link to the Creative Commons license, and indicate if
changesweremade. The images or other third partymaterial in this article are included in the article’s Creative Commons license, unless indicated otherwise in a credit line to thematerial. Ifmaterial is not included in the article’s Creative Commons license and your intended use is not permitted by statutory regulation or exceeds the permitted use, you will need to obtainpermission directly from the copyright holder. To view a copy of this license, visit http://creativecommons.org/licenses/by/4.0/.
Correspondence: Ni Hong ([email protected]) orTao Cheng ([email protected]) or Wenfei Jin ([email protected])1Department of Biology, Southern University of Science and Technology,Shenzhen, Guangdong, China2State Key Laboratory of Experimental Hematology & National Clinical ResearchCenter for Blood Diseases, Institute of Hematology & Blood Diseases Hospital,Chinese Academy of Medical Sciences & Peking Union Medical College, Tianjin,ChinaFull list of author information is available at the end of the articleThese authors contributed equally: Pengfei Qin, Yakun Pang, Wenhong Hou,Ruiqing Fu, Yingchi Zhang, Xuefei Wang
1234
5678
90():,;
1234
5678
90():,;
1234567890():,;
1234
5678
90():,;

demonstrated hematopoiesis is a continuous process ratherthan discrete stepwise process13–18. However, inconsistencypersists among those studies, e.g. Velten et al.13 proposedthe CLOUD-HSPCs model in which HSPCs directly giverise to distinct lineage-committed populations, while Tusiet al.15 proposed a continuously hierarchies model.The dynamics of gene expression during hematopoiesis
has to be precisely regulated, and dysregulation may lead toserious disorders such as leukemia17,19. Some leukemiapatients have received customized therapy based on geneticvariants/mutations they carried, leading to efficient killingof leukemia cells. However, leukemia patients are still underthe threat of relapse and drug resistance due to leukemiaheterogeneity. Analyses of cancer stem cell in chronicmyeloid leukemia identified distinct subpopulations oftherapy-resistant stem cells20–22. Recent single-cell study onacute myeloid leukemia (AML) revealed primitive leukemiacells aberrantly co-expressed stemness and myeloid priminggenes21. However, our knowledge about the relationshipbetween leukemia cell subpopulations and progression ofleukemia are still limited. Especially, study of different leu-kemia patients leads to different results, or even conflictingconclusions, potentially due to the individual difference. Inthis study, we constructed a comprehensive cell atlas ofhematopoietic cells, and proposed a hierarchically con-tinuous transition model for hematopoiesis. We developedcounterpart composite index (CCI) that integrates multiplestatistics to map leukemia cells to reference hematopoieticcells, and proposed a model for the origin of leukemiaheterogeneity. The identification of the healthy counter-parts of leukemia cells by CCI also could predict leukemiasubtype and clinical outcome. Single-cell RNA-seq analysisof a patient at diagnosis, refractory, remission, and relapsevividly demonstrated dynamics of leukemia progression.
ResultsA comprehensive cell atlas of healthy bone marrowmononuclear cells (BMMCs)Bone marrow is the primary tissue for blood cell pro-
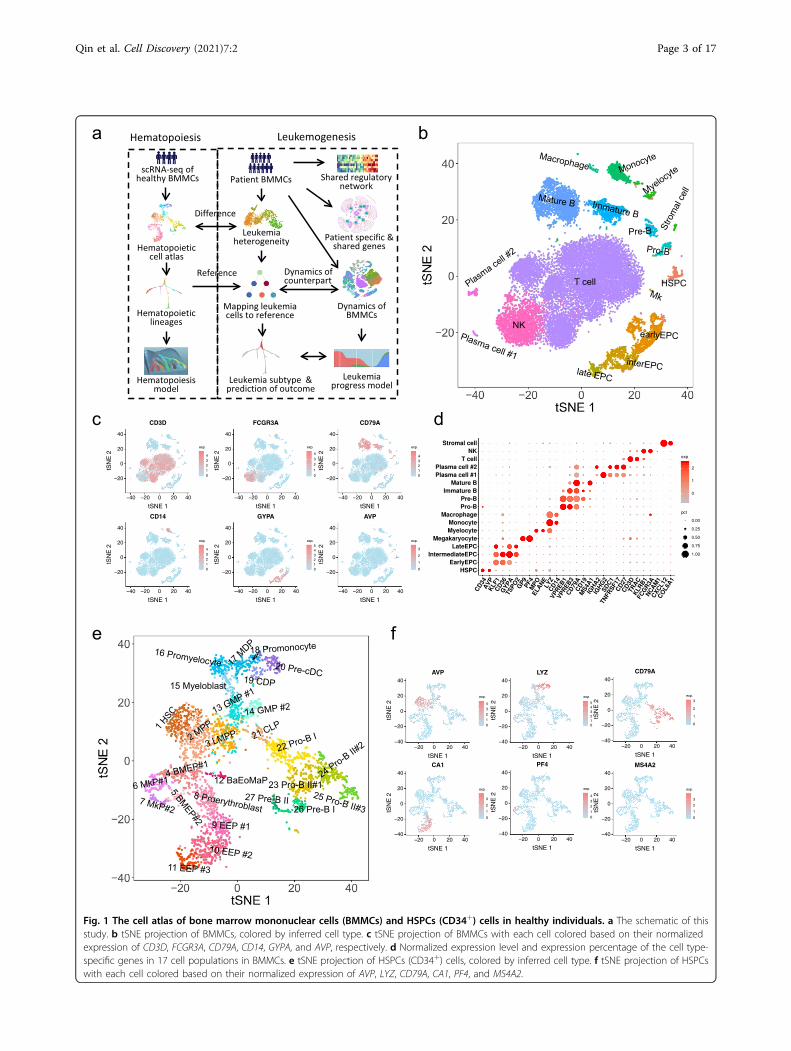
duction, and generates hundreds of billions of blood cellsand immune cells per day. In order to gain further bio-logical insights into hematopoiesis and leukemogenesis,we established approaches and pipelines for single-cellanalysis of BMMCs and its subsets from 5 healthy samplesand 18 leukemia samples (Fig. 1a and Supplementary Fig.S1a, c and Table S1). The 18,751 cells from 4 healthyBMMCs were clustered into distinct cell clusters andvisualized by t-Distributed Stochastic Neighbor Embed-ding (tSNE)23 (Fig. 1b). We identified the cell type of eachcluster based on their specific highly expressed genes(Fig. 1c, d). The frequencies of major identified cell typesin BMMCs were essentially consistent with the expecta-tions (Fig. 1b–d): 1.39% HSPCs (AVP and CD34), 10.15%erythroid progenitor cells (EPCs) (GYPA and KLF1),
0.08% megakaryocytes (Mk) (PF4 and GP9), 1.25% mye-locytes (ELANE and MPO), 2.91% monocytes (LYZ andCD14), 17.67% B cells (CD79A), 53.11% T cells (CD3D),11.62% natural killer cells (NK) (FCGR3A and NCAM1),0.04% stromal cells (CXCL12 and COL6A1). Furthermore,the frequencies of cell types were highly consistent acrossdifferent samples (r2= 0.96; Supplementary Fig. S1d).Interestingly, we identified two distinct plasma cell
populations both highly expressed SDC1, CD27, andTNFRSF17 (Fig. 1b, d). Plasma cell #1 highly expressedIGHG1, IGHG2, IGHG3, IGHG4 and IGKC, while plasmacell #2 highly expressed IGHA1, IGHA2 and translationassociated genes (Fig. 1d and Supplementary Fig. S1e),indicating their different cellular status and functions. Wefurther identified lots of T cell subsets in BMMCs (Sup-plementary Fig. S1f). Compared with peripheral bloodmononuclear cells (PBMCs)24, BMMCs contain muchmore cells in active proliferation (Supplementary Fig. S1g, h).
HSPCs form a single-connected entity on tSNE projectionOwing to the limited number of HSPCs in BMMCs
(Fig. 1b), CD34+ cells, representing HSPCs, were enrichedby fluorescence-activated cell sorting (FACS) for investi-gating hematopoiesis. The HSPCs essentially formed asingle-connected entity extending in several directions ontSNE projection and were clustered into 27 clusters forbetter understanding of the hematopoietic process(Fig. 1e). We inferred the cell type of each cluster bychecking the expression of hematopoietic lineage-specificgenes (Fig. 1f and Supplementary Fig. S2a), such as HSC(EMCN, THY1, MEG3, HES1; cluster 1), megakaryocyticprogenitors (MkP) (PF4, GP9; clusters 6, 7), early ery-throid progenitors (EEP) (APOE, CD36, CA1; clusters 8-11), neutrophil, monocyte and DC progenitors (CSF3R,MPO, and LYZ; clusters 13–20), lymphoid progenitors(CD79A, IGHM, VPREB1; clusters 21-27) (Fig. 1f andSupplementary Fig. S2a).Cluster 12 highly expressed mast cell and basophil-specific
genes, including HDC, TPSAB1, and MS4A2, as well aseosinophil-specific gene including PRG2 (Fig. 1f and Sup-plementary Fig. S2a), which matched Basophil/Eosinophil/Mast progenitors (Ba/Eo/MaP), a novel cell type has beenreported recently14,24. We did not detect any cluster withgene expression patterns similar to common myeloid pro-genitor (CMP) (CD34+, CD38+, CD123+, CD45RA−,CD10− and Lin−), consistent with recent studies showingthat CMP is a heterogeneous mixture of erythroid andmyeloid primed progenitors6,14,25. Moreover, we observedmultiple subpopulations within predefined MkP, EEP, GMP,Pro-B and so on (Fig. 1e). The expression levels of manygenes are gradually changing along the three EEP popula-tions, among which the expression levels of HBA1, TFRC,GYPA, ALAS2, PLK1, and MKI67 gradually increased as thedistance to HSC increased (Supplementary Fig. S2a).
Qin et al. Cell Discovery (2021) 7:2 Page 2 of 17
a b
e f
c d
Fig. 1 The cell atlas of bone marrow mononuclear cells (BMMCs) and HSPCs (CD34+) cells in healthy individuals. a The schematic of thisstudy. b tSNE projection of BMMCs, colored by inferred cell type. c tSNE projection of BMMCs with each cell colored based on their normalizedexpression of CD3D, FCGR3A, CD79A, CD14, GYPA, and AVP, respectively. d Normalized expression level and expression percentage of the cell type-specific genes in 17 cell populations in BMMCs. e tSNE projection of HSPCs (CD34+) cells, colored by inferred cell type. f tSNE projection of HSPCswith each cell colored based on their normalized expression of AVP, LYZ, CD79A, CA1, PF4, and MS4A2.
Qin et al. Cell Discovery (2021) 7:2 Page 3 of 17

Overall, HSPCs contain a substantial higher fraction of cellsin active cell cycles and cell states than that of BMMCs(Supplementary Fig. S2b–g). Interestingly, major early stemand progenitor cells (HSC, MPP and LMPP) are in restingphase while major later progenitors are in active prolifera-tion (Supplementary Fig. S2d, e), potentially indicating earlyprogenitors constitute the major cell pool for regulatinghematopoiesis while later progenitors are in simple transi-tional states.
Continuous hematopoietic lineages with hierarchicalstructureWe implemented Slingshot26 and SPRING27 on HSPCs
to conduct pseudotime inference. Pseudo-time ordering ofHSPCs exhibits a tree-like structure in which HSC formsthe root, from which seven lineages gradually emergedwith a hierarchical structure (Fig. 2a–c), essentially con-sistent with the cell lineages based on PCA projection
(Supplementary Fig. S3a). The results are consistent withrecent reports that hematopoiesis is a continuous pro-cess13–15,28, while showing different hierarchical structureand lineage relationship compared to previous reports.Clusters 4–5, derived from HSC/MPP, are progenitors ofBa/Eo/Ma lineage, Mk lineage and erythroid (Ery) lineage,were called BMEP, which is consistent with recentlyidentified megakaryocyte–erythroid–mast cell progenitor(MEMP)29. This study also showed that neutrophil lineagewas derived from GMP while Ba/Eo/Ma lineage wasderived from BMEP, different from the classic hemato-poietic model in which granulocytes shared a commonprogenitor30,31.Heatmap analysis showed the expression of early
hematopoietic marker genes, such as AVP, HES1, CRHBP,MEG3, EMCN and HLF, are gradually decreasing alongpseudotime (Fig. 2d). Although cells were clustered intodifferent populations, their expressions do not show
Fig. 2 Hematopoietic cell lineages and hierarchically continuous transition model for hematopoiesis. a Hematopoietic lineages visualized bySPRING, with cells colored by cell type as in Fig. 1e. b, c Expressions of AVP (b) and EMCN (c) are decreasing along hematopoietic lineages. d Heatmapof normalized expression level of early hematopoietic markers along lineages. e Heatmap of transcriptomic dynamics during lymphopoiesis.f–i Coordinated TFs and networks underlying lymphoid lineage. The top 10 coordinated TFs (f); correlation of the coordinated TFs (g); network ofcoordinated TFs, in which the size of each node represents the magnitude of expression (h); dynamics of TFs expression in regulatory networks alonglymphoid lineage (i), in which each node was colored by average expression level. j Hierarchically continuous transition model for hematopoiesis.
Qin et al. Cell Discovery (2021) 7:2 Page 4 of 17

significant changes across the boundaries, further sup-porting a gradual decrease of stemness along hemato-poietic lineage. Attenuations of expression vary greatlyfrom gene to gene, and different cells showed differentgene expression patterns (Fig. 2d), indicating each cellholds a unique status during hematopoiesis. Furthermore,by integrating HSPCs and BMMCs together (Supple-mentary Fig. S3b), we constructed a more comprehensivecell atlas (Supplementary Fig. S3c, d), in which HSPClocated in the center while erythrocytes, lymphocytes andmonocytes from BMMCs extended at terminal branches(Supplementary Fig. S3e).
Lineage-coordinated genes, transcription factors (TFs) andnetworksWe identified thousands of lineage-coordinated genes
with expression gradually shifting along the hematopoieticlineages (Fig. 2e and Supplementary Fig. S4a, b). Forinstance, the expression levels of CD79A, VPREB3 andPAX5 were increasing along the lymphoid (Lym) lineage(Fig. 2e). The observation that many genes changed con-tinuously along the lineages further supports our pre-sumption of hematopoiesis being a continuous process.We further identified lineage-coordinated TFs of eachlineage using gene regulatory networks (GRN) scores32.Among the top 10 Lym lineage-coordinated TFs (Fig. 2f),PAX5, LYL1, LEF1, HMGN1, FOS, and JUNB have beenreported to play important roles in lymphopoiesis33, whileYBX1, EGR1, TCF4, and KLF10 are newly identified. Wefurther identified SPI1, ZEB2, CEBPA and IRF1, and IRF8in DC lineage; SPI1, CEBPD, JUNB, CEBPA, and KLF2 inneutrophil lineage; SPI1, JUNB, CEBPA, and FOS inmonocyte lineage; KLF1, GATA1, ZEB2, and MYC in Erylineage; ZBTB16, GATA1, ZEB2, and KLF2 in Ba/Eo/Macell lineage; FLI1, GATA1, ZEB2, and GFI1B in Mk lineage(Supplementary Fig. S4c, h).We constructed lineage-coordinated TF networks based
on co-expression network of lineage-coordinated TFs. Thereare two major subnetworks in Lym lineage-coordinated TFnetwork with strong intra-subnetwork interactions (Fig. 2g,h). The subnetwork usage is gradually shifting from the onehighly active in HSC to the one highly active in B-cell pro-genitor along lymphopoiesis (Fig. 2i). In contrast, there isonly one major connective unit in the neutrophil lineage-coordinated TF network, in which TF usage is shiftingwithin the same network during neutrophil genesis (Sup-plementary Fig. S4d). Overall, we observed two or moresubnetworks in Ery, Mk, Lym, and DC lineages, in whichactive networks were gradually shifting from one subnet-work to another; whereas we only observed one majorcompact core in neutrophil, monocyte and Ba/Eo/Malineages with TF usage shifting in the same network (Sup-plementary Fig. S4c, h), indicating different models forlineage regulations.
Hierarchically continuous transition model forhematopoiesisWe propose a hierarchically continuous transition
model to explain the hematopoiesis process from HSC todistinct hematopoietic lineages (Fig. 2j). In this model, thehematopoietic system is a dynamic equilibrium systemcomposed of a large number of transitional states/cells,among which contiguous states could mutually convertinto each other. Thus, the cell states were only affected byits previous states and compensation effect promotes theHSC transition to vacant slots. The cell fate of a stem cellis not predefined but is gradually determined during celldifferentiation. We could consider the classic stepwisemodel as a specific case of our continuous transitionmodel, in which many transitional states have been mis-sed with FACS-sorted cell population representing somesections of the continuum. The continuous transitionmodel bridges the gap between the classic stepwisemodels based on FACS sorting and recent continuousmodels based on single-cell sequencing. Our model pro-vides an essential reference for understanding of leukemiaheterogeneity and leukemogenic process.
Leukemia diversity and shared features among patientsThe molecular heterogeneity of the leukemia has sig-
nificant impact on leukemia classification and treat-ment34. To characterize the heterogeneity of leukemiacells, we investigated the single-cell transcriptomic data ofBMMCs from 8 leukemia patients. tSNE projectionshowed these cells formed two kinds of clusters, eithernormal cell clusters with cells from both healthy andpatient samples, or patient-specific clusters that onlycomprise of cells from single patient (Fig. 3a). The resultsindicate leukemia cells are quite different from patient topatient, implying high interpatient diversity. The expres-sion of hematopoietic lineage-specific genes also supportsthe uniqueness of patient-specific leukemia cells (Fig. 3b).Compared with healthy BMMCs, the majority of thesignificantly upregulated gene sets or downregulated genesets are patient specific, with only a few gene sets beingshared among multiple patients (Fig. 3c, d).Although leukemia cells exhibited a high diversity
among patients, identification of their shared features mayprovide important clinical implications for diagnosis andtreatment. We noticed MIR181A1HG, ITGA4, CD96, andTXNP were upregulated in 5 patients and no genesupregulated in all the 8 patients (Supplementary Fig. S5a).Some gene sets were upregulated or downregulatedamong all leukemia patients (Fig. 3e). The presence ofmany shared gene sets while absence of shared genesamong all patients indicates patients are genetically spe-cific but share signatures/pathways during cancer pro-gression. For instance, the most significantly upregulatedsignatures shared by those leukemia patients are
Qin et al. Cell Discovery (2021) 7:2 Page 5 of 17

IL-2-STAT5 signaling, inflammation response, angiogen-esis, IL-6-JAK-STAT3 signaling, KRAS signaling, allograftrejection and hypoxia, which have been reported in var-ious cancers, indicating these signatures played animportant role in cancer progression. The most sig-nificantly downregulated signatures shared by those leu-kemia patients are E2F targets, DNA repairs, reactive
oxygen species pathway, MYC targets and G2M check-point, indicating reduced cell cycle checkpoint anddecreased DNA repair activities play an important role inleukemia. Indeed, the fraction of cells with active cell cyclein leukemia patients is much higher than that in healthyindividuals (Supplementary Fig. S5b, e), further indicatinghigher cell proliferation of leukemia cells.
Fig. 3 Heterogeneity of leukemia cells and shared features among multiple patients. a tSNE projection of BMMCs from 1 healthy individualand 8 leukemia patients, colored by different individuals. b tSNE projection of BMMCs from leukemia patients, with each cell colored based on itsexpression of CD3E, KLF1, MPO, VPREB3, respectively. c Majority of upregulated genes among leukemia patients are patient specific. d Majority ofdownregulated genes among leukemia patients are patient specific. e Pathway or gene sets commonly upregulated and downregulated amongleukemia patients. Z-score > 0 means upregulation of pathways while Z-score < 0 means downregulation. f Shared upregulated and downregulatedTF networks among leukemia patients. Z-score > 0 means upregulation of TF networks while Z-score < 0 means downregulation. g Correlation of TFnetworks in leukemia patients, in which TF networks were sorted based on their enrichment score decreasingly.
Qin et al. Cell Discovery (2021) 7:2 Page 6 of 17

Compared to healthy BMMCs, we observed the TFnetworks of ZNF266, RORA, GTF3C2, ZNF76, ZNF383,IRF5 and NFE2L2 being top upregulated in all leukemiapatients (Fig. 3f). RORA is the key regulator of embryonicdevelopment and cellular differentiation, whose upregu-lation may promote the proliferation of the leukemiacells35. IRF5 promotes inflammation by activating genesproducing interferons and cytokines36,37. Upregulation ofIRF5 network potentially indicates an increase of inflam-mation in leukemia patients, although inflammation aloneis inefficient to clean up leukemia cells. The top down-regulated TF networks sharing among leukemia patientsare RUNX3, KLF4, POU4F1, IKZF2, GTF3A, ATF4,TFDP1, GTF2A2, BCL11B, GFI1, MAZ, HDAC2 andKLF1 (Fig. 3f), with majority being hematopoietic lineagespecific, indicating that the healthy hematopoietic processwas repressed in those leukemia patients. Heatmap ana-lysis showed that upregulated TF networks and repressedTF networks were correlated, although the correlations ofrepressed TF networks were weaker than that betweenupregulated TF networks (Fig. 3g).
Mapping leukemia cells onto reference hematopoieticlineagesHeterogeneity of the leukemia cells is associated with
disease progression and response to chemotherapy38,39.Identifying the leukemia cell subpopulations and inferringtheir origin could facilitate precise diagnosis and treat-ments. Here, we developed counterpart composite index(CCI) with implementing software (https://github.com/pengfeeei/cci), to search for healthy counterpart of eachleukemia cell subpopulation by mapping leukemia cellonto reference healthy hematopoietic lineage (Fig. 4a).CCI integrates multiple statistics, including expressionlevel, co-expression, embedding space of dimensionreduction et al., by a composite likelihood statistical fra-mework to improve the statistic power and accuracy (see“Materials and Methods”). Identification of healthycounterparts of leukemia cells not only facilitate ourunderstanding of leukemia progression and leukemiaheterogeneity, but also could provide biological insightson the features and functions of the leukemia cell sub-population via their well-annotated healthy counterparts,thus facilitate prediction of leukemia subtype and clinicaloutcome.The substructure of leukemia cells is clearly visible and
multiple leukemia cell subpopulations could be observedin each patient (Fig. 4b). The healthy counterparts ofleukemia cell subpopulations were different in the samepatient and were also different from patient to patient(Fig. 4b, c). The healthy counterparts of leukemia cell inthe 12 AML patients include LMPP, BMEP, GMP, MDP,pro-mono, pro-mye, MPP, and Ery progenitors. Theleukemia cell subpopulation was named after its healthy
counterpart with “-L” suffix. GMP-L, LMPP-L, BMEP-Lare the most common leukemia cell subpopulations inAML patients, among which GMP- L showed up in all the12 AML patients. Interestingly, we found the leukemiacells of two patients (AML027 and AML035) were pro-jected into Ery lineage thus indicated different AMLsubtypes (Fig. 4b, c). The healthy counterparts of leuke-mia cell from ALL patients include pro-B II, pre-B I, pre-BII and ImmatB, which belong to lymphoid progenitors.PreB I-L showed up in all the three ALL patients and theheterogeneity of leukemia cells in ALL is weaker than thatin AML. Furthermore, the abundances of leukemia cellsubpopulations are quite different from patient to patient(Fig. 4c). The accuracy of CCI predictions were validatedby cell type-specific genes and also evaluated in anotherleukemia dataset21 (Supplementary Fig. S5f, g).
Leukemia subtypes, heterogeneity, and stemness basedon CCIInterestingly, mapping of the leukemia cells onto
reference hematopoietic lineages showed that leukemiacells from each patient occupy a section of hematopoieticlineage (Fig. 4d), indicating a similar developmental tra-jectory between leukemia cells and their healthy coun-terparts. We showed that leukemia cells from differentAML patients were mapping into different positions ofthe hematopoietic tree, such as monocyte lineage(patients: AML1, AML3, AML4, 508084, and 782328), Erylineage (patients: AML027 and AML035), root (patients:AML2, 721214, and 809653), Mk lineage (patient: AML5)and neutrophil lineage (patient: 548327), indicating dif-ferent subtypes of AMLs. The AML subtypes inferred byCCI are essentially consist with classic AML subtypes, butwith comprehensive information (Supplementary TableS1). The extension and coverage of leukemia cells onhematopoietic tree indicate the heterogeneity of leukemiacells, with long extension or big coverage area indicatinghigh heterogeneity of the leukemia cells, e.g., the AML1,AML4, and AML5 with the highest heterogeneity, whileAML2 and 721214 with the lowest heterogeneity due toits shortest extension on hematopoietic tree (Fig. 4d andSupplementary Table S1). Leukemia cells mapping closerto the root of hematopoietic tree means the strongerstemness of leukemia cells, such as AML2, AML5, and721214. The leukemia cells from ALL patients wereprojected to lymphoid lineage, which is consistent withthe clinical diagnosis while shows different heterogeneityand different stemness (Fig. 4d and SupplementaryTable S1).The patients with leukemia cells projecting into the
same hematopoietic lineage showed similar features, whilepatients with leukemia cells projecting into the differenthematopoietic lineage showed much different features.Therefore, projection of leukemia cells into hematopoietic
Qin et al. Cell Discovery (2021) 7:2 Page 7 of 17

tree is an accurate and unbiased approach for leukemiaclassification. Furthermore, we found the patient withleukemia cells projecting to the root of the hematopoietictree were associated with features such as higher fraction
of leukemia cells, higher proliferation and higher geneentropy that may lead to worse outcome. Therefore, CCIdoes not only have the power to infer the subtypes ofleukemia, but also provide the heterogeneity and stemness
Fig. 4 Searching the healthy counterparts of leukemia cells for comprehensive understanding of leukemogenesis. a Schematic of CCI forsearching healthy counterparts of leukemia cells. b The healthy counterpart of each leukemia cell subpopulation in the ten leukemia patients, inwhich the healthy counterparts of leukemia cells from the sample patient are different. Each leukemia cell subpopulation was named after itscounterpart by superscript “-L”. c Bar plot of leukemia cell subpopulations and their abundance. d Mapping of leukemia cells onto hematopoieticlineages. Gray indicates reference hematopoietic tree while red indicates leukemia cells. The leukemia cells from ALLs were projected into lymphoidlineage, while leukemia cells from AMLs were projected into different non-lymphoid lineages according to their subtypes.
Qin et al. Cell Discovery (2021) 7:2 Page 8 of 17

information of the leukemia cells, which could facilitateselection of appreciate treatment.
Hypothesis about the origin of leukemia heterogeneityPseudotime inference of leukemia cells further showed
that the trajectories of leukemia cell were similar to that oftheir healthy counterparts (Supplementary Fig. S5h). Inthis way, we could assume that leukemia cell subpopula-tions are not a bunch of independent subpopulations butare a series of lineage-related cells in leukemogenesis.Therefore, we hypothesize the mutant leukemia initialcells or progenitors partially maintain its original devel-opmental trajectory and terminate development at dif-ferent stages due to loss of different functional genes,leading to a serial of dysfunctional leukemia cell sub-populations, instead of developing into a homozygouspopulation.
Cell population dynamics of BMMCs in patient ALL3 andthe underlying genesPatient ALL3, a 4-year old boy, was diagnosed with B-
precursor ALL in Blood Diseases Hospital, ChineseAcademy of Medical Sciences (CAMS)/ Peking UnionMedical College (PUMC) in Nov 201240. The patient wasrefractory to a prolonged chemotherapy, and laterachieved remission after Imatinib treatment. The patientrelapsed and no longer responded to Imatinib treatment5 months after remission (Fig. 5a). scRNA-seq data ofBMMCs at diagnosis (ALL3.1), refractory (ALL3.2),remission (ALL3.3) and relapse (ALL3.4) were generated,which allowed us to investigate leukemia progression andthe underlying mechanisms. By integrating healthyBMMCs and HSPCs as reference, leukemia cells could beeasily distinguished from normal cells since leukemia cellsare patient specific and normal cells are shared by allsamples. Cells from healthy reference formed a notchedcircle on the tSNE projection (Fig. 5b, c), while leukemiacells formed several distinct clusters at the breach orinside of the notched circle (Fig. 5b). At diagnosis, leu-kemia cells account for 87.4% of total BMMCs and form amajor cell cluster surrounding with some minor cellsubpopulations (Fig. 5d). After prolonged chemotherapy,the percentage of leukemia cells in BMMCs slightdecrease while the size of some surrounding minor cellsubpopulation relatively increased (Fig. 5e). After Imatinibtreatment, leukemia cells almost completely disappeared(~1.9%) during remission (Fig. 5f). However, the leukemiacells come back and become dominant (~82.7%) afterrelapse, with a significant reduction of normal cells(Fig. 5g). Especially, leukemia cells before and after relapsewere projected to different coordinates of tSNE projection(Fig. 5b, g), indicating the relapsed leukemia cells are quitedifferent from the leukemia cells in the early stage. Therelapsed leukemia cell has the highest fraction of cells in
active cell cycle and has the highest entropy among all cellclusters (Fig. 5h, i and Supplementary Fig. S6a), indicatingthe proliferation and transcriptional complexity of leu-kemia cells significantly increased after relapse. In sum-mary, these results vividly showed the pronounceddynamics of leukemia cells during clinical treatments andrelapse.According to the above observation, we could conclude
that leukemia cells experienced dramatic changes acrosstime. Identifying the differentially expressed genes andpathways between pre- and post-relapse leukemia cellscould enhance our understanding of relapse process. Weidentified 243 significantly upregulated genes and 79 sig-nificantly downregulated genes (fold change > 2) afterrelapse (Fig. 5j). The upregulated genes include H2AFY,IGLL1, GYPC, HSPB1, STT3B, C1QTN4, SUSD3, andPDLIM1 (Fig. 5j), which significantly enriched in E2Ftargeted genes, G2M checkpoints, oxidative phosphor-ylation, MTORC1 signaling and so on (Fig. 5k). Thesegene sets have been reported to promote the cell pro-liferation in tumor, which is consistent with our obser-vation that relapsed leukemia cells express the highestlevel of cell cycle genes and show the highest entropy. The79 downregulated genes include CXCR4, DUSP1, JUNB,LST1, LTB, RPS14, RPL31, and RPS4Y2 (Fig. 5j), whichsignificant enriched in IL-6-JAK-STAT3 signaling, TNFAsignaling pathway, IL-2-STAT5 signaling, interferon alpharesponse, hypoxia, inflammatory response, interferongamma response, KRAS signaling pathway and hedgehogsignaling and so on (Fig. 5k). Imatinib inhibits the enzymeactivity of tyrosine kinase that has been shown to play acentral role in the pathogenesis of human cancers. Weobserved the expressions of a lot of tyrosine kinases werechanging during the treatment and relapse (Fig. 5l).Therefore, relapsed leukemia cells showed substructureshift and molecular difference with leukemia cells beforerelapse.
Leukemia progress model for patient ALL3After analyzing the dynamics of BMMCs, we zoomed in
leukemia cell subpopulations to provide biological insighton leukemia progress. The total leukemia cells from the 4time points were classified into 6 subpopulations (Fig. 6a).Using CCI, we found the counterparts of the six leukemiacell subpopulations were B-cell progenitors, namely pro-BI, pro-B II, pre-B, and immature-B (Fig. 6b). The majorleukemia subpopulations at diagnosis and refractory(clusters C1 and C2) were pre-B-L and immature-B-L,while the major relapsed leukemia cells (clusters C5 andC6) were pro-B-L (Fig. 6b). Since pro-B is the progenitorof pre-B and pre-B is the progenitor of immature-B inheathy hematopoietic lineage, we could assume thatrelapsed leukemia cells have increased stemness andstronger differentiation potential than leukemia cells at
Qin et al. Cell Discovery (2021) 7:2 Page 9 of 17

Fig. 5 (See legend on next page.)
Qin et al. Cell Discovery (2021) 7:2 Page 10 of 17

early stage, which is consistent with our observation thatrelapsed leukemia cells were in high proliferation stateswith the highest cell cycle activity and the highest entropy(Fig. 5h, i).We identified genetic variants from scRNA-seq data at
different phases and found increased variants in relapsedleukemia cells (Supplementary Fig. S6b), consistent withthe expectation that mutations are progressively accu-mulated during cancer progress41. We identified the leu-kemia cell or its subpopulation-specific genetic variants bycomparing the genetic variants between different cellpopulations. Among the variants that are significantlydifferent between leukemia cells and normal cells,chr1:11055657;T>C on SRM and chr11:9173222;A>C onDENND5A are two mutations distributed in all leukemiacell subpopulations and might play an important role inearly leukemogenesis (Fig. 6c, d). On the other hand, themutational alleles on IKZF1 (chr7:50382590, G>A, p.G158S) and RB1 (chr13:48409776, T>C) are extremelyconcentrated in relapsed leukemia cells (Fig. 6e, f), indi-cating these mutations raised during late phase of leuke-mia progress. Especially, IKZF1G158S is a deleteriousmutation associated with leukemia and is a predictor ofpoor outcome in ALL42,43, potentially indicating thatIKZF1G158S mutation might play an functional role in therelapse of the patient.We further separate each leukemia cell cluster into
multiple subpopulations according to time points of datacollection. We found the genetic variants were accumu-lating during the leukemia progress (Fig. 6g). We furtherconstructed a hierarchical tree based on correlationcoefficient of gene expression between pairwise sub-populations, choosing HSCs as the root of the tree. Theresults showed cell subpopulations from different timepoints in the same cluster located on the same branch(Fig. 6h). The major relapsed leukemia cells (ALL3.4-C5,ALL3.4-C6) and a minor leukemia cell subpopulationfrom early phase (ALL3.1-C5 and ALL3.2-C5) are locatedon the same branch (Fig. 6h), implicating the two sub-populations are similar to each other and potentiallyshared a common progenitor. In this way, we hypothesizethat the relapsed leukemia cells were derived from thisminor leukemia subpopulation in early phase (ALL3.1-C5 & ALL3.2-C5) that developed resistance to Imatiniband rapidly expanded to the major subpopulations in
relapse. SSBP2, a tumor suppressor gene involved in themaintenance of genome stability44, contains two haplo-types in the leukemia cells, namely reference haplotypeand alternative haplotype. Interestingly, reference haplo-types concentrated in early leukemia cells and normalcells, while alterative haplotypes exclusively enriched incluster of the major relapse leukemia cells (C5 and C6)(Fig. 6i). We found the fraction of cells with alternativehaplotype in early leukemia cells (ALL3.1-C5 and ALL3.2-C5) was nearly as high as that in relapsed leukemia cells(ALL3.4-C5) (Fig. 6j), which strongly supports the notionthat relapsed leukemia cells originated from the earlyminor leukemia cell subpopulation. Furthermore, thegenetic variants in leukemia cells subpopulations supportthat relapsed leukemia cells were derived from minorleukemia cell populations from early phase (Supplemen-tary Fig. S6c, d). Based on these observations, we proposeda model for leukemia progress (Fig. 6k), which vividlyshowed the dynamics of leukemia cells during diagnosis,refractory, remission and relapse.
DiscussionSeveral studies used scRNA-seq to investigate various
HSPC recently13–17, which greatly increased our knowl-edge about hematopoiesis. Compared with previous stu-dies, this study focuses on constructing a referencehematopoietic tree for investigating leukemogenesis. Weinferred comprehensive hematopoietic process by inte-grating cluster-specific genes and its niche on hemato-poietic tree. We further proposed a hierarchicallycontinuous transition model to fit the hematopoieticdevelopment from HSC to 7 hematopoietic lineages(Fig. 2j), in which we vividly showed the transitional cellstates, as well as the continuous changes of coordinatedgenes and TF networks along hematopoietic lineage.Distinct models have been proposed to explain the
origin of leukemia heterogeneity19,39,45, However, thesestudies usually only focus on analyzing relationshipsamong leukemia cell subpopulation thus lost the wholepicture of leukemogenesis. Integrating both referencehematopoietic cell and leukemia cell subpopulation hasthe potential to provide novel insights. However, it is a bigchallenge to identify the healthy counterparts of eachleukemia cell subpopulation based on single signature dueto the huge differences between leukemia cell and healthy
(see figure on previous page)Fig. 5 Cell population dynamics of cell populations in patient ALL3 and the underlying genes. a Sampling information the patient ALL3 atdiagnosis, refractory, remission and relapse. b tSNE projection of all BMMCs from this patient and reference cells. c–g tSNE projection of referencecells and BMMCs at each phase. Reference cells only (c), diagnosis (d), refractory (e), remission (f) and relapse (g). h Cell cycle of patient BMMCs andreference cells. i Entropy of patient BMMCs and reference cells. j Significantly differential genes between pre-and post-relapse leukemia cells.k Significantly enriched pathway and gene sets between pre- and post-relapse leukemia cells. l The expression dynamics of some tyrosine kinase(TKs) based on scRNA-seq.
Qin et al. Cell Discovery (2021) 7:2 Page 11 of 17

Fig. 6 (See legend on next page.)
Qin et al. Cell Discovery (2021) 7:2 Page 12 of 17

hematopoietic cells. Consistent results from multiplesignatures could potentially generate more reliable resultsbecause different measurements provide complementaryinformation about the relationship between cell sub-population. We developed CCI that integrates multiplemeasurements for searching the healthy counterpart ofeach leukemia cell subpopulation in reference hemato-poietic cells. Interestingly, we found leukemia cell sub-populations from the same patient had different healthycounterparts. Trajectory analysis of the leukemia cellsubpopulations within patient showed linear trajectory(Supplementary Fig. S5h). Mapping leukemia cell sub-populations on the hematopoietic tree showed leukemo-genesis almost was exactly the same as truncatedhematopoietic development. Therefore, we hypothesizethe mutant stem cells partially maintain its originaldevelopmental trajectory, while it terminates developmentat different stages resulting in a serial of different butrelated leukemia cell subpopulations. Furthermore, iden-tification of the healthy counterparts of leukemia cells notonly facilitate our understanding of the leukemia pro-gression and leukemia heterogeneity, but also providebiological insights on the features and functions of theleukemia cell subpopulation via their well-annotatedhealthy counterparts. Finally, identification of the heal-thy counterpart of leukemia cell subpopulations have a lotclinical implication such as prediction of leukemia sub-type and clinical outcome.Analyses of clinical data with multiple time points have
the potential to provide details about leukemia progres-sions. Our analyses of patient ALL3 with data at four timepoints, namely diagnosis, refractory, remission andrelapse, vividly showed dynamics of cell populationshifting during treatment and relapse. Majority of leuke-mia cells was killed after Imatinib treatment and thepatient achieved remission, However, a minor leukemiacell subpopulation, with the highest similarity to mal-function pro-B, developed Imatinib resistance and laterrapid expansion led to relapse. Variants calling fromsingle-cell transcriptomes identified the leukemia-specificmutations and relapsed leukemia cells specific mutationsthat are potentially associated with leukemia progressions.The relapsed leukemia cells were closer to the root of
hematopoietic tree than that of other leukemia cells, thusincreased stemness and proliferation. In summary, ourstudy vividly showed that leukemia heterogeneities wereassociated with cancer progression and therapy outcomes.Application of our single-cell epigenomics approaches onthese samples46,47 in the future could enhance ourunderstanding of the underlying mechanisms.In summary, this study developed a unified framework
for understanding leukemogenesis, which provided bio-logical insights into leukemia heterogeneity. Furthermore,CCI provided a novel approach for leukemia subtypeclassification and clinical outcome prediction.
Materials and methodsClinical samplesIn total, 23 BMMCs samples and 1 PBMC sample were
analyzed in this study, with detail information (Supple-mentary Table S1). Among them, 14 samples were col-lected in Blood Diseases Hospital, CAMS/PUMC andNanfang Hospital, Southern Medical University. Thisstudy was approved by IRB of Southern University ofScience and Technology (SUSTech). All individualssigned an informed consent form approved by the IRB ofthe Blood Diseases Hospital, CAMS/PUMC and SUS-Tech. The other nine BMMCs samples were from otherstudies22,48. The classic diagnosis of leukemia was estab-lished according to the criteria of the World HealthOrganization49. Overall, there are 5 healthy samples, 12AML samples, 6 ALL samples from 3 patients, amongwhich the patient ALL3 were sampled at diagnosis,refractory, remission, and relapse.
Cell preparation and flow cytometryBMMCs were isolated from whole bone marrow aspi-
rate by Ficoll density gradient separation (GE Healthcare),resuspended in 90% FBS+ 10% DMSO, and cryopre-served in liquid nitrogen. To prepare cells for FACS,frozen BMMCs vials were thawed in a 37 °C water bathfor 2 min. Vials were removed once only a tiny ice crystalwas left. Thawed BMMCs were washed and resuspendedin 1 PBS and 20% FBS. After recovery, FACS sorting wasperformed on a Becton Dickinson FACSAria II (BDBiosciences, Denmark) to remove the dead cells. BMMCs
(see figure on previous page)Fig. 6 Tracing relapsed leukemia cells and leukemia progression model. a Clustering of leukemia cell subpopulations of ALL3. b Healthycounterparts of leukemia cell subpopulations, the healthy cell populations are listed by order of lymphoid lineage. c, d Distributions of leukemia cell-specific high variants on SRM (c) and DENND5A (d). e, f Distribution of relapsed leukemia cell-specific high variants on IKZF1 (e) and RB1 (f).g Distribution of genetic variants in different cell subpopulations. h Hierarchical tree of leukemia cell subpopulations, in which relapsed leukemia cellsand earlier leukemia cells in C5 were clustering together. i Distribution of reference haplotype and alterative haplotype of SSBP2 in BMMCs.j Frequencies of relapsed-specific SSBP2 haplotype (alt haplo) in different leukemia cell subpopulations. k Progression model of patient ALL3. Ribbonswith different colors present different leukemia subpopulations across the four stages, in which red ribbon stands for major leukemia cells (C1, C2) ofdiagnosis and refractory stages, blue and purple ribbons stand for relapsed leukemia cells (C5, C6), green is the minor population of leukemia cellsfrom refractory to relapse stage, while light blue is normal cells.
Qin et al. Cell Discovery (2021) 7:2 Page 13 of 17

were stained with pre-conjugated CD34-PE antibody for15min on ice. Non-specific binding was blocked byincubation in FACS buffer (Life Technologies). Theunbound antibodies were removed using 5ml wash buf-fer. The CD34+ cells were sorted out by FACS Aria™ II.The final concentration of thawed cells was 1 x 10⁶ cellsper ml.
Single-cell library preparation and sequencingThe single-cell RNA sequencing libraries of BMMCs
and CD34+ cells from healthy individuals and leukemiapatients were generated using 10x genomics. In brief, cellsuspensions were loaded on a 10x Genomics ChromiumSingle Cell Instrument (10x Genomics, Pleasanton, CA) togenerate single-cell GEMs. Approximately 20,000 cellswere loaded per channel. Single-cell RNA-seq librarieswere prepared using the Chromium Single Cell 3’ GelBead and Library Kit (P/N 120237, 120236, 120262, 10xGenomics) following the protocols48. Sequencing librarieswere loaded at 2.4 pM on an Illumina HiSeq4000 orIllumina NovaSeq 6000 with 2 × 75 paired-end kits.
Alignment, demultiplexing, unique molecular identifiers(UMI) counting, and normalizationThe Single Cell Software Cell Ranger Suite 2 was used
to perform reads alignment, barcode demultiplexing,transcripts assemblies and expression counting (https://support.10xgenomics.com). The gene-cell barcode matrixwas filtered based on number of genes detected per cell(any cells with less than 500 or more than 4000 genes percell were filtered out), and percentage of mitochondrialUMI counts (any cells with more than 10% of mito-chondrial UMI counts were filtered out). UMI normal-ization was performed by first dividing UMI counts by thetotal UMI counts in each cell, followed by multiplicationwith the median of the total UMI counts across cells.Then, we took the natural log of the UMI counts.
Dimension reduction and clustering analysisDimension reduction was performed by PCA and
tSNE50, as our previous reports12,51. The highly variablegenes were inferred based on normalized dispersion fol-lowing Zhou et al.51 The top 30 principal components(PCs) were chosen for tSNE and clustering analysis,according to the explained variances. Single-cell cluster-ing was performed by k-nearest neighbor (KNN) graphand Louvain algorithm. Raw clusters with few differentialexpressed genes were merged to avoid excessiveclassification.
Inferences of hematopoietic lineages and lineage-coordinated genesHematopoietic lineages and cell pseudotime of each
hematopoietic lineage was inferred by Slingshot26, in
which PCA was implemented and cell clusters were pre-defined. The cell clusters inferred by KNN graph wereused as input for Slingshot to infer cell trajectories. Theconstructed hematopoietic lineages was visualized by aforce-directed layout in SPRING27, in which dimensionreduction were generated by DiffusionMap52. Differen-tially expressed genes along the pseudotime were identi-fied using negative binomial tests in Monocle211,53, withthe smoothing parameter set to three degrees of freedom.For generating heatmaps of gene expression dynamics, thenormalized UMI counts were log transformed andsmoothed using Loess regression with the degree ofsmoothing (span) set to 0.75. Heatmaps for gene expres-sion profile clustering were generated using heatmapfunction in R. While the other graphics were generatedusing ggplot2 in R.
Gene regulatory network (GRN) scoreThe GRN score32 reflect the regulator-target relation-
ships in the context of trajectory progression, which rankstranscriptional regulators based on their correlation withthe trajectory, the correlation with their predicted targets,and the extent to which target genes are regulated duringthe trajectory, which defined as below
GRNi;j ¼ ci;jmt;jnj;
where GRNi,j is the GRN score for regulator i alongtrajectory j. ci,j is the mutual information betweentranscriptional regulator i and trajectory j, mt,j is theaverage mutual information between predicted targetgene t and trajectory j, nj is the number of predictedtargets regulated along trajectory j.
Lineage-coordinated TF networksHuman transcription factors (TFs) were downloaded
from TcoF-DB v254. Lineage-coordinated TF networkswere constructed following Fletcher et al.55. In short, TFsshowing significantly gene expression changing alonginferred lineage are lineage-coordinated TFs. The co-expression networks of lineage-coordinated TFs wascalled lineage-coordinated TF networks. A lineage-coordinated TF was added into the lineage-coordinatedTF networks if it correlated with at least 5 other lineage-coordinated TFs (Pearson correlation coefficient > 0.1).TFs correlation heatmaps were generated with NMF Rpackage.
Entropy analysisEntropy was used to assess the diversity of single-cell
transcriptomes. We applied Shannon Index (SI), whichquantifies the level of heterogeneity in potency, to mea-sure the disorder of transcriptomes. Entropy of each
Qin et al. Cell Discovery (2021) 7:2 Page 14 of 17

single cell was defined as
Entropy ¼ �Xn
i¼1
pðxiÞlog2pðxiÞ;
where p(xi) represents the probability of gene expressionx= xi, and n is the number of genes.
Gene sets enrichment analysis (GSEA)GSEA determines whether a priori defined set of genes
shows statistically significant differences between twobiological states. The original GSEA was developed forgene-expression assays of bulk data36,56, which may lostaccuracy when directly implement on scRNA-RNA data.In order to take advantage of thousands of single-celltranscriptomes, we designed an approach as below: (1)Gene expression was averaged from 30 random cells fromeach cluster due to the high dropout rates of scRNA-seqdata. Genes were ranked according to their expressionlevel for each set of cells. (2) Recovery curve was createdby walking down the gene list, and steps were increasedwhen we encounter a gene in the gene set. Area under thecurve (AUC) was computed as the indicator of enrich-ment for a certain gene set. Moreover, only AUC of top5000 ranked genes was considered. (3) To compare thedifferent enrichment of two cell populations for a geneset, we calculate the Z-score of AUC in one cell popula-tion relative to the AUC distribution in another cellpopulation. Gene sets from Msigdb3.0 (Molecular Sig-natures Database) were used for analysis by our approach.
Counterpart composite index (CCI)It is interesting to systematically compare the develop-
mental trajectories of leukemia cells with that of healthyhematopoietic cells. However, searching the counterpartof a leukemia cell subpopulation in healthy hematopoieticcells is very challenging due to the significant differencebetween leukemia cells and healthy hematopoietic cells.Based on simulated data, our initial analyses showed thatdifferent approaches may produce different results.However, different statistics have much higher probabilityto generate consistent result when two cell populationshave counterpart relationship than these when two cellpopulations have uncertain relationship. Thus, the com-posite likelihood of the statistics is the highest when twocell populations have counterpart relationship. Here, wedeveloped an approach, called counterpart compositeindex (CCI) and was available on GitHub (https://github.com/pengfeeei/cci), to search for healthy counterpart ofeach leukemia cell subpopulation by integrating multiplestatistics to project leukemia cells into healthy hemato-poietic cells. CCI integrates Euclidean distance of geneexpression, correlation of gene expression, weighted dis-tance in top PCs and difference of gene set enrichment for
composite likelihood statistical framework as below:
CCI ¼YNm
j¼1
PiðSijRjÞPiðRjÞPNrk¼1 PiðSijRkÞPiðRkÞ
:
In which, Si is the score of measurement i, Rj is thecandidate reference cell population j, Nr is the number ofreference cell population, Nm is the number of compositemeasurements in CCI.The computational details of each statistic were
described as follows:1) Euclidean distance of gene expressionConsidering the prevalent of dropouts and sample size
asymmetry, gene expression level was averaged from 30random cells from each population. The sampling wasrepeat by ten thousand times for each pairwise popula-tions, from which the median value of expression differ-ence was used as the statistical measurement of twopopulations. In the meanwhile, pairwise statistical dis-tribution was built from the sampling and computations.2) Correlation of gene expressionSpearman’s rank correlation coefficient between cell
populations was calculated to measure the similarity ofgene expression. The sampling and distribution con-struction were following the same strategy as above.3) Weighted distance in top PCsThe top principal components, which could represent
the distance between cell populations or even single cells,were integrated into CCI. Euclidean distance in embed-ding space defined by top 30 eigenvectors was weighted bytheir explained variances.4) Difference of gene set enrichmentIt is well known that cells with similar function have
similar biological process and show similar gene setenrichment. Recovery curve of each gene set was con-structed and AUC value of top 5000 ranks were used forthe indication of cell similarity. Averaged gene expressionfrom 30 random cells of each population were used tocalculate the responding AUCs of 50 hallmark gene setsfrom Msigdb. Median value and statistical distributionwere derived from ten thousand of samplings.Facilitated by the comprehensive cell atlas of BMMCs
and HSPCs, we could identify the healthy counterparts ofeach leukemia cell subpopulation in HSPCs using CCI,which could greatly benefit our understanding of theprogression of leukemia.
Identifying the genetic variants in single-cell transcriptomeThere are a few reads in each locus of the single-
transcriptomic data; thus, it is very difficult to directlydetect the cell-specific variants. In order to reliably detectsingle-cell expressed specific variants, reads from everysingle individual were pooled to do variants calling. An in-house script was used to assign each single cell with its
Qin et al. Cell Discovery (2021) 7:2 Page 15 of 17

associated variants, by checking the variant on indexedreads. To reduce the artifacts and false positives, we usedfollowing criteria to filter the cell variants: (1) called in atleast 20 cells; (2) at least 5 cells with >2 reads sequenced;(3) variants observed in at least 3 cells. We found that thenumber of detected transcript mutations in each leukemiapatient was much higher than that in each healthy indi-vidual, partially due to increased number of expressedgenes in leukemia cells.The single-nucleotide variations (SNVs) identification
could be affected by the copy number variations (CNVs) instudied regions. We identified genome wide CNVs usingbulk whole-genome sequencing data from the patients, andwe used the deletion regions to filter the covered homo-zygous SNVs, as well as the associated signals. CNVnator(v0.3.2) was used to call CNVs from the whole-genomesequencing data, with a depth of ~30X, of ALL3. Thesomatic CNVs was then generated by comparing CNVs atdifferent time points to CNVs detected from its salivasample.
Haplotype tracingWe observed a sequential of homozygous variants of
SSBP2 from the major relapsed leukemia cell sub-population ALL3.4-C5, which is the alternative haplotypeof SSBP2. We analyzed 39 polymorphisms in SSBP2 toinvestigate the distribution of the alternative haplotype indifferent cell populations. Any cell with >5 loci showingthe same alleles as that in alterative haplotype (P < 0.05)were thought containing the alterative haplotype.
AcknowledgementsWe thank Dr. Keji Zhao from NIH and Xi Chen for discussion and editing of themanuscript. This study was supported by National Key R&D Program of China(2018YFC1004500), National Natural Science Foundation of China (81872330,31741077), the Science and Technology Innovation Commission of the ShenzhenMunicipal Government (JCYJ20170817111841427), the Shenzhen Science andTechnology Program (KQTD20180411143432337), CAMS Initiative for InnovativeMedicine (2017-I2M-1-015, 2016-I2M-1-017), the Ministry of Science andTechnology of China (2016YFA0100600) and the National Natural ScienceFoundation of China (81890990, 81421002, 81730006, 81770175).
Author details1Department of Biology, Southern University of Science and Technology,Shenzhen, Guangdong, China. 2State Key Laboratory of ExperimentalHematology & National Clinical Research Center for Blood Diseases, Institute ofHematology & Blood Diseases Hospital, Chinese Academy of Medical Sciences& Peking Union Medical College, Tianjin, China. 3Center for Stem Cell Medicine& Department of Stem Cell and Regenerative Medicine, Chinese Academy ofMedical Sciences & Peking Union Medical College, Tianjin, China. 4Departmentof Pediatric Hematology, Institute of Hematology & Blood Diseases Hospital,Chinese Academy of Medical Sciences & Peking Union Medical College, Tianjin,China. 5Institute of Interdisciplinary Integrative Biomedical Research, ShanghaiUniversity of Traditional Chinese Medicine, Shanghai, China. 6Department ofHematology, Nanfang Hospital, Southern Medical University, Guangzhou,China
Author contributionsW.J. conceived and designed the project. Y.P., Y.Z., Q.L., and X.Z. collected thesamples. Y.P. did the experiments. P.Q., W.H., R.F., X.W., and G.M. developedcomputational approach and performed the data analysis. W.J., C.T., and N.H.
supervised this project. W.J. and P.Q. wrote the manuscript with inputs from allauthors.
Data availabilityThe raw sequence data reported in this paper have been deposited in theGenome Sequence Archive in BIG Data Center, under accession numbersHRA000084. The code and software of CCI are available on GitHub (https://github.com/pengfeeei/cci).
Conflict of interestThe authors declare that they have no conflict of interest.
Publisher’s noteSpringer Nature remains neutral with regard to jurisdictional claims inpublished maps and institutional affiliations.
Supplementary Information accompanies the paper at (https://doi.org/10.1038/s41421-020-00223-4).
Received: 25 May 2020 Accepted: 1 October 2020
References1. Akashi, K., Traver, D., Miyamoto, T. & Weissman, I. L. A clonogenic common
myeloid progenitor that gives rise to all myeloid lineages. Nature 404,193–197 (2000).
2. Kondo, M., Weissman, I. L. & Akashi, K. Identification of clonogenic commonlymphoid progenitors in mouse bone marrow. Cell 91, 661–672 (1997).
3. Franco, C. B., Chen, C. C., Drukker, M., Weissman, I. L. & Galli, S. J. Distinguishingmast cell and granulocyte differentiation at the single-cell level. Cell Stem Cell6, 361–368 (2010).
4. Drissen, R. et al. Distinct myeloid progenitor-differentiation pathwaysidentified through single-cell RNA sequencing. Nat. Immunol. 17, 666–676(2016).
5. Notta, F. et al. Distinct routes of lineage development reshape the humanblood hierarchy across ontogeny. Science 351, aab2116 (2016).
6. Perie, L., Duffy, K. R., Kok, L., de Boer, R. J. & Schumacher, T. N. The branchingpoint in erythro-myeloid differentiation. Cell 163, 1655–1662 (2015).
7. Chattopadhyay, P. K., Gierahn, T. M., Roederer, M. & Love, J. C. Single-celltechnologies for monitoring immune systems. Nat. Immunol. 15, 128–135(2014).
8. Macosko, E. Z. et al. Highly parallel genome-wide expression profiling ofindividual cells using nanoliter droplets. Cell 161, 1202–1214 (2015).
9. Haghverdi, L., Buttner, M., Wolf, F. A., Buettner, F. & Theis, F. J. Diffusionpseudotime robustly reconstructs lineage branching. Nat. Methods 13,845–848 (2016).
10. Setty, M. et al. Wishbone identifies bifurcating developmental trajectories fromsingle-cell data. Nat. Biotechnol. 34, 637–645 (2016).
11. Qiu, X. et al. Reversed graph embedding resolves complex single-cell trajec-tories. Nat. Methods 14, 979–982 (2017).
12. Wang, W., Ren, G., Hong, N. & Jin, W. Exploring the changing landscape of cell-to-cell variation after CTCF knockdown via single cell RNA-seq. BMC Genomics20, 1015 (2019).
13. Velten, L. et al. Human haematopoietic stem cell lineage commitment is acontinuous process. Nat. Cell Biol. 19, 271–281 (2017).
14. Zheng, S., Papalexi, E., Butler, A., Stephenson, W. & Satija, R. Molecular transi-tions in early progenitors during human cord blood hematopoiesis. Mol. Syst.Biol. 14, e8041 (2018).
15. Tusi, B. K. et al. Population snapshots predict early haematopoietic and ery-throid hierarchies. Nature 555, 54–60 (2018).
16. Karamitros, D. et al. Single-cell analysis reveals the continuum of humanlympho-myeloid progenitor cells. Nat. Immunol. 19, 85–97 (2018).
17. Buenrostro, J. D. et al. Integrated single-cell analysis maps the continuousregulatory landscape of human hematopoietic differentiation. Cell 173,1535–1548 e1516 (2018).
18. Hay, S. B., Ferchen, K., Chetal, K., Grimes, H. L. & Salomonis, N. The Human CellAtlas bone marrow single-cell interactive web portal. Exp. Hematol. 68, 51–61(2018).
Qin et al. Cell Discovery (2021) 7:2 Page 16 of 17

19. Corces, M. R. et al. Lineage-specific and single-cell chromatin accessibilitycharts human hematopoiesis and leukemia evolution. Nat. Genet. 48,1193–1203 (2016).
20. Giustacchini, A. et al. Single-cell transcriptomics uncovers distinct molecularsignatures of stem cells in chronic myeloid leukemia. Nat. Med. 23, 692–702(2017).
21. van Galen, P. et al. Single-cell RNA-Seq reveals AML hierarchies relevant todisease progression and immunity. Cell 176, 1265–1281.e1224 (2019).
22. Granja, J. M. et al. Single-cell multiomic analysis identifies regulatory programsin mixed-phenotype acute leukemia. Nat. Biotechnol. 37, 1458–1465 (2019).
23. van der Maaten, L. J. P. & Hinton, G. E. Visualizing high-dimensional data usingt-SNE. J. Mach. Learn. Res. 9, 2579–2605 (2008).
24. Dahlin, J. S. et al. Lin- CD34hi CD117int/hi FcepsilonRI+ cells in human bloodconstitute a rare population of mast cell progenitors. Blood 127, 383–391(2016).
25. Paul, F. et al. Transcriptional heterogeneity and lineage commitment inmyeloid progenitors. Cell 163, 1663–1677 (2015).
26. Street, K. et al. Slingshot: cell lineage and pseudotime inference for single-celltranscriptomics. BMC Genomics 19, 477 (2018).
27. Weinreb, C., Wolock, S. & Klein, A. M. SPRING: a kinetic interface for visualizinghigh dimensional single-cell expression data. Bioinformatics 34, 1246–1248 (2018).
28. Laurenti, E. & Gottgens, B. From haematopoietic stem cells to complex dif-ferentiation landscapes. Nature 553, 418–426 (2018).
29. Popescu, D. M. et al. Decoding human fetal liver haematopoiesis. Nature 574,365–371 (2019).
30. Chen, L. et al. Transcriptional diversity during lineage commitment of humanblood progenitors. Science 345, 1251033 (2014).
31. Orkin, S. H. & Zon, L. I. Hematopoiesis: an evolving paradigm for stem cellbiology. Cell 132, 631–644 (2008).
32. da Rocha, E. L. et al. Reconstruction of complex single-cell trajectories usingCellRouter. Nat. Commun. 9, 892 (2018).
33. Mansson, R. et al. Single-cell analysis of the common lymphoid progenitorcompartment reveals functional and molecular heterogeneity. Blood 115,2601–2609 (2010).
34. Dohner, H., Weisdorf, D. J. & Bloomfield, C. D. Acute myeloid leukemia. N. Engl.J. Med. 373, 1136–1152 (2015).
35. Chang, L. W. et al. Computational identification of the normal and perturbedgenetic networks involved in myeloid differentiation and acute promyelocyticleukemia. Genome Biol. 9, R38 (2008).
36. Subramanian, A. et al. Gene set enrichment analysis: a knowledge-basedapproach for interpreting genome-wide expression profiles. Proc. Natl Acad.Sci. USA 102, 15545–15550 (2005).
37. Krausgruber, T. et al. IRF5 promotes inflammatory macrophage polarizationand TH1-TH17 responses. Nat. Immunol. 12, 231–238 (2011).
38. Gawad, C., Koh, W. & Quake, S. R. Dissecting the clonal origins of childhoodacute lymphoblastic leukemia by single-cell genomics. Proc. Natl Acad. Sci. USA111, 17947–17952 (2014).
39. Paguirigan, A. L. et al. Single-cell genotyping demonstrates complex clonaldiversity in acute myeloid leukemia. Sci. Transl. Med. 7, 281re282 (2015).
40. Zhang, Y. et al. PDGFRB mutation and tyrosine kinase inhibitor resistance inPh-like acute lymphoblastic leukemia. Blood 131, 2256–2261 (2018).
41. Bozic, I. et al. Accumulation of driver and passenger mutations during tumorprogression. Proc. Natl Acad. Sci. USA 107, 18545–18550 (2010).
42. Mullighan, C. G. et al. Deletion of IKZF1 and prognosis in acute lymphoblasticleukemia. N. Engl. J. Med. 360, 470–480 (2009).
43. de Rooij, J. D. et al. Recurrent deletions of IKZF1 in pediatric acute myeloidleukemia. Haematologica 100, 1151–1159 (2015).
44. Liang, H., Samanta, S. & Nagarajan, L. SSBP2, a candidate tumor suppressorgene, induces growth arrest and differentiation of myeloid leukemia cells.Oncogene 24, 2625–2634 (2005).
45. Gupta, S. D. & Sachs, Z. Novel single-cell technologies in acute myeloid leu-kemia research. Transl. Res. 189, 123–135 (2017).
46. Jin, W. et al. Genome-wide detection of DNase I hypersensitive sites in singlecells and FFPE tissue samples. Nature 528, 142–146 (2015).
47. Lai, B. et al. Principles of nucleosome organization revealed by single-cellmicrococcal nuclease sequencing. Nature 562, 281–285 (2018).
48. Zheng, G. X. et al. Massively parallel digital transcriptional profiling of singlecells. Nat. Commun. 8, 14049 (2017).
49. Vardiman, J. W. et al. The 2008 revision of the World Health Organization(WHO) classification of myeloid neoplasms and acute leukemia: rationale andimportant changes. Blood 114, 937–114 (2009). 951.
50. van der Maaten, L. & Hinton, G. Visualizing Data using t-SNE. J. Mach. Learn. Res.9, 2579–2605 (2008).
51. Zhou, B. & Jin, W. Visualization of Single Cell RNA-Seq Data Using t-SNE in R.Methods Mol. Biol. 2117, 159–167 (2020).
52. Angerer, P. et al. destiny: diffusion maps for large-scale single-cell data in R.Bioinformatics 32, 1241–1243 (2016).
53. Trapnell, C. et al. The dynamics and regulators of cell fate decisions arerevealed by pseudotemporal ordering of single cells. Nat. Biotechnol. 32,381–386 (2014).
54. Schmeier, S., Alam, T., Essack, M. & Bajic, V. B. TcoF-DB v2: update of thedatabase of human and mouse transcription co-factors and transcriptionfactor interactions. Nucleic Acids Res. 45, D145–D150 (2017).
55. Fletcher, R. B. et al. Deconstructing olfactory stem cell trajectories at single-cellresolution. Cell Stem Cell 20, 817–830.e818 (2017).
56. Mootha, V. K. et al. PGC-1alpha-responsive genes involved in oxidativephosphorylation are coordinately downregulated in human diabetes. Nat.Genet. 34, 267–273 (2003).
Qin et al. Cell Discovery (2021) 7:2 Page 17 of 17
Copyright © 2022 FDOKUMEN