Institutional Investor Monitoring and the Structure of Corporate Boards
67
1 Institutional Investor Monitoring and the Structure of Corporate Boards * David R. Gallagher † Gavin S. Smith ‡ Peter L. Swan § Current Draft: October 2, 2007 School of Banking and Finance, Australian School of Business, The University of New South Wales, Sydney, N.S.W. 2052 Abstract: This study examines the effect of institutional investor influence on the structure of corporate boards. We focus on investor influences with respect to reducing board size and increasing board independence. Measures of institutional influence are negatively related to board size and positively related to board independence. To achieve these aims, institutions remove inside directors. This effect is enhanced when the firm has performed poorly - institutions take corrective action to improve firm performance by punishing those directors deemed responsible for contributing to poor firm performance. Institutional investors do not adjust their monitoring objectives with respect to board size and independence to reflect firm specific characteristics. JEL classification: G23, G32, J33 Keywords: Board of Directors, Monitoring, Institutional Investment Behavior * The authors are grateful to the Australian Research Council (DP0346064) for research funding and to David Yermack for insightful comments. † Email: [email protected] . Phone: 61292369106. ‡ Corresponding author. Email: [email protected] . Phone: 61282473123. § Mail: School of Banking and Finance, The University of New South Wales, UNSW Sydney 2052, Australia. Email: [email protected] . Phone: 61293855871.
-
Upload
independent -
Category
Documents
-
view
4 -
download
0
Transcript of Institutional Investor Monitoring and the Structure of Corporate Boards
1
Institutional Investor Monitoring and the Structure of Corporate Boards*
David R. Gallagher†
Gavin S. Smith‡
Peter L. Swan§
Current Draft: October 2, 2007
School of Banking and Finance, Australian School of Business, The University of New South
Wales, Sydney, N.S.W. 2052
Abstract: This study examines the effect of institutional investor influence on the structure of corporate boards. We focus on investor influences with respect to reducing board size and increasing board independence. Measures of institutional influence are negatively related to board size and positively related to board independence. To achieve these aims, institutions remove inside directors. This effect is enhanced when the firm has performed poorly - institutions take corrective action to improve firm performance by punishing those directors deemed responsible for contributing to poor firm performance. Institutional investors do not adjust their monitoring objectives with respect to board size and independence to reflect firm specific characteristics.
JEL classification: G23, G32, J33
Keywords: Board of Directors, Monitoring, Institutional Investment Behavior
*The authors are grateful to the Australian Research Council (DP0346064) for research funding and to David Yermack for insightful comments. † Email: [email protected]. Phone: 61292369106. ‡ Corresponding author. Email: [email protected]. Phone: 61282473123. § Mail: School of Banking and Finance, The University of New South Wales, UNSW Sydney 2052, Australia. Email: [email protected]. Phone: 61293855871.

2
I. Introduction
Large shareholders, such as institutional investors, possess considerable
influence over firms in which they are shareholders. Because institutional investors
have large investments in firms, they have significant bargaining power and can gain
direct access to the top management of a firm—something atomistic shareholders
cannot achieve. Institutions also have the funds, resources and ability to wage
concerted campaigns to remove or appoint directors—they have the leverage to have
their voice heard. Institutional investors are in principle able to appoint board
members representing their interests. Hence, the effectiveness of corporate
governance typically requires the presence of large institutional investors.
This paper examines the effect of institutional investor influence on the
structure of corporate boards. Institutional investor influence on board structure is an
important issue given the role the board of director’s plays within corporations. The
board of directors is a central organizational mechanism for alleviating agency
problems and to better align management’s interests with those of shareholders. While
the board delegates to management the task of initiating and implementing various
decisions, it is the board that has the control and authority to ratify and monitor major
policy initiatives and to hire, fire and set the compensation of top management (Fama
and Jensen, 1983). By keeping the management and control aspects of the decision-
making process separate, the board is able to reduce agency conflicts. In essence, the
board of directors act as shareholders’ representatives in monitoring management, and
so work to resolve the fundamental agency problem facing firms.
To ensure the board effectively fulfils its role of monitoring management, two
aspects of board structure are scrutinized—board size and board independence. A
3
small board is said to be harder for the CEO to control (Jensen, 1993), allow increased
communication between board members (Lipton and Lorsch, 1992), result in
enhanced shareholder value (e.g., Yermack, 1996; Eisenberg, Sundgren and Wells,
1998; Gertner and Kaplan, 1997) and improved decision making. Similarly, a higher
proportion of boards that consist of non-management affiliated individuals (i.e.,
independent directors), weakens CEO power over the board. Independent directors are
viewed as not being ‘friendly’ to management and are more likely to scrutinize the
behavior of CEOs.
The focus of this study is in determining whether institutional investors
succeed in reducing board size and increasing independence. In understanding
whether institutional influence does result in more effective boards, it is also
important to understand how institutional investors achieve these objectives. Our
study examines director appointments and departures to gain insights into how
institutional investors may potentially alter board size and independence. To isolate
the monitoring objectives of institutions, alternative hypotheses are addressed that
predict optimality of different board structures (e.g. Coles, Daniel and Naveen, 2007;
Boone, Field, Karpoff and Raheja, 2007; Adams and Ferreira, 2007). These
hypotheses predict that firms with certain characteristics may not benefit from a
general prescription of smaller boards and increased independence. Tests are
conducted to determine whether institutional influence varies with firm specific
characteristics.
We find that institutional investor influence is negatively related to board size,
and positively related to board independence using pooled OLS, firm random effects
and firm fixed effects. However, these results do become insignificant using a 2SLS
4
approach which allows us to control for concerns over endogeneity. The low
variability of governance mechanisms makes the determination of causal relations
difficult. This suggests that our instrumental variables approach that orthogonalizes
institutional ownership to board characteristics may be effective; it may also be overly
harsh.
Examining director appointments and departures is potentially a better test of
institutional monitoring as it captures changes in board structure, making the
determination of causal relations more reliable. Institutional investors appear to focus
on removing inside directors as a means of reducing board size and increasing
independence. Institutional influence is also positively related to both the appointment
and departure of inside directors. Since more insiders are being removed than
appointed, this results in an increase in board independence. This relationship is
particularly evident in periods when a firm has performed poorly. Institutions take
corrective action to improve firm performance and punish those directors deemed
responsible for contributing to poor firm performance. This analysis of director
appointments and departures provides support for institutional investors being
effective monitors of corporate boards. We also fail to find consistent support for
claims that institutional investors vary their monitoring objectives away from the
pursuit of smaller boards and increased independence to reflect firm specific
characteristics.
This paper is organized as follows. The next section reviews related literature.
Section III describes the data and measurement of the variables. Section IV presents
our results with respect to the effect of institutional investor influence on board size
and independence. Section V explores the role of institutional investors in influencing
5
the appointment and departure of directors. Section V tests alternative monitoring
hypotheses that suggest the optimality of different board structures, and the final
section concludes.
II. Literature Review
Previous studies have shown that institutions monitor across a number of
dimensions; for example, executive compensation (Smith and Swan, 2007a,b),
earnings management (Chung, Firth and Kim, 2002), anti-takeover charter
amendments (Agrawal and Mandelker, 1990) and forced CEO turnover (Parrino, Sias
and Starks, 2003). Two studies have focused on the effect of institutional investor
influence on board structure. First, Wu (2004) examines the public naming of firms
by a single institution, CalPERS, and finds in the period 1988-1995, median board
size declined from 12 to 11 and the number of inside directors on the board also
declined from three to two. Second, Whidbee (1997) considers the effect of
institutions on 190 publicly traded bank holding companies and finds that board
independence increases when institutional investors own more of the firm. Our study
extends Wu (2004) and Whidbee (1997) by using a more comprehensive sample of
both institutional investors and firms, and also by examining how institutions achieve
their objectives with respect to board structure.
There is also extant literature that provides support for why institutions should
focus on smaller boards and increased board independence. Yermack (1996)
documents, in a sample of large US firms, that board size is inversely related to
Tobin’s Q and also various accounting ratios, such as return on assets. Similarly,
Eisenberg, Sundgren and Wells (1998) examine a sample of small and medium sized
6
Finnish firms that board size is inversely related to industry adjusted return on assets.
In a sample of reverse leverage buyout (LBO) firms Gertner and Kaplan (1997) find
that boards are smaller. This is said to provide evidence from the efficiency of smaller
boards due to the incentives of LBO specialists to structure boards in a way that
maximizes shareholder value. Smaller boards are also associated with improved
decision making. For example, Yermack (1996) finds smaller boards are more likely
to dismiss CEOs for poor performance and increase the sensitivity of CEO salaries
and bonuses to firm performance, while Core, Holthausen and Larcker (1999)
document that larger boards increase the level of CEO compensation.
Disturbingly, given mandated increases in board independence in the U.S. and
more widely1, findings indicating the effect of board composition on firm
performance are mixed. Baysinger and Butler (1985) and Hermalin and Weisbach
(1991) find no significant relationship between board composition and measures of
firm performance. Yermack (1996) and Agrawal and Knoeber (1996) show a
significant negative relation between the proportion of independent directors and
Tobin’s Q. Rosenstein and Wyatt (1990) examine the performance relation from an
event study perspective. They find a positive stock price reaction when a company
appoints an additional outside director. However, Rosenstein and Wyatt find a
stronger price reaction for outside directors who work for financial institutions than
for directors whose principal job is with another unrelated non-financial corporation.2
1 The Sarbanes Oxley Act of 2002 and amended listing requirements have required the appointment of
a higher proportion of outside board members. See, for example, Wintoki (2007). New listing rules in
Australia and elsewhere act in a similar direction. 2 Yet outside directors who work for financial institutions are usually treated as affiliated outside
directors rather than independent directors, because their own firm may be interested in business
dealings with the firm on whose board they sit.
7
Rosenstein and Wyatt (1997) perform an event study of the appointment of
inside directors. A key feature of their findings is that the market reaction to the
appointment of insiders depends on the ownership of the insider. When the insider
owns less than 5% of the firm’s stock, the market reaction is significantly negative.
The market reaction is significantly positive when the ownership is between 5 and
25% and insignificantly different from zero when the ownership exceeds 25%.
Although the performance effects of independent boards are questionable, they
have been shown to provide an episodic monitoring function, by benefiting
shareholders in extraordinary or crisis situations. Increased levels of independent
directors improve the effectiveness of the board when it comes to dismissing poorly
performing CEOs (Weisbach, 1988), selecting new CEOs (Borokhovich, Parrino and
Trapani, 1996) and awarding incentive compensation (Yermack, 1996). Additionally,
independent directors have been found to do a better job negotiating takeovers offers
on behalf of shareholders of target firms (Cotter, Shivdasani and Zenner, 1997), make
better acquisitions (Byrd and Hickman, 1992), produce better value and only adopt
poison pills when they are genuinely in the interests of shareholders (Brickley, Coles
and Terry, 1994). Finally, management led buyouts of firms with outsider boards have
higher abnormal returns than this with insider boards (Lee, Rosenstein, Rangan and
Davidson, 1992).
III. Data
This section discusses the data employed in the study, variable measurement,
descriptive statistics and the methodology. Board of director data is sourced from the
Investor Responsibility Research Center (IRRC). Institutional holdings, used to

8
compute measures of institutional influence, are from the Thomson Financial
CDA/Spectrum database.3 Firm level accounting and stock price data are from S&P’s
Compustat and the Centre for Research in Stock Prices (CRSP), respectively. Data is
collected for the firm fiscal years corresponding to 1996-2002.4 Our sample of firms
is based on the coverage of IRRC. Financial firms are excluded from the sample. Our
matched sample yields a maximum of 9,086 firm years.
A. Board of Director Measures:
Two key characteristic of boards are computed—board size and board
independence. Board size represents the total number of directors on the board. The
natural logarithm of board size is employed throughout the study. Independent
directors are defined as those which have no family relations with directors on the
board, have not worked for the company in the past, are not currently employees, and
also do not have any business relationship with the company. The definition of
independent directors is designed to exclude inside and grey directors that may have
some affiliation with insiders. Insiders are full-time company employees who fulfill
an executive role and are typically on the board. The proportion of independent
directors on the board of directors is then computed as the ratio of independent
directors to the total number of directors on the board.
To better understand how institutional investors shape board size and
independence, various measures of changes in board structure are also computed.
3 This database consists of quarterly 13-F filings of money managers to the U.S Securities and
Exchange Commission (SEC). Institutions with more than $100 million of securities under
management are required to report to the SEC. All positions that are greater than 10,000 shares or
$200,000 must be disclosed (Gompers and Metrick, 2001). 4 If a firm has a fiscal year that does not correspond exactly to a quarter-end, we make an adjustment to
a firm’s fiscal year. The fiscal year is rounded up to the nearest calendar quarter end.
9
First, appointments and departures of directors are observed. The number of
appointments and departures are then scaled by the number of directors up for
election. This measure is used because it provides a better indication of what
institutions can influence contemporaneously. Intuitively, if a firm has a staggered
board, only part of the board is up for election and so institutions are limited in how
they can change the board composition on an annual basis. Indeed, as noted above,
staggered boards are a major contributor to lack of takeover vulnerability. Second, the
departure and appointment of independent and inside directors are computed. Grey
directors are included with insiders. Again, the numbers of independent and inside
directors that have been appointed or departed are scaled by the number of
independent and inside directors nominated for re-election, respectively.
B. Institutional Influence Measures:
To measure institutional influence, ownership-based metrics are employed. 5
Two primary measures of institutional investor influence are utilized. The first
measure is a Herfindahl Index of the ownership of the top5 institutions. This is
defined as the sum of the squared holdings of the top five institutions as a percent of
total shares outstanding, and is designed to capture the concentration of institutional 5 Indirect support for the use of institutional ownership measures comes from several studies that have
found a positive relation between shareholder proposals and institutional ownership. The suggestion
being institutional ownership is an important characteristic in choosing proposal targets. Bizjak and
Marquette (1998), Carleton et al. (1998), Karpoff et al. (1996) and Smith (1996) find that institutional
investor ownership is high. Proposals are high in these firms due to expectation that institutions
cooperate. Moreover, institutional investors, who have far greater incentives to engage in informed
voting compared to individual shareholder because of the size and extent of their holdings, are
hypothesized to vote for proposals enhancing shareholders’ ability to monitor management with greater
frequency. Gordon and Pound (1993) and Gillan and Starks (2000) show that the percentage of votes
cast for shareholder proposals is positively related to institutional ownership.

10
ownership. Concentration is expected to be an important measure of institutional
influence since higher concentrations may decrease the cost of institutional
cooperation, and increase the incentive for institutions to take the lead in activist
efforts (Clay, 2000). The Herfindahl Index of top 5 ownership is winsorized at the 1%
and 99% levels, and also used in log form. This approach is employed to remove the
effect of extreme values in the Herfindahl Index.
The second measure of institutional influence is based on the level of
institutional ownership, computed as the proportion of shares held by the five largest
institutional holders (denoted Top5 Ownership). This measure is meant to capture the
level of ownership of institutions with large holdings. We argue that monitoring costs
decrease with the size of the institutional holding. As long as there is a fixed
component to the cost of gathering and analyzing information on the invested firm,
there will be economies of scale in monitoring technology. The larger the holdings of
an institution, the smaller will be the proportional cost of monitoring. Further, larger
holdings can actually reduce the total costs of monitoring by giving the institution
easier access to management and the board (Chen, Harford, Li, 2007). Carleton,
Nelson and Weisbach (1998) show that institutions with large ownership positions
often have access to board members and senior managers. Institutional investors with
large holdings appear to have greater incentives to monitor since they cannot always
sell shares of underperforming firms. This is not only because trading their larger
holdings could create adverse price shifts and exacerbate losses, but also because
many institutions index a large portion of their holdings. Despite all these advantages
of large monitors acknowledged by Noe (2002), in an incentive-compatible
microstructure trading equilibrium in which monitors have to recover the fixed costs
of monitoring from trading profits, smaller strategic investors will have a higher
11
probability of monitoring than larger incumbents (Noe, 2002). This is because both
monitoring and informed trading have to come as a surprise otherwise spreads rise so
as to choke off profitable trading. Thus to the extent that Top5 ownership is able to
explain board monitoring, as opposed to smaller institutional investors that trade more
actively, the lesser importance must attach for the need for such monitors to recover
costs from informed trading activities. Smith and Swan (2007b) find that smaller
institutional investors trading more intensively, rather than Top5 ownership, is most
associated with higher pay performance sensitivity of option grants and higher
executive pay.
The Top5 Ownership measure of institutional influence is further decomposed
to address issues of institutional investor heterogeneity. One issue that arises in
measuring institutional influence is that not all institutions are willing or able to exert
their influence. Brickley, Lease and Smith (1988) establish that some institutional
investors (e.g., insurance companies and banks through their trust departments) have
either existing or potential business relationships with firms, and, therefore, in order
to protect those relationships they might be less willing to challenge management
decisions. In contrast, institutions such as investment companies, independent
investment advisors and public pension funds do not seek business relationships with
the firms in which they invest (we call these “independent” institutional investors).
Institutions, such as banks and insurance companies, face high costs to monitoring
because they could damage their relationship with firm management and lose existing
or potential business. Thus, independent institutions without potential business ties
face lower costs to monitoring (Chen, Harford and Li, 2007).
Following Almazan, Hartzell and Starks (2005), institutions are categorized
into two groups based on their potential business relations with the firms in which

12
they invest. The first group is defined as Potentially Passive, due to the fact they have
potential business relations with firms and are susceptible to pressure from
management. CDA Spectrum classifications are used; with potentially passive
institutions including banks, insurance companies and institutions that fall into CDA’s
Other category. The second group is defined as Potentially Active, due to the fact
they are not expected to have significant potential business relations with firms and
are therefore not susceptible to pressure from management. These institutions include
investment companies or independent advisers. For each category of institution,
ownership is computed as a proportion of total shares outstanding if the institution is
one of the top 5 holders in the firm.6
For our study we are only interested in measures of institutional influence that
correspond to the fiscal year-end of the firm. If holdings are not reported for the
quarter for which the fiscal year ends, we take the reported holding that is closest to
this date. Moreover, if a stock has a fiscal year that does not correspond exactly to a
quarter-end, we make an adjustment to a firm’s fiscal year. The fiscal year is rounded
up to the nearest calendar quarter-end.
C. Methodology:
This section develops the models used to examine the effect of institutional
investor influence on the structure of corporate boards.
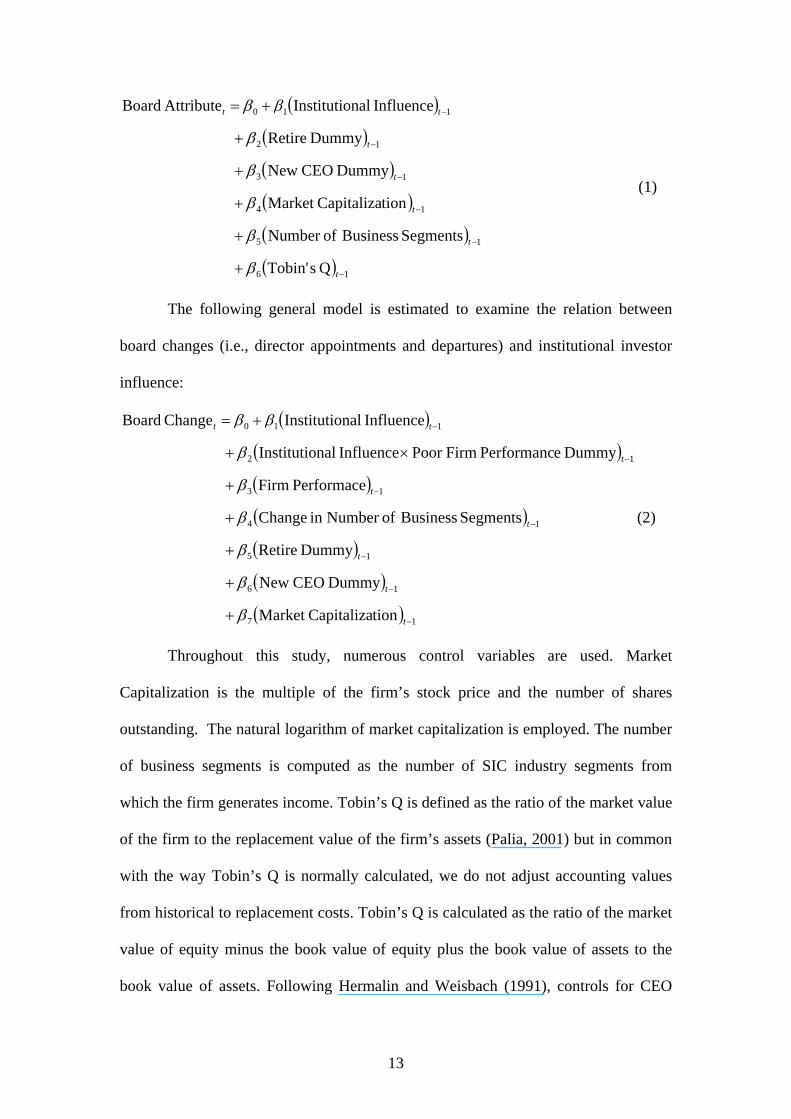
The following general model is estimated to examine the relation between
board attributes (i.e., board size and board independence) and institutional investor
influence:
6 Our measures of institutional heterogeneity are based on the level of ownership, rather than
concentration as used by Almazan et al. (2005) and Hartzell and Starks (2003).
13
( )
( )
( )
( )
( )
( ) 16
15
14
13
12
110
Q sTobin'
Segments Business ofNumber
tionCapitalizaMarket
Dummy CEO New
Dummy Retire
Influence nalInstitutioAttribute Board
−
−
−
−
−
−
+
+
+
+
+
+=
t
t
t
t
t
tt
β
β
β
β
β
ββ
(1)
The following general model is estimated to examine the relation between
board changes (i.e., director appointments and departures) and institutional investor
influence:
( )
( )
( )
( )
( )
( )
( ) 17
16
15
14
13
12
110
tionCapitalizaMarket
Dummy CEO New
Dummy Retire
Segments Business ofNumber in Change
Performace Firm
Dummy ePerformanc FirmPoor Influence nalInstitutio
Influence nalInstitutioChange Board
−
−
−
−
−
−
−
+
+
+
+
+
×+
+=
t
t
t
t
t
t
tt
β
β
β
β
β
β
ββ
(2)
Throughout this study, numerous control variables are used. Market
Capitalization is the multiple of the firm’s stock price and the number of shares
outstanding. The natural logarithm of market capitalization is employed. The number
of business segments is computed as the number of SIC industry segments from
which the firm generates income. Tobin’s Q is defined as the ratio of the market value
of the firm to the replacement value of the firm’s assets (Palia, 2001) but in common
with the way Tobin’s Q is normally calculated, we do not adjust accounting values
from historical to replacement costs. Tobin’s Q is calculated as the ratio of the market
value of equity minus the book value of equity plus the book value of assets to the
book value of assets. Following Hermalin and Weisbach (1991), controls for CEO
14
tenure are also included. A dummy variable equal to one if the CEO has tenure with
the company of less than 4.5 years, and zero otherwise, is referred to as New CEO.
Following Weisbach (1988) controls for retirement are used. A dummy variable equal
to one if the CEO is aged between 62 and 66, and zero otherwise, is referred to as
Retirement Age. Industry and year dummy controls are also included throughout the
study. Market capitalization and Tobin’s Q are log-transformed to mitigate the effect
of variable skewness in estimation. All continuous independent variables are
winsorized at the 1% and 99% levels. Winsorizing is employed to mitigate the effect
of extreme observations.
When estimating equation (1) and (2) several econometric issues are
addressed. In our analysis we run OLS regressions for the pooled sample. A problem
with using a pooled sample is that it is likely that the residuals for each firm will be
correlated across years and residuals may also be correlated across firms within a
single year. Three approached are utilized to overcome this problem: 1) pooled
regressions using year dummies and Rogers’ robust standard errors (Rogers, 1993); 2)
firm random effects with year dummies; and 3) firm fixed effects with year dummies.
The first estimation technique which applies to firm clustering assumes
observations of different firms are independent, but allows for temporal correlation
between observations of the same firm in different years. Year dummies control for
spatial correlation across firms within a year. According to Petersen’s (2004)
simulations, clustered Rogers standard errors are correct in the presence of year
effects (if year dummies are included), with no assumed parametric structure for
within-cluster errors, so that the firm effect can vary both spatially and temporally. If
firm effects vary across time, clustered Rogers standard errors are superior to those
15
from a fixed effects and random effects models, because these model assume time
invariant firm effects.
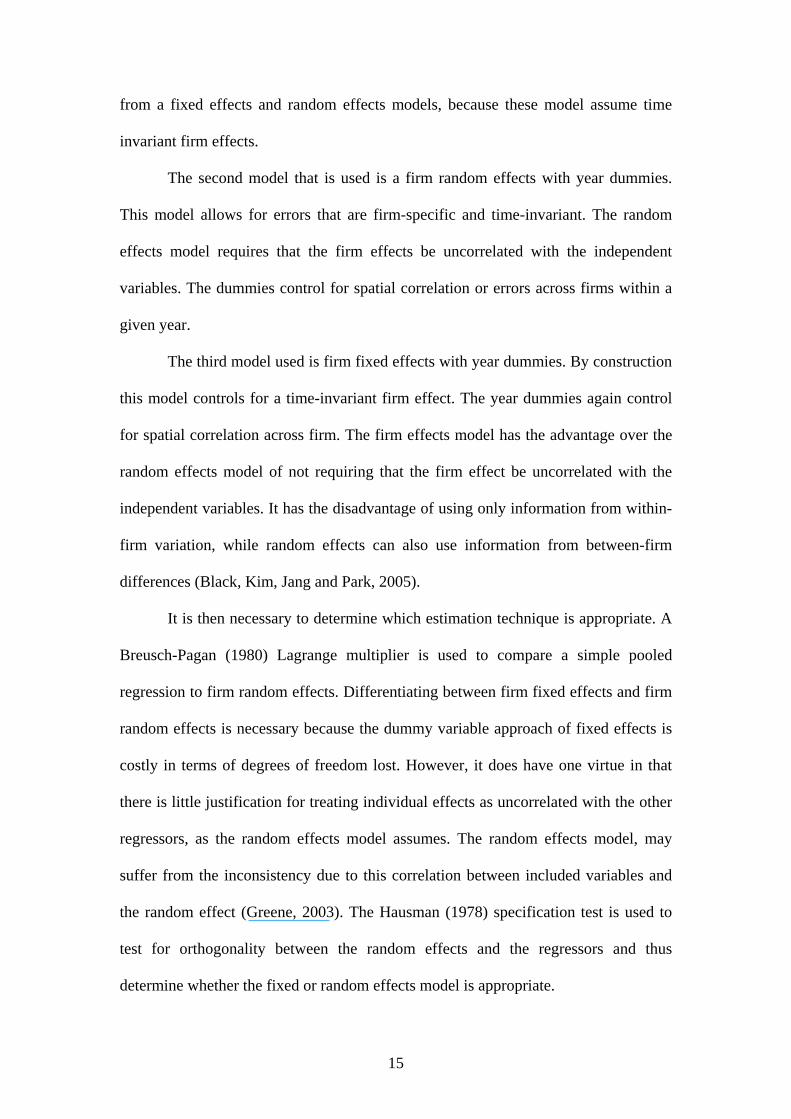
The second model that is used is a firm random effects with year dummies.
This model allows for errors that are firm-specific and time-invariant. The random
effects model requires that the firm effects be uncorrelated with the independent
variables. The dummies control for spatial correlation or errors across firms within a
given year.
The third model used is firm fixed effects with year dummies. By construction
this model controls for a time-invariant firm effect. The year dummies again control
for spatial correlation across firm. The firm effects model has the advantage over the
random effects model of not requiring that the firm effect be uncorrelated with the
independent variables. It has the disadvantage of using only information from within-
firm variation, while random effects can also use information from between-firm
differences (Black, Kim, Jang and Park, 2005).
It is then necessary to determine which estimation technique is appropriate. A
Breusch-Pagan (1980) Lagrange multiplier is used to compare a simple pooled
regression to firm random effects. Differentiating between firm fixed effects and firm
random effects is necessary because the dummy variable approach of fixed effects is
costly in terms of degrees of freedom lost. However, it does have one virtue in that
there is little justification for treating individual effects as uncorrelated with the other
regressors, as the random effects model assumes. The random effects model, may
suffer from the inconsistency due to this correlation between included variables and
the random effect (Greene, 2003). The Hausman (1978) specification test is used to
test for orthogonality between the random effects and the regressors and thus
determine whether the fixed or random effects model is appropriate.

16
For all combination of board attributes (i.e. board size and board
independence) and institutional influence (i.e., Herfindahl Index, Top5 Ownership,
Potentially Active and Passive Ownership) a Breusch-Pagan (1980) Lagrange
multiplier test rejects a simple pooled regression compared to a firm random effects
model, with p-values of, or close to, zero. This suggests that pooled regression
coefficients may be biased relative to fixed or random effects models. Moreover, a
Hausman test produces p-values of zero meaning we can reject the hypothesis that the
individual effects are uncorrelated with the other regressors in the model. This
suggests that the fixed effects model is appropriate throughout the study.
When estimating the pooled regression using clustered Rogers standard errors
industry and year dummies are included in both equation (2) and (3). The industry
dummy variable takes a value of 1 for the two-digit Standard Industrial Classification
(SIC) in which the firm operates. The year dummy variable takes a value of 1 if the
observation was from the given year.
A second methodological issue is endogeneity. Here the independent variable
may be correlated with the error term and thus produce a biased coefficient. This
correlation can come from two sources: omitted variables bias and reverse causality.
Using a panel data structure helps overcome problems associated with omitted
variable bias. By using either firm fixed effects of firm random effects model, we can
capture unobserved heterogeneity that is firm specific and time invariant. A greater
challenge comes from reverse causality. For example, institutions may self select into
firms based on preferences for existing board structures already in place. An
instrumental variables approach is utilized to address the problem of endogeneity.
This method requires the specification of instrumental variables that are both
correlated with the endogenous variable and uncorrelated with the error term of the
17
original regression. A problem is in identifying an appropriate instrument for
institutional influence. We resort to orthogonalizing institutional influence with
respect to lagged board size, board independence and firm size. We include firm size
in the orthogonalization process to control for size effects in board size. This process
ensures institutional influence is unrelated to lagged board structures.
Using our instruments, a Durbin-Wu-Hausman test for endogeneity is
conducted and two stage least squares regressions are estimated. The Durbin-Wu-
Hausman test procedure is similar to 2SLS. For example, in the first stage we regress
institutional influence on their orthogonalized equivalent and other control variables.
In the second stage we regress the compensation measures on institutional influence,
control variables and the residual from the first stage regression. A significant
coefficient on the first stage residual is evidence of endogeneity. For the Durbin-Wu-
Hausman test and the 2SLS firm fixed effects is employed since the Hausman test
suggests this is the correct model specification.
When estimating model (2) pooled regressions using year dummies and
Rogers’ robust standard errors are used. The fact that model (2) employs board
changes (i.e., director appointments and departures) mitigates problems associated
with reverse causality.
D. Descriptive Statistics:
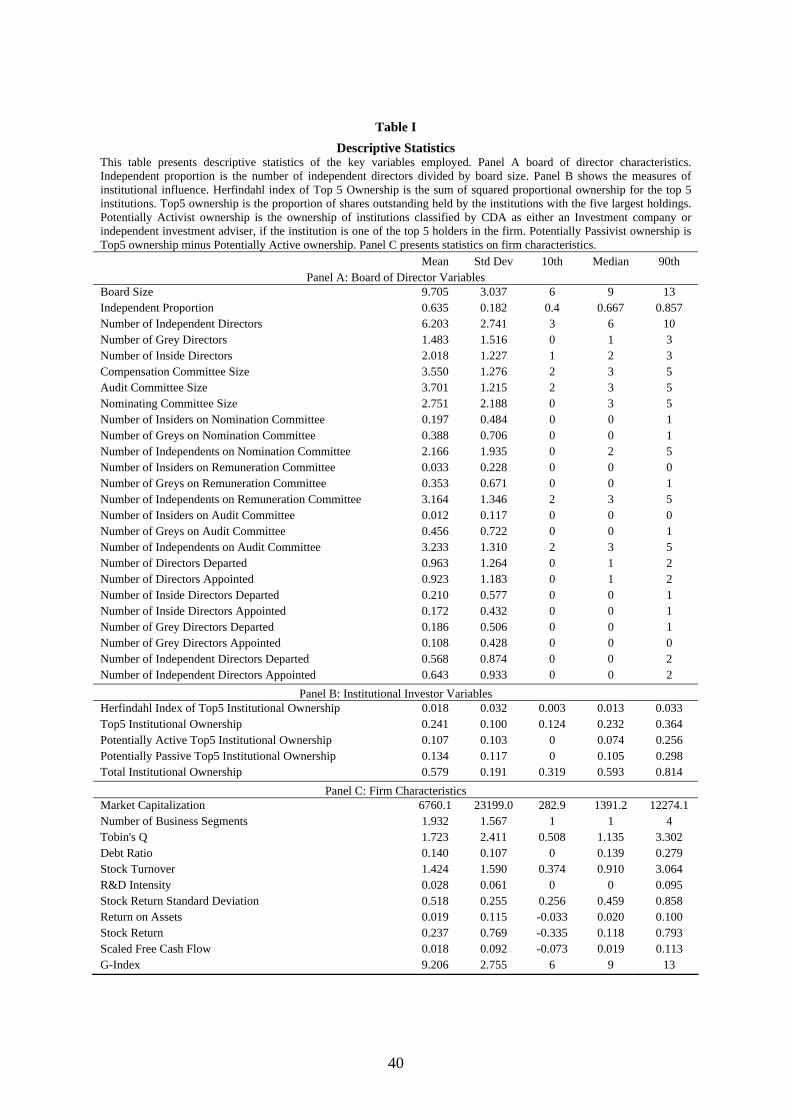
Table I presents descriptive statistics of the key variables. Panel A presents
statistics on the board of directors. Panel B presents statistics on institutional investor
measures of influence and Panel C presents statistics on firm characteristics. In our
sample the average board size is 9.7 with 63.9 percent of the board being composed of
independent directors. The average size of compensation, audit and nominating
18
committees is 3.5, 3.7 and 2.7, respectively. Board size changes very little on an
annual basis, with 0.96 directors departing and 0.92 directors being appointed.
Moreover, inside and grey directors have over time been slowly replaced by
independent directors. On average, 0.21 inside and 0.18 grey directors depart while
only 0.17 inside and 0.10 grey directors are appointed. On the other hand, 0.56
independent directors depart and 0.64 independent directors are appointed. In our
sample, institutions own on average 57.9 percent of the firms in which they invest.
The top five institutions own 24.1 percent of firms, showing that relatively few
institutions can yield considerable influence if they work together. The average
(median) market capitalization of the firm in our sample is $6.7 ($1.3) billion. In
Table II, correlations between the key variables are examined. A negative relation
generally exists between our measures of institutional investor influence and board
size, while a positive relation exists with board independence.
<<INSERT TABLES I AND II>>
IV. Board Size and Independence as a Function of Institutional Investor Influence
In this section the effect of institutional investor influence on board size and
the proportion of independent directors on the board are examined. These board
characteristics are empirically related to improved firm performance and decision-
making by the board. They are also aspects of board structure that activist pension
funds have publicly targeted. For example, TIAA-CREF has stated that it will only
invest in companies that have a majority of outside directors on the board. Similarly,
19
CalPERS recommends that the CEO should be the only inside director on a firm’s
board (Coles, Daniel and Naveen, 2007).
A. Board Size:
Table III presents the results for the effect of the Herfindahl Index of Top5
Ownership on board size. The Herfindahl Index is negatively related to board size
using pooled OLS with clustered standard errors and also using firm random effects
estimation. However, the lower coefficient in model (2) suggests that the coefficients
from pooled OLS regressions in model (1) are upward biased due to firm-specific and
time-invariant heterogeneity. In model (3) where firm fixed effects is used, the
coefficient for Herfindahl index is insignificant.
<<INSERT TABLE III>>
Table IV examines the effect of Top5 institutional ownership on board size.
Top5 Ownership is negatively and significantly related to board size in model (1), (2)
and (3). The results in model (1) imply that a one standard deviation increase in Top5
Ownership will decrease board size by 2.175%, which equates to 0.211 directors for
the average board.7 In model (2) this effect declines, with a similar increase in Top5
Ownership decreasing board size by 0.611% or 0.059 directors.8 In model (3) a one
standard deviation increase in Top5 Ownership will decrease board size by 0.418%,
which equates to 0.041 directors for the average board.9
7 =100*(exp(-0.2199*0.10)-1). 8 =100*(exp(-0.0613*0.10)-1). 9 =100*(exp(-0.0419*0.10)-1).
20
<<INSERT TABLE IV>>
In Table V and IV concerns over endogeneity are addressed. In Panel A of
both Table V and VI results of a Durbin-Wu-Hausman test for endogeneity are
presented. The first stage of the test regresses the respective measure of institutional
influence on an instrument which is the institutional influence measure orthogonalized
with respect to board size and board independence. The residual from this model is
then included as an independent variable in stage two. The significance of this
residual in the second stage of the Durbin-Wu-Hausman test indicates endogeneity of
both Herfindahl Index of Top5 Ownership and also Top5 Ownership. Panel B
presents results for 2SLS, where the in the second stage both Herfindahl Index of
Top5 Ownership and also Top5 Ownership are insignificant. Whereas Top5
Ownership was significant throughout Table IV, most notably using firm fixed
effects, this significance was likely attributable to endogeneity.
<<INSERT TABLE V AND VI>>
Table VII examines the effect of institutional heterogeneity on board size. The
results indicate that there is a significant difference in the effect of potentially active
and potentially passive institutions on board size. In model (1) both potentially active
and potentially passive institutions have a significant negative effect on board size,
though the coefficient for potentially active institutions is approximately twice that for
potentially passive institutions. A Wald F-test for the difference in coefficients
21
produces a test statistic of 8.88 and a p-value close to zero indicating that the
coefficients are significantly different. To quantify these differences, a one standard
deviation increase in potentially active ownership decreases board size by 3.139% or
0.305 directors for the average board.10 In contrast, a one standard deviation increase
in potentially passive ownership decreases board size by 1.843% or 0.179 directors
for the average board.11 In model (2) and (3) potentially active ownership is
significantly negatively related to board size, whereas potentially passive ownership is
insignificant. The results from model (3) using firm fixed effects imply a one standard
deviation increase in potentially active ownership will decrease board size by 0.859%
which equates to 0.083 directors for the average board.12 A one standard deviation
increase in potentially passive ownership will decrease board size by 0.163% or 0.015
directors for the average board.13 Table VIII examines whether the significance of
potentially active ownership is being inflated by endogeneity. Panel A of Table VIII
indicates that both potentially active ownership and potentially passive ownership are
endogenous. In Panel B where 2SLS results are presented, potentially active
ownership is insignificant. Whilst insignificant, the signs for potentially active and
potentially active institutions are opposed. Potentially active institutions are
negatively related to board size whereas potentially passive institutions are positively
related to board size.
<<INSERT TABLE VII AND VIII>>
10 =100*(exp(-0.3097*0.103)-1). 11 =100*(exp(-0.1590*0.117)-1). 12 =100*(exp(-0.0838*0.103)-1). 13 =100*(exp(-0.0139*0.117-1).
22
B. Board Independence:
Table IX presents the effect of Herfindahl Index of Top5 Ownership on the
proportion of the board that are independent directors. The Herfindahl Index is
significantly positively related to independent proportion of directors using pooled
OLS and also firm random effects. However, employing firm fixed effects which a
Hausman specification test indicates is the appropriate estimation technique, shows
that Herfindahl index is insignificant. In Table X institutional influence is measure
using Top5 Ownership. Top5 Ownership is significantly positively related to
independent proportion of directors using all three model specifications. However, the
lower coefficient in model (2) suggests that the coefficients from pooled OLS
regressions in model (1) are upward biased due to firm-specific and time-invariant
heterogeneity. Model (1) implies that a one standard deviation increase in Top5
Ownership will increase the independent proportion of directors by 0.021, raising the
proportion of independent directors for the average board to 0.6529.14 Model (2) and
(3) imply much smaller changes in the independent proportion of directors. In model
(2) and (3), a one standard deviation increase in Top5 Ownership increases the
independent proportion of directors by 0.007 and 0.004.15
<<INSERT TABLE IX AND X>>
Table XI and XII address the issue of endogeneity. In Panel A of Table XI and
XII, Herfindahl Index and Top5 Ownership are endogenous, as implied by the
significance of the residual in the second stage of the Durbin-Wu-Hausman test. In
14 = 0.2044*0.10. 15 =0.0743*0.10; =0.0418*0.10.
23
Panel B of Table XI and XII, 2SLS indicate that Herfindahl Index and Top5
Ownership are insignificantly related to the independent proportion of directors on the
board.
<<INSERT TABLE XI AND XII>>
Table XIII examines the effect of institutional heterogeneity on board
independence. Model (1) indicates that potentially active institutions have a
marginally larger effect on board independence then their potentially passive
counterparts. However, a Wald F-test indicates that this difference is not significant
with a test statistic of 1.45 and a p-value of 0.2295. Model (1) implies that a one
standard deviation in potentially active ownership increases the proportion of
independent directors on the board by 0.0238 which produces a new independent
proportion of 0.6563 for the average board.16 Similarly, a one standard deviation in
potentially passive ownership increases the proportion of independent directors on the
board by 0.0217 which produces a new independent proportion of 0.6542 for the
average board.17
<<INSERT TABLE XIII >>
Employing firm random effects and firm fixed effects indicates that potentially
passive institutions have a larger effect on board independence, with a Wald F-test
16 =0.2318*0.103. 17 =0.1858*0.117.
24
indicating that the difference is significant. Using firm fixed effects eliminates any
significant effect of potentially active institutions on board independence. Firm fixed
effects implies a one standard deviation increase in potentially active ownership
increases the proportion of independent directors on the board by 0.001, whereas a
similar increase for potentially passive institutions produces a 0.007 increase.18
Table XIV addresses any concerns of endogeneity in analyzing institutional
heterogeneity. The second stage results in Panel A indicate that potentially active
ownership is endogenous, though potentially passive ownership is not endogenous. In
Panel B, 2SLS show that potentially active ownership is negatively related to the
independent proportion of directors.
<<INSERT TABLE XIV >>
V. Director Appointments and Departures as a Function of Institutional Investor Influence
The analysis of the effect of institutional influence on board size and board
independence has not provided compelling support for monitoring once correct model
specification and endogeneity issues are taken into account. This may be because
focusing on the levels of the number of directors on the board and the proportion of
independent directors masks real monitoring that institutions perform. This section
focuses on changes in board structure with the emphasis being on the appointment
and departure of director. Moreover, when institutions monitor this may not necessary
18 =0.0108*0.103; =0.0624*0.117
25
result in a continuous exertion of influence. Of particular interest in this section is the
role that firm performance plays in determining institutional investor actions when it
comes to director appointments and departures. Several studies find that firms that
institutional investors target are indeed poor performers (Karpoff, Malatesta and
Walkling, 1996; Strickland, Wiles and Zenner, 1996; Wahal, 1996; Bizjak and
Marquette, 1998; Johnson, Porter and Shackell, 1997, and Opler and Sokobin,
1995).19 When firms are performing poorly, institutional investors are more concerned
with implementing changes that will punish directors deemed responsible, with the
aim of improving firm performance. When the firm is performing well, shareholders
are more willing to leave discretionary authority in the hands of managers.20 Hence,
institutional investor influence is expected to vary due to the relative costs and
benefits of such actions in different states of firm performance. This section examines
the role of institutions in appointing directors and forcing them to depart. An
interactive analysis methodology is employed to test whether performance is an
important factor for institutions when influencing board structure. Institutional
influence measures are interacted with a dummy variable equal to one if the firms’
performance, as measured by return on assets (ROA) or Tobin’s Q respectively, is
below the sample median.
19 Since 1988, the California Public Employees’ Retirement System (CalPERS) has chosen targets
from among the poor performers in its portfolio (Romano, 2001). This is consistent with the CalPERS
approach when their Focus list is compiled. The focus list contains companies that merit public and
market attention due to market performance and corporate governance practices
(http://governance.calpers.org/viewpoint/speeches/carlson5.asp). 20 The comparative advantage of managers is to come up with new ideas to seize profit opportunities,
and that scrutinizing managerial decisions is a time consuming process. Since it is particularly costly to
miss a profit opportunity when the demand for the firm’s product is high, shareholders are more willing
to leave discretionary authority in the hands of managers in good times than in bad times.
26
A. Director Appointments:
Table XV shows institutional investors have a negligible impact on director
appointments, even under periods of poor firm performance. The exception is the
Top5 ownership-firm performance interaction variable in models (2) and (5). This
indicates that in periods of poor performance, there is a positive effect on director
appointments. However, the net effect on director appointments, which is the sum of
the coefficient for Top5 Ownership and the Top5*Firm Performance interaction
variable is not different from zero, as indicated by a Wald F-test. The Wald F-test
produces a test statistic of 0.03 and a p-value of 0.87.
A decomposition of director appointments is required to better understand
institutional investor influence. Table XVI decomposes the effect of institutional
investors on director appointments and reveals that the Herfindahl Index, Top5
Ownership and ownership of potentially passive institutions increase the likelihood of
inside director appointments when the firm has performed poorly. Though, an F-test
indicates that the net effect on director appointments when the firm has performed
poorly is only statistically different from zero in model (1). This positive adjustment
to institutional influence in periods of poor firm performance can likely be attributable
to the fact that insider directors may be the CEO of the firm, or other high ranking
executives, and they are removed from the firm and consequently depart the firm.
Replacement CEOs, or executives, are then likely to be appointed to the board. In
contrast, Table XVII shows that potentially active institutional investors have a
positive effect on independent directors when the firm has performed poorly. The
analysis suggests heterogeneity in the strategies pursued by institutions.
<<INSERT TABLES XV, XVI AND XVII>>
27
B. Director Departures:
Table XVIII examines the effect of institutions on aggregate director
departures. Model (3) shows that potentially activist institutions have a significant
positive effect on the departure of directors, and this effect does not significantly
change in periods of poor firm performance. In models (4), (5) and (6), using Tobin’s
Q as a performance measure produces different results. The Hefindahl Index, Top5
ownership and potentially activist institutions are positively related to director
departures. However, in model (6), potentially activist institutions significantly lower
the likelihood of director departures in periods of poor performance.
Decomposing director departures helps shed light on the findings in Table
XVIII. Table XIX indicates strong relations between institutional influence and inside
director departures, with firm performance playing an important role. In models (1)
and (4) the Hefindahl Index becomes significant and positively related to inside
director departures only when the firm has performed poorly. In models (2) and (5),
Top5 ownership is significantly related to inside director departures and this effect is
significantly increased in periods of poor firm performance. In models (3) and (6),
potentially activist institutions target inside directors with firm performance playing
an insignificant role in adjusting institutional influence. However, potentially passivist
institutional influence on inside directors is significantly increased when the firm has
performed poorly.
In Table XX, model (6) indicates that potentially activist institutions have a
positive effect on independent director departures, although this effect is tempered in
periods of poor performance. Models (4) and (5) also suggest that institutional
28
investor influence helps to retain independent directors in periods of poor
performance.
<<INSERT TABLE XVIII, XIX AND XX>>
C. Net Change in Board Size and Independence:
The results from the analysis of director appointments and departures indicate
that the concentration and ownership of Top 5 institutions is positively related to
director departures, with insiders departing during periods of poor performance.
Though, independent directors are less likely to depart when the firm has performed
poorly. The concentration and ownership of Top 5 institutions is also positively
related to inside director appointments in periods of poor performance. Moreover, the
likelihood of inside director departures is reduced in periods of poor firm performance
suggesting that some appointments of insiders are simply replacements. Potentially
passive institutions appear to focus on the appointment and departure of inside
directors when the firm has performed poorly. In contrast, potentially activist
institutions exert considerable influence on appointing and retaining independent
directors in periods of poor performance, while exerting pressure on inside directors
to depart irrespective of firm performance. To better understand the net effect of this
influence, the net change in board size and independence is examined.
In Table XXI there is weak evidence of a net decrease in board size.
Institutional influence is negatively related to changes in board size when the firm
performs poorly, but this holds only for models using ROA as a performance control.
The major effect of institutional influence is realized on board independence. In Table
XXII for both performance controls, institutional investor influence has a significant
29
positive effect on the change in board independence. This suggests that while
institutional influence was positively related to both the appointment and departure of
inside directors, more insiders were being removed than appointed.
<<INSERT TABLE XI AND XII>>
VI. Alternative Monitoring Hypotheses This section re-examines the effect of institutional investor influence on board
size and board independence by accounting for firm specific monitoring requirements.
In this section, alternative monitoring objectives are addressed. Recent theoretical
models have questioned whether all firms should benefit from common prescriptions
with respect to board size and independence. Optimal governance structure depends
on firms’ monitoring needs, and on the costs and benefits of different governance
mechanisms. To the extent that these costs and benefits vary across firms and over
time, optimal governance structure should also vary (Lehn, Patro and Zhao, 2005).
Theoretical models based on such a motivation can be classified according to three
hypotheses—1) Scope of operations hypothesis, 2) Monitoring hypothesis, and 3)
Negotiations hypothesis.
A. Scope of Operations Hypothesis:
The first factor that affects the costs and benefits of different board structures
is the scope of operations which also gives an indication of firms advising needs. The
major advantage of large boards is the collective information possessed by the board.
This information is valuable for both the advisory and monitoring functions of boards.
30
Firms with higher advising needs, such as those operating in diversified industries,
large firms, and those that rely more on debt financing, are all more likely to benefit
from a larger board of directors. In addition, larger firms demand more outside
directors because their size gives rise to more significant agency problems (Boone,
Field, Karpoff and Raheja, 2007). It is tested whether institutional influence is
positively related to board size and independence in complex and diversified firms.
The scope of business operations is measured by sales, number of business operating
segments and leverage (see Coles, Daniel and Naveen, 2007; Boone, Field, Karpoff
and Raheja, 2007). An interactive analysis is employed to test the effect of
institutional influence, where each measure of institutional influence is interacted with
a dummy variable equal to one if the hypothesis variable (e.g. sales) is above the
median, and zero otherwise.
<<INSERT TABLE XXIII AND XXIV>>
Table XXIII examines the effect of institutional influence on board size while
accounting for the scope of a firm’s operations. Institutional influence is negatively
related to board size in large firms, positively related to board size in firms with
numerous operating segments and insignificantly related to board size in firms with
high leverage. Table XXIV examines the effect of institutional influence on board
independence while accounting for the scope of a firm’s operations. Institutional
influence is positively related to board independence in larger firms as measure by
sales. However, institutional influence does not adjust to reflect the diversity of a
firm. In contrast to the scope of operations hypothesis, institutional influence on board
31
independence is lowered in firms with higher levels of leverage. This is surprising
since Booth and Deli (1999) find that commercial bankers serve as directors so that
they can provide bank-debt-market expertise. An alternative and potentially
competing argument is that debt is serving as a monitoring mechanism of
management, thereby reducing the need for independent directors. Overall, there is
weak evidence to support institutional investors adjusting their monitoring objectives
to reflect the scope of a firm’s operations.
B. Monitoring Hypothesis:
The rationale of the monitoring hypothesis is that the private benefits being
extracted by managers, and also the cost of monitoring the behavior of managers,
needs to be assessed when designing the board. This hypothesis predicts that, as the
opportunity increases for managers to consume private benefits, there should be more
independent directors to monitor management, which thereby results in a bigger
board. The opportunity to consume private benefits is measured by free cash flow and
also the G-Index (Boone, Field, Karpoff and Raheja, 2007). This suggests in firms
exhibiting high potential private benefits for managers, institutional investor influence
should be positively related to the proportion of independent directors and
consequently positively related to board size.
The second part of the monitoring hypothesis predicts that the cost to the
board in monitoring management also affects board structure. Costs associated with
monitoring management are generally accepted to be higher in growth firms due to
the noisiness of their operating environment. In firms where the cost of monitoring
management is high, it is not desirable to have a large board. Lehn, Patro and Zhao
(2005) explain that with larger boards, directors are more inclined to ‘free ride’. That
32
is, when the board is larger, the influence of each board member decreases. As such,
with less influence board members have reduced incentives to actively monitor
managements and bear the costs associated with investing in information needed to
monitor. In order to mitigate the free riding problem and thereby force directors to
have an incentive to accept higher monitoring costs, boards need to be smaller.
Similarly, with respect to board composition, in growth firms there are large
informational asymmetries. This makes it more difficult for independent directors to
monitor management, and means that independent directors have to incur significant
costs to gather information. Therefore, since the firm-specific knowledge of insiders
is relatively more important in growth firms, shareholders are likely to benefit from
greater representation of insiders. The cost of monitoring is measured using research
and development expenses scaled by total assets and also the stock return standard
deviation (see Coles, Daniel and Naveen, 2007; Boone, Field, Karpoff and Raheja,
2007; Gaver and Gaver, 1993). It is expected that the cost of monitoring will increase
with stock return standard deviation. This is because volatility reflects background
uncertainty about the firm’s prospects and performance, and increases the difficulty of
judging managers’ performance (Boone, Field, Karpoff and Raheja, 2007). This
suggests that, in firms with higher costs of monitoring, institutional investor influence
should be negatively related to board size. It should also negatively relate to the
proportion of independent directors.
Table XXV does not support the monitoring hypothesis for board size. For
firms with higher levels of free cash flow, institutions attempt to reduce board size.
Moreover, for other test variables (i.e. G-Index, R&D intensity, Standard Deviation of
stock returns) there is no significant evidence to suggest institution investors adjust
their influence. Table XXVI addresses the monitoring hypothesis with respect to
33
board independence. Institutional influence only adjusts to reflect the extraction of
private benefits, as measure by the G-Index. The general insignificance of the
institutional influence and monitoring hypothesis interaction variables does not
provide support for institutions adjusting their objectives to reflect the private benefits
being extracted by managers, and also the cost of monitoring the behavior of
managers.
<<INSERT TABLE XVI>>
C. Negotiations Hypothesis:
A third factor that affects board structure is the implicit negotiations that occur
between the CEO and outside directors (or institutional investors). Hermalin and
Weisbach (1998) propose that boards reflect the outcome of a negotiation between the
CEO and outside directors. CEOs that generate surpluses for their firms use their
influence to capture some of these surpluses by placing insiders on the board. The
resulting board is not inefficient; rather it is part of the compensation earned by the
CEO. Boone, Field, Karpoff and Raheja (2007) describe this as being the result of
negotiations between the CEO and board.
Adams and Ferreira (2007) develop a similar model whereby ‘management
friendly’ boards may be optimal. The rationale is that the task of the board is to
monitor management, and independent board members are generally accepted as
being better monitors. A manager faces a trade-off in that if the manager shares their
information with the board, they may receive better advice, but they will be monitored
more intensely given the board will be better informed.
34
CEO stock ownership and CEO tenure are used to measure CEO influence and
information asymmetry between the CEO and the firm. We then test whether
institutional investors permit more friendly boards by allowing decreased board
independence and increased board size in situations where the CEO wields
considerable influence and has informational advantages. Table XXVII and XXVIII
do not support the hypothesis that institutional investors structure the board in a
manner that encourages influential or powerful CEOs to reveal their information. All
interaction variables with the negotiations test variables are insignificant.
<<INSERT TABLE XXVII AND XXVIII>>
VII. Conclusion Institutional investors possess considerable influence over firms in which they
have a shareholding. Because institutional investors have significant investments in
firms, they collaboratively enjoy significant bargaining power and can gain direct
access to the top management of a firm—something atomistic shareholders cannot
achieve. They have the funds, resources and ability to wage concerted campaigns to
remove or appoint directors—the leverage to have their voice heard. Institutions can
also use their influence to remove or appoint directors in order to shape the board in a
manner that improves its effectiveness. This paper examines whether institutional
investors use their influence to reduce board size and increase board independence,
two dimensions of board structure shown to have an important impact on the
performance of the firm. The study also examines how institutions achieve their
objectives with respect to board structure.
35
Our study finds that institutional investor influence is negatively related to
board size and positively related to board independence. This is generally consistent
across various estimation techniques, such as pooled OLS with clustered standard
errors, firm random effects and firm fixed effects. However, endogeneity does appear
to be an issue in examining board attributes such as board size and independence.
This is largely due to the low variability of the board attributes. Examining changes in
board structure, such as director appointments and departures, helps alleviate concerns
of endogeneity. Analysis of board changes shows that institutional investors remove
inside directors as a means of reducing board size and increasing independence.
Institutional influence is positively related to both the appointment and departure of
inside directors. More insiders are found to be removed than appointed, resulting in
an increase in board independence. This relationship is particularly evident in periods
when a firm had performed poorly. Institutions appear to take corrective action to
improve firm performance and punish directors deemed responsible for poor
performance. Institutional investors follow the general prescription that smaller
boards and increased independence are better for monitoring managers. They are
successful in achieving their objectives. Moreover, there is not evidence to suggest
institutional investors adapt their influence to reflect firm specific characteristics
which may alter the optimality of smaller boards and increased independence.
Additional research can examine how institutions exert their influence on
board structure – whether it is through private negotiation (Carleton, Nelson and
Weisbach, 1998), public naming (Wu, 2004), proxy voting or a combination.
36
References
Adams, R. and D. Ferreira, 2007, A Theory of Friendly Boards, Journal of Finance 62, 217-250.
Agrawal, A. and G. Mandelker, 1990, Large Shareholders and the Monitoring of Managers: The Case of Antitakeover Charter Amendments, Journal of Financial and Quantitative Analysis 25, 143-161.
Agrawal, A. and C. Knoeber, 1996, Firm Performance and Mechanisms to Control Agency Problems between Managers and Shareholders, Journal of Financial and Quantitative Analysis 31, 377-397.
Almazan, A., J. Hartzell and L. Starks, 2005, Active Institutional Shareholders and Managerial Compensation, Financial Management 34, 5-34.
Baysinger, B. and H. Butler, 1985, Corporate Governance and the Board of Directors: Performance Effects of Changes in Board Composition, Journal of Law, Economics and Organization 1, 101-124.
Bizjak, J. and C. Marquette, 1998, Are Shareholder Proposals All Bark and No Bite? Evidence from Shareholder Resolutions to Rescind Poison Pills, Journal of Financial and Quantitative Analysis 33, 499-521.
Black, B., W. Kim, H. Jang and K. Park, 2005, Does Corporate Governance Predict Firms’ Market Values? Time Series Evidence from Korea, Working Paper University of Texas Law School, KDI School of Public Policy and Management, Korea University Business School.
Boone, A., L. Field, J. Karpoff and C. Raheja, 2007, The Determinants of Corporate Board Size and Composition: An Empirical Analysis, Journal of Financial Economics 85, 65-101.
Booth, J. and D. Deli, 1999, On Executives of Financial Institutions as Outside Directors, Journal of Corporate Finance 5, 227-250.
Borokhovich, K., R. Parrino and T. Trapani, 1996, Outside Directors and CEO Selection, Journal of Financial and Quantitative Analysis 31, 337-355.
Breusch, T. and A. Pagan, 1980, The Lagrange Multiplier Test and Its Implications to Model Specification in Econometrics, Review of Financial Studies 47, 239-253.
Brickley, J., R. Lease and C. Smith, 1988, Ownership Structure and Voting on Antitakeover Amendments, Journal of Financial Economics 20, 267-92.
Brickley, J., J. Coles and R. Terry, 1994, Outside Directors and the Adoption of Poison Pills, Journal of Financial Economics 35, 371-390.
Byrd, J. and K. Hickman, 1992, Do Outside Directors Monitor Managers? Evidence from Tender Offer Bids, Journal of Financial Economics 32, 195-221.
California Public Employees Retirement System, Corporate Governance Core Principles and Guidelines (1998), Available www.calpersgovernance.org/principles/domestic/us/page 01.asp.
Carleton, W., J. Nelson and M. Weisbach, 1998, The Influence of Institutions on Corporate Governance Through Private Negotiations: Evidence from TIAA-CREF, Journal of Finance 53, 1338-40.
37
Chen, X., J. Harford and K. Li, 2007, Monitoring: Which Institutions Matter?, Journal of Financial Economics, Forthcoming.
Chung, R., M. Firth and J. Kim, 2002, Institutional Monitoring and Opportunistic Earnings Management, Journal of Corporate Finance 8, 29-48.
Clay, D., 2000, The Effects of Institutional Investment on CEO Compensation, Working Paper, University of Southern California.
Coles, J., N. Daniel and L. Naveen, 2007, Boards: Does One Size Fit All?, Journal of Financial Economics, Forthcoming.
Core, J., R. Holthausen and D. Larcker, 1999, Corporate Governance, Chief Executive Officer Compensation and Firm Performance, Journal of Financial Economics 51, 371-406.
Cotter, J., A. Shivdasani, M. Zenner, 1997, Do Independent Directors Enhance Target Shareholder Wealth During Tender Offers? Journal of Financial Economics 43, 195-218.
Eisenberg, T., S. Sundgren and M. Wells, 1996, Larger Board Size and Decreasing Firm Value in Small Firms, Journal of Financial Economics 48, 35-54.
Fama, E. and M. Jensen, 1983, Separation of Ownership and Control, Journal of Law and Economics 26, 301-325.
Gaver, J. and K. Gaver, 1993, Additional Evidence on the Association Between the Investment Opportunity Set and Corporate Financing, Dividend, and Compensation Policies, Journal of Accounting and Economics 16, 125-160.
Gertner, R. and S. Kaplan, 1997, The Value-Maximizing Board, Working Paper, University of Chicago.
Gillan, S. and L. Starks, 2000, Corporate Governance Proposals and Shareholder Activism: The Role of Institutional Investors, Journal of Financial Economics 57, 275-305.
Gordon. L. and J. Pound, 1993, Information, Ownership Structure and Shareholder Voting: Evidence from Shareholder-Sponsored Corporate Governance Proposals, Journal of Finance 48, 697-718.
Gompers, P. and A. Metrick, 2001, Institutional Investors and Equity Prices, Quarterly Journal of Economics 116, 229-259.
Greene, W., 2003, Econometric Analysis, Fifth Edition, Prentice Hall.
Hartzell, J. and L. Starks, 2003, Institutional Investors and Executive Compensation, Journal of Finance 58, 2351-2374.
Hausman, J., 1978, Specification Tests in Econometrics, Econometrica 46, 1251-1271.
Hermalin, E. and S. Weisbach, 1991, The Effects of Board Composition and Direct Incentives on Firm Performance, Financial Management 20, 101-112.
Hermalin, B. and M. Weisbach, 1998, Endogenously Chosen Boards of Directors and their Monitoring of the CEO, American Economic Review 88, 96-118.
Jensen, M., 1993, The Modern Industrial Revolution, Exit, and the Failure of Internal Control Systems, Journal of Finance 48, 831-880.
38
Johnson, M., S. Porter and M. Shackell, 1997, Stakeholder Pressure and the Structure of Executive Compensation, Working Paper, University of Michigan and University of Texas at Austin.
Karpoff, J., P. Malatesta and R. Walkling, 1996, Corporate Governance and Shareholder Initiatives: Empirical Evidence, Journal of Financial Economics, 42, 365-395.
Lee, C. S. Rosenstein, N. Rangan and W. Davidson, 1992, Board Composition and Shareholder Wealth: The Case of Management Buyouts, Financial Management 21, 58-72.
Lehn, K., S. Patro and M. Zhao, 2005, Determinants of the Size and Structure of Corporate Boards: 1935-2000, Working Paper, University of Pittsburgh.
Lipton, M. and J. Lorsch, 1992, A Modest Proposal for Improved Corporate Governance, Business Lawyer 48, 59-77.
Noe, Thomas H., 2002, “Investor Activism and Financial Market Structure,” Review of Financial Studies 15, 289-318.
Opler, T. and J. Sokobin, Does Coordinated Institutional Activism Work? An Analysis of the Activities of the Council of Institutional Investors, Working Paper.
Palia, D., 2001, The Endogeneity of Managerial Compensation in Firm Valuation: A Solution, Review of Financial Studies 14, 735-764.
Parrino, R., R. Sias and L. Starks, 2003, Voting With Their Feet: Institutional Ownership Changes around Forced CEO Turnover, Journal of Financial Economics 68, 3-46.
Petersen, M., 2004, Estimating Standard Errors in Financial Panel Data Sets: Comparing Approaches, Working Paper, Northwestern University.
Rogers, W., 1993, Regression Standard Errors in Clustered Samples, Stata Technical Bulletin 13, 357-384.
Romano, R., 2001, Less is More: Making Institutional Investor Activism a Valuable Mechanism of Corporate Governance, Yale Journal on Regulation 18, 174-251.
Rosenstein, S. and J. Wyatt, 1990, Outside Directors, Board Independence, and Shareholder Wealth, Journal of Financial Economics 26, 175-191.
Rosenstein, S. and J. Wyatt, 1997, Inside Directors, Board Effectiveness, and Shareholder Wealth, Journal of Financial Economics 44, 229-250.
Smith, G. and P. L. Swan, 2007a, To Good to be True: Do Institutional Investors Really Reduce Executive Compensation Whilst Raising Incentives?, Working Paper, University of New South Wales.
Smith, G. and P. L. Swan, 2007b, Will the Real Monitors Please Stand Up? Institutional Investors and CEO Compensation, Working Paper, University of New South Wales.
Smith, M., 1996, Shareholder Activism by Institutional Investors: Evidence from CalPERS, Journal of Finance 51, 227-252.
Strickland, D., K. Wiles and M. Zenner, 1996, A Requiem for the USA: Is Small Shareholder Monitoring Effective, Journal of Financial Economics 40, 319-338.
39
Wahal, S., 1996, Pension Fund Activism and Firm Performance, Journal of Financial and Quantitative Analysis 31, 1-23.
Weisbach, S., 1988, Outside Directors and CEO Turnover, Journal of Financial Economics 20, 431-460.
Whidbee, D., 1997, Board Composition and Control of Shareholder Voting Rights in the Banking Industry, Financial Management 26, 27-41.
Wintoki, M. Babajide, 2007, “Corporate Boards and Regulation: The Effect of the Sarbanes-Oxley Act and the Exchange Listing Requirements on Firm Value,” Journal of Corporate Finance, forthcoming.
Wu, Y., 2004, The Impact of Public Opinion on Board Structure Changes, Director Career Progression, and CEO Turnover: Evidence from CalPERS’ Corporate Governance Program, Journal of Corporate Finance 10, 199-227.
Yermack, D., 1996, Higher Market Valuation of Companies with a Small Board of Directors, Journal of Financial Economics 40, 185-212.
40
Table I
Descriptive Statistics This table presents descriptive statistics of the key variables employed. Panel A board of director characteristics. Independent proportion is the number of independent directors divided by board size. Panel B shows the measures of institutional influence. Herfindahl index of Top 5 Ownership is the sum of squared proportional ownership for the top 5 institutions. Top5 ownership is the proportion of shares outstanding held by the institutions with the five largest holdings. Potentially Activist ownership is the ownership of institutions classified by CDA as either an Investment company or independent investment adviser, if the institution is one of the top 5 holders in the firm. Potentially Passivist ownership is Top5 ownership minus Potentially Active ownership. Panel C presents statistics on firm characteristics. Mean Std Dev 10th Median 90th
Panel A: Board of Director Variables Board Size 9.705 3.037 6 9 13 Independent Proportion 0.635 0.182 0.4 0.667 0.857 Number of Independent Directors 6.203 2.741 3 6 10 Number of Grey Directors 1.483 1.516 0 1 3 Number of Inside Directors 2.018 1.227 1 2 3 Compensation Committee Size 3.550 1.276 2 3 5 Audit Committee Size 3.701 1.215 2 3 5 Nominating Committee Size 2.751 2.188 0 3 5 Number of Insiders on Nomination Committee 0.197 0.484 0 0 1 Number of Greys on Nomination Committee 0.388 0.706 0 0 1 Number of Independents on Nomination Committee 2.166 1.935 0 2 5 Number of Insiders on Remuneration Committee 0.033 0.228 0 0 0 Number of Greys on Remuneration Committee 0.353 0.671 0 0 1 Number of Independents on Remuneration Committee 3.164 1.346 2 3 5 Number of Insiders on Audit Committee 0.012 0.117 0 0 0 Number of Greys on Audit Committee 0.456 0.722 0 0 1 Number of Independents on Audit Committee 3.233 1.310 2 3 5 Number of Directors Departed 0.963 1.264 0 1 2 Number of Directors Appointed 0.923 1.183 0 1 2 Number of Inside Directors Departed 0.210 0.577 0 0 1 Number of Inside Directors Appointed 0.172 0.432 0 0 1 Number of Grey Directors Departed 0.186 0.506 0 0 1 Number of Grey Directors Appointed 0.108 0.428 0 0 0 Number of Independent Directors Departed 0.568 0.874 0 0 2 Number of Independent Directors Appointed 0.643 0.933 0 0 2
Panel B: Institutional Investor Variables Herfindahl Index of Top5 Institutional Ownership 0.018 0.032 0.003 0.013 0.033 Top5 Institutional Ownership 0.241 0.100 0.124 0.232 0.364 Potentially Active Top5 Institutional Ownership 0.107 0.103 0 0.074 0.256 Potentially Passive Top5 Institutional Ownership 0.134 0.117 0 0.105 0.298 Total Institutional Ownership 0.579 0.191 0.319 0.593 0.814
Panel C: Firm Characteristics Market Capitalization 6760.1 23199.0 282.9 1391.2 12274.1 Number of Business Segments 1.932 1.567 1 1 4 Tobin's Q 1.723 2.411 0.508 1.135 3.302 Debt Ratio 0.140 0.107 0 0.139 0.279 Stock Turnover 1.424 1.590 0.374 0.910 3.064 R&D Intensity 0.028 0.061 0 0 0.095 Stock Return Standard Deviation 0.518 0.255 0.256 0.459 0.858 Return on Assets 0.019 0.115 -0.033 0.020 0.100 Stock Return 0.237 0.769 -0.335 0.118 0.793 Scaled Free Cash Flow 0.018 0.092 -0.073 0.019 0.113 G-Index 9.206 2.755 6 9 13
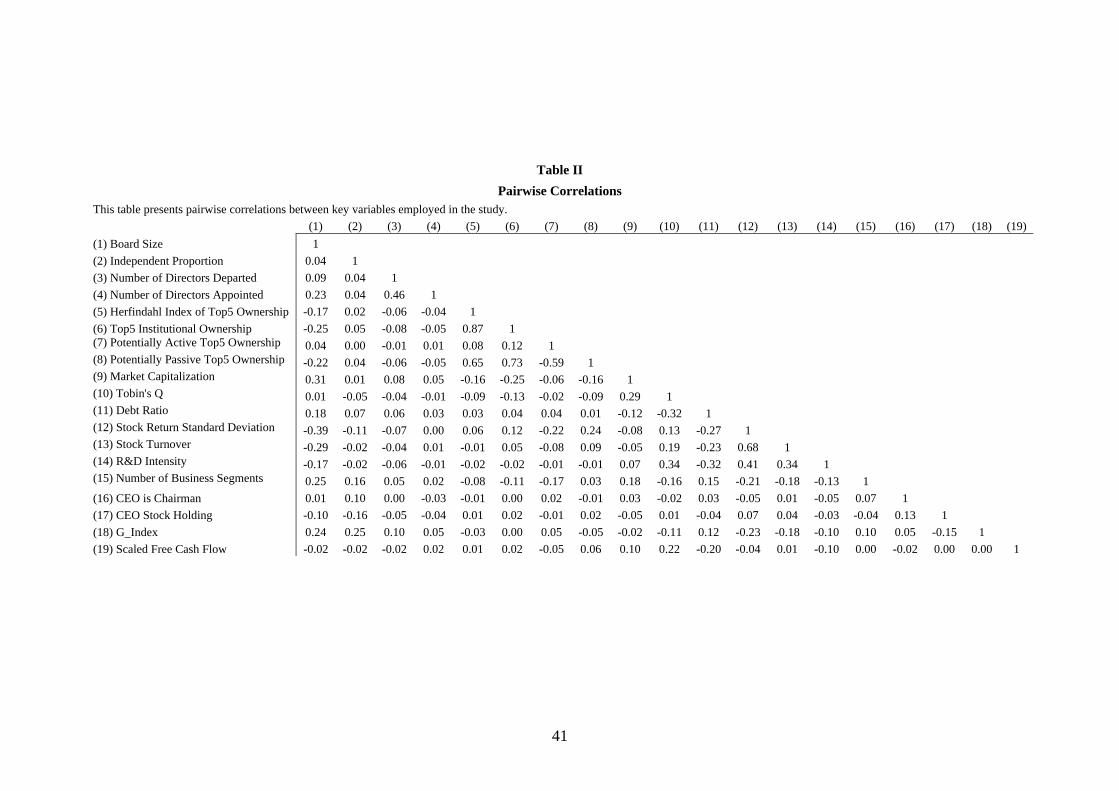
41
Table II Pairwise Correlations
This table presents pairwise correlations between key variables employed in the study.
(1) (2) (3) (4) (5) (6) (7) (8) (9) (10) (11) (12) (13) (14) (15) (16) (17) (18) (19) (1) Board Size 1 (2) Independent Proportion 0.04 1 (3) Number of Directors Departed 0.09 0.04 1 (4) Number of Directors Appointed 0.23 0.04 0.46 1 (5) Herfindahl Index of Top5 Ownership -0.17 0.02 -0.06 -0.04 1 (6) Top5 Institutional Ownership -0.25 0.05 -0.08 -0.05 0.87 1 (7) Potentially Active Top5 Ownership 0.04 0.00 -0.01 0.01 0.08 0.12 1 (8) Potentially Passive Top5 Ownership -0.22 0.04 -0.06 -0.05 0.65 0.73 -0.59 1 (9) Market Capitalization 0.31 0.01 0.08 0.05 -0.16 -0.25 -0.06 -0.16 1 (10) Tobin's Q 0.01 -0.05 -0.04 -0.01 -0.09 -0.13 -0.02 -0.09 0.29 1 (11) Debt Ratio 0.18 0.07 0.06 0.03 0.03 0.04 0.04 0.01 -0.12 -0.32 1 (12) Stock Return Standard Deviation -0.39 -0.11 -0.07 0.00 0.06 0.12 -0.22 0.24 -0.08 0.13 -0.27 1 (13) Stock Turnover -0.29 -0.02 -0.04 0.01 -0.01 0.05 -0.08 0.09 -0.05 0.19 -0.23 0.68 1 (14) R&D Intensity -0.17 -0.02 -0.06 -0.01 -0.02 -0.02 -0.01 -0.01 0.07 0.34 -0.32 0.41 0.34 1 (15) Number of Business Segments 0.25 0.16 0.05 0.02 -0.08 -0.11 -0.17 0.03 0.18 -0.16 0.15 -0.21 -0.18 -0.13 1 (16) CEO is Chairman 0.01 0.10 0.00 -0.03 -0.01 0.00 0.02 -0.01 0.03 -0.02 0.03 -0.05 0.01 -0.05 0.07 1 (17) CEO Stock Holding -0.10 -0.16 -0.05 -0.04 0.01 0.02 -0.01 0.02 -0.05 0.01 -0.04 0.07 0.04 -0.03 -0.04 0.13 1 (18) G_Index 0.24 0.25 0.10 0.05 -0.03 0.00 0.05 -0.05 -0.02 -0.11 0.12 -0.23 -0.18 -0.10 0.10 0.05 -0.15 1 (19) Scaled Free Cash Flow -0.02 -0.02 -0.02 0.02 0.01 0.02 -0.05 0.06 0.10 0.22 -0.20 -0.04 0.01 -0.10 0.00 -0.02 0.00 0.00 1
42
Table III
Pooled, Random Effects and Fixed Effects Regressions: Board Size as a Function of Institutional Influence
This table presents results for the effect of institutional influence, as measured by a Herfindahl Index of the ownership of the institutions with the five largest holdings, on (Log) board size. Model (1) is estimated using pooled estimation and computes clustered standard errors; model (2) is estimated using firm random effects; and model (3) is estimated using firm fixed effects. T-statistics are presented in parentheses. One, two and three asterisks denote significance at 10, 5 and 1 percent levels.
(1) (2) (3) Pooled, Firm Clusters Firm Random Effects Firm Fixed Effects
Herfindahl Top5 t -1 -1.0421*** -0.2995** -0.226 (-3.39) (-2.07) (-1.48) Retire Dummy t -1 0.0102 0.0002 -0.0009 (1.01) (0.04) (-0.21) New CEO Dummy t -1 0.0055 0.0009 -0.0004 (0.83) (0.24) (-0.11) Market Capitalization t -1 0.0975*** 0.0841*** 0.0611*** (28.72) (31.24) (15.47) No. Business Segments t -1 0.0143*** 0.0039*** 0.0005 (5.21) (2.95) (0.33) Tobin's Q t -1 -0.2373*** -0.1637*** -0.1082*** (-18.5) (-22.86) (-12.19) Year dummies Yes Yes Yes Industry dummies Yes Yes No Observations 9086 9086 9086 Within R2 0.0356 0.0365 Between R2 0.4063 0.3564
Overall R2 0.3819 0.3687 0.3249
43
Table IV
Pooled, Random Effects and Fixed Effects Regressions: Board Size as a Function of Institutional Influence
This table presents results for the effect of institutional influence, as measured by the ownership of the institutions with the five largest holdings, on (Log) board size. Model (1) is estimated using pooled estimation and computes clustered standard errors; model (2) is estimated using firm random effects; and model (3) is estimated using firm fixed effects. T-statistics are presented in parentheses. One, two and three asterisks denote significance at 10, 5 and 1 percent levels.
(1) (2) (3) Pooled, Firm Clusters Firm Random Effects Firm Fixed Effects
Top5 Ownership t -1 -0.2199*** -0.0613*** -0.0419* (-4.6) (-2.7) (-1.73) Retire Dummy t -1 0.0092 8.98E-05 -0.001 (0.93) (0.02) (-0.22) New CEO Dummy t -1 0.0052 0.0009 -0.0005 (0.79) (0.22) (-0.12) Market Capitalization t -1 0.0964*** 0.0839*** 0.061*** (28.38) (31.14) (15.44) No. Business Segments t -1 0.0143*** 0.004*** 0.0005 (5.25) (3.02) (0.37) Tobin's Q t -1 -0.2389*** -0.1636*** -0.108*** (-18.64) (-22.86) (-12.17) Year dummies Yes Yes Yes Industry dummies Yes Yes No Observations 9086 9086 9086 Within R2 0.0357 0.0366 Between R2 0.4072 0.3577
Overall R2 0.3842 0.3698 0.3264

44
Table V
Tests for Endogeneity and Two Stage Least Squares: Board Size as a Function of Institutional Influence
This table presents results for the effect of institutional investor influence on (Log) board size. Panel A presents results from Durbin-Wu-Hausman tests for endogeneity; and Panel B presents results from a Two Stage Least Squares regression. T-statistics are presented in parentheses. One, two and three asterisks denote significance at 10, 5 and 1 percent levels.
Panel A: Durbin-Wu-Hausman Test (Pooled with Firm Clusters) First Stage Second Stage
Herfindahl Top5 Board Size Herfindahl Top5 -0.0184 (-0.11) Residual from Herf.Top5 Equation -16.2026*** (-9.94) Herf. Top5 Orthogonalized Instrument 0.9956*** (726.67) Other Control Variables Yes Yes Year dummies Yes Yes Observations 7430 7430
Within R2 0.9896 0.0488
Between R2 0.9357 0.3487
Overall R2 0.9480 0.3223 Panel B: Two Stage Least Squares (Pooled with Firm Clusters)
First Stage Second Stage Herfindahl Top5 Board Size
Fitted Value from Herf. Top5 Equation -0.0184 (-0.11) Herf.Top5 Orthogonalized Instrument 0.9956*** (726.67) Other Control Variables Yes Yes Year dummies Yes Yes Observations 7430 7430
Within R2 0.9896 0.0322
Between R2 0.9357 0.3365
Overall R2 0.9480 0.3082
45
Table VI
Tests for Endogeneity and Two Stage Least Squares: Board Size as a Function of Institutional Influence
This table presents results for the effect of institutional investor influence on (Log) board size. Panel A presents results from Durbin-Wu-Hausman tests for endogeneity; and Panel B presents results from a Two Stage Least Squares regression. T-statistics are presented in parentheses. One, two and three asterisks denote significance at 10, 5 and 1 percent levels.
Panel A: Durbin-Wu-Hausman Test (Pooled with Firm Clusters) First Stage Second Stage
Top5 Ownership Board Size Top5 Ownership 0.0111 (0.41) Residual from Top5 Propn Equation -1.9017*** (-10.44) Top5 Propn Orthogonalized Instrument 0.9878*** (499.19) Other Control Variables Yes Yes Year dummies Yes Yes Observations 7430 7430
Within R2 0.9787 0.0505
Between R2 0.9028 0.3600
Overall R2 0.9156 0.3325 Panel B: Two Stage Least Squares (Pooled with Firm Clusters)
First Stage Second Stage Top5 Ownership Board Size
Fitted Value from Top5 Propn Equation 0.0111 (0.41) Top5 Propn Orthogonalized Instrument 0.9878*** (499.19) Other Control Variables Yes Yes Year dummies Yes Yes Observations 7430 7430
Within R2 0.9787 0.0320
Between R2 0.9028 0.3350
Overall R2 0.9156 0.3069
46
Table VII
Pooled, Random Effects and Fixed Effects Regressions: Board Size as a Function of Institutional Influence
This table presents results for the effect of institutional influence, as measured by the ownership of potentially actvist institutions that are one of the five largest holdings and also measured by the ownership of potentially passivist institutions that are one of the five largest holdings, on (Log) board size. Model (1) is estimated using pooled estimation and computes clustered standard errors; model (2) is estimated using firm random effects; and model (3) is estimated using firm fixed effects. T-statistics are presented in parentheses. One, two and three asterisks denote significance at 10, 5 and 1 percent levels.
(1) (2) (3) Pooled, Firm Clusters Firm Random Effects Firm Fixed Effects
Potentially Activist t -1 -0.3097*** -0.1029*** -0.0838*** (-5.32) (-3.84) (-2.97) Potentially Passivist t -1 -0.159*** -0.0331 -0.0139 (-3.15) (-1.34) (-0.54) Retire Dummy t -1 0.0088 -0.0002 -0.0012 (0.88) (-0.04) (-0.28) New CEO Dummy t -1 0.0055 0.0011 -0.0003 (0.82) (0.27) (-0.07) Market Capitalization t -1 0.0959*** 0.0836*** 0.0605*** (28.22) (30.99) (15.29) No. Business Segments t -1 0.0145*** 0.0042*** 0.0007 (5.3) (3.14) (0.49) Tobin's Q t -1 -0.2384*** -0.163*** -0.107*** (-18.59) (-22.77) (-12.05) Year dummies Yes Yes Yes Industry dummies Yes Yes No Observations 9086 9086 9086 Within R2 0.0367 0.0377 Between R2 0.4077 0.3594
Overall R2 0.3853 0.3706 0.3286
8.88 8.56 8.30 Wald F-Statistics for equality of Active v Passive Ownership 0.0029 0.0034 0.0040

47
Table VIII
Tests for Endogeneity and Two Stage Least Squares: Board Size as a Function of Institutional Influence
This table presents results for the effect of institutional investor influence on (Log) board size. Panel A presents results from Durbin-Wu-Hausman tests for endogeneity; and Panel B presents results from a Two Stage Least Squares regression. T-statistics are presented in parentheses. One, two and three asterisks denote significance at 10, 5 and 1 percent levels.
Panel A: Durbin-Wu-Hausman Test (Pooled with Firm Clusters) First Stage First Stage Second Stage
Potentially Activist Potentially Passivist Board Size Potentially Activist -0.0377 (-1.23) Residual from Activist Equation -28.1387*** (-25.21) Potentially Passivist 0.0384 (1.40) Residual from Passivist Equation 26.1058*** (21.93) Activist Orthogonalized Instrument 0.9920*** -0.0075*** (817.24) (-6.61) Passivist Orthogonalized Instrument -0.0055*** 0.9952*** (-5.01) (971.29) Other Control Variables Yes Yes Yes Year dummies Yes Yes Yes Observations 7430 7430 7430
Within R2 0.9979 0.9986 0.1376
Between R2 0.9586 0.9775 0.3048
Overall R2 0.9754 0.9854 0.2624 Panel B: Two Stage Least Squares (Pooled with Firm Clusters)
First Stage First Stage Second Stage Potentially Activist Potentially Passivist Board Size
Fitted Value from Activist Equation -0.0377 (-1.16) Fitted Value from Passivist Equation 0.0384 (1.32) Activist Orthogonalized Instrument 0.9920*** -0.0075*** (817.24) (-6.61) Passivist Orthogonalized Instrument -0.0055*** 0.9952*** (-5.01) (971.29) Other Control Variables Yes Yes Yes Year dummies Yes Yes Yes Observations 7430 7430 7430
Within R2 0.9979 0.9986 0.0339
Between R2 0.9586 0.9775 0.3368
Overall R2 0.9754 0.9854 0.3092
8.37 Wald F-Statistic for equality of Active v Passive Ownership 0.0038
Table IX
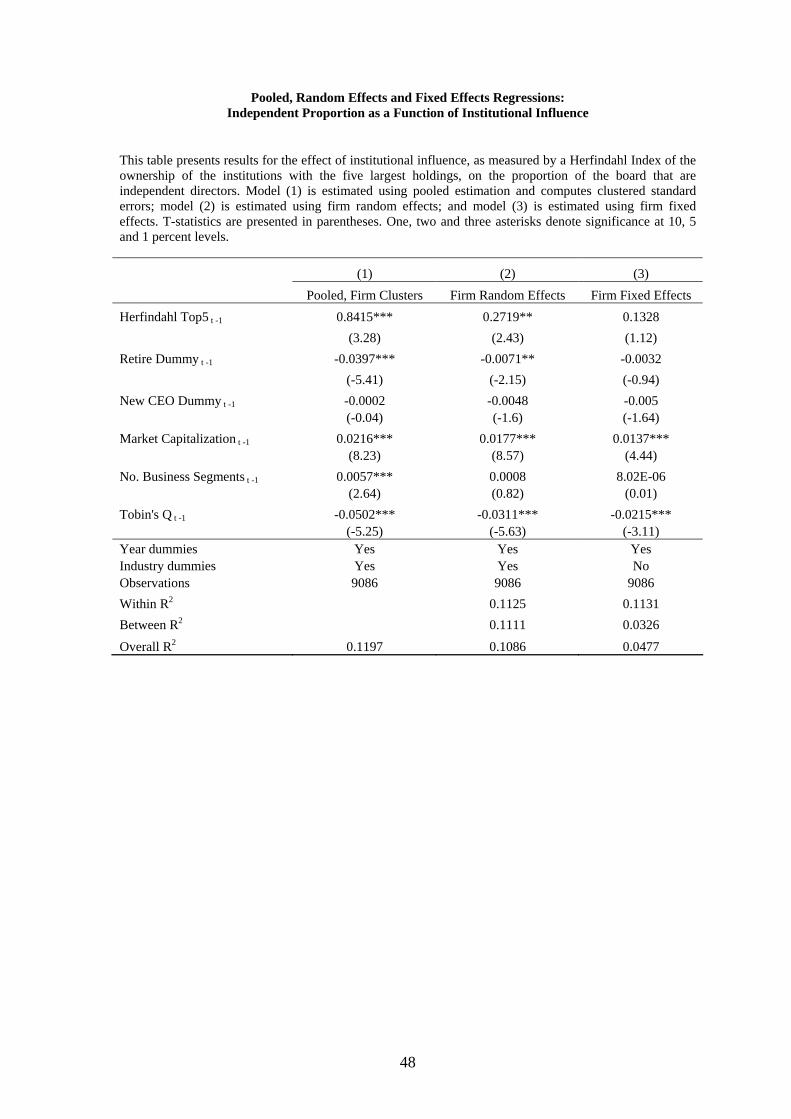
48
Pooled, Random Effects and Fixed Effects Regressions: Independent Proportion as a Function of Institutional Influence
This table presents results for the effect of institutional influence, as measured by a Herfindahl Index of the ownership of the institutions with the five largest holdings, on the proportion of the board that are independent directors. Model (1) is estimated using pooled estimation and computes clustered standard errors; model (2) is estimated using firm random effects; and model (3) is estimated using firm fixed effects. T-statistics are presented in parentheses. One, two and three asterisks denote significance at 10, 5 and 1 percent levels.
(1) (2) (3) Pooled, Firm Clusters Firm Random Effects Firm Fixed Effects
Herfindahl Top5 t -1 0.8415*** 0.2719** 0.1328 (3.28) (2.43) (1.12) Retire Dummy t -1 -0.0397*** -0.0071** -0.0032 (-5.41) (-2.15) (-0.94) New CEO Dummy t -1 -0.0002 -0.0048 -0.005 (-0.04) (-1.6) (-1.64) Market Capitalization t -1 0.0216*** 0.0177*** 0.0137*** (8.23) (8.57) (4.44) No. Business Segments t -1 0.0057*** 0.0008 8.02E-06 (2.64) (0.82) (0.01) Tobin's Q t -1 -0.0502*** -0.0311*** -0.0215*** (-5.25) (-5.63) (-3.11) Year dummies Yes Yes Yes Industry dummies Yes Yes No Observations 9086 9086 9086 Within R2 0.1125 0.1131 Between R2 0.1111 0.0326
Overall R2 0.1197 0.1086 0.0477
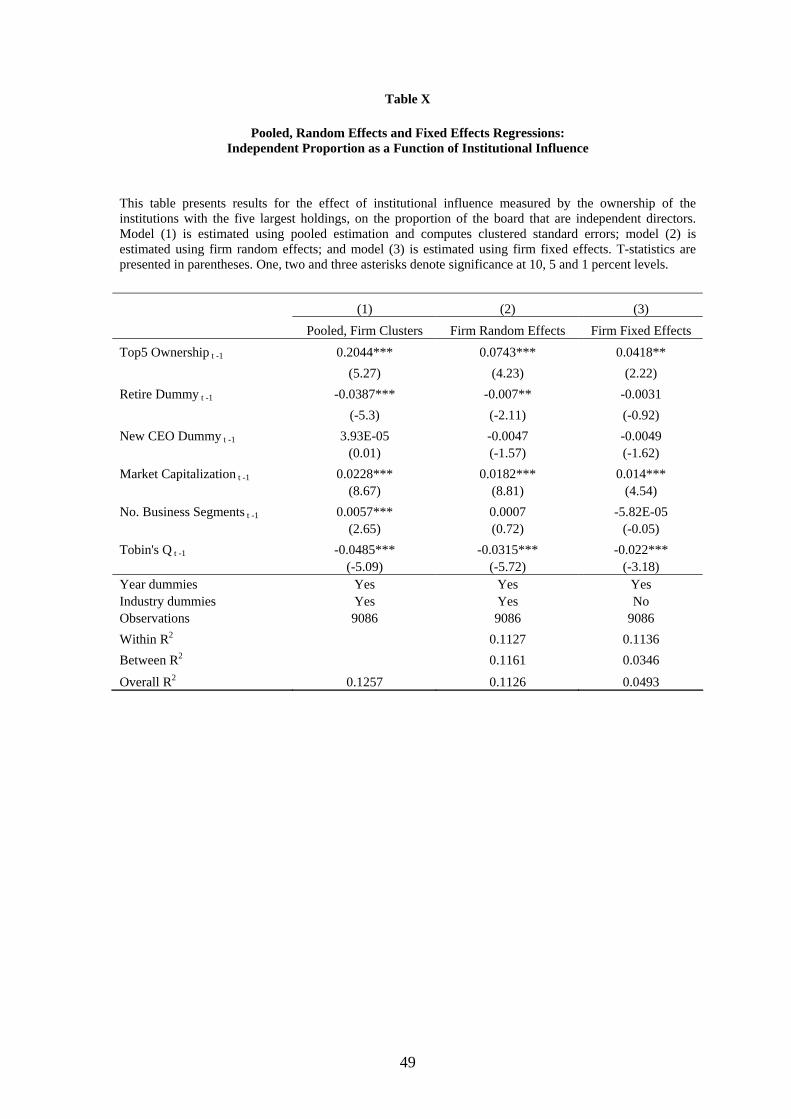
49
Table X
Pooled, Random Effects and Fixed Effects Regressions: Independent Proportion as a Function of Institutional Influence
This table presents results for the effect of institutional influence measured by the ownership of the institutions with the five largest holdings, on the proportion of the board that are independent directors. Model (1) is estimated using pooled estimation and computes clustered standard errors; model (2) is estimated using firm random effects; and model (3) is estimated using firm fixed effects. T-statistics are presented in parentheses. One, two and three asterisks denote significance at 10, 5 and 1 percent levels.
(1) (2) (3) Pooled, Firm Clusters Firm Random Effects Firm Fixed Effects
Top5 Ownership t -1 0.2044*** 0.0743*** 0.0418** (5.27) (4.23) (2.22) Retire Dummy t -1 -0.0387*** -0.007** -0.0031 (-5.3) (-2.11) (-0.92) New CEO Dummy t -1 3.93E-05 -0.0047 -0.0049 (0.01) (-1.57) (-1.62) Market Capitalization t -1 0.0228*** 0.0182*** 0.014*** (8.67) (8.81) (4.54) No. Business Segments t -1 0.0057*** 0.0007 -5.82E-05 (2.65) (0.72) (-0.05) Tobin's Q t -1 -0.0485*** -0.0315*** -0.022*** (-5.09) (-5.72) (-3.18) Year dummies Yes Yes Yes Industry dummies Yes Yes No Observations 9086 9086 9086 Within R2 0.1127 0.1136 Between R2 0.1161 0.0346
Overall R2 0.1257 0.1126 0.0493
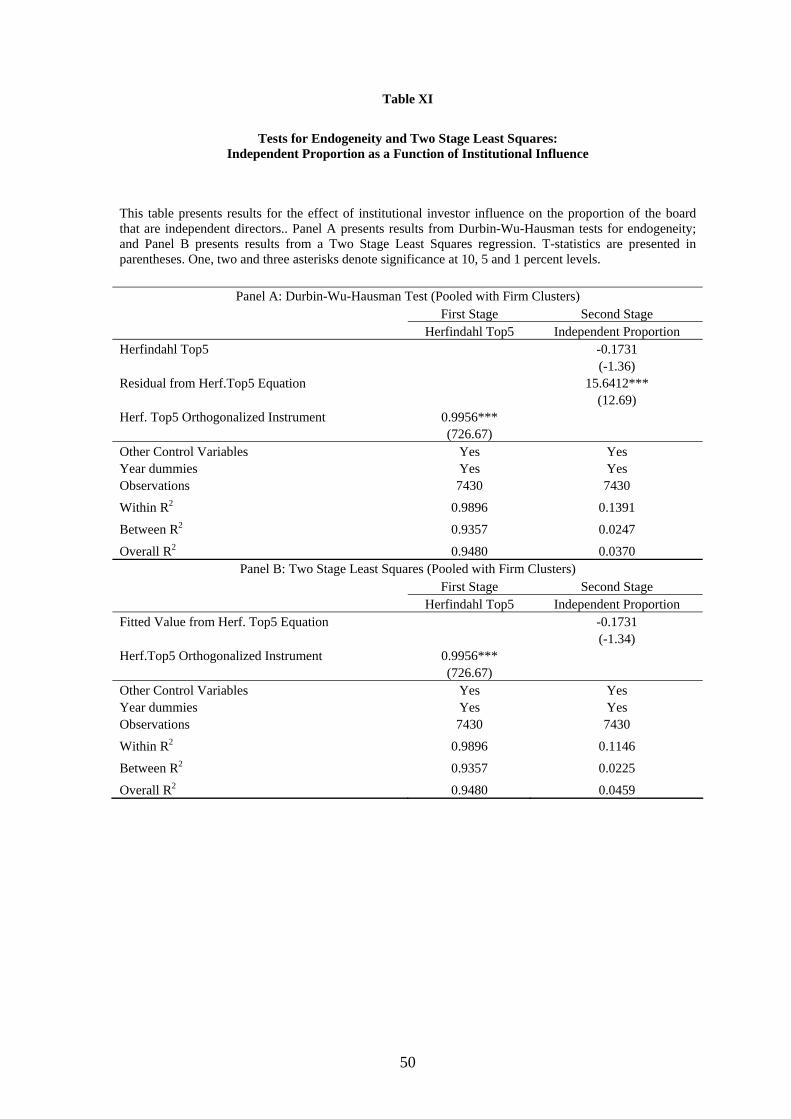
50
Table XI
Tests for Endogeneity and Two Stage Least Squares: Independent Proportion as a Function of Institutional Influence
This table presents results for the effect of institutional investor influence on the proportion of the board that are independent directors.. Panel A presents results from Durbin-Wu-Hausman tests for endogeneity; and Panel B presents results from a Two Stage Least Squares regression. T-statistics are presented in parentheses. One, two and three asterisks denote significance at 10, 5 and 1 percent levels.
Panel A: Durbin-Wu-Hausman Test (Pooled with Firm Clusters) First Stage Second Stage
Herfindahl Top5 Independent Proportion Herfindahl Top5 -0.1731 (-1.36) Residual from Herf.Top5 Equation 15.6412*** (12.69) Herf. Top5 Orthogonalized Instrument 0.9956*** (726.67) Other Control Variables Yes Yes Year dummies Yes Yes Observations 7430 7430
Within R2 0.9896 0.1391
Between R2 0.9357 0.0247
Overall R2 0.9480 0.0370 Panel B: Two Stage Least Squares (Pooled with Firm Clusters)
First Stage Second Stage Herfindahl Top5 Independent Proportion
Fitted Value from Herf. Top5 Equation -0.1731 (-1.34) Herf.Top5 Orthogonalized Instrument 0.9956*** (726.67) Other Control Variables Yes Yes Year dummies Yes Yes Observations 7430 7430
Within R2 0.9896 0.1146
Between R2 0.9357 0.0225
Overall R2 0.9480 0.0459

51
Table XII
Tests for Endogeneity and Two Stage Least Squares: Independent Proportion as a Function of Institutional Influence
This table presents results for the effect of institutional investor influence on the proportion of the board that are independent directors.. Panel A presents results from Durbin-Wu-Hausman tests for endogeneity; and Panel B presents results from a Two Stage Least Squares regression. T-statistics are presented in parentheses. One, two and three asterisks denote significance at 10, 5 and 1 percent levels.
Panel A: Durbin-Wu-Hausman Test (Pooled with Firm Clusters) First Stage Second Stage
Top5 Ownership Independent Proportion Top5 Ownership -0.023 (-1.12) Residual from Top5 Propn Equation 2.0122*** (14.67) Top5 Propn Orthogonalized Instrument 0.9878*** (499.19) Other Control Variables Yes Yes Year dummies Yes Yes Observations 7430 7430
Within R2 0.9787 0.1471
Between R2 0.9028 0.0389
Overall R2 0.9156 0.0501 Panel B: Two Stage Least Squares (Pooled with Firm Clusters)
First Stage Second Stage Top5 Ownership Independent Proportion
Fitted Value from Top5 Propn Equation -0.023 (-1.10) Top5 Propn Orthogonalized Instrument 0.9878*** (499.19) Other Control Variables Yes Yes Year dummies Yes Yes Observations 7430 7430
Within R2 0.9787 0.1143
Between R2 0.9028 0.0222
Overall R2 0.9156 0.0455
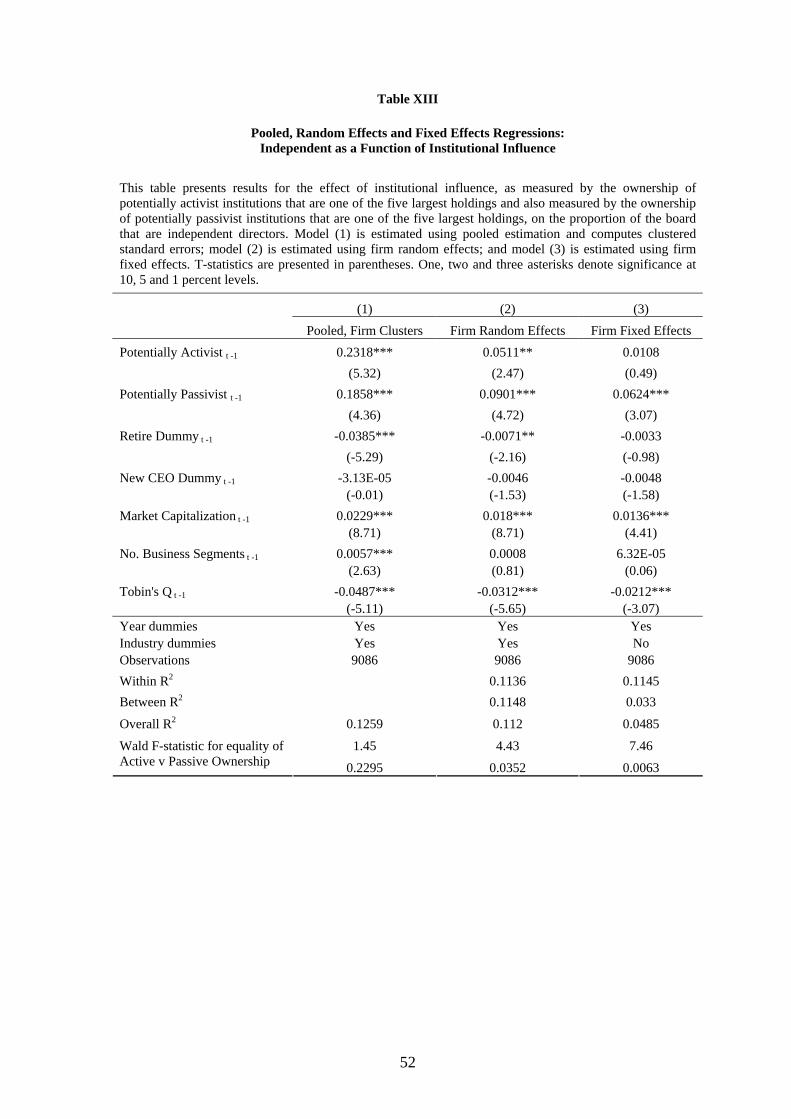
52
Table XIII
Pooled, Random Effects and Fixed Effects Regressions: Independent as a Function of Institutional Influence
This table presents results for the effect of institutional influence, as measured by the ownership of potentially activist institutions that are one of the five largest holdings and also measured by the ownership of potentially passivist institutions that are one of the five largest holdings, on the proportion of the board that are independent directors. Model (1) is estimated using pooled estimation and computes clustered standard errors; model (2) is estimated using firm random effects; and model (3) is estimated using firm fixed effects. T-statistics are presented in parentheses. One, two and three asterisks denote significance at 10, 5 and 1 percent levels.
(1) (2) (3) Pooled, Firm Clusters Firm Random Effects Firm Fixed Effects
Potentially Activist t -1 0.2318*** 0.0511** 0.0108 (5.32) (2.47) (0.49) Potentially Passivist t -1 0.1858*** 0.0901*** 0.0624*** (4.36) (4.72) (3.07) Retire Dummy t -1 -0.0385*** -0.0071** -0.0033 (-5.29) (-2.16) (-0.98) New CEO Dummy t -1 -3.13E-05 -0.0046 -0.0048 (-0.01) (-1.53) (-1.58) Market Capitalization t -1 0.0229*** 0.018*** 0.0136*** (8.71) (8.71) (4.41) No. Business Segments t -1 0.0057*** 0.0008 6.32E-05 (2.63) (0.81) (0.06) Tobin's Q t -1 -0.0487*** -0.0312*** -0.0212*** (-5.11) (-5.65) (-3.07) Year dummies Yes Yes Yes Industry dummies Yes Yes No Observations 9086 9086 9086 Within R2 0.1136 0.1145 Between R2 0.1148 0.033
Overall R2 0.1259 0.112 0.0485
1.45 4.43 7.46 Wald F-statistic for equality of Active v Passive Ownership 0.2295 0.0352 0.0063
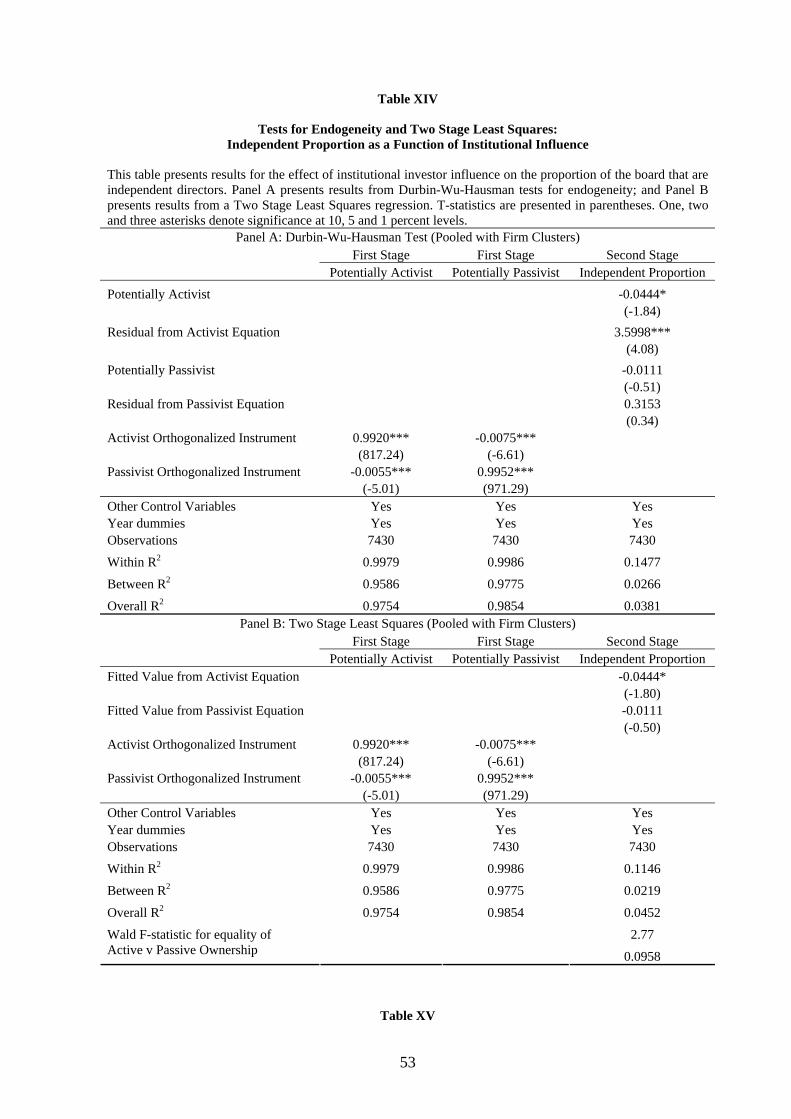
53
Table XIV
Tests for Endogeneity and Two Stage Least Squares: Independent Proportion as a Function of Institutional Influence
This table presents results for the effect of institutional investor influence on the proportion of the board that are independent directors. Panel A presents results from Durbin-Wu-Hausman tests for endogeneity; and Panel B presents results from a Two Stage Least Squares regression. T-statistics are presented in parentheses. One, two and three asterisks denote significance at 10, 5 and 1 percent levels.
Panel A: Durbin-Wu-Hausman Test (Pooled with Firm Clusters) First Stage First Stage Second Stage
Potentially Activist Potentially Passivist Independent Proportion Potentially Activist -0.0444* (-1.84) Residual from Activist Equation 3.5998*** (4.08) Potentially Passivist -0.0111 (-0.51) Residual from Passivist Equation 0.3153 (0.34) Activist Orthogonalized Instrument 0.9920*** -0.0075*** (817.24) (-6.61) Passivist Orthogonalized Instrument -0.0055*** 0.9952*** (-5.01) (971.29) Other Control Variables Yes Yes Yes Year dummies Yes Yes Yes Observations 7430 7430 7430
Within R2 0.9979 0.9986 0.1477
Between R2 0.9586 0.9775 0.0266
Overall R2 0.9754 0.9854 0.0381 Panel B: Two Stage Least Squares (Pooled with Firm Clusters)
First Stage First Stage Second Stage Potentially Activist Potentially Passivist Independent Proportion
Fitted Value from Activist Equation -0.0444* (-1.80) Fitted Value from Passivist Equation -0.0111 (-0.50) Activist Orthogonalized Instrument 0.9920*** -0.0075*** (817.24) (-6.61) Passivist Orthogonalized Instrument -0.0055*** 0.9952*** (-5.01) (971.29) Other Control Variables Yes Yes Yes Year dummies Yes Yes Yes Observations 7430 7430 7430
Within R2 0.9979 0.9986 0.1146
Between R2 0.9586 0.9775 0.0219
Overall R2 0.9754 0.9854 0.0452
2.77 Wald F-statistic for equality of Active v Passive Ownership 0.0958
Table XV
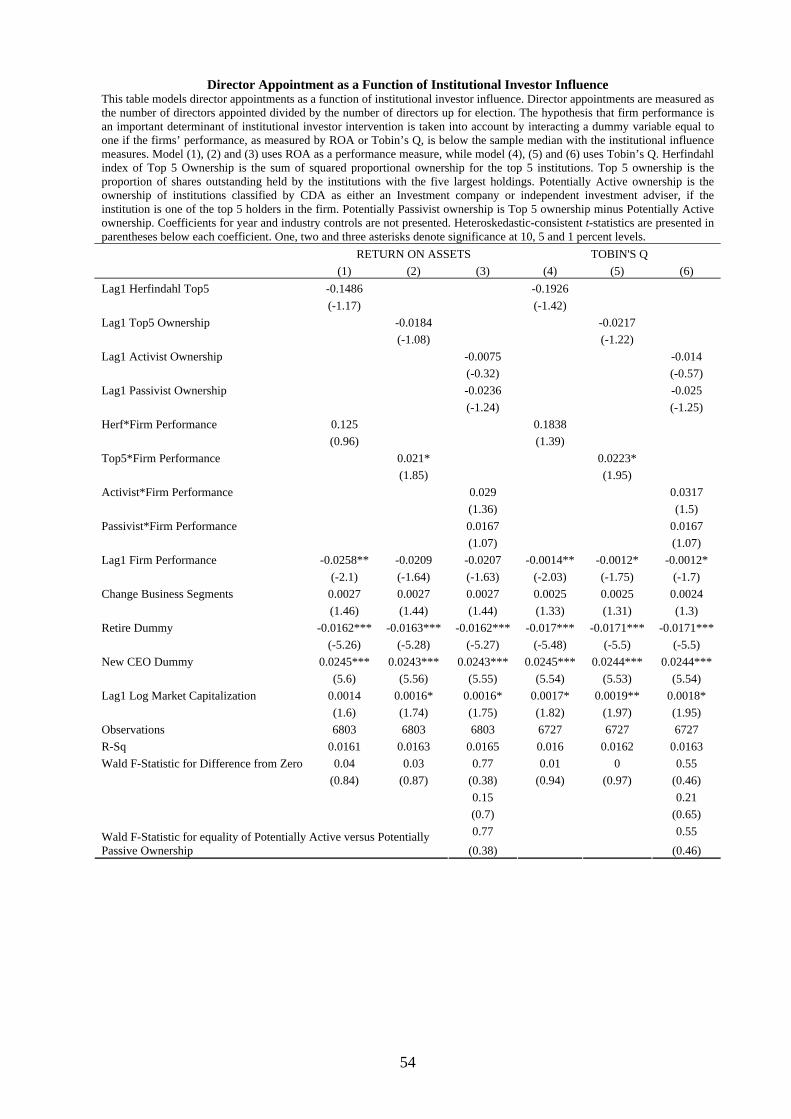
54
Director Appointment as a Function of Institutional Investor Influence This table models director appointments as a function of institutional investor influence. Director appointments are measured as the number of directors appointed divided by the number of directors up for election. The hypothesis that firm performance is an important determinant of institutional investor intervention is taken into account by interacting a dummy variable equal to one if the firms’ performance, as measured by ROA or Tobin’s Q, is below the sample median with the institutional influence measures. Model (1), (2) and (3) uses ROA as a performance measure, while model (4), (5) and (6) uses Tobin’s Q. Herfindahl index of Top 5 Ownership is the sum of squared proportional ownership for the top 5 institutions. Top 5 ownership is the proportion of shares outstanding held by the institutions with the five largest holdings. Potentially Active ownership is the ownership of institutions classified by CDA as either an Investment company or independent investment adviser, if the institution is one of the top 5 holders in the firm. Potentially Passivist ownership is Top 5 ownership minus Potentially Active ownership. Coefficients for year and industry controls are not presented. Heteroskedastic-consistent t-statistics are presented in parentheses below each coefficient. One, two and three asterisks denote significance at 10, 5 and 1 percent levels. RETURN ON ASSETS TOBIN'S Q (1) (2) (3) (4) (5) (6) Lag1 Herfindahl Top5 -0.1486 -0.1926 (-1.17) (-1.42) Lag1 Top5 Ownership -0.0184 -0.0217 (-1.08) (-1.22) Lag1 Activist Ownership -0.0075 -0.014 (-0.32) (-0.57) Lag1 Passivist Ownership -0.0236 -0.025 (-1.24) (-1.25) Herf*Firm Performance 0.125 0.1838 (0.96) (1.39) Top5*Firm Performance 0.021* 0.0223* (1.85) (1.95) Activist*Firm Performance 0.029 0.0317 (1.36) (1.5) Passivist*Firm Performance 0.0167 0.0167 (1.07) (1.07) Lag1 Firm Performance -0.0258** -0.0209 -0.0207 -0.0014** -0.0012* -0.0012* (-2.1) (-1.64) (-1.63) (-2.03) (-1.75) (-1.7) Change Business Segments 0.0027 0.0027 0.0027 0.0025 0.0025 0.0024 (1.46) (1.44) (1.44) (1.33) (1.31) (1.3) Retire Dummy -0.0162*** -0.0163*** -0.0162*** -0.017*** -0.0171*** -0.0171*** (-5.26) (-5.28) (-5.27) (-5.48) (-5.5) (-5.5) New CEO Dummy 0.0245*** 0.0243*** 0.0243*** 0.0245*** 0.0244*** 0.0244*** (5.6) (5.56) (5.55) (5.54) (5.53) (5.54) Lag1 Log Market Capitalization 0.0014 0.0016* 0.0016* 0.0017* 0.0019** 0.0018* (1.6) (1.74) (1.75) (1.82) (1.97) (1.95) Observations 6803 6803 6803 6727 6727 6727 R-Sq 0.0161 0.0163 0.0165 0.016 0.0162 0.0163 Wald F-Statistic for Difference from Zero 0.04 0.03 0.77 0.01 0 0.55 (0.84) (0.87) (0.38) (0.94) (0.97) (0.46) 0.15 0.21 (0.7) (0.65)
0.77 0.55 Wald F-Statistic for equality of Potentially Active versus Potentially Passive Ownership (0.38) (0.46)
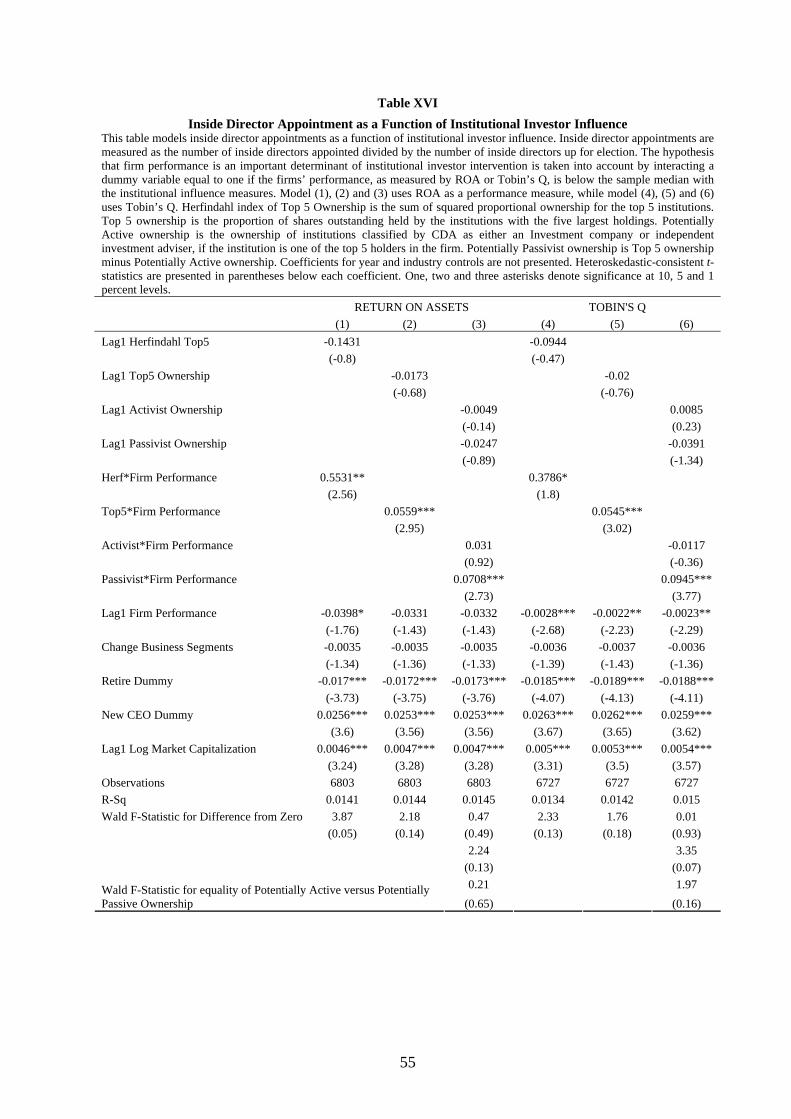
55
Table XVI Inside Director Appointment as a Function of Institutional Investor Influence
This table models inside director appointments as a function of institutional investor influence. Inside director appointments are measured as the number of inside directors appointed divided by the number of inside directors up for election. The hypothesis that firm performance is an important determinant of institutional investor intervention is taken into account by interacting a dummy variable equal to one if the firms’ performance, as measured by ROA or Tobin’s Q, is below the sample median with the institutional influence measures. Model (1), (2) and (3) uses ROA as a performance measure, while model (4), (5) and (6) uses Tobin’s Q. Herfindahl index of Top 5 Ownership is the sum of squared proportional ownership for the top 5 institutions. Top 5 ownership is the proportion of shares outstanding held by the institutions with the five largest holdings. Potentially Active ownership is the ownership of institutions classified by CDA as either an Investment company or independent investment adviser, if the institution is one of the top 5 holders in the firm. Potentially Passivist ownership is Top 5 ownership minus Potentially Active ownership. Coefficients for year and industry controls are not presented. Heteroskedastic-consistent t-statistics are presented in parentheses below each coefficient. One, two and three asterisks denote significance at 10, 5 and 1 percent levels. RETURN ON ASSETS TOBIN'S Q (1) (2) (3) (4) (5) (6) Lag1 Herfindahl Top5 -0.1431 -0.0944 (-0.8) (-0.47) Lag1 Top5 Ownership -0.0173 -0.02 (-0.68) (-0.76) Lag1 Activist Ownership -0.0049 0.0085 (-0.14) (0.23) Lag1 Passivist Ownership -0.0247 -0.0391 (-0.89) (-1.34) Herf*Firm Performance 0.5531** 0.3786* (2.56) (1.8) Top5*Firm Performance 0.0559*** 0.0545*** (2.95) (3.02) Activist*Firm Performance 0.031 -0.0117 (0.92) (-0.36) Passivist*Firm Performance 0.0708*** 0.0945*** (2.73) (3.77) Lag1 Firm Performance -0.0398* -0.0331 -0.0332 -0.0028*** -0.0022** -0.0023** (-1.76) (-1.43) (-1.43) (-2.68) (-2.23) (-2.29) Change Business Segments -0.0035 -0.0035 -0.0035 -0.0036 -0.0037 -0.0036 (-1.34) (-1.36) (-1.33) (-1.39) (-1.43) (-1.36) Retire Dummy -0.017*** -0.0172*** -0.0173*** -0.0185*** -0.0189*** -0.0188*** (-3.73) (-3.75) (-3.76) (-4.07) (-4.13) (-4.11) New CEO Dummy 0.0256*** 0.0253*** 0.0253*** 0.0263*** 0.0262*** 0.0259*** (3.6) (3.56) (3.56) (3.67) (3.65) (3.62) Lag1 Log Market Capitalization 0.0046*** 0.0047*** 0.0047*** 0.005*** 0.0053*** 0.0054*** (3.24) (3.28) (3.28) (3.31) (3.5) (3.57) Observations 6803 6803 6803 6727 6727 6727 R-Sq 0.0141 0.0144 0.0145 0.0134 0.0142 0.015 Wald F-Statistic for Difference from Zero 3.87 2.18 0.47 2.33 1.76 0.01 (0.05) (0.14) (0.49) (0.13) (0.18) (0.93) 2.24 3.35 (0.13) (0.07)
0.21 1.97 Wald F-Statistic for equality of Potentially Active versus Potentially Passive Ownership (0.65) (0.16)
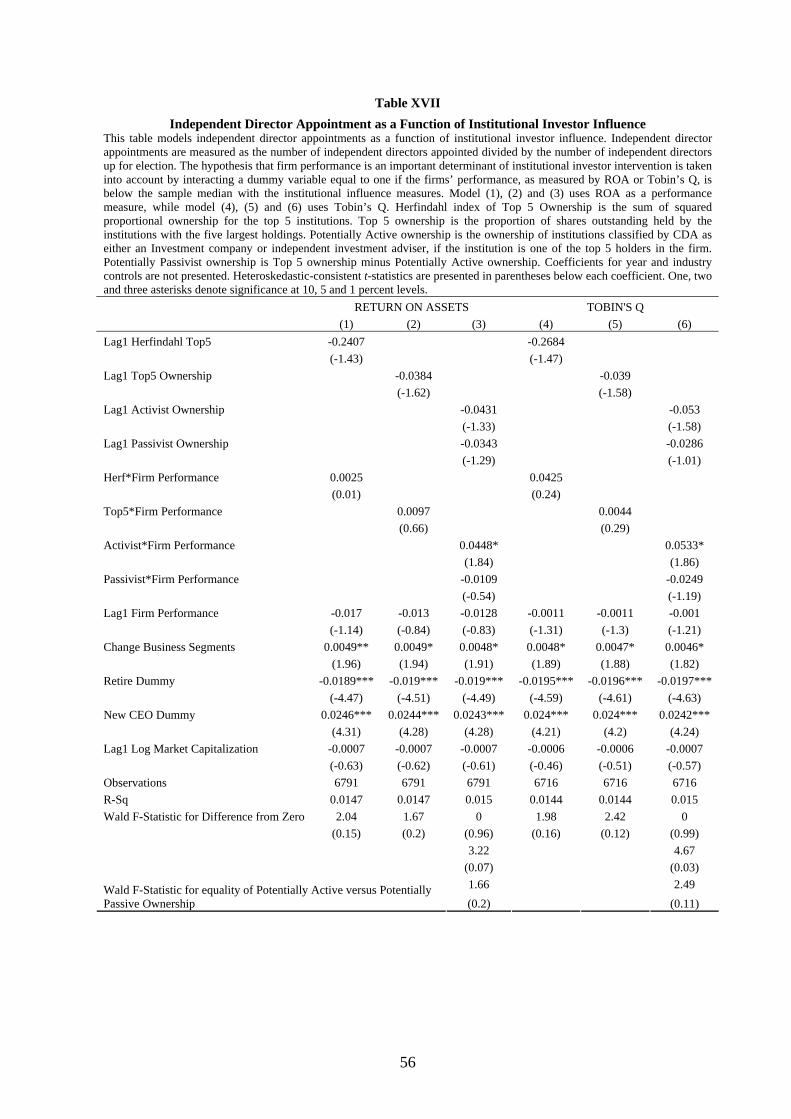
56
Table XVII Independent Director Appointment as a Function of Institutional Investor Influence
This table models independent director appointments as a function of institutional investor influence. Independent director appointments are measured as the number of independent directors appointed divided by the number of independent directors up for election. The hypothesis that firm performance is an important determinant of institutional investor intervention is taken into account by interacting a dummy variable equal to one if the firms’ performance, as measured by ROA or Tobin’s Q, is below the sample median with the institutional influence measures. Model (1), (2) and (3) uses ROA as a performance measure, while model (4), (5) and (6) uses Tobin’s Q. Herfindahl index of Top 5 Ownership is the sum of squared proportional ownership for the top 5 institutions. Top 5 ownership is the proportion of shares outstanding held by the institutions with the five largest holdings. Potentially Active ownership is the ownership of institutions classified by CDA as either an Investment company or independent investment adviser, if the institution is one of the top 5 holders in the firm. Potentially Passivist ownership is Top 5 ownership minus Potentially Active ownership. Coefficients for year and industry controls are not presented. Heteroskedastic-consistent t-statistics are presented in parentheses below each coefficient. One, two and three asterisks denote significance at 10, 5 and 1 percent levels. RETURN ON ASSETS TOBIN'S Q (1) (2) (3) (4) (5) (6) Lag1 Herfindahl Top5 -0.2407 -0.2684 (-1.43) (-1.47) Lag1 Top5 Ownership -0.0384 -0.039 (-1.62) (-1.58) Lag1 Activist Ownership -0.0431 -0.053 (-1.33) (-1.58) Lag1 Passivist Ownership -0.0343 -0.0286 (-1.29) (-1.01) Herf*Firm Performance 0.0025 0.0425 (0.01) (0.24) Top5*Firm Performance 0.0097 0.0044 (0.66) (0.29) Activist*Firm Performance 0.0448* 0.0533* (1.84) (1.86) Passivist*Firm Performance -0.0109 -0.0249 (-0.54) (-1.19) Lag1 Firm Performance -0.017 -0.013 -0.0128 -0.0011 -0.0011 -0.001 (-1.14) (-0.84) (-0.83) (-1.31) (-1.3) (-1.21) Change Business Segments 0.0049** 0.0049* 0.0048* 0.0048* 0.0047* 0.0046* (1.96) (1.94) (1.91) (1.89) (1.88) (1.82) Retire Dummy -0.0189*** -0.019*** -0.019*** -0.0195*** -0.0196*** -0.0197*** (-4.47) (-4.51) (-4.49) (-4.59) (-4.61) (-4.63) New CEO Dummy 0.0246*** 0.0244*** 0.0243*** 0.024*** 0.024*** 0.0242*** (4.31) (4.28) (4.28) (4.21) (4.2) (4.24) Lag1 Log Market Capitalization -0.0007 -0.0007 -0.0007 -0.0006 -0.0006 -0.0007 (-0.63) (-0.62) (-0.61) (-0.46) (-0.51) (-0.57) Observations 6791 6791 6791 6716 6716 6716 R-Sq 0.0147 0.0147 0.015 0.0144 0.0144 0.015 Wald F-Statistic for Difference from Zero 2.04 1.67 0 1.98 2.42 0 (0.15) (0.2) (0.96) (0.16) (0.12) (0.99) 3.22 4.67 (0.07) (0.03)
1.66 2.49 Wald F-Statistic for equality of Potentially Active versus Potentially Passive Ownership (0.2) (0.11)
57
Table XVIII Director Departure as a Function of Institutional Investor Influence
This table models director departures as a function of institutional investor influence. Director departures are measured as the number of directors departed divided by the number of directors up for election. The hypothesis that firm performance is an important determinant of institutional investor intervention is taken into account by interacting a dummy variable equal to one if the firms’ performance, as measured by ROA or Tobin’s Q, is below the sample median with the institutional influence measures. Model (1), (2) and (3) uses ROA as a performance measure, while model (4), (5) and (6) uses Tobin’s Q. Herfindahl index of Top 5 Ownership is the sum of squared proportional ownership for the top 5 institutions. Top5 ownership is the proportion of shares outstanding held by the institutions with the five largest holdings. Potentially Active ownership is the ownership of institutions classified by CDA as either an Investment company or independent investment adviser, if the institution is one of the top 5 holders in the firm. Potentially Passivist ownership is Top5 ownership minus Potentially Active ownership. Coefficients for year and industry controls are not presented. Heteroskedastic-consistent t-statistics are presented in parentheses below each coefficient. One, two and three asterisks denote significance at 10, 5 and 1 percent levels. RETURN ON ASSETS TOBIN'S Q (1) (2) (3) (4) (5) (6) Lag1 Herfindahl Top5 1.1779 1.7371* (1.16) (1.77) Lag1 Top5 Ownership 0.2225 0.2906* (1.37) (1.83) Lag1 Activist Ownership 0.5268* 0.7882*** (1.68) (2.69) Lag1 Passivist Ownership 0.0834 0.0343 (0.61) (0.25) Herf*Firm Performance 0.2027 -1.0126 (0.21) (-1.01) Top5*Firm Performance -0.0135 -0.1494 (-0.14) (-1.52) Activist*Firm Performance 0.1042 -0.4594* (0.38) (-1.69) Passivist*Firm Performance -0.0736 0.0279 (-0.95) (0.34) Lag1 Firm Performance 0.01 -0.0021 0.0019 -0.0054 -0.0068 -0.0065 (0.14) (-0.03) (0.03) (-1.04) (-1.29) (-1.24) Change Business Segments 0.0241 0.0244 0.0244 0.0243 0.0247 0.0257 (0.83) (0.83) (0.84) (0.83) (0.84) (0.88) Retire Dummy -0.0016 -0.0008 -0.0004 -0.0027 -0.0013 -0.0004 (-0.04) (-0.02) (-0.01) (-0.07) (-0.03) (-0.01) New CEO Dummy 0.0866** 0.0873** 0.0868** 0.0842** 0.085** 0.0837** (2.27) (2.29) (2.27) (2.19) (2.21) (2.17) Lag1 Log Market Capitalization -0.0134 -0.0127 -0.0126 -0.0133 -0.0135 -0.0131 (-1.23) (-1.16) (-1.15) (-1.15) (-1.17) (-1.13) Observations 6491 6491 6491 6418 6418 6418 R-Sq 0.1088 0.1089 0.1096 0.1088 0.109 0.11 Wald F-Statistic for Difference from Zero 2.27 1.85 4.17 0.52 0.76 0.99 (0.13) (0.17) (0.04) (0.47) (0.38) (0.32) 0.01 0.22 (0.94) (0.64)
4.6 0.73 Wald F-Statistic for equality of Potentially Active versus Potentially Passive Ownership (0.03) (0.39)
58
Table XIX Inside Director Departure as a Function of Institutional Investor Influence
This table models inside director departures as a function of institutional investor influence. Inside director departures are measured as the number of departed inside directors divided by the number of inside directors up for election. The hypothesis that firm performance is an important determinant of institutional investor intervention is taken into account by interacting a dummy variable equal to one if the firms’ performance, as measured by ROA or Tobin’s Q, is below the sample median with the institutional influence measures. Model (1), (2) and (3) uses ROA as a performance measure, while model (4), (5) and (6) uses Tobin’s Q. Herfindahl index of Top 5 Ownership is the sum of squared proportional ownership for the top 5 institutions. Top 5 ownership is the proportion of shares outstanding held by the institutions with the five largest holdings. Potentially Active ownership is the ownership of institutions classified by CDA as either an Investment company or Independent Investment adviser, if the institution is one of the top 5 holders in the firm. Potentially Passivist ownership is Top5 ownership minus Potentially Active ownership. Coefficients for year and industry controls are not presented. Heteroskedastic-consistent t-statistics are presented in parentheses below each coefficient. One, two and three asterisks denote significance at 10, 5 and 1 percent levels. RETURN ON ASSETS TOBIN'S Q (1) (2) (3) (4) (5) (6) Lag1 Herfindahl Top5 0.8036 0.3884 (1.12) (0.51) Lag1 Top5 Ownership 0.2559** 0.1938* (2.41) (1.75) Lag1 Activist Ownership 0.4335** 0.3123* (2.44) (1.73) Lag1 Passivist Ownership 0.1724 0.141 (1.59) (1.25) Herf*Firm Performance 1.4525** 1.8451** (1.97) (2.44) Top5*Firm Performance 0.124* 0.188*** (1.76) (2.63) Activist*Firm Performance 0.0727 0.2389 (0.46) (1.52) Passivist*Firm Performance 0.1533* 0.1614* (1.87) (1.94) Lag1 Firm Performance -0.0193 -0.0122 -0.0106 -0.01*** -0.0085** -0.0082** (-0.34) (-0.21) (-0.18) (-2.8) (-2.48) (-2.41) Change Business Segments -0.026 -0.0257 -0.0256 -0.0283 -0.028 -0.028 (-1.5) (-1.48) (-1.48) (-1.62) (-1.61) (-1.61) Retire Dummy -0.0701*** -0.0691*** -0.0691*** -0.0732*** -0.073*** -0.0728*** (-2.71) (-2.67) (-2.68) (-2.8) (-2.79) (-2.79) New CEO Dummy 0.0643** 0.0641** 0.0637** 0.0618** 0.0616** 0.0616** (2.55) (2.54) (2.53) (2.44) (2.43) (2.43) Lag1 Log Market Capitalization -2.17E-05 0.0022 0.0023 0.0049 0.0076 0.0075 (0) (0.36) (0.36) (0.78) (1.18) (1.17) Observations 5431 5431 5431 5369 5369 5369 R-Sq 0.0339 0.0348 0.0352 0.0353 0.0363 0.0367 Wald F-Statistic for Difference from Zero 10.22 13.43 8.17 10.32 13.48 9.89 (0) (0) (0) (0) (0) (0) 9.69 8.06 (0) (0)
1.05 2 Wald F-Statistic for equality of Potentially Active versus Potentially Passive Ownership (0.31) (0.16)
59
Table XX Independent Director Departure as a Function of Institutional Investor Influence
This table models independent director departures as a function of institutional investor influence. Independent director departures are measured as the number of departed independent directors divided by the number of independent directors up for election. The hypothesis that firm performance is an important determinant of institutional investor intervention is taken into account by interacting a dummy variable equal to one if the firms’ performance, as measured by ROA or Tobin’s Q, is below the sample median with the institutional influence measures. Model (1), (2) and (3) uses ROA as a performance measure, while model (4), (5) and (6) uses Tobin’s Q. Herfindahl index of Top 5 Ownership is the sum of squared proportional ownership for the top 5 institutions. Top 5 ownership is the proportion of shares outstanding held by the institutions with the five largest holdings. Potentially Active ownership is the ownership of institutions classified by CDA as either an Investment company or independent investment adviser, if the institution is one of the top 5 holders in the firm. Potentially Passivist ownership is Top5 ownership minus Potentially Active ownership. Coefficients for year and industry controls are not presented. Heteroskedastic-consistent t-statistics are presented in parentheses below each coefficient. One, two and three asterisks denote significance at 10, 5 and 1 percent levels. RETURN ON ASSETS TOBIN'S Q (1) (2) (3) (4) (5) (6) Lag1 Herfindahl Top5 -0.6452 0.1952 (-0.76) (0.23) Lag1 Top5 Ownership -0.0373 0.0574 (-0.29) (0.46) Lag1 Activist Ownership 0.149 0.4216* (0.63) (1.9) Lag1 Passivist Ownership -0.1176 -0.1188 (-0.96) (-0.96) Herf*Firm Performance -0.173 -1.7045* (-0.2) (-1.9) Top5*Firm Performance -0.0394 -0.181** (-0.48) (-2.22) Activist*Firm Performance 0.0232 -0.4538** (0.11) (-2.18) Passivist*Firm Performance -0.0709 -0.0359 (-0.83) (-0.41) Lag1 Firm Performance 0.0113 0.0012 0.0036 0.005 0.0039 0.0041 (0.2) (0.02) (0.06) (1.22) (0.97) (1) Change Business Segments -0.0013 -0.0012 -0.0012 3.53E-05 0.0003 0.0012 (-0.05) (-0.05) (-0.05) (0) (0.01) (0.05) Retire Dummy -0.0464 -0.046 -0.0458 -0.0445 -0.0434 -0.0429 (-1.52) (-1.5) (-1.5) (-1.44) (-1.4) (-1.39) New CEO Dummy 0.0451 0.0454 0.0453 0.0458 0.0463 0.0458 (1.37) (1.38) (1.37) (1.38) (1.4) (1.38) Lag1 Log Market Capitalization -0.0337*** -0.0335*** -0.0334*** -0.0382*** -0.0385*** -0.0384*** (-3.82) (-3.81) (-3.81) (-4.17) (-4.21) (-4.18) Observations 6106 6106 6106 6034 6034 6034 R-Sq 0.0604 0.0603 0.0607 0.0607 0.0608 0.0617 Wald F-Statistic for Difference from Zero 0.93 0.39 0.53 3.07 0.94 0.02 (0.33) (0.53) (0.46) (0.08) (0.33) (0.9) 2.56 1.59 (0.11) (0.21)
2.36 0.24 Wald F-Statistic for equality of Potentially Active versus Potentially Passive Ownership (0.12) (0.62)
60
Table XXI Change in Board Size as a Function of Institutional Investor Influence
This table models the change in board size as a function of institutional investor influence. Change in board size is measured as the first difference in the board size. The hypothesis that firm performance is an important determinant of institutional investor intervention is taken into account by interacting a dummy variable equal to one if the firms’ performance, as measured by ROA or Tobin’s Q, is below the sample median with the institutional influence measures. Model (1), (2) and (3) uses ROA as a performance measure, while model (4), (5) and (6) uses Tobin’s Q. Herfindahl index of Top 5 Ownership is the sum of squared proportional ownership for the top 5 institutions. Top5 ownership is the proportion of shares outstanding held by the institutions with the five largest holdings. Potentially Active ownership is the ownership of institutions classified by CDA as either an Investment company or independent investment adviser, if the institution is one of the top 5 holders in the firm. Potentially Passivist ownership is Top5 ownership minus Potentially Active ownership. Coefficients for year and industry controls are not presented. Heteroskedastic-consistent t-statistics are presented in parentheses below each coefficient. One, two and three asterisks denote significance at 10, 5 and 1 percent levels. RETURN ON ASSETS TOBIN'S Q (1) (2) (3) (4) (5) (6) Lag1 Herfindahl Top5 0.0746 -0.1942 (0.31) (-0.47) Lag1 Top5 Ownership 0.0033 -0.0077 (0.09) (-0.17) Lag1 Activist Ownership -0.0536 -0.0697 (-0.8) (-0.94) Lag1 Passivist Ownership 0.0307 0.0237 (0.87) (0.59) Herf*Firm Performance -0.7825** -0.1373 (-2.33) (-0.38) Top5*Firm Performance -0.0611*** -0.0317 (-2.59) (-1.19) Activist*Firm Performance -0.0913* -0.0368 (-1.66) (-0.63) Passivist*Firm Performance -0.0448* -0.0294 (-1.67) (-0.98) Lag1 Firm Performance 0.0013 -0.001 -0.0018 0.0054*** 0.0049*** 0.0048*** (0.06) (-0.05) (-0.09) (3.56) (3.46) (3.41) Change Business Segments 0.0036 0.0037 0.0037 0.0042 0.0043 0.0042 (1.02) (1.02) (1.02) (1.16) (1.18) (1.17) Retire Dummy 0.0048 0.0049 0.0048 0.0061 0.0064 0.0063 (0.89) (0.91) (0.89) (1.12) (1.17) (1.15) New CEO Dummy -0.0131 -0.013 -0.0129 -0.0134 -0.0134 -0.0134 (-1.58) (-1.56) (-1.55) (-1.58) (-1.57) (-1.58) Lag1 Log Market Capitalization -0.0059*** -0.0059*** -0.0059*** -0.0071*** -0.0073*** -0.0073*** (-3.57) (-3.55) (-3.56) (-4.04) (-4.06) (-4.08) Observations 6799 6799 6799 6723 6723 6723 R-Sq 0.0061 0.0056 0.0066 0.0068 0.0069 0.0076 Wald F-Statistic for Difference from Zero 3.03 1.94 3.67 1.74 1.04 2.23 (0.08) (0.16) (0.06) (0.19) (0.31) (0.14) 0.16 0.03 (0.69) (0.87)
3.69 2.2 Wald F-Statistic for equality of Potentially Active versus Potentially Passive Ownership (0.05) (0.14)
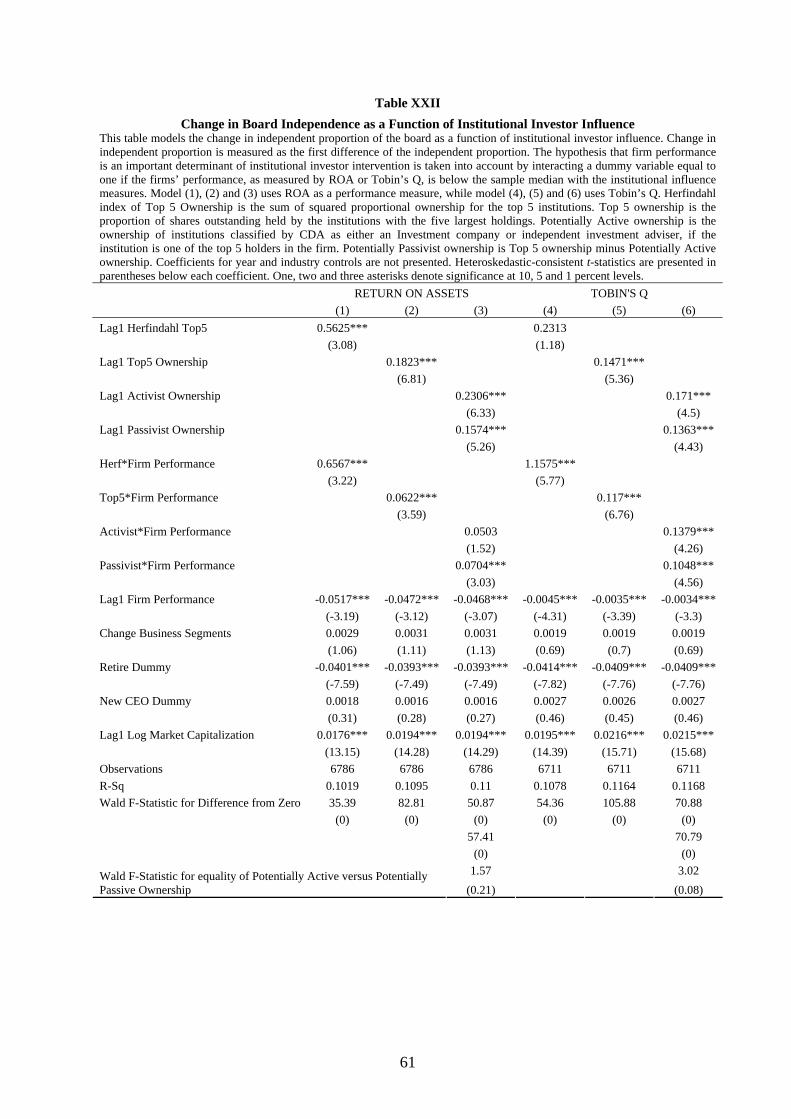
61
Table XXII Change in Board Independence as a Function of Institutional Investor Influence
This table models the change in independent proportion of the board as a function of institutional investor influence. Change in independent proportion is measured as the first difference of the independent proportion. The hypothesis that firm performance is an important determinant of institutional investor intervention is taken into account by interacting a dummy variable equal to one if the firms’ performance, as measured by ROA or Tobin’s Q, is below the sample median with the institutional influence measures. Model (1), (2) and (3) uses ROA as a performance measure, while model (4), (5) and (6) uses Tobin’s Q. Herfindahl index of Top 5 Ownership is the sum of squared proportional ownership for the top 5 institutions. Top 5 ownership is the proportion of shares outstanding held by the institutions with the five largest holdings. Potentially Active ownership is the ownership of institutions classified by CDA as either an Investment company or independent investment adviser, if the institution is one of the top 5 holders in the firm. Potentially Passivist ownership is Top 5 ownership minus Potentially Active ownership. Coefficients for year and industry controls are not presented. Heteroskedastic-consistent t-statistics are presented in parentheses below each coefficient. One, two and three asterisks denote significance at 10, 5 and 1 percent levels. RETURN ON ASSETS TOBIN'S Q (1) (2) (3) (4) (5) (6) Lag1 Herfindahl Top5 0.5625*** 0.2313 (3.08) (1.18) Lag1 Top5 Ownership 0.1823*** 0.1471*** (6.81) (5.36) Lag1 Activist Ownership 0.2306*** 0.171*** (6.33) (4.5) Lag1 Passivist Ownership 0.1574*** 0.1363*** (5.26) (4.43) Herf*Firm Performance 0.6567*** 1.1575*** (3.22) (5.77) Top5*Firm Performance 0.0622*** 0.117*** (3.59) (6.76) Activist*Firm Performance 0.0503 0.1379*** (1.52) (4.26) Passivist*Firm Performance 0.0704*** 0.1048*** (3.03) (4.56) Lag1 Firm Performance -0.0517*** -0.0472*** -0.0468*** -0.0045*** -0.0035*** -0.0034*** (-3.19) (-3.12) (-3.07) (-4.31) (-3.39) (-3.3) Change Business Segments 0.0029 0.0031 0.0031 0.0019 0.0019 0.0019 (1.06) (1.11) (1.13) (0.69) (0.7) (0.69) Retire Dummy -0.0401*** -0.0393*** -0.0393*** -0.0414*** -0.0409*** -0.0409*** (-7.59) (-7.49) (-7.49) (-7.82) (-7.76) (-7.76) New CEO Dummy 0.0018 0.0016 0.0016 0.0027 0.0026 0.0027 (0.31) (0.28) (0.27) (0.46) (0.45) (0.46) Lag1 Log Market Capitalization 0.0176*** 0.0194*** 0.0194*** 0.0195*** 0.0216*** 0.0215*** (13.15) (14.28) (14.29) (14.39) (15.71) (15.68) Observations 6786 6786 6786 6711 6711 6711 R-Sq 0.1019 0.1095 0.11 0.1078 0.1164 0.1168 Wald F-Statistic for Difference from Zero 35.39 82.81 50.87 54.36 105.88 70.88 (0) (0) (0) (0) (0) (0) 57.41 70.79 (0) (0)
1.57 3.02 Wald F-Statistic for equality of Potentially Active versus Potentially Passive Ownership (0.21) (0.08)

62
Table XXIII
Scope of Operations Hypothesis: Board Size as a Function of Institutional Influence This table models the board size and the proportion of the board that are independent directors as a function of institutional investor influence. The Scope of Operations hypothesis is taken into account by interacting the hypothesis variables with the institutional influence variables. The hypothesis variables are firm size dummy, number of business segments dummy and the debt ratio dummy. Coefficients for year and industry controls are not presented. Heteroskedastic-consistent t-statistics are presented in parentheses below each coefficient. One, two and three asterisks denote significance at 10, 5 and 1 percent levels. (1) (2) (3)
Hefindahl Top5 Active/Passive Herfindahl Top5 t -1 1.1541 (1.5) Top5 Ownership t -1 0.2629** (2.24) Potentially Activist t -1 -0.0291 (-0.22) Potentially Passivist t -1 0.3751*** (3.14) Herfindahl Top5 t -1 * Sales t -1 -0.247** (-2.22) Top5 Ownershipt -1 * Sales t -1 -0.0495*** (-2.95) Potentially Activist t -1 * Sales t -1 -0.0199 (-1.02) Potentially Passivist t -1 * Sales t -1 -0.0563*** (-3.33) Herfindahl Top5 t -1 * No. Business Segments t -1 0.2394*** (2.93) Top5 Ownershipt -1 * No. Business Segments t -1 0.0299*** (2.58) Potentially Activist t -1 * No. Business Segments t -1 0.0408** (2.34) Potentially Passivist t -1 * No. Business Segments t -1 0.0201 (1.62) Herfindahl Top5 t -1 * Debt Ratio t -1 -0.9918 (-0.82) Top5 Ownershipt -1 * Debt Ratio t -1 -0.0983 (-0.53) Potentially Activist t -1 * Debt Ratio t -1 0.1824 (0.85) Potentially Passivist t -1 * Debt Ratio t -1 -0.1765 (-0.93) Sales t -1 0.0465*** 0.0541*** 0.0505*** (10.17) (9.33) (8.63) No. Business Segments t -1 -0.0045** -0.0075** -0.0052* (-2.41) (-2.52) (-1.66) Debt Ratio t -1 -0.0326 -0.0252 -0.048 (-0.92) (-0.45) (-0.86) Other controls Yes Yes Yes Year dummies Yes Yes Yes Industry dummies Yes Yes Yes Observations 9031 9031 9031 Overall R2 0.3089 0.3099 0.3107 Wald F-Statistic for equality of Institutional Influence 0.01 0.5 0.54 0.9081 0.4799 0.4634 0.61 0.4353 Wald F-Statistic for equality of Active v Passive 0.01 0.9393
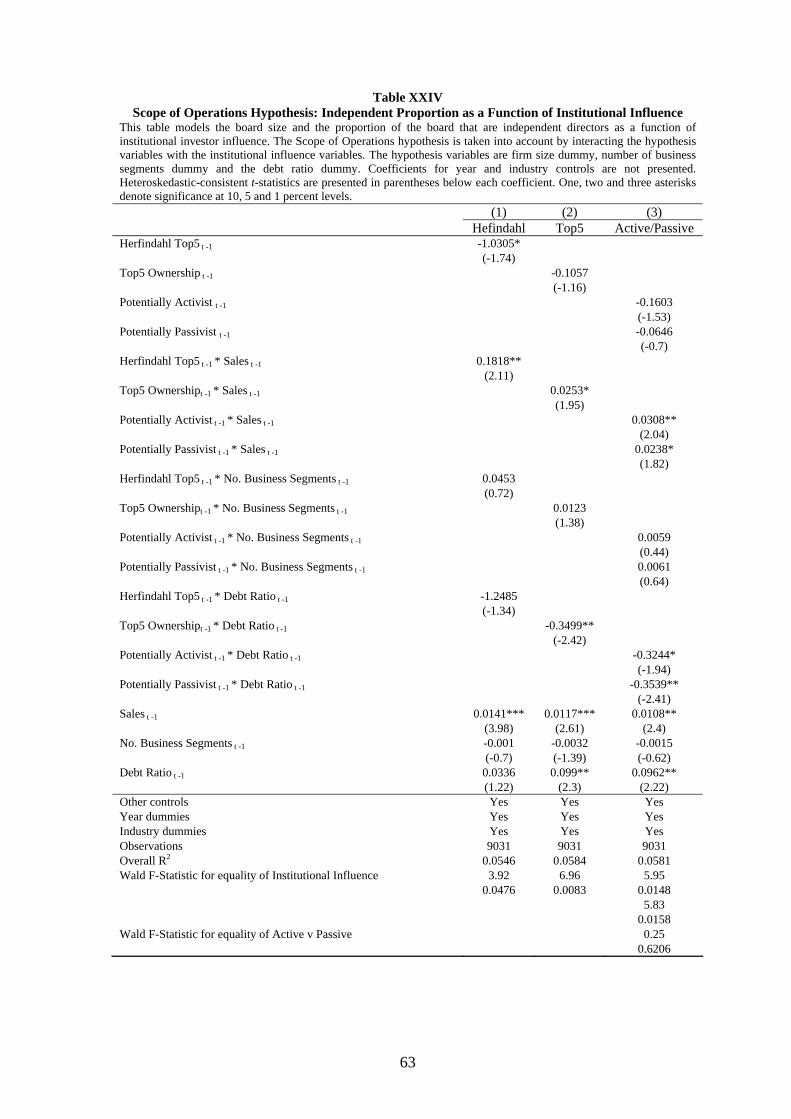
63
Table XXIV Scope of Operations Hypothesis: Independent Proportion as a Function of Institutional Influence
This table models the board size and the proportion of the board that are independent directors as a function of institutional investor influence. The Scope of Operations hypothesis is taken into account by interacting the hypothesis variables with the institutional influence variables. The hypothesis variables are firm size dummy, number of business segments dummy and the debt ratio dummy. Coefficients for year and industry controls are not presented. Heteroskedastic-consistent t-statistics are presented in parentheses below each coefficient. One, two and three asterisks denote significance at 10, 5 and 1 percent levels. (1) (2) (3)
Hefindahl Top5 Active/Passive Herfindahl Top5 t -1 -1.0305* (-1.74) Top5 Ownership t -1 -0.1057 (-1.16) Potentially Activist t -1 -0.1603 (-1.53) Potentially Passivist t -1 -0.0646 (-0.7) Herfindahl Top5 t -1 * Sales t -1 0.1818** (2.11) Top5 Ownershipt -1 * Sales t -1 0.0253* (1.95) Potentially Activist t -1 * Sales t -1 0.0308** (2.04) Potentially Passivist t -1 * Sales t -1 0.0238* (1.82) Herfindahl Top5 t -1 * No. Business Segments t -1 0.0453 (0.72) Top5 Ownershipt -1 * No. Business Segments t -1 0.0123 (1.38) Potentially Activist t -1 * No. Business Segments t -1 0.0059 (0.44) Potentially Passivist t -1 * No. Business Segments t -1 0.0061 (0.64) Herfindahl Top5 t -1 * Debt Ratio t -1 -1.2485 (-1.34) Top5 Ownershipt -1 * Debt Ratio t -1 -0.3499** (-2.42) Potentially Activist t -1 * Debt Ratio t -1 -0.3244* (-1.94) Potentially Passivist t -1 * Debt Ratio t -1 -0.3539** (-2.41) Sales t -1 0.0141*** 0.0117*** 0.0108** (3.98) (2.61) (2.4) No. Business Segments t -1 -0.001 -0.0032 -0.0015 (-0.7) (-1.39) (-0.62) Debt Ratio t -1 0.0336 0.099** 0.0962** (1.22) (2.3) (2.22) Other controls Yes Yes Yes Year dummies Yes Yes Yes Industry dummies Yes Yes Yes Observations 9031 9031 9031 Overall R2 0.0546 0.0584 0.0581 Wald F-Statistic for equality of Institutional Influence 3.92 6.96 5.95 0.0476 0.0083 0.0148 5.83 0.0158 Wald F-Statistic for equality of Active v Passive 0.25 0.6206
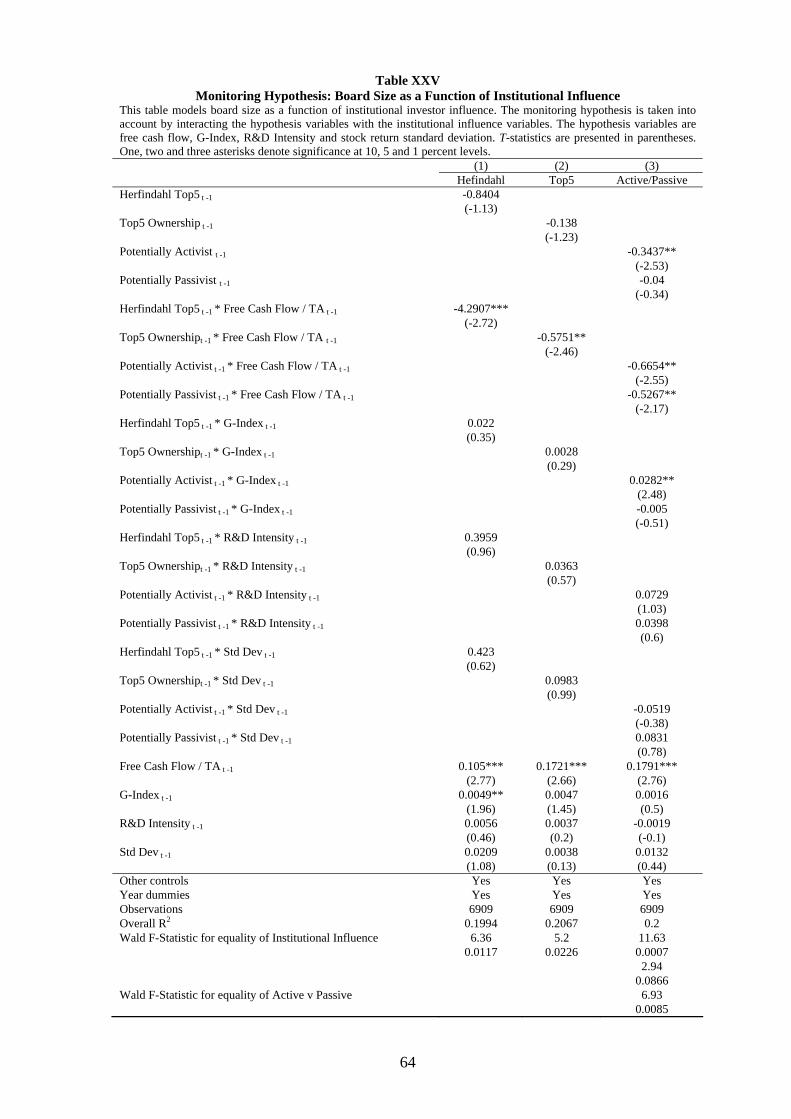
64
Table XXV Monitoring Hypothesis: Board Size as a Function of Institutional Influence
This table models board size as a function of institutional investor influence. The monitoring hypothesis is taken into account by interacting the hypothesis variables with the institutional influence variables. The hypothesis variables are free cash flow, G-Index, R&D Intensity and stock return standard deviation. T-statistics are presented in parentheses. One, two and three asterisks denote significance at 10, 5 and 1 percent levels. (1) (2) (3)
Hefindahl Top5 Active/PassiveHerfindahl Top5 t -1 -0.8404 (-1.13) Top5 Ownership t -1 -0.138 (-1.23) Potentially Activist t -1 -0.3437** (-2.53) Potentially Passivist t -1 -0.04 (-0.34) Herfindahl Top5 t -1 * Free Cash Flow / TA t -1 -4.2907*** (-2.72) Top5 Ownershipt -1 * Free Cash Flow / TA t -1 -0.5751** (-2.46) Potentially Activist t -1 * Free Cash Flow / TA t -1 -0.6654** (-2.55) Potentially Passivist t -1 * Free Cash Flow / TA t -1 -0.5267** (-2.17) Herfindahl Top5 t -1 * G-Index t -1 0.022 (0.35) Top5 Ownershipt -1 * G-Index t -1 0.0028 (0.29) Potentially Activist t -1 * G-Index t -1 0.0282** (2.48) Potentially Passivist t -1 * G-Index t -1 -0.005 (-0.51) Herfindahl Top5 t -1 * R&D Intensity t -1 0.3959 (0.96) Top5 Ownershipt -1 * R&D Intensity t -1 0.0363 (0.57) Potentially Activist t -1 * R&D Intensity t -1 0.0729 (1.03) Potentially Passivist t -1 * R&D Intensity t -1 0.0398 (0.6) Herfindahl Top5 t -1 * Std Dev t -1 0.423 (0.62) Top5 Ownershipt -1 * Std Dev t -1 0.0983 (0.99) Potentially Activist t -1 * Std Dev t -1 -0.0519 (-0.38) Potentially Passivist t -1 * Std Dev t -1 0.0831 (0.78) Free Cash Flow / TA t -1 0.105*** 0.1721*** 0.1791*** (2.77) (2.66) (2.76) G-Index t -1 0.0049** 0.0047 0.0016 (1.96) (1.45) (0.5) R&D Intensity t -1 0.0056 0.0037 -0.0019 (0.46) (0.2) (-0.1) Std Dev t -1 0.0209 0.0038 0.0132 (1.08) (0.13) (0.44) Other controls Yes Yes YesYear dummies Yes Yes Yes Observations 6909 6909 6909 Overall R2 0.1994 0.2067 0.2 Wald F-Statistic for equality of Institutional Influence 6.36 5.2 11.63 0.0117 0.0226 0.0007 2.94 0.0866 Wald F-Statistic for equality of Active v Passive 6.93 0.0085
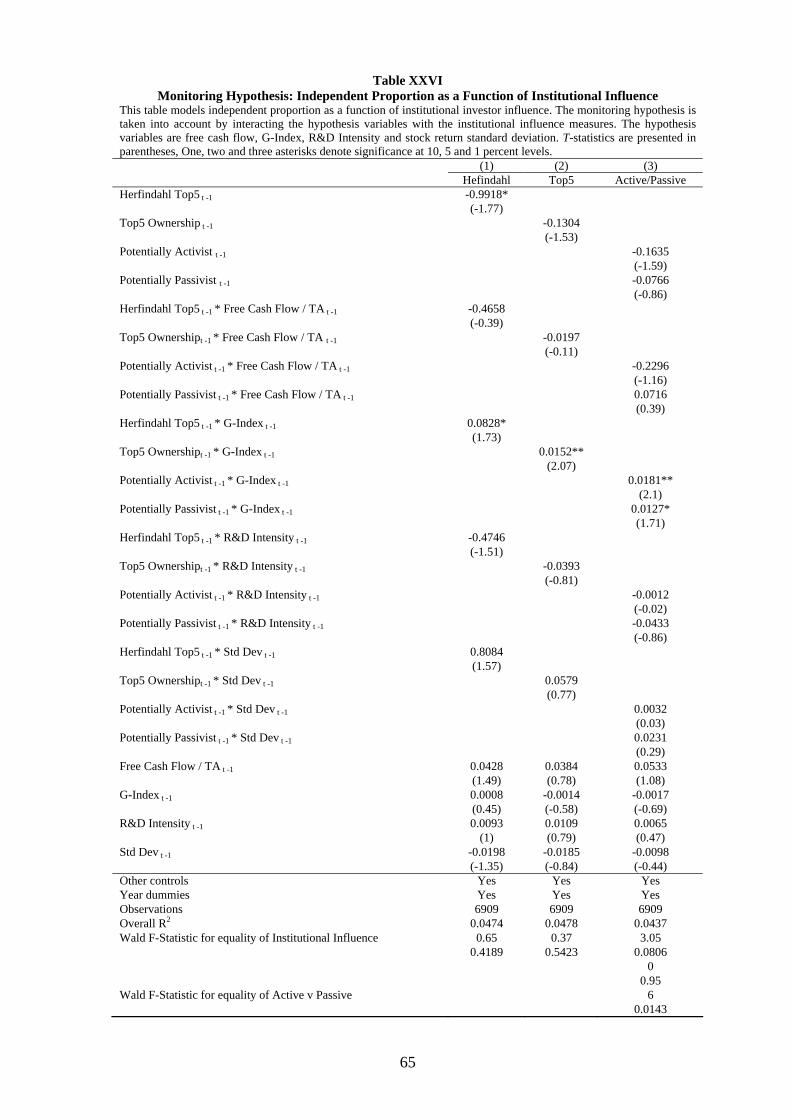
65
Table XXVI Monitoring Hypothesis: Independent Proportion as a Function of Institutional Influence
This table models independent proportion as a function of institutional investor influence. The monitoring hypothesis is taken into account by interacting the hypothesis variables with the institutional influence measures. The hypothesis variables are free cash flow, G-Index, R&D Intensity and stock return standard deviation. T-statistics are presented in parentheses, One, two and three asterisks denote significance at 10, 5 and 1 percent levels. (1) (2) (3)
Hefindahl Top5 Active/PassiveHerfindahl Top5 t -1 -0.9918* (-1.77) Top5 Ownership t -1 -0.1304 (-1.53) Potentially Activist t -1 -0.1635 (-1.59) Potentially Passivist t -1 -0.0766 (-0.86) Herfindahl Top5 t -1 * Free Cash Flow / TA t -1 -0.4658 (-0.39) Top5 Ownershipt -1 * Free Cash Flow / TA t -1 -0.0197 (-0.11) Potentially Activist t -1 * Free Cash Flow / TA t -1 -0.2296 (-1.16) Potentially Passivist t -1 * Free Cash Flow / TA t -1 0.0716 (0.39) Herfindahl Top5 t -1 * G-Index t -1 0.0828* (1.73) Top5 Ownershipt -1 * G-Index t -1 0.0152** (2.07) Potentially Activist t -1 * G-Index t -1 0.0181** (2.1) Potentially Passivist t -1 * G-Index t -1 0.0127* (1.71) Herfindahl Top5 t -1 * R&D Intensity t -1 -0.4746 (-1.51) Top5 Ownershipt -1 * R&D Intensity t -1 -0.0393 (-0.81) Potentially Activist t -1 * R&D Intensity t -1 -0.0012 (-0.02) Potentially Passivist t -1 * R&D Intensity t -1 -0.0433 (-0.86) Herfindahl Top5 t -1 * Std Dev t -1 0.8084 (1.57) Top5 Ownershipt -1 * Std Dev t -1 0.0579 (0.77) Potentially Activist t -1 * Std Dev t -1 0.0032 (0.03) Potentially Passivist t -1 * Std Dev t -1 0.0231 (0.29) Free Cash Flow / TA t -1 0.0428 0.0384 0.0533 (1.49) (0.78) (1.08) G-Index t -1 0.0008 -0.0014 -0.0017 (0.45) (-0.58) (-0.69) R&D Intensity t -1 0.0093 0.0109 0.0065 (1) (0.79) (0.47) Std Dev t -1 -0.0198 -0.0185 -0.0098 (-1.35) (-0.84) (-0.44) Other controls Yes Yes YesYear dummies Yes Yes Yes Observations 6909 6909 6909 Overall R2 0.0474 0.0478 0.0437 Wald F-Statistic for equality of Institutional Influence 0.65 0.37 3.05 0.4189 0.5423 0.0806 0 0.95 Wald F-Statistic for equality of Active v Passive 6 0.0143
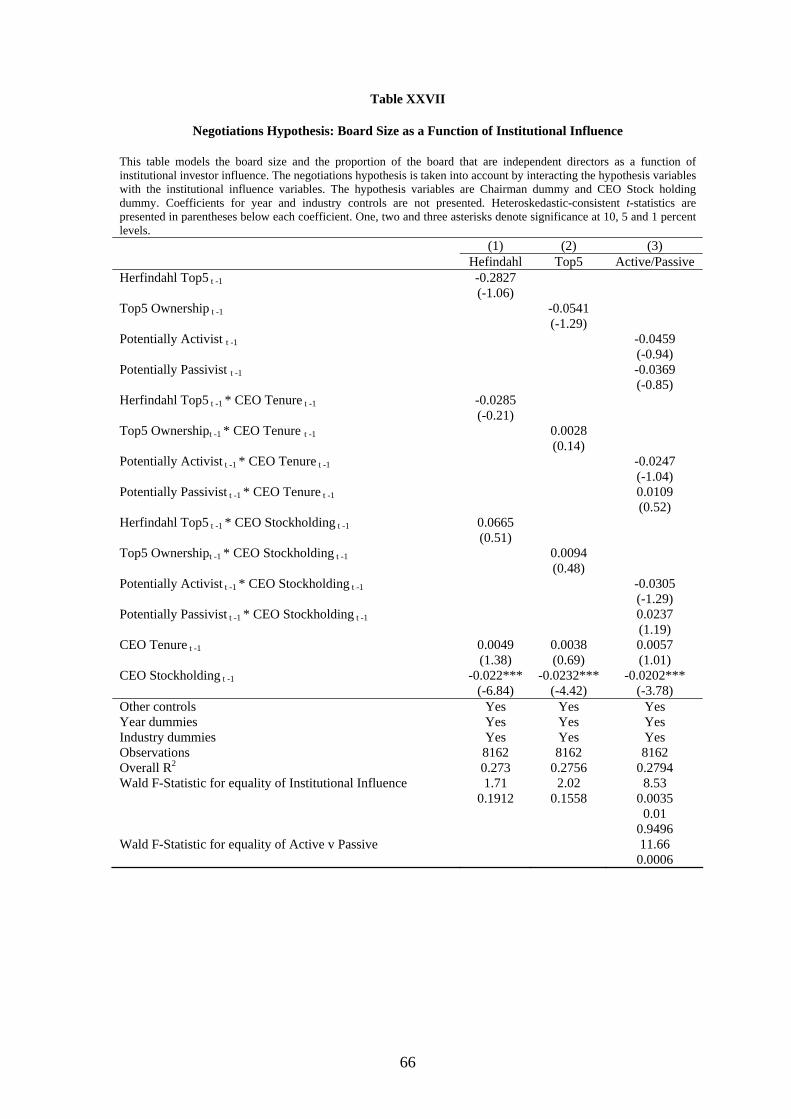
66
Table XXVII
Negotiations Hypothesis: Board Size as a Function of Institutional Influence
This table models the board size and the proportion of the board that are independent directors as a function of institutional investor influence. The negotiations hypothesis is taken into account by interacting the hypothesis variables with the institutional influence variables. The hypothesis variables are Chairman dummy and CEO Stock holding dummy. Coefficients for year and industry controls are not presented. Heteroskedastic-consistent t-statistics are presented in parentheses below each coefficient. One, two and three asterisks denote significance at 10, 5 and 1 percent levels. (1) (2) (3)
Hefindahl Top5 Active/Passive Herfindahl Top5 t -1 -0.2827 (-1.06) Top5 Ownership t -1 -0.0541 (-1.29) Potentially Activist t -1 -0.0459 (-0.94) Potentially Passivist t -1 -0.0369 (-0.85) Herfindahl Top5 t -1 * CEO Tenure t -1 -0.0285 (-0.21) Top5 Ownershipt -1 * CEO Tenure t -1 0.0028 (0.14) Potentially Activist t -1 * CEO Tenure t -1 -0.0247 (-1.04) Potentially Passivist t -1 * CEO Tenure t -1 0.0109 (0.52) Herfindahl Top5 t -1 * CEO Stockholding t -1 0.0665 (0.51) Top5 Ownershipt -1 * CEO Stockholding t -1 0.0094 (0.48) Potentially Activist t -1 * CEO Stockholding t -1 -0.0305 (-1.29) Potentially Passivist t -1 * CEO Stockholding t -1 0.0237 (1.19) CEO Tenure t -1 0.0049 0.0038 0.0057 (1.38) (0.69) (1.01) CEO Stockholding t -1 -0.022*** -0.0232*** -0.0202*** (-6.84) (-4.42) (-3.78) Other controls Yes Yes Yes Year dummies Yes Yes Yes Industry dummies Yes Yes Yes Observations 8162 8162 8162 Overall R2 0.273 0.2756 0.2794 Wald F-Statistic for equality of Institutional Influence 1.71 2.02 8.53 0.1912 0.1558 0.0035 0.01 0.9496 Wald F-Statistic for equality of Active v Passive 11.66 0.0006
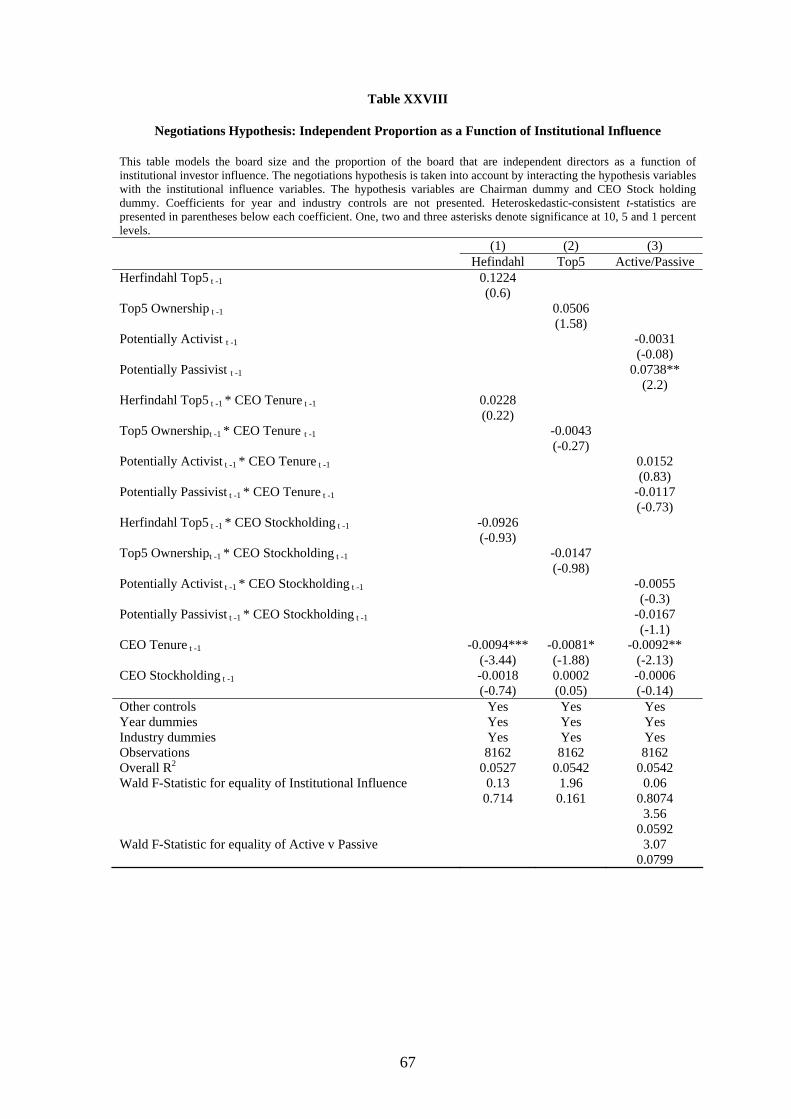
67
Table XXVIII
Negotiations Hypothesis: Independent Proportion as a Function of Institutional Influence
This table models the board size and the proportion of the board that are independent directors as a function of institutional investor influence. The negotiations hypothesis is taken into account by interacting the hypothesis variables with the institutional influence variables. The hypothesis variables are Chairman dummy and CEO Stock holding dummy. Coefficients for year and industry controls are not presented. Heteroskedastic-consistent t-statistics are presented in parentheses below each coefficient. One, two and three asterisks denote significance at 10, 5 and 1 percent levels. (1) (2) (3)
Hefindahl Top5 Active/Passive Herfindahl Top5 t -1 0.1224 (0.6) Top5 Ownership t -1 0.0506 (1.58) Potentially Activist t -1 -0.0031 (-0.08) Potentially Passivist t -1 0.0738** (2.2) Herfindahl Top5 t -1 * CEO Tenure t -1 0.0228 (0.22) Top5 Ownershipt -1 * CEO Tenure t -1 -0.0043 (-0.27) Potentially Activist t -1 * CEO Tenure t -1 0.0152 (0.83) Potentially Passivist t -1 * CEO Tenure t -1 -0.0117 (-0.73) Herfindahl Top5 t -1 * CEO Stockholding t -1 -0.0926 (-0.93) Top5 Ownershipt -1 * CEO Stockholding t -1 -0.0147 (-0.98) Potentially Activist t -1 * CEO Stockholding t -1 -0.0055 (-0.3) Potentially Passivist t -1 * CEO Stockholding t -1 -0.0167 (-1.1) CEO Tenure t -1 -0.0094*** -0.0081* -0.0092** (-3.44) (-1.88) (-2.13) CEO Stockholding t -1 -0.0018 0.0002 -0.0006 (-0.74) (0.05) (-0.14) Other controls Yes Yes Yes Year dummies Yes Yes Yes Industry dummies Yes Yes Yes Observations 8162 8162 8162 Overall R2 0.0527 0.0542 0.0542 Wald F-Statistic for equality of Institutional Influence 0.13 1.96 0.06 0.714 0.161 0.8074 3.56 0.0592 Wald F-Statistic for equality of Active v Passive 3.07 0.0799