
Institutional Environment, Economic Performance and Innovation in Turkey
54
METU TEKPOL SCIENCE AND TECHNOLOGY POLICIES RESEARCH CENTER TEKPOL Working Paper Series STPS-WP-13/03 Institutional Environment, Economic Performance and Innovation in Turkey Erkan ERDİL, Teoman PAMUKÇU and Dilek ÇETİN TEKPOL | Science and Technology Policies Research Center Middle East Technical University Ankara 06531 Turkey http://www.stps.metu.edu.tr
-
Upload
suleyman-demirel -
Category
Documents
-
view
5 -
download
0
Transcript of Institutional Environment, Economic Performance and Innovation in Turkey
METUTEKPOL
SCIENCE AND TECHNOLOGY POLICIES RESEARCH CENTER TEKPOL Working Paper Series STPS-WP-13/03
Institutional Environment, Economic Performance and Innovation in Turkey
Erkan ERDİL, Teoman PAMUKÇU and Dilek ÇETİN
TEKPOL | Science and Technology Policies Research CenterMiddle East Technical UniversityAnkara 06531 Turkeyhttp://www.stps.metu.edu.tr
1
Institutional Environment, Economic Performance and Innovation in Turkey1
Erkan Erdil, Teoman Pamukçu and Dilek Çetin
Science and Technology Policies Research Center (METU-‐TEKPOL)
Middle East Technical University, Dumlupinar Bulvari 06800 Ankara Turkey Tel: +903122103082 Fax: +903122107964 E-‐mail: [email protected] and [email protected]
Abstract This paper investigates the relationship between economic performance and innovation in Turkey, while also taking into account the crucial mediating effect of the institutional environment. We carry out an in-‐depth analysis of the recent shifts in STI policy making in Turkey. The emphasis is on the innovation support policy instruments, and their effectiveness, as well as on the formulation of national STI targets, sector priorities and targets in the field of human resources. A number of concerns are expressed for the effectiveness of policy instruments and for the attainability of national STI targets. In the second part using firm-‐level data from an innovation survey pertaining to 2008-‐2010, an econometric exercise is conducted in order to test for the effectiveness of innovation support in Turkey. Innovation support is treated alternatively as an exogenous and endogenous variable. Findings indicate a positive impact innovation support in general. Innovation support granted by local authorities is not effective while EU-‐funded projects lead to innovation although they constitute an extremely low share of total innovation supports.
Keywords Institutional Environment, Science, Technology, Innovation, Economic Performance, CDM Model, Turkey JEL Classification O1, O31, O38, B23
1 Research funded by the EU Commission FP7 project SEARCH, Sharing Knowledge Assets: Interregionally cohesive neighbourhoods
2
1. INTRODUCTION
Turkish economy ranks 18th in the 2011 list of world economies with $774,983m (€598,997m2) of
total Gross Domestic Product for current prices (IMF, 2012)3. The country has a population of 74.7m4
(TURKSTAT, 2012), would be accounting for 14.87% of the population of the EU-‐27 (EUROSTAT,
2012)5. 67.4% of the population are between 15-‐64 years of age and half is younger than 29.7. The
gross domestic product (GDP) per capita in 2011 was €7,137 (TL17,553).6 While the annual average
growth rate was 4.2% between 2009 and 2011 in real terms, Turkey achieved a GDP growth of 8.5%
in 2011 with constant prices (The GDP realised in the first three quarters of 2012 was €37,732m
(TL87,655m) with a growth rate of 2.6% (TURKSTAT, 2012).7
The R&D intensity in Turkey was 0.86% in 20118 (TURKSTAT, 2012). While it is below the EU-‐27
average of 2.03% (EUROSTAT, 2012)9, the gross expenditure on R&D increased by 20.4% compared to
previous year. According to TURKSTAT, 45.8% of R&D expenditures were financed by business
enterprises, 29.2% by government sector, 20.8% by higher education sector, 3.4% by other national
sector and 0.7% by foreign funds in 2011.10 The Business Expenditure on Research and Development
(BERD) undertaken in Turkey in 2011 was €1,958.8m (TL4,817.3m).11 It was increased by 58%12 in real
terms since 2008. In 2011, the Higher Education R&D (HERD) was €2,063m (TL5,073.4m). This
represents an increase of €835m (TL2,053m) since 2008 (a 68% increase in real terms). Government
Expenditure on R&D (GOVERD) stood at €429m (TL1,263.5m) in 2011 representing an increase of
€100m (TL247m) since 2008 (a 30% increase in real terms) (TUBITAK, 2012). The government
earmarked an amount of €1.2b13 (TL2.8b) for funding R&D in 201314. The number of full-‐time
equivalent (FTE) R&D personnel increased to 92,801 in 2011 from 67,244 in 2008, according to
2 €1=$1.2938 (Central Bank of Turkey’s effective sale rate for 30.11.2011) 3 http://www.imf.org/external/pubs/ft/weo/2012/02/weodata/index.aspx 4 http://www.turkstat.gov.tr/PreHaberBultenleri.do?id=10736 5 http://epp.eurostat.ec.europa.eu/portal/page/portal/population/data/main_tables 6 At 1998 prices, €1=TL2.4593 (Central Bank of Turkey’s effective sale rate for 30.12.2011) http://www.tuik.gov.tr/PreIstatistikTablo.do?istab_id=1221 7 Constant prices, €1=TL2.3231 (Central Bank of Turkey’s effective sale rate for 28.09.2012) http://www.turkstat.gov.tr/PreHaberBultenleri.do?id=10955 8 http://www.turkstat.gov.tr/PreHaberBultenleri.do?id=10931 9 http://epp.eurostat.ec.europa.eu/portal/page/portal/science_technology_innovation/data/main_tables 10 http://www.turkstat.gov.tr/HbGetir.do?id=10931&tb_id=2 11 €1=TL2.4593 (Central Bank of Turkey’s effective sale rate for 30.12.2011) 12 www.tuik.gov.tr/PreIstatistikTablo.do?istab_id=1 13 €1=TL2.3363 (Central Bank of Turkey’s effective sale rate for 30.10.2012) 14 http://www.tbmm.gov.tr/butce/2013/konusma_30_Ekim_2012.pdf
3
TURKSTAT.15 The private sector employs 45,408 FTE R&D staff and universities employ 35,644 FTE
R&D personnel while 11,749 FTE R&D personnel are employed by the public sector.
The main changes in the research and innovation system in 2011 that still have impacts in 2012 were
the reorganisation of three key ministries: The Ministry of Science, Industry and Technology (MoSIT)
replaced the former Ministry of Industry and Trade after the elections in June 2011. The science,
technology and innovation-‐related duties of the MoSIT are defined as the development,
implementation and coordination of the S&T and innovation policies, and the promotion of the R&D
and innovation projects, activities and investments. The Ministry of Development (MoD) replaced the
former State Planning Organisation and is responsible for providing advice to the government and
preparing national plans, policies, strategies and programmes, and coordinating regional
development agencies, among other things. The newly created Ministry of Economy (MoE) is
responsible for developing and implementing of foreign trade and foreign direct investment policies,
and investment incentives, among others. These ministries along with the other high-‐level bodies in
the national innovation system are represented in the Supreme Council of Science and Technology
(BTYK), which is responsible for the overall coordination of the national innovation policy.
National R&D targets of Turkey for 2023 were agreed by the BTYK on 27 December 2011. These are
as follows:
- Achieving an R&D intensity of 3% (from 0.84% in 2010)
- Increasing business R&D expenditure as a percentage of GDP to 2% (from 0.36% in 2010)
- Increasing the number of FTE researchers to 300,000 (from 64,341 in 2010)
- Increasing the number of FTE researchers in the private sector to 180,000 (from 25,342 in
2010).
The National Science, Technology and Innovation Strategy 2011-‐2016 adopted in December 2010 by
the BTYK focuses on human resources development for science, technology and innovation,
transformation of research outputs into products and services, enhancing interdisciplinary research,
highlighting the role of SMEs, R&D infrastructures and international cooperation. It also identifies
automotive, machinery and production technologies, ICT, energy, water, food, security and space as
focus areas. In line with this, the strategy puts special emphasis on keeping the balance between
focused areas and bottom-‐up research (TUBITAK, 2010 and IUC, 2011).
15 http://www.turkstat.gov.tr/HbGetir.do?id=10931&tb_id=3
4
In addition to the National Science, Technology and Innovation Strategy 2011-‐2016, at the BTYK
meeting in December 2011, the following new items were identified for the improvement of the
research and innovation performance of the country:16
- Setting up a coordination board to secure integration, coherence and target-‐oriented approach
in R&D, innovation and entrepreneurship support mechanisms;
- Developing policy tools to activate and increase the number of R&D intensive start-‐ups;
- Developing policy tools to trigger innovation and entrepreneurship in universities;
- Promoting entrepreneurship culture;
- Improving public procurement and public right of use in such a way to foster innovation,
localisation and technology transfer;
- Promoting science centres;
- Developing policy tools to stimulate domestic patent licensing.
In accordance with The National Science, Technology and Innovation Strategy 2011-‐2016 and
decisions taken in December 2011, in the 24th meeting of BTYK in August 2012, the new decisions
mainly directed towards increasing the quality of educational infrastructure. In the 25th meeting of
BTYK in January 2013, six new decisions mainly on the e-‐government infrastructure have been taken.
Moreover, in this meeting, it is decided to include health as an S&T priority area
Based on the key indicators and issues, the following challenges are identified for Turkey:
- Promoting research commercialisation from universities
- Increasing the number of innovative high-‐growth start-‐ups
- Increasing R&D and innovation capabilities of the private sector (in particular, micro, small and
medium enterprises (MSMEs))
- Focusing on sectors and thematic areas of importance
- Increasing availability and quality of research personnel
In Turkish R&D and innovation policy, there is a clear shift from horizontal focus to sectoral focus.
Another remarkable shift is the move from research to innovation. In general research and
innovation started to play more important role in the overall national/regional policy mix and there is
16http://www.tubitak.gov.tr/tr/kurumsal/bilim-‐ve-‐teknoloji-‐yuksek-‐kurulu/toplantilar/icerik-‐bilim-‐ve-‐teknoloji-‐yuksek-‐kurulu-‐23toplantisi-‐27-‐aralik-‐2011

5
now an increased commitment to develop and implement strategic, coherent and integrated policy
framework.
The process of the harmonisation with the EU acquis contributes to above efforts, as it did so far.
Although not a Member State yet, Turkey’s strategies and efforts in the field S&T and innovation are,
to a large extend, in line with the ERA pillars/objectives. In addition, R&D objectives of Turkey are in
parallel with the ERA targets. The ERA developments have been closely followed by the policy-‐
makers and the BTYK launched the “Turkish Research Area” (TARAL) in 2004 with inspiration from the
ERA.
For the short and medium term, it is important that innovation is placed at the heart of the
development and growth process, and is integrated and embedded in each policy area. It is expected
that the new governance system and existing high-‐level commitment for achieving the new targets
set for 2023 will contribute to the enrichment of the policy mix with the design and implementation
of new instruments.
2. THEORETICAL BACKGROUND
Like many other developing countries, Turkey pursued an import substitution based development
strategy from the early 1960s to the year 1980, when this strategy was abandoned. During this
period, science and technology policies implemented were strongly influenced by the characteristics
of this strategy (Katz, 1994; Rath, 1994): indeed, when it came to provide public support to
technological activities of firms the focus was solely on the supply side of the R&D process, with the
government determining which kind of R&D activities to support and how to support them. Besides a
low level of direct public funding of business R&D, the promotion of business R&D activities was
achieved mainly by the exemption from import duties of and accelerated depreciation of capital
goods used in R&D laboratories. The two basic assumptions behind these policies related to the
supposedly linear nature of the innovation process (from basic research to applied research to
commercialization of new products, excluding any interactions and feedback between the different
stages of this process) and the existence of knowledge only in codified form. This conceptualization
of technology led also to the creation of a public infrastructure for scientific and technological
research by the State consisting mainly of public research institutes and laboratories, and university
labs which were supposed to create and transfer new knowledge to business sector. Little or no
consideration was made for the demand side of new technology creation and utilization, taking little
or no account of the needs of firms in this field.
The abandon of import substitution-‐based industrialization in the developing world in the 1980s and
the concomitant adoption of more outward economic policies changed radically science and
6
technology policies therein (Hall and Maffioli, 2008). Indeed, a demand-‐driven approach substituted
the previous supply-‐driven one and led to the funding of exclusively projects prepared and submitted
by final users. Therefore, demand of the beneficiary (firms) has since determined priorities in the
field of innovation and the allocation of resources to innovative activities. The main funding
instrument of the post-‐1980 period has been direct subsidies to firms which are non reimbursable
and matching grants and for which the beneficiary is required to participate in the financing of
eligible projects – in other word, total project cost is not covered (co-‐financing principle).
Another major characteristic of innovation polices of the post-‐1980 period was the initial neutral
character of these policies and their later evolution to targeted or selective policies (Teubal, 1996;
Lall and Teubal, 1998). The initial non-‐discrimination was justified by the need to not to interfere with
the market allocation of resources and provide important and flexible support to innovation activities
in order to facilitate their routinization in the business sector initially. More targeted and strict
criteria were to be applied in the subsequent mature stage. In addition, no competition between
firms existed for the allocation of resources but later more competitive mechanisms were adopted –
such as call for innovation project proposals.
The case for government support for innovation can be built both on the findings of mainstream
economic theory and on the evolutionary approach. Starting with the former, innovation activity is
related to several sources of market failure: inability to assign and protect property rights,
information asymmetry and risk aversion.
The outcome of innovation efforts might be hard to appropriate. Although the system of intellectual
property rights offers some protection, it is usually quite expensive to use 17 and secrecy might be
hard to keep, given the modern means of communication, the reliance on team-‐work in research and
the professional mobility of skilled workers and researchers. Some discoveries are commercially
applied only after a longer period of time and not necessarily in the kind of product (or even the kind
of industry) they were initially expected to support. These factors discourage innovation, unless a
firm has a long-‐term technology strategy, a considerable budget for patent protection, and ideally, a
variety of products in its portfolio.
External funding is another problem for a firm willing to engage in R&D activities. The inherent
innovation asymmetry makes it hard for the investor to assess the usefulness of a given project and
to monitor the adequacy of a firm’s efforts. A possible consequence is thus a ‘funding gap’ (Hall, 17 According to the estimates by van Pottelsberghe i Meyer, the average cost of obtaining a patent In 2008 was about 2000 USD in the USA, while in Europe it was between 17000 USD and 35000 USD (in purchasing Power parity), depending on the country scope of protection van Bruno Pottelsberghe 2008 .
7
Lerner 2010). Information asymmetry can result in credit rationing , i.e. a complicated and hard to
use procedure for accessing the capital by innovative firms, to avoid the negative phenomena of
adverse selection (attracting bad R&D projects) and moral hazard (inefficient work or excessively
risky projects), cf. (Tirole 2005).
Like other market failures the ‘funding gap’ problems can be amended by market forces itself, in this
case by actors such as venture capital firms or so-‐called angel investors (Goldberg, Goddard 2011).
However this is more likely to mitigate the problem in developed countries, with strong innovation
sectors. The evolutionary approach in the economics of innovation has developed further arguments
in support of government aid for innovating companies (Metcalfe 1995). Here the key concept is that
of technology capabilities of firms (Pavitt 1990), i.e. their ability to adapt, create and commercially
exploit new technologies, and that of the system of innovation (Edquist, 2006). From this point of
view the development of new technologies is to a smaller extent a reflection of a competitive
equilibrium than it is a result of processes of variety generation and selection. The role of technology
policy is to facilitate these processes by enhancing firms’ technology capabilities, supporting co-‐
operation in the system and preventing the phenomenon of lock-‐in, among other things (Metcalfe
1994).
3. TURKISH NATIONAL INNOVATION SYSTEM
3.1 National Research and Innovation Priorities
The BTYK approved the National Science, Technology and Innovation Strategy (2011-‐2016) on 15
December 2010. The continuation of the pace of the improvement of R&D and innovation capacity
achieved through the National Science and Technology Policies Implementation Plan for 2005-‐2010
have been one of the main motives behind the new strategies. The strategies aim at disseminating
culture of multilateral and multidisciplinary R&D and innovation cooperation, stimulating sectoral
and regional R&D and innovations dynamics, encouraging SMEs to become stronger actors within the
national innovation system, and enhancing the contribution of research infrastructures to the
knowledge creation capacity of the Turkish Research Area (TARAL)18.
As explained by TUBITAK, in order to meet these aims, mission oriented approaches in areas with
strong RDI capacity, need-‐oriented approaches in areas with a demand for gaining acceleration, and
bottom-‐up approaches including basic, applied and frontier research are identified under the new
18 http://www.tubitak.gov.tr/sid/2415/pid/2400/index.htm
8
strategy, and the strategic framework has been set in such a way that it comprises of three vertical
axes and six horizontal axes that cross-‐cuts the vertical ones (Figure 1).
The National Science, Technology and Innovation Strategy (2011-‐2016) define the following strategic
areas to focus for increased science, technology and innovation performance:
- Target-‐oriented approaches in the areas where Turkey has R8D and innovation capacities;
- Demand-‐oriented approaches where further R&D and innovation efforts are needed;
- Bottom-‐up approaches (including basic, applied and frontier research).
- The cross-‐cutting objectives for these three areas are set as follows:
- Developing human resources for science, technology and innovation;
- Stimulating the transformation of research results into commercial products and services;
- Diffusing a multi-‐actor and multi-‐discipline R&D cooperation culture;
- Strengthening the role of SMEs within the national innovation system (NIS);
- Increasing the contribution of R&D infrastructures to knowledge production of the Turkish
Research Area (TARAL);
- Activating international science, technology and innovation cooperation for the benefit of the
country.
Moreover, the national R&D targets of Turkey for 2023, which were agreed by the BTYK on 27
December 2011, include the following:
- Achieving an R&D intensity of 3% (from 0,84% in 2010)
- Increasing business R&D expenditure as % of GDP to 2% (from 0,36% in 2010)
- Increasing the number of FTE researchers to 300,000 (from 64.341 in 2010)
- Increasing the number of FTE researchers in the private sector to 180,000 (from 25.342 in
2010)

9
Figure 1: Strategic Framework of the National Science, Technology and Innovation Strategy (2011-‐2016)
Source: TUBITAK
(http://www.tubitak.gov.tr/tubitak_content_files/BTYPD/strateji_belgeleri/UBTYS_2011-‐2016.pdf)
As noted above, automotive, machinery and production technologies, ICT, energy, water, food,
security and space were identified as priority sectors under the strategy. Health sector is also recently
added as a new S&T priority sector in 25th meeting of BTYK in January 2013. The National R&D and
Innovation Strategies were developed and approved for Energy, Water and Food by the BTYK in
December 2011. This indicates a clear shift in R&D and innovation policy-‐making from horizontal to
sectoral focus.
10
Another remarkable shift is the move from research to innovation. While the National Science and
Technology Policies Implementation Plan for 2005-‐2010 was mainly characterised by outlining
research oriented strategies, the National Science, Technology and Innovation Strategy (2011-‐2016)
started to discuss aims to transform research outputs into products and services. Finally, the BTYK
decisions taken at its meeting on 27 December 2011, as noted above, put high emphasis on
innovation, and link innovation with entrepreneurship.19
TUBITAK announced four new support programmes in 2012: The first measure is the ‘Support
Programme for Individual Entrepreneurs’ which is a multistage programme aiming to support
individual entrepreneurs to transform their technology and innovation focused business ideas into
enterprises.20 The other two measures are directed to improve R&D performance in priority research
areas. The ‘Support Programme for Research, Technological Development and Innovation Projects in
Priority Areas’ targets private sector companies whereas the ‘Programme for Supporting R&D
Projects in Priority Areas’ was directed towards researchers from both academia and private/public
research centers.21,22 Furthermore, TUBITAK revised its ‘Support Programme for Research and
Development Projects of Public Institutions’ in the same period.23 The programme is now accepting
project applications to specific calls announced by TUBITAK regarding public institutions’ needs. For
this aim, TUBITAK has invited the public institutions to determine their priority needs that can be
resolved by R&D projects. Finally, ‘Support Programme for Technology Transfer Offices’ aims to
commercialize knowledge and technology in universities, to establish collaboration between
universities and the private sector and to produce knowledge and technology demanded by the
industry. This new programme was announced in November 2012 and deadline for applications was
the end of December 2012.24 TUBITAK received around 40 project applications for this programme
(BTYK25, 2013).
The new priorities also include governance improvements. The new decision of the BTYK for the
coordination and coherence between policy measures is an important commitment in this respect. In
addition, the creation of the new Ministry of Science, Industry and Technology in June 2011, which is
19http://www.tubitak.gov.tr/tr/kurumsal/bilim-ve-teknoloji-yuksek-kurulu/toplantilar/icerik-bilim-ve-teknoloji-yuksek-kurulu-23toplantisi-27-aralik-2011 20http://www.tubitak.gov.tr/tr/destekler/sanayi/ulusal-destek-programlari/icerik-1512-bireysel-girisimcilik-asamali-destek-programi 21http://www.tubitak.gov.tr/tr/destekler/sanayi/ulusal-destek-programlari/icerik-1511-tubitak-oncelikli-alanlar-arastirma-teknoloji-gelistirme-ve-yenilik-p-d-p 22http://www.tubitak.gov.tr/tr/destekler/akademik/ulusal-destek-programlari/icerik-1003-oncelikli-alanlar-ar-ge-projeleri-destekleme-programi 23http://www.tubitak.gov.tr/tr/destekler/kamu/ulusal-destek-programlari/icerik-1007-kamu-kurumlari-arastirma-ve-gelistirme-projelerini-dp 24http://www.tubitak.gov.tr/tr/destekler/akademik/ulusal-destek-programlari/icerik-1513-teknoloji-transfer-ofisleri-destekleme-programi
11
given the responsibility for the development, implementation and coordination of the S&T and
innovation policies, increases the priority of governance improvements in the policy agenda.
When the national priorities are compared with the structural challenges presented in Section 2, it is
observed that the current priorities recognise and address the challenges identified, as explained
above.
The new policy changes are not yet reflected on the policy mix of measures as they have very
recently been introduced. The characterisation of the policy instruments to foster public and private
R&D investment is summarised below.
Route 1: Promoting the establishment of new indigenous R&D performing firms
As part of the broader industrial and innovation policy framework, the leading programmes aiming to
encourage creation of new technology-‐based firms including the new ‘R&D, Innovation and Industrial
Application Support Programme’ of KOSGEB and ‘Technoentrepreneurship Support Programme’ of
the MoSIT. The former is the follow up of the ‘R&D and Technological Innovation Support
Programme’ which was replaced in mid-‐2010. The programme is composed of two sub-‐programmes:
R&D and Innovation Programme, and Industrial Application Programme. 850 projects were funded
with a support budget of €15.88m25 (TL37.00m) in the scope of the R&D and Innovation Programme
as of November 2012. The number of supported projects was 150 and the total support amount was
€2.58m (TL6.00) for the Industrial Application Programme in the same period.26 The programme also
supports technology incubators (called ‘Technology Development Centres’) of KOSGEB, which are
established in cooperation with universities and local chambers to support technology start-‐ups.
As of November 2012, the MoSIT allocated €32.62m27 (TL76m) to 741 entrepreneurs to start their
technology-‐based business in 2009-‐2012 period. A total amount of €12.02m (TL28m) was allocated to
the supported projects in 2012 (BTYK25, 2013).
Route 2: Stimulating greater R&D investment in R&D performing firms
The primary focus of the measures in Turkey is on increasing the R&D investments of companies in
general. The main instruments implemented for this purpose cover subsidies in the form of grants
and soft loans as well as fiscal incentives. The leading measure is the ‘Support Programme for
Industrial R&D Projects’ which aims to increase R&D activities of the private sector and is
25 €1=TL2.3363 (Central Bank of Turkey’s effective sale rate for 30.10.2012) 26 http://kosgeb.gov.tr/Pages/UI/Baskanligimiz.aspx?ref=23 27 €1=TL2.3363 (Central Bank of Turkey’s effective sale rate for 30.10.2012)

12
implemented by TUBITAK. By November 2012, €106m28 (TL247m) was provided to R&D projects of
the private sector under this programme. From 2005 to 2012, 108 projects were funded by this
programme (BTYK25, 2013). Together with this programme, two different programmes exist with
comparably lower budgets, namely ‘SME R&D Support Programme’ and ‘Support Programme for
International Industrial R&D’. The former is a programme directed towards SMEs that do not engage
in R&D activities which will be explained in the next section. The latter is funded through EUREKA and
ERA-‐NET call. In this programme 30 projects with €3.26m29 (TL7.6m) budget were funded in 2005-‐
2012 period. ‘R&D projects Brokerage Events Grant Programme’ supports activities of R&D
performers to introduce their R&D project ideas.30 59 projects with €0.45m (TL1.06m) budget were
funded with this scheme in 2002-‐2012 period.
Another similar measure is the Technology Development Project Support programme of TTGV. The
amount provided as soft loan to the supported projects was €2.58m31 (TL6m) in 2012. The funding
provided to the new and ongoing projects were €9.87m (TL23m) in 2011 and €12.88m (TL30m) in
2010. Under the Advanced Technology Projects Support Programme (ITEP), which was initiated in
2011, TTGV allocated €4.98m32 (USD6.93m) for selected projects (BTYK25, 2013).
Tax incentives are provided under the ‘Law of Technology Development Zones’ and the ‘Law on
Supporting Research and Development Activities’. The former provides tax exemption to R&D
activities of tenants of technoparks, while the latter is used by companies located outside the
technoparks and employing at least 50 FTE researchers in case they have been entitled as “R&D
Centre” by the MoSIT. As of November 2012, there were 2,037 companies with 16,677 R&D
personnel in 32 active technoparks. The MoSIT granted the ‘R&D centre’ status to 138 companies as
of November 2012 (BTYK25, 2011). The amount of support between 2008-‐2011 is €2,180.26m33
(TL5,080m). Total number of patents from R&D centers has reached to 1,080 in 2012 which
represents 12.62% increase as compared to 2011. On the other hand, the total number of
researchers in these R&D centers is 10,242 at the end of 2012 (MoSIT, 2012). Their amount of R&D
expenditures between 2008 and 2010 was €2.06m34 (TL 4.8m) (MoSIT, 2011).35
The KOSGEB programme mentioned in route 1 above also covers this route and the route 3 below.
28 €1=TL2.3363 (Central Bank of Turkey’s effective sale rate for 30.10.2012) 29 €1=TL2.3363 (Central Bank of Turkey’s effective sale rate for 30.10.2012) 30http://www.tubitak.gov.tr/tr/destekler/sanayi/ulusal-destek-programlari/icerik-1503-proje-pazari-destekleme-programi 31 €1=TL2.3363 (Central Bank of Turkey’s effective sale rate for 30.10.2012) 32 €1=$1.33 (Central Bank of Turkey’s effective sale rate for 30.10.2012) 33 €1=TL2.3363 (Central Bank of Turkey’s effective sale rate for 30.10.2012) 34 €1=TL2.3363 (Central Bank of Turkey’s effective sale rate for 30.10.2012) 35http://sagm.sanayi.gov.tr/Files/Documents/web-ar-ge-istatistik-26-0-08082012101635.docx
13
Route 3: Stimulating firms that do not perform R&D yet
Apart from the above-‐mentioned KOSGEB support for SMEs, the only scheme available to stimulate
firms that do not perform R&D yet is the ‘SME Funding Programme’ implemented by TUBITAK. It
aims to increase the number of R&D projects carried out by SMEs by offering a much faster and
easier access for funding. €34.16m36 (TL 79.6m) and €32.23m (TL 75.1m) was provided to the R&D
projects of SMEs in 2011 and 2012, respectively. In 2012, an amount of €21.03m (TL 49m) was
allocated to the projects under this programme as of November 2012 (BTYK25, 2013).
Route 4: Attracting R&D-‐performing firms from abroad
Attracting FDI is one of the priorities of the government. However, there are no direct measures for
pulling research-‐intensive FDI. The ‘Law on Supporting Research and Development Activities’ which
provides fiscal incentives for R&D activities of firms employing at least 50 researchers is expected to
be used as a stimuli to attract foreign firms which would like to locate their R&D branches outside
their home countries. The tax exemptions provided under the ‘Law of Technology Development
Zones’ has been instrumental in attracting 70 R&D-‐performing firms from abroad. Their total amount
of investments reached to €513.53m37 (USD683m) as of December 2012 (MoSIT, 2013)38.
Route 5: Increasing extramural R&D carried out in cooperation with the public sector
The topic has been on the political agenda for a very long time. One of the programmes implemented
for this purpose is the ‘Industrial Thesis (San-‐Tez) Projects’ support programme by the MoSIT. By
November 2012, the MoSIT provided €76.82m39 (TL179m) to the projects supported under this
programme. The funding provided to the projects in 2011 and 2012 were €13.73m (TL32m) and
€26.18m (TL61m), respectively (BTYK25, 2013). In 2011, TUBITAK introduced the ‘Technology
Transfer Support Programme for SMEs’ aiming to promote technology transfer from universities to
SMEs. However, this programme was extended to all types of establishments. Five project
applications have been received in 2011 and 7 out of 21 applications were funded in 2012 (BTYK25,
2013). Finally, as a part of the ‘Support Programme for Research Projects of Public Institutions’, it is
possible for public bodies to create consortiums with the private sector, universities or public
research institutes to conduct joint R&D activities. Since this programme is more related to the
increasing R&D in the public sector (and since R&D collaboration with third parties is not mandatory
for public organisations) it is covered under the route 6 below.
36 €1=TL2.3363 (Central Bank of Turkey’s effective sale rate for 30.10.2012) 37 €1=$1.33 (Central Bank of Turkey’s effective sale rate for 30.10.2012) 38 http://sagm.sanayi.gov.tr/userfiles/file/GENEL%20BR%C4%B0F%C4%B0NG%2007_01_13.doc 39 €1=TL2.3363 (Central Bank of Turkey’s effective sale rate for 30.10.2012)
14
Route 6: Increasing R&D in the public sector
Involvement of the public sector in R&D activities is another topic that has been debated for more
than a decade. The ‘Support Programme for Research Projects of Public Institutions’ aims to address
the R&D needs of public organisations. As part of the programme, the public administrations need to
identify their needs, which could be solved through R&D projects (also see route 5 above). The total
budget allocated for supported projects is €190.13m40 (TL443m) as of November 2012 (BTYK25,
2013).
In the Turkish policy mix of measures, the route 2 has been given higher importance when compared
with the number of measures in other routes. It is expected that with the new policy measures to be
introduced to implement the new strategies and decisions of the BTYK, the balance and efficiency of
the policy mix will improve in the near future.
Of above programmes, only KOSGEB’s ‘R&D and Technological Innovation Support Programme’ was
evaluated in 2010. The evaluation results indicate that the ‘Technology Development Centres’
established under this programme have proved to be successful in the creation of technology start-‐
ups.
Route 7: Supporting Innovative Activities
The programmes under this route support various innovative and collaborative activities. ‘Patent
Applications Support Programme’ support applications for national and international patents.41 In the
period between 2007 and 2012, total amount of supports reached to €6.78m42 (TL15.8m) for 7,357
projects (BTYK25, 2013). ‘University-‐Industry Collaboration Grant Programme’ commenced in August
2011. This programme aims to transfer knowledge and technology in universities and public research
centres in to the industry and the ultimate target is to commercialize unexploited idle knowledge.43
Until November 2012, 7 projects were funded out of 26 project applications (BTYK25, 2013). ‘Support
Programme for Technology Transfer Offices’ aims to commercialize knowledge and technology in
universities, to establish collaboration between universities and the private sector and to produce
knowledge and technology demanded by the industry. This new programme was announced in
40 €1=TL2.3363 (Central Bank of Turkey’s effective sale rate for 30.10.2012) 41http://www.tubitak.gov.tr/tr/destekler/sanayi/ulusal-destek-programlari/icerik-1008-patent-basvurusu-tesvik-ve-destekleme-programi 42 €1=TL2.3363 (Central Bank of Turkey’s effective sale rate for 30.10.2012) 43http://www.tubitak.gov.tr/tr/destekler/sanayi/ulusal-destek-programlari/icerik-1505-universite-sanayi-isbirligi-destek-programi

15
November 2012 and deadline for applications was the end of December 2012.44 TUBITAK received
around 40 project applications for this programme (BTYK25, 2013). Finally, ‘Establishment of
Scientific and Technological Collaboration Networks and Platforms’ programme aims to establish and
enhance collaborative activities among institutions and establishments engaged in natural,
engineering, health and social sciences and relevant technological fields.45 It also aims to produce
substantial outputs through these networks. However, this programme is under revision and new
project proposals are not accepted. In 2007-‐2012 period, 18 projects were funded with €5.11m46
(TL11.9m) (BTYK25, 2013).
In sum, expected aims and influences of all of the above routes can be summarized as follows:
- Expanding R&D and innovation investments of private sector (public-‐private sector 50%-‐50%
ratio)
- Formation of R&D culture and structure in more firms, especially in SMEs
- Acquiring project and source management skills
- Providing the transformation of covered information to uncovered -‐codified -‐ information by
documenting the profits (tacit to codified knowledge transformation)
- Constituting collaboration between universities and industry
- Increasing the number of successful firms which are able to compete with world markets,
- Improving local products and services to decrease import,
- Increasing productivity and product quality by improving product technologies,
- Getting financial success and new expansion opportunities through project outputs.
3.2 Challenges
44http://www.tubitak.gov.tr/tr/destekler/akademik/ulusal-destek-programlari/icerik-1513-teknoloji-transfer-ofisleri-destekleme-programi 45http://www.tubitak.gov.tr/tr/destekler/sanayi/ulusal-destek-programlari/icerik-1301-bilimsel-ve-tekn-isblg-aglari-ve-platf-kurma-girisimi-proj-isbap 46 €1=TL2.3363 (Central Bank of Turkey’s effective sale rate for 30.10.2012)

16
Turkey is treated as a “modest innovator with a below average performance” in the Innovation Union
Scoreboard (IUS) 201147, In terms of average economic growth, Turkey has 8.5% real GDP growth in
2011 which is considerably high above the EU27 average (1.5%). For Turkey, the improvement of
innovation performance from 2010 has been well above the EU27 average (1.1%) in IUS 2011 with a
value of 2.4%. According to the IUS 2011, the relative strengths are in ‘Open, excellent and attractive
research systems’, ‘Finance and support’, ‘Innovators’ and “Economic effects’. However, the relative
weaknesses are listed as ‘Human resources’, ‘Firm investments’ and ‘Intellectual assets’. The
Innovation Union Competitiveness (IUC) Report48 also highlights a specific relative strength of Turkey
in the quality of its scientific production, with 6.9% of its scientific publications among the top 10% of
those most cited worldwide (IUC, 2011). IUC (2011) points out that in terms of human resources
intensity and knowledge intensity of the economy, Turkey is behind the countries with similar
industrial structure and knowledge capacity. It is mentioned that “Turkey's R&D profile is weaker
than that of the EU average, in particular new doctoral graduates and patenting activity"49.
Both the IUS 2011 and IUC 2011 reports underline high growth for ‘Business R&D expenditure’, ‘PCT
patent applications’ and ‘Community trademarks’. The annual growth rate for ‘business R&D
expenditures’ is 1.3% for EU27, while it is 12.8% in Turkey. This growth rate represents the highest
growth performance among the countries studied in IUS 2011. Such a trend is also observed for ‘PCT
patent applications’. Turkey has the third highest growth rate (8.8%) in this indicator while EU27
average has a declining rate with 0.8%. The same tendency is also observed for ‘PCT patent
applications in societal challenges’ defined as climate change mitigation and health although these
challenges were not in the S&T priority areas in Turkey for 2011. The 25th BTYK meeting convened in
January 2013 decided to include health as an S&T priority area. According to IUC 2011, “PCT patent
applications in societal challenges may not reflect the patenting dynamics of Turkey”. The annual
growth in ‘community trademarks’ is 12.8% in Turkey as compared to EU27 average of 8%. However,
the growth performance in ‘community designs’ is the worst among all indicators. It decreases by
6.2% being one of the worst performances among the countries in IUS 2011.
The IUS 2011 underlines that growth performance in ‘Human resources’, ‘Open, excellent and
attractive research systems’, ‘Finance and support’ and ‘Firm investments’, is above average. Growth
in the main research and innovation indicators between 2000-‐2009 (R&D intensity, business R&D
expenditures on R&D, public expenditures on R&D, new doctoral graduates, scientific publications
47http://www.proinno-europe.eu/inno-metrics/page/innovation-union-scoreboard-2011 48http://ec.europa.eu/research/innovation-union/pdf/competitiveness-report/2011/iuc2011-full-report.pdf#view=fit&pagemode=none 49http://ec.europa.eu/research/innovation-union/pdf/competitiveness-report/2011/country_review.pdf#view=fit&pagemode=none (pp. 250)

17
within the 10% most cited scientific publications worldwide and PCT patent applications), except for
patent activity in societal challenges, is reported in the IUC 2011.
According to IUS 2011, the growth rate in ‘new doctorate graduates’ is 10.7% in Turkey which is the
second highest growth rate among the countries in IUS 2011. ‘Population completed tertiary
education’ indicator has also higher growth rate (6.8%) as compared to EU27 average (3.8%). In
terms of ‘finance and support’, the growth rate of ‘R&D expenditure in the public sector’ in Turkey
(9.1%) is also higher than EU27 average of 4%.
The IUC 2011 report also highlights Turkey’s improvement in human resources for research and
innovation and in knowledge transfer from public research to business enterprise over the period
2000-‐2008 as measured by the public sector expenditure on R&D financed by business enterprise as
% of GDP. “This is particularly important given the relatively good performance of Turkey in scientific
quality output” (IUC, 2011).
According to the Global Competitiveness Report 2012-‐201350 of the World Economic Forum, Turkey
is in the stage of transition from efficiency-‐driven economies to innovation-‐driven economies. In the
Global Competitiveness index, Turkey ranks as 43 and exhibits a god performance as compared to
previous rank of 59. Turkey’s performance in innovation pillar is comparable with other ‘efficiency-‐
driven economies’ with a rank of 55. Under the innovation pillar, Turkey’s scores relatively well in the
‘government procurement of advanced technology products’ (32nd), ‘availability of scientists and
engineers’ (41st out of 144 economies), ‘PCT patent applications per million of population (42nd ) and
‘capacity for innovation’ (48th). Moderate performance is observed in ‘company spending on R&D
(56th). On the other hand, university-‐industry collaboration in R&D (70th) and quality of scientific
research institutions (88th) remain areas of concern for the country.
The National Science, Technology and Innovation Strategy 2011-‐2016 adopted in December 2010 by
the BTYK focuses on human resources development for science, technology and innovation,
transformation of research outputs into products and services, enhancing interdisciplinary research,
highlighting the role of SMEs, R&D infrastructures and international cooperation. It also identifies
automotive, machinery and production technologies, ICT, energy, water, food, security and space as
focus areas. In line with this, the strategy puts special emphasis on keeping the balance between
focused areas and bottom-‐up research (TUBITAK, 2010 and IUC, 2011).
50http://www3.weforum.org/docs/WEF_GlobalCompetitivenessReport_2012-13.pdf

18
In addition to the National Science, Technology and Innovation Strategy 2011-‐2016, at the 23rd BTYK
meeting in December 2011, the following new items were identified for the improvement of the
research and innovation performance of the country:51
- Setting up a coordination board to secure integrity, coherence and target-‐oriented approach in
R&D, innovation and entrepreneurship support mechanisms;
- Developing policy tools to activate and increase the number of R&D intensive start-‐ups;
- Developing policy tools to trigger innovation and entrepreneurship in universities;
- Promoting entrepreneurship culture;
- Improving public procurement and public right of use in such a way to foster innovation,
localisation and technology transfer;
- Promoting science centres;
- Developing policy tools to stimulate domestic patent licensing.
In the 24th meeting of BTYK in August 2012, the following new decisions mainly directed towards
increasing the quality of educational infrastructure have been taken:52
- Carrying out studies directed to the evaluation of the situation for incerasing the quality of
education;
- Developing and accessing of the digital content for the primary and secondary education;
- Encouraging and accesing of the development of digital lecture content for the undergraduate
level;
- Carrying out studies on the revision of the education programs and design of education
contents directed to the aim for the students to gain essential competences;
- Carrying out studies on the foreign language education system of the primary and secondary
education and developing alternative education methods;
51http://www.tubitak.gov.tr/tr/kurumsal/bilim-ve-teknoloji-yuksek-kurulu/toplantilar/icerik-bilim-ve-teknoloji-yuksek-kurulu-23toplantisi-27-aralik-2011 52http://www.tubitak.gov.tr/tr/kurumsal/bilim-ve-teknoloji-yuksek-kurulu/toplantilar/icerik-bilim-ve-teknoloji-yuksek-kurulu-24toplantisi-7-agustos-2012

19
- Restructuring the scholarship programs for graduate study abroad;
- Organizing science fairs for students of the primary and secondary education;
- Restructuring the university entrance system;
- Performing the preparation activities for the participation to the EU Framework Program
Horizon 2020.
In the 25th meeting of BTYK in January 2013, the following six new decisions mainly on the e-‐
government infrastructure have been taken:53
- Monitoring the highly-‐gifted individuals strategy of 2013-‐2017;
- Carrying out studies on e-‐government management model;
- Completing the firm accreditation system for public procurement of e-‐government
applications;
- Carrying out studies on the establishment of National Database Centre;
- Public procurement of software needs of public institutions;
- Determining health as an S&T priority area.
Above-‐mentioned items are in line with the challenges and weaknesses highlighted in the previous
ERAWATCH Country Reports54 and TrendChart reports55 of Turkey.
Based on above discussion, the following challenges are identified for Turkey:
- Promoting research commercialisation from universities: This can take place in various forms,
such as university start-‐ups and spin-‐off, mobility of researchers and students, contract
research projects, joint research projects, innovative public procurement, licensing, consulting,
trainings, formal and informal networks, competitiveness clusters etc. This fact is also
underlined by the Global Competitiveness Index in which Turkey has a relatively weak
performance. The above-‐listed new decisions of the 23rd meeting of BTYK and the National
Science, Technology and Innovation Strategy 2011-‐2016 focus on this challenge. The
53http://www.tubitak.gov.tr/tr/kurumsal/bilim-ve-teknoloji-yuksek-kurulu/toplantilar/icerik-bilim-ve-teknoloji-yuksek-kurulu-25toplantisi-15-ocak-2013 54 http://erawatch.jrc.ec.europa.eu 55 http://proinno.intrasoft.be/index.cfm?fuseaction=country.showCountry&topicID=108&parentID=52&ID=41

20
enrichment of the policy mix with a variety of measures (financial, non-‐financial, etc.) will help
to address this challenge.
- Increasing the number of innovative high-‐growth start-‐ups: This is an important challenge
facing the innovation and economic performance of the country. The underdeveloped venture
capital and business angels market, as well as limited number and variety of policy measures
for start-‐up creation, are crucial impediments for the establishment and development of
innovative businesses in Turkey. It is also a barrier for encouraging educated and qualified
human sources to see entrepreneurship as a career option. Insufficient early stage funding is
also an obstacle for the development of venture capital industry as it helps generate a large
deal flow for venture capital investments. The BTYK decisions of December 2011 recognise this
challenge and aim to address through new policy measures. Furthermore, the Undersecretariat
of Treasury carries out studies for improving the framework conditions for angel investments,
and the ‘Entrepreneurship Council’ established in January 2012 aims to increase number of
innovative and technology-‐based start-‐ups56.
- Increasing R&D and innovation capabilities of the private sector (in particular, micro, small and
medium enterprises (MSMEs)): The low levels of absorptive capacity of the business sector,
particularly that of MSMEs, is a barrier to increase R&D and innovation performance. MSMEs
constitute 99.9% of the total enterprises and 78% of employment in Turkey, according to
KOSGEB. Micro enterprises constitute the majority of MSMEs. They are mainly active in
traditional, middle to low-‐tech sectors, such as garments (14%), furniture (14%), metal
products (14%), wood products (10%) and food (8%) (KOSGEB 2011).57 There exist policy
measures for increasing R&D and innovation investment of the private sector and SMEs, and
the National Science, Technology and Innovation Strategy 2011-‐2016 highlights the role of
SMEs. It is important to design and implement specific measures (such as support for
R&D/innovation vouchers and knowledge intensive service activities, etc.) for enhancing the
learning capabilities, absorptive capacity, and R&D and innovation capabilities of MSMEs and
other private sector companies.
- Focusing on sectors and thematic areas of importance: It is important for Turkey to focus on
priority sectors, technology areas and specific thematic fields for building capacities and
addressing key challenges of today and tomorrow. This requires incentives and measures
specifically designed and government funds strategically channelled to these areas. As noted
56 http://www.sanayi.gov.tr/NewsDetails.aspx?newsID=2292&lng=tr 57 http://www.kosgeb.gov.tr/Pages/UI/Baskanligimiz.aspx?ref=23
21
above, with the new National Science, Technology and Innovation Strategy 2011-‐2016, priority
areas were identified. In addition to these areas, stimulating innovation in traditional sectors
and addressing societal challenges such as climate change mitigation and health can help
increase innovation outputs and outcomes due to the intensity of enterprises in the former,
and the size of societal needs in the latter.
- Increasing availability and quality of research personnel: As evident by indicators, Turkey is
behind countries with similar industrial structure and knowledge capacity with respect to
human resources intensity, and on the knowledge-‐intensity of its economy (reflecting both
manufacturing and services). (IUC 2011). This has long been recognised as one of the
challenges of the Turkish research and innovation system by the government and specific
interventions have helped improvements in trends. Current strategies and action plans
indicate ongoing commitment in this area. Further efforts and diversified measures are needed
to develop human resources in a way that the absorptive capacity of companies is enhanced,
and the quantity and quality of researchers are increased. The BTYK decisions of December
2011 and August 2012 support the steps to be taken to tackle this challenge.
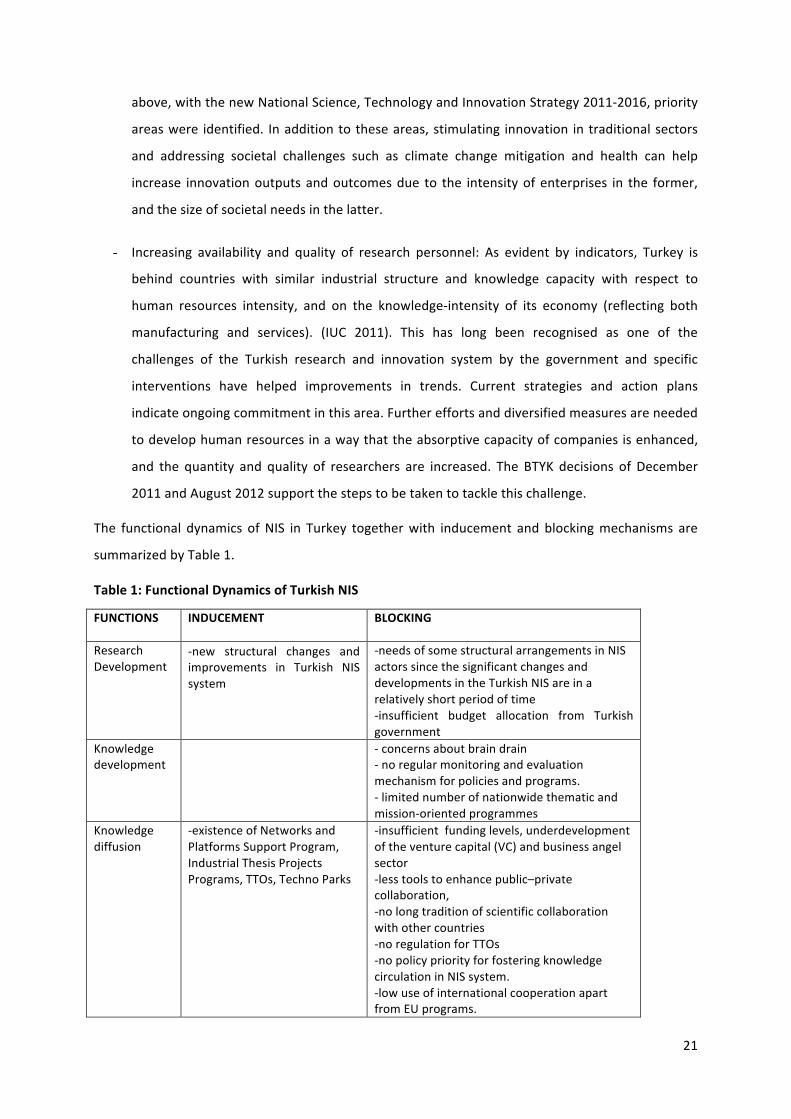
The functional dynamics of NIS in Turkey together with inducement and blocking mechanisms are
summarized by Table 1.
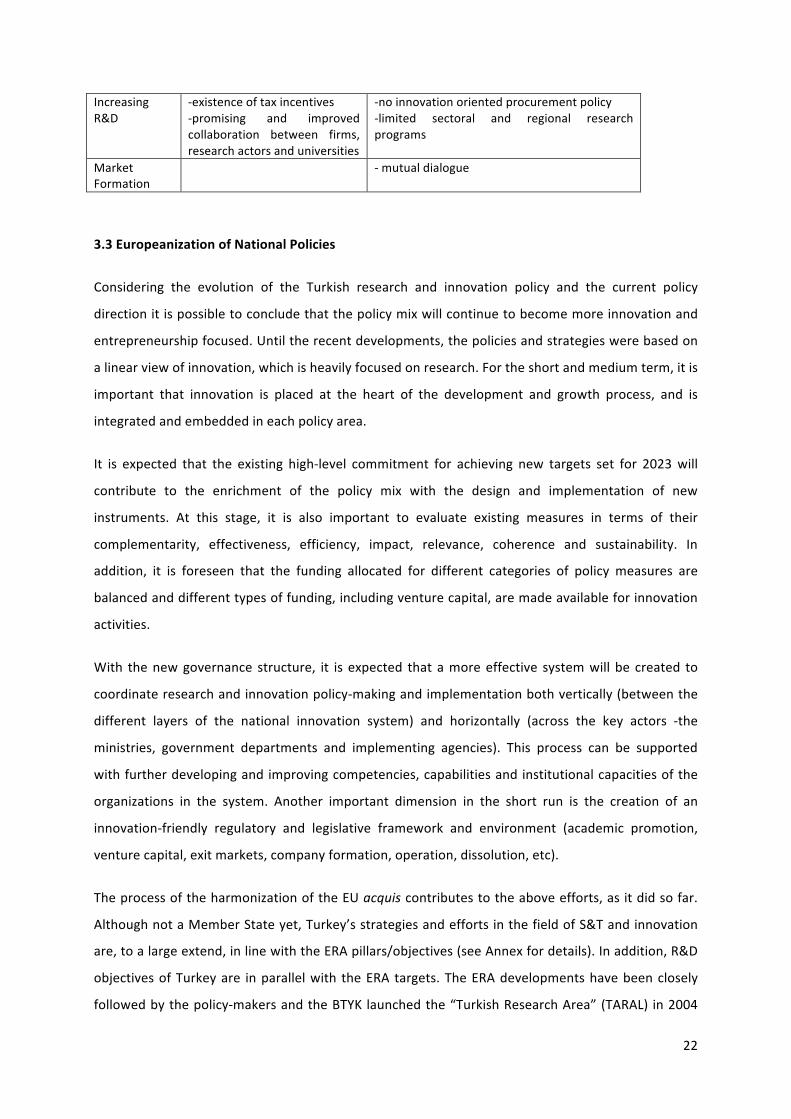
Table 1: Functional Dynamics of Turkish NIS
FUNCTIONS INDUCEMENT BLOCKING
Research Development
• -‐new structural changes and improvements in Turkish NIS system
-‐needs of some structural arrangements in NIS actors since the significant changes and developments in the Turkish NIS are in a relatively short period of time -‐insufficient budget allocation from Turkish government
Knowledge development
-‐ concerns about brain drain -‐ no regular monitoring and evaluation mechanism for policies and programs. -‐ limited number of nationwide thematic and mission-‐oriented programmes
Knowledge diffusion
-‐existence of Networks and Platforms Support Program, Industrial Thesis Projects Programs, TTOs, Techno Parks
-‐insufficient funding levels, underdevelopment of the venture capital (VC) and business angel sector -‐less tools to enhance public–private collaboration, -‐no long tradition of scientific collaboration with other countries -‐no regulation for TTOs -‐no policy priority for fostering knowledge circulation in NIS system. -‐low use of international cooperation apart from EU programs.
22
Increasing R&D
-‐existence of tax incentives -‐promising and improved collaboration between firms, research actors and universities
-‐no innovation oriented procurement policy -‐limited sectoral and regional research programs
Market Formation
-‐ mutual dialogue
3.3 Europeanization of National Policies
Considering the evolution of the Turkish research and innovation policy and the current policy
direction it is possible to conclude that the policy mix will continue to become more innovation and
entrepreneurship focused. Until the recent developments, the policies and strategies were based on
a linear view of innovation, which is heavily focused on research. For the short and medium term, it is
important that innovation is placed at the heart of the development and growth process, and is
integrated and embedded in each policy area.
It is expected that the existing high-‐level commitment for achieving new targets set for 2023 will
contribute to the enrichment of the policy mix with the design and implementation of new
instruments. At this stage, it is also important to evaluate existing measures in terms of their
complementarity, effectiveness, efficiency, impact, relevance, coherence and sustainability. In
addition, it is foreseen that the funding allocated for different categories of policy measures are
balanced and different types of funding, including venture capital, are made available for innovation
activities.
With the new governance structure, it is expected that a more effective system will be created to
coordinate research and innovation policy-‐making and implementation both vertically (between the
different layers of the national innovation system) and horizontally (across the key actors -‐the
ministries, government departments and implementing agencies). This process can be supported
with further developing and improving competencies, capabilities and institutional capacities of the
organizations in the system. Another important dimension in the short run is the creation of an
innovation-‐friendly regulatory and legislative framework and environment (academic promotion,
venture capital, exit markets, company formation, operation, dissolution, etc).
The process of the harmonization of the EU acquis contributes to the above efforts, as it did so far.
Although not a Member State yet, Turkey’s strategies and efforts in the field of S&T and innovation
are, to a large extend, in line with the ERA pillars/objectives (see Annex for details). In addition, R&D
objectives of Turkey are in parallel with the ERA targets. The ERA developments have been closely
followed by the policy-‐makers and the BTYK launched the “Turkish Research Area” (TARAL) in 2004
23
with inspiration from the ERA. TARAL, a platform for public, private and NGO stakeholders to
coordinate future R&D priorities and collaboration, is aimed to be integrated with the ERA. In this
respect, Turkey participates in the common programmes and is determined to be involved in the
initiatives carried out at the European level. Further improvement of policy coordination across
policy levels and in the policy mix would contribute to the alignment with the ERA pillars.
In the 24th BTYK meeting, one new decision is taken about the participation process for EU
Framework Programme, the Horizon 2020. Turkey is participated the 6th and 7th Framework
Programmes actively as an associated country in the EU cohesion process. In the 7th Framework
Programme, Turkish partners have taken €145,1m58 funds (TUBITAK, 2012). For the Horizon 2020,
TUBITAK is the responsible organization for the EU negotiations in collaboration with the other public
institutions.
4. DATA AND METHODOLOGY
Community Innovation Survey is the principal survey of innovation activities of firms in the European
Economic Areas and the EU candidate and associate countries. Moreover a few dozens other
countries ran one or more editions of their own ‘CIS-‐like’ enterprise surveys, based, like the original
CIS, on the Oslo Manual (see below). Started in 1993, the actual CIS is coordinated by the Eurostat,
implying that there is a ‘core questionnaire’ present in every national study (additional questions are
included by the national statistical offices). Initially the survey was ran every four years but since
2004 the frequency increased. Currently, there is a ‘full’ survey organized every four years, and a
‘reduced’ version, with a shorter core questionnaire, two years after every full survey. Turkish
Statistical Institute has conducted innovations surveys based on CIS methodology since the mid-‐
1990s.
Our research is particularly challenging from the methodological point of view, because it combines
problems related to the analysis of innovation surveys, and those inherent to the evaluation of
government intervention. The former include modeling the complicated relationship between
innovation input and output (and often – firm productivity). The latter is caused by possibly non-‐
random selection of firms that are subject to government support.
As for modeling innovation activities, the standard procedure in the literature has become the CDM
model, called this in honor of the authors of the seminal 1998 paper: Crépon, Duguet and Mairesse.
58 €1=TL2.3363 (Central Bank of Turkey’s effective sale rate for 30.10.2012)
24
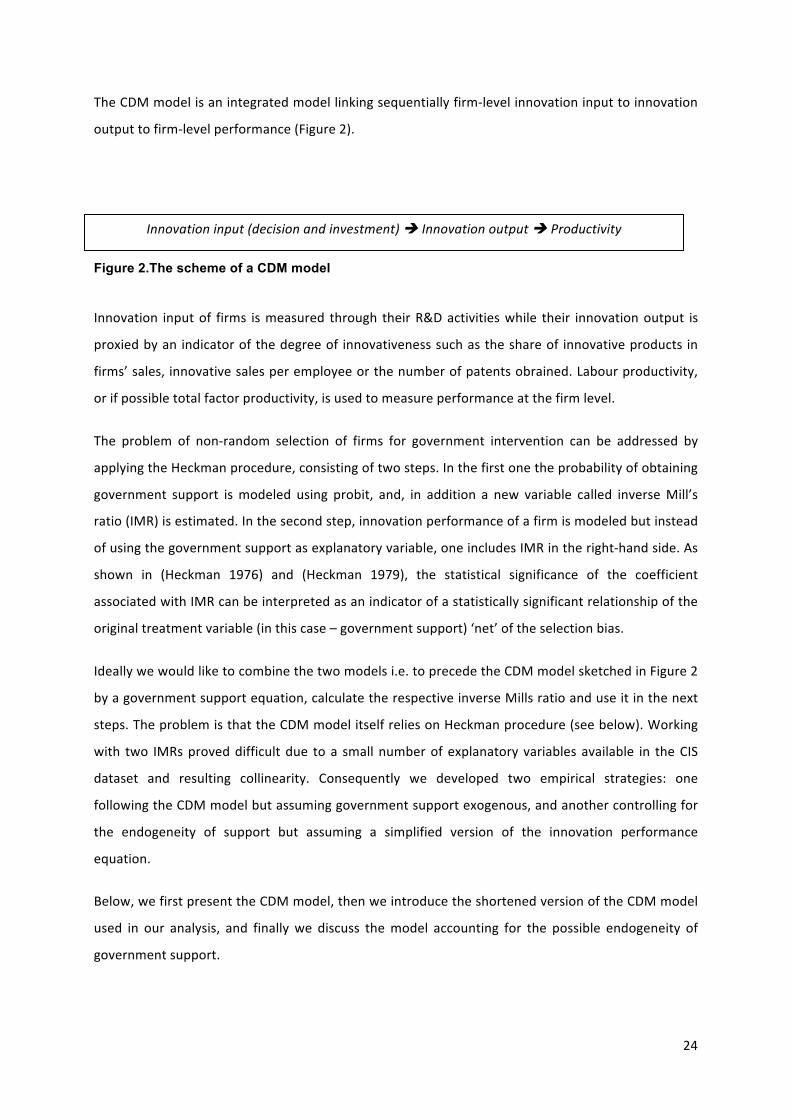
The CDM model is an integrated model linking sequentially firm-‐level innovation input to innovation
output to firm-‐level performance (Figure 2).
Innovation input of firms is measured through their R&D activities while their innovation output is
proxied by an indicator of the degree of innovativeness such as the share of innovative products in
firms’ sales, innovative sales per employee or the number of patents obrained. Labour productivity,
or if possible total factor productivity, is used to measure performance at the firm level.
The problem of non-‐random selection of firms for government intervention can be addressed by
applying the Heckman procedure, consisting of two steps. In the first one the probability of obtaining
government support is modeled using probit, and, in addition a new variable called inverse Mill’s
ratio (IMR) is estimated. In the second step, innovation performance of a firm is modeled but instead
of using the government support as explanatory variable, one includes IMR in the right-‐hand side. As
shown in (Heckman 1976) and (Heckman 1979), the statistical significance of the coefficient
associated with IMR can be interpreted as an indicator of a statistically significant relationship of the
original treatment variable (in this case – government support) ‘net’ of the selection bias.
Ideally we would like to combine the two models i.e. to precede the CDM model sketched in Figure 2
by a government support equation, calculate the respective inverse Mills ratio and use it in the next
steps. The problem is that the CDM model itself relies on Heckman procedure (see below). Working
with two IMRs proved difficult due to a small number of explanatory variables available in the CIS
dataset and resulting collinearity. Consequently we developed two empirical strategies: one
following the CDM model but assuming government support exogenous, and another controlling for
the endogeneity of support but assuming a simplified version of the innovation performance
equation.
Below, we first present the CDM model, then we introduce the shortened version of the CDM model
used in our analysis, and finally we discuss the model accounting for the possible endogeneity of
government support.
Figure 2.The scheme of a CDM model
Innovation input (decision and investment) è Innovation output è Productivity

25
The CDM model
The idea of the CDM approach is to model in a sequential manner different stages going from the
innovation input to its output and finally the impact of the latter variable on firm performance (cf.
the sequence in Figure 2Figure 2): Hereafter, we will first present different equations that form the
CDM model, as they were initially introduced in Crepon, 1998:44.
Modeling R&D propensity and intensity of firms. R&D is modeled within the framework of a
generalized Tobit model. In this model, the first equation is related to the propensity to invest in R&D
or the R&D decision of firms. It is expressed as a latent variable, 𝑟𝑑!∗, which is given by equation (1) (I
indexes firms)
𝑟𝑑!∗ = 𝛽𝑋! + 𝑢! (1)
The left-‐hand side variable is a latent variable which is not observed. It proxies something like the
expected present value of benefits accruing to firms due to launching R&D activities. The first
element of the right-‐hand side is a vector containing explanatory variables for the R&D decision and
an associated vector of coefficients. The second element is a random disturbance term.
In a second stage, we introduce the variable 𝑟𝑑! which, contrarily to 𝑟𝑑!∗, is observed and takes the
value of 1 for those firms where the latent variable is negative or zero, and the value of 0 if it is
positive.
𝑟𝑑! =1 𝑖𝑓 𝑟𝑑!∗ > 0
0 𝑖𝑓 𝑟𝑑!∗ ≤ 0 (2)
The second equation of the generalized Tobit model relates to R&D intensity of firms or equivalently
to their R&D expenditures – whether expressed in absolute values or normalized by sales. The R&D
effort of the firm is noted by the latent variable 𝑟𝑑𝑒!∗, which is modeled as a function of a number of
explanatory variables – contained in the vector W ,with an associated coefficient vector 𝛼 – and a
random disturbance term 𝑣! :
26
𝑟𝑑𝑒!∗ = 𝛼𝑊! + 𝑣! (3)
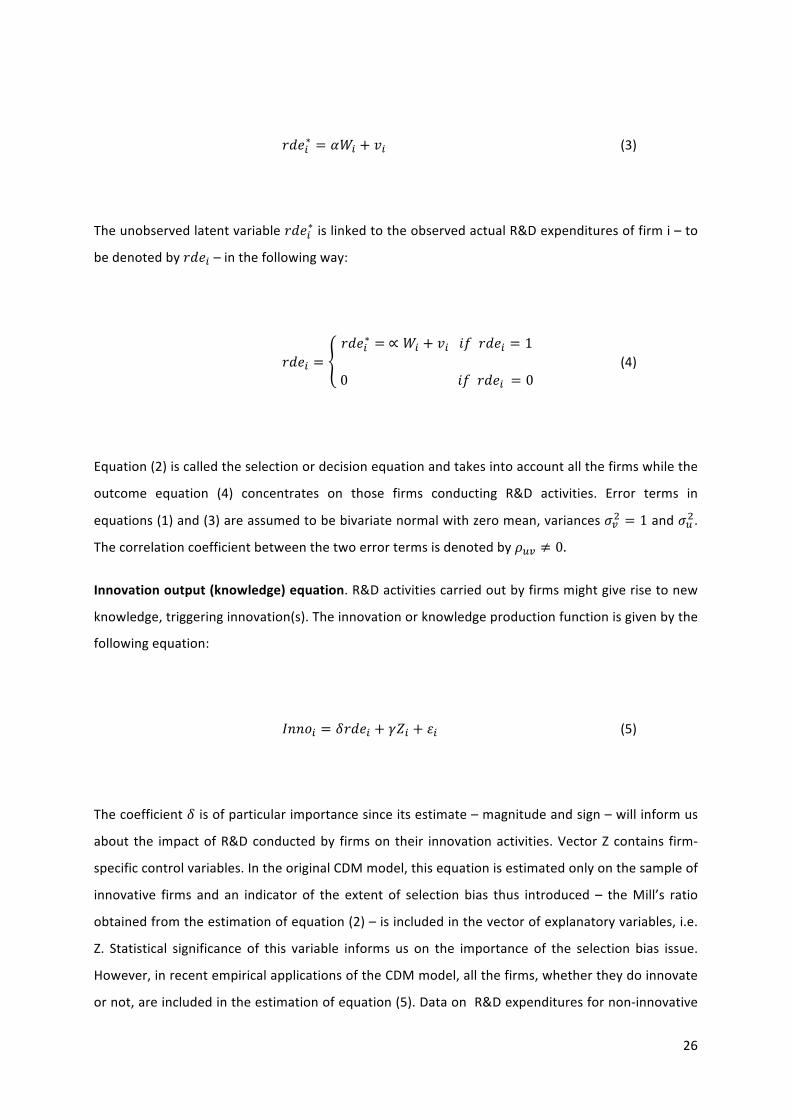
The unobserved latent variable 𝑟𝑑𝑒!∗ is linked to the observed actual R&D expenditures of firm i – to
be denoted by 𝑟𝑑𝑒! – in the following way:
𝑟𝑑𝑒! = 𝑟𝑑𝑒!∗ = ∝ 𝑊! + 𝑣! 𝑖𝑓 𝑟𝑑𝑒! = 1
0 𝑖𝑓 𝑟𝑑𝑒! = 0 (4)
Equation (2) is called the selection or decision equation and takes into account all the firms while the
outcome equation (4) concentrates on those firms conducting R&D activities. Error terms in
equations (1) and (3) are assumed to be bivariate normal with zero mean, variances 𝜎!! = 1 and 𝜎!!.
The correlation coefficient between the two error terms is denoted by 𝜌!" ≠ 0.
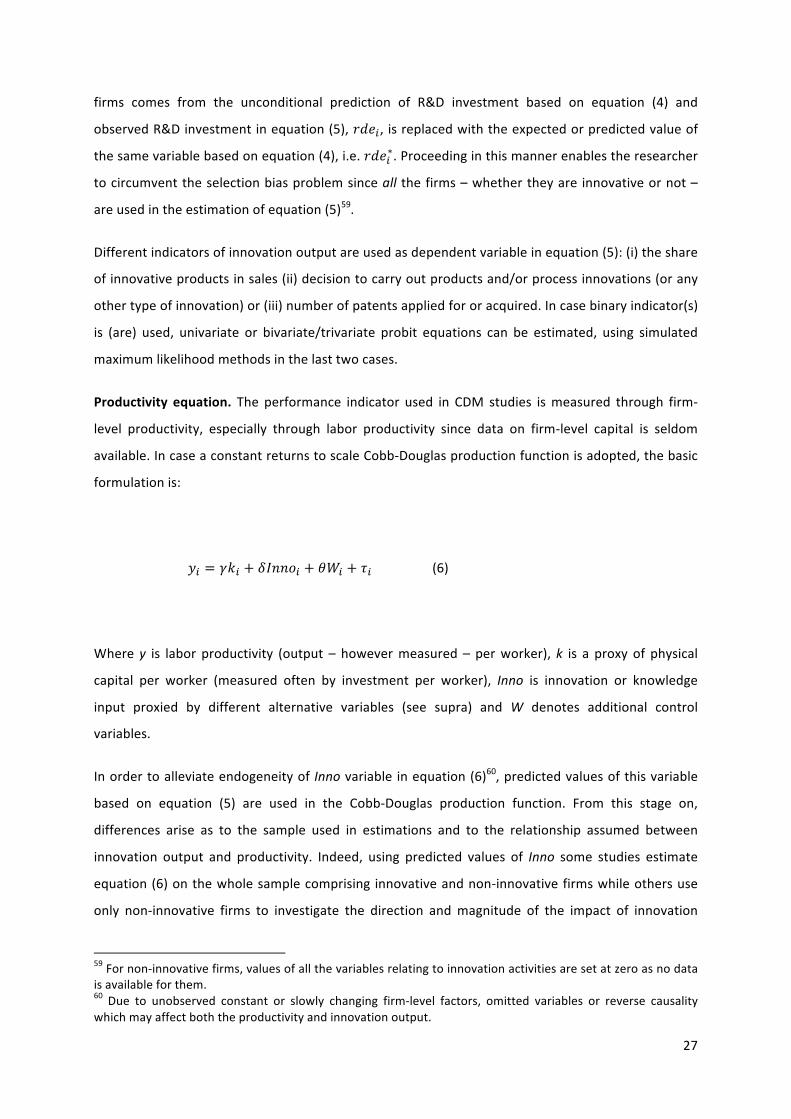
Innovation output (knowledge) equation. R&D activities carried out by firms might give rise to new
knowledge, triggering innovation(s). The innovation or knowledge production function is given by the
following equation:
𝐼𝑛𝑛𝑜! = 𝛿𝑟𝑑𝑒! + 𝛾𝑍! + 𝜀! (5)
The coefficient 𝛿 is of particular importance since its estimate – magnitude and sign – will inform us
about the impact of R&D conducted by firms on their innovation activities. Vector Z contains firm-‐
specific control variables. In the original CDM model, this equation is estimated only on the sample of
innovative firms and an indicator of the extent of selection bias thus introduced – the Mill’s ratio
obtained from the estimation of equation (2) – is included in the vector of explanatory variables, i.e.
Z. Statistical significance of this variable informs us on the importance of the selection bias issue.
However, in recent empirical applications of the CDM model, all the firms, whether they do innovate
or not, are included in the estimation of equation (5). Data on R&D expenditures for non-‐innovative
27
firms comes from the unconditional prediction of R&D investment based on equation (4) and
observed R&D investment in equation (5), 𝑟𝑑𝑒!, is replaced with the expected or predicted value of
the same variable based on equation (4), i.e. 𝑟𝑑𝑒!∗. Proceeding in this manner enables the researcher
to circumvent the selection bias problem since all the firms – whether they are innovative or not –
are used in the estimation of equation (5)59.
Different indicators of innovation output are used as dependent variable in equation (5): (i) the share
of innovative products in sales (ii) decision to carry out products and/or process innovations (or any
other type of innovation) or (iii) number of patents applied for or acquired. In case binary indicator(s)
is (are) used, univariate or bivariate/trivariate probit equations can be estimated, using simulated
maximum likelihood methods in the last two cases.
Productivity equation. The performance indicator used in CDM studies is measured through firm-‐
level productivity, especially through labor productivity since data on firm-‐level capital is seldom
available. In case a constant returns to scale Cobb-‐Douglas production function is adopted, the basic
formulation is:
𝑦! = 𝛾𝑘! + 𝛿𝐼𝑛𝑛𝑜! + 𝜃𝑊! + 𝜏! (6)
Where y is labor productivity (output – however measured – per worker), k is a proxy of physical
capital per worker (measured often by investment per worker), Inno is innovation or knowledge
input proxied by different alternative variables (see supra) and W denotes additional control
variables.
In order to alleviate endogeneity of Inno variable in equation (6)60, predicted values of this variable
based on equation (5) are used in the Cobb-‐Douglas production function. From this stage on,
differences arise as to the sample used in estimations and to the relationship assumed between
innovation output and productivity. Indeed, using predicted values of Inno some studies estimate
equation (6) on the whole sample comprising innovative and non-‐innovative firms while others use
only non-‐innovative firms to investigate the direction and magnitude of the impact of innovation
59 For non-‐innovative firms, values of all the variables relating to innovation activities are set at zero as no data is available for them. 60 Due to unobserved constant or slowly changing firm-‐level factors, omitted variables or reverse causality which may affect both the productivity and innovation output.

28
output on firm productivity. Besides, some studies assume the existence of a bi-‐directional causality
between productivity and the outcome of innovation activities of firms and estimate therefore
equations (5) and (6) in a simultaneous equation framework – on the sample of innovative firms only.
CDM-‐based models estimated
The model to be estimated for Turkey – called the core model in the next section – will include two
parts and three equations. The first part includes innovation decision and innovation expenditure
equations which are estimated by the Heckman procedure. The second part contains the innovation
output equation and is estimated by probit. The selection issue in the first part of the model is
addressed by the Heckman selection model which does account for non-‐innovators while estimating
the innovation expenditure equation. As for the innovation output expenditure equation which is
estimated using data only on innovating firms, the selection issue is handled by the inclusion in the
equation of the inverse Mill’s ratio obtained from the previous stage. No productivity equation is
estimated in the core model and the effect of innovation support will be estimated on innovation
expenditure (input additionality) and innovation output (output additionality). The model has a
certain affinity with the Microdata project i.e. a (OECD 2009) study of innovation activities in firms in
18 countries (discussed in more details in the next subsection)
The choice of independent variables in each specific equation is discussed in the results section. The
innovation decision variable is a firm-‐level variable and takes the value of 1 if a firm has positive
innovation expenditures – which as rather a broad definition but it is used in (OECD 2009) – 0 if it
innovation expenditures is nil. Data on innovation expenditures are available in innovation surveys
and this variable is used in our study as innovation expenditures per capita. As to the innovation
output indicator, a dummy variable taking the value of 1 if s firm introduces innovation new to the
market – i.e. radical innovations –, zero otherwise is used in the model.
In the Turkish CIS, a representative sample is collected for the entire economy, including hence
mining, manufacturing, industry other than manufacturing, and services. In the case of Turkey we
were able to match the innovation survey with data coming from another data set, namely Structural
Business Survey for the year 2010. This enabled us to use in the econometric exercise variables not
included in the innovation survey such as production, value added, exports, imports, etc. The main
point is that an indicator of firm-‐level productivity was constructed, which enabled us to add the
productivity equation the CDM model. The specification and estimation of the model was carried out
in accordance with the (OECD 2009) study and will be examined below.
29
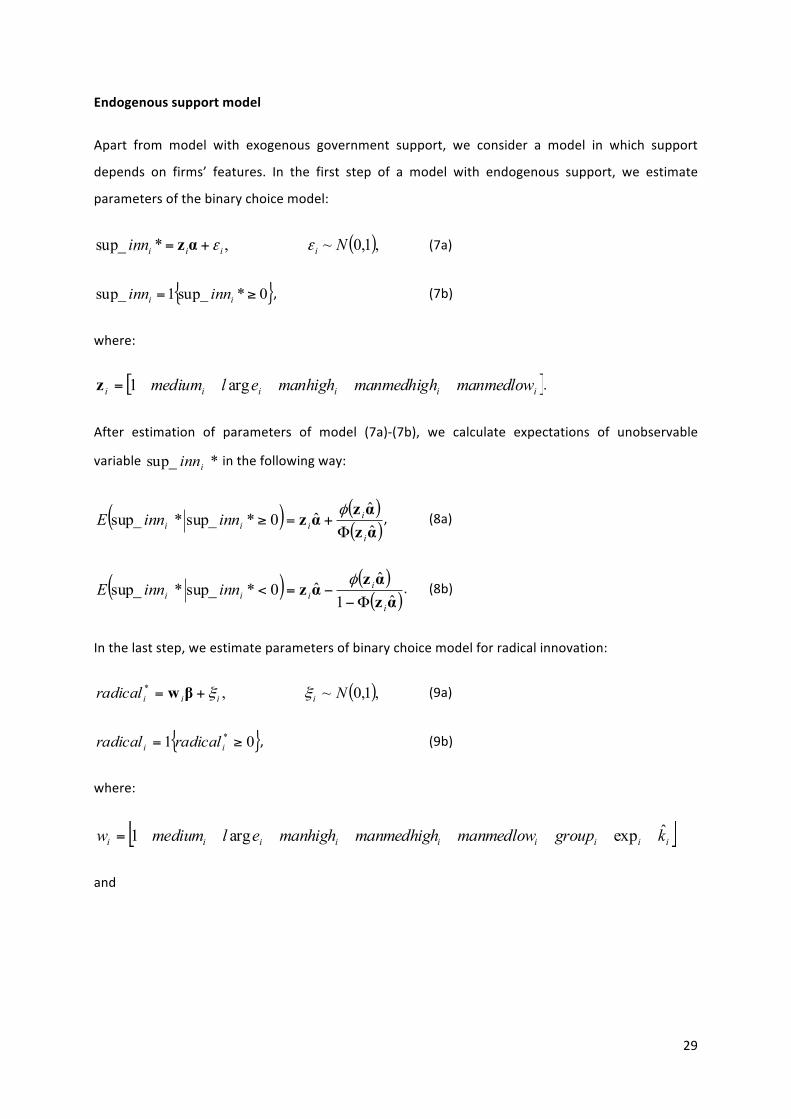
Endogenous support model
Apart from model with exogenous government support, we consider a model in which support
depends on firms’ features. In the first step of a model with endogenous support, we estimate
parameters of the binary choice model:
( ),1,0~,*sup_ Ninn iiii εε+= αz (7a)
{ }0*sup_1sup_ ≥= ii inninn , (7b)
where:
[ ]iiiiii manmedlowmanmedhighmanhighelmedium arg1=z .
After estimation of parameters of model (7a)-‐(7b), we calculate expectations of unobservable
variable *sup_ iinn in the following way:
( ) ( )( )αzαz
αzˆˆ
ˆ0*sup_*sup_i
iiii inninnE
Φ+=≥φ
, (8a)
( ) ( )( )αzαz
αzˆ1ˆ
ˆ0*sup_*sup_i
iiii inninnE
Φ−−=<
φ. (8b)
In the last step, we estimate parameters of binary choice model for radical innovation:
( ),1,0~,* Nradical iiii ξξ+= βw (9a)
{ }01 * ≥= ii radicalradical , (9b)
where:
[ ]iiiiiiiii kgroupmanmedlowmanmedhighmanhighelmediumw ˆexparg1=
and
( ),1,0~,sup_ * Ninn iiii εε+= αz

30
( )( )
( )( )⎪
⎪⎪
⎩
⎪⎪⎪
⎨
⎧
=Φ−
−
=Φ
+
=
.0sup_ˆ1ˆ
ˆ
,1sup_,ˆˆ
ˆ
ˆ
ii
ii
ii
ii
i
innif
innif
k
αzαz
αz
αzαz
αz
φ
φ
(10)
5. FINDINGS AND DISCUSSION
Core part
We start with the discussion of the sequential model, and then proceed with the presentation of the
model with endogenous support.
How can government support be controlled for in a CDM-‐like model? One way is to follow the OECD
methodology and to include a support dummy in the innovation expenditure equation. However
government support might be conducive for innovation in other ways than just monetary: it might
facilitate co-‐operation with important actors in the innovation system (e.g. R&D institutes), help
attract new talents61, or mobilize the firm for a more efficient performance. To verify that, we
estimate the sequential model including the government support variables also in the second step –
the equation explaining the decision of the firm to include radical innovation.
The choice of right hand side variables in the sequential model was an outcome of a longer process
including several trial estimations. We first discuss the selection equation (whether the firm had
innovation expenditure or not). The starting point was the model estimated for 18 countries in (OECD
2009) where the variables included in the selection were dummies for: group membership, exporting
activities, collaboration with other firms in innovation activities and the firm being large. Moreover
the authors included variables describing the role of the barriers to innovation faced by the firm (in a
0-‐3 Likert scale). We decided to exclude barriers to innovation activities, because this variable proved
problematic in the OECD study (and so it did in previous studies of ours). While the OECD model
includes industry dummies as controls, we used industry categories defined by technology intensity.
Although the OECD study is restricted to firms with positive innovation expenditure only, we did not 61 A related effect was hypothesized by Lerner in his analysis of the American SBIR programme: the government support could have been a kind of ‘quality certificate’ enabling the firm to raise funds from private sources.
31
want to lose the information, so our models are estimated on the whole sample of companies.
Consequently, the collaboration dummy that is technically available only for innovating firms, was
extended so as to indicate zero in case of non-‐innovators. The OECD model includes pretty much the
same variables in the ‘outcome equation’ i.e. in the model explaining the amount of innovation
expenditure, and in addition to that the dummy indicating public support for innovation. We roughly
follow that methodology.
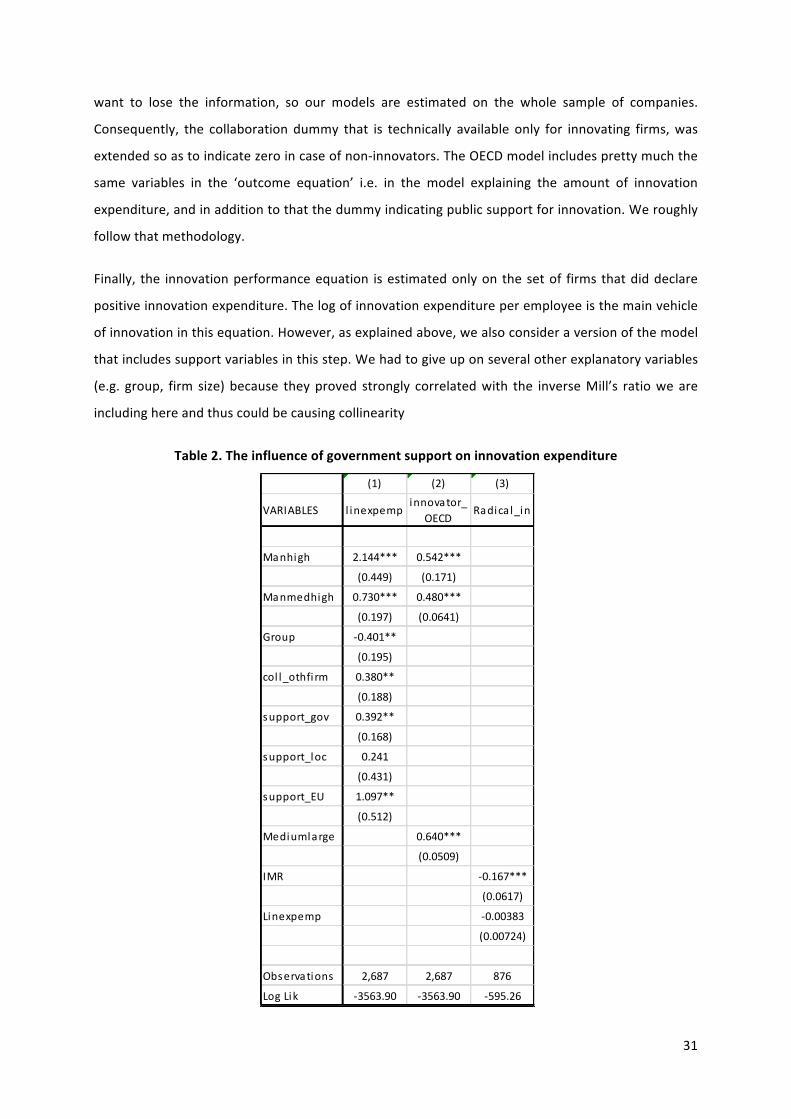
Finally, the innovation performance equation is estimated only on the set of firms that did declare
positive innovation expenditure. The log of innovation expenditure per employee is the main vehicle
of innovation in this equation. However, as explained above, we also consider a version of the model
that includes support variables in this step. We had to give up on several other explanatory variables
(e.g. group, firm size) because they proved strongly correlated with the inverse Mill’s ratio we are
including here and thus could be causing collinearity
Table 2. The influence of government support on innovation expenditure
(1) (2) (3)
VARIABLES l inexpempinnovator_
OECDRadica l_in
Manhigh 2.144*** 0.542***
(0.449) (0.171)
Manmedhigh 0.730*** 0.480***
(0.197) (0.0641)
Group -‐0.401**
(0.195)
col l_othfi rm 0.380**
(0.188)
support_gov 0.392**
(0.168)
support_loc 0.241
(0.431)
support_EU 1.097**
(0.512)
Mediumlarge 0.640***
(0.0509)
IMR -‐0.167***
(0.0617)
Linexpemp -‐0.00383
(0.00724)
Observations 2,687 2,687 876
Log Lik -‐3563.90 -‐3563.90 -‐595.26
32
Standard errors in parentheses *** p<0.01, ** p<0.05, * p<0.1
The results of the basic model are presented in Table 2.62 Larger firms are more likely to have
innovation expenditure in Turkey, and so are firms from more advanced industries in terms of
technology. Not surprisingly, government support has a statistically significant and positive impact on
innovation expenditure. The probability to introduce radical product innovation increases with
innovation expenditure (although it does not apply to all sources of support). The coefficient was
insignificant. When the support dummy is included also in the innovation performance equation,
innovation expenditure becomes insignificant (Table 3). The support obtained from central
government is associated with a better innovation performance in Turkey. While these results
indicate the importance of government support, they are a bit puzzling (innovation expenditure
insignificant, mixed results with respect to the kinds of support).
Table 3. The influence of government support on innovation expenditure and innovation
performance
62 For the variables used in the model, see Table A1 in the appendix.

33
Standard errors in parentheses *** p<0.01, ** p<0.05, * p<0.1
(1) (2) (3) (4)
VARIABLES linexpempinnovator_OECD radical_in radical_in
Manhigh 2.230*** 0.543***-‐0.447 -‐0.171
Manmedhigh 0.753*** 0.481***-‐0.197 -‐0.0641
Group -‐0.370*-‐0.195
coll_othfirm 0.424**-‐0.187
sup_ino 0.454*** 0.103***-‐0.165 (0.0343)
Mediumlarge 0.640***-‐0.0509
IMR -‐0.149** -‐0.146**(0.0624) (0.0627)
Linexpemp -‐0.00665 -‐0.00704(0.00745) (0.00748)
support_gov 0.0880**(0.0352)
support_loc 0.0938(0.0901)
support_EU 0.0632(0.109)
Observations 2,687 2,687 876 876
Log Lik -‐3566.4 -‐3566.4 -‐590.80 -‐590.80
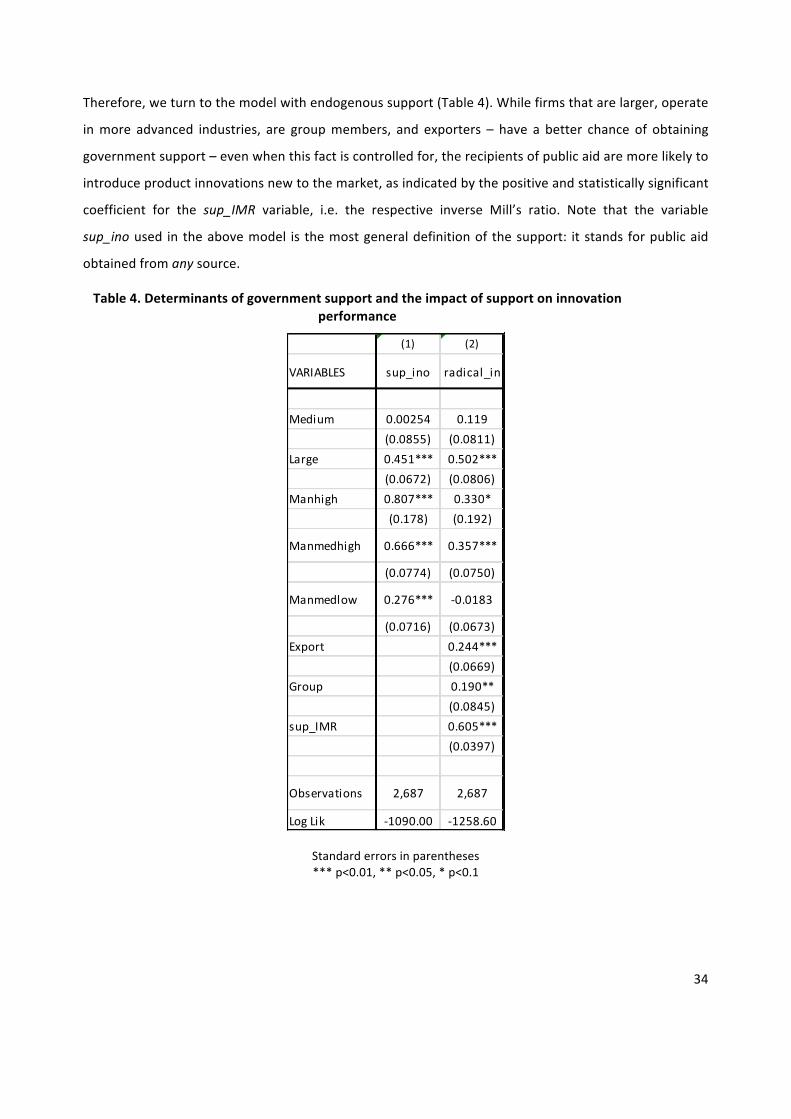
34
Therefore, we turn to the model with endogenous support (Table 4). While firms that are larger, operate
in more advanced industries, are group members, and exporters – have a better chance of obtaining
government support – even when this fact is controlled for, the recipients of public aid are more likely to
introduce product innovations new to the market, as indicated by the positive and statistically significant
coefficient for the sup_IMR variable, i.e. the respective inverse Mill’s ratio. Note that the variable
sup_ino used in the above model is the most general definition of the support: it stands for public aid
obtained from any source.
Table 4. Determinants of government support and the impact of support on innovation performance
Standard errors in parentheses *** p<0.01, ** p<0.05, * p<0.1
(1) (2)
VARIABLES sup_ino radical_in
Medium 0.00254 0.119(0.0855) (0.0811)
Large 0.451*** 0.502***(0.0672) (0.0806)
Manhigh 0.807*** 0.330*(0.178) (0.192)
Manmedhigh 0.666*** 0.357***
(0.0774) (0.0750)
Manmedlow 0.276*** -‐0.0183
(0.0716) (0.0673)Export 0.244***
(0.0669)Group 0.190**
(0.0845)sup_IMR 0.605***
(0.0397)
Observations 2,687 2,687
Log Lik -‐1090.00 -‐1258.60
35
Extension of the Model As mentioned previously, we matched the Turkish innovation survey with two other data bases
containing firm-‐level data for Turkey. This enabled us to replicate the CDM model estimated for 18
countries in the OECD Microdata project as examined in (OECD 2009). We extended the OECD model by
using besides any innovation support, three different types of innovation support granted by central
government, by local authorities and through funds coming from EU. Secondly, we used the
methodology suggested in Griffith et al. (2006) which allows us to estimate the innovation output and
productivity equations for all the firms present in the sample, not only for innovators – which increased
significantly the number of observations used in regressions.
In the sequel, we first present the CDM model used in in the OCD Microdata project (OECD 2009). We
then estimate it on Turkish data which, it should be reminded, is based on a sample of firms covering all
the sectors – not solely the manufacturing sector. We then estimate and discuss different extensions of
the OECD model with the emphasis being each time on the impact of innovation support granted to
firms on their innovation expenditures and innovation output.
CDM model used in the OECD Microdata Project63 The CDM model used in the (OECD 2009) for a
number of countries that agreed to participate in the project has the following characteristics.
First, the model is estimated only for innovative firms, defined as those firms having both positive
innovation expenditures and innovative sales. Secondly, endogeneity and selectivity issues are addressed
within the model. Third, a core model containing variables available to all the countries participating in
the project was specified in order for the countries to be able to estimate the same equations. Finally,
only variables obtained from innovation surveys are used in the project.
The CDM model used in the OECD project involves three stages and consists of four equations. We
analyze them below by putting the emphasis on the dependent and explanatory variables included in
different equations of the model on the one hand, and on the methods used to alleviate selectivity and
endogeneity. The first stage of CDM model explains innovation propensity (decision) of firms and the
volume of innovation expenditure through a generalized Tobit model. As mentioned in OECD (2009:
128), the limited availability of data on non-‐innovative firms in innovation surveys leads to the selection
of these variables in the first stage.
63 See also chapter 3 (Innovation and productivity: estimating the core model across 18 OECD countries) in OECD 2009
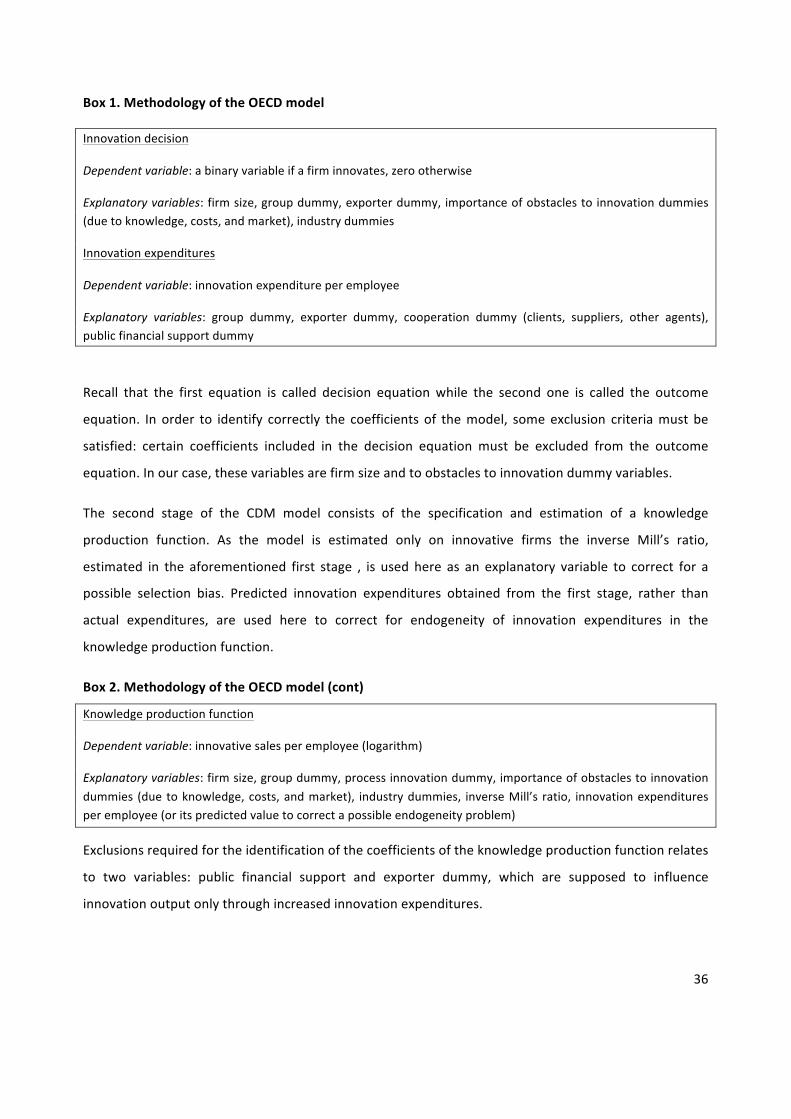
36
Box 1. Methodology of the OECD model
Innovation decision
Dependent variable: a binary variable if a firm innovates, zero otherwise
Explanatory variables: firm size, group dummy, exporter dummy, importance of obstacles to innovation dummies (due to knowledge, costs, and market), industry dummies
Innovation expenditures
Dependent variable: innovation expenditure per employee
Explanatory variables: group dummy, exporter dummy, cooperation dummy (clients, suppliers, other agents), public financial support dummy
Recall that the first equation is called decision equation while the second one is called the outcome
equation. In order to identify correctly the coefficients of the model, some exclusion criteria must be
satisfied: certain coefficients included in the decision equation must be excluded from the outcome
equation. In our case, these variables are firm size and to obstacles to innovation dummy variables.
The second stage of the CDM model consists of the specification and estimation of a knowledge
production function. As the model is estimated only on innovative firms the inverse Mill’s ratio,
estimated in the aforementioned first stage , is used here as an explanatory variable to correct for a
possible selection bias. Predicted innovation expenditures obtained from the first stage, rather than
actual expenditures, are used here to correct for endogeneity of innovation expenditures in the
knowledge production function.
Box 2. Methodology of the OECD model (cont)
Knowledge production function
Dependent variable: innovative sales per employee (logarithm)
Explanatory variables: firm size, group dummy, process innovation dummy, importance of obstacles to innovation dummies (due to knowledge, costs, and market), industry dummies, inverse Mill’s ratio, innovation expenditures per employee (or its predicted value to correct a possible endogeneity problem)
Exclusions required for the identification of the coefficients of the knowledge production function relates
to two variables: public financial support and exporter dummy, which are supposed to influence
innovation output only through increased innovation expenditures.
37
In the third and final step of the model the link between innovation output (knowledge) and productivity
is investigated through an augmented Cobb Douglas function.
Box 3. Methodology of the OECD model (cont)
Productivity function
Dependent variable: sales per employee (logarithm)
Explanatory variables: firm size, group dummy, process innovation dummy, inverse Mill’s ratio, exporter dummy, innovative sales per employee (logarithm)
Since innovative sales per employee present in the augmented Cobb Douglas production function might
be potentially an endogenous variable, this equation is estimated using instrumental variables two-‐stage
least squares.
Estimation of the basic CDM model used in the OECD Microdata Project
Estimation results for the basic OECD model for Turkey are presented in Tables 5-‐8.. These tables report
coefficients for the innovation decision variable, not marginal effects of the explanatory variables. Most
of the explanatory variables included in these tables were presented previously while discussing the
OECD project. In Table 5, we present estimation results for the basic OECD model where any innovation
support variable (sup_ino) is included only in the innovation expenditures equation. Linexemp is
logarithm of the innovation expenditures per employee, innovator is a dummy variable taking the value
1 if a firm has positive innoıvation expenditures, zero otherwise. Linsalemp is the logarithm of the
innovative sales per employee. Lvalademp stands for the logarithm of firm-‐level labour productivity,
measured as value added divided by the number of employees. Lemp represent logarithm of the number
of employees (firm size). Coll_othfirm is a dummy variable taking the value of 1 if a firm collaborates with
any other company in order to innovate, zeros otherwise. Sector-‐level dummies introduced in
regressions are: manhigh (hi-‐tech manufacturing industries), manmedhigh (high-‐medium tech
manufacturing industries) manmedlow (medium-‐low technology manufacturing industries), kis
(knowledge-‐intensive service industries) and lkis (low knowledge intensive service industries). The
omitted category is low-‐tech manufacturing industries. Amills is the inverse Mill’s ratio retrieved from
the Heckman selection equation and used in the innovation expenditure in order to mitigate a possible
selection bias since this equation is estimated only on Linexpemp_hat is linexpemp variable, which is
instrumented.
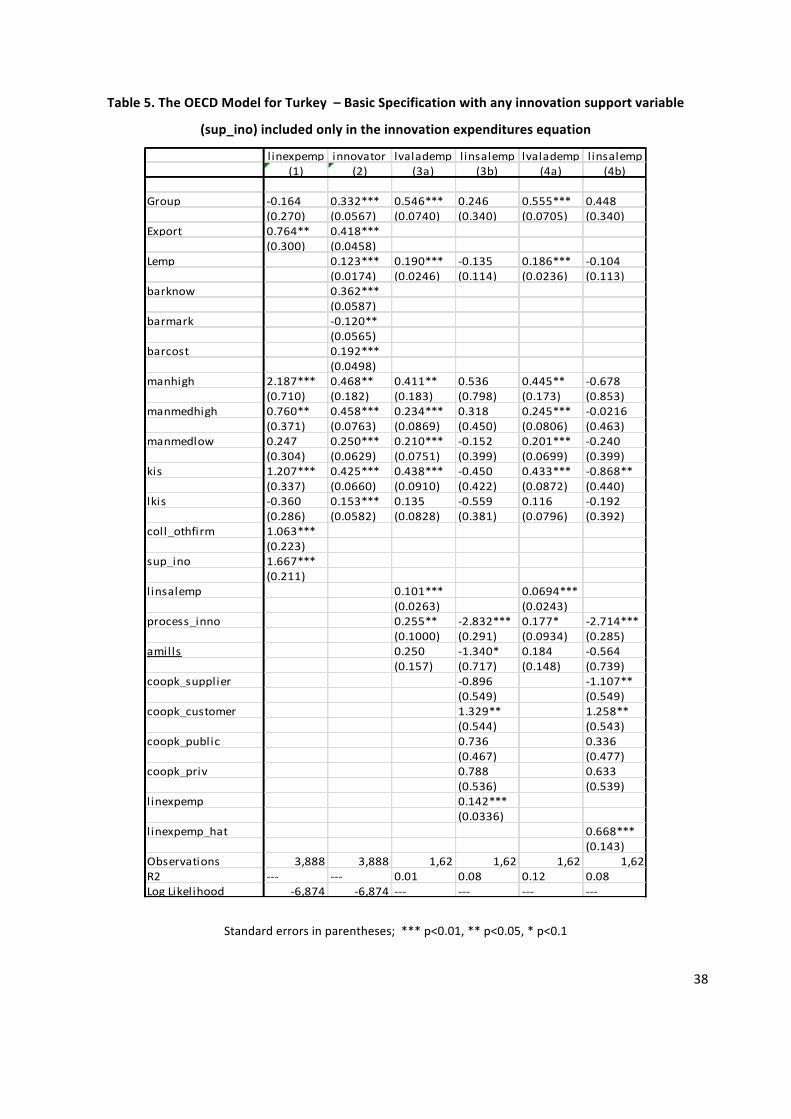
38
Table 5. The OECD Model for Turkey – Basic Specification with any innovation support variable
(sup_ino) included only in the innovation expenditures equation
Standard errors in parentheses; *** p<0.01, ** p<0.05, * p<0.1
l inexpemp innovator lvalademp linsalemp lvalademp linsalemp(1) (2) (3a) (3b) (4a) (4b)
Group -‐0.164 0.332*** 0.546*** 0.246 0.555*** 0.448(0.270) (0.0567) (0.0740) (0.340) (0.0705) (0.340)
Export 0.764** 0.418***(0.300) (0.0458)
Lemp 0.123*** 0.190*** -‐0.135 0.186*** -‐0.104(0.0174) (0.0246) (0.114) (0.0236) (0.113)
barknow 0.362***(0.0587)
barmark -‐0.120**(0.0565)
barcost 0.192***(0.0498)
manhigh 2.187*** 0.468** 0.411** 0.536 0.445** -‐0.678(0.710) (0.182) (0.183) (0.798) (0.173) (0.853)
manmedhigh 0.760** 0.458*** 0.234*** 0.318 0.245*** -‐0.0216(0.371) (0.0763) (0.0869) (0.450) (0.0806) (0.463)
manmedlow 0.247 0.250*** 0.210*** -‐0.152 0.201*** -‐0.240(0.304) (0.0629) (0.0751) (0.399) (0.0699) (0.399)
kis 1.207*** 0.425*** 0.438*** -‐0.450 0.433*** -‐0.868**(0.337) (0.0660) (0.0910) (0.422) (0.0872) (0.440)
lkis -‐0.360 0.153*** 0.135 -‐0.559 0.116 -‐0.192(0.286) (0.0582) (0.0828) (0.381) (0.0796) (0.392)
coll_othfirm 1.063***(0.223)
sup_ino 1.667***(0.211)
linsalemp 0.101*** 0.0694***(0.0263) (0.0243)
process_inno 0.255** -‐2.832*** 0.177* -‐2.714***(0.1000) (0.291) (0.0934) (0.285)
amills 0.250 -‐1.340* 0.184 -‐0.564(0.157) (0.717) (0.148) (0.739)
coopk_supplier -‐0.896 -‐1.107**(0.549) (0.549)
coopk_customer 1.329** 1.258**(0.544) (0.543)
coopk_public 0.736 0.336(0.467) (0.477)
coopk_priv 0.788 0.633(0.536) (0.539)
linexpemp 0.142***(0.0336)
linexpemp_hat 0.668***(0.143)
Observations 3,888 3,888 1,62 1,62 1,62 1,62R2 -‐-‐-‐ -‐-‐-‐ 0.01 0.08 0.12 0.08Log Likelihood -‐6,874 -‐6,874 -‐-‐-‐ -‐-‐-‐ -‐-‐-‐ -‐-‐-‐
39
This instrumented variable is used in the innovation output equation (linsalemp) in an attempt to
mitigate a possible reverse causality problem between innovation input and innovation output variables.
This instrumented variable is used as an explanatory variable alternatively with the actual innovation
expenditure variable (linexpemp) in the innovation output equation.
Coefficients reported in Table 5 indicate that direct innovation support of any kind granted by public
authorities does exert a positive and statistically significant effect on the innovation expenditures of
Turkish firms. This result points to the existence of input additionality, indicating that on average firms
would have spent less for innovation in the absence of the direct support. Besides, innovation
expenditures -‐ whether they are measured by actual expenditures or by the instrumented one – exert a
positive and significant effect on innovation output. Similarly, innovation output –measured by the
actual innovative sales per employee – increases productivity of firms.
Table 6 replicates estimation of the model presented in Table 5 but with a major difference: any
innovation support variable (sup_ino) is replaced by the three support variables: (i) a dummy variable
taking the value of 1 if a firm receives an innovation support from an organization associated with the
central government (support_gov), zero otherwise (ii) a dummy variable taking the value of 1 if a firm
receives an innovation support granted by a local authority (support_loc), zero otherwise and (iii) a
dummy variable taking the value of 1 if a firm receives an innovation support from EU funds
(support_EU), zero otherwise.
Coefficients estimated with these three different types of support among explanatory variables are
reported in Table 5. Innovation support provided by central government – the most common type of
support – has a positive and significant effect at the 1% level on innovation expenditures of firms,
indicating the presence of an input additionality effect. Such an additionality concerns also innovation
support originating from EU funds but it is significant only at the 10% level. There is no statistical
evidence as to any positive impact of support granted by local authorities on innovation expenditures of
firms (note that it’s coefficient is negative).Besides, variables measuring innovation expenditures exert a
positive and significant effect on innovation output (innovative sales per employee) while the innovation
output variable itself has also a positive and significant effect on labor productivity. Next, we will
introduce different innovation support variables not only in the innovation expenditure equation to test
for the input additionality but also in the innovation output model to test for the output additionality of
innovation support in Turkey.

40
Table 6. The OECD Model for Turkey – Basic Specification with different types of innovation support (support_gov, support_loc, support_EU) included only in the innovation expenditures equation
Standard errors in parentheses; *** p<0.01, ** p<0.05, * p<0.1
l inexpemp innovator lvalademp linsalemp lvalademp linsalemp(1) (2) (3a) (3b) (4a) (4b)
Group -‐0.603** 0.346*** 0.545*** 0.222 0.557*** 0.494(0.274) (0.0562) (0.0752) (0.345) (0.0703) (0.352)
Export 0.0261 0.424***(0.287) (0.0454)
Lemp 0.102*** 0.186*** -‐0.123 0.182*** -‐0.130(0.0185) (0.0239) (0.111) (0.0225) (0.110)
Barknow 0.331***(0.0572)
Barmark -‐0.107**(0.0533)
Barcost 0.181***(0.0469)
manhigh 0.557*** 0.418** 0.455 0.459*** 0.476(0.165) (0.184) (0.810) (0.171) (0.794)
manmedhigh 0.449*** 0.227*** 0.311 0.242*** 0.266(0.0737) (0.0871) (0.453) (0.0795) (0.454)
manmedlow 0.229*** 0.203*** -‐0.142 0.192*** -‐0.179(0.0603) (0.0746) (0.397) (0.0681) (0.397)
kis 0.462*** 0.440*** -‐0.490 0.430*** -‐0.419(0.0616) (0.0924) (0.430) (0.0877) (0.431)
lkis 0.111** 0.126 -‐0.522 0.104 -‐0.539(0.0561) (0.0825) (0.379) (0.0778) (0.380)
coll_othfirm 1.013***(0.224)
support_gov 1.741***(0.223)
support_loc -‐0.374(0.527)
support_EU 1.110*(0.645)
linsalemp 0.1000*** 0.0575**(0.0263) (0.0257)
process_inno 0.253** -‐2.831*** 0.148 -‐2.720***(0.0999) (0.291) (0.0954) (0.286)
amills 0.234 -‐1.382* 0.141 -‐1.486**(0.162) (0.739) (0.152) (0.736)
coopk_supplier -‐0.897 -‐1.018*(0.549) (0.546)
coopk_customer 1.331** 1.315**(0.544) (0.540)
coopk_public 0.738 0.363(0.467) (0.482)
coopk_priv 0.785 0.696(0.536) (0.539)
linexpemp 0.142***(0.0336)
linexpemp_hat 0.534***(0.139)
Observations 3,888 3,888 1,62 1,62 1,62 1,62R2 -‐-‐-‐ -‐-‐-‐ 0.012 0.083 0.153 0.079Log Likelihood -‐6,882 -‐6,882 -‐-‐-‐ -‐-‐-‐ -‐-‐-‐ -‐-‐-‐
41
In Table 6, any innovation support variable (sup_ino) is included both in the innovation expenditure and
innovation output equations. Although its positive and significant effect on innovation expenditures
observed in Table 5 is conserved, no such significant impact is observed on innovative sales per
employee, pointing to the absence of output additionality of supports. Another possible explanation is
that we are using cross-‐section data but materialization of a possible effect of innovation support on
innovation output may need a long period of time – longer than what is needed for input additionality.
In Table 7, we introduced the three types of innovation support instead of sup_ino variable in the model.
The positive and significant effect of government and EU supports on innovation expenditure is
confirmed here. EU support on innovation seems to exert a positive and significant effect on innovative
sales per employee – but it is significant only at the 10% level – while government support has a negative
effect which is, however, only significant at the 10 % level. In both Table 6 and Table 7 the positive and
significant effect of innovation expenditure on innovation output is conserved as well as the positive
impact of innovation output on firm-‐level productivity in Turkey.
Finally, results presented in Table 8 and Table 9 are based on the methodology discussed in Griffith et al.
(2006). This methodology uses innovation probabilities computed after the Heckman procedure to
estimate the innovation input (expenditure) and output (innovative sales) on all sample firms, innovators
and non-‐innovators all together. This procedure increases considerably the number of observations
hence degrees of freedom for the estimation of the CDM model.
Results reported in Table 9 confirm those obtained previously: innovation support by government and
EU funds both have a positive and significant impact on innovation expenditures, confirming the
previously found input additionality effect for these two types of support. Absence of a significant effect
of local innovation support on innovation expenditures is also confirmed.
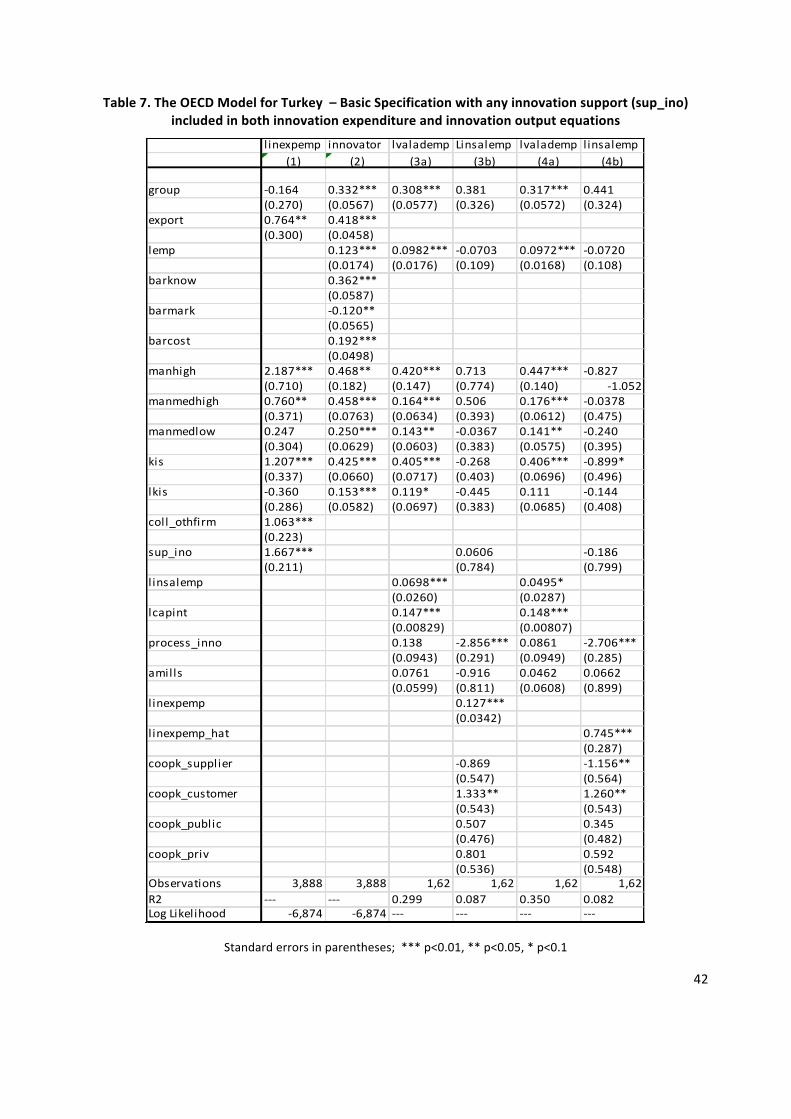
42
Table 7. The OECD Model for Turkey – Basic Specification with any innovation support (sup_ino) included in both innovation expenditure and innovation output equations
Standard errors in parentheses; *** p<0.01, ** p<0.05, * p<0.1
l inexpemp innovator lvalademp Linsalemp lvalademp linsalemp(1) (2) (3a) (3b) (4a) (4b)
group -‐0.164 0.332*** 0.308*** 0.381 0.317*** 0.441(0.270) (0.0567) (0.0577) (0.326) (0.0572) (0.324)
export 0.764** 0.418***(0.300) (0.0458)
lemp 0.123*** 0.0982*** -‐0.0703 0.0972*** -‐0.0720(0.0174) (0.0176) (0.109) (0.0168) (0.108)
barknow 0.362***(0.0587)
barmark -‐0.120**(0.0565)
barcost 0.192***(0.0498)
manhigh 2.187*** 0.468** 0.420*** 0.713 0.447*** -‐0.827(0.710) (0.182) (0.147) (0.774) (0.140) -‐1.052
manmedhigh 0.760** 0.458*** 0.164*** 0.506 0.176*** -‐0.0378(0.371) (0.0763) (0.0634) (0.393) (0.0612) (0.475)
manmedlow 0.247 0.250*** 0.143** -‐0.0367 0.141** -‐0.240(0.304) (0.0629) (0.0603) (0.383) (0.0575) (0.395)
kis 1.207*** 0.425*** 0.405*** -‐0.268 0.406*** -‐0.899*(0.337) (0.0660) (0.0717) (0.403) (0.0696) (0.496)
lkis -‐0.360 0.153*** 0.119* -‐0.445 0.111 -‐0.144(0.286) (0.0582) (0.0697) (0.383) (0.0685) (0.408)
coll_othfirm 1.063***(0.223)
sup_ino 1.667*** 0.0606 -‐0.186(0.211) (0.784) (0.799)
linsalemp 0.0698*** 0.0495*(0.0260) (0.0287)
lcapint 0.147*** 0.148***(0.00829) (0.00807)
process_inno 0.138 -‐2.856*** 0.0861 -‐2.706***(0.0943) (0.291) (0.0949) (0.285)
amills 0.0761 -‐0.916 0.0462 0.0662(0.0599) (0.811) (0.0608) (0.899)
linexpemp 0.127***(0.0342)
linexpemp_hat 0.745***(0.287)
coopk_supplier -‐0.869 -‐1.156**(0.547) (0.564)
coopk_customer 1.333** 1.260**(0.543) (0.543)
coopk_public 0.507 0.345(0.476) (0.482)
coopk_priv 0.801 0.592(0.536) (0.548)
Observations 3,888 3,888 1,62 1,62 1,62 1,62R2 -‐-‐-‐ -‐-‐-‐ 0.299 0.087 0.350 0.082Log Likelihood -‐6,874 -‐6,874 -‐-‐-‐ -‐-‐-‐ -‐-‐-‐ -‐-‐-‐
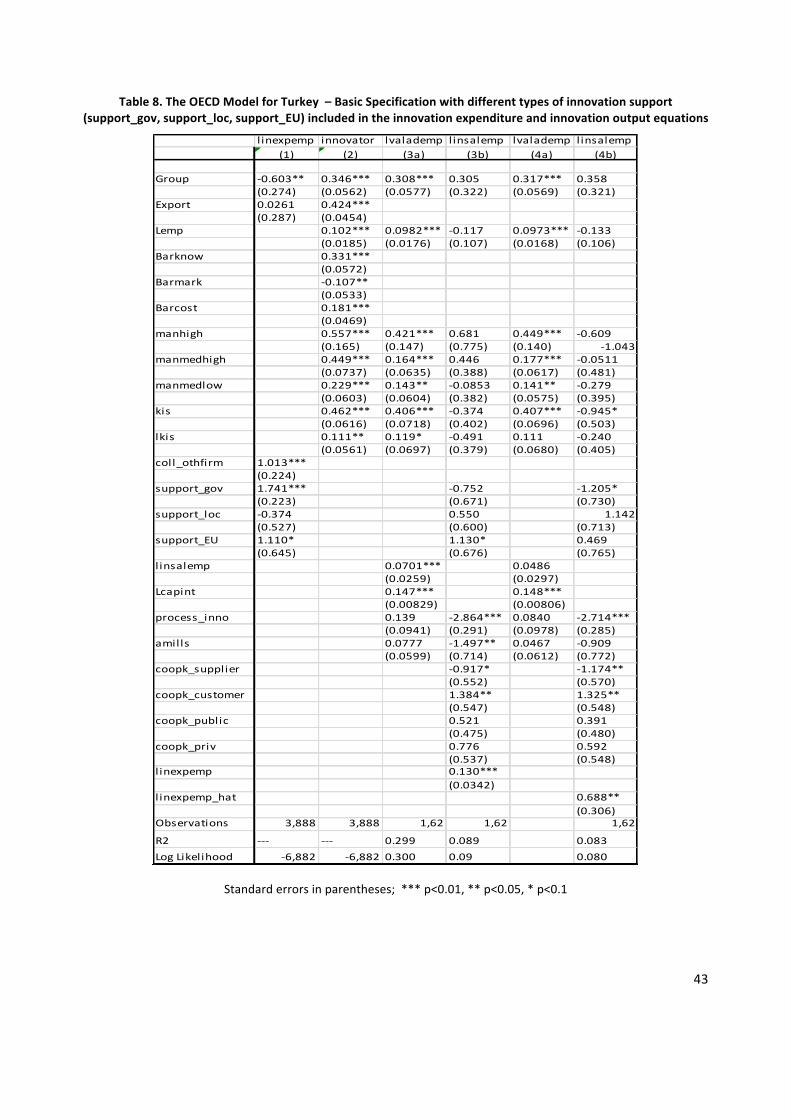
43
Table 8. The OECD Model for Turkey – Basic Specification with different types of innovation support (support_gov, support_loc, support_EU) included in the innovation expenditure and innovation output equations
Standard errors in parentheses; *** p<0.01, ** p<0.05, * p<0.1
l inexpemp innovator lvalademp linsalemp lvalademp linsalemp(1) (2) (3a) (3b) (4a) (4b)
Group -‐0.603** 0.346*** 0.308*** 0.305 0.317*** 0.358(0.274) (0.0562) (0.0577) (0.322) (0.0569) (0.321)
Export 0.0261 0.424***(0.287) (0.0454)
Lemp 0.102*** 0.0982*** -‐0.117 0.0973*** -‐0.133(0.0185) (0.0176) (0.107) (0.0168) (0.106)
Barknow 0.331***(0.0572)
Barmark -‐0.107**(0.0533)
Barcost 0.181***(0.0469)
manhigh 0.557*** 0.421*** 0.681 0.449*** -‐0.609(0.165) (0.147) (0.775) (0.140) -‐1.043
manmedhigh 0.449*** 0.164*** 0.446 0.177*** -‐0.0511(0.0737) (0.0635) (0.388) (0.0617) (0.481)
manmedlow 0.229*** 0.143** -‐0.0853 0.141** -‐0.279(0.0603) (0.0604) (0.382) (0.0575) (0.395)
kis 0.462*** 0.406*** -‐0.374 0.407*** -‐0.945*(0.0616) (0.0718) (0.402) (0.0696) (0.503)
lkis 0.111** 0.119* -‐0.491 0.111 -‐0.240(0.0561) (0.0697) (0.379) (0.0680) (0.405)
coll_othfirm 1.013***(0.224)
support_gov 1.741*** -‐0.752 -‐1.205*(0.223) (0.671) (0.730)
support_loc -‐0.374 0.550 1.142(0.527) (0.600) (0.713)
support_EU 1.110* 1.130* 0.469(0.645) (0.676) (0.765)
linsalemp 0.0701*** 0.0486(0.0259) (0.0297)
Lcapint 0.147*** 0.148***(0.00829) (0.00806)
process_inno 0.139 -‐2.864*** 0.0840 -‐2.714***(0.0941) (0.291) (0.0978) (0.285)
amills 0.0777 -‐1.497** 0.0467 -‐0.909(0.0599) (0.714) (0.0612) (0.772)
coopk_supplier -‐0.917* -‐1.174**(0.552) (0.570)
coopk_customer 1.384** 1.325**(0.547) (0.548)
coopk_public 0.521 0.391(0.475) (0.480)
coopk_priv 0.776 0.592(0.537) (0.548)
linexpemp 0.130***(0.0342)
linexpemp_hat 0.688**(0.306)
Observations 3,888 3,888 1,62 1,62 1,62
R2 -‐-‐-‐ -‐-‐-‐ 0.299 0.089 0.083Log Likelihood -‐6,882 -‐6,882 0.300 0.09 0.080
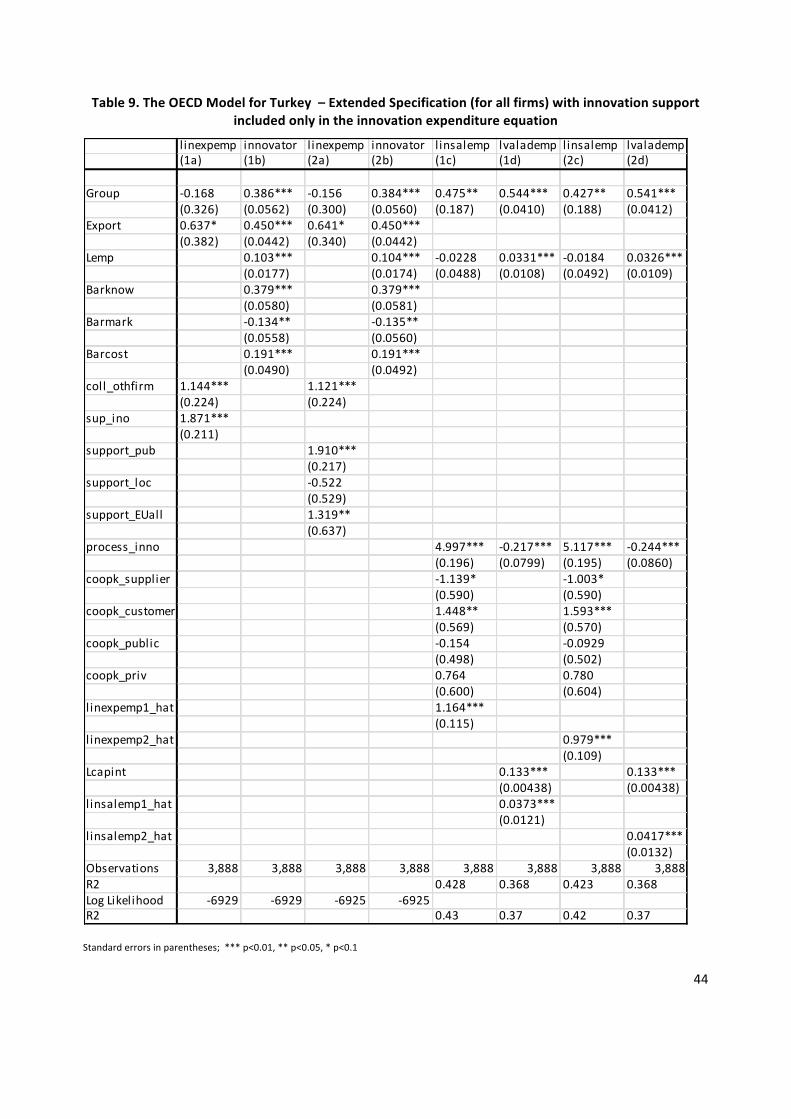
44
Table 9. The OECD Model for Turkey – Extended Specification (for all firms) with innovation support included only in the innovation expenditure equation
Standard errors in parentheses; *** p<0.01, ** p<0.05, * p<0.1
l inexpemp innovator linexpemp innovator linsalemp lvalademp linsalemp lvalademp(1a) (1b) (2a) (2b) (1c) (1d) (2c) (2d)
Group -‐0.168 0.386*** -‐0.156 0.384*** 0.475** 0.544*** 0.427** 0.541***(0.326) (0.0562) (0.300) (0.0560) (0.187) (0.0410) (0.188) (0.0412)
Export 0.637* 0.450*** 0.641* 0.450***(0.382) (0.0442) (0.340) (0.0442)
Lemp 0.103*** 0.104*** -‐0.0228 0.0331*** -‐0.0184 0.0326***(0.0177) (0.0174) (0.0488) (0.0108) (0.0492) (0.0109)
Barknow 0.379*** 0.379***(0.0580) (0.0581)
Barmark -‐0.134** -‐0.135**(0.0558) (0.0560)
Barcost 0.191*** 0.191***(0.0490) (0.0492)
coll_othfirm 1.144*** 1.121***(0.224) (0.224)
sup_ino 1.871***(0.211)
support_pub 1.910***(0.217)
support_loc -‐0.522(0.529)
support_EUall 1.319**(0.637)
process_inno 4.997*** -‐0.217*** 5.117*** -‐0.244***(0.196) (0.0799) (0.195) (0.0860)
coopk_supplier -‐1.139* -‐1.003*(0.590) (0.590)
coopk_customer 1.448** 1.593***(0.569) (0.570)
coopk_public -‐0.154 -‐0.0929(0.498) (0.502)
coopk_priv 0.764 0.780(0.600) (0.604)
linexpemp1_hat 1.164***(0.115)
linexpemp2_hat 0.979***(0.109)
Lcapint 0.133*** 0.133***(0.00438) (0.00438)
linsalemp1_hat 0.0373***(0.0121)
linsalemp2_hat 0.0417***(0.0132)
Observations 3,888 3,888 3,888 3,888 3,888 3,888 3,888 3,888R2 0.428 0.368 0.423 0.368Log Likelihood -‐6929 -‐6929 -‐6925 -‐6925R2 0.43 0.37 0.42 0.37

45
Table10. The OECD Model for Turkey – Extended Specification (for all firms) with innovation support included both in the innovation expenditure and innoıvation output
equations
Standard errors in parentheses; *** p<0.01, ** p<0.05, * p<0.1
l inexpemp innovator linexpemp innovator linsalemp lvalademp linsalemp Lvalademp(1a) (1b) (2a) (2b) (1c) (1d) (2c) (2d)
group 0.0793 0.338*** -‐0.0106 0.334*** 0.245 0.544*** 0.296 0.545***(0.237) (0.0601) (0.235) (0.0600) (0.190) (0.0411) (0.189) (0.0411)
export 0.974*** 0.347*** 0.844*** 0.348***(0.223) (0.0475) (0.221) (0.0475)
sup_ino 1.934*** 0.913**(0.460) (0.404)
lemp 0.107*** 0.107*** -‐0.0160 0.0331*** -‐0.0157 0.0332***(0.0182) (0.0182) (0.0497) (0.0108) (0.0499) (0.0108)
barknow 0.301*** 0.301***(0.0640) (0.0637)
barmark -‐0.0423 -‐0.0432(0.0605) (0.0605)
barcost 0.0969* 0.0946*(0.0539) (0.0538)
coll_othfirm 1.170*** 1.140***(0.223) (0.223)
support_pub 1.734*** 0.470(0.432) (0.421)
support_loc -‐0.634 2.532***(0.560) (0.659)
support_EUall 1.361** -‐0.715(0.636) (0.786)
process_inno 5.017*** -‐0.217*** 5.066*** -‐0.207**(0.196) (0.0802) (0.196) (0.0824)
coopk_supplier -‐0.895 -‐0.987*(0.591) (0.597)
coopk_customer 1.531*** 1.582***(0.569) (0.574)
coopk_public -‐0.0901 -‐0.0730(0.499) (0.502)
coopk_priv 0.909 0.846(0.602) (0.604)
linexpemp2_hat 0.822***(0.161)
linexpemp1_hat 0.695***(0.139)
Lcapint 0.133*** 0.133***(0.00438) (0.00438)
linsalemp1_hat 0.0373***(0.0121)
linsalemp2_hat 0.0358***(0.0126)
Observations 3,888 3,888 3,888 3,888 3,888 3,888 3,888R2 -‐-‐-‐ -‐-‐-‐ -‐-‐-‐ -‐-‐-‐ 0.428 0.368 0.426Log Likelihood -‐6560 -‐6560 -‐6560 -‐6560 -‐-‐-‐ -‐-‐-‐ -‐-‐-‐

46
Results in Table 10 indicate that receiving an innovation support increases not only innovation
expenditures but also innovation output (innovative sales per employee), which points to an output
additionality effect of innovation support in Turkey. When we look at different types of support, we see
that support based on government and EU funds are again positive and statistically significant. Only
support originating from local authorities seems to have an output additionality effect.
6. CONCLUSIONS
The effectiveness of national system in Turkey can be evaluated in two interrelated dimensions: First is
the effectiveness of public support system since the government is still the main player to enhance
national research system. Second is the supply of and demand for human resources for research. In the
last decade, there are increasing attempts to improve the effectiveness of public support system. The
ratio of R&D expenditures to is targeted to be 2% by the end of 2013. In the period 2007-‐2011, the share
of BERD increases from 41.3% to 43.2%. In the same period, GERD increased to 11.3% as compared to
10.6% in 2007 whereas HERD falls to 45.5% from 48.2% in 2007. We can describe the effectiveness of
public support system through two further axes. First is the extensive impact of the supports in terms of
their diffusiveness and second is the contribution of supports in transforming the whole system. In the
first axis, we can surely claim that the spectrum of public supports have been seriously enriched with
various tools. In the private sector, the supports are provided by numerous public institutions both
towards large scale establishments and SMEs. However, not only the quantity but also the quality of the
supports is rising. For instance, in terms of the number of project applications to TUBITAK-‐TEYDEB
projects (one of the most popular direct R&D support scheme for the private sector), the percentage of
SMEs was 45.8% in 2000 while this figure reached to 81% in 2012. On the other hand, total number of
TEYDEB project applications in the 2000-‐2012 period increased approximately by 11 times (TEYDEB,
2013). During the period, the geographical coverage of project applications has considerably expanded
as well. The similar tendencies are also observed in terms of sectoral distribution and the number of
supported projects. But what this example significantly shows is that the diffusiveness of public support
system improved in the last decade. This further enhances the effectiveness of the system. Another
important attempt is the sectoral prioritization in policy formulation. The National Science, Technology
and Innovation Strategy (2011-‐2016) approved in 22nd meeting of BTYK in December 2010. Automotive,
machinery and production technologies, ICT, energy, water, food, security and space were identified as
priority sectors under the strategy. Health sector has been also recently added as a new S&T priority
sector in 25th meeting of BTYK in January 2013.

47
As compared to these attempts, especially the ones directed towards supply side of ST-‐HR, the attempts
in the demand side are rather weak. The ST-‐HR needs of industry, public sector and universities are
almost unknown. This lack of knowledge is an important impediment for an effective long-‐term planning
in ST-‐HR. Although MoD planned to carry out such a study for higher education, the public procurement
for this project postponed twice and the future of the study is still unclear. In sum, against all the
attempts to improve ST-‐HR, there is a long way to take in this issue in terms of the effectiveness of
national research system.
In the next period, three important concerns to increase the effectiveness of national research system
through public support system will be commercialization of R&D outputs by innovation supports; impact
assessment of public support system; and support for innovative activities in public services. Turkey is
especially suffering from the non-‐existence of an effective impact assessment system. The establishment
of such a system and regular assessment and evaluation activities of policies and programmes at the
support-‐providing institution level, at the sector level and at the national level will enhance the
effectiveness of national research system.
In Turkey, one can observe the growing popularity and the generous practices of public incentives in
industrial R&D and innovation, in addition to the recent trends in public policies to support technological
entrepreneurship and commercialization of research output. Since 2004, significant changes and
improvements that have taken place in Turkey concerning science and technology policy schemes have
actually influenced the national innovation system in a number of ways: important increase has been
observed in public support provided to private R&D; diversification of direct support programmes for
private R&D and innovation occurred, which was tailored to the needs of potential innovators; widening
of the scope of existing fiscal incentives for private R&D activities and implementation of new ones
occurred; implementation of new call-‐based grant programmes targeted to technology areas and
industries based on national priorities.
In this study, to assess the efficiency of public support system, an econometric methodology is applied to
the Turkish 2008-‐2010 editions of the Community Innovation Survey for manufacturing firms. Two
models were estimated: one following the now classical CDM model and assessing the role of innovation
spendings, but assuming government support exogenous; and another controlling for the endogeneity of
support but assuming a simplified version of the innovation performance equation.

48
The evidence indicates that government support contributes to higher innovation spending by firms
(input additionality) and this in turn improves their chances to introduce product innovations (output
additionality). The positive impact remains valid even when a possibly non-‐random selection of firms for
government support programmes is controlled for. Extended analysis for Turkey proved a positive
relationship between innovation and firm productivity.
Several recommendations both for policy and for further research can be formulated. In Turkey, while
the general assessment of innovation support policy is positive, the puzzling element is the that the EU-‐
related support (mainly from the 7th Framework Programme) was a significant incentive to increase
firms’ innovation activities – despite constituting less than 2% of the total public support in Turkey. Since
in Turkey all the EU supported R&D projects are based on international collaboration, only 1.5 % of R&D
and innovation projects that are supported by national programs are collaborative. Therefore, existing
mechanisms should be strengthen and new policy instruments should be developed both for universities
and private sector. Further research is necessary to investigate the success of EU-‐funded programmes on
one hand – and the apparent failure of the schemes organized on the local (subnational) level, on the
other.
For the short and medium term, it is important that innovation is placed at the heart of the development
and growth process, and is integrated and embedded in each policy area. It is expected that the new
governance system and existing high-‐level commitment for achieving the new targets set for 2023 will
contribute to the enrichment of the policy mix with the design and implementation of new instruments.
49
References
Edquist, Charles (2006) National Systems of Innovation. In : The Oxford Handbook on Innovation, eds. Jan
Fagerberg, David C. Mowery, Richard C. Nelson, 148-‐179, Oxford, Oxford University Press.
Goldberg, I.; Goddard, J.G (2011) Igniting Innovation: International Bank for Reconstruction and
Development (World Bank e-‐Library).
Hall, Bronwyn H.; Lerner, Josh (2010) Chapter 14 -‐ The Financing of R&D and Innovation. In Bronwyn H.
Hall, Nathan Rosenberg (Eds.): Handbook of The Economics of Innovation, Vol. 1, vol. 1: North-‐Holland
(Handbook of the Economics of Innovation), pp. 609–639.
Heckman, James J. (1976) The Common Structure of Statistical Models of Truncation, Sample Selection
and Limited Dependent Variables and a Simple Estimator for Such Models. In : Annals of Economic and
Social Measurement, Volume 5, number 4: National Bureau of Economic Research, Inc (NBER Chapters),
pp. 475–492.
Heckman, James J. (1979) Sample Selection Bias as a Specification Error. In Econometrica 47 (1), pp. 153–
161.
Lerner, Josh (1999) Small Businesses, Innovation, and Public Policy. In : Zoltan J. Acs. Are Small Firms
Important? Their Role and Impact, Amsterdam, Kluwer Academic Publishers.
Metcalfe, J. S. (1994) Evolutionary Economics and Technology Policy. In The Economic Journal 104 (425),
pp. p 931-‐944.
Metcalfe, J. S. (1995) Technology Systems and Technology Policy in an Evolutionary Framework. In
Cambridge Journal of Economics 19 (1), pp. 25–46.
OECD (2009) Innovation in Firms: A Microeconomic Perspective, Paris, OECD Publishing.
Pavitt, Keith (1990) What We Know about the Strategic Management of Technology. In California
Management Review 32 (3), pp. p 17-‐26.
Tirole, Jean (2005) The Theory of Corporate Finance: Princeton University Press.
50
van Bruno Pottelsberghe, Malwina Mejer (2008) The London Agreement and the Cost of Patenting in
Europe. Bruegel (264).
Web Sources:
EUROSTAT, 2012, Patent Applications to the EPO and patents granted by the USPTO, 2001-‐2010,
http://epp.eurostat.ec.europa.eu/statistics_explained/index.php?title=File:Patent_applications_to_the_
EPO_and_patents_granted_by_the_USPTO,_2001-‐2010.png&filetimestamp=20121016060342
EUROSTAT, 2012, Science, Technology and Innovation Statistics,
http://epp.eurostat.ec.europa.eu/portal/page/portal/science_technology_innovation/data/main_tables
EUROSTAT, 2012, Population Statistics,
http://epp.eurostat.ec.europa.eu/portal/page/portal/population/data/main_tables
FP7, 2012, EU 7th Framework Programme Mid-‐term Evaluation Report,
http://www.fp7.org.tr/tubitak_content_files//GenelHaber/7CPRaporTemmuz2012.pdf
IMF, 2013, World Economic Outlook Database,
http://www.imf.org/external/pubs/ft/weo/2012/02/weodata/index.aspx
IUC, 2012, Innovation Union Competitiveness Report, http://ec.europa.eu/research/innovation-‐
union/pdf/competitiveness-‐report/2011/iuc2011-‐full-‐report.pdf#view=fit&pagemode=none
IUS, 2011, Innovation Union Scoreboard 2011, http://www.proinno-‐europe.eu/inno-‐
metrics/page/innovation-‐union-‐scoreboard-‐2011
KOSGEB, 2012, Plans and Reports, http://www.kosgeb.gov.tr/Pages/UI/Baskanligimiz.aspx?ref=23
MoF, 2012, 2013 Budget Presentation Speech,
http://www.tbmm.gov.tr/butce/2013/konusma_30_Ekim_2012.pdf
MoSIT, 2011, SME Strategy and Action Plan 2011-‐2013,
http://www.sanayi.gov.tr/Files/Documents/KOSGEB_Katalog.pdf
MoSIT, 2011, Turkish Industrial Strategy Document 2011-‐2014,
http://www.sanayi.gov.tr/Files/Attachments/OtherFiles/turkish_industrial_strate-‐16022011152724.pdf
51
MoSIT, 2012, Entrepreneurial and Innovative University Index of Turkey,
http://www.sanayi.gov.tr/Pages.aspx?pageID=744&lng=tr
MoSIT, 2012, Statistics on R&D Centers, http://sagm.sanayi.gov.tr/Files/Documents/web-‐ar-‐ge-‐istatistik-‐
26-‐0-‐08082012101635.docx
MoSIT, 2012, Technology Development Zones,
http://sagm.sanayi.gov.tr/userfiles/file/GENEL%20BR%C4%B0F%C4%B0NG%2007_01_13.doc
MoSIT, 2012, Entrepreneurship Council,
http://www.sanayi.gov.tr/NewsDetails.aspx?newsID=2292&lng=tr
OSYM, 2012, Higher Education Statistics for 2011-‐2012, http://osym.gov.tr/belge/1-‐13575/2011-‐2012-‐
ogretim-‐yili-‐yuksekogretim-‐istatistikleri.html
TPE, 2013, Patent Statistics, http://www.tpe.gov.tr/portal/default_en.jsp?sayfa=170
TUBITAK, 2011, 23th Meeting of BTYK, http://tubitak.gov.tr/tr/kurumsal/bilim-‐ve-‐teknoloji-‐yuksek-‐
kurulu/toplantilar/icerik-‐bilim-‐ve-‐teknoloji-‐yuksek-‐kurulu-‐23toplantisi-‐27-‐aralik-‐2011
TUBITAK, 2012, 24th Meeting of BTYK, http://tubitak.gov.tr/tr/kurumsal/bilim-‐ve-‐teknoloji-‐yuksek-‐
kurulu/toplantilar/icerik-‐bilim-‐ve-‐teknoloji-‐yuksek-‐kurulu-‐24toplantisi-‐7-‐agustos-‐2012
TUBITAK, 2012, Legislation on the Establishment of TUBITAK,
http://www.tubitak.gov.tr/tubitak_content_files//mevzuat/yonetmelik/KANUN_278_temmuz-‐2012.pdf
TUBITAK, 2012, Science and Technology Human Resource Strategy and Action Plan,
http://www.tubitak.gov.tr/tubitak_content_files//BTYPD/strateji_belgeleri/BT_IK_STRATEJI_BELGESI_20
11_2016.pdf
TUBITAK, 2012, Science, Technology and Innovation Statistics,
http://tubitak.gov.tr/tr/kurumsal/politikalar/icerik-‐bty-‐istatistikleri
TUBITAK, 2012, Turkey Publication Statistics, http://www.ulakbim.gov.tr/cabim/yayin/tr-‐veri.uhtml
52
TUBITAK, 2013, 25th Meeting of BTYK, http://tubitak.gov.tr/tr/kurumsal/bilim-‐ve-‐teknoloji-‐yuksek-‐
kurulu/toplantilar/icerik-‐bilim-‐ve-‐teknoloji-‐yuksek-‐kurulu-‐25toplantisi-‐15-‐ocak-‐2013
TUBITAK, 2013, National Support Programmes, http://www.tubitak.gov.tr/sid/2415/pid/2400/index.htm
TURKSTAT, 2012, Population Statistics, http://www.turkstat.gov.tr/PreHaberBultenleri.do?id=10736
TURKSTAT, 2012, GDP Statistics, http://www.turkstat.gov.tr/PreHaberBultenleri.do?id=10955
TURKSTAT, 2012, Research and Developmen Activities Survey,
http://www.turkstat.gov.tr/PreHaberBultenleri.do?id=10931
UNCTAD, 2012, World Investment Report 2012, http://www.unctad-‐docs.org/files/UNCTAD-‐WIR2012-‐
Full-‐en.pdf
World Economic Forum, 2012, Global Competitiveness Report 2012-‐2013,
http://www3.weforum.org/docs/WEF_GlobalCompetitivenessReport_2012-‐13.pdf
YOK, 2012, University Statistics, https://www.yok.gov.tr/content/view/527/222/lang,tr/
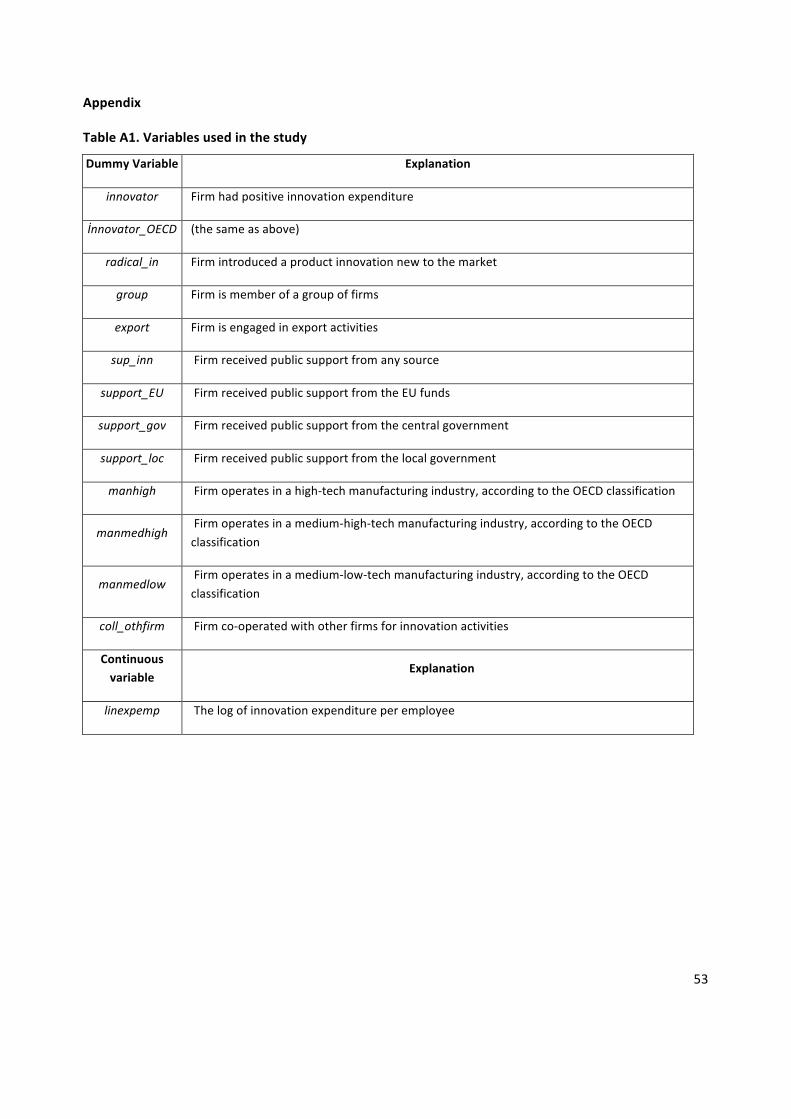
53
Appendix
Table A1. Variables used in the study
Dummy Variable Explanation
innovator Firm had positive innovation expenditure
İnnovator_OECD (the same as above)
radical_in Firm introduced a product innovation new to the market
group Firm is member of a group of firms
export Firm is engaged in export activities
sup_inn Firm received public support from any source
support_EU Firm received public support from the EU funds
support_gov Firm received public support from the central government
support_loc Firm received public support from the local government
manhigh Firm operates in a high-‐tech manufacturing industry, according to the OECD classification
manmedhigh Firm operates in a medium-‐high-‐tech manufacturing industry, according to the OECD classification
manmedlow Firm operates in a medium-‐low-‐tech manufacturing industry, according to the OECD classification
coll_othfirm Firm co-‐operated with other firms for innovation activities
Continuous variable
Explanation
linexpemp The log of innovation expenditure per employee