Identification of novel Theileria parva candidate vaccine ...
Upload
independentCategory
view
2download
0
INVESTIGATION
Insight Into Genomic Changes AccompanyingDivergence: Genetic Linkage Maps and Syntenyof Lucania goodei and L. parva Reveala Robertsonian FusionEmma L. Berdan,*,1,2,3 Genevieve M. Kozak,*,1 Ray Ming,† A. Lane Rayburn,‡ Ryan Kiehart,§
and Rebecca C. Fuller**Department of Animal Biology, University of Illinois, Champaign, Illinois 61820, †Department of Plant Biology, and‡Department of Crop Sciences, University of Illinois, Urbana, Illinois 61801, and §Department of Biology, Ursinus College,Collegeville, Pennsylvania 19426
ABSTRACT Linkage maps are important tools in evolutionary genetics and in studies of speciation. Weperformed a karyotyping study and constructed high-density linkage maps for two closely related killifishspecies, Lucania parva and L. goodei, that differ in salinity tolerance and still hybridize in their contact zone inFlorida. Using SNPs from orthologous EST contigs, we compared synteny between the two species to de-termine how genomic architecture has shifted with divergence. Karyotyping revealed that L. goodei possesses24 acrocentric chromosomes (1N) whereas L. parva possesses 23 chromosomes (1N), one of which is a largemetacentric chromosome. Likewise, high-density single-nucleotide polymorphism2based linkage maps in-dicated 24 linkage groups for L. goodei and 23 linkage groups for L. parva. Synteny mapping revealed twolinkage groups in L. goodei that were highly syntenic with the largest linkage group in L. parva. Together, thisevidence points to the largest linkage group in L. parva being the result of a chromosomal fusion. We furthercompared synteny between Lucania with the genome of a more distant teleost relative medaka (Oryziaslatipes) and found good conservation of synteny at the chromosomal level. Each Lucania LG had a singlebest match with each medaka chromosome. These results provide the groundwork for future studies on thegenetic architecture of reproductive isolation and salinity tolerance in Lucania and other Fundulidae.
KEYWORDS
syntenyRobertsonianfusion
chromosomalrearrangement
linkage mapspeciationEST-based SNPsfundulidae
Species-specific linkage maps are critical to understanding genomicarchitecture and how it differs between species. Linkage maps allow theexploration of genotype-phenotype relationships through quantitativetrait loci mapping (Falconer and Mackay 1996; for examples, seePeichel et al. 2001; Tripathi et al. 2009) and the comparison of geno-mic architecture between species via synteny mapping (Prince et al.1993; Backstrom et al. 2008; Muchero et al. 2009; Lucas et al. 2011;McGraw et al. 2011). However, the majority of previous studies ofgenome-wide synteny have used pairs of species that are distantlyrelated (i.e., from different orders or families: Stapley et al. 2008; Jaariet al. 2009; Foley et al. 2011; McGraw et al. 2011). It is less commonfor comparisons of synteny to be made within the same genus (but seeMing et al. 1998; Rogers et al. 2007; Lubieniecki et al. 2010; Lee et al.2011; Timusk et al. 2011; Naish et al. 2013). High-density linkagemaps are now possible with the advent of high-throughput sequencingand have the potential to facilitate fine-scale comparisons of syntenybetween closely related species. These comparisons are needed to
Copyright © 2014 Berdan et al.doi: 10.1534/g3.114.012096Manuscript received February 25, 2014; accepted for publication May 20, 2014;published Early Online June 3, 2014.This is an open-access article distributed under the terms of the CreativeCommons Attribution Unported License (http://creativecommons.org/licenses/by/3.0/), which permits unrestricted use, distribution, and reproduction in anymedium, provided the original work is properly cited.Supporting information is available online at http://www.g3journal.org/lookup/suppl/doi:10.1534/g3.114.012096/-/DC1The population-specific Illumina transcriptome sequences are archived inGenBank (bio-project ID: PRJNA215087). Source and probe sequences fromthe Illumina Infinium chip are accessible on Dryad (http://datadryad.org/resource/doi:10.5061/dryad.hv75h/9).1These authors contributed equally to this work.2Present address: Museum für Naturkunde, Leibniz-Institut für Evolutions-undBiodiversitätsforschung, Berlin, Germany.
3Corresponding author: Museum für Naturkunde, Leibniz-Institut für Evolutions-undBiodiversitätsforschung, Invalidenstraße 43, 10115 Berlin, Germany.E-mail: [email protected]
Volume 4 | August 2014 | 1363

determine how genome structure diverges and potentially contributesto speciation.
The problem for maintaining species boundaries in areas of sympatryis that gene flow between species and recombination in hybrids shouldhomogenize species-specific traits and break down reproductive isolatingbarriers. Genomic rearrangements, such as chromosomal fusions,inversions, or deletions, can potentially facilitate the maintenanceof reproductive isolating barriers because they reduce recombination inportions of the genome (Rieseberg 2001; Butlin 2005; Faria and Navarro2010). Data from a wide range of taxa support the theory that genesconferring reproductive isolation between sympatric species often arelocalized to rearranged areas of the genome (Rieseberg et al. 1999; Nooret al. 2001; Coluzzi et al. 2002; Feder et al. 2003; Kitano et al. 2009).
One way to study the role of genomic rearrangements in speciation isto compare synteny between species that hybridize at low levels. We dothis in Lucania, a genus that is becoming a model system for ecologicalspeciation research. The bluefin killifish (Lucania goodei) and the rain-water killifish (L. parva) are two closely related species that differ radi-cally in their salinity tolerance (Duggins et al. 1983; Whitehead 2010).Lucania goodei is found primarily in freshwater habitats, whereasL. parva is euryhaline and can be found in fresh, brackish, and marinehabitats (Lee et al. 1980). Survival at various life stages differs betweenLucania species in different salinities (Fuller et al. 2007; Fuller 2008).Lucania goodei and L. parva also show divergence in sequence andexpression of a number of salinity tolerance genes (Berdan and Fuller2012; Kozak et al. 2014). Despite these ecological differences betweenspecies, there is evidence for low levels of ongoing hybridization insympatric populations. Sympatric populations exist in the Atlantic andGulf coastal waterways of Florida (Fuller and Noa 2008). Hubbs et al.(1943) found hybrids based on morphological characters in one popu-lation, and analysis of mtDNA suggests recent gene flow between thetwo species in multiple river drainages in Florida (R. C. Fuller, unpub-lished data). We hypothesized that differences in genome structure mightcontribute to speciation in Lucania. This hypothesis was sparked by anunsupported comment made in an older study; Uyeno and Miller (1971)stated that chromosome number differs between L. goodei and L. parvabut did not provide any evidence to support this statement.
The purpose of this study was to determine whether L. goodei andL. parva differ in genomic architecture. To do this, we (1) karyotyped bothspecies and (2) produced two high-density single-nucleotide polymor-phism (SNP)-based linkage maps. Transcriptome sequencing and high-throughput SNP genotyping were performed in both species to create thelinkage maps. These data allowed us to determine (1) the number ofchromosomes possessed by each species, (2) whether a fusion/fission eventhad occurred, and (3) patterns of synteny between the two species. Weanalyzed synteny at the linkage group (LG) level and at the level of markerorder to determine whether large or small-scale genomic rearrangementshave occurred during divergence (Gale and Devos 1998; Ming et al. 1998;Wang et al. 2010). We further compared synteny in Lucaniawith the mostclosely related species with a sequenced genome, medaka (Oryzias latipes)to ask how Lucania genomic architecture corresponds to that of otherteleost fish (Kasahara et al. 2007). These linkage maps will enable futurestudies to ask whether the areas of the genome contributing to salinitytolerance also are implicated in reproductive isolation and whether thesetraits map to genomic rearrangements in Lucania.
MATERIALS AND METHODS
KaryotypingSomatic karyotypes were determined for both L. goodei and L. parvausing metaphase spreads. For each species, animals of both sexes from
multiple populations were used. Details on the karyotyping methodscan be found in Supporting Information, File S1. In summary, indi-viduals were injected intraperitoneally at 0 hr with a phytohemagglu-tinin solution to stimulate mitosis, injected at 24 hr with 1% colchicinesolution, and then killed at 26 hr using MS-222. The gills were re-moved, placed in chilled distilled water to allow the cells to swell(30 min), then fixed in a 3:1 methanol/glacial acetic acid mixture(30 min). The gills were dabbed on the slides to break the cellsand release the chromosomes. Slides were cleared, dried, stainedwith 5% Giemsa solution (Electron Microscopy Sciences, Hatfield,PA), mounted with Permount, and visualized using a compoundmicroscope.
Comparative genetic linkage maps: overviewGenetic linkage maps were created separately for both L. goodei andL. parva from F2 mapping crosses between two geographically isolatedpopulations. The key to comparing the genetic linkage maps betweenthe two species was to use SNP markers from orthologous expressedsequence tags (ESTs; from 454 and Illumina sequencing) that wereexpressed in both species (Figure 1). F2 offspring and F1 parents weregenotyped using an Illumina Infinium Bead Chip custom designed forLucania.
Mapping crossesFor each species, crosses were set up between geographically andecologically divergent populations. For Lucania goodei, these popula-tions were Upper Bridge from the spring-fed Wakulla River (WakullaCounty, Florida) and a swamp population in the Everglades (BrowardCounty, Florida). For Lucania parva, the populations were IndianRiver Lagoon, an Atlantic coast population where salinity is typically35 ppt (Brevard County, Florida) and Pecos River, a freshwater inlandriver in Texas (Pecos-Crockett County border, Texas). Between pop-ulation breeding pairs were established in both hybrid cross directions.Cross designs for the creation of the F1 parents are described forL. goodei in Fuller et al. (2010) and for L. parva in Kozak et al.(2012). F1 hybrid offspring were then raised to adulthood and pairedwith unrelated F1 hybrid individuals to create F2 offspring. For L. parva,we created and genotyped 161 F2 offspring from 8 F2 families and 16 F1parents (parents from 11 F1 families: 4 Indian River female · Pecosmale crosses; 7 Pecos female · Indian River male crosses; see Kozaket al. 2012). For L. goodei, we created and genotyped 303 F2 offspring
Figure 1 Procedures used to generate single-nucleotide polymor-phisms (SNPs) from orthologous expressed sequence tags (ESTs) forlinkage maps.
1364 | E. L. Berdan et al.

from 14 F2 families and 28 F1 parents (21 F1 families: 11 Upper Bridgefemale · Everglades male crosses; 10 Everglades female · Upper Bridgemale crosses).
F2 eggs were collected and raised in freshwater with dilute methyleneblue (an antifungicide). Fry were fed newly hatched Artemia and raisedto 1 month postfertilization. The fry were then killed in MS-222, pre-served in ethanol, and stored at 280�. F1 parents and F0 grandparentswere preserved in ethanol. F2 family sizes ranged from 15 to 24 fry.
Creation of population-specific EST librariesRNA was extracted from five males and five females from the twoL. goodei populations (Upper Bridge and Everglades) and the twoL. parva populations (Indian River and Pecos River). Fish were killedin MS-222. Tissue samples were taken from the gills (122 arches),dorsal fins, eyes, brain, and the gonads (ovaries or testes). RNA wasextracted using a protocol modified from Carleton (2011: see File S1).A pooled sample containing RNA from all tissues was created for eachpopulation that contained equal amounts of RNA from all individuals.The RNA was submitted to the Keck Center for Comparative andFunctional Genomics at the University of Illinois for creation ofcDNA libraries and sequenced using Illumina HiSequation 2000(see File S1). The two populations from L. goodei were uniquelybarcoded and run on a single lane of Illumina HiSeq for 100-bp paired-end sequencing. Indian River L. parva and Pecos River L. parva wererun on separate lanes. Average quality scores were above 20 for allcycles. Samples produced from 5 to 10 billion bases of data (readsper end: Upper Bridge = 29,661,140, Everglades = 26,235,855, PecosRiver = 55,535,778, Indian River = 53,061,233). The population specificIllumina transcriptome sequences are archived in Genbank (bio-projectID: PRJNA215087).
In addition, 454 sequencing was done on pooled samples of RNAfrom five L. goodei populations across Florida (1: Upper BridgeWakulla River, Wakulla, Co., FL; 2: St. Mark’s National Wildlife Ref-uge Gambo Bayou, Wakulla, Co., FL; 3: 26-Mile Bend, Everglades,Broward Co., FL; 4: Rum Island Park, Santa Fe River, Columbia Co.,FL; and 5: Delk’s Bluff Bridge, Oklawaha River, Marion Co., FL).These sequences were used to construct a reference upon which sub-sequent assembly was based (see section: Assembly and alignment;reference available in Dryad accompanying this paper). Tissue sam-ples were taken from the gills, fins, eyes, brain, and gonads (ovaries ortestes). Additional details on the 454 project can be found in Fullerand Claricoates (2011).
Assembly and alignmentLucania goodei 454 sequences were used as a reference for the assem-bly. For the reference, contigs were assembled using Newbler assem-bler (454 Life Sciences, Branford, CT). Assembly parameters were asfollows: the minimum contig length was set at 200 bp, the minimumoverlap length was 60 bp, and the minimum overlap identity was 95%.A total of 29,838 contigs were generated by the Newbler assembler.Using the L. goodei 454 contigs as a reference anchored the analysis ofshorter Illumina sequences and allowed identification of contigs thatcontained multiple SNPs. The goal was to find contigs containinga SNP that was diagnostic for the two L. goodei populations as wellas a SNP that was diagnostic for the two L. parva populations. Thismethod may have missed L. parva contigs that were not expressed inL. goodei, but these contigs are uninformative for the comparison oflinkage maps. Illumina sequences were trimmed to 75 bp in lengthand aligned against the reference using Novoalign (Novocraft Tech-nologies; www.novocraft.com). Alignment parameters were as follows:the maximum alignment score acceptable for a best alignment was set
at 45; the gap extend penalty was set at 10; and the number of goodquality bases for an acceptable read was set at 50.
SNP selectionThe alignments were exported to MAQ (i.e., Mapping and Assemblingwith Quality) software (see Fuller and Claricoates 2011 for details) forSNP detection. Diagnostic SNPs for each population were identifiedusing its population pair as a reference. SNPs were considered to bediagnostic when they were identified unambiguously for both popula-tions. There were many more diagnostic SNPs between the two L. parvapopulations than there were between two L. goodei populations. Toincrease the number of SNPs for L. goodei, SNPs were used that werefixed in one population but were segregating in the alternate population.
Candidate SNPs were submitted to Illumina for initial evaluationfor suitability for the Infinium Genotyping Assay. There were threeclasses of SNPs: L. parva2specific SNPs were SNPs that were segre-gating within L. parva, L. goodei2specific SNPs were SNPs that weresegregating within L. goodei, and between species SNPs that were fixed(or nearly fixed) between the two species. The between species SNPs
Figure 2 Somatic metaphase/anaphase spread of (A) Lucania parvaand (B) L. goodei. The arrow in (A) indicates the fused chromosome.
Volume 4 August 2014 | Killifish Linkage Maps | 1365

were designed for another study. The custom Infinium bead chip heldprobes for 4545 SNPs. Of these, 1497 were candidate SNPs forL. goodei, 1369 were candidate SNPs for L. parva, and 1679 werecandidate between species SNPs. All SNPs were labeled with the IDnumber of the contig in which they occur. Protein annotations for thelinkage map contigs were obtained using blastX searches against tel-eost reference proteomes (Atlantic killifish: Fundulus heteroclitus, Jap-anese medaka: Oryzia latipes, three-spined stickleback: Gasterosteusaculeatus, guppy: Poecilia reticulata) and human complete proteome(Uniprot release 2012_8 available at: ftp://ftp.uniprot.org/pub/databases/uniprot/previous_releases/release-2012_08/uniref/). Only contigs thatmatched a single protein in each species with a blast score .100 wereconsidered high confidence annotations (Table S1). Proteins that
matched multiple contigs located on different LGs were removed fromthe annotations.
DNA extraction and SNP genotypingDNA was extracted using a modified version of the PureGene (GentraSystems; www.gentra.com) extraction protocol over 4 days (see FileS1). Sample concentration and quality were verified using a Nanodropspectrophotometer (Thermo Fisher Scientific, Waltham, MA). DNAsamples were diluted to 75 mg/mL in nuclease-free water and thengenotyped at all SNPs using the Lucania Illumina Infinium BeadChip. Source and probe sequences from the chip are accessible onDryad (http://datadryad.org/resource/doi:10.5061/dryad.hv75h/9). Beadchips were scanned using the iScan System (Illumina) at the KeckCenter for Comparative and Functional Genomics at The Universityof Illinois. Illumina GenomeStudio (v2011.1) was used for genotypecalls. Cluster positioning was performed separately for L. goodei andL. parva SNPs (no-call threshold was set to 0.15). Population-specificSNP alleles were verified from genotypes of 16 Upper Bridge L. goodei(7 males, 9 females), 17 Everglades L. goodei (7 males, 10 females), 6Indian River L. parva (3 males, 3 females), and 5 Pecos River L. parva(3 males, 2 females). Genotype data were analyzed separately for eachfamily. For each family, SNPs were removed if either (1) genotypeswere homozygous in both parents thereby guaranteeing all offspringwere homozygotes, or (2) the genotype was a no-call (i.e., the sampledid not run) for one or both parents. Not all SNPs were fixed between
n Table 1 Summary of integrated linkage maps for L. parvaand L. goodei
L. parva L. goodei
No. chromosomes 23 24No. linkage groups 23 24Map size, cM 605 392Average linkage group size, cM 26.3 16.3Markers per cM 1.26 2.41Total no. markers 766 915No. individuals 161 303
Figure 3 Lucania parva linkage map. Numbers on the right of each linkage group indicate the marker name and numbers on the left indicate theposition in centimorgans (cM).
1366 | E. L. Berdan et al.
the two L. goodei populations, so we also genotyped the F0 grandparentsto clarify phases.
Linkage map creationFor each species, individual maps were constructed for each individualF2 family (14 for L. goodei; 8 for L. parva) using JoinMap 4.1 (Li et al.2008). Parental and grandparental genotypes provided phase informa-tion for each locus. Grouping thresholds of LOD 4.0 (L. goodei) and3.5 (L. parva) were used and markers significantly out of Hardy-Weinberg equilibrium (P, 0.001) were excluded. The Kosambi map-ping function (Kosambi 1944) was used to convert recombinationfrequencies to cM. For each species, a consensus map was constructedusing the Map Integration tool in JoinMap from the individual familymap inputs. Linkage groups from individual families were joined ifthey shared two or more markers. MapChart 2.2 (Stam 1993) wasused for graphical representation of the consensus map for each spe-cies. Lucania parva LGs were numbered in descending order based ontotal length in cM. Lucania goodei LGs were numbered based uponsynteny with L. parva LGs (see section: Synteny comparisons).
Synteny comparisonsTo compare synteny between L. parva and L. goodei, SNPs designedfrom a common contig were considered to be putatively orthologous.
Consistent clusters of SNPs from common contigs in both species pro-vided evidence of synteny at the LG level (i.e., SNPs from the samecontigs clustered together in both species). Within LGs, marker orderwas compared among orthologous SNPs by performing rank ordercorrelations between species. Lucania goodei and L. parva LGs also werecompared with chromosomes from medaka (Oryzias latipes), the mostclosely related species with a fully sequenced genome [both are in thesuperorder Acanthopterygii (Steinke et al. 2006)]. Sequences of contigs inthe Lucania linkage maps were blasted against medaka sequences usingblastn. If a given contig had highly significant blast hits (bit score. 100)against a single medaka LG, then its approximate position was estimatedin the medaka genome. However, if a given contig had multiple, highlysignificant blast hits on multiple medaka LGs, then the orthologouslocation in the medaka genome could not be determined. Hence, syntenywas examined at the level of LG clustering for the L. goodei and L. parva,L. goodei and medaka, and L. parva and medaka comparisons. Syntenywas examined at the level marker order for only the L. goodei andL. parva comparison. False-discovery rate P-values were calculated forrank order correlations using fdrtool in R (Strimmer 2008).
Flow cytometryThe genome size of both species was estimated using flow cytometryto determine how much recombination was occurring per megabase.
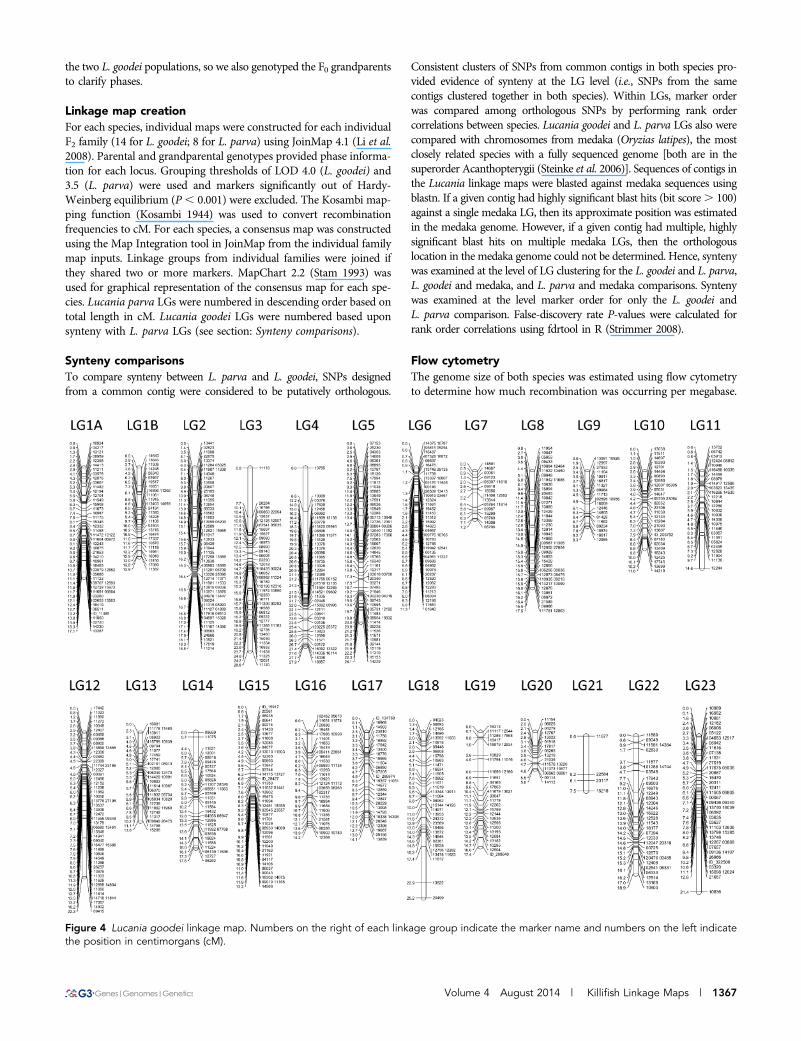
Figure 4 Lucania goodei linkage map. Numbers on the right of each linkage group indicate the marker name and numbers on the left indicatethe position in centimorgans (cM).
Volume 4 August 2014 | Killifish Linkage Maps | 1367

Four L. goodei and four L. parva individuals were collected from theLower Bridge site on the Wakulla River, Florida. The DNA content oferythrocyte nuclei was measured using flow cytometry at UrsinusCollege (see File S1). Betta splendens was used as a standard.
RESULTSThe two Lucania species differed in chromosome number. Lucaniaparva had 23 chromosomes (Figure 2A). Twenty-two of these wereacrocentric chromosomes of similar size, and one was a metacentricchromosome approximately twice the size of the other chromosomes(denoted by an arrow in Figure 2A). Lucania goodei had 24 acrocen-tric chromosomes (Figure 2B).
The number of chromosomes corresponded well to the number ofLGs that were recovered. For L. parva, 23 linkage groups were found,which matched the number of chromosomes observed in the karyo-type. Specifically, 766 SNP markers were resolved into 23 LGs (Table1; Figure 3). Many of these SNP markers came from an EST thatcorresponded to a known protein, many of which could be assigneda putative function (Table S1). The number of markers per linkagegroup (LG) ranged from 18 (LG 20) to 59 (LG 1). The total length ofthe map was 605 cM with the average LG being 26.3 cM (Table 1).Marker density was 1.26 markers per cM on average spanning from0.67 (LG 7) to 2.22 (LG 18). Marker density was relatively consistentwith the largest gap being 13 cM on LG 8 and with 32 gaps of 4 cM orlarger across the map. Average genome size (C-value) in L. parva was1.423 pg (range: 1.396-1.450). One centimorgan in L. parva is thusapproximately 2.3 Mb.
Similarly, the number of LGs recovered for L. goodei matched thenumber of chromosomes (1N = 24). Significant linkages were foundfor 915 SNP markers making up 24 LGs (Table 1; Figure 4). Again,many of these SNP markers came from an EST that corresponded toa known protein (Table S1). The number of markers per LG rangedfrom 4 (LG 21) to 66 (LG 2). The linkage map spanned 392 cM withthe average LG size being 16.33 cM (Table 1). Average marker densitywas 2.41 markers per cM, ranging from 0.53 (LG 21) to 4.42 (LG 6).
Marker density was consistent with the largest gap being 8.7 cM onLG 23 and only 9 gaps of 4 cM or larger across the entire map.Average genome size in L. goodei was 1.349 pg (range: 1.342-1.356).One centimorgan in L. goodei is thus approximately 3.44 Mb.
Synteny of L. parva and L. goodei mapsThe LGs were highly syntenic between L. goodei and L. parva, allow-ing us to unambiguously assign orthologous LGs. Across all LGs, wefound 368 markers shared between the linkage maps that were fromputatively orthologous ESTs. Figure 5 shows that markers from theputatively orthologous ESTs clustered together in the same LGs inL. goodei and L. parva. Specifically, 364 (98.91%) markers (those froma common contig and in both linkage maps) showed a pattern ofsynteny, whereas only 4 markers (1.09%) deviated and clustered dif-ferently in the two species (Figure 5 and Figure S1).
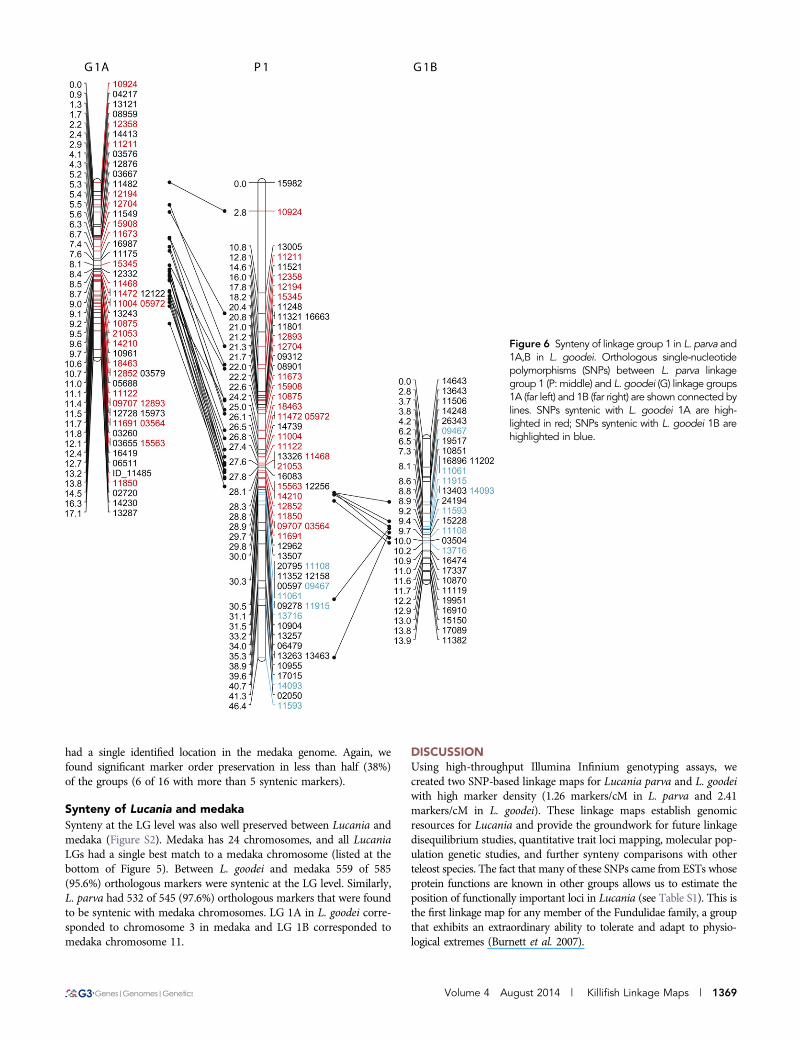
Two LGs from L. goodei were syntenic with the largest LG inL. parva, strongly suggesting that LG 1 represents the metacentricchromosome observed in the L. parva metaphase spread. Figure 6shows that LG 1A in L. goodei was syntenic with the top portion ofLG 1 in L. parva (matching at 24 markers: Figure 5), and LG 1B wassyntenic with the bottom portion (matching at 7 markers).
Synteny was less conserved at the level of marker order within LGs(Table 2). Rank order correlations were high for some LGs but werelow and nonsignificant for others. Across all LGs combined, markerorder was highly correlated in L. parva and L. goodei (Spearman rankorder correlation: n = 364, r = 0.99, P , 0.0001). When rank ordercorrelations were performed on LGs separately (and corrected formultiple testing by use of the false-discovery rate), marker order wassignificantly correlated in 11 of 23 syntenic LGs (50%; Table 2; notethat LG21 lacked sufficient orthologous markers to test marker order).The marker order correlations were not statistically significantly greaterthan zero for the other 12 LGs. To determine whether noncodingrepetitive RNAs or slight differences in the order of densely mappedmarkers were influencing this result, we repeated these synteny anal-yses using only syntenic markers $0.5 cM apart in either species that
Figure 5 Summary of synteny comparisons be-tween L. parva and L. goodei linkage groups.Bolded numbers along the diagonal show thenumber of orthologous single-nucleotide poly-morphisms on the linkage groups. Numbers offthe diagonal are nonsyntenic markers. Identity ofsyntenic medaka chromosomes listed along thebottom row.
1368 | E. L. Berdan et al.
had a single identified location in the medaka genome. Again, wefound significant marker order preservation in less than half (38%)of the groups (6 of 16 with more than 5 syntenic markers).
Synteny of Lucania and medakaSynteny at the LG level was also well preserved between Lucania andmedaka (Figure S2). Medaka has 24 chromosomes, and all LucaniaLGs had a single best match to a medaka chromosome (listed at thebottom of Figure 5). Between L. goodei and medaka 559 of 585(95.6%) orthologous markers were syntenic at the LG level. Similarly,L. parva had 532 of 545 (97.6%) orthologous markers that were foundto be syntenic with medaka chromosomes. LG 1A in L. goodei corre-sponded to chromosome 3 in medaka and LG 1B corresponded tomedaka chromosome 11.
DISCUSSIONUsing high-throughput Illumina Infinium genotyping assays, wecreated two SNP-based linkage maps for Lucania parva and L. goodeiwith high marker density (1.26 markers/cM in L. parva and 2.41markers/cM in L. goodei). These linkage maps establish genomicresources for Lucania and provide the groundwork for future linkagedisequilibrium studies, quantitative trait loci mapping, molecular pop-ulation genetic studies, and further synteny comparisons with otherteleost species. The fact that many of these SNPs came from ESTs whoseprotein functions are known in other groups allows us to estimate theposition of functionally important loci in Lucania (see Table S1). This isthe first linkage map for any member of the Fundulidae family, a groupthat exhibits an extraordinary ability to tolerate and adapt to physio-logical extremes (Burnett et al. 2007).
Figure 6 Synteny of linkage group 1 in L. parva and1A,B in L. goodei. Orthologous single-nucleotidepolymorphisms (SNPs) between L. parva linkagegroup 1 (P: middle) and L. goodei (G) linkage groups1A (far left) and 1B (far right) are shown connected bylines. SNPs syntenic with L. goodei 1A are high-lighted in red; SNPs syntenic with L. goodei 1B arehighlighted in blue.
Volume 4 August 2014 | Killifish Linkage Maps | 1369

By combining our linkage maps with actual chromosome counts, wefound strong evidence for a major chromosomal rearrangementbetween L. parva and L. goodei. Our metaphase spread showed thata large metacentric chromosome was present in L. parva and absent inL. goodei (see arrow in Figure 2). Our linkage maps indicate that thelargest L. parva LG (LG 1, 46.4 cM) is syntenic with two smallerL. goodei chromosomes (LG 1A and 1B). Comparisons of interspecificlinkage maps have previously been used in other taxa to identify chro-mosomal rearrangements between species (Tanksley et al. 1992; Burkeet al. 2004). Several pieces of evidence suggest that the metacentricchromosome is due to a Robertsonian fusion of two smaller acrocentricchromosomes in the L. parva lineage rather than a chromosomal fissionevent in the L. goodei lineage (a metacentric chromosome becoming twoacrocentric chromosomes). First, Fundulus parvipinnis is the closestrelative to Lucania (Whitehead 2010), and its karyotype is similar toL. goodei with 1N = 24 (Chen 1971). Second, L. goodei LG 1A issyntenic to chromosome 3 in medaka, and LG 1B is syntenic to chro-mosome 11. The fact that each of these two LGs map to a single LG inmedaka suggests that they are unlikely to reflect the outcome of a fissionevent. Our evidence for a chromosomal fusion clarifies a previous report(made without any supporting data) that L. parva’s karyotype of 1N =23 deviates from the typicial fundulid karyotype of 1N = 24 (Uyeno andMiller 1971). However, our evidence for a fusion should be furtherverified using in situ hybridization to determine that LG1 markers areindeed found on the metacentric chromosome in L. parva.
With the exception of the fused chromosome, comparisonsbetween our maps reveal that large-scale structure is widely conservedbetween species. At the level of the linkage group, we found highpreservation of synteny between Lucania linkage groups. We alsofound preservation of synteny between Lucania and medaka chromo-somes. Each Lucania chromosome could be assigned unambiguouslyas syntenic to a single medaka chromosome. This result is consistentwith findings from other teleost linkage maps and genomes (Schartl
et al. 2013). This degree of synteny will facilitate future comparisonswith other related teleost species for which genomic resources areemerging, such as guppies (Tripathi et al. 2009; Fraser et al. 2011)and fundulids (Cossins and Crawford 2005; Burnett et al. 2007).Currently, the fusion we document in Lucania (between chromo-somes that are syntenic to medaka 3 and 11) is unique among relatedfish species for which linkage maps exist. Guppies (Poecilia reticulata)also possess a fused chromosome, but it has occurred between twochromosomes that are syntenic to medaka 2 and 21 (Tripathi et al.2009). Tilapia (Oreochromis niloticus) possess two fused chromo-somes: one between chromosomes that are syntenic to medaka2 and 4, and another between chromosomes syntenic to medaka6 and 12 (Liu et al. 2013).
Our comparisons of synteny at the marker order level revealedsignificant marker order preservation in only half of the linkagegroups between L. parva and L. goodei. Our estimate of 50% collinearmarkers is much lower than a previous estimate of marker orderpreservation between hybridizing populations, which found that83% of markers between incipient species of whitefish (Coregonusclupeaformis) were collinear (Rogers et al. 2007). Comparisons ofchinook salmon and rainbow trout (genus Oncorhynchus) also suggesthigh preservation of marker order between congeners (Naish et al.2013). Our study differs from these previous ones because we usedSNPs derived from ESTs rather than microsatellites and consequentlyhad a much denser distribution of markers on our map. However,further work is needed to determine if the low marker-order syntenyin Lucania is genuine or simply the result of (1) low number oforthologous markers on some linkage groups, (2) genotyping errors,or (3) map construction errors due to merging maps from multiplefamilies within each species. If genuine, then the low marker-ordersynteny found in Lucania would be indicative of small-scale rear-rangements, which could potentially contribute to the reduction ofgene flow and the evolution of reproductive isolation.
n Table 2 Marker order correlations for syntenic markers on each linkage group in Lucania parva and L. goodei
LG Size L. parva, cM Size L. goodei, cM No. Syntenic Markers Spearman r P Value FDR-Corrected P Value
1 46.4 A:17.1 24 0.8183 0.000001 0.000084B:13.9 7 0.607 0.1362 0.251906
2 45.5 22 27 0.835 0.000001 0.0000843 38.7 28.6 13 0.4341 0.137904 0.2519064 34.8 27.9 22 0.9198 0.000001 0.0000845 33.5 26 28 0.7225 0.000014 0.0077196 30.2 11.3 14 0.033 0.914228 1.0000007 28.5 7.2 7 0.785714 0.0536 0.2519068 27.9 17.5 11 0.6818 0.02071 0.0303749 26.7 8.3 7 0.214286 0.5962 1.000000
10 26.5 11.6 14 0.3626 0.20193 1.00000011 25.5 14.6 13 0.1923 0.529033 1.00000012 25.2 22.2 25 0.5354 0.005817 0.03037413 22.7 13.8 17 0.348 0.170412 0.25190614 22.6 18.4 14 0.5956 0.02454 0.09428915 21 13.2 21 0.441 0.039729 0.09428916 20.6 15.3 18 0.5542 0.017116 0.03037417 20.4 14.1 7 0.142857 0.7264 1.00000018 20.3 30 22 0.8701 0.000001 0.00008419 20.2 17.9 15 0.7214 0.002382 0.00771920 19 9.5 10 0.3455 0.328748 1.00000021 18.8 7.5 2 N/A N/A N/A22 17.9 22.1 13 0.7637 0.002393 0.02193123 13.1 21.4 12 0.6783 0.0153 0.030374
LG, linkage group; FDR, false-discovery rate.
1370 | E. L. Berdan et al.
Our linkage maps for Lucania goodei and L. parva showed thata large-scale genomic rearrangement has occurred between species.This Robertsonian fusion may have aided divergence in these closelyrelated species and helped to maintain species boundaries in zones ofcontact by suppressing recombination in hybrids. Other fundulid spe-cies also differ in karyotype, and our work may give insight into themechanisms by which these changes occur. These maps will enablethe use of numerous genomic techniques to determine how reproduc-tive isolation has evolved in Lucania. The maps will also furthera general understanding of the evolution of many other unique traitsin this group including vision, color pattern, and salinity tolerance.
ACKNOWLEDGMENTSLeslie Noa and Jessie Coonley assisted with F2 crosses, fish rearing, andpreservation. Matthew Schrader and Leslie Noa assisted with RNAextractions. Mark Band, Tatsiana Akraiko (Infinium assay), and AlvaroHernandez (library preparation and sequencing) and other staff at theKeck Center for Comparative and Functional Genomics at the Uni-versity of Illinois performed the sequencing and genotyping. JamesWalsh assisted with bioinformatics and SNP calling; Lei-ting Li helpedwith Joinmap. Sairaghav Nissankula assisted with blast searches. JamesUrton and Shaun McCann provided invaluable advice and help withthe karyotype. Katie Peichel provided helpful comments on the man-uscript. This work was approved by the University of Illinois IACUC(Protocol Nos. 08183, 09306, 11143). This work was funded by theUniversity of Illinois (Research Board Award 11153) and the NationalScience Foundation (IOB 0445127, DEB 0953716, DEB 1110658). The454 L. goodei reference assembly and the joinmap files are accessible onDryad with this paper (doi: 10.5061/dryad.80822).
LITERATURE CITEDBackstrom, N., N. Karaiskou, E. H. Leder, L. Gustafsson, C. R. Primmer et al.,
2008 A gene-based genetic linkage map of the collared flycatcher(Ficedula albicollis) reveals extensive synteny and gene-order conservationduring 100 million years of avian evolution. Genetics 179: 1479–1495.
Berdan, E. L., and R. C. Fuller, 2012 Interspecific divergence of ionoregu-latory physiology in killifish: insight into adaptation and speciation.J. Zool. 287: 283–291.
Burke, J. M., Z. Lai, M. Salmaso, T. Nakazato, S. X. Tang et al.,2004 Comparative mapping and rapid karyotypic evolution in thegenus Helianthus. Genetics 167: 449–457.
Burnett, K. G., L. J. Bain, W. S. Baldwin, G. V. Callard, S. Cohen et al.,2007 Fundulus as the premier teleost model in environmental biology:Opportunities for new insights using genomics. Comp. Biochem.Physiol.Part D Genomics Proteomics 2: 257–286.
Butlin, R. K., 2005 Recombination and speciation. Mol. Ecol. 14: 2621–2635.
Carleton, K. L., 2011 Quantification of transcript levels with quantitativeRT-PCR, pp. 279–295 in Molecular Methods for Evolutionary Genetics,edited by V. Orgogozo, and M. V. Rockman. Springer, New York.
Chen, T. R., 1971 A comparative chromosome study of twenty killifishspecies of the genus Fundulus (Teleostei: Cyprinodontidae). Chromo-soma 32: 436–453.
Coluzzi, M., A. Sabatini, A. della Torre, M. A. Di Deco, and V. Petrarca,2002 A polytene chromosome analysis of the Anopheles gambiae speciescomplex. Science 298: 1415–1418.
Cossins, A. R., and D. L. Crawford, 2005 Opinion - Fish as models forenvironmental genomics. Nat. Rev. Genet. 6: 324–333.
Duggins, C. F., A. A. Karlin, and K. G. Relyea, 1983 Electrophoretic vari-ation in the killifish genus Lucania. Copeia 564–570.
Falconer, D. S., and T. F. C. Mackay, 1996 Introduction to QuantitativeGenetics. Pearson Education Limited, New York, NY.
Faria, R., and A. Navarro, 2010 Chromosomal speciation revisited: rear-ranging theory with pieces of evidence. Trends Ecol. Evol. 25: 660–669.
Feder, J. L., F. B. Roethele, K. Filchak, J. Niedbalski, and J. Romero-Severson,2003 Evidence for inversion polymorphism related to sympatric hostrace formation in the apple maggot fly, Rhagoletis pomonella. Genetics163: 939–953.
Foley, B. R., C. G. Rose, D. E. Rundle, W. Leong, G. W. Moy et al., 2011 Agene-based SNP resource and linkage map for the copepod Tigriopuscalifornicus. BMC Genomics • • • : 12.
Fraser, B. A., C. J. Weadick, I. Janowitz, F. H. Rodd, and K. A. Hughes,2011 Sequencing and characterization of the guppy (Poecilia reticulata)transcriptome. BMC Genomics 12: 568.
Fuller, R. C., 2008 Genetic incompatibilities in killifish and the role ofenvironment. Evolution 62: 3056–3068.
Fuller, R. C., and L. A. Noa, 2008 Distribution and stability of sympatricpopulations of Lucania goodei and L. parva across Florida. Copeia 699–707.
Fuller, R. C., and K. M. Claricoates, 2011 Rapid light-induced shifts inopsin expression: finding new opsins, discerning mechanisms of change,and implications for visual sensitivity. Mol. Ecol. 20: 3321–3335.
Fuller, R. C., K. E. McGhee, and M. Schrader, 2007 Speciation in killifishand the role of salt tolerance. J. Evol. Biol. 20: 1962–1975.
Fuller, R. C., L. A. Noa, and R. S. Strellner, 2010 Teasing apart the manyeffects of lighting environment on opsin expression and foraging pref-erence in bluefin killifish. Am. Nat. 176: 1–13.
Gale, M. D., and K. M. Devos, 1998 Comparative genetics in the grasses.Proc. Natl. Acad. Sci. USA 95: 1971–1974.
Hubbs, C. L., B. W. Walker, and R. E. Johnson, 1943 Hybridization innature between species of American cyprinodont fishes. Contr. Lab.Vertebrate Biol. 23: 1–21.
Jaari, S., M. H. Li, and J. Merila, 2009 A first-generation microsatellite-based genetic linkage map of the Siberian jay (Perisoreus infaustus): in-sights into avian genome evolution. BMC Genomics 10: 1.
Kasahara, M., K. Naruse, S. Sasaki, Y. Nakatani, W. Qu et al., 2007 Themedaka draft genome and insights into vertebrate genome evolution.Nature 447: 714–719.
Kitano, J., J. A. Ross, S. Mori, M. Kume, F. C. Jones et al., 2009 A role fora neo-sex chromosome in stickleback speciation. Nature 461: 1079–1083.
Kosambi, D. D., 1944 The estimation of map distance from recombinationvalues. Ann. Eugen. 12: 172–175.
Kozak, G. M., A. B. Rudolph, B. L. Colon, and R. C. Fuller, 2012 Postzygoticisolation evolves before prezygotic isolation between fresh and saltwaterpopulations of the rainwater killifish, Lucania parva. Int. J. Evol. Biol.2012: 523967.
Kozak, G. M., R. S. Brennan, E. L. Berdan, R. C. Fuller, and A. Whitehead,2014 Functional and population genomic divergence within and be-tween two Species of killifish adapted to different osmotic niches. Evo-lution 68: 63–80.
Lee, D. S., C. R. Gilbert, C. H. Hocutt, R. E. Jenkins, D. E. McAllister et al.,1980 Atlas of North American Freshwater Fishes. North Carolina StateMuseum of Natural History, Raleigh, NC.
Lee, S. F., L. Rako, and A. A. Hoffmann, 2011 Genetic mapping of adaptivewing size variation in Drosophila simulans. Heredity 107: 22–29.
Li, H., J. Ruan, and R. Durbin, 2008 Mapping short DNA sequencing reads andcalling variants using mapping quality scores. Genome Res. 18: 1851–1858.
Liu, F., F. Sun, J. Li, J. H. Xia, G. Lin et al., 2013 A microsatellite-based linkagemap of salt tolerant tilapia (Oreochromis mossambicus x Oreochromis spp.)and mapping of sex-determining loci. BMC Genomics 14: 58.
Lubieniecki, K. P., S. L. Jones, E. A. Davidson, J. Park, B. F. Koop et al.,2010 Comparative genomic analysis of Atlantic salmon, Salmo salar,from Europe and North America. BMC Genet. 11: 105.
Lucas, M. R., N. N. Diop, S. Wanamaker, J. D. Ehlers, P. A. Roberts et al.,2011 Cowpea-Soybean synteny clarified through an improved geneticmap. Plant Genome 4: 218–225.
McGraw, L. A., J. K. Davis, L. J. Young, and J. W. Thomas, 2011 A geneticlinkage map and comparative mapping of the prairie vole (Microtusochrogaster) genome. BMC Genet. 12: 60.
Ming, R., S. C. Liu, Y. R. Lin, J. da Silva, W. Wilson et al., 1998 Detailedalignment of Saccharum and Sorghum chromosomes: Comparative organiza-tion of closely related diploid and polyploid genomes. Genetics 150: 1663–1682.
Volume 4 August 2014 | Killifish Linkage Maps | 1371

Muchero, W., N. N. Diop, P. R. Bhat, R. D. Fenton, S. Wanamaker et al.,2009 A consensus genetic map of cowpea [Vigna unguiculata (L)Walp.] and synteny based on EST-derived SNPs. Proc. Natl. Acad. Sci.USA 106: 18159–18164.
Naish, K. A., R. B. Phillips, M. S. O. Brieuc, L. R. Newton, A. E. Elz et al.,2013 Comparative genome mapping between chinook salmon (Onco-rhynchus tshawytscha) and rainbow trout (O. mykiss) based on homol-ogous microsatellite loci. G3 (Bethesda) 3: 2281–2288.
Noor, M. A. F., K. L. Grams, L. A. Bertucci, and J. Reiland,2001 Chromosomal inversions and the reproductive isolation of spe-cies. Proc. Natl. Acad. Sci. USA 98: 12084–12088.
Peichel, C. L., K. S. Nereng, K. A. Ohgi, B. L. E. Cole, P. F. Colosimo et al.,2001 The genetic architecture of divergence between threespine stick-leback species. Nature 414: 901–905.
Prince, J. P., E. Pochard, and S. D. Tanksley, 1993 Construction of a mo-lecular linkage map of pepper and a comparison of synteny with tomato.Genome 36: 404–417.
Rieseberg, L. H., 2001 Chromosomal rearrangements and speciation.Trends Ecol. Evol. 16: 351–358.
Rieseberg, L. H., J. Whitton, and K. Gardner, 1999 Hybrid zones and thegenetic architecture of a barrier to gene flow between two sunflowerspecies. Genetics 152: 713–727.
Rogers, S. M., N. Isabel, and L. Bernatchez, 2007 Linkage maps of the dwarfand normal lake whitefish (Coregonus clupeaformis) species complex andtheir hybrids reveal the genetic architecture of population divergence.Genetics 175: 375–398.
Schartl, M., R. B. Walter, Y. J. Shen, T. Garcia, J. Catchen et al., 2013 Thegenome of the platyfish, Xiphophorus maculatus, provides insights intoevolutionary adaptation and several complex traits. Nat. Genet. 45: 567–572.
Stam, P., 1993 Construction of integrated genetic linkage maps by means ofa new computer package - Joinmap. Plant J. 3: 739–744.
Stapley, J., T. R. Birkhead, T. Burke, and J. Slate, 2008 A linkage map of thezebra finch Taeniopygia guttata provides new insights into avian genomeevolution. Genetics 179: 651–667.
Steinke, D., W. Salzburger, and A. Meyer, 2006 Novel relationships amongten fish model species revealed based on a phylogenomic analysis usingESTs. J. Mol. Evol. 62: 772–784.
Strimmer, K., 2008 fdrtool: a versatile R package for estimating local andtail area-based false discovery rates. Bioinformatics 24: 1461–1462.
Tanksley, S. D., M. W. Ganal, J. P. Prince, M. C. de Vicente, M. W. Bonierbaleet al., 1992 High density molecular linkage maps of the tomato andpotato genomes. Genetics 132: 1141–1160.
Timusk, E. R., M. M. Ferguson, H. K. Moghadam, J. D. Norman, C. C.Wilson et al., 2011 Genome evolution in the fish family salmonidae:generation of a brook charr genetic map and comparisons among charrs(Arctic charr and brook charr) with rainbow trout. BMC Genet. 12: 68.
Tripathi, N., M. Hoffmann, E. M. Willing, C. Lanz, D. Weigel et al.,2009 Genetic linkage map of the guppy, Poecilia reticulata, and quan-titative trait loci analysis of male size and colour variation. Proc. Biol. Sci.276: 2195–2208.
Uyeno, T., and R. R. Miller, 1971 Multiple sex chromosomes in a Mexicancyprinodontid fish. Nature 231: 452–453.
Wang, J., B. Roe, S. Macmil, Q. Yu, J. E. Murray et al., 2010 Microcollinearitybetween autopolyploid sugarcane and diploid sorghum genomes. BMCGenomics 11: 261.
Whitehead, A., 2010 The evolutionary radiation of diverse osmotolerantphysiologies in killifish (Fundulus Sp.). Evolution 64: 2070–2085.
Communicating editor: A. S. McCallion
1372 | E. L. Berdan et al.
Copyright © 2022 FDOKUMEN