Inside Game / Outstide Game - Segregation and Spatial Planning in Metropolitan Areas
116
-
Upload
independent -
Category
Documents
-
view
3 -
download
0
Transcript of Inside Game / Outstide Game - Segregation and Spatial Planning in Metropolitan Areas
INSIDE GAME/OUTSIDE GAME Segregation and Spatial Planning in Metropolitan Areas
By David Rusk
In collaboration with ABF Strategie (Dirk Frieling and Léon Groenemeijer)
Washington D.C./Delft/Amsterdam: February 2001
Commissioned by
the Dutch Ministry of the Interior and Kingom Relations
the Dutch Ministry of Economic Affairs the Dutch Ministry of Agriculture, Nature Preserves and
Fisheries the City of Arnhem
the City of The Hague

Table of Contents
Introduction....................................................................................................................................2
Part 1: Matching up metro areas ....................................................................................................3
Part 2: Urban Decentralization.......................................................................................................9
Part 3: Comparative “rules of the game” .....................................................................................15 American “Rules of the Game”..........................................................................................15
Continental Level: The Federal Government............................................................15 State Level.................................................................................................................17 Annexation case study: Portland, Rochester, Lehigh Valley ....................................21
European Rules of the Game..............................................................................................23 Continental Level: The European Union ..................................................................23 “State” Level: The Netherlands ................................................................................24 Annexation Case Study: The Hague, Nijmegen, Arnhem ........................................30
Part 4: Regional Government and Urban Growth Management..................................................34 Portland...............................................................................................................................34 Regional Government in the Netherlands ..........................................................................38
Haaglanden................................................................................................................39 KAN (Knooppunt Arnhem Nijmegen)......................................................................40
Evaluating Portland’s Urban Growth Boundary.................................................................44
Part 5: Ethnic and economic segregation.....................................................................................54 Residential Segregation ......................................................................................................54
School Segregation ...................................................................................................72 Labor Market Segmentation......................................................................................82
Part 6: Conclusions and recommendations ..................................................................................90 Conclusions ........................................................................................................................90 Recommendations: .............................................................................................................95
Appendices
A. American Continental Government “Rules of the Game” B. History of the European Union C. Decline of Annexation in the USA D. The Oregon Land Use Law E. The History of Portland Metro F. Kaderwet: Haaglanden and KAN’s accomplishments G. Montgomery County, Maryland’s Moderately Priced Dwelling Unit (MPDU) Ordinance
INSIDE GAME/OUTSIDE GAME
2
Introduction
This report contains three stories, that is, three levels of information on changes in Dutch society that require action.
On the surface, as the context of public debate, is the story of global trends that promote international migration. The Netherlands, with its open and globally oriented economy, is an immigration land and will stay so in the future.
In the center, to be put on the political agenda, are national trends of spatial segregation of minority populations, as shown for the city-regions of Haaglanden and KAN (Knooppunt Arnhem-Nijmegen), as compared to some city-regions in the USA and the EU. Statistical analyses shows that in American and Dutch city-regions with comparable minority population, regional residential ethnic segregation is more or less the same, residential economic segregation is worse in the American examples, and school segregation is worse in the Dutch examples.
At the bottom level are the “rules of the game.” In theory, all citizens have the same liberties in their pursuit of happiness, be it with regard of finding a home, a school or a job. In practice, however, these liberties are restricted by rules and regulations that prevent or, at least, seriously hamper equal accessibility.
Dutch society is quite aware of the need to combine being an immigration-land and being an integration-land. This is demonstrated by an Act on Integration of Newcomers (Wet Inburgering Nieuwkomers) and the Big City Policy.
As the analysis in this report shows, Big City Policy (the Inside Game) is no answer to regional segregation trends (the Outside Game). The Kaderwet expires and will have to be replaced by new instruments to govern regional coordination. At the same time, a fifth report on spatial planning introduces a concept of “urban networks” that underlines the need for regional planning. To find good solutions for both, it is useful to assess the best international practices. For the USA, this is Portland, Oregon. For the EU, this might be Stockholm, Sweden.
INSIDE GAME/OUTSIDE GAME
3
Part 1: Matching up metro areas
Any comparative study of urban regions, particularly a study whose examples cross international boundaries, must take great care to compare “apples-to-apples” rather than “apples-to-oranges.” Meaningful comparisons and valid conclusions must be based on common criteria used in a transnational analysis.
This study deliberately applies American standards and methodologies to the analysis of Dutch, American, and other European regions on three levels:
a) common delineation of the urban regions in order to approximate American-style metropolitan areas;
b) common determination of the population size of smaller units of analysis in order to match the scale of American census tracts; and
c) common designation of ethnic and economic groups in order to parallel the position of American blacks, Hispanics and poor persons.
This report was commissioned by Dutch sponsors in order to inform and shape Dutch urban policy. Why not apply Dutch standards to analyzing American examples? Instead of comparing Dutch “apples” to American “apples,” why not compare American “oranges” to Dutch “oranges”?
The answer is a very pragmatic one. The two Dutch case studies – The Hague and Arnhem-Nijmegen – were pre-determined. The search for American counterparts involved reviewing data for 320 American metropolitan areas.1 For that task it would have been impossible to do anything else than to draw upon the existing body of data and analysis based on American methodologies.
The study compares the two Dutch regions with their closest USA peers. The Hague metro area (Haaglanden) is matched with metro Portland, Oregon and metro Rochester, New York. The Arnhem Nijmegen metro area (Knooppunt Arnhem-Nijmegen, or KAN) is matched with the Allentown-Bethlehem-Easton, Pennsylvania-New Jersey metro area (also known as the Lehigh Valley). As European case studies, we have selected the Stockholm and Antwerp regions. Sag
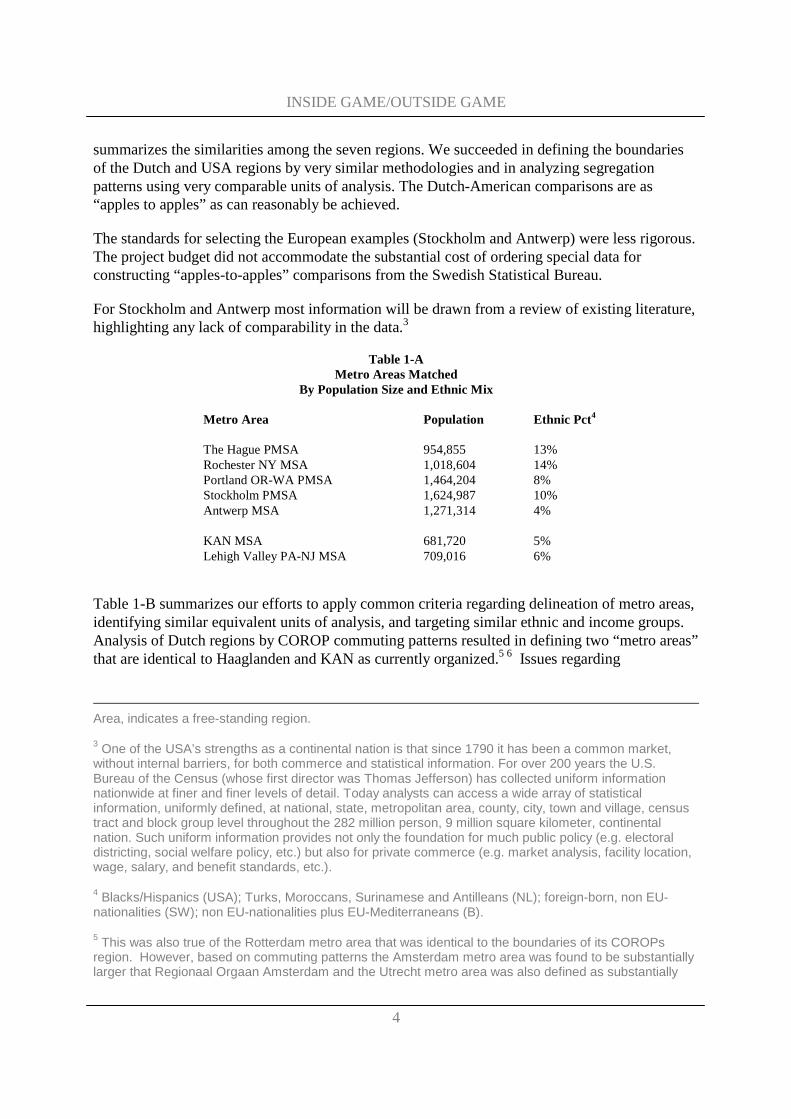
The regions were matched on the basis of population size and ethnic composition.2 Table 1-A
1 One American case study (Portland, Oregon) was also pre-determined because of Dutch interest in having the consequences of the Portland region’s Urban Growth Boundary assessed for possible adaptation to Dutch circumstances. Fortuitously, the Portland metro area also matched up well with The Hague metro area, and, in certain respects, like the percentage of ethnic population, also with KAN.
2 USA peers metro areas were selected on the basis of being within 33% (plus or minus) of the Dutch metro areas’ population size and of being with 5 percentage points (plus or minus) of their ethnic mix. “PMSA,” or Primary Metropolitan Statistical Area, means that the region is part of an even larger complex of metropolitan areas (e.g. The Hague PMSA as part of the Randstad). “MSA,” or Metropolitan Statistical
INSIDE GAME/OUTSIDE GAME
4
summarizes the similarities among the seven regions. We succeeded in defining the boundaries of the Dutch and USA regions by very similar methodologies and in analyzing segregation patterns using very comparable units of analysis. The Dutch-American comparisons are as “apples to apples” as can reasonably be achieved.
The standards for selecting the European examples (Stockholm and Antwerp) were less rigorous. The project budget did not accommodate the substantial cost of ordering special data for constructing “apples-to-apples” comparisons from the Swedish Statistical Bureau.
For Stockholm and Antwerp most information will be drawn from a review of existing literature, highlighting any lack of comparability in the data.3
Table 1-A
Metro Areas Matched By Population Size and Ethnic Mix
Metro Area Population Ethnic Pct4 The Hague PMSA 954,855 13% Rochester NY MSA 1,018,604 14% Portland OR-WA PMSA 1,464,204 8% Stockholm PMSA 1,624,987 10% Antwerp MSA 1,271,314 4% KAN MSA 681,720 5% Lehigh Valley PA-NJ MSA 709,016 6%
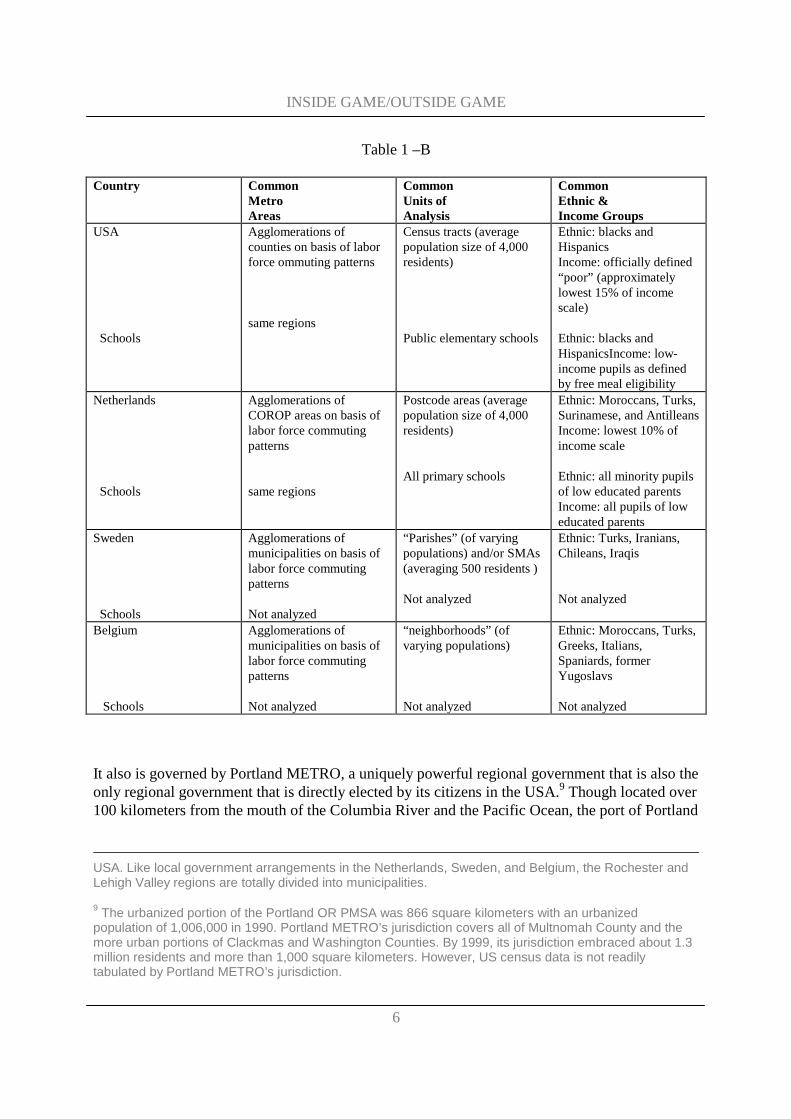
Table 1-B summarizes our efforts to apply common criteria regarding delineation of metro areas, identifying similar equivalent units of analysis, and targeting similar ethnic and income groups. Analysis of Dutch regions by COROP commuting patterns resulted in defining two “metro areas” that are identical to Haaglanden and KAN as currently organized.5 6 Issues regarding
Area, indicates a free-standing region.
3 One of the USA’s strengths as a continental nation is that since 1790 it has been a common market, without internal barriers, for both commerce and statistical information. For over 200 years the U.S. Bureau of the Census (whose first director was Thomas Jefferson) has collected uniform information nationwide at finer and finer levels of detail. Today analysts can access a wide array of statistical information, uniformly defined, at national, state, metropolitan area, county, city, town and village, census tract and block group level throughout the 282 million person, 9 million square kilometer, continental nation. Such uniform information provides not only the foundation for much public policy (e.g. electoral districting, social welfare policy, etc.) but also for private commerce (e.g. market analysis, facility location, wage, salary, and benefit standards, etc.).
4 Blacks/Hispanics (USA); Turks, Moroccans, Surinamese and Antilleans (NL); foreign-born, non EU-nationalities (SW); non EU-nationalities plus EU-Mediterraneans (B).
5 This was also true of the Rotterdam metro area that was identical to the boundaries of its COROPs region. However, based on commuting patterns the Amsterdam metro area was found to be substantially larger that Regionaal Orgaan Amsterdam and the Utrecht metro area was also defined as substantially
INSIDE GAME/OUTSIDE GAME
5
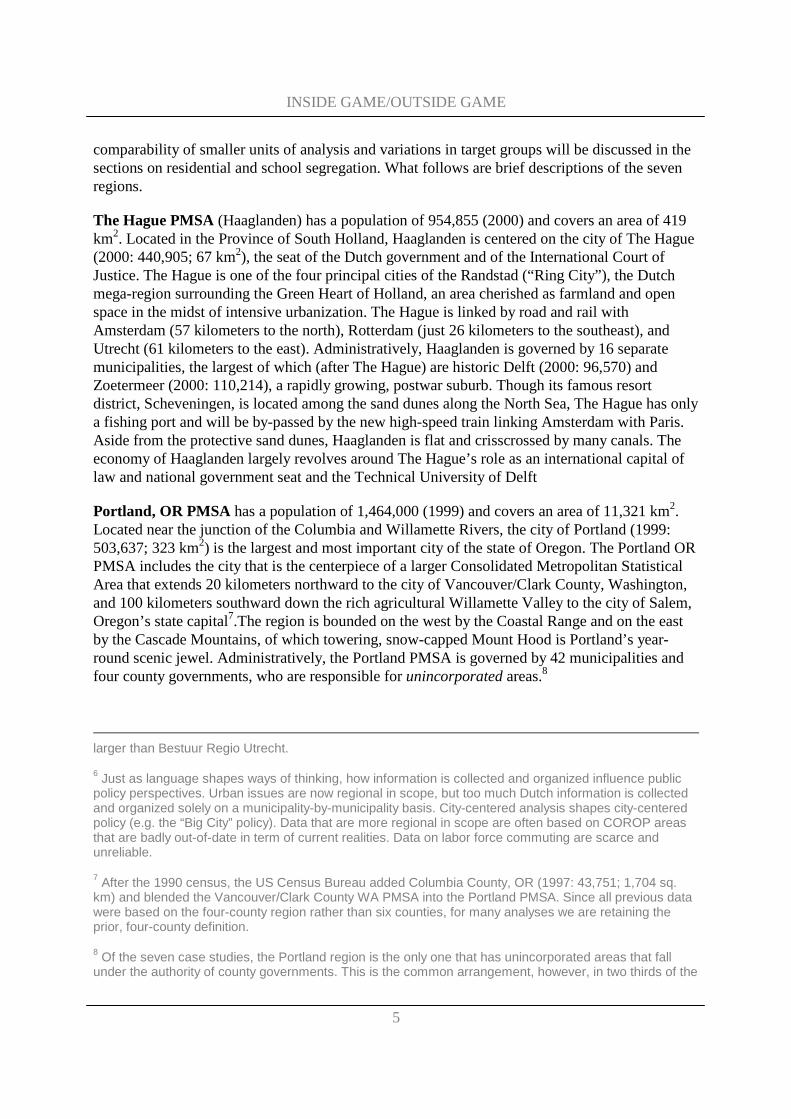
comparability of smaller units of analysis and variations in target groups will be discussed in the sections on residential and school segregation. What follows are brief descriptions of the seven regions.
The Hague PMSA (Haaglanden) has a population of 954,855 (2000) and covers an area of 419 km2. Located in the Province of South Holland, Haaglanden is centered on the city of The Hague (2000: 440,905; 67 km2), the seat of the Dutch government and of the International Court of Justice. The Hague is one of the four principal cities of the Randstad (“Ring City”), the Dutch mega-region surrounding the Green Heart of Holland, an area cherished as farmland and open space in the midst of intensive urbanization. The Hague is linked by road and rail with Amsterdam (57 kilometers to the north), Rotterdam (just 26 kilometers to the southeast), and Utrecht (61 kilometers to the east). Administratively, Haaglanden is governed by 16 separate municipalities, the largest of which (after The Hague) are historic Delft (2000: 96,570) and Zoetermeer (2000: 110,214), a rapidly growing, postwar suburb. Though its famous resort district, Scheveningen, is located among the sand dunes along the North Sea, The Hague has only a fishing port and will be by-passed by the new high-speed train linking Amsterdam with Paris. Aside from the protective sand dunes, Haaglanden is flat and crisscrossed by many canals. The economy of Haaglanden largely revolves around The Hague’s role as an international capital of law and national government seat and the Technical University of Delft
Portland, OR PMSA has a population of 1,464,000 (1999) and covers an area of 11,321 km2. Located near the junction of the Columbia and Willamette Rivers, the city of Portland (1999: 503,637; 323 km2) is the largest and most important city of the state of Oregon. The Portland OR PMSA includes the city that is the centerpiece of a larger Consolidated Metropolitan Statistical Area that extends 20 kilometers northward to the city of Vancouver/Clark County, Washington, and 100 kilometers southward down the rich agricultural Willamette Valley to the city of Salem, Oregon’s state capital7.The region is bounded on the west by the Coastal Range and on the east by the Cascade Mountains, of which towering, snow-capped Mount Hood is Portland’s year-round scenic jewel. Administratively, the Portland PMSA is governed by 42 municipalities and four county governments, who are responsible for unincorporated areas.8
larger than Bestuur Regio Utrecht.
6 Just as language shapes ways of thinking, how information is collected and organized influence public policy perspectives. Urban issues are now regional in scope, but too much Dutch information is collected and organized solely on a municipality-by-municipality basis. City-centered analysis shapes city-centered policy (e.g. the “Big City” policy). Data that are more regional in scope are often based on COROP areas that are badly out-of-date in term of current realities. Data on labor force commuting are scarce and unreliable.
7 After the 1990 census, the US Census Bureau added Columbia County, OR (1997: 43,751; 1,704 sq. km) and blended the Vancouver/Clark County WA PMSA into the Portland PMSA. Since all previous data were based on the four-county region rather than six counties, for many analyses we are retaining the prior, four-county definition.
8 Of the seven case studies, the Portland region is the only one that has unincorporated areas that fall under the authority of county governments. This is the common arrangement, however, in two thirds of the
INSIDE GAME/OUTSIDE GAME
6
Table 1 –B
Country Common Metro Areas
Common Units of Analysis
Common Ethnic & Income Groups
USA Schools
Agglomerations of counties on basis of labor force ommuting patterns same regions
Census tracts (average population size of 4,000 residents) Public elementary schools
Ethnic: blacks and Hispanics Income: officially defined “poor” (approximately lowest 15% of income scale) Ethnic: blacks and HispanicsIncome: low-income pupils as defined by free meal eligibility
Netherlands Schools
Agglomerations of COROP areas on basis of labor force commuting patterns same regions
Postcode areas (average population size of 4,000 residents) All primary schools
Ethnic: Moroccans, Turks, Surinamese, and Antilleans Income: lowest 10% of income scale Ethnic: all minority pupils of low educated parents Income: all pupils of low educated parents
Sweden Schools
Agglomerations of municipalities on basis of labor force commuting patterns Not analyzed
“Parishes” (of varying populations) and/or SMAs (averaging 500 residents ) Not analyzed
Ethnic: Turks, Iranians, Chileans, Iraqis Not analyzed
Belgium Schools
Agglomerations of municipalities on basis of labor force commuting patterns Not analyzed
“neighborhoods” (of varying populations) Not analyzed
Ethnic: Moroccans, Turks, Greeks, Italians, Spaniards, former Yugoslavs Not analyzed
It also is governed by Portland METRO, a uniquely powerful regional government that is also the only regional government that is directly elected by its citizens in the USA.9 Though located over 100 kilometers from the mouth of the Columbia River and the Pacific Ocean, the port of Portland
USA. Like local government arrangements in the Netherlands, Sweden, and Belgium, the Rochester and Lehigh Valley regions are totally divided into municipalities.
9 The urbanized portion of the Portland OR PMSA was 866 square kilometers with an urbanized population of 1,006,000 in 1990. Portland METRO’s jurisdiction covers all of Multnomah County and the more urban portions of Clackmas and Washington Counties. By 1999, its jurisdiction embraced about 1.3 million residents and more than 1,000 square kilometers. However, US census data is not readily tabulated by Portland METRO’s jurisdiction.
INSIDE GAME/OUTSIDE GAME
7
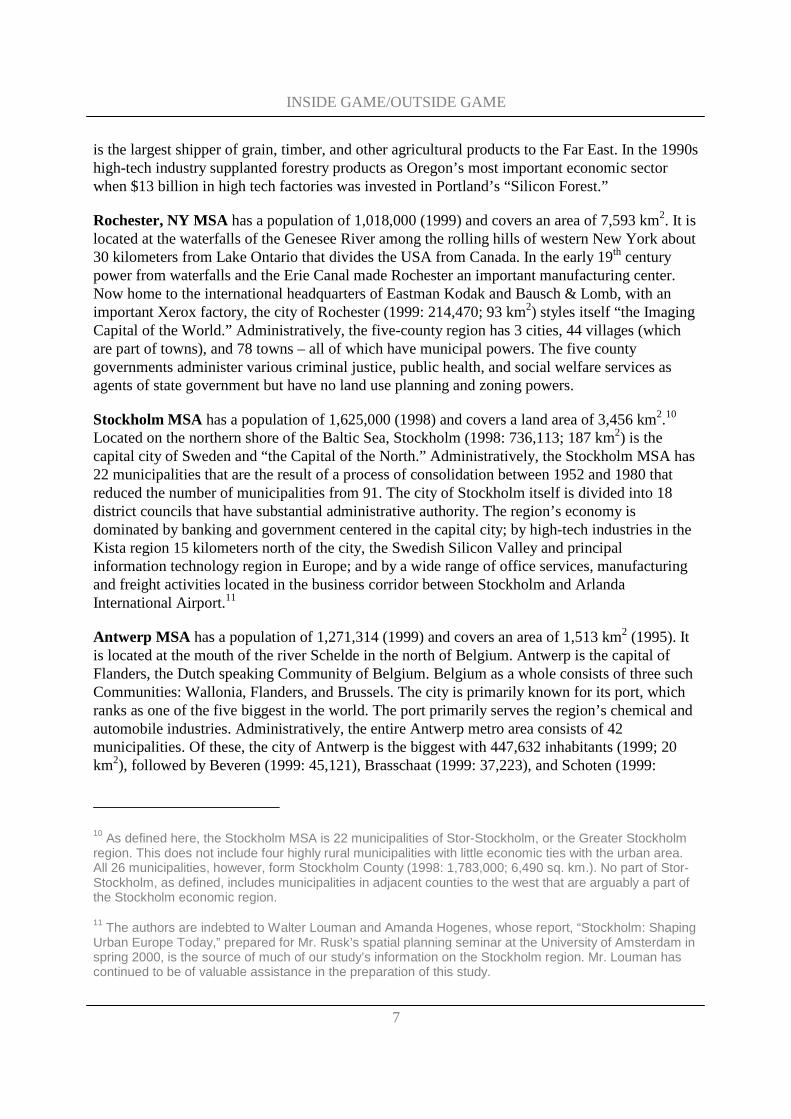
is the largest shipper of grain, timber, and other agricultural products to the Far East. In the 1990s high-tech industry supplanted forestry products as Oregon’s most important economic sector when $13 billion in high tech factories was invested in Portland’s “Silicon Forest.”
Rochester, NY MSA has a population of 1,018,000 (1999) and covers an area of 7,593 km2. It is located at the waterfalls of the Genesee River among the rolling hills of western New York about 30 kilometers from Lake Ontario that divides the USA from Canada. In the early 19th century power from waterfalls and the Erie Canal made Rochester an important manufacturing center. Now home to the international headquarters of Eastman Kodak and Bausch & Lomb, with an important Xerox factory, the city of Rochester (1999: 214,470; 93 km2) styles itself “the Imaging Capital of the World.” Administratively, the five-county region has 3 cities, 44 villages (which are part of towns), and 78 towns – all of which have municipal powers. The five county governments administer various criminal justice, public health, and social welfare services as agents of state government but have no land use planning and zoning powers.
Stockholm MSA has a population of 1,625,000 (1998) and covers a land area of 3,456 km2.10 Located on the northern shore of the Baltic Sea, Stockholm (1998: 736,113; 187 km2) is the capital city of Sweden and “the Capital of the North.” Administratively, the Stockholm MSA has 22 municipalities that are the result of a process of consolidation between 1952 and 1980 that reduced the number of municipalities from 91. The city of Stockholm itself is divided into 18 district councils that have substantial administrative authority. The region’s economy is dominated by banking and government centered in the capital city; by high-tech industries in the Kista region 15 kilometers north of the city, the Swedish Silicon Valley and principal information technology region in Europe; and by a wide range of office services, manufacturing and freight activities located in the business corridor between Stockholm and Arlanda International Airport.11
Antwerp MSA has a population of 1,271,314 (1999) and covers an area of 1,513 km2 (1995). It is located at the mouth of the river Schelde in the north of Belgium. Antwerp is the capital of Flanders, the Dutch speaking Community of Belgium. Belgium as a whole consists of three such Communities: Wallonia, Flanders, and Brussels. The city is primarily known for its port, which ranks as one of the five biggest in the world. The port primarily serves the region’s chemical and automobile industries. Administratively, the entire Antwerp metro area consists of 42 municipalities. Of these, the city of Antwerp is the biggest with 447,632 inhabitants (1999; 20 km2), followed by Beveren (1999: 45,121), Brasschaat (1999: 37,223), and Schoten (1999:
10 As defined here, the Stockholm MSA is 22 municipalities of Stor-Stockholm, or the Greater Stockholm region. This does not include four highly rural municipalities with little economic ties with the urban area. All 26 municipalities, however, form Stockholm County (1998: 1,783,000; 6,490 sq. km.). No part of Stor-Stockholm, as defined, includes municipalities in adjacent counties to the west that are arguably a part of the Stockholm economic region.
11 The authors are indebted to Walter Louman and Amanda Hogenes, whose report, “Stockholm: Shaping Urban Europe Today,” prepared for Mr. Rusk’s spatial planning seminar at the University of Amsterdam in spring 2000, is the source of much of our study’s information on the Stockholm region. Mr. Louman has continued to be of valuable assistance in the preparation of this study.

INSIDE GAME/OUTSIDE GAME
8
32,498). Because of its cultural pre-eminence and economic prosperity during the late Renaissance, Antwerp is renowned for its beautiful historic buildings and noted painters (e.g. Rubens).
Arnhem-Nijmegen MSA has a population of 681,720 (2000) and covers an area of 991 square kilometers. Arnhem, the capital of the province of Gelderland, (2000: 138,180; 10 km2) is located on a branch of the Rhine, 20 kilometers from the German border. The Battle of Arnhem in September 1944 (“A Bridge Too Far”) devastated the historic city center. The northern part of the city is part of the Veluwe, Netherland’s largest nature preserve. Arnhem is home to financial and business services and the headquarter of AKZO Nobel (chemistry and pharmaceutics). Seventeen kilometers to the south on the southern bank of the River Waal, the main branch of the Rhine, is Nijmegen (2000: 148,745; 6 km2), Arnhem’s twin city, and the location of Europe’s largest chip manufacturing plant, Philips Micro-Electronica.12 Administratively, the region is divided into 25 municipalities. Under the provisions of Dutch law (Kaderwet), it also has an effective regional government, Knooppunt Arnhem-Nijmegen (KAN). Located midway between the Randstad and the Ruhr, the KAN region (or, more broadly, Gelderland) has been rated by Empirica Institute as the top location for business investment out of 267 Western European regions. Arnhem will be the only stop outside the Randstad of the new High Speed Train to Germany, spurring development of a major, multi-use Central Station complex. Ten kilometers south of Arnhem will be the Valburg Multimodal Transport Center, a state-of-the art facility for freight transport, storage, transshipment, and processing. The three rivers in the KAN-area (Rhine, Waal and IJssel) are part of the European ecological mainstructure (the area is important in bird migration) which puts extra demands on the layout of urbanization.
Allentown-Bethlehem-Easton PA-NJ MSA (or Lehigh Valley) has a population of 709,000 (1999) and covers an area of 3,784 square kilometers. The two-state, four-county Lehigh Valley is bisected by the Delaware River and lies mid-way between Philadelphia and New York (but to the west of the main highway and rail lines between the two metropolises). The Lehigh Valley’s principal cities are Allentown (1999: 105,086; 46 km2), adjacent Bethlehem (1999: 71,756; 50 km2) and, 20 kilometers north, Easton (1999: 23,309; 11 km2). Administratively, the Lehigh Valley has three cities, 38 boroughs, and 66 towns and townships. All have co-equal municipal powers. Home to Bethlehem Steel, once the USA’s second largest steel producer, the Lehigh Valley has been forced by events like the closing of Allentown’s Mack Truck factory and downsizing of the steel plant to make the transition to a diversified, post-industrial economy.
12 A common Dutch saying is “North of the rivers, people live to work; south of the rivers, they work to live.” The sociological divide runs through KAN, differentiating the more Protestant Arnhem area from the more Catholic Nijmegen area.
INSIDE GAME/OUTSIDE GAME
9
Part 2: Urban Decentralization
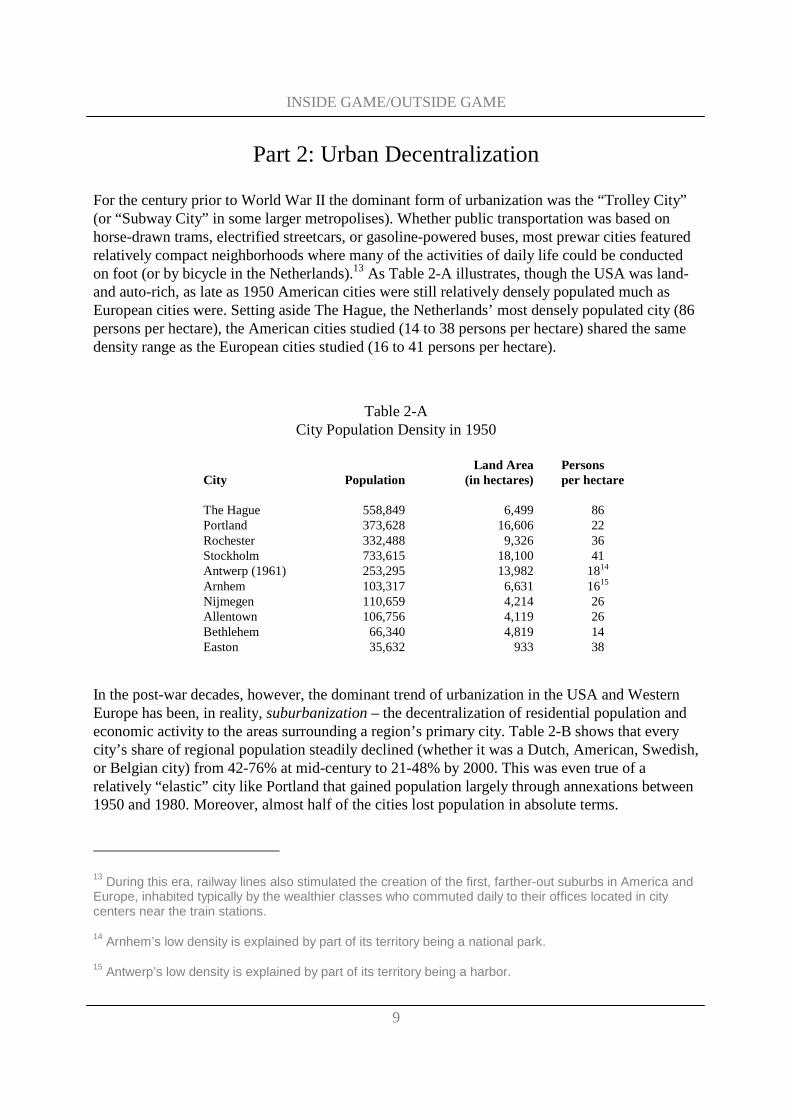
For the century prior to World War II the dominant form of urbanization was the “Trolley City” (or “Subway City” in some larger metropolises). Whether public transportation was based on horse-drawn trams, electrified streetcars, or gasoline-powered buses, most prewar cities featured relatively compact neighborhoods where many of the activities of daily life could be conducted on foot (or by bicycle in the Netherlands).13 As Table 2-A illustrates, though the USA was land- and auto-rich, as late as 1950 American cities were still relatively densely populated much as European cities were. Setting aside The Hague, the Netherlands’ most densely populated city (86 persons per hectare), the American cities studied (14 to 38 persons per hectare) shared the same density range as the European cities studied (16 to 41 persons per hectare).
Table 2-A City Population Density in 1950
Land Area Persons City Population (in hectares) per hectare The Hague 558,849 6,499 86 Portland 373,628 16,606 22 Rochester 332,488 9,326 36 Stockholm 733,615 18,100 41 Antwerp (1961) 253,295 13,982 1814 Arnhem 103,317 6,631 1615 Nijmegen 110,659 4,214 26 Allentown 106,756 4,119 26 Bethlehem 66,340 4,819 14 Easton 35,632 933 38
In the post-war decades, however, the dominant trend of urbanization in the USA and Western Europe has been, in reality, suburbanization – the decentralization of residential population and economic activity to the areas surrounding a region’s primary city. Table 2-B shows that every city’s share of regional population steadily declined (whether it was a Dutch, American, Swedish, or Belgian city) from 42-76% at mid-century to 21-48% by 2000. This was even true of a relatively “elastic” city like Portland that gained population largely through annexations between 1950 and 1980. Moreover, almost half of the cities lost population in absolute terms.
13 During this era, railway lines also stimulated the creation of the first, farther-out suburbs in America and Europe, inhabited typically by the wealthier classes who commuted daily to their offices located in city centers near the train stations.
14 Arnhem’s low density is explained by part of its territory being a national park.
15 Antwerp’s low density is explained by part of its territory being a harbor.
INSIDE GAME/OUTSIDE GAME
10
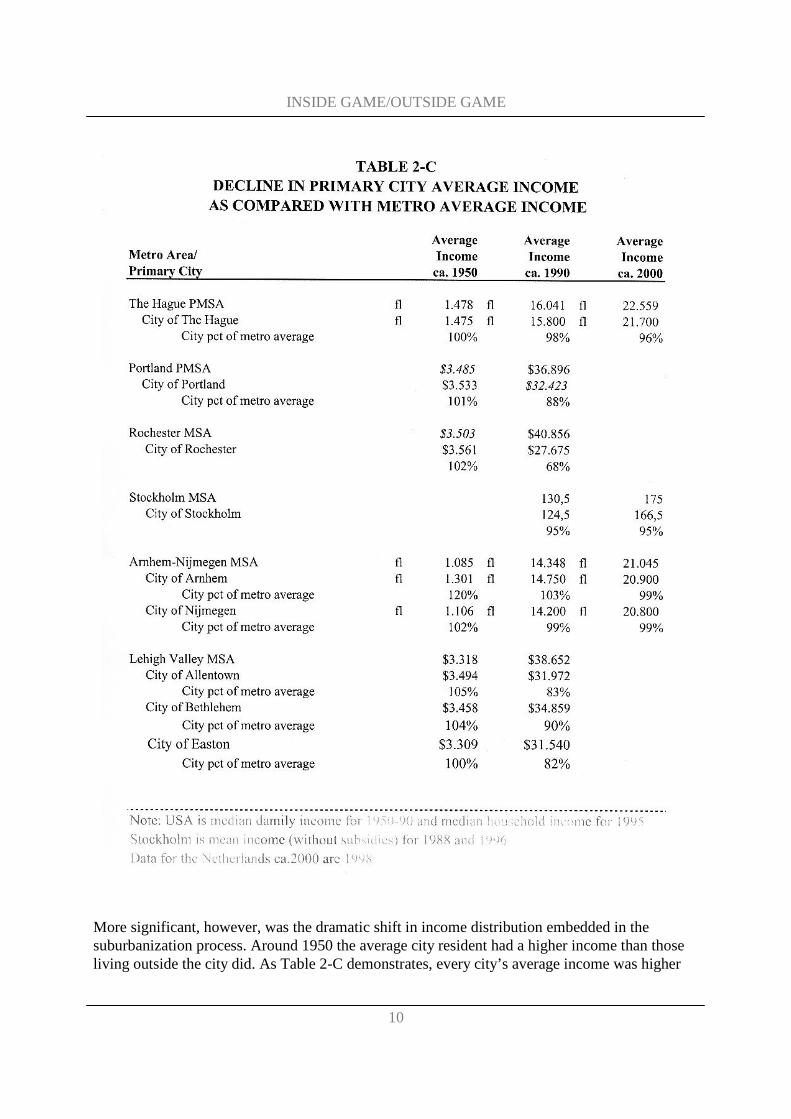
More significant, however, was the dramatic shift in income distribution embedded in the suburbanization process. Around 1950 the average city resident had a higher income than those living outside the city did. As Table 2-C demonstrates, every city’s average income was higher
INSIDE GAME/OUTSIDE GAME
11
than the regional average income at that time. Four or five decades later, every city’s average income was lower than the regional average income. The most dramatic decline was registered by Rochester, which fell from 102% of the regional average to 68% in just four decades. The smallest decline was registered by Nijmegen, which declined slightly from 102% of the regional average to just 99%.
Declining average incomes reflected three trends common to all the cities:
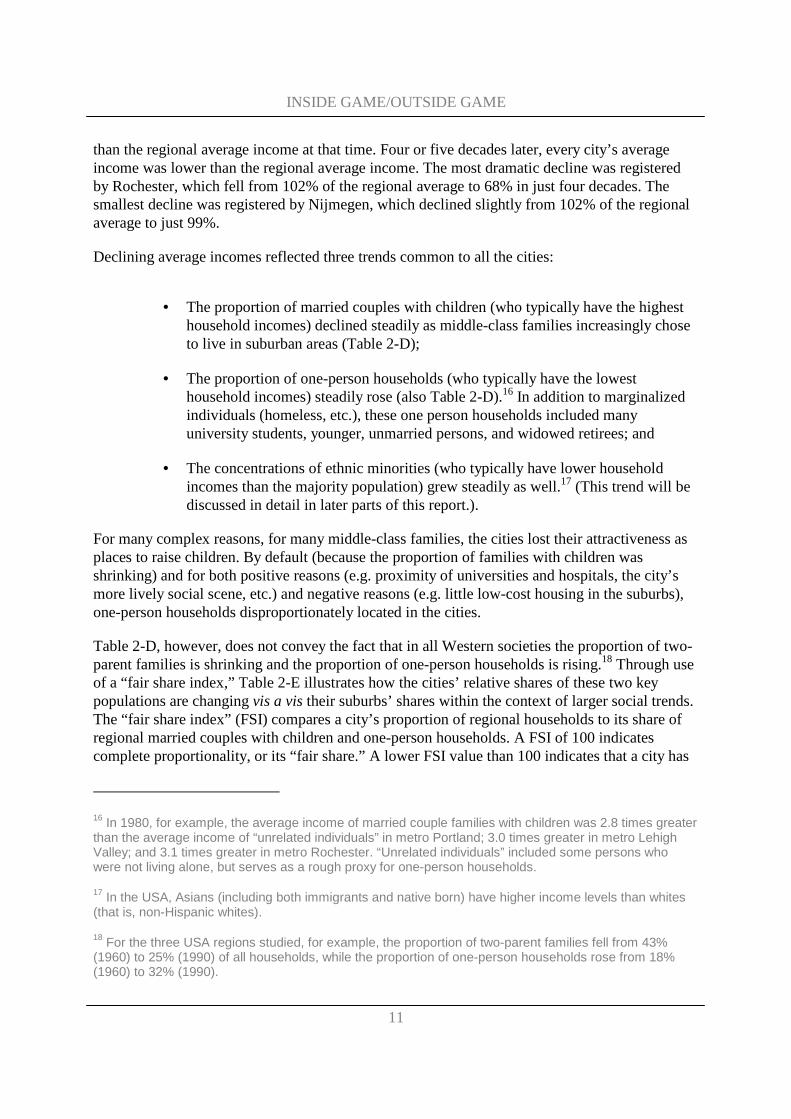
• The proportion of married couples with children (who typically have the highest household incomes) declined steadily as middle-class families increasingly chose to live in suburban areas (Table 2-D);
• The proportion of one-person households (who typically have the lowest household incomes) steadily rose (also Table 2-D).16 In addition to marginalized individuals (homeless, etc.), these one person households included many university students, younger, unmarried persons, and widowed retirees; and
• The concentrations of ethnic minorities (who typically have lower household incomes than the majority population) grew steadily as well.17 (This trend will be discussed in detail in later parts of this report.).
For many complex reasons, for many middle-class families, the cities lost their attractiveness as places to raise children. By default (because the proportion of families with children was shrinking) and for both positive reasons (e.g. proximity of universities and hospitals, the city’s more lively social scene, etc.) and negative reasons (e.g. little low-cost housing in the suburbs), one-person households disproportionately located in the cities.
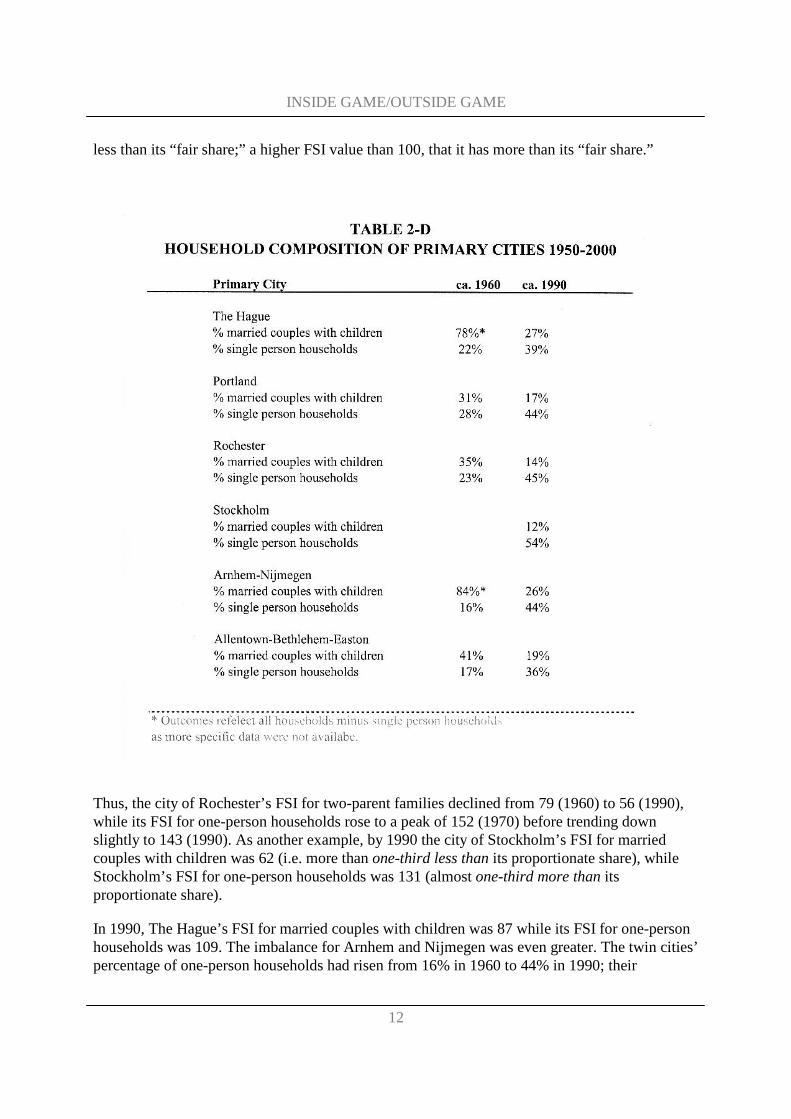
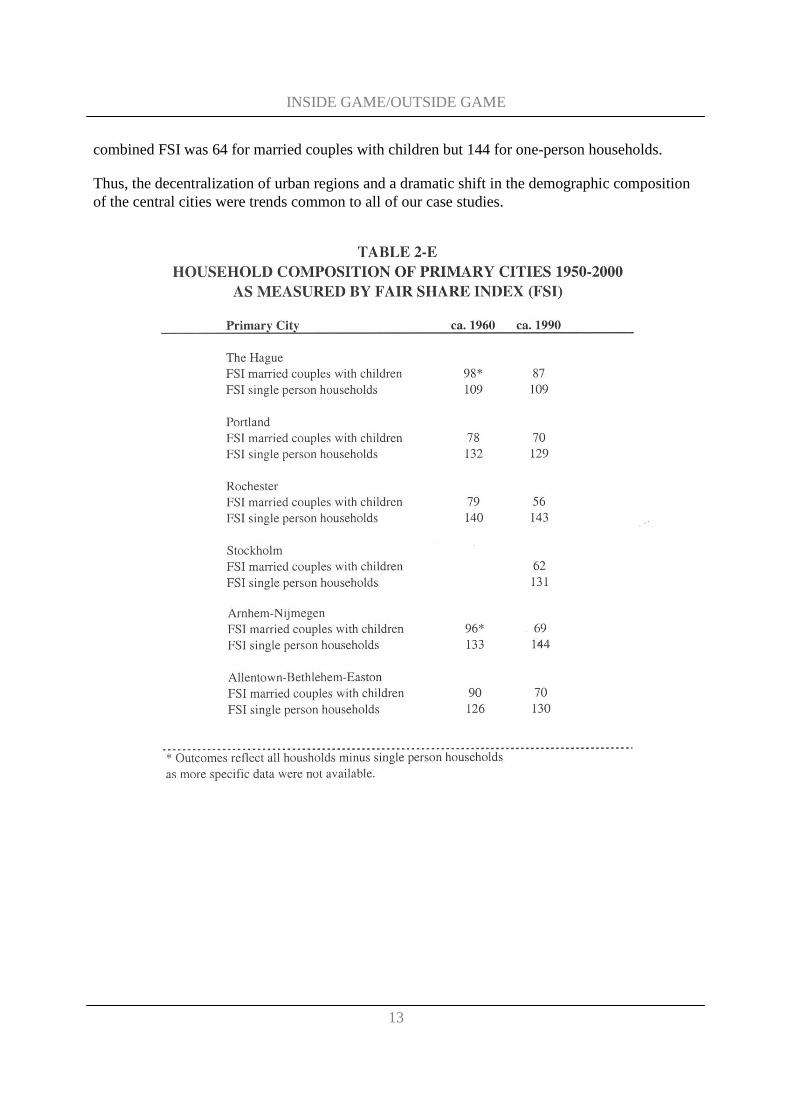
Table 2-D, however, does not convey the fact that in all Western societies the proportion of two-parent families is shrinking and the proportion of one-person households is rising.18 Through use of a “fair share index,” Table 2-E illustrates how the cities’ relative shares of these two key populations are changing vis a vis their suburbs’ shares within the context of larger social trends. The “fair share index” (FSI) compares a city’s proportion of regional households to its share of regional married couples with children and one-person households. A FSI of 100 indicates complete proportionality, or its “fair share.” A lower FSI value than 100 indicates that a city has
16 In 1980, for example, the average income of married couple families with children was 2.8 times greater than the average income of “unrelated individuals” in metro Portland; 3.0 times greater in metro Lehigh Valley; and 3.1 times greater in metro Rochester. “Unrelated individuals” included some persons who were not living alone, but serves as a rough proxy for one-person households.
17 In the USA, Asians (including both immigrants and native born) have higher income levels than whites (that is, non-Hispanic whites).
18 For the three USA regions studied, for example, the proportion of two-parent families fell from 43% (1960) to 25% (1990) of all households, while the proportion of one-person households rose from 18% (1960) to 32% (1990).
INSIDE GAME/OUTSIDE GAME
12
less than its “fair share;” a higher FSI value than 100, that it has more than its “fair share.”
Thus, the city of Rochester’s FSI for two-parent families declined from 79 (1960) to 56 (1990), while its FSI for one-person households rose to a peak of 152 (1970) before trending down slightly to 143 (1990). As another example, by 1990 the city of Stockholm’s FSI for married couples with children was 62 (i.e. more than one-third less than its proportionate share), while Stockholm’s FSI for one-person households was 131 (almost one-third more than its proportionate share).
In 1990, The Hague’s FSI for married couples with children was 87 while its FSI for one-person households was 109. The imbalance for Arnhem and Nijmegen was even greater. The twin cities’ percentage of one-person households had risen from 16% in 1960 to 44% in 1990; their
INSIDE GAME/OUTSIDE GAME
13
combined FSI was 64 for married couples with children but 144 for one-person households.
Thus, the decentralization of urban regions and a dramatic shift in the demographic composition of the central cities were trends common to all of our case studies.

INSIDE GAME/OUTSIDE GAME
14
INSIDE GAME/OUTSIDE GAME
15
Part 3: Comparative “rules of the game”
Suburbanization occurred around all cities, but began earlier and was more extensive in the USA. After World War II, underlying conditions made greater suburbanization inevitable in the USA as compared with Europe:19
• USA has much more land (9,171,000 square kilometers) compared to Europe (6,000,000 square kilometers, excluding Russia);
• USA had much faster population growth (1950-2000: 131 million, or 87%).
• USA experienced sustained economic growth without the need to rebuild war-torn economies (1947-1999: a 135% increase in inflation-adjusted median family income). More than doubling the average family’s standard of living sustained living patterns that consumed much land: by the late 1990s, 67% of American families owned homes; 92% owned automobiles; 48% had home air-conditioning (70% in the hot and humid Sunbelt), etc.
American “Rules of the Game”
Continental Level: The Federal Government
In addition to these underlying conditions, key public policies – what the author call the “rules of the game”- at federal, state, and local government accelerated suburbanization.20
To understand America’s “rules of the game,” one must first understand the structure of government in this continental nation. American government is not a simple hierarchy of authority from national to state to local level. It is a federal system in which the federal (or continental) government has only the powers that are explicitly conferred upon it by the federal constitution as amended periodically (only 27 times in 212 years) or interpreted by the U.S. Supreme Court.21 The American constitution is silent on the question of local government.
19 The authors are indebted to Pietro Nivola, whose Laws of the Landscape: How Policies Shape Cities in Europe and America [Washington, DC: The Brookings Institution Press (1999)] was a source of invaluable ideas and information that are quoted or paraphrased extensively here.
20 Despite all its philosophizing about “free markets,” the National Association of Homebuilders (no fan of government regulation) has said it best: “Public policy dictates where development occurs [emphasis added]. NAHB. Smart Growth: Building Better Places To Live, Work, and Play. Washington, D.C. (2000), p. 8.
21 The US Supreme Court also determines whether or not individual rights guaranteed to citizens of the nation have been violated by state or local government decisions. It was a federal court decision in Village

INSIDE GAME/OUTSIDE GAME
16
Therefore, under the 10th amendment, all power over how local governments are organized and what they are authorized to do is reserved to state governments. Municipal and county governments (as well as independent public school boards, etc.) are literally “creatures” of state government.
Therefore, the federal government has no direct, formal jurisdiction over state and local land use planning and zoning powers. The United States Congress has no more formal role in land use planning with regard to state governments than the Parliament of the European Union or its other political bodies have with regard to European member states.
In reality, though, the federal government has had a huge impact of urban development through its capital expenditures, housing finance role, tax policies, and environmental regulations. All these are among the “rules of the game” and add up not to a national urban policy but to a national suburban policy.
Direct “rules of the game”: Many federal government policies and expenditures have (both implicitly and explicitly) favored low-density, suburban development over more compact urbanization. These have included22
• Federally guaranteed, low-cost mortgages for homeowners and the federally-organized, secondary mortgage market both of which, for several decades, explicitly favored new, owner-occupied, suburban housing even over older, owner-occupied, city-located housing. The federal government’s housing finance policies now provide about forty times more support for owner-occupied housing (located primarily in suburbs) than for renter-occupied housing (located primarily in cities);
• Pro-homeowner tax policies: Through allowing deduction of mortgage interest and local property taxes against federal income tax liability, the federal government provides about eleven times more tax incentives for individual homeowners than it provides for apartment landlords.
• Massive highway subsidies: In building the Interstate Highway System, the federal government promoted a vast decentralization of America’s urban centers. From 1956 onward, suburb-inducing, highway subsidies were about eight times greater than city-supporting, mass transit subsidies.
• Anti-city environmental protection laws: Federal money to build new sewage treatment plants subsidized suburban growth. Federal regulation of air pollution initially restricted regional industry growth (though it may now have some effect on reducing dependence on automobiles). Strict federal controls on abandoned
of Euclid (Ohio) v. Ambler Realty that established the constitutionality of local government zoning powers as the “law of the land” in 1926.
22 These direct “rules of the game” are discussed in more detail in Appendix A.
INSIDE GAME/OUTSIDE GAME
17
factory sites (“brownfields”) severely hampered cities’ ability to compete with suburban “greenfield” sites as locations for new industries.
Indirect “rules of the game”: Many other policies may, at first glance, to be unrelated to urban development, but still have a profound collective impact on land use patterns, such as
• Dramatically lower gasoline prices in the USA than in Europe that encourages excessive automobile use. The difference is entirely the level of taxes; the production cost is much the same. In 1996, Dutch gasoline taxes per liter were eight times higher than American taxes.
• Almost as dramatically lower prices for electricity, in part based on cheaper fuel sources like the USA’s abundant coal and natural gas, in part based on deliberate federal and state regulatory policy to keep electricity costs low. Low electricity prices allow US consumers to cool and heat bigger homes and substitute large home appliances (such as refrigerators and freezers) for neighborhood shops, etc. in ways most Europeans could not afford with their higher energy costs.
• The USA’s reliance on income taxes rather than Europe’s reliance on sales and value added taxes. In effect, the American tax system rewards consumption, while European tax systems penalize excessive consumption.
• Lower agricultural subsidies. Between 1993 the average “producer subsidy equivalent” per hectare of agricultural land in the United State was $67. The average in the European Union was $791 per hectare – almost twelve times as much. No wonder many European farmers still prefer to grow crops while many American farmers “grow houses”.
• Lower taxes on American employers for employee social welfare benefits. These favor supermarkets and superstores that, in America, dominate suburban retailing over having small, family-operated retail shops in compact European-style neighborhoods.
In short, the federal government (that is, the continental government) does not even have an agency devoted to “spatial planning.” However, many federal “rules of the game” (direct and indirect) shape land development as surely, if less visibly, as if the federal government were issuing Dutch-style planning ‘nota’s’.
State Level
The State [i.e. state government] … at its pleasure may modify or withdraw all [city] powers, may take without compensation [city] property, hold it itself, or vest it in other agencies, expand or contract the territorial areas, unite the whole or a part of it with another municipality,
INSIDE GAME/OUTSIDE GAME
18
repeal the charter and destroy the [municipal] corporation. All this may be done, conditionally or unconditionally, with or without the consent of the citizens, or even against their protest. In all these respects the State is supreme, and its legislative body, conforming its action to the state constitution, may do so as it will, unrestrained by any provision of the Constitution of the United States.
- U.S. Supreme Court decision in Hunter v. City of Pittsburgh (1907)
Ultimately, state governments – state legislatures, governors and executive agencies, state courts – control the “rules of the game” at both state government and local government levels. Thus, the USA, in theory, has fifty different land use policies among the fifty different states just as, at present, the European Union has 15 different land use policies among its 15 member states.
In reality, there are four broad categories into which state governments’ impact on land development falls: a) state planning and investment in roads, highways, and other public works; b) annexation powers for local governments, c) tax policies for local governments, and d) planning and zoning powers delegated to local governments by state laws.
State transportation policy: State highway departments have been the federal government’s partners in building the nation’s road and highway system. In 1996, for example, state highway departments spent $57 billion from gasoline taxes – both their share and the federal government’s that they received as federal grants-in-aid for highway construction. (Local governments spent about $37 billion on local roads and streets.) The broad outlines (and substantial details) of America’s suburbanization were decided not by professional urban planners nor by local elected officials but by federal and state highway engineers. It was not until the Congress enacted the federal Inter-modal Surface Transportation Efficiency Act of 1991 (called “ice tea’) that local governments achieved real influence over major transportation planning.
State annexation laws: State annexation laws determined whether or not city governments would be able to defend themselves against the consequences of urban sprawl (in part, created by state highway departments) by expanding their boundaries to capture their share of the new development. In the Age of Sprawl, whether or not a city could annex new development – that is, could be “elastic” by expanding its boundaries – would have a crucial impact on its future social, economic, and fiscal health. (See accompanying case study that illustrates the differences between “elastic” Portland and “inelastic” Rochester and the Lehigh Valley cities.)
In general, during the past fifty years, annexation was impossible in New England, New York, New Jersey, and Pennsylvania. Like the Netherlands, Northeastern states were entirely divided up into municipalities with no unincorporated land. Unlike the Netherlands, their legislatures would not merge municipalities nor allow larger cities to annex parts of smaller municipalities. Annexation was difficult in Middle Western states that were completely divided into townships. Annexation rarely happened in strong township states (e.g. Michigan), but generally occurred in weak township states (e.g. Indiana, Illinois). Annexation was relatively easy in Southern and Western states where municipalities were surrounded by unincorporated land.
INSIDE GAME/OUTSIDE GAME
19
However, by 2000, it is increasingly clear that the highway system is decentralizing urban areas so rapidly that even the most annexation-minded cities cannot keep pace. In the long run, it is better to control sprawl than for a city to try to simply capture its share through annexation. A city should annex what it can when it can. But without strong, regional, anti-sprawl, land use controls, central cities are competing in a game that they cannot win solely by annexation.
State municipal finance policies: About 77 percent of municipal government budgets in the USA come from local taxes and fees; state governments provide 16 percent; and the federal government provides just 7 percent (always for specified programs and purposes). However, in an important respect, American municipalities do not control 77% of their own fiscal destinies. What specific taxes they can levy (and some times what fees they can charge for services) depend on what state legislatures authorize municipalities to do.
A thorough study of 86 major American cities showed that, on average, they received
• only 10 percent of their revenues from income, earnings, or payroll taxes;
• 17 percent from general sales taxes;
• 20 percent from a variety of miscellaneous taxes (hotel taxes, etc.); and
• 53 percent from property taxes.
But the averages understated the importance of property taxes. All 86 cities surveyed depended heavily on property taxes for from 23 percent to 82 percent of tax revenues, and that has major implications for land development.
With each of the myriad municipalities, towns, and counties in the typical U.S. metropolis largely forced to fend for itself, many resort to competitive strategies aimed at controlling the demand for services and bolstering the local economic base. Land-use regulations that maintain low residential densities limit the number of households requiring public services. By raising the per-unit cost of housing, these regulations can also prevent the entry of low- and moderate-income households who typically contribute less in taxes than they cost in services. The exclusionary zoning renders any relocation of inner-city residents to the suburbs all the more difficult.
At the same time, localities often jockey for business investment, each seeking to beat their neighbors’ base of taxable commercial property that in the long run is supposed to lighten the tax rate on homeowners. The competition can turn into something like a bidding war, as the parties tender “incentives” to attract the latest superstore, office park, or sports arena. In this contest, the central cities often find themselves at a disadvantage. Straining from the fiscal drain of their large, low-income enclaves, many can ill-afford the tax abatements, cheap land clearance,
INSIDE GAME/OUTSIDE GAME
20
and other attractions that suburban counties and townships can offer developers.23
This is a perfect description of the property tax-dependence effects in “little box” regions like Rochester and the Lehigh Valley. The effects are somewhat ameliorated in “big box” regions where cities will annex most new development that occurs in unincorporated areas near their city limits.24 (Many annexations occur before new development as cities pledge to provide the utilities and other services that make such development possible in the first place.) Newly annexed areas still remain under the county government’s jurisdiction. County government will still collect taxes, but will be relieved by the cities of providing many municipal-type services to the new sub-divisions, shopping centers, office and industrial parks.
State municipal planning laws: Unlike the Dutch government, no American state government issues periodic planning “nota’s.” However, every state has enacted general laws authorizing local government to regulate land development. Most state municipal land use codes are remarkably similar. The typical state municipal planning code authorizes a municipality to “protect the public health, welfare, and safety” of its residents (the so-called “police powers”) through regulating land use. Municipalities are to establish a general comprehensive plan and adopt a zoning map to implement the plan.25 Typically, planning and zoning seek to segregate land uses – residential neighborhoods separated from retail stores as well as from office and industrial parks, single family homes separated from apartments, etc. Often this “Euclidean” zoning (named after the US Supreme Court case, not the ancient Greek who was the “Father of Geometry”) is further overlaid by standard street design codes, standard sidewalk design codes, etc. (These also are based on voluntary national model codes promulgated by private, national engineering associations.)26
Though every state has enacted general municipal planning codes, there are twelve states that have also enacted additional laws that require municipalities to plan together to develop a
23 Nivola, Laws of the Landscape, p. 27.
24 “Little box” regions refer to metro areas that are divided into many small municipalities and multiple school districts (that is, “little boxes). These are typically the “township states” of the Northeast and Middle West where, like the Netherlands, the areas are totally divided into municipalities. “Big box” regions are typically located in the South and West. They have large cities that annex new development in unincorporated land around them and large, often countywide school districts (that is, “big boxes). “Little box” regions tend to be much more divided by race and class with significant fiscal disparities among the many jurisdictions. “Big box” municipalities and school systems tend to be less racially and economically segregated, have broad tax bases, and are economically healthy. For an extensive analysis, see David Rusk, Cities without Suburbs [Washington, DC: The Brookings Institution Press (1995)]
25 Incredibly, some states, like Pennsylvania, explicitly say that the zoning code and map are not governed by the comprehensive plan. Pennsylvania’s attitude seems to be that “planning is good as long as it doesn’t mean anything.” The dichotomy between planning and zoning was not resolved by a major reform of Pennsylvania’s municipal planning code in 2000.
26 Ironically, under such “modern,” “state-of-the-art,” local regulations, many of the most aesthetically pleasing, resident-friendly, pre-Euclidian, city and village neighborhoods that many local residents most cherish could not be reproduced today. They would be against the law.
INSIDE GAME/OUTSIDE GAME
21
regional plan.27 These range from laws with strong state standards, mandates, and sanctions (e.g. Oregon) to laws that establish very weak systems (e.g. New Jersey). However, it is this statutory requirement that local governments must collaborate in establishing a regional plan that classifies these twelve states as having enacted state growth management laws.
Annexation case study: Portland, Rochester, Lehigh Valley
Within the context of the three American case studies of this report, only Portland was a reasonably elastic city within a quasi-“big box” region. Between 1950 and 1990, Portland expanded its municipal area from 166 square kilometers to 323 square kilometers. Though large in a Dutch or other European context, Portland’s territorial expansion was modest by American standards. By the author’s typology, Portland was classified at the higher end of the “low-elastic” scale. Nevertheless, its annexations helped Portland expand its population from 373,628 (1950) to 437,319 (1990). Portland’s substantial population growth in the 1990s (to 503,637 in 1999) was the result of both additional annexations and higher density development within the city limits as a result of the regional Urban Growth Boundary (see below).
By contrast, Rochester was a prototypical “zero-elastic” city in a classic “little box” region. Trapped within its city limits for most of the 20th century, Rochester is a relatively small “central city” (93 square kilometers) by American standards. As noted in Part 1, within its five-county region, Rochester is surrounded by 124 other “little box” governments with no possibility of annexing additional territory. Though New York law, in theory, allows municipal boundary changes, Article 9 of the New York Constitution (the so-called “Local Government Bill of Rights”) requires any annexations or consolidations to be approved by popular elections in both affected municipalities. The political odds that any neighboring town would approve merger with the city of Rochester are zero. As a result, as illustrated in Tables 2-B through 2-E, Rochester suffered the problems of a zero-elastic city in the Age of Sprawl – declining population, falling income levels, and growing imbalance in household structure. (To this list, in Part 5, will be added significant ethnic and economic segregation affecting Rochester’s neighborhoods and schools.)
Allentown (46 square kilometers), Bethlehem (50 square kilometers) and, particularly Easton (just 11 square kilometers) are even smaller “central cities.” As reported to the US Census Bureau, small upward adjustments in their municipal territories over past decades reflect more accurate surveying than actual annexations. At mid-century, only Bethlehem had any significant vacant land; its development accounted for Bethlehem’s subsequent population growth, peaking in 1960. Allentown and Bethlehem have not suffered Rochester-type population losses, in part because of recent Hispanic immigration (largely Puerto Ricans from Philadelphia and New York). On a socioeconomic scale, these three cities would be labeled more “troubled” than
27 In order of original enactment, the states are Hawaii (1959), Vermont (1970), Florida (1972), Oregon (1973), Georgia (1989), Washington (1990), Maryland (1991), Maine, Rhode Island, and Delaware (all in early 1990s), New Jersey (1993), and Tennessee (1998).
INSIDE GAME/OUTSIDE GAME
22
“distressed,” like Rochester.
The Lehigh Valley, however, is as quintessential an example of a “little box” region as is the Rochester area. Besides the three cities, the Lehigh Valley has 66 towns and townships and 38 small boroughs (ten of which have less than 1,000 residents). Yet all are co-equal municipalities under state law. In Pennsylvania “annexations” can only occur through complete merger of two or more municipalities by a complicated process that requires a series of steps approved by all affected voters in three different elections. In the last twenty years such mergers have been successful only seven times out of Pennsylvania’s 2,570 cities, boroughs, and townships. There has been only one successful, voter-approved merger among neighboring New Jersey’s 567 cities, towns, and townships, and none among New York’s 1,549 cities, villages, and towns.
Thus, unlike the Portland area where substantial unincorporated land is under county government jurisdiction and municipal annexations are frequent, local government is organized in the Rochester and Lehigh Valley areas much as it is in the Netherlands. And like the Dutch Parliament, the Pennsylvania and New York legislatures (despite New York’s “Local Government Bill of Rights”) retain the power to approve annexations and mergers. During the 20th Century they never did so, and are unlikely to exercise that power in the foreseeable future.28
28 State legislatures were not shy about using their powers during the 19th century, however. In one afternoon in 1854 the Pennsylvania General Assembly abolished the USA’s 9th, 11th, 12th, 20th, and 28th most populous cities, added all remaining townships within Philadelphia County, and merged them with Philadelphia City to create the modern City and County of Philadelphia (350 square kilometers). In 1897, the New York State Assembly abolished the USA’s 1st and 7th most populous cities (New York and Brooklyn), merged them with three rural counties, and created the modern New York City (800 square kilometers). Both huge cities (which were, in effect, their own suburbs for decades) were very successful until post-war sprawl carried the bulk of their middle classes into new suburbs beyond their 19th century city limits. In the last fifty years, the merger of Indianapolis and Marion County (1970) was the only major consolidation carried out by a state legislature without voter approval. The merger instantly made Indianapolis the USA’s 12th most populous city and literally catapulted Indianapolis into the ranks of “big league” cities (with new professional football and basketball teams).
INSIDE GAME/OUTSIDE GAME
23
European Rules of the Game
Continental Level: The European Union
In important respects, the European Union is evolving as the equivalent of the federal government of the United States of America. Thus, when this report talks about “national policy” for a continental union, conceptually more and more attention should be focused on the evolving role of the European Union. In that context, the traditional national governments (Germany, France, The Netherlands, etc.) increasingly occupy the position of “states” in the American system.29 Dutch provinces become American “counties.” Indeed, both in their geographic and population size and in their relatively weak powers and functions, Dutch provinces appear to be more like American counties than American states.
This report has made no attempt to analyze European Union “rules of the game” in depth. We regard these few paragraphs as mere “placeholders” to remind Dutch policymakers that the EU-policies and programs will become increasingly important in Dutch development patterns.
EU Policies and Programs: The budget of the European Union for 2000 is 93 billion Euro. There are two fundamental ways in which the European Union works to bring about equal development of its member states and regions: the Cohesion Funds and Structural Funds
Cohesion Funds (2.5% of EU-budget 2000) are allocated only to member states and are limited to infrastructure and environmental projects only. In addition to allocation to member states, Structural Funds (30% of the EU-budget 2000) can also be allocated to regions whose socio-economic development is below the EU average. Programs focus not only on lagging regions but also on cities and problem areas within cities. The focus of the Structural Funds is programmatically broader than Cohesion Funds. For instance, Structural Funds are also used to reduce labor market obstacles for groups in society.
Although the actual way these funds are spent is decided by the regional and “national” governments, the European Union can decide that certain amounts have to be paid back when they were not spent according to the outlines of EU-policy.
29 One of the attributes of sovereignty is the power to issue currency. Since adoption of the federal constitution in 1789, American states have not had that power. With the Treaty of Maastricht, twelve member states have surrendered that key attribute of sovereignty to the European Monetary Union. Another of the attributes of sovereignty is the ability to declare war and make peace. With the exception of Great Britain (e.g. the brief conflict in the Falkland Islands in 1982, the Persian Gulf War in 1991) and Sweden and France (not NATO members), as a practical matter, EU members no longer have the power to go to war except as NATO allies. The proposed development of a small, European Union military force independent of NATO may further reinforce the EU’s emergence as a continental government and the relegation of its members to “state”-level roles.
INSIDE GAME/OUTSIDE GAME
24
Through the Common Agriculture Policy (CAP)), European farmers receive direct financial aid (which accounted for 45% of the EU-budget 2000) and a guaranteed price for their products.
The expansion process will fundamentally change the direction of funds provided by the European Union through CAP and the Cohesion and Structural Funds. Broadly speaking, EU funds are currently transferred from northern Europe to southern Europe, helping relatively underdeveloped regions in Spain, Portugal, and Greece (as well as Ireland). Of the total EU budget for Cohesion and Structural Funds of fl. 437 billion for the period 2000-2007, Dutch regions and cities will receive fl. 23 billion guilders. One consequence of expanding EU membership will be to replace the north-south transfer in favor of transfers from western Europe to eastern Europe. It is expected that European financial support for Dutch regions and cities will diminish significantly.
“State” Level: The Netherlands
Viewing the Netherlands as a “state”-level government within the context of the European Union, we shall examine briefly the same four broad categories into which the Dutch government’s impact on local land development falls: a) planning and investment in roads, highways, and other public works; b) provisions for municipal annexations, c) municipal tax and fiscal policies, and d) planning and zoning powers delegated to municipal governments by Dutch law. To these will be added a fifth category: allocation of direct state housing subsidies that shape municipal growth policy even more directly than do such activities in the USA.
State transportation policy: The European Union does not yet play the same dominant role that the American federal government plays in financing transportation infrastructure. For Trans European Networks (TENs) the EU-budget 2000 amounted to 668 million Euro (0.7% of the budget). In the Dutch TEN-projects are the High Speed Rail lines to Paris and Frankfurt and the Betuwe freight rail line (Rotterdam-Ruhr) – both of which pass through the KAN region.
In the Netherlands, public transportation has been heavily subsidized with state subsidies covering approximately 50% of operating costs for the national railroads and up to 80% of operating costs for local and regional public transportation. As car mobility took hold of the Netherlands in the 1960s, investments in the highways soared, quadrupling the national highway system from 583 km in 1960 to 2,268 km today. In the same period, only a few extensions of the national railroads were built. These were a regional line connecting The Hague and Zoetermeer; a new line connecting Schiphol Airport to Amsterdam and The Hague; and an extension of the railroad system to Almere and Lelystad, two new towns located in newly reclaimed polder land. Moreover, in Amsterdam and Rotterdam, new subway systems were built. But during the same period nearly all regional and many local tram systems were closed down, and the length of the total rail network shrank from 3,250 km to 2,805 km.
In the 1960s, the ratio between private transportation by car and public transportation was 53:47; nowadays that ratio is 88:12. Thus, in recent decades, the bulk of Dutch transportation investments favored roads and highways that facilitated lower-density suburbanization rather
INSIDE GAME/OUTSIDE GAME
25
than rail, tram, bus, and subway systems that strengthened more compact urbanization.
State municipal annexation laws: Unlike two-thirds of the USA where states contain much unincorporated land, the Netherlands is totally divided into incorporated municipalities. However, the Dutch Parliament (like American legislatures) has the power to merge municipalities or to allow one municipality to annex portions of another municipality. The Dutch three-tier governmental system with “national” (state), provincial (county) and municipal levels dates back to the Constitution of 1848 and the Municipal Law in 1851. Based on the statesman Thorbecke’s line of thinking, in this decentralised, but unitary, system, central (state) power is limited by a long history of municipal autonomy (which contrasts with the American philosophy that municipalities are “creatures of the state”). In the mid-1800s, the Netherlands had 1,209 municipalities of which about 200 were abolished through annexations and mergers by 1950.
Annexation controversies ultimately produced a very fundamental change for all Dutch municipalities. Tiring of constant controversies over annexation battles, in the mid-1920s, the Dutch Parliament set up a special commission to review annexation laws. Big cities argued that annexation was essential to expand their local tax bases; it was primarily fiscal policy that drove their annexation needs. In a surprise outcome, the Dutch Parliament eliminated the fiscal justification for annexation by “nationalizing” all municipal finance (see below).
Over the last fifty years, in spite of adding several new municipalities for reclaimed land in the IJsselmeer polders, the overall number of municipalities dwindled from 1,012 (1950) to 537 (2000). This was mostly accomplished by merging sparsely populated, rural municipalities.
Big cities’ attempts to annex land in suburban municipalities, however, have been bitterly opposed. From 1950 to 1990, the most populated 16 Dutch cities30 were only able to expand their municipal territory by an average of 25 square kilometers, or by only one-third of their initial territory.31 In one sense, the Dutch government’s Kaderwet law in 1994 (see below) was an attempt to overcome Big City inelasticity by consolidating them with surrounding municipalities to create unified “city-provinces” (stadprovincie). The effort was largely abandoned when voters in Rotterdam and Amsterdam, objecting to breaking up their historic cities into smaller districts within the proposed city-provinces, overwhelmingly rejected the proposals at the polls.
Recently, annexation-procedures have been changed as part of the Renewing of Governmental Organization-project, which started in 1995. The newly inaugurated government reconfirmed the three-tier governmental system and announced its intention to cut back on detailed regional regulations (except for the Kaderwet-areas) in favor of strenthening municipal authority and autonomy.
30 D. Rusk – Urban Growth, Conversations on Urban Policy: the USA and The Netherlands; in: Planning Metropolis, Urban Growth and Social Patterns, Vereniging Deltametrool, Delft, 1999
31 By contrast, setting aside 23 “zero-elastic” cities like New York, Chicago, Philadelphia, Detroit, Boston, and Washington, DC, the USA’s 84 most populous, “elastic” cities expanded by an average of 341 square kilometers --- more than tripling their initial territories.
INSIDE GAME/OUTSIDE GAME
26
In order to accelerate and clarify annexation-procedures, provincial parliaments will only have advisory roles regarding annexations, rather than having the power to draw up the bill which had to pass Parliament to legally approve the annexation. This will now be the exclusive function of the central government in order to make clear to citizens where decisions in annexation matters are taken. The authority of central government to initiate an annexation-procedure is now an explicit part of the law.
Also, new guidelines for re-drawing municipal bopundaries have been formulated in which, with a 25-year period in mind, redistricting must lead to healthy municipalities on an adequate scale. In addition to mergers of small rural and suburban municipalities, redistricting in favor of central cities is a new priority. (Annexation possibilities for Amsterdam and Rotterdam, however, were temporarily set aside while evaluation of their regional public bodies under the Kaderwet proceeded). “Annexations should facilitate those municipalities which serve as regional central cities to carry out this function properly,” the policy stated, “and allow them to develop housing-, office- and industrial sites within their own territory.” As a result of this policy, both small cities and some cities with more than 100.000 inhabitants (like Breda and Utrecht) have recently annexed neighboring municipalities. (See accompanying case study on municipal redistricting in Haaglanden and KAN.)
From one point of view, the Dutch government’s current proposal to annex about 12 km2 to the city of The Hague32 is modest by American standards if this were happening in an American state with large amounts of unincorporated land (a “county” state). On the other hand, no American legislature has transferred land from one municipality to another municipality in a “township” state (like the Netherlands) for almost a century.
State municipal finance policies: There is no greater contrast between local government systems in the USA and the Netherlands than in how local government is financed. As noted above, on average, local taxes and fees provide 77% of municipal revenues in the USA; state governments provide only 16%, and the federal government provides the remaining 7%. By contrast, the Dutch government funds 84% of municipal budgets; local fees and taxes generate about 15%. (In 1999, the European Union’s Structural Funds for Dutch regional and local governments amounted to fl. 850 million – 1% of all local government budgets.)
In recent years, however, the proportion of municipal budgets subsidized by the Dutch government has been falling as Dutch policy has emphasized greater municipal reliance on local fees and taxes (which in 1990 amounted to only 10% of all local budgets). The Dutch government has been motivated by the desire to reduce its expenses and balance its budget (to meet European Monetary Union requirements) and to inject a greater dimension of local accountability into municipal finance.
Since Dutch municipalities are very dependent on central government for their income, the criteria by which the “Municipal Fund” is divided and allocated to individual municipalities are
32 Exact area of proposed annexation is not in the bill; refered is to 490 ha of business locations; housing sites for about 15.000 homes; and approximately 10.000 inhabitants less in the suburban municipalities.
INSIDE GAME/OUTSIDE GAME
27
of great importance. Periodically, the allocation formula is revised after extensive investigations, hearings, and political lobbying. With the 1997 major revision, allocation criteria were rearranged in favor of cities. For the four biggest cities special arrangements were negotiated.
As Dutch municipal governments come to depend more and more on local taxes and fees, they will become increasingly motivated to engage in direct, American-style competition with their neighbors for desirable new development (i.e. welcome the rich and exclude the poor).
State municipal planning laws: The Netherlands is a heavily regulated country in every respect. Land use is regulated by the Act on Spatial Planning in which municipalities, provinces (counties) and the Dutch government all make their own plans that are coordinated with each level. The central government issues National Planning Decisions (PKB), periodic National Planning Reports, or “nota’s” (the proposed 5th nota has just been released), and also sectoral p[lans (for harbors, traffic, green areas, etc.). Provinces make regional plans (‘streekplannen’). Municipalities make comprehensive plans (‘structuurplannen’) and more detailed local land-use plans (‘bestemmingsplannen’). All these plans have to be agreed to by the next higher authority, which can (theoretically, at least) force the lower authority to amend its plan if it is contrary to the higher-level plan. And all these plans must (at least, officially) be reassessed every ten years.
In order to achieve its goals, in practice though, the central government needs the cooperation of the municipalities for they have a large amount of formal autonomy. Municipalities not only make and adopt local land-use plans but they grant building permits in accordance with these plans. Although at all levels proposed plans are subject to comments of citizens before final decisions are taken, only the municipal “bestemmingsplan” is legally binding. If there is no “bestemmingsplan,” or if there is an outdated plan which is inconsistent with new national strategies (and there are many plans older than ten years), municipalities still cannot refuse to grant a building permit33.
Many rural and suburban municipalities want to grow – and actively pursue – regardless of higher level planning policies. Moreover, in the past, most development has taken place on land where infrastructure was built and services were provided exclusively by municipalities. Therefore, municipalities can stop development from taking place which they do not want, and they have great powers for stimulating development which they do want. National government cannot accomplish its growth management strategy against the wishes of the municipalities. In the 1990s private developers complicated the picture by buying land designed for urban development under the 4th Nota.
Some 43,000 ‘bestemmingsplannen’ regulate land-use in the Netherlands, which is an average of one per 70 hectares and per 350 inhabitants. As this is far too complex in practice, around 15,000 times a year legal exceptions to these land use plans are proposed by municipalities and approved by the provinces. This combination of intensive planning for the future and flexibility in daily
33 One of the reasons why decision making on spatial planning in the Netherlands is so slow is that there are so many rules and regulations to obey that in most procedures mistakes are made by government bodies themselves, giving openings for a wide variety of legal challenges.
INSIDE GAME/OUTSIDE GAME
28
practice is rather efficient in balancing making land available in time for urban expansion and accommodating market forces.
Thus, suburbanization and urban sprawl – even though at higher densities than in the US – are not something that happens beyond political control, as may appear to be the case in the USA, but are part and parcel of government policy. Central government has legal powers both to prevent municipalities from approving land use plans that do not agree with central governmental policy and to replace a local land-use plan with its own plan, but, in practice, central government rarely uses these powers.
State housing policy: National spatial planning started with the Housing Law (“Woningwet”) in 1901, which first made governmental subsidies for housing corporations legally possible, but also introduced land-use plans (“uitbreidingsplannen”). After the devastation of World War II, this instrument was heavily used to combat “Enemy of the People Number 1” –the housing shortage. With the “Woonruimtewet” in 1947, municipalities also received authority to set up distribution systems for housing. In the subsequent 35 years social housing increased from 12% to 43% of all housing. In this period, some Dutch cities used the “Erfpacht”-instrument – leasing municipally-owned land for periods of 50 or 100 years after which the rent would be reassessed on basis of market prices. In the period after World War II up to the 1970s, because of these policies and active local housing corporations, even “inelastic” Dutch cities could capture a reasonable share of their region’s population growth.
As housing costs are a substantial part of personal expenditure, and good housing for all is considered to be socially desirable, Dutch housing policy has always been an integral part of Dutch social welfare policy. The Dutch government both subsidizes housing directly (as good housing stock is a socio-economic asset in its own right) and subsidizes residents. As in the United States, the Netherlands has a system of deduction of mortgage interest against income tax liability. With growing economic prosperity, buying a house through this system became financially much more attractive than renting. With an increasing number of home buyers and increasing housing rents, in 1975 individual rent subsidies were introduced (‘Huursubsidiewet’). Since then, both categories of individual subsidies grew heavily. Rent subsidies keep growing (fl. 3 billion in 1999), but are now subject to stricter eligibility rules. With homeowners now representing 50% of the population, changing the mortgage deduction system (fl. 12 billion in 1999) would not be easy politically.
Because after World War II most new housing has been built by housing corporations and buying homes became popular only in the seventies (when sprawl started), central cities have a high amount of social housing, while most owner-occupied housing is located in suburbs and rural communities.
Indirect rules of the game: Apart from the complexities of land-use planning, there are many rules and regulations that formally have nothing to do with land use planning but nevertheless can and do influence settlement patterns.
Agricultural subsidies and allotments: The Netherlands combines heavy food production subsidies from the European Union with the market-oriented approach of Dutch farmers. The

INSIDE GAME/OUTSIDE GAME
29
central government stimulates this by a special Rural Reconstruction Act that facilitates re-allotment of agricultural land between the owners to improve the conditions for agricultural production in combination with measures to promote conservation of valuable natural and cultural resources.
Any government agency or any private developer, however, may buy agricultural land and develop it as long as this is allowed by local land-use plans. With an eye to the flexibility (in practical use) of the Spatial Planning Act, farmers, especially in the western part of the country, have become players in an ongoing Great Land Lottery, in which present and future urbanization is driving land prices up to several times its value as agricultural land. If this situation continues and global trade policies keep pressing prices for farm products downward, farming will not be enough to earn a real income and farmers will either leave or combine farming with other sources of income.
It may not be easy to find general cause-and-effect relationships between these rules of the game and the outcome of all interactions among players, but the net effect is constant urban sprawl, constant loss of farmland, and an increase in economic segregation during a period that average incomes are also increasing.
New rules: 5th National Report on Planning: As nobody seems really happy with the results and people feel the Netherlands is very crowded indeed, the central government is proposing to change the rules of the game by introducing concepts like the “network-city,” “red contours” (as urban growth boundaries), and “green contours” (as defense lines for the conservation of landscapes that are valuable for natural or cultural reasons.) However, the “red contours” and “green contours” are not the same, leaving a gray “balance” zone in between.
With the “network-city” concept, the Dutch government hopes to stimulate concentration of urban development on and around nodes of transportation, at the same time creating new urban centers and diversifying these centers by making them unusually attractive living environments. If this approach succeeds, it may offer an alternative to ongoing suburbanization by shaping the emergence of a new, more attractive type of urban environment.
Introducing red and green contours may offer means to improve coordination between municipalities and provinces on overall urbanization patterns and of maintaining a sustainable rural economy and at the same time improve citizen’s control over local government arrangements in these matters.
To support this land use policy of network cities and landscape conservation by red and green boundaries, the central government also announced a “fundamental” review of the Act on Spatial Planning and a series of new legal instruments to regulate the land market. This improved regulation of the land market should strengthen the position of municipalities, not only in acquiring land but also in obliging private developers to pay for public facilities in new urban extensions as well as in inner city reconstruction. These recent proposals are focused on strengthening municipal powers, and their impact on agricultural land use and on values of agricultural land is not clear yet.
INSIDE GAME/OUTSIDE GAME
30
Summing up: The lessons to be learned from a broad look at all the rules and regulations that influence land-use is that planning rules alone will not do the trick if they are not supported – or at least not nullified – by rules and regulations that have apparently nothing to do with planning but “only” with other subjects of government policy.
Annexation Case Study: The Hague, Nijmegen, Arnhem
Although the legal framework for annexations has been the same for the three Dutch case studies in this report, the outcomes have been very different.
The Hague is the Netherlands’ most inelastic city. Since the introduction of the Municipal Law by Thorbecke in 1851, the Dutch “Hofstad’s territory” was never enlarged until 1994, when a meager 315 hectares (0.5%) was at last added to its original 66 square kilometers. Compared to Amsterdam’s 11% growth, Rotterdam’s 37% growth, and Utrecht’s 171% growth just between 1950 and 1990, The Hague’s territorial expansion was extraordinarily low.
The Hague’s population peaked in 1958 with 608,825, but declined to 441,000 in 2000. Being the center of a region that was growing from 795,000 (1950) to 955,000 (2000) and at the same time losing population itself (which in the Dutch “Municipal Fund” system means losing “tax-base”), The Hague ran into heavy financial problems. In 1994, the city had to request “article 12 status,” which meant that all The Hague’s expenditures had to be approved by the provincial and Dutch governments.
Haaglanden’s special position was recognized by the Dutch government in 1995 (after the rejection of their own proposed city-provinces by Amsterdam and Rotterdam voters). The central government announced that it would continue preparations for creating a Haaglanden city-province but would keep open the option to redraw municipal boundaries to allow for The Hague’s expansion. A majority of the Haaglanden regional council voted in 1996 in favor of evolving into a Haaglanden city-province, but five member municipalities disagreed.
In 1997, the Dutch Parliament voted, contrary to the government’s proposals, to stop preparations for a Haaglanden city-province and to ease The Hague’s fiscal burden by enlarging its territory through annexing suburban locations planned for new housing and industry. In that same year, a fl. 1.1 billion injection into The Hague’s budget was granted by the Dutch government on the assumption that The Hague’s long-term financial position would soon improve as a result of the pending annexations. Advisory councils reported that one of the main reasons for The Hague’s financial problems was its inability to offset expensive urban renewal projects with profitable greenfield projects.
Four years later the numbers of hectares to be annexed has shrunk from 1,500 hectares initially proposed to 1,20034 hectares currently in a fierce battle which still remains to be resolved in
34 All estimates, see footnote 32
INSIDE GAME/OUTSIDE GAME
31
Parliament. Part of the bill is now the (voluntary) merger of two suburban municipalities (Pijnacker and Nootdorp), which will both lose parts of their territory to The Hague, into one municipality. The seven municipalities in the “greenhouse area” of Westland are still “keeping all options open” about The Hague’s annexation plans and their own futures.
Nijmegen has also been a zero-elastic city for almost half a century. In 1969, provincial proposals to enlarge Nijmegen significantly by annexing the neighbouring Ooij-polder were aborted after urban development on this site was forbidden in one of the rare cases that the Dutch Government used its power to veto the provincial streekplan. In the 1970s, relations between Nijmegen and its neighboring communities were tense and led to ending regional cooperation within the framework of the Stadsgewest Nijmegen.35
The 1990s saw a turnaround in inter-municipal relationships. As part of the 4th Nota, a major new housing site, the Waalsprong, was proposed to the north of Nijmegen. In 1992, the municipalities of Valburg, Bemmel, and Elst resisted the Waalsprong-project in favor of merely expanding their own existing villages (that is, the more urbanized areas within their municipal boundaries) in the Over-Betuwe area between Arnhem and Nijmegen. The Dutch government subsequently announced that it would withdraw its financial support for plans in the region in case the three municipalities’ alternative was adopted. After heated debate, in 1993 the Province of Gelderland opted in favor of the Waalsprong housing development and concluded that Nijmegen and its municipal neighbors must negotiate the exact terms of its location and financing.
The outcome of this process has been remarkable. “Voluntarily,” the municipalities of Valburg, Bemmel and Elst agreed to redrawing their municipal boundaries to create a new part of Nijmegen north of the Waal River. In return, Nijmegen paid Elst, the most affected municipality, fl. 1.8 million in compensation for its annexed territory. In addition, the current inhabitants of the annexed territories received a financial “welcome rebate” in order to compensate for Nijmegen’s higher local taxes. In three subsequent annexations in 1996-98, Nijmegen enlarged its territory by 1,200 hectares to 54 square kilometers (i.e. 29% growth), bringing its population back at its peak level of 152,000. And, as part of the deal, the three involved municipalities in the Over-Betuwe area were allowed to enlarge their villages with a modest amount of new housing construction.
Arnhem, by contrast, is a hyperelastic city by Dutch standards. Since 1950, it enlarged its territory by 3,200 hectares (50% growth) with annexations in 1953, 1966, 1974 and 1995. Taking in account that half of Arnhem’s original territory is part of natural park area, the Veluwe, Arnhem, in fact, doubled its urbanized territory.
In another merger of suburban municipalities that were deemed too small to be viable, the six municipalities between Arnhem and Nijmegen have been merged into two in 2001. Arnhem claimed part of this territory in order to enlarge (if needed) the Schuytgraaf housing site that Arnhem is currently building. The Dutch Parliament decided not to support Arnhem, based on
35 M. Boogers, Het Onderste uit de KAN, maatschappelijk draagvlak voor stadsregionaal bestuur in het Knooppunt Arnhem-Nijmegen, Eburon, Delft, 1998

INSIDE GAME/OUTSIDE GAME
32
assurances by the Province of Gelderland that, if necessary, Arnhem’s proposal will be executed by the Province.
To the east of Arnhem, in the ‘Liemers’-area, redistricting proposals have also been announced. Claiming territory for industrial sites near the A12 highway, Arnhem recently reached its goal without annexation when the municipality of Duiven agreed to develop a 200 ha site itself.

INSIDE GAME/OUTSIDE GAME
33
INSIDE GAME/OUTSIDE GAME
34
Part 4: Regional Government and Urban Growth Management
Portland
The greatest sin of typical state municipal planning codes is that they encourage a view of the world that is bounded by the jurisdictional limits of each municipality. The Pennsylvania, New York, and Oregon (pre-1973) municipal planning codes neither require nor encourage municipal planners to look beyond their jurisdictional boundaries. That means that the “world” within which local governments develop their “comprehensive” plans averages 60 square kilometers in metro Rochester, 35 square kilometers in the Lehigh Valley, and 36 square kilometers in Portland’s urbanized area (pre-1973).
Why Oregon Is Different within the USA
Why have we twice referred to Oregon or Portland as”pre-1973”? The answer is that in 1973 the Oregon legislature approved The Oregon Land Use Act that literally transformed land use trends in Oregon. Almost thirty years later Oregon’s growth management program is a proven success and a national model.
The Oregon Land Use Act dramatically reduced local government autonomy over land-use decisions in order to achieve statewide growth management policies. At the same time, both the state legislature and local voters combined to create Portland METRO, the USA’s only directly elected regional government, as the land use and transportation planning agency.
The Portland area has the USA’s strongest anti-sprawl, growth management system because Portland METRO functions at the juncture of two powerful forces: strong direction from above (that is, from state government, which has the constitutional authority) and strong influence and accountability from below (that is, to the regional electorate – many of whom are extremely knowledgeable and active in land use and transportation planning issues).
The basic elements of the system can be summarized as follows:
Direction from above (state goals, review, and approval):
1. The Oregon Land Use Act mandated that.
a) all 36 counties must develop comprehensive land use plans that complied with 14 state goals, and
b) all 242 municipalities must adopt comprehensive land use plans that would be consistent with state goals, the county plan, and that would designate an Urban Growth Boundary (UGB). The UGB must draw a clear line between
i. land preserved exclusively for farming, forestry, and wilderness and recreation areas; no urbanization is allowed, and
INSIDE GAME/OUTSIDE GAME
35
ii. land that would be urbanized. Inside the UGB, sufficient land must be provided for 20 years of anticipated residential, commercial, and industrial growth.
2. The Act established a new state regulatory agency, the Land Conservation and Development Commission (LCDC). With seven members appointed by the governor (and confirmed by the state senate) and a professional staff, LCDC was charged with adopting detailed state goals and regulations, reviewing and approving county plans (with their component municipal plans), and reviewing and approving subsequent amendments to the approved local plans. In addition, LCDC was given authority to review and approve other state agency plans with land use impacts.
3. Subsequent legislation established the Land Use Board of Appeals (LUBA) as a quasi-judicial body to decide appeals of local government planning decisions. With three, full-time attorneys appointed by the governor (and confirmed by the state senate), LUBA provided a faster, less expensive path for adjudicating disputes than legal challenges in the state court system.
(A more extensive discussion of the Oregon Land Use Act, LCDC, and LUBA is contained in Appendix D.)
Accountability from below: (Portland Metro)
1. Portland METRO’s jurisdiction covers the city of Portland, 23 suburban municipalities, all of Multnomah County, and substantial portions of Clackamas and Washington Counties. (Very rural portions of these two counties far from the urbanized area lie outside of METRO’s official authority.)
2. METRO is not an all-purpose government (unlike the ill-fated Dutch stadprovincie) that replaces any of the 24 municipal and three county governments. It is a special purpose government, established by the legislature and the region’s voters, explicitly to be the regional land use and transportation planning agency. Periodically, METRO has been assigned management responsibility for certain regional functions (e.g. the Oregon Zoo, the Oregon Convention Center, the regional parks system, and a regional solid waste disposal and recycling program). These are major functions in terms of budget and number of employees but minor functions compared to METRO’s important planning powers in shaping the region’s future.
3. METRO is governed by seven-member Metro Council that is elected for four-year, staggered terms from the seven districts into which the region is divided. Its Executive Officer, also elected, is perhaps second only to the governor among Oregon’s elected officials. He directs an agency with 693 employees and an annual operating budget of $263 million in 2000-01. (Over two-thirds of its employees are involved in the service functions mentioned above.)
4. METRO is responsible for developing and periodically revising the region’s
INSIDE GAME/OUTSIDE GAME
36
comprehensive land use plan, including designating the UGB. (The original UGB in 1979 was 88,600 hectares; it was expanded by 1,550 hectares in 1998. By 1999 about 1.3 million people, or 90% of the population of the five-county PMSA, lived within the UGB. The remaining population lived in smaller towns and rural areas under the jurisdiction of the four more rural counties. Multnomah County is totally urbanized.)
5. METRO also has overall responsibility for allocation of annual federal and state transportation subsidies (highway construction, the light rail system, bikeways, etc.).36 In addition, with bonds approved by voters, METRO acquires land for and manages the regional park system.37
6. METRO adopts specific ordinances to carry out its adopted plans. These ordinances are legally binding on local governments.38
7. METRO develops its plans and policies after extensive consultation with local governments and many public meetings and public hearings. METRO’s planning process is fundamentally democratic, not technocratic.
Over a period of more than three decades, the state legislature and local citizens (through four charter referenda and a dozen elections) have collaborated to create Portland METRO, the USA’s only directly elected regional government.
(An extensive history of METRO’s evolution is contained in Appendix E.)
Summing Up
Since its birth the Oregon Land Use Act (and Portland METRO) have been controversial, and have had their dedicated opponents. Three times Oregon voters have gone to the polls to defeat initiative referenda to repeal the law – by a 57 to 43 margin in 1976, by a 60 to 40 margin in 1978, and by a 55 to 45 margin in 1982. In 1999, an initiative was proposed to require that all administrative rules adopted by all state regulatory bodies would be voided unless submitted to and confirmed by the Oregon legislature. That was widely interpreted at being targeted primarily at LCDC and the state growth management program. That was defeated by a similar margin.
36 Under the federal Transportation Equity Act (TEA-21), METRO is designated as the “Metropolitan Planning Agency (MPO).”
37 METRO currently manages 1,600 hectares of regional parks and is acquiring 2,400 additional hectares under a $135 million bond issue approved by the region’s voters in 1995.
38 An example would be a METRO ordinance, adopted in 1998 that banned any new retail stores of more than 6,000 square meters in land zoned for industry. (In other words, no more superstores.) METRO wanted 1) to reserve the limited supply of industrial land for major, job-creating, high-wage industries, 2) to reduce air pollution by limiting vehicle miles traveled (superstores typically depend on a 40-kilometer radius customer area), and 3) to favor smaller, neighborhood-based retail stores as part of its plan for a more compact, pedestrian-oriented region.
INSIDE GAME/OUTSIDE GAME
37
Nonetheless, Oregon voters are not exempt from being deceived or from doing stupid things. In 2000, the same ultra-conservative activists who have proposed many ballot initiatives (including the anti-state regulation ballot initiative that was defeated the previous year) were back with a so-called “property rights” amendment to the Oregon constitution. That would require that property owners be reimbursed for any government action, including zoning, that arguably would reduce the potential value of their property. If adopted, the constitutional amendment’s provisions would apply not only to future actions but also to all past actions. (A similar “property rights” amendment had been narrowly defeated in the neighboring state of Washington the previous year.)
Despite the opposition of many civic, business, and “good government” organizations, arguing that such a provision could cost the taxpayers billions of dollars, the “property rights” amendment was approved by a 54 to 46 margin statewide (though it lost within the Portland area).
Potentially, this action could seriously damage growth management in Oregon. However, growth management supporters are challenging the amendment before the Oregon Supreme Court.
Confronted with Oregon’s achievements, many elsewhere in the USA counter that “Oregonians are different.” It is true that many Oregonians (both natives and more recent arrivals) are strongly committed to protecting Oregon’s environment. (Oregon is a beautiful state. Oregonians have much to protect.)
But it is also true that many Oregonians are westerners with an anti-government, rugged individualism, “don’t fence me in” attitude. The two sides of the Oregon personality has been at war with each other over growth management for the past thirty years. The anti-government forces won the latest round.
Winston Churchill once said: “We first shape our buildings. Then our buildings shape us.”
For thirty years Oregonians have been shaping their building – the Oregon Land Use Act, LCDC, METRO, etc. A dozen times since 1978, voters of the region have gone to the polls to elect the Metro Council and Executive Officer. Land use and transportation planning controversies are always the election issues.
Beyond the governmental institutions, Oregon has developed a powerful citizens lobby, 1,000 Friends of Oregon, that serves as a watchdog over the entire process. 1,000 Friends of Oregon has defended good planning principles and citizens’ right to be involved many times before LCDC, LUBA, the courts, and the legislature.
That intensely democratic process has, in turn, re-shaped the builders. There is broader and more knowledgeable citizen involvement in land use planning issues in Oregon (particularly, within Portland METRO communities) than in any other area of the USA.
To the extent that Oregonians are different, their institutions have helped to educate and shape them.
INSIDE GAME/OUTSIDE GAME
38
Regional Government in the Netherlands
National policy backround: For half a century urban decentralization and the growing scale of urban systems have fueled a debate on the need for regional government in the Netherlands. As there is no unincorporated territory, big city annexations have been hotly debated and contested (without exception). Local government mergers have occurred mostly in rural areas.
In order to promote inter-municipal collaboration the Dutch parliament approved in 1950 a law on common regulations (Wet gemeenschappelijke regelingen, or Wgr). Under this law, different alternatives were provided for the composition of joint governing boards for different types of voluntary cooperative serviecs (joint fire-brigades, joint health care facilities, etc.).
In the 1960s, the need for coordinated spatial planning at an adequate scale was recognized by the Dutch government, which resulted in a proposal to create 44 gewesten in the Netherlands. In Rotterdam, where needs were the highest, in 1964 the “Public Body Rijnmond” had already been initiated. But controversy led to delays, and only a second major regional body, the “Agglomeration Eindhoven,” was created. In 1976, a new administration proposed creating a new type of provincial government, incluiding an increase from the 11 existing provinces to 24 new-style provinces. After more debates (and party turnover in the Dutch cabinet), the two existing regional bodies for Rotterdam and Eindhoven, which had continuing conflicts with their central cities, were abolished, and the Wgr was revised in 1984. Under the revised Wgr, the different types of inter-municipal cooperation had to be integrated into one, more visible, umbrella-like gemeenschappelijk regeling in an effort to raise public understanding and support.
At the end of the 1980s, the tide changed again. The desire to promote an urban renaissance inspired the central government to publish its 4th National Report on Planning, in which a small number of cities were targeted to be strengthened. An independent advisory committee on “Big City Policy” advised enlarging the four big cities in the Randstad significantly.
In 1990 government started a bottom-up process, leading in 1994 to the Kaderwet Bestuur in verandering, or Kaderwet, which authorized organizing a new type of regional body – a Regionaal Openbaar Lichaam (ROL), or “Regional Public Body” – to coordinate important public programs for metropolitan areas. (Seven such regional bodies were formed.)
The Kaderwet also allowed turning the regional bodies into a new type of government, the city-province (stadprovincie) that would not only consolidate many municipal governments into one, unified, super-municipality but would also, in effect, supplant the provincial governments.
In referenda in Amsterdam and Rotterdam in 1995 and 1996, an overwhelming majority of citizens voted against the city-province concept because part of the plan was to break up the cities of Amsterdam and Rotterdam into smaller, constituent districts (called municipalities) within the proposed city-provinces. In the aftermath of those electoral defeats, after long hesitation, the Dutch government shelved the city-province strategy. Recently, after an evaluation of the seven operating regional bodies, the Dutch cabinet has announced that this year it will send new proposals to the Dutch Parliament about the future of regional government in the
INSIDE GAME/OUTSIDE GAME
39
Netherlands.
The basic goal of all seven ROLs (as set forth in the Kaderwet) is to develop collaborative approaches to metropolitan problems and to assure balanced development of the entire region. To reach this central goal, the ROLs have planning and coordinating tasks in the fields of urban development, housing, land use policy, transportation, environmental protection, and economic development (just like Portland METRO). To execute the VINEX-policies of the 4th National Report on Planning the central government has signed covenants with the ROLs. In addition to their planning functions, they allocate and administer housing subsidies, and are responsible for the housing distribution regulations.
As Transportation Regions (Vervoerregio’s) only ROLs can apply for infrastructure investment subsidies from the central government and receive subsidies to cover the operating deficits of public transportation companies. At present, ROLs have the authority to allocate centrally-funded budgets for minor infrastructural projects (up to fl 25 mln). Recently the Dutch Cabinet has proposed to raise these budget limits and let both provincial governments (the only other transportation regions) and ROLs allocate projects up to fl. 500 million.
Apart from these basic powers, the ROLs also have certain responsibilities that have been delegated to them by both central and municipal governments. The ROLs represent their regions in several national policy forums (for example, in the discussions regarding the 5th Report on National Spatial Planning and the National Traffic Plan, or NVVP).
Each ROL’s primary responsibilities were to develop a Regional Comprehensive Plan (Regionaal Structuurplan or (RSP) and, as a Transportation Region, the Regional Transport Plan (Regionaal Verkeer- en Vervoersplan or RVVP). RSP is the integrating document into which all regional policies and projects must fit (like Portland METRO’s comprehensive plan).
(See Appendix F for an overview and accomplishments of KAN and Haaglanden.)
Haaglanden
History: Recognising their inter-relationship, seven municipalities in The Hague area started an “inter-municipal consultation’ in 1968. (The seven municipalities in the neighboring “greenhouse area” of Westland had done this already in 1967.) Inspired by national policy proposals in 1973, six of these municipalities formed a voluntary council of governments (Gewest ’s-Gravenhage), which had a Crown-appointed chairman and received a national subsidy of one guilder per inhabitant as gesture of good will for supporting the proposed national policy. Integrating and coordinating planning were its main tasks.
Following changes in national policy, board membership of the Gewest ’s-Gravenhage was revised to reflect its member municipalities; responsibilities were limited to coordinating services rather than broader planning.
INSIDE GAME/OUTSIDE GAME
40
Under Kaderwet: In 1988, The Hague started pressing for annexations. In response, the seven municipalities agreed to strengthen the regional cooperation. Enactment of the Kaderwet law led in 1995 to melding the gewesten Westland and The Hague into the Stadsgewest Haaglanden, which now consisted of 16 municipalities as Delft and Pijnacker had joined the The Hague gewest already in 1993. Contrary to the Amsterdam and Rotterdam cases, the 1996 proposals for a Haaglanden city-province did not contain plans to split up The Hague itself into smaller municipalities. In 1999 Haaglanden’s budget was fl. 640 mln and it had a 110 member staff.
Power: Members of the Haaglanden-council are appointed by their municipal councils. With 46.8% of the population, The Hague has 34.8% of the votes in the Haaglanden council. Together with Delft (8.7% of the votes; 10.1% of the population) and Zoetermeer (10.1%, respectively 11.6%), the three major cities can control a clear majority of the council votes. The mayor of The Hague is, by regulation, chairman of the executive committee. Each municipality has a representative on the executive committee; votes have the same weight as in the Haaglanden-council.
Results: Haaglanden’s Regional Plan has not yet been adopted as conflicts over a luxury housing site on The Hague’s border have only been settled recently. Also, other projects, like The Hague’s ring road, have a long history of inter-municipal conflicts and slow procedures.
One positive outcome is that a compensation fund has been established. The cost of difficult and easy-to-develop housing sites offset each other through this fund, into which negotiated amounts of money flow from several municipalities and central government (as part of the agreement to execute the 4th Report-policy). Of interest also is Haaglanden’s ‘mobility-fund’ into which each municipality donates fl. 15 per year per inhabitant to improve transportation infrastructure.
Another improvement is the regional housing distribution system, which came into effect in 1996. Renters looking for housing can now use a common application for housing in all Haaglanden municipalities (except the Westland). Reaching agreement on the number of low-income renters to be accomodated in each municipality has been more difficult. The Hague is pressing its neighbours to raise their quotas. And even more important, construction of new housing for low-income groups in the suburbs is minimal as the VINEX-covenant leaves enough flexibility to build ‘social housing’ at rent-levels that are beyond low-income households’ reach.
The annexation-threat has recently had a very negative impact on regional cooperation in Haaglanden. The five threatened suburbs recently proposed a weak form of a city-province as an alternative to The Hague’s proposed annexations.
KAN (Knooppunt Arnhem Nijmegen)
History: In 1966 Arnhem and its surrounding municipalities started an inter-municipal consultation body, which, following national policies, turned into the Gewest Arnhem in 1973. With a “give and take” strategy, its board was operating relatively succesful. National policy changes led to the organization to splinter into several functional groupings, which, after the next
INSIDE GAME/OUTSIDE GAME
41
national policy change in 1984, were integrated again under one umbrella organization.
An inter-municipal consultation body in Nijmegen started in 1965, but was wracked by conflict, mainly because of Nijmegen’s annexation attempts. When its annexation strategy failed, Nijmegen tried to strengthen regional cooperation through a new Stadsgewest Nijmegen (1971). Pushing for stronger powers led to its break up in 1977.
Preparations for the 4th National Report on Planning and its knooppunten-strategie led to new momentum for regional cooperation in the Arnhem-Nijmegen region. The economic slow-down in the 1980s, and industrial lay-offs had caused high unemployment rates. With the Province of Gelderland providing the stimulus, plans were prepared for the region to play a role as national knooppunt between the Randstad and the Ruhr-area. Under these plans, Arnhem and Nijmegen are growing towards each other, with the areas between them filling with new housing sites, office and industrial parks, greenhouses and parks.
Under Kaderwet: When the Kaderwet was still in preparation, debate started over which municipalities should form the Arnhem-Nijmegen region. The Province of Gelderland would not allow the region, the core of its province, to become too big. Though interested, Wageningen, 15 km to the west of Arnhem and home to the Netherlands’ agricultural university, was not allowed to become member. Some municipalities at the fringes of the Nijmegen and Arnhem areas refused to become members. In the end, 25 of the 29 municipalities who made up the former Stadsgewesten became members of the new Knooppunt Arnhem-Nijmegen (KAN). KAN’s budget for 2000 amounts fl. 154 million and its has a 20 member staff.
Power: KAN’s members are the cities of Arnhem and Nijmegen and 23 surrounding municipalities. The official start of KAN was February 1995, when KAN was installed as a Regionaal Openbaar Lichaam (ROL). The KAN-Council has a total of 39 representatives from all 25 municipalities, who are appointed by each municipal council. Municipalities with fewer than 20,000 inhabitants appoint one member, the others two. The major cities of Arnhem and Nijmegen each have five members, but their votes count double. Thus, the two cities (that collectively represent about 42% of the region’s population) can cast about 40% of the KAN-Council’s votes.
The KAN-Council has chosen an administrative board composed of four part-time members and its full-time chairman, who is currently from outside the region. The KAN-Council has also created a number of advisory committees.
KAN policies and programs: In 1998, the outlines for urban planning in KAN were finalized when the RSP was adopted by KAN-Council and approved by the Province (just as LCDC must approve regional plans in Oregon). For the RSP, KAN formulated several overall policy goals:
• Concentrate urbanization
• Limit the growth of automobile use
• Protect and reinforce the natural landscape
INSIDE GAME/OUTSIDE GAME
42
• Create jobs by stimulating economic development
• Assure adequate levels of public services
• Serve market demand by diversifying housing supply and neighborhood types
• Limit pressures on the natural environment (e.g. air pollution, water pollution, etc.)
The RSP has had great impact.
First, all municipal plans must be adjusted to the RSP’s policy decisions. Because of the basic Dutch municipal planning law, agreements mentioned in the RSP are not binding on local citizens until the moment they are integrated into municipal plans. (Similarly, in Oregon, it is only municipal zoning codes and municipal zoning maps that are legally binding on property owners.)
Second, the RSP consists of a detailed plan for urban development. The agreements concerning timetables and financing are binding. If a municipality does not follow these agreements as set forth in the RSP, the Province can force the municipality to do so (just as the LCDC and LUBA do in Oregon). As to financial policies for urban development, KAN has not yet used its legal powers draw up policies, for example to compensate between easy and difficult to develop housing sites.
Another major task of KAN concerns housing as KAN is responsible for regulating housing distribution and allocates various subsidies for new housing units, including funds for social housing. KAN adopted a Regional Housing Plan and has detailed agreements on the proportions of different price categories for new housing. All subregions within KAN would build 20% low-income, 35% middle-income, 25% expensive and 20% very expensive housing. An evaluation of the outcomes for the 1999-2001 period shows that the agreed amount of low-income housing has been built in spite of Arnhem’s low percentage (6%). The problem is that in the whole region not enough middle-income housing and too much expensive housing are being built. The KAN-council has recently decided to differentiate the regional targets between Arnhem/Nijmegen and the rest of the region. The two cities will build less low- and middle-income housing, while other municipalities will build relatively more of these price categories, in order to lessen disparities in the housing stock in KAN.
Since adopting the RSP in 1998, KAN’s attention has focused on the execution of projects and monitoring of social and economic developments to see if the RSP needs an update.
Summing Up
The municipalities working together in KAN seem to have made the best possible use of the Kaderwet. Of the seven Regional Public Bodies (ROLs), KAN is widely acknowledged as a successful example, while Haaglanden is generally viewed as beset by internal conflict.
We suggest that there are three primary reasons for KAN’s success.
INSIDE GAME/OUTSIDE GAME
43
• No single municipality can dominate KAN politically. Even the two largest cannot, for Arnhem and Nijmegen account for only 42% of the region’s population and 40% of the votes.39
• Unlike in the highly developed and already wealthy Randstad, for example, the desire to promote the KAN region’s prosperity probably created a greater spirit of common purpose and willingness to collaborate for the common good.
• Having a highly respected “outsider” as chairman/CEO who was not an (elected) official from a member municipality provided a neutral leader who was very effective in resolving disputes among members.
Comparing these fairly recent experiences with KAN and Haaglanden in the Dutch context of the Kaderwet with more extended experiences in Portland in the Oregon context of the 1973 Land Use Act, two important differences should be mentioned.
First, the role of citizens in Portland is much more powerful and pervasive than in KAN and Haaglanden. Whereas the Oregon Land Use Act and the Portland Metro Charter empowered citizens and were in themselves products of citizen initiatives, in the Netherlands the Kaderwet created KAN and Haaglanden as internal, intra-governmental affairs. Within KAN’s specific context, this worked well. However, the overwhelming rejection of the proposed city-provinces by Amsterdam and Rotterdam voters serves as a warning sign of what can happen when officialdom listens too much only to itself.
Second, in Oregon, conservation of agricultural land use is considered to be more important than it is in more heavily urbanized Netherlands. However, farmland serves two roles: to produce agricultural products and to conserve open space. As heavily urbanized as the Netherlands is, 46% of Haaglanden and 76% of KAN is still rural land, which makes the urbanized areas more livable.
39 For the other ROLs, the population percentages and voting strength of the central cities are Regionaal Orgaan Amsterdam (population: 56%; voting strength: 38%); Stadsgewest Rotterdam (49% and 51%); Bestuur Regio Utrecht (30% and 36%); Stadsgewest Eindhoven (28% and 27%); and Twente (Enschede: 24% and 24%).
INSIDE GAME/OUTSIDE GAME
44
Evaluating Portland’s Urban Growth Boundary
How effective was Portland’s Urban Growth Boundary? How well did the UGB protect farm and forest lands? More to the point of this study, how well did the UGB help prevent the decline of the city and its inner-suburbs by redirecting investment back into the urban core communities?
This section will seek to provide answers to those questions. The method used will be primarily to compare the Portland area to the other two American case studies (Rochester and Lehigh Valley) or to other American communities. Where possible we will provide relevant data on Haaglanden, KAN, Stockholm, and Antwerp. However, the Portland case should not be evaluated on the basis of comparison with European communities. First, data are often not comparable. Second – and much more importantly – as the early parts of this report sought to show, many basic conditions are very different between America and Europe. Portland’s UGB should be evaluated within an American context. Then one can speculate on a UGB’s effectiveness in a Dutch or other European context.
Saving Farmland
The impact of different “rules of the game” between Oregon/Portland, on the one hand, and New York/Rochester and Pennsylvania/Lehigh Valley, on the other hand, is clear. As table 4-A USA shows, during the 1990s Oregon’s population grew rapidly (20.4%) but Oregon lost only -2.0% of its farmland. In other words, population grew at ten times the rate of farmland loss. By contrast, both Pennsylvania (-8.9%) and New York (-13.8%) lost farmland at about 2 ½ times the rate of their modest population growth (3.4% and 5.5%, respectively). The state of Washington’s rapid population growth (21.1%) was about four times the rate of farmland loss (-5.8%). (In 1990, the state of Washington adopted an Oregon-type law. That undoubtedly helped to slow down the rate of farmland loss during the later years of the decade.)
At the regional level, the three counties (partially) covered by Portland METRO’s urban growth boundary grew 17.6% in population but lost only -0.1% of farmland – a spectacular result. By contrast, the Lehigh Valley grew a modest 3.2% but lost -6.9% of its farmland (over twice the rate of population growth). Metro Rochester’s population hardly grew at all (1.6%) but it lost -12.8% of its farmland (8 times the rate of population growth).
Interestingly, table 4-A NL/EU illustrates that, on the one hand, the Netherlands and Belgium both were closer to an Oregon-type balance between population growth and urbanization of farmland than they were to the extreme imbalances experienced in New York and Pennsylvania. In the 1990s, the Netherlands’ population grew two times as fast (4.7%) as the loss of farmland (-2.0%); in Belgium, population growth (3.5%) equaled the rate of farmland loss (-4.6%).
On the other hand, both Haaglanden and the Antwerp region mirrored Rochester- and Lehigh Valley-type imbalances. Although the greenhouse area expanded, Haaglanden lost farmland (-7.3%) at three times the rate of population growth (2.8%). The Antwerp region lost farmland (-7.0%) at four times the rate of population growth (1.8%).
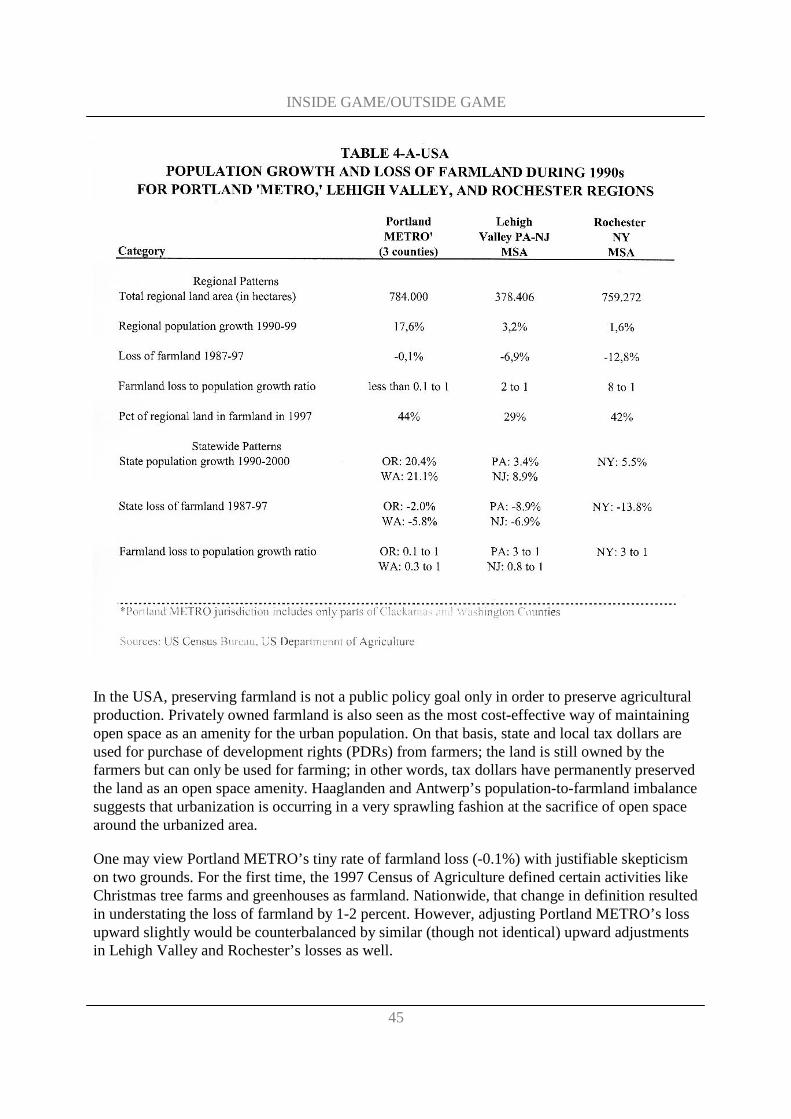
INSIDE GAME/OUTSIDE GAME
45
In the USA, preserving farmland is not a public policy goal only in order to preserve agricultural production. Privately owned farmland is also seen as the most cost-effective way of maintaining open space as an amenity for the urban population. On that basis, state and local tax dollars are used for purchase of development rights (PDRs) from farmers; the land is still owned by the farmers but can only be used for farming; in other words, tax dollars have permanently preserved the land as an open space amenity. Haaglanden and Antwerp’s population-to-farmland imbalance suggests that urbanization is occurring in a very sprawling fashion at the sacrifice of open space around the urbanized area.
One may view Portland METRO’s tiny rate of farmland loss (-0.1%) with justifiable skepticism on two grounds. For the first time, the 1997 Census of Agriculture defined certain activities like Christmas tree farms and greenhouses as farmland. Nationwide, that change in definition resulted in understating the loss of farmland by 1-2 percent. However, adjusting Portland METRO’s loss upward slightly would be counterbalanced by similar (though not identical) upward adjustments in Lehigh Valley and Rochester’s losses as well.
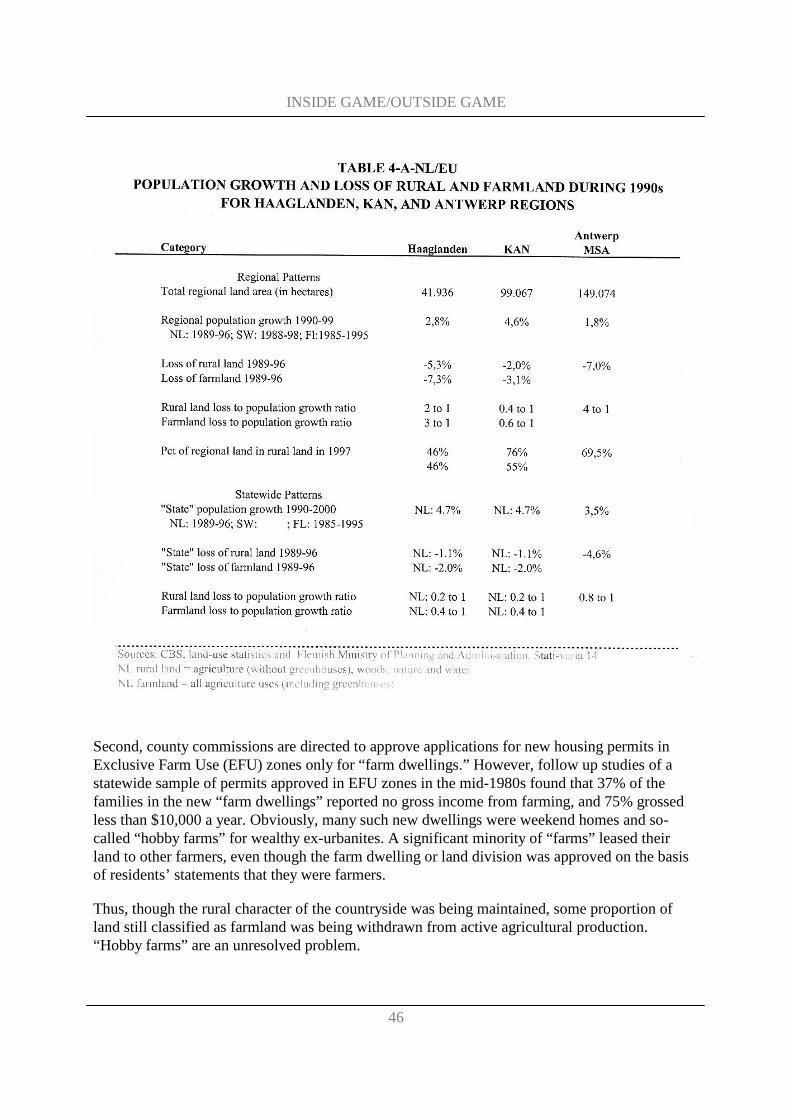
INSIDE GAME/OUTSIDE GAME
46
Second, county commissions are directed to approve applications for new housing permits in Exclusive Farm Use (EFU) zones only for “farm dwellings.” However, follow up studies of a statewide sample of permits approved in EFU zones in the mid-1980s found that 37% of the families in the new “farm dwellings” reported no gross income from farming, and 75% grossed less than $10,000 a year. Obviously, many such new dwellings were weekend homes and so-called “hobby farms” for wealthy ex-urbanites. A significant minority of “farms” leased their land to other farmers, even though the farm dwelling or land division was approved on the basis of residents’ statements that they were farmers.
Thus, though the rural character of the countryside was being maintained, some proportion of land still classified as farmland was being withdrawn from active agricultural production. “Hobby farms” are an unresolved problem.
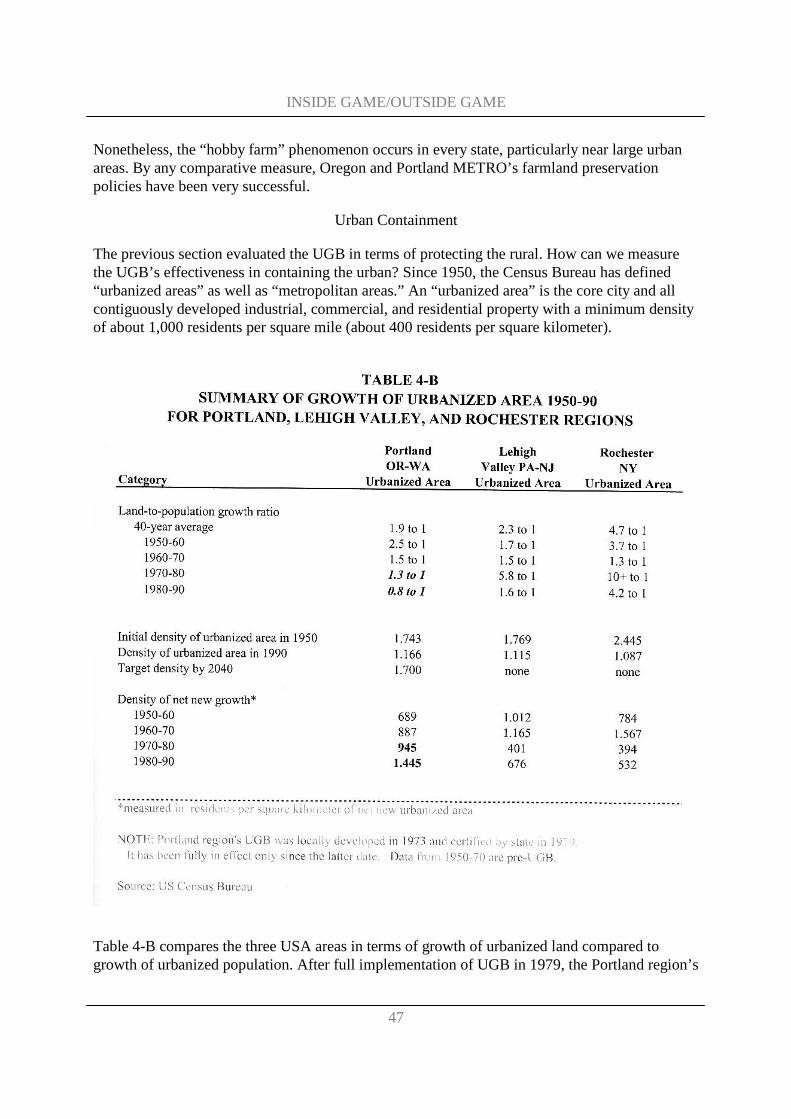
INSIDE GAME/OUTSIDE GAME
47
Nonetheless, the “hobby farm” phenomenon occurs in every state, particularly near large urban areas. By any comparative measure, Oregon and Portland METRO’s farmland preservation policies have been very successful.
Urban Containment
The previous section evaluated the UGB in terms of protecting the rural. How can we measure the UGB’s effectiveness in containing the urban? Since 1950, the Census Bureau has defined “urbanized areas” as well as “metropolitan areas.” An “urbanized area” is the core city and all contiguously developed industrial, commercial, and residential property with a minimum density of about 1,000 residents per square mile (about 400 residents per square kilometer).
Table 4-B compares the three USA areas in terms of growth of urbanized land compared to growth of urbanized population. After full implementation of UGB in 1979, the Portland region’s
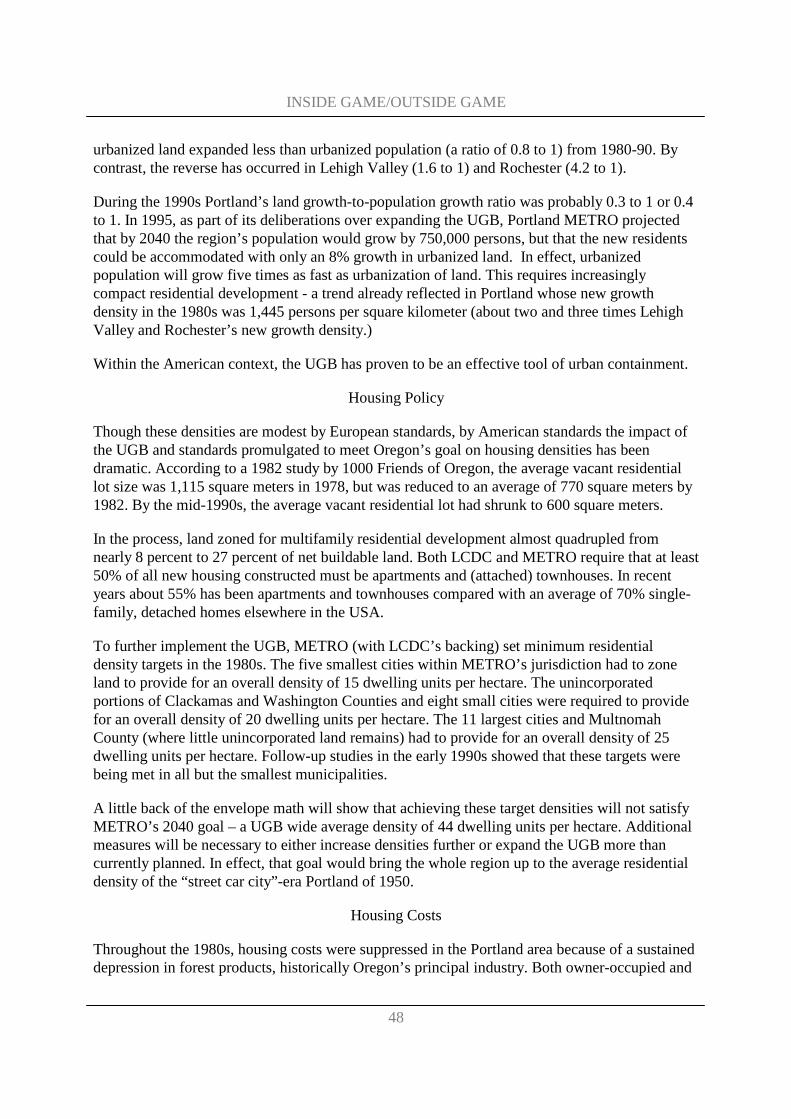
INSIDE GAME/OUTSIDE GAME
48
urbanized land expanded less than urbanized population (a ratio of 0.8 to 1) from 1980-90. By contrast, the reverse has occurred in Lehigh Valley (1.6 to 1) and Rochester (4.2 to 1).
During the 1990s Portland’s land growth-to-population growth ratio was probably 0.3 to 1 or 0.4 to 1. In 1995, as part of its deliberations over expanding the UGB, Portland METRO projected that by 2040 the region’s population would grow by 750,000 persons, but that the new residents could be accommodated with only an 8% growth in urbanized land. In effect, urbanized population will grow five times as fast as urbanization of land. This requires increasingly compact residential development - a trend already reflected in Portland whose new growth density in the 1980s was 1,445 persons per square kilometer (about two and three times Lehigh Valley and Rochester’s new growth density.)
Within the American context, the UGB has proven to be an effective tool of urban containment.
Housing Policy
Though these densities are modest by European standards, by American standards the impact of the UGB and standards promulgated to meet Oregon’s goal on housing densities has been dramatic. According to a 1982 study by 1000 Friends of Oregon, the average vacant residential lot size was 1,115 square meters in 1978, but was reduced to an average of 770 square meters by 1982. By the mid-1990s, the average vacant residential lot had shrunk to 600 square meters.
In the process, land zoned for multifamily residential development almost quadrupled from nearly 8 percent to 27 percent of net buildable land. Both LCDC and METRO require that at least 50% of all new housing constructed must be apartments and (attached) townhouses. In recent years about 55% has been apartments and townhouses compared with an average of 70% single-family, detached homes elsewhere in the USA.
To further implement the UGB, METRO (with LCDC’s backing) set minimum residential density targets in the 1980s. The five smallest cities within METRO’s jurisdiction had to zone land to provide for an overall density of 15 dwelling units per hectare. The unincorporated portions of Clackamas and Washington Counties and eight small cities were required to provide for an overall density of 20 dwelling units per hectare. The 11 largest cities and Multnomah County (where little unincorporated land remains) had to provide for an overall density of 25 dwelling units per hectare. Follow-up studies in the early 1990s showed that these targets were being met in all but the smallest municipalities.
A little back of the envelope math will show that achieving these target densities will not satisfy METRO’s 2040 goal – a UGB wide average density of 44 dwelling units per hectare. Additional measures will be necessary to either increase densities further or expand the UGB more than currently planned. In effect, that goal would bring the whole region up to the average residential density of the “street car city”-era Portland of 1950.
Housing Costs
Throughout the 1980s, housing costs were suppressed in the Portland area because of a sustained depression in forest products, historically Oregon’s principal industry. Both owner-occupied and
INSIDE GAME/OUTSIDE GAME
49
rental housing costs averaged about 85% of the national averages.
During the 1990's the Portland area experienced a very rapid increase in owner-occupied housing prices. Between 1990 and 1999, average home sale price increased from $79,500 to $160,000, or a 101% increase. (The national rate of general price inflation was 30%.) The National Association of Homebuilders and other national, anti-growth regulation critics blamed Portland’s UGB and launched a very anti-Portland UGB campaign.
However, other regions like Salt Lake City UT (109%), Denver CO (92%), Louisville KY (91%), and Detroit MI (85%) also experienced major increases in single family housing prices, but, unlike Portland, these regions had no effective growth management policies like Portland's UGB. What they shared with Portland was a period of tremendous economic growth (an "economic boom") in which new workers migrated to the area much faster than the housing supply could be expanded. Many new immigrants into Portland were high-tech professionals relocating from California. They brought substantial equity from sale of their homes in California’s high priced markets and the obligation to invest their total “capital gain” in their new homes or face heavy federal taxes. Thus, transplanted Californians helped bid up housing prices rapidly.
Though higher land cost (which did increase within the UGB) contributed somewhat to the price increase, economists at Lewis and Clark University found that the greater factor was clearly the supply-demand imbalance created by the economic boom. Though land cost was higher, less land was being consumed per housing unit. At most, the economists calculated, higher land costs might have added $10,000 to a $160,000 house.
With single-family home prices at 115% of the national average in 1999, the Portland area still had the least expensive owner-occupied housing on the Pacific Coast compared with Los Angeles (135%), Seattle (147%), San Diego (152%), Orange County (180%), and San Francisco (302%!!)
Finally, Portland remains at 85% of national average for rental housing. Thus, total housing costs are at about 110% of the national average.
Maintaining Healthy Core Communities
Table 4-C shifts to a national perspective, comparing the Greater Portland OR-WA CMSA (seven counties) to the 25 largest American metro areas (including Portland). Metropolitan Area Research Corporation (MARC) categorizes all suburbs into six different clusters (from Cluster 1 – At Risk, Segregated to Cluster 6 – Very High Tax Capacity, Low Poverty). As a central city, Portland is less poverty-impacted, experienced higher growth in households, and had a higher local tax capacity than the average of the other 25 central cities. More notably, only 1% of the Portland CMSA’s households live in Category 1 (At Risk, Segregated) suburbs and none live in Category 2 (At Risk, Older) suburbs. For the 25 largest metro areas, 3% and 6% of households live in Category 1 and Category 2 suburbs.
INSIDE GAME/OUTSIDE GAME
50
The Portland area so favorably evaluated in Table 4-C is the Portland-Salem-Vancouver OR-WA CMSA that covers seven counties in two states. The portion covered by the Portland UGB contains major parts of only three counties. Table 4-D shows that, by MARC’s cluster criteria, the Portland UGB region contains zero disadvantaged suburbs and only 5 potentially stressed suburbs. The 21 other are moderately advantaged to highly advantaged suburbs. All 25 suburbs grew in population and tax capacity per household during the 1990s. Overall, the Portland UGB area suburbs averaged a cluster ranking (3.96) far above the average ranking of suburbs in all 25 largest metro areas (2.58).
Overall Population Changes
In the Portland region in the 1990s, every municipality gained population – a result of strong regional growth, modest annexations, and the impact of the UGB’s re-directing new residential construction into the urban core.
By contrast, the Rochester area’s three cities lost residents (-6.7%) and its 39 villages (smaller, older urban centers) lost -1.0%. Meanwhile, the population in the remaining land in towns (i.e. outside village and city boundaries) grew 12.5% – basically matching the loss of farmland. In effect, with virtually no population growth the Rochester region was losing about seven acres of farmland for every net new resident.
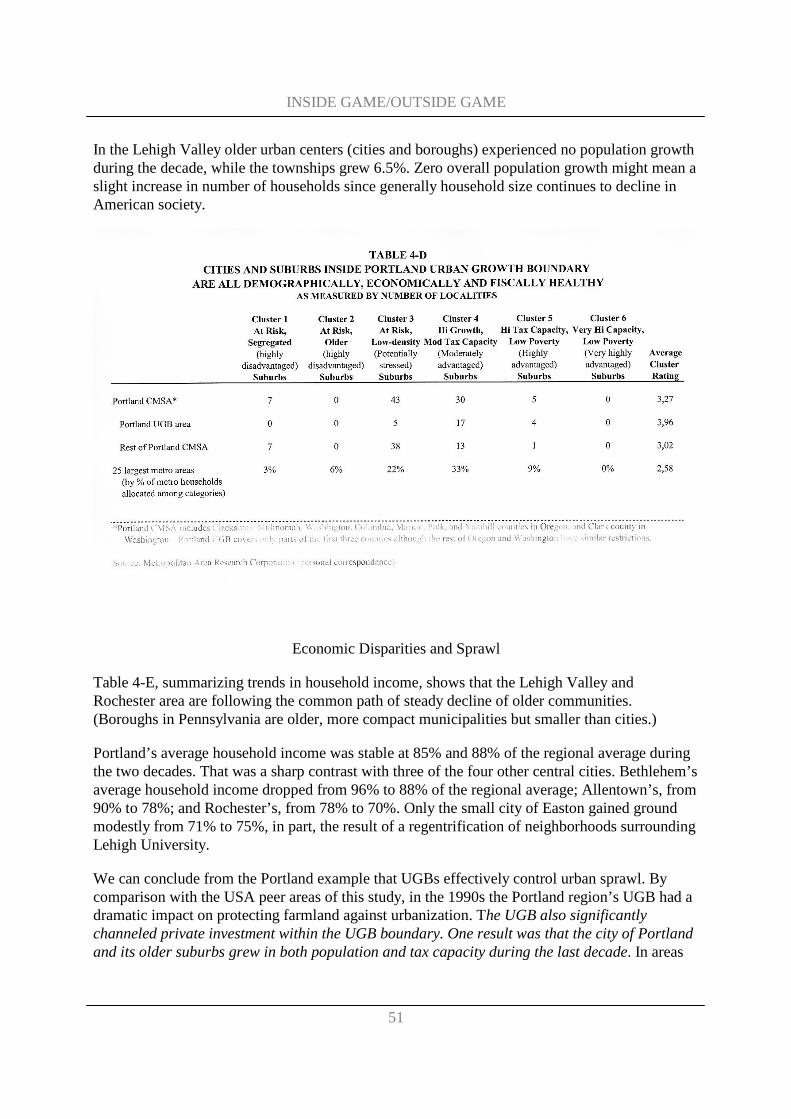
INSIDE GAME/OUTSIDE GAME
51
In the Lehigh Valley older urban centers (cities and boroughs) experienced no population growth during the decade, while the townships grew 6.5%. Zero overall population growth might mean a slight increase in number of households since generally household size continues to decline in American society.
Economic Disparities and Sprawl
Table 4-E, summarizing trends in household income, shows that the Lehigh Valley and Rochester area are following the common path of steady decline of older communities. (Boroughs in Pennsylvania are older, more compact municipalities but smaller than cities.)
Portland’s average household income was stable at 85% and 88% of the regional average during the two decades. That was a sharp contrast with three of the four other central cities. Bethlehem’s average household income dropped from 96% to 88% of the regional average; Allentown’s, from 90% to 78%; and Rochester’s, from 78% to 70%. Only the small city of Easton gained ground modestly from 71% to 75%, in part, the result of a regentrification of neighborhoods surrounding Lehigh University.
We can conclude from the Portland example that UGBs effectively control urban sprawl. By comparison with the USA peer areas of this study, in the 1990s the Portland region’s UGB had a dramatic impact on protecting farmland against urbanization. The UGB also significantly channeled private investment within the UGB boundary. One result was that the city of Portland and its older suburbs grew in both population and tax capacity during the last decade. In areas
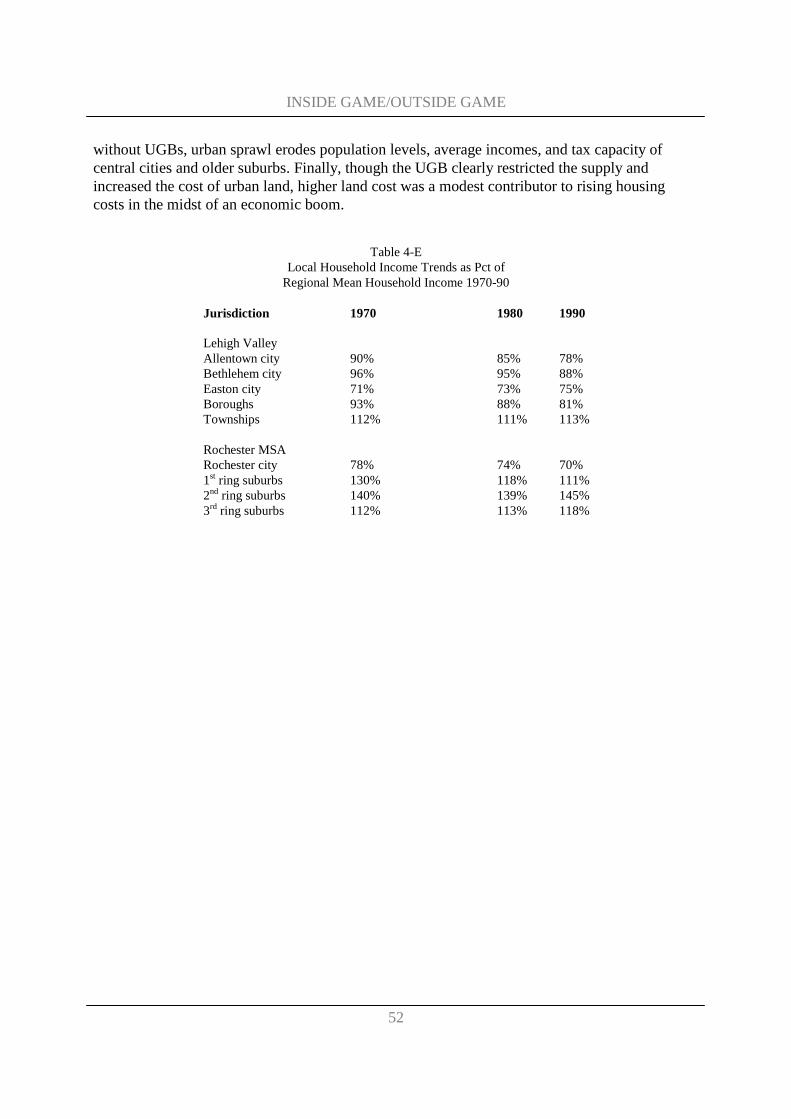
INSIDE GAME/OUTSIDE GAME
52
without UGBs, urban sprawl erodes population levels, average incomes, and tax capacity of central cities and older suburbs. Finally, though the UGB clearly restricted the supply and increased the cost of urban land, higher land cost was a modest contributor to rising housing costs in the midst of an economic boom.
Table 4-E
Local Household Income Trends as Pct of Regional Mean Household Income 1970-90
Jurisdiction 1970 1980 1990 Lehigh Valley Allentown city 90% 85% 78% Bethlehem city 96% 95% 88% Easton city 71% 73% 75% Boroughs 93% 88% 81% Townships 112% 111% 113% Rochester MSA Rochester city 78% 74% 70% 1st ring suburbs 130% 118% 111% 2nd ring suburbs 140% 139% 145% 3rd ring suburbs 112% 113% 118%

INSIDE GAME/OUTSIDE GAME
53
INSIDE GAME/OUTSIDE GAME
54
Part 5: Ethnic and economic segregation
Residential Segregation
The common view that Europe doesn’t have American-type ethnic ghettos is correct but misleading. No Dutch region, for example, has the high proportion of minorities (20-40%) characteristic of many of the USA’s largest and best-known regions. When Dutch regions are compared to American regions of equivalent population size and ethnic composition, the levels of ethnic segregation are essentially the same.
Table 5-A summarizes measures of relative ethnic segregation for our target regions. Two common measures are used: the dissimilarity index (D-Index) measures how evenly or unevenly a minority population is distributed among the majority population (i.e. ethnic Dutch, white Americans, etc.). In effect, it measures how relatively “set apart” the minority group lives from the mainstream society. The D-Index is a measure that is unaffected by the relative size of the minority population. The higher the D-Index score (on a scale of 0 to 100), the higher the level of segregation.
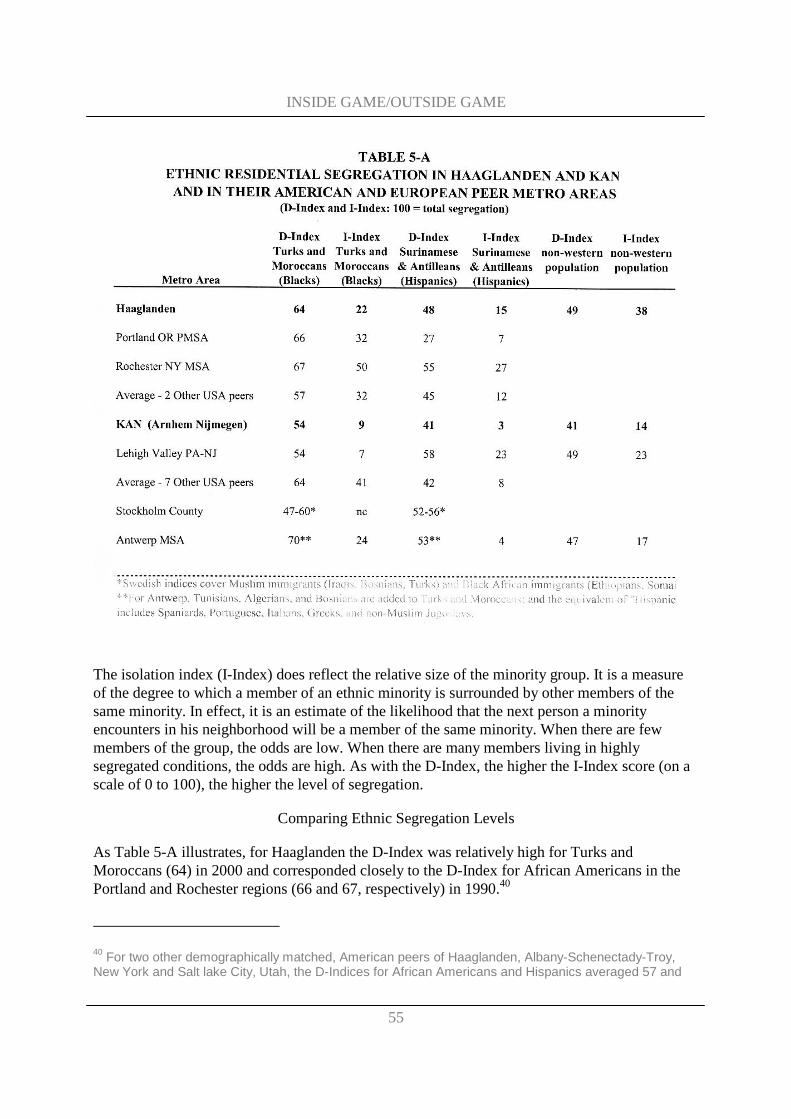
INSIDE GAME/OUTSIDE GAME
55
The isolation index (I-Index) does reflect the relative size of the minority group. It is a measure of the degree to which a member of an ethnic minority is surrounded by other members of the same minority. In effect, it is an estimate of the likelihood that the next person a minority encounters in his neighborhood will be a member of the same minority. When there are few members of the group, the odds are low. When there are many members living in highly segregated conditions, the odds are high. As with the D-Index, the higher the I-Index score (on a scale of 0 to 100), the higher the level of segregation.
Comparing Ethnic Segregation Levels
As Table 5-A illustrates, for Haaglanden the D-Index was relatively high for Turks and Moroccans (64) in 2000 and corresponded closely to the D-Index for African Americans in the Portland and Rochester regions (66 and 67, respectively) in 1990.40
40 For two other demographically matched, American peers of Haaglanden, Albany-Schenectady-Troy, New York and Salt lake City, Utah, the D-Indices for African Americans and Hispanics averaged 57 and

INSIDE GAME/OUTSIDE GAME
56
Similarly, for KAN the D-Index for Turks and Moroccans was significantly lower (54) than Haaglanden’s in 2000, but matched the D-Index for African Americans in the Lehigh Valley (54) in 1990.41
For Surinamese and Antilleans, the D-Indices were lower in both Haaglanden (48) and KAN (41) than for Turks and Moroccans. This is consistent with the pattern in the USA where Hispanics are generally less segregated than blacks, except for Puerto Ricans in some parts of the northeastern USA, as was, indeed, the case in the Lehigh Valley (58).
The isolation index for Haaglanden tells a somewhat different story. For Turks and Moroccans, Haaglanden’s I-Index (22) was significantly lower than its American peers (32 to 50). However, its I-Index for Surinamese and Antilleans was bracketed by Portland’s lower Hispanic I-Index (7) and Rochester’s higher Hispanic I-Index (27).
KAN’s I-Index for Turks and Moroccans (9) was matched by the Lehigh Valley’s for African Americans (7), but its index for Surinamese and Antilleans (3) was far below the Lehigh Valley’s I-Index for, in reality, Puerto Ricans (23).
45, respectively. Isolation indices were 32 for African Americans and 12 for Hispanics.
41 For a group of seven other American peers of KAN, the average D-Index for Africans Americans was 64 (significantly higher than KAN’s), but for Hispanics the average D-Index was 42 (the same as KAN’s). The average isolation indices for the group of seven were 42 for African Americans (much higher than KAN’s level for Turks and Moroccans) and 8 for Hispanics (approximating KAN’s level of 3 for Surinamese and Antilleans). The group of seven consisted of Albany-Schenectady-Troy and Syracuse, New York; Knoxville, Tennessee; Omaha, Nebraska; Grand Rapids, Michigan; Tulsa, Oklahoma; and Tacoma, Washington – geographically varied but demographically matched with KAN in population size and ethnic mix.
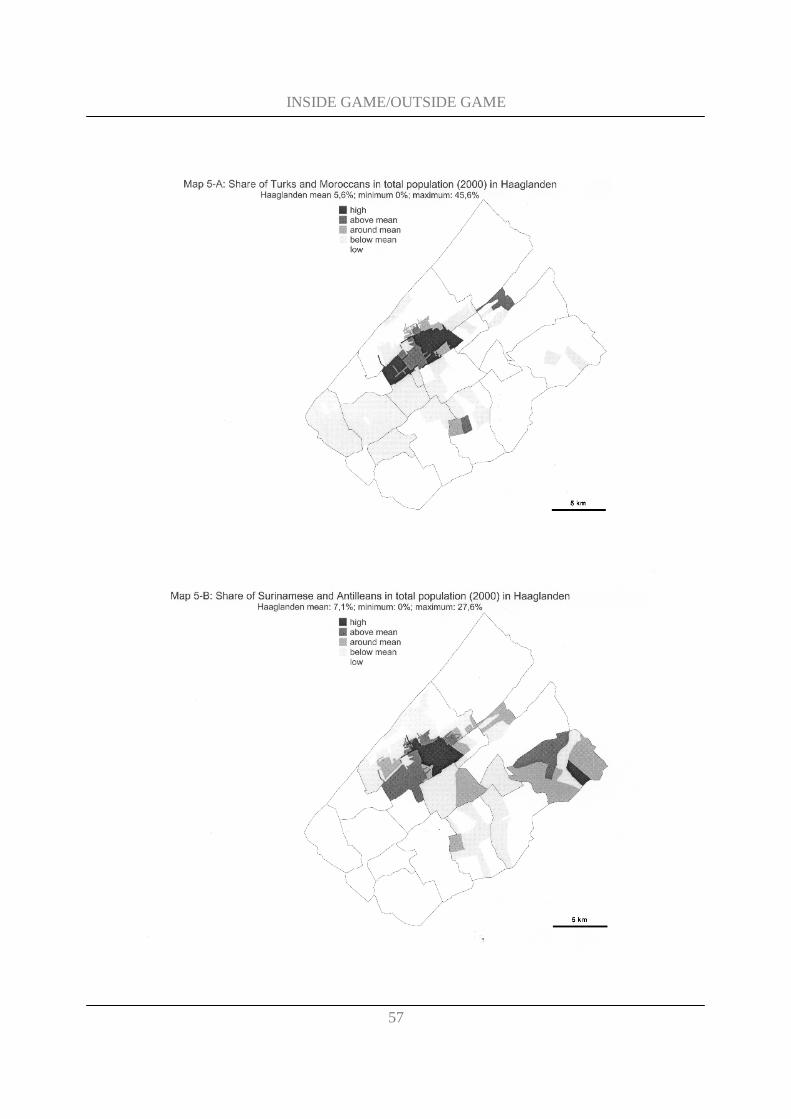
INSIDE GAME/OUTSIDE GAME
57
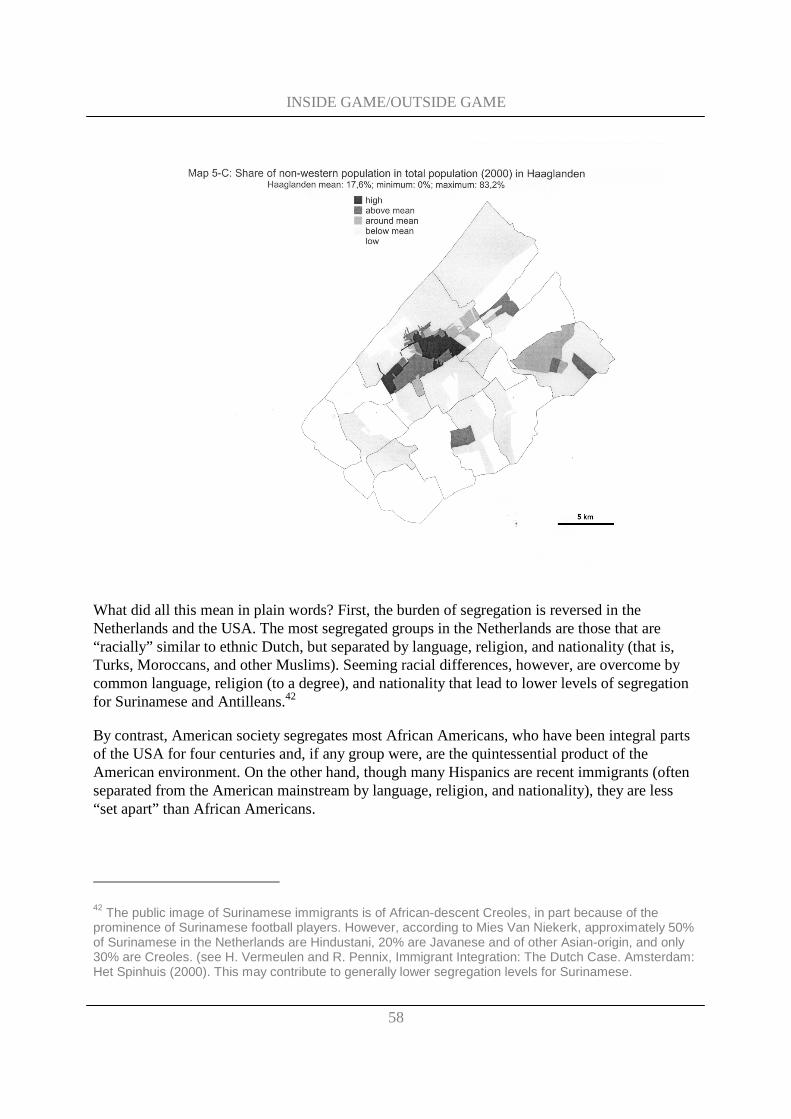
INSIDE GAME/OUTSIDE GAME
58
What did all this mean in plain words? First, the burden of segregation is reversed in the Netherlands and the USA. The most segregated groups in the Netherlands are those that are “racially” similar to ethnic Dutch, but separated by language, religion, and nationality (that is, Turks, Moroccans, and other Muslims). Seeming racial differences, however, are overcome by common language, religion (to a degree), and nationality that lead to lower levels of segregation for Surinamese and Antilleans.42
By contrast, American society segregates most African Americans, who have been integral parts of the USA for four centuries and, if any group were, are the quintessential product of the American environment. On the other hand, though many Hispanics are recent immigrants (often separated from the American mainstream by language, religion, and nationality), they are less “set apart” than African Americans.
42 The public image of Surinamese immigrants is of African-descent Creoles, in part because of the prominence of Surinamese football players. However, according to Mies Van Niekerk, approximately 50% of Surinamese in the Netherlands are Hindustani, 20% are Javanese and of other Asian-origin, and only 30% are Creoles. (see H. Vermeulen and R. Pennix, Immigrant Integration: The Dutch Case. Amsterdam: Het Spinhuis (2000). This may contribute to generally lower segregation levels for Surinamese.
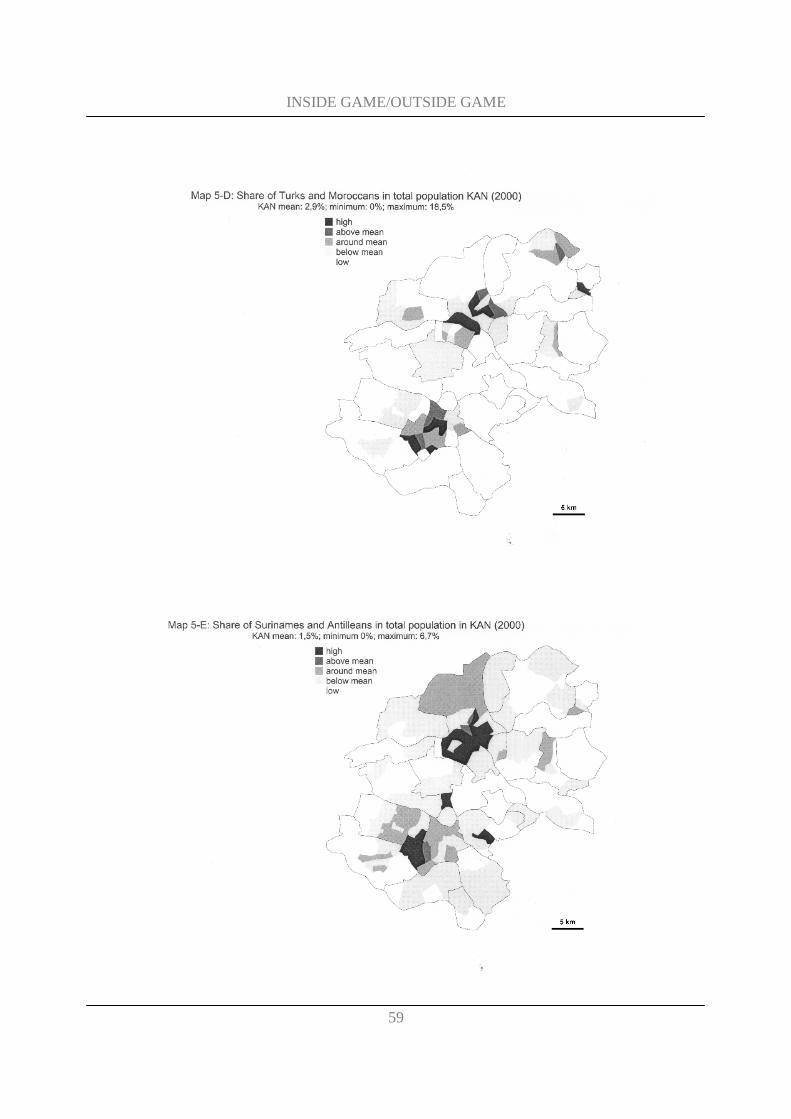
INSIDE GAME/OUTSIDE GAME
59
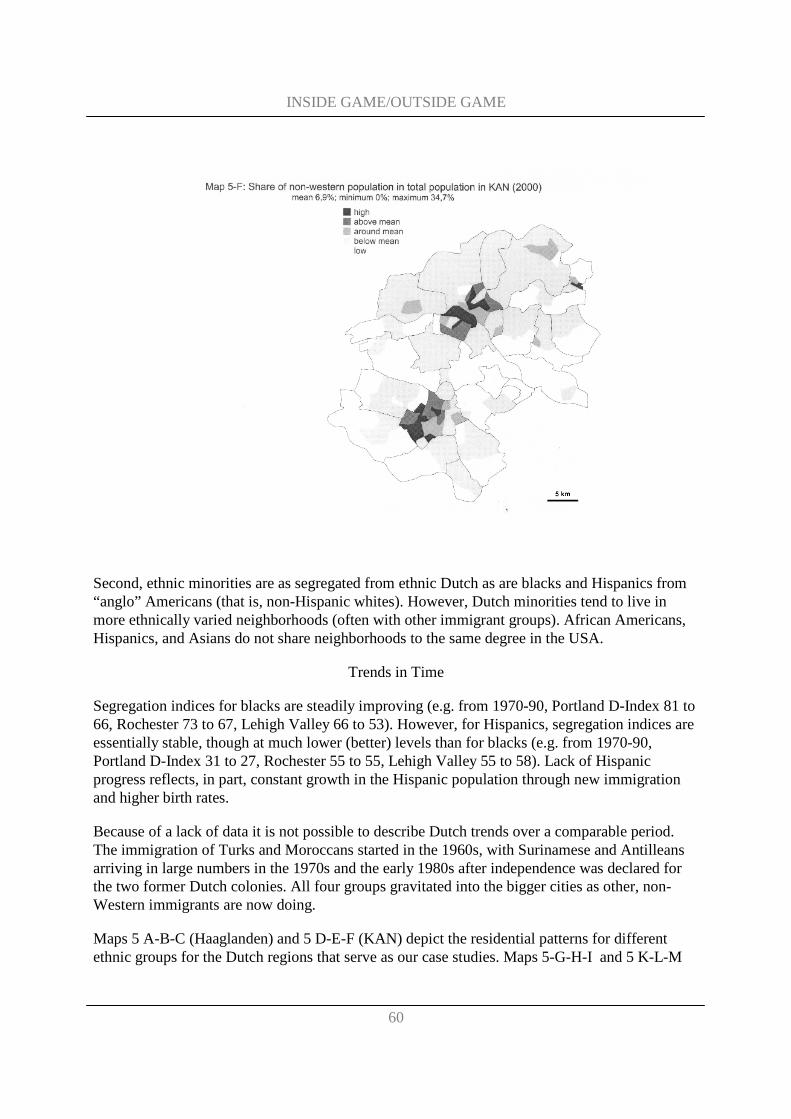
INSIDE GAME/OUTSIDE GAME
60
Second, ethnic minorities are as segregated from ethnic Dutch as are blacks and Hispanics from “anglo” Americans (that is, non-Hispanic whites). However, Dutch minorities tend to live in more ethnically varied neighborhoods (often with other immigrant groups). African Americans, Hispanics, and Asians do not share neighborhoods to the same degree in the USA.
Trends in Time
Segregation indices for blacks are steadily improving (e.g. from 1970-90, Portland D-Index 81 to 66, Rochester 73 to 67, Lehigh Valley 66 to 53). However, for Hispanics, segregation indices are essentially stable, though at much lower (better) levels than for blacks (e.g. from 1970-90, Portland D-Index 31 to 27, Rochester 55 to 55, Lehigh Valley 55 to 58). Lack of Hispanic progress reflects, in part, constant growth in the Hispanic population through new immigration and higher birth rates.
Because of a lack of data it is not possible to describe Dutch trends over a comparable period. The immigration of Turks and Moroccans started in the 1960s, with Surinamese and Antilleans arriving in large numbers in the 1970s and the early 1980s after independence was declared for the two former Dutch colonies. All four groups gravitated into the bigger cities as other, non-Western immigrants are now doing.
Maps 5 A-B-C (Haaglanden) and 5 D-E-F (KAN) depict the residential patterns for different ethnic groups for the Dutch regions that serve as our case studies. Maps 5-G-H-I and 5 K-L-M
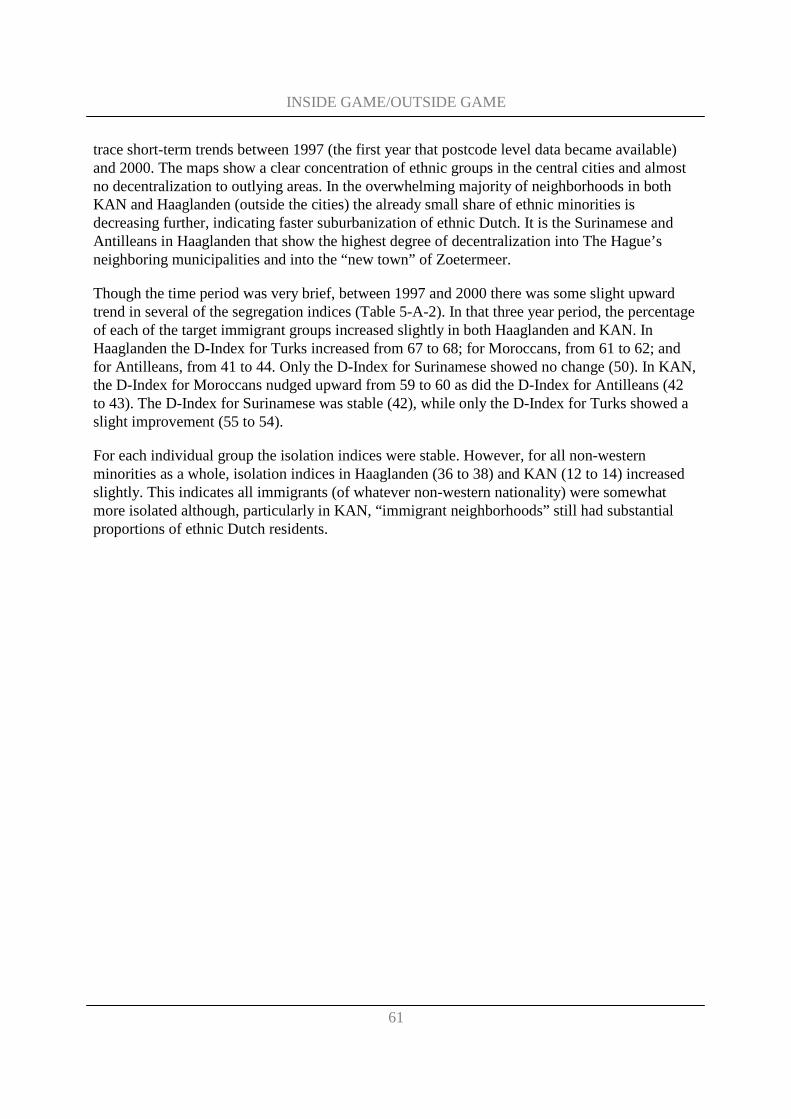
INSIDE GAME/OUTSIDE GAME
61
trace short-term trends between 1997 (the first year that postcode level data became available) and 2000. The maps show a clear concentration of ethnic groups in the central cities and almost no decentralization to outlying areas. In the overwhelming majority of neighborhoods in both KAN and Haaglanden (outside the cities) the already small share of ethnic minorities is decreasing further, indicating faster suburbanization of ethnic Dutch. It is the Surinamese and Antilleans in Haaglanden that show the highest degree of decentralization into The Hague’s neighboring municipalities and into the “new town” of Zoetermeer.
Though the time period was very brief, between 1997 and 2000 there was some slight upward trend in several of the segregation indices (Table 5-A-2). In that three year period, the percentage of each of the target immigrant groups increased slightly in both Haaglanden and KAN. In Haaglanden the D-Index for Turks increased from 67 to 68; for Moroccans, from 61 to 62; and for Antilleans, from 41 to 44. Only the D-Index for Surinamese showed no change (50). In KAN, the D-Index for Moroccans nudged upward from 59 to 60 as did the D-Index for Antilleans (42 to 43). The D-Index for Surinamese was stable (42), while only the D-Index for Turks showed a slight improvement (55 to 54).
For each individual group the isolation indices were stable. However, for all non-western minorities as a whole, isolation indices in Haaglanden (36 to 38) and KAN (12 to 14) increased slightly. This indicates all immigrants (of whatever non-western nationality) were somewhat more isolated although, particularly in KAN, “immigrant neighborhoods” still had substantial proportions of ethnic Dutch residents.
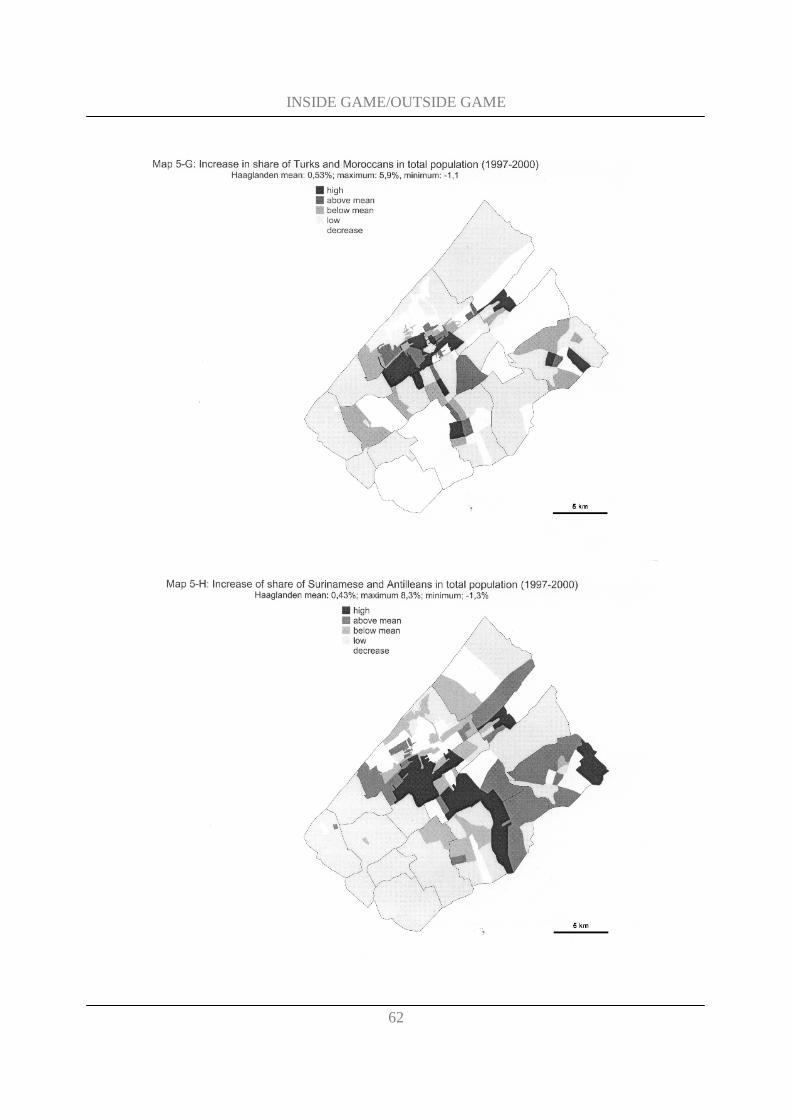
INSIDE GAME/OUTSIDE GAME
62
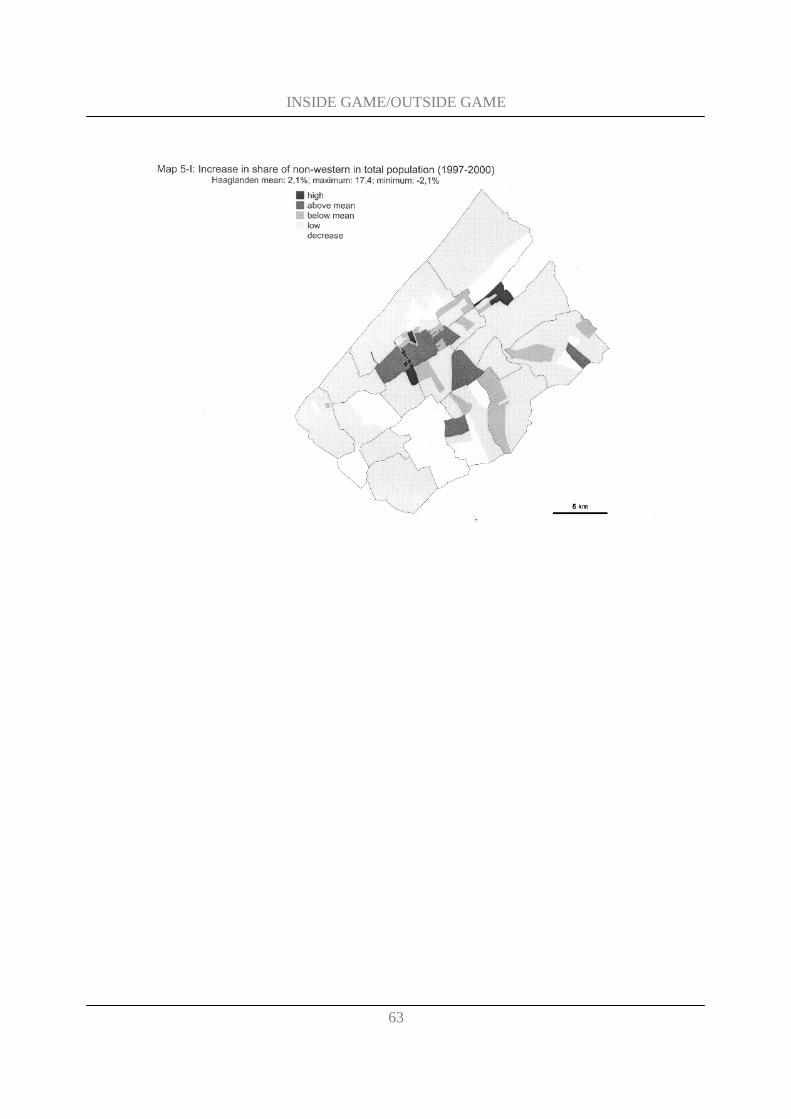
INSIDE GAME/OUTSIDE GAME
63
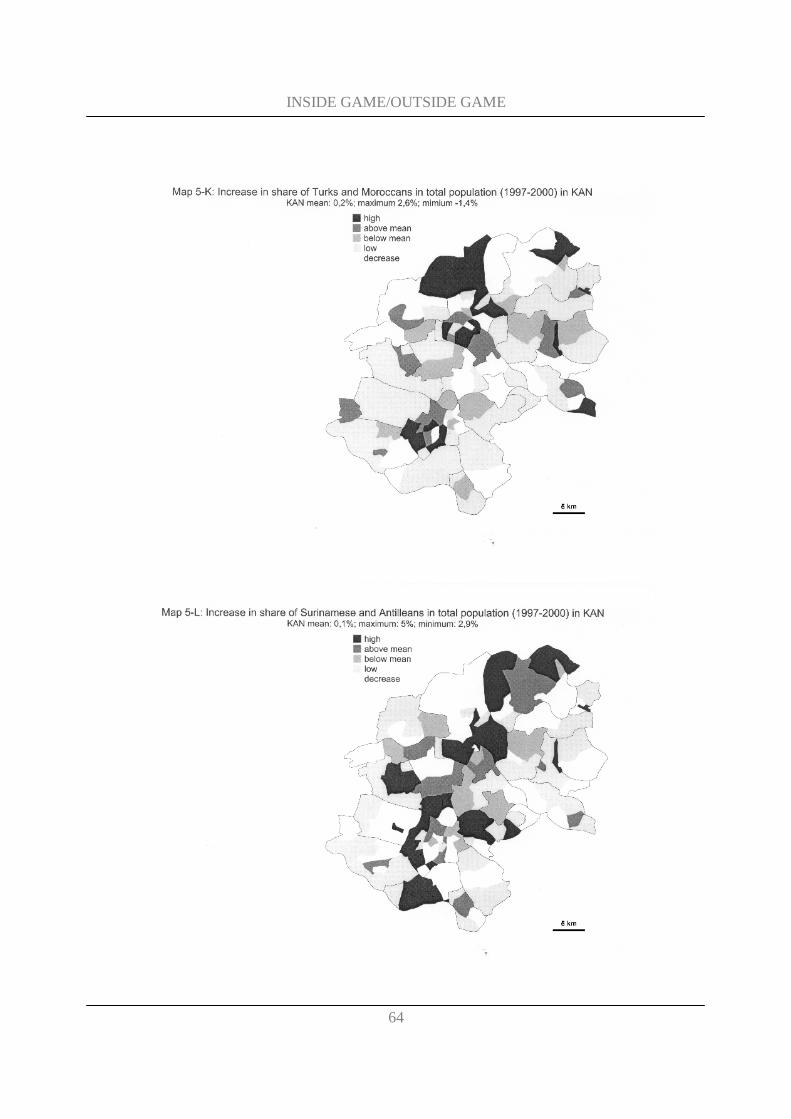
INSIDE GAME/OUTSIDE GAME
64
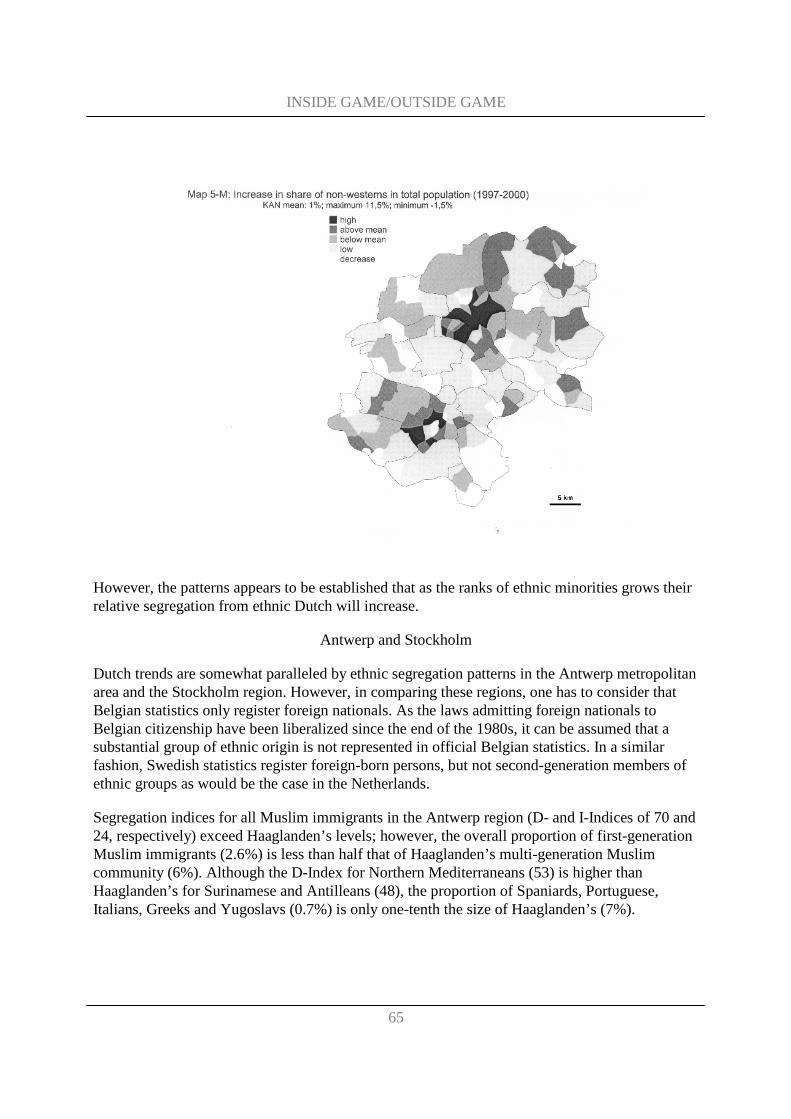
INSIDE GAME/OUTSIDE GAME
65
However, the patterns appears to be established that as the ranks of ethnic minorities grows their relative segregation from ethnic Dutch will increase.
Antwerp and Stockholm
Dutch trends are somewhat paralleled by ethnic segregation patterns in the Antwerp metropolitan area and the Stockholm region. However, in comparing these regions, one has to consider that Belgian statistics only register foreign nationals. As the laws admitting foreign nationals to Belgian citizenship have been liberalized since the end of the 1980s, it can be assumed that a substantial group of ethnic origin is not represented in official Belgian statistics. In a similar fashion, Swedish statistics register foreign-born persons, but not second-generation members of ethnic groups as would be the case in the Netherlands.
Segregation indices for all Muslim immigrants in the Antwerp region (D- and I-Indices of 70 and 24, respectively) exceed Haaglanden’s levels; however, the overall proportion of first-generation Muslim immigrants (2.6%) is less than half that of Haaglanden’s multi-generation Muslim community (6%). Although the D-Index for Northern Mediterraneans (53) is higher than Haaglanden’s for Surinamese and Antilleans (48), the proportion of Spaniards, Portuguese, Italians, Greeks and Yugoslavs (0.7%) is only one-tenth the size of Haaglanden’s (7%).
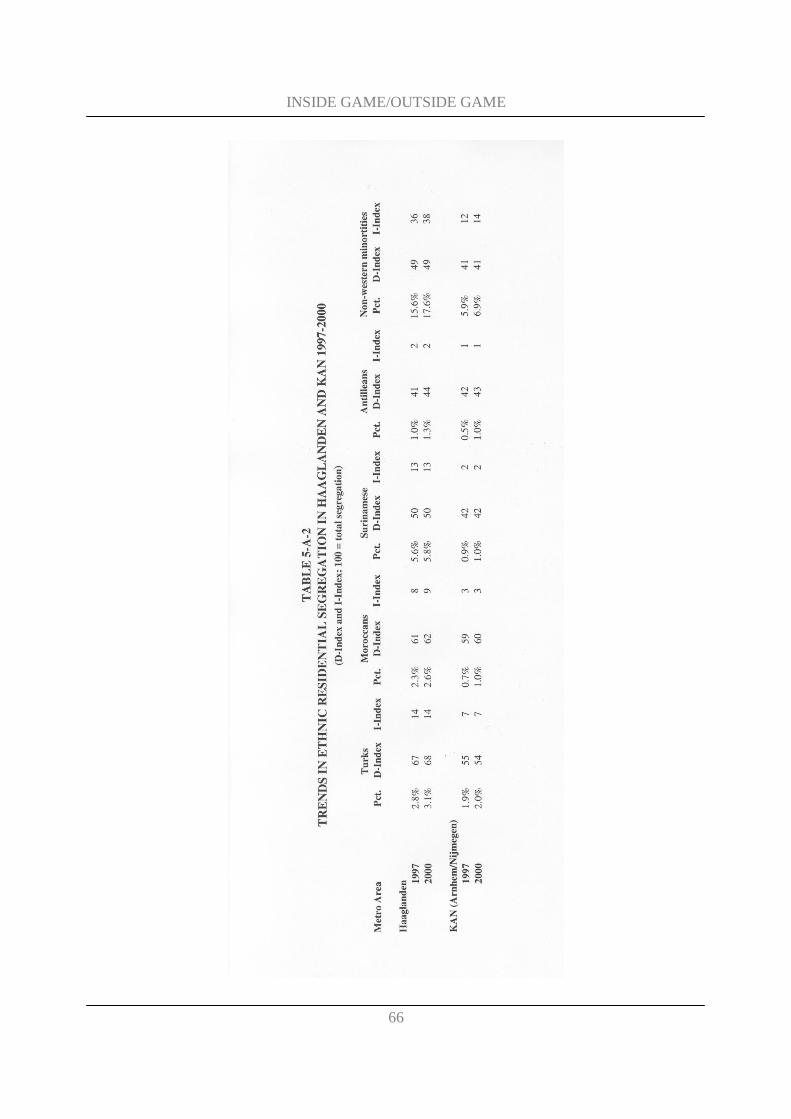
INSIDE GAME/OUTSIDE GAME
66
INSIDE GAME/OUTSIDE GAME
67
The Antwerp indices, at least, are based on reasonable “apples-to-apples” methodology. Stockholm’s data is more problematic. The “region” properly omits the northern half of Stockholm County that is very rural, but several areas are omitted in adjacent counties to the west of Stockholm that are very much a part of Greater Stockholm. The calculations are based on “parishes” that vary greatly but average about three times the population size of American census tracts and Dutch postcodes. Of most critical importance, however, the ethnic data covers only immigrants born outside Sweden. Their children born in Sweden no longer show up in the data. These factors tend to understate the level of ethnic segregation in Greater Stockholm (although including second and third generation immigrants might lower the indices since, with time, there is some inter-generational dispersion.
Nevertheless, the now-familiar patterns recur. Muslim immigrants (Iraqis, Bosnians, Turks, etc.) were 2.7% of the population in 1995. They had levels of dissimilarity ranging from 47 to 60. The smaller Black African population (Somalis, Ethiopians) constituted 0.9% of the population; their D-indices were 56 and 52, respectively.43 Other immigrant groups (primarily Finns, Iranians, Chileans, Poles, Germans, Yugoslavs, and Greeks) constituted the bulk of foreign-born residents. Overall, 17% of the Swedish population was foreign born in 1995. Many of the Third World immigrants arrived as political refugees. The general pattern has been that, over time, they have been integrated steadily into Swedish society. Segregation indices rise with new waves of immigrants.
Economic Segregation
By contrast with the ethnic picture, Dutch regions are substantially less economically segregated than USA regions (Table 5-B). As measured by D-Indices, economic segregation in Haaglanden was 24 compared with Rochester (42) and the average of two other USA peers (33). Only the Portland region (27) had roughly the same low level of economic segregation as Haaglanden.
KAN (21) had a somewhat greater advantage over its peers in terms of the measure of dissimilarity (35 for Lehigh Valley, 34 for the average of seven other American peer regions).
In the context of isolation indices, however, the gap between the Dutch regions and their peers either disappeared (e.g. Haaglanden-Portland, Kan-Lehigh Valley) or narrowed.
Unlike the measures of ethnic segregation, there are more questions about comparability of data. For the Dutch regions, we are measuring the residential distribution of the bottom 10% of household income. For the USA regions, we are measuring households officially defined as below the poverty level (roughly the bottom 15% of households).
The Dutch Social and Cultural Planning Bureau recently concluded that the number of poor households diminished between 1994 and 1998 (as occurred in the USA) but that the remaining
43 Information on segregation patterns in Greater Stockholm comes from Robert A. Murdie and Larks-Erik Borgegard, “Immigration, Spatial Segregation and Housing Segmentation of Immigrants in Metropolitan Stockholm, 1960-95,” in Urban Studies, Vol. 35, No. 10, 1869-1888, 1998.
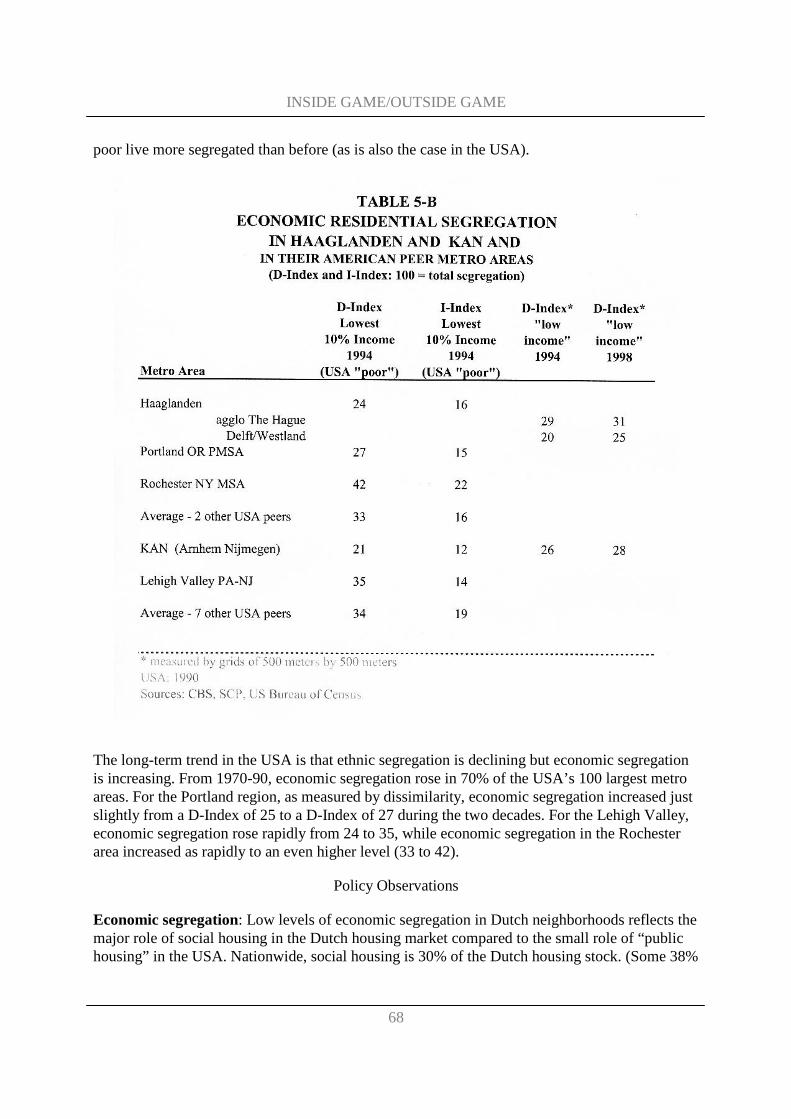
INSIDE GAME/OUTSIDE GAME
68
poor live more segregated than before (as is also the case in the USA).
The long-term trend in the USA is that ethnic segregation is declining but economic segregation is increasing. From 1970-90, economic segregation rose in 70% of the USA’s 100 largest metro areas. For the Portland region, as measured by dissimilarity, economic segregation increased just slightly from a D-Index of 25 to a D-Index of 27 during the two decades. For the Lehigh Valley, economic segregation rose rapidly from 24 to 35, while economic segregation in the Rochester area increased as rapidly to an even higher level (33 to 42).
Policy Observations
Economic segregation: Low levels of economic segregation in Dutch neighborhoods reflects the major role of social housing in the Dutch housing market compared to the small role of “public housing” in the USA. Nationwide, social housing is 30% of the Dutch housing stock. (Some 38%
INSIDE GAME/OUTSIDE GAME
69
of the housing supply in the city of The Hague is social housing as is 46% in Arnhem and 49% in Nijmegen.) By contrast, only 1½% of the USA housing stock is public housing and another 2½% are rent-subsidized private apartments.
Dutch social housing is occupied by a more economically diverse population than is American public housing. Indeed, one of the major policy concerns of the Dutch government is the degree to which households well over the income guidelines occupy large proportions of social housing. This is financially considered to be wrong as it offers public support for households that do not need it; socially, it is considered to be good, because it keeps middle income households in neighborhoods that would otherwise deteroriate into poor neighborhoods and thus strengthens economic integration. In doing this, the Dutch certainly avoid one American-style remedy: limiting eligibility for social housing to such a degree that creation of low-income ghettos is the result.
American public housing policies: In the late 1930s, the federal government launched the public housing program. Public housing was intended to be a temporary abode for out-of-work families during the Great Depression. World War II not only ended the depression, but also created a tremendous need for public housing for defense workers near wartime factories. With the postwar economic boom and suburban expansion, many working families moved out of public housing projects, increasing the concentration of the poorest households.
In 1967, however, the US Congress completed the task. Intending to place a ceiling on the proportion of their income that public housing families paid in rent, the Congress fixed rents at 25% of income. That had the effect of raising many working families’ rents to levels where they could secure better private rental housing in better neighborhoods – or buy a new suburban home.
Public housing projects became warehouses for the poorest of the poor. By the 1990s, 95% of the residents of public housing projects were single mothers and their children. Public housing projects concentrated poverty to a greater degree than private rental housing ever achieved. At the heart of the highest poverty ghettos there was almost always a federal public housing complex.44
During the 1990s, the federal government reversed direction. With billions of dollars of new federal grants through programs like HOPE VI and Moving To Work, public housing authorities (PHAs) began demolishing high-density projects (in particular, high-rise buildings) and re-building them as town house and low-rise apartment communities. Re-diversifying income mix was more important than lowering density. A typical HOPE VI project is now 20-25% poor families, 10-15% poor elderly persons, and 60-70% “market-rate” renters and homeowners.
44 Though public housing is financed entirely by the federal government, a network of 3,300 quasi-independent, public housing authorities (PHAs) actually receive the federal subsidies and build and manage the projects. Legally, PHAs are established by municipal or county governments; practically, they are quasi-federal agencies. Thus, though their clientele is much narrower economically, American PHAs are somewhat analogous to Dutch housing associations.
INSIDE GAME/OUTSIDE GAME
70
Over the last two decades the federal government has also shifted its emphasis from subsiding buildings (i.e. public housing projects) to subsidizing poor families’ rents in private rental housing (i.e. Section 8 vouchers). Section 8 now subsidizes rents for almost 2 million poor households (over twice the number that lives in public housing projects).
Spatial/racial impact of USA public housing subsidies: That policy has had its impact on the spatial distribution of poverty. Older, city-based PHAs built almost all the projects; younger, suburban PHAs almost never built projects (except for the elderly). Suburban PHAs receive their federal housing allocations almost entirely in the form of Section 8 rent subsidies. Proportionally fewer Section 8 funds are received by city PHAs.
As a result, suburban poor (who are overwhelmingly white) are scattered widely in rent-subsidized, private, suburban apartments. By contrast, the city poor (who are heavily minority) are concentrated in large projects or in older, low-rent neighborhoods that have become “Section 8 ghettos.”
As a result, for example, in 1990, 72% of poor whites in the Rochester area, 80% of poor whites in the Portland area, and 88% of poor whites in the Lehigh Valley lived in middle class communities or in low-poverty rural areas.
For poor blacks and Hispanics, the situation was reversed. In the Lehigh Valley, 51% of poor blacks and 68% of poor Hispanics (largely Puerto Rican) lived in poor neighborhoods. In the Portland region, 56% of poor blacks but only 15% of poor Hispanics (mostly Mexicans) lived in poor neighborhoods.
Racially based economic segregation reached its high point in metro Rochester, where 80% of poor blacks and 70% of poor Hispanics lived in poverty-impacted neighborhoods where poverty rates exceeded 20%. (One-quarter of poor blacks and one-third of poor Hispanics lived in very high-poverty neighborhoods where poverty rates exceeded 40%; only 3% of poor whites lived in such “killer neighborhoods.”)
Dutch and European parallels and implications: The Dutch and other European housing markets are substantially different from the American market. Nevertheless, there are certain parallels. After World War II, Europe’s housing crisis was met by wholesale construction of apartment blocs in the cities (typically, away from the downtown areas) and in some inner suburbs. This was followed by populist policies to “build for the neighborhood” – that is, urban revitalization should emphasize building new housing for existing low- and moderate-income residents. As a result, virtually all higher-end, owner-occupied, new housing was built in newer suburban areas.
In Haaglanden, KAN, and the Stockholm region the neighborhoods that architecturally are filled with large apartment complexes for low-and moderate-income families often have developed substantial concentrations of ethnic minorities. These are the “postwar neighborhoods” in the Netherlands and the “Million Programme” neighborhoods in Greater Stockholm (most are located outside the city itself). As ethnic Dutch and ethnic Swedes became more prosperous, these postwar housing complexes became less competitive. The Dutch and Swedish middle
INSIDE GAME/OUTSIDE GAME
71
classes moved away. Immigrant households (who had generally lower-incomes than previous residents) filled up the vacated housing.45
Physically, the housing supply and infrastructure of the poorest neighborhoods of The Hague and Arnhem that the author visited are visually better than in many poor areas of Portland, Rochester, and Lehigh Valley.46 This again is the product of a more economically diverse population in Dutch social housing (compared to USA public housing) and more extensive ownership and management of the housing supply by Dutch housing associations as contrasted with multiple, private landlords in the USA.
However, the parallels still persist. Poor ethnic minorities are concentrated in European cities and some older, blue-collar suburbs – often in large, subsidized housing projects. Suburbs are where middle class, mainstream families (Dutch and Swedish) increasingly are raising their children.
Moreover, it is possible that the VINEX developments (large, planned communities located outside of, but typically near, major cities) will exacerbate these patterns. On the one hand, the plans call for VINEX developments to build 30% social housing. The reality (at least in Haaglanden) is more complex.
A recent report to the Parliament about the progress of the VINEX program divides housing production targets between “built-up areas” and “outlying areas.” In Haaglanden the ten-year social housing target (1995-2005) for VINEX in the “built-up” areas (i.e. The Hague) was already exceeded by the fourth year. Production of social housing in VINEX developments in “outlying areas” is lagging far behind. As The Hague is recently building more middle- and high-income housing (see below), it is pushing for more cheap social housing in other municipalities to which current low-income residents of The Hague would have access through the regional distribution system. The current inter-municipal agreements on numbers of housing units to be allocated to low-income renters are scheduled to expire this summer.
But, on the other hand, unless the new VINEX communities aggressively seek to attract immigrant households, they are likely to become magnets for many low- and moderate-income ethnic Dutch families to move out of ethnically mixed city neighborhoods. Ethnic (and possibly economic) segregation could increase in both “sending” and “receiving” communities.
As part of its Big City Policy, the Dutch government and major cities are emphasizing “re-differentiation” of the urban housing stock. Urban renewal will stress renovating or building upper-end housing that will be attractive to middle class families, including creating more owner-
45 This was certainly not the initial desire of the Swedish government. With most immigrants arriving as political refugees, the national government instituted an “All over Sweden” immigration policy. Municipalities throughout the country were assigned quotas of new immigrants to receive. Many new arrivals, however, subsequently relocated into Stockholm and other major cities, seeking better economic opportunities and companionship of fellow immigrants.
46 Though not a “postwar neighborhood,” as an example, the Schilderswijk neighborhood in The Hague has been the target for the largest urban renewal program in the European Union.
INSIDE GAME/OUTSIDE GAME
72
occupied homes in the city.
In one sense, re-attracting middle-class households was one of the goals of urban renewal when it began four decades ago in the USA. (Commercial and cultural revival were the predominant goals, as arguably was “Negro removal.”) Such policies failed almost totally in re-attracting middle class families to urban core neighborhoods in the USA. The reef upon which such good intentions sank was the abysmal quality of most urban public schools in American cities. (This will be the topic of the next section.)
The extensive Dutch social welfare system places a higher floor under low-income households than occurs in the USA. Thus, being ethnically segregated in the Netherlands does not typically entail being as economically segregated as in the USA. This reality must temper any comparisons between the two societies.
American, Dutch, and some other European cities are following a common path with increasingly two categories of residents: single person households – often American (Dutch) university students and young professionals or older American (Dutch) “empty nesters” – and lower income, ethnic minority families seeking to educate their children and usually hoping to escape to better situations.
As long as the dynamics of metropolitan areas gives all different groups in society equal access to different urban environments, differentiation among these urban environments according to the specific activities and interests of different groups is a positive quality and, in a way, the outcome of “natural” - that is, life-cycle, or age-related - differences in society. Problems arise as soon as civil rights (the freedom to choose home, school and job one is legally entitled to and economically able to) are restricted by a practice of unequal accessibility.
The more Dutch policies move toward the market-driven, USA model, the more ethnic and economic segregation is likely to increase and the greater the potential for unequal accessibility of urban and suburban neighborhoods.
School Segregation
It is hard to imagine two Western societies in which primary and secondary education is organized more differently than in the USA and the Netherlands.
School organization in the USA: In the USA most primary and secondary education is the responsibility of 14,900 local school districts that run over 86,000 public elementary and secondary schools. Most operate under independently elected school boards and raise an average of 45% of their annual budgets from local taxes (usually property taxes).47
47 Local school systems fall under municipal or county government budgetary authority only in Connecticut, Hawaii, Maryland, North Carolina, and Virginia.

INSIDE GAME/OUTSIDE GAME
73
State governments (the equivalents of the Dutch national government) have constitutional authority over local school boards and now provide almost half of local school budgets from state taxes. The federal government (the equivalent of the European Union) has little education role. The US Department of Education provides funds to help states support compensatory education for schools with concentrations of low-income students. In addition, the US Department of Agriculture subsidizes free meals (FARM) for low- and moderate-income students. Overall, the federal government provides about only 7% of funding for elementary and secondary education.
In addition, there are 26,000 private elementary and secondary schools. Some 8,300 are Catholic schools organized on a parish basis. Another 12,200 are affiliated with Protestant and other religious denominations. The remaining 5,500 are non-sectarian schools. Overall, only 11% of American school children attend private schools.
The United States Constitution provides for strict separation of church and state. Few public funds flow to religious schools. The only major exception is the federal free lunch program (FARM) where the courts have held that the aid is for the children and not for the school. Most state level initiatives to experiment with providing public school students with “vouchers” to pay tuition at private, religiously affiliated schools have been declared unconstitutional.
To summarize, almost 90% of American school children attend their non-sectarian, public schools. Most attend their neighborhood school. Some will transfer within their school districts to another school (less than 10%). Between private school pupils and public school transferees, only about 20% of American parents are exercising “freedom of choice” in where their children go to school.
School organization in the Netherlands: What a contrast with the Netherlands in which, since 1919, the Dutch government (that is, the “state”-level government) provides 100% of the funding not only for non-sectarian public schools but also for all Catholic, Protestant, Jewish, Muslim, and other religiously-based schools. Moreover, all parents are constitutionally guaranteed total freedom of choice in where to send their children to school. The controversies that wrack the American political scene about tax-funded vouchers, freedom of choice, and tax support for religious educational institutions have been established public policy for almost a century.
Though overall educational policy is controlled at the state (that is, Dutch government) level as in the USA, Dutch schools fall within the administrative scope of municipal governments which allocate different central government subsidies among local schools on the basis of plans submitted.
Finally, recognizing the special problems that low-income children must often overcome, the state funding formula provides a 25% bonus per student for “low-income” ethnic Dutch students (so-called “1.25 students) and a 90% bonus per student for “low-income” ethnic minority students (so-called “1.9” students).
There is no comparable effort at compensatory funding in the USA system. Most state school funding formulas struggle politically to bring tax-poor local school districts up to the level of funding per pupil of wealthier school districts. Even in the most poverty-impacted schools the
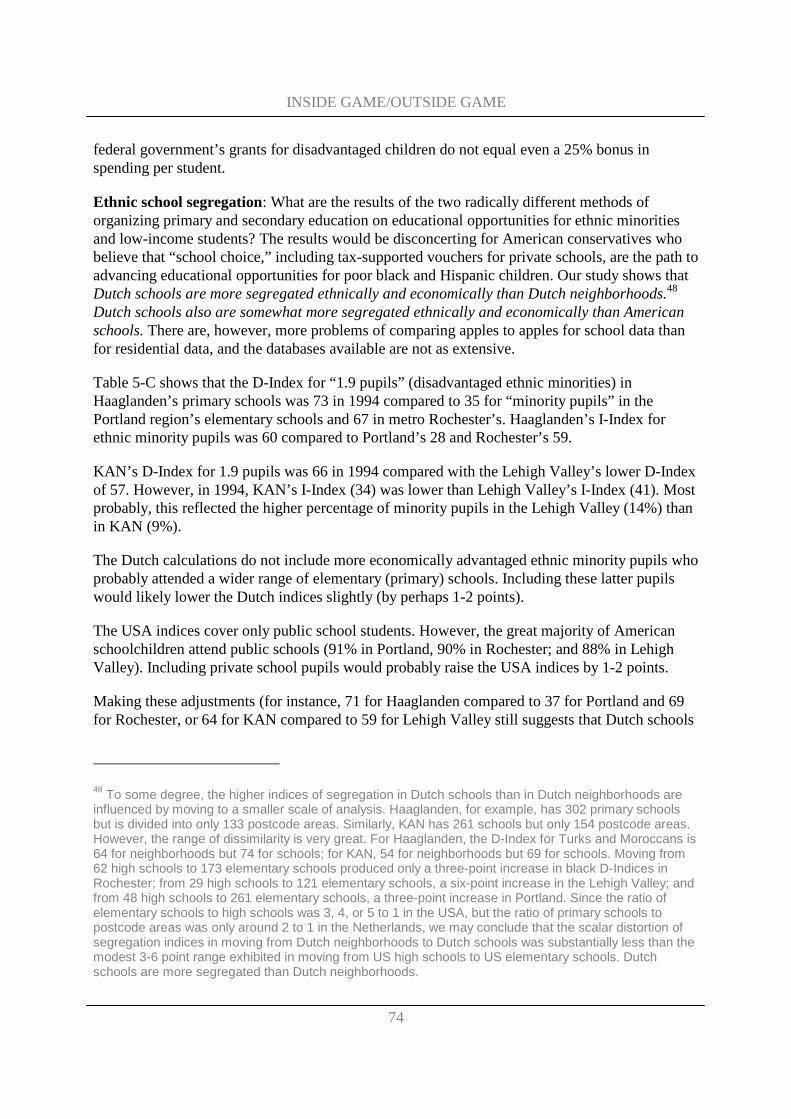
INSIDE GAME/OUTSIDE GAME
74
federal government’s grants for disadvantaged children do not equal even a 25% bonus in spending per student.
Ethnic school segregation: What are the results of the two radically different methods of organizing primary and secondary education on educational opportunities for ethnic minorities and low-income students? The results would be disconcerting for American conservatives who believe that “school choice,” including tax-supported vouchers for private schools, are the path to advancing educational opportunities for poor black and Hispanic children. Our study shows that Dutch schools are more segregated ethnically and economically than Dutch neighborhoods.48 Dutch schools also are somewhat more segregated ethnically and economically than American schools. There are, however, more problems of comparing apples to apples for school data than for residential data, and the databases available are not as extensive.
Table 5-C shows that the D-Index for “1.9 pupils” (disadvantaged ethnic minorities) in Haaglanden’s primary schools was 73 in 1994 compared to 35 for “minority pupils” in the Portland region’s elementary schools and 67 in metro Rochester’s. Haaglanden’s I-Index for ethnic minority pupils was 60 compared to Portland’s 28 and Rochester’s 59.
KAN’s D-Index for 1.9 pupils was 66 in 1994 compared with the Lehigh Valley’s lower D-Index of 57. However, in 1994, KAN’s I-Index (34) was lower than Lehigh Valley’s I-Index (41). Most probably, this reflected the higher percentage of minority pupils in the Lehigh Valley (14%) than in KAN (9%).
The Dutch calculations do not include more economically advantaged ethnic minority pupils who probably attended a wider range of elementary (primary) schools. Including these latter pupils would likely lower the Dutch indices slightly (by perhaps 1-2 points).
The USA indices cover only public school students. However, the great majority of American schoolchildren attend public schools (91% in Portland, 90% in Rochester; and 88% in Lehigh Valley). Including private school pupils would probably raise the USA indices by 1-2 points.
Making these adjustments (for instance, 71 for Haaglanden compared to 37 for Portland and 69 for Rochester, or 64 for KAN compared to 59 for Lehigh Valley still suggests that Dutch schools
48 To some degree, the higher indices of segregation in Dutch schools than in Dutch neighborhoods are influenced by moving to a smaller scale of analysis. Haaglanden, for example, has 302 primary schools but is divided into only 133 postcode areas. Similarly, KAN has 261 schools but only 154 postcode areas. However, the range of dissimilarity is very great. For Haaglanden, the D-Index for Turks and Moroccans is 64 for neighborhoods but 74 for schools; for KAN, 54 for neighborhoods but 69 for schools. Moving from 62 high schools to 173 elementary schools produced only a three-point increase in black D-Indices in Rochester; from 29 high schools to 121 elementary schools, a six-point increase in the Lehigh Valley; and from 48 high schools to 261 elementary schools, a three-point increase in Portland. Since the ratio of elementary schools to high schools was 3, 4, or 5 to 1 in the USA, but the ratio of primary schools to postcode areas was only around 2 to 1 in the Netherlands, we may conclude that the scalar distortion of segregation indices in moving from Dutch neighborhoods to Dutch schools was substantially less than the modest 3-6 point range exhibited in moving from US high schools to US elementary schools. Dutch schools are more segregated than Dutch neighborhoods.
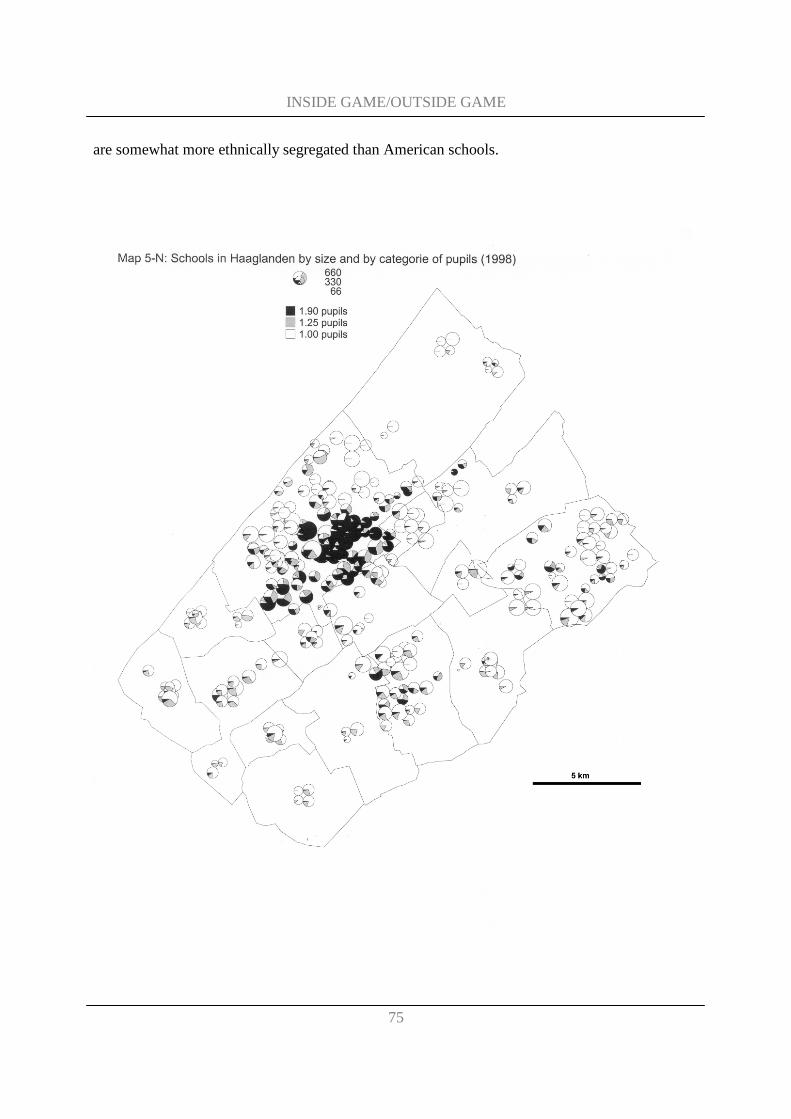
INSIDE GAME/OUTSIDE GAME
75
are somewhat more ethnically segregated than American schools.
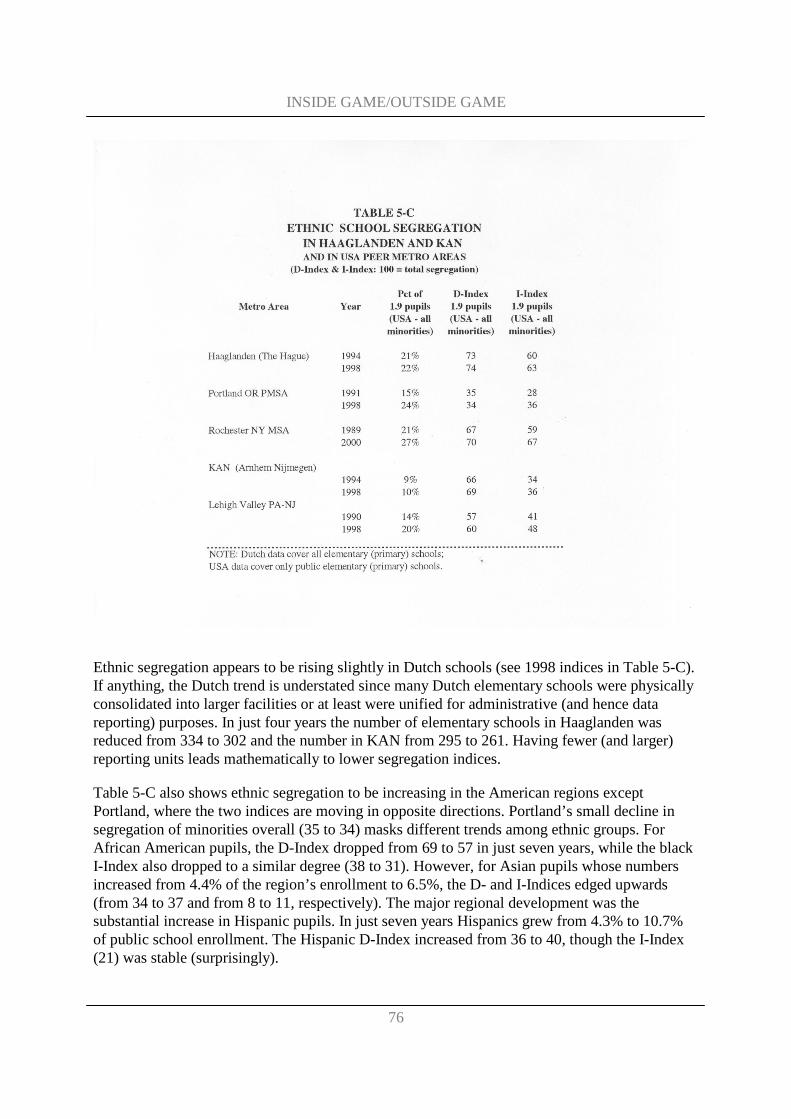
INSIDE GAME/OUTSIDE GAME
76
Ethnic segregation appears to be rising slightly in Dutch schools (see 1998 indices in Table 5-C). If anything, the Dutch trend is understated since many Dutch elementary schools were physically consolidated into larger facilities or at least were unified for administrative (and hence data reporting) purposes. In just four years the number of elementary schools in Haaglanden was reduced from 334 to 302 and the number in KAN from 295 to 261. Having fewer (and larger) reporting units leads mathematically to lower segregation indices.
Table 5-C also shows ethnic segregation to be increasing in the American regions except Portland, where the two indices are moving in opposite directions. Portland’s small decline in segregation of minorities overall (35 to 34) masks different trends among ethnic groups. For African American pupils, the D-Index dropped from 69 to 57 in just seven years, while the black I-Index also dropped to a similar degree (38 to 31). However, for Asian pupils whose numbers increased from 4.4% of the region’s enrollment to 6.5%, the D- and I-Indices edged upwards (from 34 to 37 and from 8 to 11, respectively). The major regional development was the substantial increase in Hispanic pupils. In just seven years Hispanics grew from 4.3% to 10.7% of public school enrollment. The Hispanic D-Index increased from 36 to 40, though the I-Index (21) was stable (surprisingly).
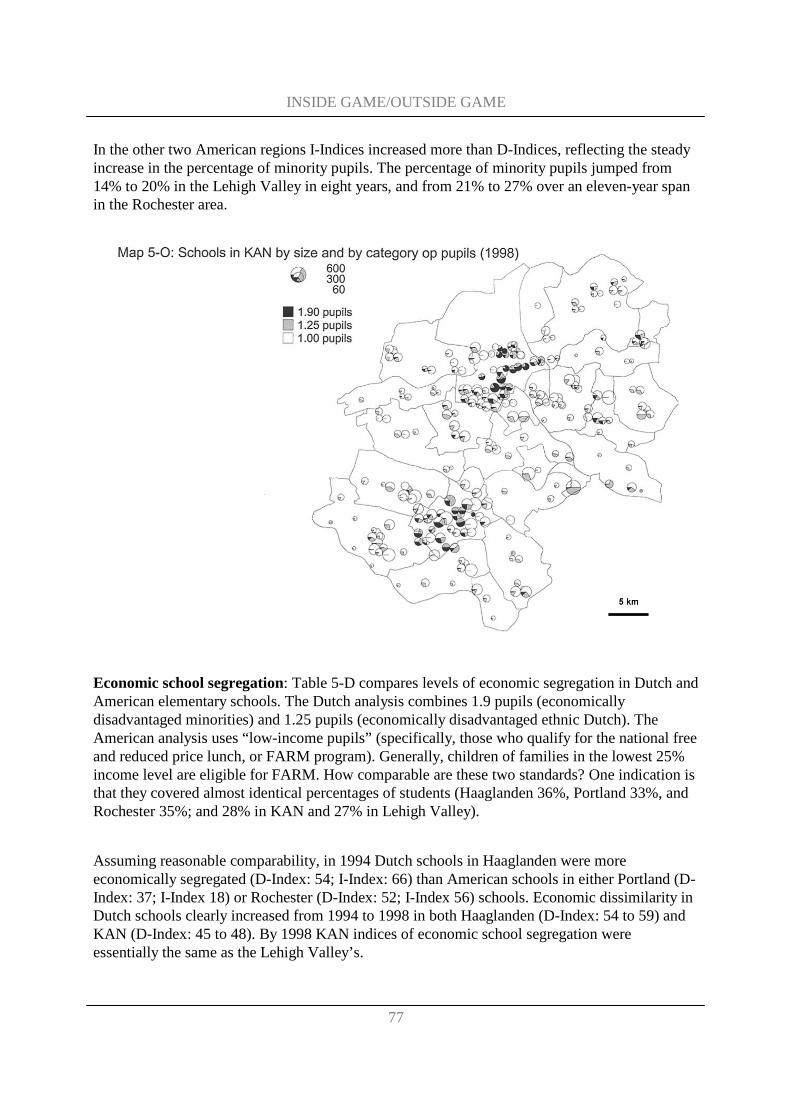
INSIDE GAME/OUTSIDE GAME
77
In the other two American regions I-Indices increased more than D-Indices, reflecting the steady increase in the percentage of minority pupils. The percentage of minority pupils jumped from 14% to 20% in the Lehigh Valley in eight years, and from 21% to 27% over an eleven-year span in the Rochester area.
Economic school segregation: Table 5-D compares levels of economic segregation in Dutch and American elementary schools. The Dutch analysis combines 1.9 pupils (economically disadvantaged minorities) and 1.25 pupils (economically disadvantaged ethnic Dutch). The American analysis uses “low-income pupils” (specifically, those who qualify for the national free and reduced price lunch, or FARM program). Generally, children of families in the lowest 25% income level are eligible for FARM. How comparable are these two standards? One indication is that they covered almost identical percentages of students (Haaglanden 36%, Portland 33%, and Rochester 35%; and 28% in KAN and 27% in Lehigh Valley).
Assuming reasonable comparability, in 1994 Dutch schools in Haaglanden were more economically segregated (D-Index: 54; I-Index: 66) than American schools in either Portland (D-Index: 37; I-Index 18) or Rochester (D-Index: 52; I-Index 56) schools. Economic dissimilarity in Dutch schools clearly increased from 1994 to 1998 in both Haaglanden (D-Index: 54 to 59) and KAN (D-Index: 45 to 48). By 1998 KAN indices of economic school segregation were essentially the same as the Lehigh Valley’s.
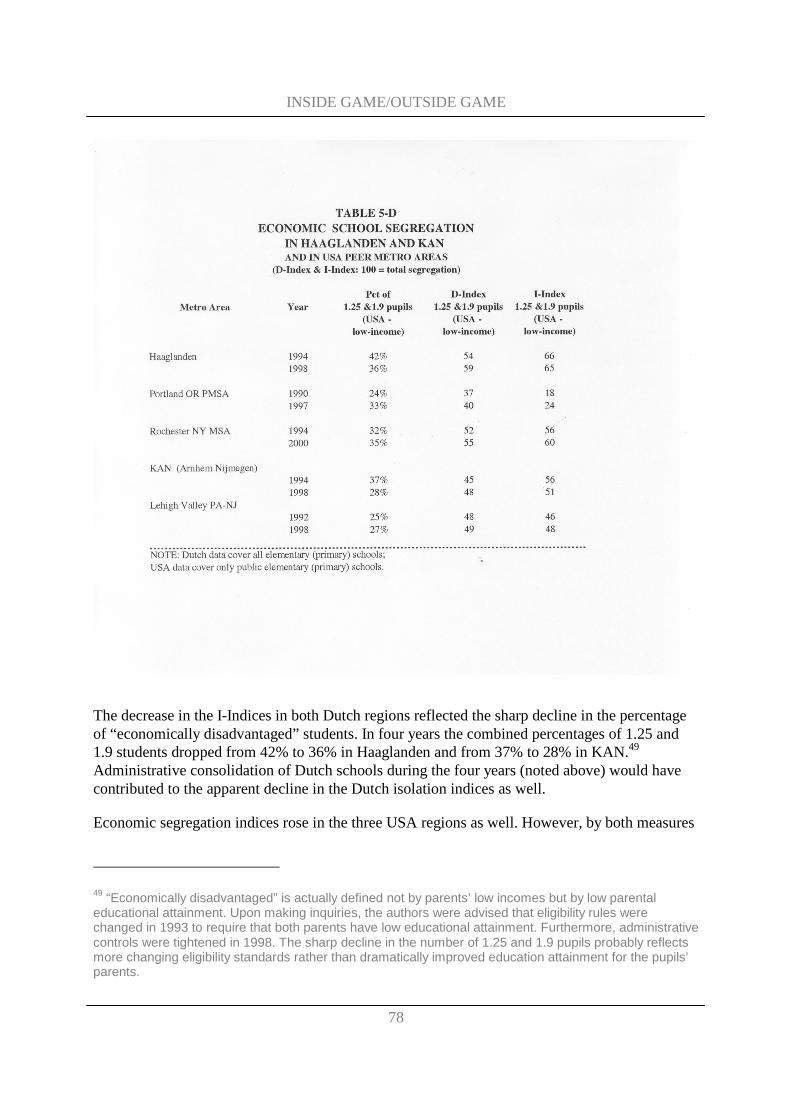
INSIDE GAME/OUTSIDE GAME
78
The decrease in the I-Indices in both Dutch regions reflected the sharp decline in the percentage of “economically disadvantaged” students. In four years the combined percentages of 1.25 and 1.9 students dropped from 42% to 36% in Haaglanden and from 37% to 28% in KAN.49 Administrative consolidation of Dutch schools during the four years (noted above) would have contributed to the apparent decline in the Dutch isolation indices as well.
Economic segregation indices rose in the three USA regions as well. However, by both measures
49 “Economically disadvantaged” is actually defined not by parents’ low incomes but by low parental educational attainment. Upon making inquiries, the authors were advised that eligibility rules were changed in 1993 to require that both parents have low educational attainment. Furthermore, administrative controls were tightened in 1998. The sharp decline in the number of 1.25 and 1.9 pupils probably reflects more changing eligibility standards rather than dramatically improved education attainment for the pupils’ parents.
INSIDE GAME/OUTSIDE GAME
79
the levels were the lowest in the Portland region. This may be further evidence of the impact of the Portland region’s growth management and affordable housing policies discussed earlier in this report.
Policy Observations
Classmates vs. Schools Boards: There have been no more consistent findings of USA educational research than
a) the powerful impact of the socioeconomic status of family and classmates on educational outcomes, and
b) the positive value on low-income children’s school performance of attending economically integrated, predominately middle class schools.
In the USA this linkage was first – and most compellingly – documented in 1966 by the massive research study conducted by sociologist James Coleman for the US Office of Education (the “Coleman Report”). After reviewing records for over 1,000,000 American school children, Coleman concluded: “The educational resources provided by a child’s fellow students are more important for his achievement than are the resources provided by the school board.”50
This basic observation has been re-affirmed again in the context of this study. With information available on the Internet, the author analyzed the relationship between socioeconomic status and test scores for 121 elementary schools in the Lehigh Valley for 1998-99. The result: the percentage of low-income pupils accounted for 51% of the variation in school averages for 8th grade math tests, 53% for 6th grade writing tests, 66% from 8th grade reading tests, 69% for 5th grade math tests, and 80% for 5th grade reading tests.51
With President George W. Bush proposing federally funded school vouchers as a key part of his new administration’s educational initiatives, there is no more timely opportunity to push for economically integrating American schools. Yet there are also no research findings more persistently ignored by policy makers and general public.
Almost 90% of American school children attend their non-sectarian, public schools. Most attend their neighborhood school. Since local schools are organized and funded primarily by local school districts, almost no child ever transfers out of district. Ethnically and economically
50 The just published book by Richard Kahlenberg (All Together Now. Washington, DC: Century Foundation/ Brookings Institution Press: 2001) is the definitive summary of research on the importance of economic integration. In Chapters 3 (The Case for Economic School Desegregation) and 4 (The Significance of the Socioeconomic Makeup of Schools) plus 35 pages of footnotes, Kahlenberg cites and summarizes over 200 research studies on the topic (including three by the author). Readers seeking more information are referred to Kahlenberg’s book.
51 “Explained” refers to the adjusted r-square value in linear regression analysis; all findings were highly significant statistically.
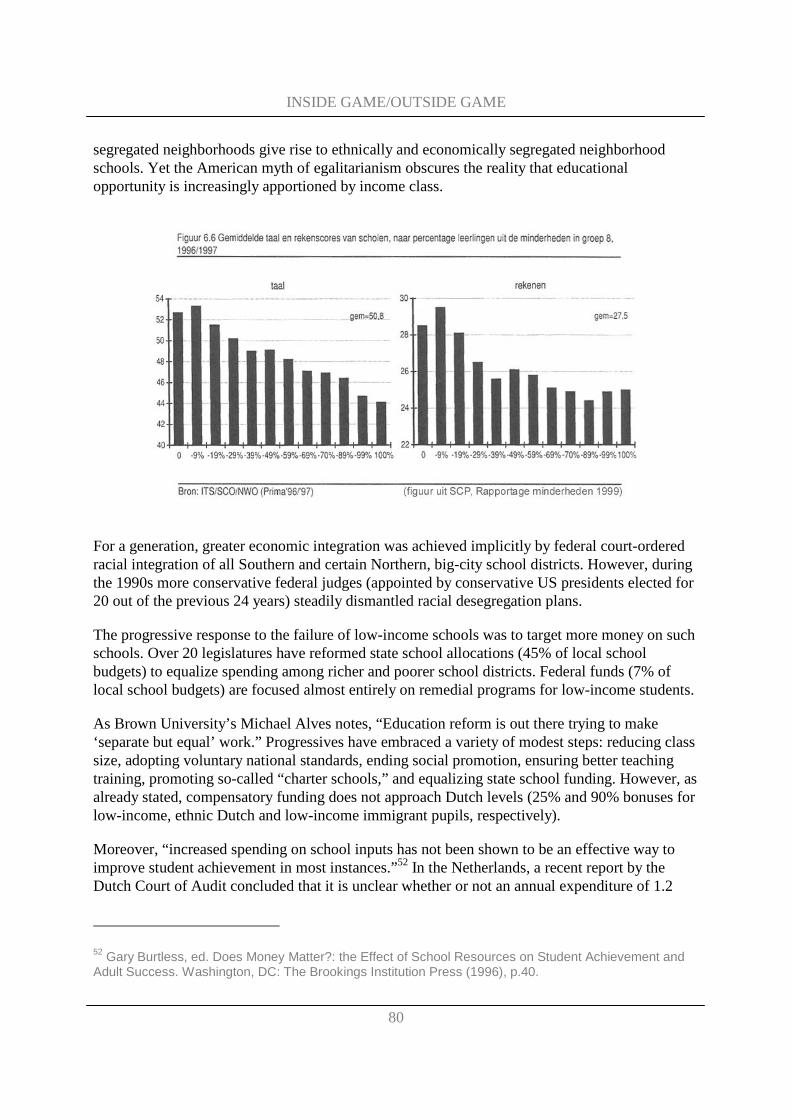
INSIDE GAME/OUTSIDE GAME
80
segregated neighborhoods give rise to ethnically and economically segregated neighborhood schools. Yet the American myth of egalitarianism obscures the reality that educational opportunity is increasingly apportioned by income class.
For a generation, greater economic integration was achieved implicitly by federal court-ordered racial integration of all Southern and certain Northern, big-city school districts. However, during the 1990s more conservative federal judges (appointed by conservative US presidents elected for 20 out of the previous 24 years) steadily dismantled racial desegregation plans.
The progressive response to the failure of low-income schools was to target more money on such schools. Over 20 legislatures have reformed state school allocations (45% of local school budgets) to equalize spending among richer and poorer school districts. Federal funds (7% of local school budgets) are focused almost entirely on remedial programs for low-income students.
As Brown University’s Michael Alves notes, “Education reform is out there trying to make ‘separate but equal’ work.” Progressives have embraced a variety of modest steps: reducing class size, adopting voluntary national standards, ending social promotion, ensuring better teaching training, promoting so-called “charter schools,” and equalizing state school funding. However, as already stated, compensatory funding does not approach Dutch levels (25% and 90% bonuses for low-income, ethnic Dutch and low-income immigrant pupils, respectively).
Moreover, “increased spending on school inputs has not been shown to be an effective way to improve student achievement in most instances.”52 In the Netherlands, a recent report by the Dutch Court of Audit concluded that it is unclear whether or not an annual expenditure of 1.2
52 Gary Burtless, ed. Does Money Matter?: the Effect of School Resources on Student Achievement and Adult Success. Washington, DC: The Brookings Institution Press (1996), p.40.
INSIDE GAME/OUTSIDE GAME
81
billion guilders in compensatory education for 1.25 and 1.90 students has had any positive impact. Educational goals are not clearly established nor are adequate administrative controls in effect. However, after 35 different evaluation studies over the course of two decades, the results of substantial compensatory funding are unclear.
In America conservative reformers now champion “school choice” to provide tax-supported vouchers for low-income children to attend private, non-sectarian and private, religious schools. As discussed, universal school choice, of course, is the hallmark of the Dutch educational system. However, school choice is hardly the cure-all that American conservatives envision. As noted above, Dutch schools are more segregated than Dutch neighborhoods. Academic performance of “black schools” (i.e. majority immigrant schools) is particularly low and resistant to more funds. Though results are challenged (see Gramberg), most recent Dutch educational research (see Social and Cultural Planning Bureau, Westerbeek) confirms similar socioeconomic effects as in the USA. Social and economic school integration would substantially improve results for minority and low-income pupils.
However, achieving greater ethnic and economic integration of Dutch schools may be no easier politically than in the USA. The factors that contribute to Dutch schools being more segregated than Dutch neighborhoods are many and complex. These probably include53
1. Within more compact urban areas, it is quite normal for parents to look for better schools since many more alternatives are reachable by foot or public transportation than would be true of many American communities.
2. The more highly educated parents are, the more likely they are to “shop” for alternatives to the neighborhood school. Since most ethnic Dutch parents have higher education levels than most immigrant parents, their children tend to be scattered across a wider range of alternative schools than do immigrant children. Schools with special pedagogical approaches (such as Montessori schools) would have special appeal to more educated parents.
3. There may be some vestige of older, more discriminatory practices with regard to immigrants when, at the start of mass migration in the 1960s, some municipalities sought to concentrate different immigrant children in different schools or have only one school for immigrant children.
4. Religious schools will have a natural tendency to divide by ethnicity based on religious preferences (Catholic schools for Catholics, Islamic schools for Muslims, etc.)54
53 Sociaal en Cultureel Planbureau, Minderhedenrapportage 1995
54 “Pillarization” has largely vanished from contemporary Dutch society but it survives in the educational system. Religious schools have the right to refuse pupils for religious reasons. It is not clear how far this leads to minority pupils being refused entrance into Catholic or Protestant schools. The growing number of Muslim schools may reinforce Islamic culture and religion (seen as a positive achievement), but be
INSIDE GAME/OUTSIDE GAME
82
5. Ethnic minority parents will be attracted to schools that offer special services for their children, such as intensive Dutch language instruction or, conversely, instruction in their native language.
6. Parents (especially high income parents) seek out schools where students have a similar background to their own children.
7. Many ethnic Dutch parents regard schools with concentrations of ethnic minorities as undesirable because they believe that the quality of education will be low.
8. The first five reasons we may regard as morally neutral factors. The last two raise issues that lie at the heart of school segregation in America.
9. In effect, whatever benefits Dutch society gains from having more economically integrated neighborhoods may be substantially nullified from having more economically segregated schools.
Labor Market Segmentation
Jobs and Worker Mismatches: Residential and school segregation and urban sprawl raise barriers for minority advancement in the labor force in two forms: skills mismatch and spatial mismatch. Skills mismatch arises from disadvantaged minorities receiving inadequate education in segregated schools, developing bad work habits within segregated social environments, and lacking effective personal networks (because of their social isolation) to connect with good jobs in the mainstream economy. Spatial mismatch arises from the decentralization of job locations away from central cities (where disadvantaged minorities are concentrated) to locations farther out in the suburban fringe (often unconnected to public transportation).
During recent decades most new jobs created within USA central cities have been professional and technical occupations located in downtown office cores, universities, and medical complexes. Though these jobs are geographically accessible to disadvantaged minorities in city neighborhoods, many cannot overcome the barrier of the skills mismatch.
On the other hand, the great bulk of low-skilled jobs are now created in suburban industrial and warehouse parks (located near major highways and airports) and in retail and service establishments located in suburban shopping areas near the bulk of their customers. (The primary exception is city-based, convention and tourism-related jobs that are low-skill but also low-wage.) Disadvantaged workers in city neighborhoods face a spatial mismatch. Many suburban jobs are either too costly to reach (in time or money) for the low wages involved, or completely inaccessible for workers without private autos.
academically self-defeating in terms of integrating Turks, Moroccans, and other Muslim immigrants into advanced educational and job opportunities.
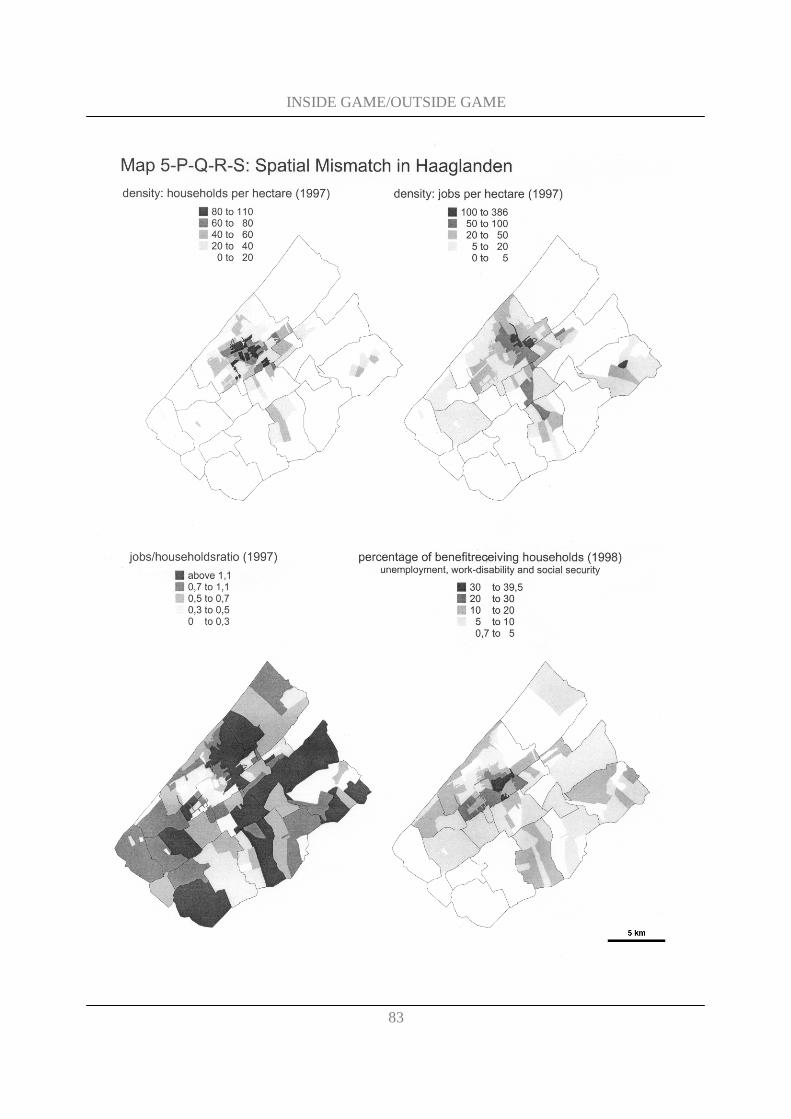
INSIDE GAME/OUTSIDE GAME
83

INSIDE GAME/OUTSIDE GAME
84
INSIDE GAME/OUTSIDE GAME
85
Spatial Mismatch: We have not uncovered existing studies of spatial mismatch that focus specifically on our target regions in the USA and the Netherlands. Analyzing the Dutch regions shows that both in KAN and Haaglanden (maps 5-P/W), some (but not all) areas with high percentages of households receiving benefits have an extremely low jobs-households ratio (defined as the number of jobs in an area divided by the number of households living in this area). In these centrally located neighborhoods in Arnhem and The Hague, job density is low. Nijmegen presents a more balanced picture. Analyzing the jobs-households ratio for different economic sectors (i.e. business and financial services, manufacturing, wholesale distribution, retail services, etc) reveals pronounced regional differences in locational patterns. However, in the low-income neighborhoods in Arnhem and The Hague, the low jobs-households ratio applies for all economic sectors.
Dutch urban renewal policies of the 1970s and 1980s emphasized building more social housing. Many city shops and factories closed down or relocated in those years. The effect is that places to work are relatively scarce in urban neighborhoods where they are most needed now. As distances in Dutch regions are comparatively short and public transport is generally better than in the USA, spatial mismatch in the Netherlands is probably not only a problem of transportation to suburban job sites, but also a lack of cheap urban land for new or expanded job sites. Another ‘re-differentiation’ policy is needed: increase mixed-use of neighborhoods with relatively high amounts of unemployed.55
Economic Integration and Skills Mismatch: We have also not located studies of skills mismatch that focus specifically on our target regions. However, there are some general Dutch studies and many American studies that examine the link between economic segregation and integration and successful entrance into more advanced training, university education, and more skilled occupations.
American examples: One of the most important and best known American examples is Prof. James Rosenbaum’s study of the so-called “Gautreaux Program.” The Gautreaux Program was established by federal court order in 1976 after a suit against the Chicago Housing Authority for conducting a racially discriminatory program.
In 1991, Rosenbaum and colleagues at Northwestern University found that inner-city students whose families moved to rent-subsidized apartments in the affluent suburbs as part of the court-ordered remedy were much more likely to succeed than similar students whose families moved instead to other parts of Chicago. (The research did not measure the real control group – poor families who remained in Chicago’s fearsome public housing ghettos.) The students who moved into low-poverty suburbs and attended low-poverty suburban schools were
• four times less likely to drop out of secondary school before graduation (5% versus 20%);
55 See also Olga van Maanen – Zuidwijk in de lift (TU Delft, 2001) in which the four big cities in the Randstad are compared in this regard and proposals are formulated for urban renewal in one of these areas (Zuidwijk in Rotterdam)

INSIDE GAME/OUTSIDE GAME
86
• almost twice as likely to take university preparatory courses (40% versus 24%);
• twice as likely to attend some form of post-secondary, advanced training or higher education (54% versus 21%); and
• almost eight times as likely to attend a four-year university (27% versus 4%).
Moreover, both students and parents were more likely to be employed in the suburbs than in the city and with slightly better wages.
Because 95% of movers chose the first available housing placement, whether in the city or in the suburbs, the greater success of suburban movers was unlikely to be related to self-selection.
Another highly studied program is the “voluntary” racial desegregation program in which 12,500 St. Louis students (all African American) attend schools in 16 wealthy suburban districts. (Though called “voluntary,” the agreement was negotiated between the St. Louis Public Schools and the 16 suburban districts under threat of an adverse federal court decision in 1980.).
Evaluation studies found that suburban transfer students who entered the transfer program as 9th graders from the city schools, as compared to 9th grade city students who remained in city schools (even in enriched magnet schools) were
• more than twice as likely to graduate from secondary school (60% to 27%) four years later;
• more than three times as likely to go on to post-secondary training and education (40% to 13%); and
• more than three times as likely to enter four-year universities (26% to 8%).
Self-selection was clearly a factor in this case; black St. Louis students –or their parents – volunteered for the program. However, one researcher writes,
“While the desire to escape the social ills of the inner city provides much of the impetus for black students to transfer to schools twenty to thirty miles from their homes, they also know that going to school with white and wealthy students has a lot of added advantages.
It is not that these African American students need to sit next to white students to learn, but if they do they are more likely to be admitted to social institutions that confer status and prestige.
For instance, white suburban schools – unlike schools that serve poor and black students – are much more likely to be focused on preparing students for college and white-collar lives; they are generally more intricately linked to the admissions
INSIDE GAME/OUTSIDE GAME
87
offices of top universities.”56
Dutch examples: A very comprehensive analysis of the process of integrating major immigrant groups into Dutch society has recently been published.57 While it does not present detailed analyses of the comparative progress of members of different immigrant populations in segregated and integrated settings, it does offer value insights into the relative progress of different immigrant groups from which conclusions may be drawn.
First, Table 5-E summarizes the present job level of the work force by the four major ethnic categories (Turks, Moroccans, Surinamese, and Antilleans) and compares them to ethnic Dutch. A clear distinction can be seen between the weak labor market position of Turks and Moroccans (who first arrived as unskilled and low-skilled guest workers) and the stronger labor market position of Surinamese and Antilleans (many of whom originally came to further their education). Even the latter groups lag significantly behind ethnic Dutch. “However, the differences in job levels of the four groups mentioned and the majority population have clearly declined in the past twenty years,” the authors observe.
Second, Table 5-F summarizes the education level attained by adult workers who are not still in school. It shows a clear improvement for all groups in moving up the educational scale. However, Table 5-G highlights the dramatic differences that still exist among choices that different immigrant youth and ethnic Dutch youth make regarding post-secondary education. In this table, one can hear echoes of the comments made about the value to African American students of attending suburban secondary schools with regard to opening new vistas of opportunity.
56 Amy Stuart Wells and Robert L. Crain. Stepping over the Color Line: African-American Students in White Suburban Schools. Yale University Press: New Haven and London (1997), pp. 198-99.
57 Vermeulen & Penninx, op. cit.
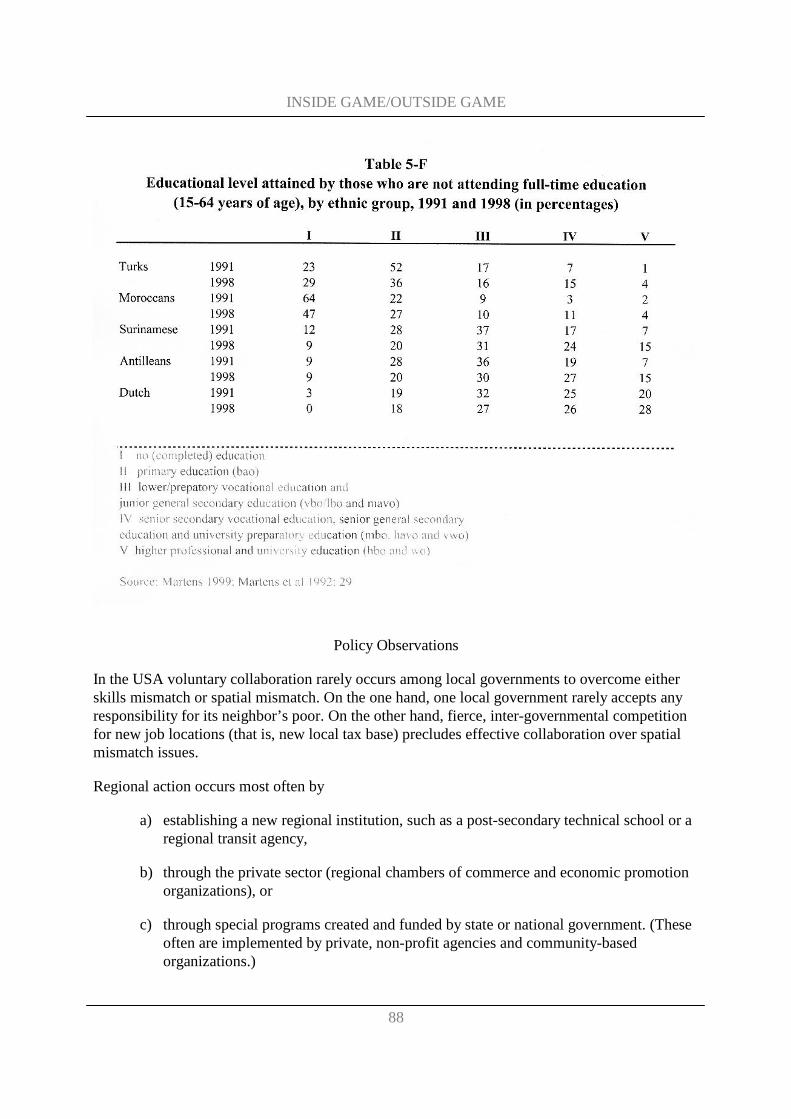
INSIDE GAME/OUTSIDE GAME
88
Policy Observations
In the USA voluntary collaboration rarely occurs among local governments to overcome either skills mismatch or spatial mismatch. On the one hand, one local government rarely accepts any responsibility for its neighbor’s poor. On the other hand, fierce, inter-governmental competition for new job locations (that is, new local tax base) precludes effective collaboration over spatial mismatch issues.
Regional action occurs most often by
a) establishing a new regional institution, such as a post-secondary technical school or a regional transit agency,
b) through the private sector (regional chambers of commerce and economic promotion organizations), or
c) through special programs created and funded by state or national government. (These often are implemented by private, non-profit agencies and community-based organizations.)
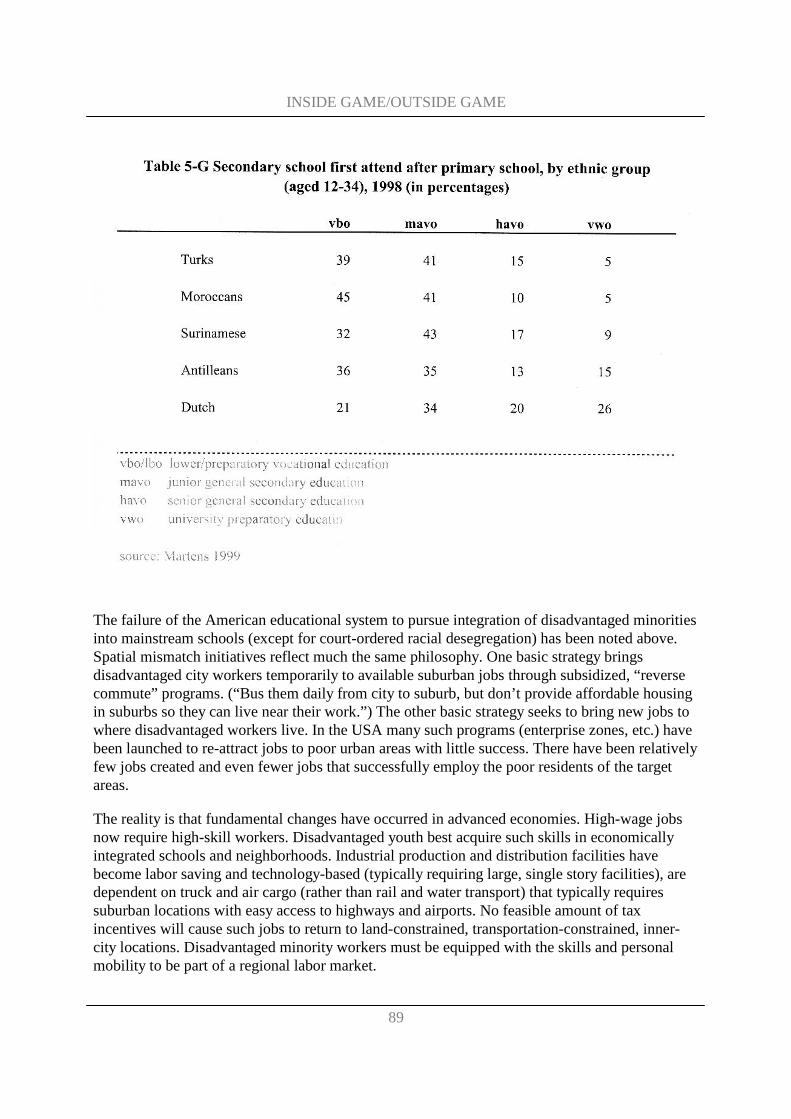
INSIDE GAME/OUTSIDE GAME
89
The failure of the American educational system to pursue integration of disadvantaged minorities into mainstream schools (except for court-ordered racial desegregation) has been noted above. Spatial mismatch initiatives reflect much the same philosophy. One basic strategy brings disadvantaged city workers temporarily to available suburban jobs through subsidized, “reverse commute” programs. (“Bus them daily from city to suburb, but don’t provide affordable housing in suburbs so they can live near their work.”) The other basic strategy seeks to bring new jobs to where disadvantaged workers live. In the USA many such programs (enterprise zones, etc.) have been launched to re-attract jobs to poor urban areas with little success. There have been relatively few jobs created and even fewer jobs that successfully employ the poor residents of the target areas.
The reality is that fundamental changes have occurred in advanced economies. High-wage jobs now require high-skill workers. Disadvantaged youth best acquire such skills in economically integrated schools and neighborhoods. Industrial production and distribution facilities have become labor saving and technology-based (typically requiring large, single story facilities), are dependent on truck and air cargo (rather than rail and water transport) that typically requires suburban locations with easy access to highways and airports. No feasible amount of tax incentives will cause such jobs to return to land-constrained, transportation-constrained, inner-city locations. Disadvantaged minority workers must be equipped with the skills and personal mobility to be part of a regional labor market.
INSIDE GAME/OUTSIDE GAME
90
Part 6: Conclusions and recommendations
Conclusions
Residential Segregation
Comparing the Netherlands and the USA shows that, for comparably defined metropolitan regions of equivalent population size and percentage of minorities, the degree of ethnic segregation in regional housing markets is basically the same. This is troubling since current levels of ethnic segregation in the USA reflect a long history of explicitly discriminatory practices that have only become illegal and generally disavowed by the majority in the last three decades.58 Such legally sanctioned practices have never existed in the Netherlands, which prides itself on being a tolerant society (but were the slave traders of the world).
Some apologists may explain such segregation as a purely temporary phenomenon among recent immigrants or as only a reflection of voluntary self-segregation by ethnic minorities. The tragic history of American race relations should caution the Dutch from easily accepting such self-absolving explanations. At the very least, the degree of ethnic segregation (which seems to be growing) also reflects the steady suburbanization of ethnic Dutch families; to what degree this trend is motivated (if at all) by anti-immigrant prejudice has not been addressed by this study.
Of all European societies, the Dutch have devoted the most academic analysis and public policy attention to the issue of ethnic segregation. However, in-depth, continuing analysis of individual motivations and institutional arrangements that foster ethnic segregation and then enacting necessary public policy reforms are essential if Dutch society is to avoid more serious problems.
By contrast, the degree of economic segregation in regional housing markets in the Netherlands is substantially less than in the USA. This is a result of the extensive Dutch welfare state and the major role of social housing. Lower economic segregation probably lessens adverse consequences of ethnic segregation. Nevertheless, economic segregation seems to be inching upward, and most public policy trends (reduction in social housing subsidies, greater emphasis on market-rate housing, etc.) lead in the direction of greater economic segregation unless re-shaped by offsetting “rules of the game.”
58 Setting aside legal segregation (“Jim Crow” laws) in former slave states in the South, these included such disgraceful Northern practices as black exclusion laws (e.g. Oregon in the 1800s); racially exclusive zoning ordinances (pioneered by Baltimore in 1917); racial, ethnic, and religious covenants in homeowners’ deeds (until declared unconstitutional in 1948); denying federally insured mortgages for homes in minority neighborhoods, or “red-lining” (from 1934 to 1966); and overt discrimination in real estate and mortgage lending practices (until made illegal by the federal Civil Rights Act of 1968).
INSIDE GAME/OUTSIDE GAME
91
School Segregation
Our study shows that Dutch schools are more segregated ethnically and economically than Dutch neighborhoods. Dutch schools also are somewhat more segregated ethnically and economically than American schools. Ethnic school segregation is rising. Declining measures of economic segregation may reflect changes in classification standards more than improved parental education levels. In effect, whatever benefits Dutch society gains from having more economically integrated neighborhoods may be substantially nullified from having more economically segregated schools.
Prior to our study we read that Dutch schools are more segregated than Dutch neighborhoods. That Dutch schools are also more segregated than American schools genuinely surprised the authors. The basis of comparison (two Dutch regions and three American) is very small. Additional “apples to apples” comparisons should be made before accepting such a sweeping generalization.
These social trends are occurring in the context of American and European regional development patterns that are surprisingly similar. With the exception of The Hague, our sample cities began the postwar period within much the same density range (another surprising finding). Thereafter, all regions experienced the same phenomena – steady decentralization of population and employment, increasing spatial separation of middle class families from poor families (with consequences for ethnic segregation), growing concentration of one-person households and ethnic minority families in cities, and increased reliance on private automobiles rather than mass transit. These trends have been more pronounced in the USA (e.g. much greater consumption of land per household). However, the differences are matters of degree and not in the direction of the trends.
Segregation and Spatial Planning: “Big Boxes” vs. “Little Boxes”
This report is subtitled “Segregation and Spatial Planning in Metropolitan Areas.” What insights does this study yield about the relationship between effective regional planning and ethnic and economic segregation? Very little, in a formal sense. Though the Portland region’s ethnic and economic segregation levels are usually below its American peers, one is hesitant to draw broad conclusions based on one example of effective regional spatial planning (even after three decades of experience). And KAN and Haaglanden ROLs have been in existence only six years – far too short a time to measure their effect on such a complex issue as ethnic and economic segregation.
In another sense, however, we can say a great deal about the relationship of segregation and spatial planning if we shift to a comparison of “big box” and “little box” regions. In the USA “big box” regions have large, expanding central cities in the midst of unincorporated land, or they are dominated by consolidated city-county governments, or governed by county governments (as in Maryland and Virginia where municipalities are few and weak). “Big box” regions also have large, often countywide school districts.
Through their dominant “elastic” cities, or consolidated city-county governments, or fully empowered county governments, “big box” regions carry out de facto regional spatial planning.
INSIDE GAME/OUTSIDE GAME
92
Their planning and zoning policies and infrastructure investments dictate where most private development occurs. Since they already contain most of the region’s tax base and will annex most newly developed properties, “big box” jurisdictions don’t compete with themselves over new business investment or for high-end housing developments. Since they already contain most of the region’s poor households, they don’t try to exclude them; on the contrary, “big box” governments tend to scatter public housing projects and Section 8 rent vouchers into many different neighborhoods. Within “big box” school districts parents tend to transfer their children more to schools they prefer than automatically sending them to the neighborhood school.
The approximately two hundred “big box” regions in the USA both exercise substantial regional spatial planning powers and (though other factors contribute importantly) are less ethnically and economically segregated.
Nothing approaching regional spatial planning exists in any of the USA’s approximately one hundred “little box” regions (unless laws in a handful of states requires it). “Little box” regions have dozens, even hundreds, of independent municipalities and almost as many school districts. Spatial planning authority of any “little box” ends at its municipal boundaries; often its horizons end there too.
Dependent on local property and sales taxes, “little box” governments compete fiercely for new business and upper-income housing developments. They have a fiscal incentive to zone out their neighbor’s poor and often seek to push out their own poor residents as well. The mosaic of “little boxes” becomes the template against which regional society divides itself by ethnicity and class.
Dutch “Little Box” Regions
Divided universally into 537 incorporated municipalities, the Netherlands is a “little box” state. However, Dutch “rules of the game” have substantially reduced the ability of municipalities to act as typical “little boxes.” The most important such rules have been:
• near total financing by the Dutch government of municipal budgets that removed the fiscal incentive for inter-municipal economic competition;
• state control and allocation of social housing subsidies that tended to diversify the housing supply in suburban municipalities;
• a generous state social welfare system that provided an adequate minimum income for low-income households;
• 90% state funding of municipally-administered social welfare programs that removed most of the fiscal incentive for socially exclusionary practices; and
• a system of land use and transportation planning that tied municipal, provincial, and central government plans loosely together, substantially broadening the horizons of municipal planning and regulation and diminishing the “little box” world view.
INSIDE GAME/OUTSIDE GAME
93
Thus, past “rules of the game” have substantially offset the inherent tendencies of “little box” regions towards inter-municipal rivalry and social fragmentation along lines of ethnicity and class.
However, as noted at several points in this report, in recent years the trend of Dutch policy has been to move away from traditional practices for every one of the five points listed above towards more “market-oriented” approaches. With USA-style market-oriented policies come USA-style fiscal and social problems.
Comparing ‘the rules of the game’ in the US and the Netherlands, the same trends now show up. Conflicts between market-oriented housing policy and social welfare policy; transportation policies that facilitate urban sprawl; inability or unwillingness to “defend” farmland against the encroachment of urbanization; and a general belief that freedom of movement for people, business, and all other institutions will lead to optimal settlement patterns – all work together to generate ongoing urban sprawl. That European and Dutch population densities in metropolitan areas remain higher than comparable densities in the land-rich, auto-rich USA does not change this conclusion.
Lessons from Portland
Looking at solutions, there is one prominent American example – Portland, Oregon – that demonstrates a pattern of more compact metropolitan development that goes against the current of ongoing urban sprawl. What can be learned from the Portland experience?
The Land Use Act adopted in 1973 by the State of Oregon obliged municipalities to establish Urban Growth Boundaries (UGBs) and generated a set of new “rules of the game” that, in combination, have been able to reverse the trend that the expansion of urban land is proportionally higher that the growth of the urban population. Loss of farmland is thus proportionally lower that in otherwise comparable metropolitan areas without UGBs.
Also, this new set of rules has been effective in sustaining the vitality of the urban area. By concentrating people and investments within the boundaries of the city and older suburbs, the economies of the city and older suburbs are not sapped by sprawl but strengthened by concentration.
The new set of rules that was generated by the Oregon Land Use Act consists of the following items:
A. The obligation for all municipalities in the state to establish UGBs for periods of 20 years;
B. The prohibition to build urban facilities outside of these UGBs; (NB: In Dutch terms, in Oregon the “red” boundary is at the same time a “green” boundary.)
C. The creation of a new citizen commission, the Land Conservation and Development Commission (LCDC) to oversee the statewide planning program;
INSIDE GAME/OUTSIDE GAME
94
the establishment of a new state agency under the same name, as staff to the LCDC;
D. The requirement that all county and municipal plans must comply with state goals, as formulated by the LCDC.
E. The establishment of the Oregon Land Use Board of Appeals (LUBA); the LUBA appeals process takes about half the time of going through the state court system. In addition, for Portland Metropolitan Area:
F. The establishment of a regional government, called METRO, directly elected by its citizens, consisting of an elected “executive officer” and an elected commission of seven members.
G. The enfranchisement of METRO by state law and by METRO’s home rule charter, drawn up by a citizens’ charter commission and approved by area voters, charging METRO with regional planning as its primary function.
H. The subordination of county and municipal plans to METRO’s regional plan (after confirmation by LCDC and subject to appeal to LUBA).
Lessons from KAN
Looking at solutions in the Netherlands, there is one example that has taken advantage of all the possibilities authorized by the Kaderwet (an Act of Parliament to facilitate regional coordination and planning of housing, employment and transportation) to make regional government a practical reality. This is the Knooppunt Arnhem Nijmegen, actively supported by all municipalities within its regional boundaries, from whose positive experiences there are many lessons to be learned.
Among the seven Regional Public Bodies (ROLs) formed under the Kaderwet, these reasons for KAN’s success seem to be
• No single municipality can dominate KAN politically. Even the two largest cannot, for Arnhem and Nijmegen account for only 42% of the region’s population and 40% of the votes. Unlike in the highly developed and wealthy Randstad, for example, the desire to promote the KAN region’s prosperity probably created a greater spirit of common purpose and willingness to collaborate for the common good.
• Having a highly respected “outsider” as chairman/CEO who was not an elected official from a member municipality provided a neutral leader who was very effective in resolving disputes among members.
Of course, some of these conditions cannot be replicated. Broadening some ROL boundaries (e.g. Utrecht/BRU and Amsterdam/ROA) to American-style metropolitan configurations would
INSIDE GAME/OUTSIDE GAME
95
diminish the city’s dominance and perhaps create a spirit of greater collegiality. Providing for a neutral chairman/CEO could be effective in building a more collaborative environment.
However, changing to Portland-style direct election of regional officials would solve both problems. An elected ROL “executive officer” would be accountable to all the region’s voters. Electing the members of a relatively small regional council would diminish municipal “turf protection” because several suburban municipalities and sections of the central city could be combined in regional council districts.
Initially, some natural coordination between regional and municipal levels could be lost by ending membership on the regional council of elected municipal officials. However, the Portland experience suggests that this loss would be more than counterbalanced by the increase in citizen participation. Voters who wear both a regional and a municipal hat tend to be impatient with bureaucratic battles.
New Policy Developments
At the central government level very recently (in 2000/2001), in the Fifth Report on Spatial Planning, the Dutch government has introduced a spatial policy that will foster network-cities as a means to attract urbanites and suburbanites to old and new urban centers by a combination of improved accessibility and more attractive urban environments.
To support urban concentration and enlarge differentiation between urban and rural areas, the central government also proposes a system of “red” and “green” contours that have a similar aim as Oregon’s urban growth boundaries.
To support this land use policy, the Dutch government has announced a “fundamental” review of the Act on Spatial Planning as well as a set of renewed and new legal rules to regulate the land market in the Netherlands.
Recommendations:
1. The Central Bureau of Statistics develop uniform standards for designating urban/metropolitan regions, based substantially on labor force commuting patterns, and officially designate such regions throughout the Netherlands. The delineation of metropolitan regions should be professionally revised periodically, based on clearly established criteria.
2. As an emerging continental entity, the European Union should develop and adopt uniform standards for collection of basic statistical information in all member countries so that Eurostat can become the equivalent of the U.S. Bureau of the Census.
3. Big City Policy will not be effective if it is considered as an “inside game” only. Big City Policy must always been planned in its regional context, appropriate policies and programs applied to the region outside the Big City –the Outside Game- are equally
INSIDE GAME/OUTSIDE GAME
96
essential for the success of the Big City Policy.
4. The Dutch government should continue a thorough, in-depth analysis of cause-and-effect of existing rules affecting taxes, subsidies, and regulatory policies with regard to housing, transportation, agriculture, landscape, education and employment on urban development patterns.
5. In preparation of a follow up of the Kaderwet (due in 2003 when this law expires) assessment of best international practice will enlarge the choice of possibilities in the Netherlands. Portland, Oregon and Stockholm County, Sweden may be stimulating examples.
6. As farmland is more threatened than nature reserves because farming seems to be a “normal” economic activity, special care should be given to farmland conservation as an essential part of the urban landscape. Urban Growth Boundaries (UGB) as well as systems of Purchase of Development Rights (PDRs) and Transfer of Development Rights (PDRs) can be effective legal instruments.
7. The long experience of the USA with market-dominated housing policies suggests that, without specific public policies requiring private housing developers to meet certain social objectives, the result will be increased economic segregation of housing markets accompanied by increased ethnic segregation as well. Ongoing immigration asks for deliberate policies to minimize the potential for increased economic and ethnic segregation59.
8. The development of sustainable regional land use plans would benefit from a broader base of citizen participation. A successor law to the Kaderwet in 2003 should establish greater citizen participation as a primary goal. Continuing evolution of Information and Communication technology (ICT) offers further opportunities for informing and engaging citizens in the planning process. This will promote interaction between “living reality” and “cool data”, improving mutual assessment of social reality and social policy.
59 See appendix G for a succesful American example: the Moderately Priced Dwelling Unit Ordinance (Montgomerey County, Maryland).
INSIDE GAME/OUTSIDE GAME
Appendix A: American Continental Government “Rules of the Game”
A more extensive discussion of direct federal “rules of the game” follows:
Low-cost home mortgages: During the Great Depression, the New Deal- created the Federal Housing Administration (FHA) in an effort to stabilize, and then expand homeownership. Through FHA and related banking legislation, the federal government created the modern mortgage financing system. Also, the Servicemen’s Readjustment Act of 1944, or the “GI Bill of Rights,” empowered the Veterans Administration (VA) to help 14 million veterans of World War II, Korea, Vietnam, and the Cold War to buy homes.
By the early 1950s, the FHA and VA were insuring half the mortgages in America and accounted for one-third of all new housing starts. By 1996 the FHA and VA were insuring just 20 percent of the home mortgage market, but the amount of outstanding mortgage loans insured was still massive; the FHA’s mortgage portfolio was $423 billion, while mortgages guaranteed by the VA topped $212 billion. Such a program inherently favored newer suburbs, with their predominantly single-family homes, over older cities, with their much higher percentage of rental housing.60
Secondary Mortgage Market: Beginning in 1938, the federal government chartered “Fannie Mae,”(a quasi-private corporation, stockholder-owned and federally regulated), “Freddie Mac” (owned by the nation’s private savings and loan associations) and “Ginnie Mae,” (an agency guaranteeing mortgages from various federal housing subsidy programs). They created a secondary mortgage market to bridge regional imbalances between money supply and mortgage demand. By the 1970s they had perfected the marketing of “mortgage-backed securities.” They would package tens of thousands of FHA, VA, and conventional mortgages as collateral for bonds sold on Wall Street.
The financial impact of these federally chartered mortgage pools (GSEs) was even greater than the FHA and VA backing of private lenders. In 1995 the total value of Fannie Mae, Freddie Mac, and Ginnie Mae’s mortgage portfolios was $1.8 trillion. The avalanche of mortgage money from the secondary mortgage market gave further impetus to suburban development.61 Through FHA,
60 The FHA and VA made the members of the white working class and middle class an offer they could not refuse. In 1934 the FHA began by requiring a 20 percent down payment and single-digit interest mortgages for 25 or 30 years. (Prior to federal government reorganization of the mortgage market, private lenders’ terms had typically been 50% down and a 5- or 10-year, high interest loan.) By the early 1950s, the FHA required only 5 percent down. The VA went FHA one step better, requiring no down payment. The blatantly discriminatory way the federal agencies administered the program will be discussed in the next part of the report.
61 By contrast, in 1995, direct federal subsidies for low-income households through the US Department of Housing and Urban Development (HUD) totaled less than $26 billion. One-third subsidized 1.4 million units in public housing projects and two-thirds paid various forms of rent subsidies for low-income households in private apartments. Attributing an amortized value to the public housing inventory would
INSIDE GAME/OUTSIDE GAME
VA, and the GSEs, the federal government provides about forty times more support for suburban-oriented, middle-income homeownership than it does for largely city-based, lower-income rental housing.
Pro-home owner tax policies: Since 1913, taxpayers have been able to deduct home mortgage interest against their tax liability. (No such tax offsets are provided for apartment renters.) For fiscal year 1999 the annual value of the mortgage interest deduction was estimated to be $54.4 billion in tax breaks for 40 million homeowners. This “tax expenditure” is the federal government’s sixth largest expenditure after social security payments, national defense, interest paid on the national debt, and health insurance for the elderly and the poor.
Interstate highways: In launching the National Interstate and Defense Highway System in 1956, the federal government permanently reshaped metropolitan America. From 1956 to the mid-1990s, when the 54,714-mile interstate highway system was nearing completion, the federal government spent a total of $750 billion (in 2000 dollars) on highway aid. (The money was provided by the fuel tax-funded Highway Trust Fund, the only major tax legally restricted to highway construction among Western counties.) Over half of the funds had gone into building 22,134 miles of new highways within metropolitan areas. This fostered the vast decentralization of the country’s urban centers.62
Federal environmental protection: Since 1956 the federal government has provided $145 billion (in 2000 dollars) in grants to state and local governments for new sewage treatment plants and major sewer lines. Much of the money (perhaps one-third) has been spent not to remedy old problems but to provide new capacity to support new suburban growth. The federal grants have covered 75 percent of the costs of waste treatment plants, thus creating heavy subsidies for new development.
Failure to meet federal Clean Air Act (1968) standards bore down most heavily on older, industrial regions whose out-dated, coal-fired factories and power plants were major “point source” air polluters. With little regard for its impact on other public policy goals (such as job creation in high-poverty regions), the federal Environment Protection Agency (EPA) prohibited location of new industries in regional “non-attainment areas.” EPA’s impact on cities was even more severe when the agency would find harmful industrial pollutants embedded in the soil of abandoned industrial sites (“brownfields”). Federal Superfund grants to help clean up the most polluted “brownfields” were rarely sufficient to offset the attractiveness to industry of locating new facilities in suburban “greenfields.”
raise the federal government’s annual support of low-income rental housing to about $60 billion.
62 By contrast, under the Urban Mass Transit Act of 1964, federal aid to public bus and subway systems, which tend to promote greater centralization, totaled only $95 billion (in 2000 dollars). Federal transportation policy, in effect, channeled almost eight times more money into suburban sprawl than into helping maintain more compact urban centers.
INSIDE GAME/OUTSIDE GAME
Appendix B: History of the European Union
For readers who are not familiar with the EU, we offer this brief history.
From Common Market to European Union: The European integration process started in the early 1950s. In the years following World War Two, the conviction grew that cooperation between the European nation states would be beneficial to the European economies and would also diminish the chance of new battlefields in Europe.
The six countries that started the European Community for Coal and Steel in 1952 were France, West Germany, Italy and the three Low Countries (Belgium, Luxembourg and the Netherlands). In 1958, with the Treaties of Rome, the European Economic Community was formed. Its goals were to create a common market and customs union.
From 1970 onwards, plans were initiated for a European monetary union, but the difficult economic situation of the 1970s and 1980s caused these plans not to be realized for many years.
In the meantime, in the 1970s the European Community welcomed the United Kingdom, Denmark and Ireland as new members, and in the 1980s the southern nations of Greece, Portugal, and Spain.
The Treaty of Maastricht (1992) formally launched the European Union (EU), which brought all other existing bodies for continental collaboration under its umbrella. The final stage of the European Monetary Union will be reached in 2002, when the euro will be introduced as the new currency in the twelve member states which have joined the monetary union up to now.
In 1995 Sweden, Finland and Austria joined the EU, raising the EU’s membership to 15. The biggest current issue within the EU is how to extend membership to Central and Eastern European states. When completed, this will make the common market grow by one third.
INSIDE GAME/OUTSIDE GAME
Appendix C: Decline of Annexation in the USA
Throughout the South and West, at mid-century, city officials could reasonably expect that annexation and mergers would continue to protect “elastic” cities’ predominance as quasi-regional governments. They often had other tools available to shape development patterns. Many cities owned and operated regional water and sewage treatment systems; some exercised extraterritorial planning jurisdiction. With such powers, most southern and western elastic cities expected to successfully maintain their “market share” of regional development.
By the 1990s, highway-driven reality had proven the elastic cities wrong. The highway system decentralized America’s metropolitan areas so rapidly that almost no city’s annexation or merger efforts were able to keep pace.
Between 1960 and 1990 the USA’s 50 most annexation-minded central cities increased their municipalities by an average of almost 400 square kilometers, or 228 percent! Yet despite tripling their municipal territory, the cities’ share of urbanized population fell from 65 percent in 1960 to 51 percent in 1990 and their share of metropolitan population declined from 60 percent in 1960 to 43 percent in the same period.
Over the three decades, only nine cities (Anchorage, Jacksonville, Nashville, Lexington, Columbus GA, Colorado Springs, San Jose, Bakersfield, and Fresno) increased their market shares of both urbanized and metropolitan populations. However, the high water mark for consolidated city-county governments peaked upon consolidation. During the 1980s Jacksonville, Indianapolis, Nashville, Lexington, and Columbus GA experienced slower population growth than surrounding counties.
INSIDE GAME/OUTSIDE GAME
Appendix D: The Oregon Land Use Law
The Oregon Land Use Act dramatically reduced local government autonomy over land-use decisions in order to achieve statewide growth management policies. To understand why Oregon’s program is effective, one must understand the legal and administrative structures that the Act put in place.63
The Act’s most important action was to create a new citizen commission, the Land Conservation and Development Commission (LCDC), to oversee the planning program. The LCDC is composed of seven private citizens appointed by the governor, subject to state senate confirmation, to serve staggered four-year terms without pay. The Act also established a new state agency, the Department of Land Conservation and Development, as LCDC’s staff.
The Act required Oregon’s 36 counties and 242 cities to adopt new comprehensive land use plans that were consistent with statewide planning goals (state goals). The local plans were to be implemented by local land use regulations (e.g. zoning, procedural regulations, etc.) that must be promulgated in compliance with the state goals. Thus, land use planning in Oregon was no longer advisory, but became an integrated hierarchy of legally binding state goals, local plans, and local regulations.
State Goals: In 1974 the LCDC adopted 14 statewide goals as the framework for comprehensive plans for all cities and counties. The statewide goals’ titles give a good impression of the breadth of Oregon’s land use objectives: Goal 1 – Citizen Involvement; Goal 2 – Land Use Planning; Goal 3- Agricultural Lands; Goal 4 – Forest Lands; Goal 5 – Open Spaces; Scenic and Historic Areas, and Natural Resources; Goal 6 – Air, Water, and Land Resources Quality; Goal 7 – Areas Subject to Natural Disasters and Hazards; Goal 8 – Recreational Needs; Goal 9 – Economy of the State; Goal 10 – Housing; Goal 11 – Public Facilities and Services; Goal 12 – Transportation; Goal 13 – Energy Conservation; and Goal 14 – Urbanization. Three state goals are of special significance for this report:
Goal 14 – Urbanization - created Oregon’s urban containment policy. Goal 14 required every city (an incorporated community) to establish an Urban Growth Boundary (UGB), which contains the urban core and sufficient undeveloped land to accommodate growth during a 20-year planning period. Urban uses such as residential subdivisions, shopping malls, and factories are generally not allowed outside of UGBs on rural land protected for farming and forestry, and even on rural land no longer suitable for farm or forest uses due to prior scattered development or the land’s inherent non-productivity.
63 The source of this summary is Robert L. Liberty, ‘Oregon’s Comprehensive Growth Management Program: An Implementation Review and Lessons for Other States” in Environmental Law Reporter News & Analysis (June 1992).

INSIDE GAME/OUTSIDE GAME
By the Act itself, each county was made responsible for coordinating all planning activities affecting land uses within the county, including those of the county, cities, special districts, and state agencies. The Act also authorized forming regional planning agencies, if approved by voters, to exercise counties’ authority.
Thus, Goal 14 created a new tool of urban containment (UGBs) to be planned and implemented within the context of countywide or region-wide comprehensive land use plans.
Goal 10 – Housing – required that local comprehensive plans must “encourage the availability of adequate numbers of housing units at price ranges and rent levels which are commensurate with the financial capabilities of Oregon households and allow for flexibility of housing location type and density.” Although written in broad strokes, this general directive was implemented through detailed statutes and regulations. LCDC regulations prevented cities and counties from prohibiting multifamily, manufactured, renter occupied, or government-assisted housing, or impose special conditions that would discourage “needed housing” through unreasonable cost or delay. Indeed, when the need was shown for additional low-income housing within a UGB, all local governments were required to permit its construction
Goal 3 – Agricultural Lands – defined “agricultural land” and mandated its protection by exclusive farm use (EFU) zoning. In addition, LCDC regulated how agricultural land may be partitioned and conferred property tax benefits on lands protected for farm use. The thrust of EFU zoning was to limit the uses and structures allowed in the zone to farming and closely related activities and structures. Conspicuously absent from the list of permitted uses was any general authorization of houses, whether in subdivisions or individual residences on preexisting parcels.
LCDC Approval of Local Plans: Once local governments adopted new comprehensive plans, or modified existing plans to comply with the state goals, LCDC began reviewing each proposed county plan (and its incorporated city plans) to determine whether it properly implemented the state goals. The process was complex, involving constant interaction among LCDC staff, the local government, citizens, and other interested parties, including other state agencies. Finally, after a public hearing, LCDC could “acknowledge” that the entire plan complied with the state goals (i.e. approve the plan), acknowledge certain provisions or geographic areas while continuing the review of the remaining provisions or areas, or reject the plan in its entirety.64 The LCDC’s decision, which became a final agency order complete with findings of fact and legal analysis, could be appealed to the Oregon Court of Appeals.
64 In a similar fashion, LCDC reviews and “certifies” or rejects other state agency plans that have land use impacts. By the end of 1990, nearly two decades after passage of the Land Use Act, the LCDC had certified 20 out of 27 state agencies’ land use plans. LCDC maintained similar interim powers over state agency plans that it had over local government plans.
INSIDE GAME/OUTSIDE GAME
The process of reviewing and revising city and county comprehensive plans was more arduous than program advocates had anticipated. Many counties had to revise and resubmit their plan to the LCDC three and four times. The last comprehensive plans were not approved until 1986, more than 12 years after the first 14 state goals were adopted. The legislature originally contemplated that the plan approval process would take only one or two years.
In the interim, the law required that virtually all land use decisions made by local governments had to comply with state goals until a final, LCDC-acknowledged plan was in effect. The LCDC was also empowered to force recalcitrant local governments and state agencies to proceed with their planning responsibilities and to comply with state goals. LCDC could suspend a local government’s authority to issue building permits or to approve subdivisions in areas likely to be preserved for farm or forest uses. LCDC could also force a local government to issue building permits and allow subdivisions in urban areas where the local governments opposed the higher densities required. Further, the LCDC could block distribution of certain state tax revenues to a local government.
After all local plans were approved by the LCDC, the LCDC continued to play an important, if diminished role. LCDC continued to review local plan amendments and, if necessary, could challenge a local government’s decision in state courts. Cities and counties were to undergo the first periodic review of acknowledged plans and land use regulations within two to five years of initial acknowledgement and every four to ten years thereafter. Like acknowledgement review, periodic reviews have taken far longer than originally contemplated.
The Board of Appeals: In 1982 the legislature established the Oregon Land Use Board of Appeals (LUBA). This shifted the process for appealing city and county land use decisions from the state courts to a quasi-judicial, administrative body. This action substantially shortened the time and reduced the expense of the appellate process. Oregon’s system of appellate review for local land use decisions is one of the Oregon system’s most distinctive features.
LUBA is made up of three full-time lawyer “referees,” appointed by the governor and confirmed by the state senate. LUBA’s jurisdiction includes all appeals on land use decisions made by cities, counties, and regional governments. LUBA’s mandate is to reverse (or to remand) city, county, and regional land use decisions that violate the local comprehensive plan, or the state goals, when applicable. Moreover, LUBA may stay local actions, pending its decisions on the merits. Oregon’s circuit courts retain the authority to grant declaratory, injunctive, or mandatory relief and enforcement orders to secure compliance with the local comprehensive plan or LUBA’s orders.
LUBA receives about 200-300 appeals per year. Most appeals involve individual permits, many concerning permits for uses inside urban growth boundaries. Neighbors have filed a majority of the appeals. LUBA reverses or remands local government decisions in slightly more than half of the decisions, with the rest affirmed or the appeal dismissed. The LUBA appeals process takes about half the time (and much less expense) than going through the court system.
Thus, by state legislation, Oregon has built a system that maintains the responsibility for land use planning and regulation at the local government level. However, all local government planning

INSIDE GAME/OUTSIDE GAME
and zoning actions must be carried out within a regional context (i.e. countywide or multi-county). Furthermore, all local government plans and actions must conform to state goals. A strong, new state agency (LCDC) was created by the legislature to define state goals, to review, approve or reject local plans, and to monitor on-going implementation; LCDC’s powers also extended to land use planning impacts of other state agencies’ programs as well.
INSIDE GAME/OUTSIDE GAME
Appendix E: The History of Portland METRO
In the rest of Oregon, county government had the coordinating role. In metropolitan Portland, however, the officials who manage the overall growth process are directly accountable to all area residents through METRO, the nation’s only directly elected regional government. METRO is a state-charted regional government that covers all of Multnomah County, the city of Portland and 23 other municipalities, and parts of Clackamas and Washington Counties. The region’s voters elect the seven-member METRO Council and METRO executive officer.
During the 1950s, as urban sprawl accelerated, political wars raged over Portland’s aggressive annexation efforts. Suburban subdivisions struggled to incorporate as a defense against “big city” annexation.
To bring order out of chaotic local governance, a coalition of business and civic organizations persuaded the legislature to establish the Portland Metropolitan Study Commission. Its recommendations ultimately transformed regional governance. The study commission first helped organize a voluntary Columbia Region Council of Governments (CRAG) in 1969. It also persuaded the legislature to set up two other regional bodies: the Local Government Boundary Commission (1969) and the Metropolitan Service District (1970).
From the outset CRAG was embroiled in controversy and frustration. Its original membership was composed of officials representing four counties and fourteen cities. Over the years the governing board mushroomed to delegates from five counties and thirty-one member cities. All had co-equal status. Though CRAG had a good professional staff, it had neither the authority nor the ability to forge a consensus around difficult regional policy issues. CRAG board members were torn between what was good for the region and what would protect their own constituents from unwanted costs, programs, or development. Thus, CRAG acted only on the easy issues, meaning that member jurisdictions thought that they had nothing to lose. In short, CRAG had all the virtues and defects of some 600 voluntary councils of government scattered across the nation today.
The Metropolitan Services District (MSD), on the other hand, proved to be a more promising regional initiative. The MSD was created by the Oregon legislature as a “metropolitan municipality of greater Portland,” covering Multnomah, Clackamas, and Washington Counties. MSD did not supplant county government or any of the 24 municipalities. It was only an “empty box” to be filled by whatever duties the legislature or the voters approved for it.
In May 1970 the region’s voters swept aside the mayor of Portland’s implacable opposition and activated the MSD by a 54 to 46 margin. A seven-member board of local elected officials from Portland, the three counties, and three other cities initially governed it.
MSD’s first project – planning a regional solid waste disposal system – was financed by a small tax on used auto tires. In 1976, with Portland’s agreement and voter approval, MSD took over the Washington Park Zoo. (In 1986 the region’s voters approved a $65 million bond issue for the
INSIDE GAME/OUTSIDE GAME
Oregon Convention Center, which the MSD would plan, build, and run.)
In 1977 the Oregon legislature injected more direct democracy into the MSD. The state lawmakers shelved having MSD governed by elected officials from member counties and cities in favor of having the region’s voters elect a twelve-member board and an executive officer for four year, staggered terms. The legislature also gave MSD broader taxing authority (but only with voter approval).
In May 1978 the region’s voters approved the revised MSD by a 55 to 45 margin. In the bargain, the voters abolished CRAG. The newly democratized MSD took over CRAG’s regional planning role, including overseeing Oregon’s growth management program for the three-county Portland area. Buttressed by an advisory council of local officials, MSD also took over planning for federal transportation funds (a role that was to become much more powerful in the 1990s) By 1979 the LCDC formally “acknowledged” the regional Urban Growth Boundary. Drawn up by the MSD. The boundary line was based on CRAG staff work begun five years earlier.
In 1990, an amendment to the Oregon constitution allowed the MSD to have its own home rule charter. Drawn up by citizens’ charter commission, the document was approved by area voters in November 1992. The structural changes provided in MSD’s home rule charter – now officially called “METRO” – were minimal; the council was reduced from twelve members to seven (all elected from seven districts into which the region was divided). METRO’s state-conferred growth management powers received a resounding endorsement from local voters. In the new charter the voters affirmed that regional planning would be METRO’s “primary” function.
Thus, the long evolution of METRO was shaped not just from “on high” (by the legislature) but by grassroots democracy. Regional voters have approved METRO’s development at five different organizational stages. Since 1978, regional voters have gone to the polls every two years (twelve times) to elect METRO council members and (every fourth year) the METRO executive officer. During METRO elections, candidates must argue about regional land use planning and regional transportation issues. (There are hardly any elections in America where such key regional issues are the focal point.)
METRO's democratic credentials shape its approach to its planning responsibilities. For example, when METRO was considering expanding the Urban Growth Boundary in the mid-1990s, it held 182 public meetings with local government officials and citizens. To supplement these presentations, METRO produced a video and made it available through area Blockbuster Video stores and libraries. (Copies were taken out over 8,000 times.) It mailed a tabloid and questionnaire, featuring multicolored maps of the alternative concepts, to all 550,000 households in the Portland area. More than 17,000 questionnaires were mailed back, 10,000 with additional written comments beyond the choices checked off on the questionnaires.
Far from being a technocrat-dominated bureaucracy, Portland METRO is deeply committed to carrying out state Goal 1 – “to insure the opportunity for citizens to be involved in all phases of the planning process.”
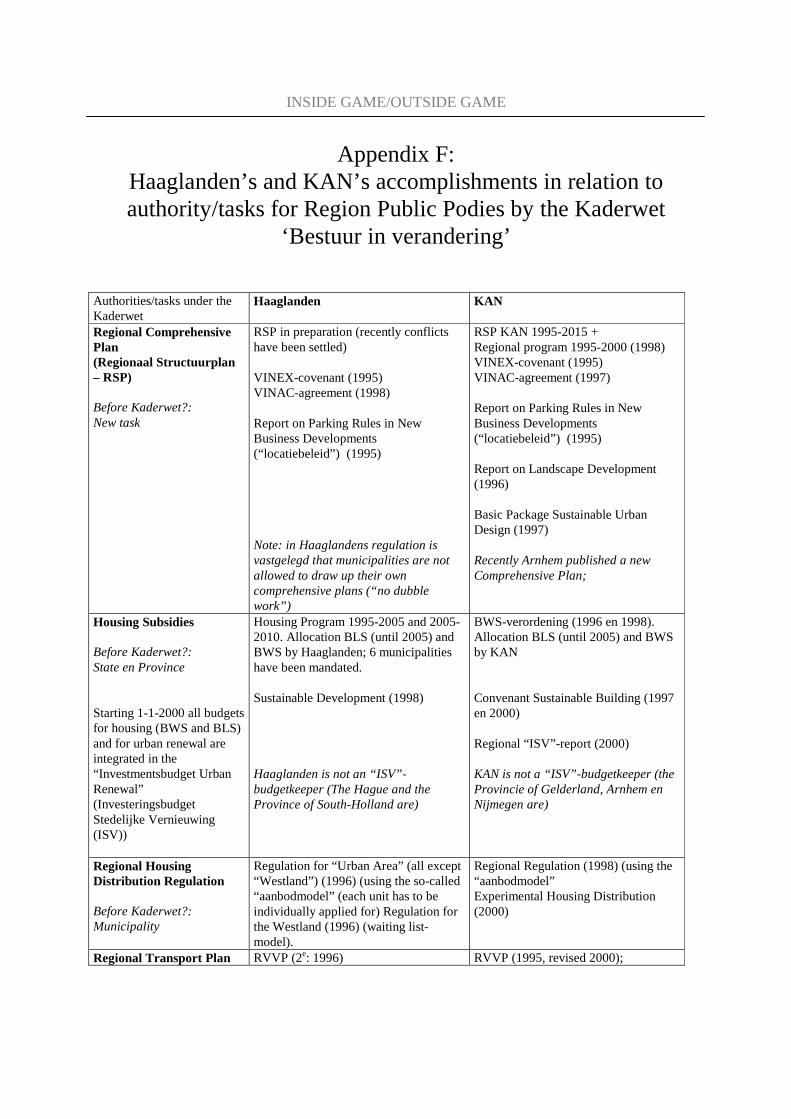
INSIDE GAME/OUTSIDE GAME
Appendix F: Haaglanden’s and KAN’s accomplishments in relation to authority/tasks for Region Public Podies by the Kaderwet
‘Bestuur in verandering’
Authorities/tasks under the Kaderwet
Haaglanden KAN
Regional Comprehensive Plan (Regionaal Structuurplan – RSP) Before Kaderwet?: New task
RSP in preparation (recently conflicts have been settled) VINEX-covenant (1995) VINAC-agreement (1998) Report on Parking Rules in New Business Developments (“locatiebeleid”) (1995) Note: in Haaglandens regulation is vastgelegd that municipalities are not allowed to draw up their own comprehensive plans (“no dubble work”)
RSP KAN 1995-2015 + Regional program 1995-2000 (1998) VINEX-covenant (1995) VINAC-agreement (1997) Report on Parking Rules in New Business Developments (“locatiebeleid”) (1995) Report on Landscape Development (1996) Basic Package Sustainable Urban Design (1997) Recently Arnhem published a new Comprehensive Plan;
Housing Subsidies Before Kaderwet?: State en Province Starting 1-1-2000 all budgets for housing (BWS and BLS) and for urban renewal are integrated in the “Investmentsbudget Urban Renewal” (Investeringsbudget Stedelijke Vernieuwing (ISV))
Housing Program 1995-2005 and 2005-2010. Allocation BLS (until 2005) and BWS by Haaglanden; 6 municipalities have been mandated. Sustainable Development (1998) Haaglanden is not an “ISV”- budgetkeeper (The Hague and the Province of South-Holland are)
BWS-verordening (1996 en 1998). Allocation BLS (until 2005) and BWS by KAN Convenant Sustainable Building (1997 en 2000) Regional “ISV”-report (2000) KAN is not a “ISV”-budgetkeeper (the Provincie of Gelderland, Arnhem en Nijmegen are)
Regional Housing Distribution Regulation Before Kaderwet?: Municipality
Regulation for “Urban Area” (all except “Westland”) (1996) (using the so-called “aanbodmodel” (each unit has to be individually applied for) Regulation for the Westland (1996) (waiting list-model).
Regional Regulation (1998) (using the “aanbodmodel” Experimental Housing Distribution (2000)
Regional Transport Plan RVVP (2e: 1996) RVVP (1995, revised 2000);
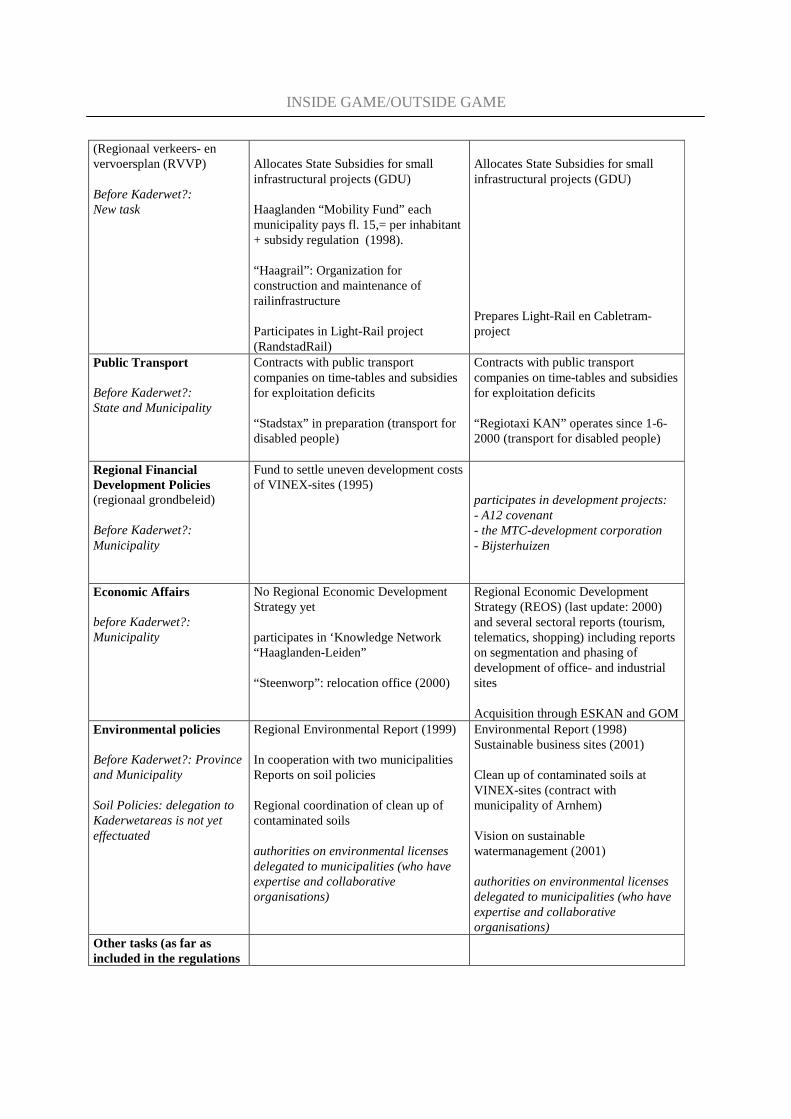
INSIDE GAME/OUTSIDE GAME
(Regionaal verkeers- en vervoersplan (RVVP) Before Kaderwet?: New task
Allocates State Subsidies for small infrastructural projects (GDU) Haaglanden “Mobility Fund” each municipality pays fl. 15,= per inhabitant + subsidy regulation (1998). “Haagrail”: Organization for construction and maintenance of railinfrastructure Participates in Light-Rail project (RandstadRail)
Allocates State Subsidies for small infrastructural projects (GDU) Prepares Light-Rail en Cabletram-project
Public Transport Before Kaderwet?: State and Municipality
Contracts with public transport companies on time-tables and subsidies for exploitation deficits “Stadstax” in preparation (transport for disabled people)
Contracts with public transport companies on time-tables and subsidies for exploitation deficits “Regiotaxi KAN” operates since 1-6-2000 (transport for disabled people)
Regional Financial Development Policies (regionaal grondbeleid) Before Kaderwet?: Municipality
Fund to settle uneven development costs of VINEX-sites (1995)
participates in development projects: - A12 covenant - the MTC-development corporation - Bijsterhuizen
Economic Affairs before Kaderwet?: Municipality
No Regional Economic Development Strategy yet participates in ‘Knowledge Network “Haaglanden-Leiden” “Steenworp”: relocation office (2000)
Regional Economic Development Strategy (REOS) (last update: 2000) and several sectoral reports (tourism, telematics, shopping) including reports on segmentation and phasing of development of office- and industrial sites Acquisition through ESKAN and GOM
Environmental policies Before Kaderwet?: Province and Municipality Soil Policies: delegation to Kaderwetareas is not yet effectuated
Regional Environmental Report (1999) In cooperation with two municipalities Reports on soil policies Regional coordination of clean up of contaminated soils authorities on environmental licenses delegated to municipalities (who have expertise and collaborative organisations)
Environmental Report (1998) Sustainable business sites (2001) Clean up of contaminated soils at VINEX-sites (contract with municipality of Arnhem) Vision on sustainable watermanagement (2001) authorities on environmental licenses delegated to municipalities (who have expertise and collaborative organisations)
Other tasks (as far as included in the regulations
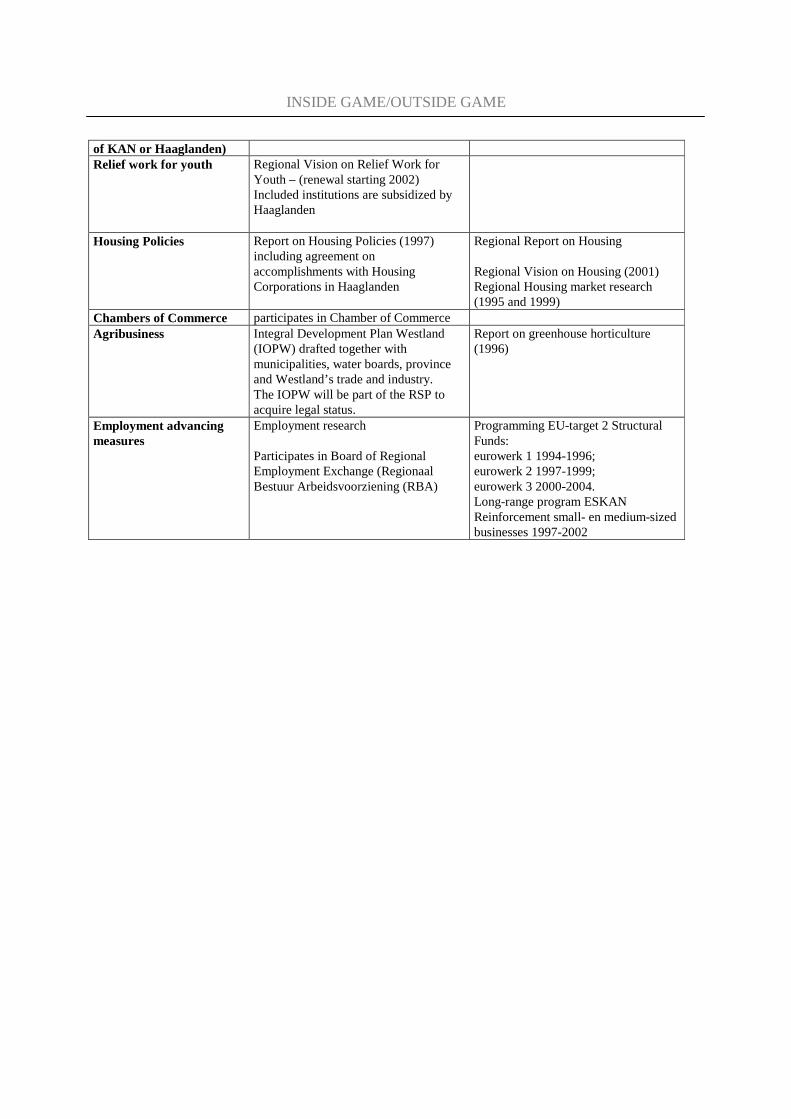
INSIDE GAME/OUTSIDE GAME
of KAN or Haaglanden) Relief work for youth Regional Vision on Relief Work for
Youth – (renewal starting 2002) Included institutions are subsidized by Haaglanden
Housing Policies Report on Housing Policies (1997) including agreement on accomplishments with Housing Corporations in Haaglanden
Regional Report on Housing Regional Vision on Housing (2001) Regional Housing market research (1995 and 1999)
Chambers of Commerce participates in Chamber of Commerce Agribusiness Integral Development Plan Westland
(IOPW) drafted together with municipalities, water boards, province and Westland’s trade and industry. The IOPW will be part of the RSP to acquire legal status.
Report on greenhouse horticulture (1996)
Employment advancing measures
Employment research Participates in Board of Regional Employment Exchange (Regionaal Bestuur Arbeidsvoorziening (RBA)
Programming EU-target 2 Structural Funds: eurowerk 1 1994-1996; eurowerk 2 1997-1999; eurowerk 3 2000-2004. Long-range program ESKAN Reinforcement small- en medium-sized businesses 1997-2002
INSIDE GAME/OUTSIDE GAME
Appendix G: Montgomery County, Maryland’s Moderately Priced Dwelling
Unit (MPDU) Ordinance
The USA's model for success in assuring economically integrated housing though the private sector market is Montgomery County, Maryland’s Moderately Priced Dwelling Unit (MPDU) law.
Since 1973, Montgomery County has required that in all new developments of at least 50 homes, at least 15 percent of the dwellings must be affordable for modest-income households (that is, those in the lowest third of the income scale). Furthermore, the county's public housing agency, the Housing Opportunities Commission, has the legal right to buy one-third of the affordable housing---or, in effect, 5 percent of the new homes built.
If you want to be a homebuilder in Montgomery County, you must play by these rules. As a result, the private sector has produced 11,000 moderately priced dwelling units (MPDUs); the Housing Opportunities Commission has purchased over 1,500 of these, scattered in 220 different subdivisions.
The MPDU rule is profitable for the homebuilder as well. Builders receive up to a 22 percent density bonus above the ceiling allowed by the basic zoning regulations. Furthermore, complying with MPDU requirements allows builders to build townhouses in areas zoned for freestanding single-family houses. When the demand for market-rate housing slumps, Montgomery County's more progressive builders keep their crews busy building MPDUs---for which there is always a market.
In all, through its MPDU policy and other housing initiatives, the Housing Opportunities Commission utilizes about 35,000 homes in mixed-income settings. As a result, with over a quarter of its population being ethnic minorities, Montgomery County is one of the USA’s more ethnically and economically integrated communities.65
65 In 1990, the dissimilarity index for all ethnic minorities was 27 in Montgomery County. The dissimilarity index for the poor was 28.

INSIDE GAME/OUTSIDE GAME

INSIDE GAME/OUTSIDE GAME

INSIDE GAME/OUTSIDE GAME
Colofon
© ABF Strategie
Delft, march 2001
Postbus 2885 2601 CW Delft
tel. 015 2153010