Input-output Table Indonesia, 1971 Volume 1 - WVU ...
145
Accounts and Data IIOA Input Output Archive 5-30-1977 Input-output Table Indonesia, 1971 Volume 1 Input-output Table Indonesia, 1971 Volume 1 M. Abdulmadjid Central Bureau of Statistics, Indonesia Follow this and additional works at: https://researchrepository.wvu.edu/rri_ioacctdata Recommended Citation Recommended Citation Abdulmadjid, M., "Input-output Table Indonesia, 1971 Volume 1" (1977). Accounts and Data. 20. https://researchrepository.wvu.edu/rri_ioacctdata/20 This Article is brought to you for free and open access by the IIOA Input Output Archive at The Research Repository @ WVU. It has been accepted for inclusion in Accounts and Data by an authorized administrator of The Research Repository @ WVU. For more information, please contact [email protected].
-
Upload
khangminh22 -
Category
Documents
-
view
2 -
download
0
Transcript of Input-output Table Indonesia, 1971 Volume 1 - WVU ...

Accounts and Data IIOA Input Output Archive
5-30-1977
Input-output Table Indonesia, 1971 Volume 1 Input-output Table Indonesia, 1971 Volume 1
M. Abdulmadjid Central Bureau of Statistics, Indonesia
Follow this and additional works at: https://researchrepository.wvu.edu/rri_ioacctdata
Recommended Citation Recommended Citation Abdulmadjid, M., "Input-output Table Indonesia, 1971 Volume 1" (1977). Accounts and Data. 20. https://researchrepository.wvu.edu/rri_ioacctdata/20
This Article is brought to you for free and open access by the IIOA Input Output Archive at The Research Repository @ WVU. It has been accepted for inclusion in Accounts and Data by an authorized administrator of The Research Repository @ WVU. For more information, please contact [email protected].

--,
INPUT - OUTPUT JOINT RESEARCH PROJECT
INDONESIA, I 971
INPUT-OUTPUT TABLE INDONESIA, 1971
VOLUME I
GENERAL FRAMEWORK
CONCEPTS AND DEFINITIONS
CENTI/AL !:lUl<E.!,U OF STATISflCS BANK INDONESIA
INSTITUTE OF DEVELOPING ECO:S:()l\11ES CENTEI~ FOR SOUTH-EAST ASIAN STLJDil:S, KYODAI
TOKY0,1977

7
PREFACE
Certainly planners, observers and analysts of the Indonesian economy have long desired a more detailed picture of the process of economic activities in this country. The comprehensive data compiled in the 1971 Input-Output Table in the present report will partially serve that purpose.
The arrangement of data in a matrix form in this Input-Output Table reveals the complex inter-relationships of the economic activities of the producers. At the same time it also serves as a tool to see how a change in demand for a given industry's output affects producers. As a system, the Input-Output Table is an integral part of a larger system known as the System of National Accounts.
The completion of the Input-Output Table presented here is an important step forward . It will aid in the economic analysis and projections necessary for development planning, as well as in the evaluation of existing statistical data and their inherent limitations which will serve to develop an overall national statistical system.
A special note of acknowledgement should be made here of the support given by Dr . Arifin M. Siregar (Managing Director, Bank Indonesia) and Mr. Nohoru Kanokogi (President, Institute of Developing Economies, Japan) which has helped make possirle the completion of the present Input-Output Table. In addition, Bank Indonesia and the lnstitut•~ of Developing Economies have given financial aid and the government of Japan through Japan International Cooperation Agency (JICA) has provided technical advisors and equipment.
Finally, thanks are due to many participants from the Indonesian Ministries and other government agencies and from private business circles and to the participants in the Panel Discussion for their contribution of data, comments, and suggestions. They helped make possible the successful completion of the 1971 Input-Output Table of Indonesia accon5ing to schedule.
Jakarta, October 1976 Director General,
Central Bureau of Statistics . Project Manager,
Input-Output Joint Research Project, lndo sia, 1971 .
M.

ACKNOWLEDGEMENTS
On this occasion our thanks are due to the following people participated in this work:
Board of Directors: Nugroho Arifin M. Siregar Noboru Kanokogi Shinichi lchimura
Executive Committee: Sugito Samali T. Budimulia
Paryono ·
Kiyoshi Hasegawa
Shigeru Yamazaki
Nucleus Team: J. Supranto Tjahjani Sudirman Jani Damiri Hartini Hasan Tarkaya D. Subarwa Kusmadi Saleh Mohammad Asta J.S. Adikarta
Data Processing: P.L. Kasenda Payung Surbakti Yuwono Habil Iskandar Harsanto Sahat Manalu Sihar Tobing
(1)
Advisory group from Japan: (a) Theoretical advisor:
Yukio Kaneko
MEMBERS OF THIS PROJECT
Deputy Director General, Central Bureau of Statistics (CBS) Managing Director, Bank Indonesia (BI) President, Institute of Developing Economies (IDE) Director, Center for South-East Asian Studies, Kyoto University (KYODAI)
Director, Bureau of Basic Statistics, CBS Chief, Economics and Statistics Department, BI (until October 1975) Special Assistant to the Governor, BI (at present) Chief, Economics and Statistics Department, BI (from Octobber 1975) Chief, Statistics Division, IDE (until July 1973) Chief, Statistical Planning Office, Ministry of International Trade and Industry (MITI) (at present) Chief, Statistics Division, IDE (from July 1973)
Director, Statistical Education and Training Center, CBS Chief, National Income Division, CBS Chief, Economic Analysis Division, CBS Chief, Price and Financial Statistics Division, CBS National Income Division, CBS National Inco·me Division, CBS National Income Division, CBS General Economics Division, BI
Programmer, Data Processing Center (DPC), CBS Programmer, DPC, CBS Programmer, DPC, CBS Chief, Punching Division, D:'C, CBS Chief, Operation Division, DPC, CBS Junior Programmer, DPC, CBS Junior Programmer, DPC, CUS
Professor, Chuo University
- 8 -

l
t ._·
(b) Technical advisors: i. Long-term assignment:
Shunichi Furukawa Hideo Yamada Seiichi Doi
ii . Short-term assignment: - IDE staff:
Statistics Division, IDE Public Utilities Department, Sendai Bureau, MIT! Statistics Analysis Division, Resea rch and Statistics Department (RSD), MIT!
Shoichi Yamashita Statistics Division, IDE Hiroshi Osada Statistics Division, IDE Jun Nakamura Statistics Division, IDE Takao Sano Statistics Division, IDE - Government Officials through Japan International Cooperation Agency (JICA) (alphabet
cal order) : Keisuke Maeba
Hifumi Mitsuya
Mitsuru Miyata Hideo Nakanishi
Shoo Ohama Tsu tomu Onoda Yasunori Saito Sumito Sato Toshia Suzuki Suketomo Wakamiya Zensaku Yamada
Bank Indonesia: N.A.L. Mailangkay Riyanto
Harsono Henri A. Adriansjah Heru Supraptomo A.J . Susanto Tarekat Ating Rahmat
Central Bureau of Statistics: Azwar Rasjid Sam Suharto Soenardi S.O. Kartono H.P. Marian Hendro Suwandhi Johan Tutuarimo Susilo
Research Division, Minister's Secretariat, Ministry of Agriculture and Forestry Office of Statistical Standards, Administrative Management
I
Agency I Director, Statistics Analysis Division, RSD, MITI , Formally Deputy Director, Statistics Analysis Division, RSD , I MITI Administration Division, RSD, MITI Fourth Statistics Division (Chemical Industry), RSD, MIT! Statistics Analysis Division, RSD, MITI General Coordination Department, Fukuoka Bureau, MIT! Director, Administration Division, RSD, MITI Commercial Statistics Division, RSD, MITI Fourth Statistics Division (Chemical Industry), RSD, MIT!
(2) SUPPORTING MEMBERS
Deputy Chief, Economics and Statistics Department (ESD) Chief, General 'i:.conomics Division (GED), ESD (until Marc 1974) ·chief, GED, ESD (from March 1974) Chief, Monetary Division GED, ESD GED, ESD GED, ESD GED, ESD
Director, Bureau of Research and Development Director, Data Processing Center Director, Bureau of the Census Deputy Director, Bureau of Basic Statistics Chief, Industrial Statistics Di vision Chief, Foreign Trade Statistics Division Chief, Transport & Communic~ition·Statistics Division Chief, S_ocial Statistics Division
-4-
7 7 7 7 7 7 7 7 7 l 7 7 7 7 7 7 7 7 7

Sri Budianti Moh. Hasan Alimudin Sidabalok Urip Subiyanto Rusman Heriawan Tumpal Sitorus Komet Mangiri .
(3)
Chief, National Sample Survey Division Chief, Statistical Education Division National Income Division (NID) Economic Analysis Division NID NID NID
REPRESENTATIVES FROM MINISTRIES AND
OTHER GOVERNMENT AGENCIES
Ministry of Agriculture: Sayuti Yahya Maan Miharta M. Marpaung Bambang Suyoto N.P. Hutabarat
Ministry of Industry: Gatot Pudjantojo Hasan Basri D.
Ministry of ·Mining: Burhanudin Bambang Soepeno Sadeli
Ministry of Trade: S. Sukardjono G. Gultom Samsugiar
Ministry of Communication: Maruli S.
Ministry of Finance: Tjoek Soeroso Bambang Hidayat Sugeng Sumarsono Bambang Irawan
Bureau of Planning Directorate General of Forestry Directorate General of Animal Husbandry Directorate General of Food Crops Directorate General of Estates
Bureau of Planning Bureau of Planning
Directorate General of Mining Directorate General of Petroleum and Natural Gas Pertamina
Bureau of Planning Bureau of Planning Bureau of Planning
Bureau of Planning
Bureau of Planning Bureau of Planning Bureau of Planning Bureau of Planning
Ministry of Public Works and Electric Power: Sutarto Bureau of Planning E.H. Pasaribu Bureau of Planning
(4) PARTICIPANTS IN THE PANEL DISCUSSION ON
THE 1971 INPUT-OUTPUT TABLE
Sugeng Sundjaswadi B.S. Muljana
National Planning Board (BAPPENAS) National Planning Board (BAPPENAS)
- 5 -

Soebekti lndrohadikusumo Kadariyah Kunaryo Sri Edi Swasono M. Arsjad Marsudi Djojodipuro Arief Djanin lrsan Tanjung Anwar Ibrahim Syamsudin Ukardi Johanas Abdurahman Hananto Sigit H.W. Tampubolon Thee Kian Hwie
J.L. Tamba Legho Nirwhono Sidik Mulyono Amien Warsito
National Planning Board (BAPPENAS) • National Planning Board (BAPPENAS)
National Planning Board (BAPPENAS) University of Indonesia Faculty of Economics, University of Indonesia Faculty of Economics, University of Indonesia Ministry of Finance Ministry of Finance Ministry of Industry Ministry of Industry Ministry of Mining Ministry of Communication Central Bureau of Statistics Institute of Indonesian Sciences (UPI) Natforial Institute of Economic and Social Research (LEKNAS), LIPI LEKNAS, LIPI Department of Public Works and Electri ·:: Power National Logistics Board Investment Coordinating Board
I am also grateful to Messrs. Mustangin and Ahmad Azis for taking care of the secretarial and typing work.
Jakarta, October 1976
·::, ,, ...
Director General Central Bureau of Statistics.
Project Manager, Input-Output Joint Research Project,
Indo sia, 1971
M· . "h~
--·
. ;-t i '
,. I
l ;r l
7 l . 7 l l 7 l l 7 l 7 l l l 7 l 7

....
CONTENTS
VOLUME I: GENERAL FRAMEWORK: CONCEPTS AND DEFINITIONS
PREFACE - - - - - · · · · · · · · · · · · · • · · · · · · · · · · · · · · · · · · · · · · · · · · ·........................ /
ACKNOWLEDGEMENTS .............. · .. · · · · · · · · · · · · · · · · · · · · · · · · · · · · · · · · · · · · · · · · · 3
CONTENTS . . ........ · ... · · · · · · · · · · · · · · · · · · · · · · · · · · · · · · · · · · · · · · · · · · · · · · · ........ . 7
CHAPTER I: INTRODUCTION ................................................... . I.I. SUMMARYOFTHE 1971 INPUT-OUTPUTTABLE .................... . I. I. I. Gross Value Added ....................................... . ....... . 1.1.2. Final Demand . . . . . . . . . . . . . . . . . . . . . . . . . . . . . . . . . . . . . . . . . . . . . . . . . . . . I 1.1.3. Imports . . . . . . . . . . . . . . . . . . . . . . . . . . . . . . . . . . . . . . . . . . . . . . . . . . . . . . . . . 2 1.1.4. Exports . . . . . . . . . . . . . . . . . . . . . . . . . . . . . . . . . . . . . . . . . . . . . . . . . . . . . . . . . 2 1.2. ORGANIZATION . . . . . . . . . . . . . . . . . . . . . . . . . . . . . . . . . . . . . . . . . . . . . . . . . 2 1.3. SEQUENCE OF ACTIVITIES . . . . . . . . . . . . . . . . . . . . . . . . . . . . . . . . . . . . . . . . 3
CHAPTER 2: CONCEPTUAL FRAMEWORK OF THE INPUT-OUTPUT TABLE ........... JO 2.1. INTRODUCTION ................................................. JO 2.2. FEATURES OF AN INPUT-OUTPUT TABLE .......................... JO 2.2.1. Transaction Table ..................... : ........................... JO 2.2.2. Transaction Table at Purchaser's Prices and at Producer's Prices . . . . . . . . . . . . . . 11 2.2.3. Economic Units ................................................... 12 2.2.4. Treatment of Imports .............................................. 12 2.3. SECTOR CLASSIFICATION ........................................ 12 2.4. INTERMEDIATE TRANSACTIONS .................................. 13 2.5. FINA.L DEMAND .................................................. 13 2.5.1. Private Consumption Expenditures .................................... 13 2.5.2. Government Consumption Expenditures ................................ 14 2.5.3. Fixed Capital Formation .......... , ................................. 14 2.5.4. Change in Inventories ............... ; .............................. 14 2.5.5. Exports and Imports ................................................ 14 2.6. PRIMARY INPUTS : ........................... ; ................... 14 2.6.1. Wages and Salaries ................................................. 15 2.6.2. Operating Surplus ................................................. 15 2.6.3. Depreciation of Fixed Assets ......................................... 15 2.6.4. Net Indirect Taxes ................................................. 15 2.7. VALUATION ..................................................... 15 2.7.1. Valuation of Domestic Outputs ......... , ............................. 15 2.7.2. Valuation of Exports and Imports ..................................... 15 2.8. DOMESTIC OUTPUT .............................................. 16 2.9. TREATMENT FOR SPECIAL SECTORS ............................... _ 16 2.9.1. Trade and Transport Sectors ......................................... 16 2.9.2. Imputation Method .......... . ... . ...................... . .......... 16 2.10. BY-PRODUCTS, SUBSIDIARY PRODUCTS,
AND SCRAP AND WASTE .......................................... 16 2.10.1. By-Products ..................... , ........................ _ ....... 16 2.10.2. Subsidiary Products . . . . . . . . . . . . . . . . . . . . . . . . . . . . . . . . . . . . . . . . . . . . . . . . 17 2.10.3. Scrap and Waste .................................................. 17 2.10.4. Treatments of By-Products, Subsidiary Products, and Scrap Waste . . . . . . . . . . . . 17 2.11. RELATION BETWEEN THE INPUT-OUTPUT TABLE
AND GROSS DOMESTIC PRODUCT ................................. 18
- 7 -
! • • ' , . : f .. .~ . . .. s- - ' • •• ~ ' ~ :i.. t • • • ..

.j
'
CHAPTER 3: THE SUPPORTING AND ANALYTICAL TABLES ....... . ........... . .. . .. 20 3. 1. INTRODUCTION ..... . ... .. .............. .. ....... . . . . - ... · · · · · · · 20 3.2. TRADE MARGINS AND TRANSPORT COSTS MATRICES . .. ... . ....... 20 3.3. IMPORT MATRIX ................. ....... .... ... .... · · · · · · · · · · · · · 22 3.4. EMPLOYMENT TABLE .. . ................................. · - · ·. · · · 22 3.5 . TABLE ON .TRANSACTIONS OF CAPITAL GOODS . . . . ... .. ... . ....... 23 3.6. INPUT COEFFICIENT TABLES ...... ...... . .. .. ................ .. .. 23 3.7. INVERSE MATRIX ... .. . . ......... . .......... . ........ . ........... 23 3.8. DOMESTIC OUTPUT INDUCED BY EACH FINAL
DEMAND COMPONENT . ....... . .. ... ............ . ........ . .... . .. 25 3.9. IMPORTS INDUCED BY EACH FINAL DEMAND COMPONENT ... . .. ... 26 3.10. TOTAL IMPORT COEFFICIENT .. ... ............ ... ....... . ........ 26 3.11. GROSS VALUE ADDED INDUCED BY EACH FINAL
DEMAND COMPONENT ........... .. .... . ................... ... ... 26 3.12. TOTAL GROSS VALUE ADDED COEFFICIENT ................... . ... 27 3. 13 . EMPLOYMENT INDUCED BY EACH FINAL
DEMAND COMPONENT ........................................ .. . 28 3.14. TOTAL EMPLOYMENT COEFFICIENT .......... .. ..... . ............ 28 3. 15. NET FOREIGN EXCHANGE EARNINGS BY EXPORTS ...... . ......... . 28 3. 16. POWER OF DISPERSION AND DEGREE OF SENSITIVITY ......... . .... 29
CHAPTER 4 : THE STRUCTURE OF THE INDONESIAN ECONOMY .... . ............ .... 30 4. 1. INTRODUCTION ..... . .......................................... . . 30 4.2. SUPPLY AND DEMAND ................................... . .. ..... 30 4.3 . DOMESTIC OUTPUT .............................................. 32 4.4. GROSS VALUE ADDED ... . ..... ... ....... .. ....... ................ 32 4.5. FINAL DEMAND . . ................ ..... ....... .......... .. ... ... .. 34 4.6. EMPLOYMENT . . . . . . . . . . . . . . . . . . . . . . . . . . . . . . . . . . . . . . . . . . . . . . . . . . . 36 4.7. FOREIGN TRADE ................................................ 36 4.7.1. Imports and Exports . ...... ..... .. ......... . . ...... .... . ......... .. 36 4. 7 .2. Net Foreign Exchange Earnings from Exports ...... ·. . . . . . . . . . . . . . . . . . . . . . 39 4.8. IMPACT OF EACH FINAL DEMAND COMPONENT . ...... .. ........... 39 4.9. THE FEATURES OF PRODUCTION SECTORS . ·. • ........ .. ... . .. ....... 40 4.9.1. Intermediate Demand Ratio and Intermediate Input Ratio .................. 40 4.9.2. Total Gross Value Added Coefficients, Total Employment
Coefficients, and Total Import Coefficients .... '· .. .- ........................ 45 4.9.3. Net Foreign Exchange Earning Coefficients by Exports .................... 45 4.9.4. Power of Dispersion and Degree of Sensitivity ..... · ....................... 45
APPENDIX A: SECTOR AND COMMODITY CLASSIFICATION FOR 1971 INPUT -OUTPUT TABLE OF INDONESIA ... .. ...... ... . ....... . ... 53
APPENDIX B: EXPLANATION OF THE SECTORS . ..... .... .... .. .. . .... . . ... ... .. . .. 67 I. INTRODUCTION ..... ......... . .. .. .... .... , ........... . .......... 67 2. AGRICULTURE, LIVESTOCK, FORESTRY AND FISHERIES
( 1-001 to 1-042) ... ..... .. .. ........... .. · . . . ... .... .... ... . .. . . ..... 68 3. MINING AND QUARRYING
(2-043 to 2-054) ............... . ........ ... ....... .. ...... .. ........ 83 4. MANUFACTURING
(3-055 to 3-132) .... .. .. .... ... ..................................... 87 5. ELECTRICITY, GAS AND WATER SUPPLIES
(4-133 and 4-134) ................................................... 104 6. CONSTRUCTION
(5-135 to •5.;J41) ..... ... . ..... .. . · .. .'1 .. · ...... · ....................... 105 7. TRADE, RESTAURANTS AND HOTELS
(6-142 to 6-145) .. ........ .. ...... ; . ...... · ... · .... .. .. · . .............. 107
- 8 -
7 l 7 7 l l 7 7 7 l l 7 7 7 7 7 l 7

......, 8. TRANSPORTATION AND COMMUNICATIONS
( 7 -146 to 7 -15 5) .............. . ... . ................... . .......... . .. I 09 9. FINANCING, RE~L ESTATE, AND BUSINESS SERVICES
(8 -156 to 8-160) ................... .... ........................ . .... I 14
10. SERVICES (9-161109-174) .... .. ....... .. .......................... . .. . . . . . . .. 117
11. VALUE ADDED, FINAL DEMAND, IMPORT, TRADE AND TRANSPORT (201 to 204,301 to 305,401 to 403,501 to 503) .. ... .. . .......... . .... . . . . 122
APPENDIX C: LIST OF REFERENCES ........... ...... ...... ... ... . . . .............. 129

1
VOLUME II: DATA REPORT
CONTENTS . ........ .. ...... . . . .. . ......... .. .. . . . . .. ..... . .. .. ... · · . · · · · · ... . .. · . I
PART I: BASIC TABLES AND SUPPORTING TABLES ... . ..... .... ... . . .. .. .. .. · · · · · · · ·
A-I Transaction Table at Purchaser's Prices (175 Sector Classification) . .. . ..... . . ..... . . . . ..... .. . ...... . . . .. ... . . .. . . • • 3
A-2 Transaction Table at Producer's Prices ( 175 Sector a assification) . . . . . . . . . . . . . . . . . . . . . . . . . . . . . . . . . . . . . . . . . . . . . . . . . . . I 5
A-3 Trade Margin Matrix (I 7 5 Sector Classification) . .. .... . . .... ... ... ... .. . .... . . .. ... . . .. . ... .. .. . . 28
A-4 Transport Cost Matrix (175 Sector Classification) .......... . ...... . . ....... .. . ... . . .. .. . .. .. ... . .. . 34
8- I Transaction Table at Purchaser's Prices (66 Sector Classification) .. . ... . . . . .... ... .. ... .... . ..... . . . .... ... . . . . .... . 40
,.
·t ~- i . 8-2 Transaction Table at Producer's Prices
(66 Sector Classification) ... . . . . ....... .. . . ... . . .... . . . . ..... .... . .... . . . ... 48
8-3 Trade Margin Matrix (66 Sector Classification) ..... . .. . .. . . .. ..... . ........ . ........ .. .. .. . ...... 56
8-4 Transport Cost Matrix (66 Sector Classification) . . ...... . .... . ... .. ... ... .. .. . . . . ........... . .. .. .. 63
8-5 Employment Table (66 and 19 Sector Classification) ... . ........ . ..... .... ... .. . . . . . . ...... . ..... 70
C-1 Transaction Table at Purchaser's Prices ( 19 Sector Classification) ....... . .. .. .... . ....... . ...... . ...... . . ... .. . .... . 72
C-2 Transaction Table at Producer's Prices ( 19 Sector Classification) . . . . . . . . . . . . . . . . . . . . . . . . . . . . . . . . . . . . . . . . . . . . . . . . . . . 72
C-3 Trade Margin Matrix (19 SeJ:tor Classification) . . . . . . . . . . . . . . . . . . . . . . . . . . . . . . . . . . . . . . . . . . . . . . . . . . . 78
C-4 Transport Cost Matrix ( 19 Sector Classification) . . . . . . . . . . . . . . . . . . . . . . . . . . . . . . . . . . . . . . . . . . . . . . . . . . . 78
PART II: ANALYTICAL TABLES ..... . .. . ... . . ..... . ..... ...... ... ... . . . ... .... . . ... 83
A-5 Input Coefficient Table at Purchaser's Prices and at Producer's Prices (175 Sector Classification) ..... .. .......... .. .. . . . .. . .......... . . . .... ... . . . 85
A-6 Domestic Outputs Induced by Each Final Demand Component (175 Sector Classification) . .... . . ... .. . . ... .... . . . : . ...... .. . . .... ... . ... . . . 110
A-7 Imports Induced by Each Final Demand Component (175 Sector Classification) .. . ... .... . . .. ... ..... ........ . . . ... .. . . .. . ...... . 112
8-6 Input Coefficient Table at Purchaser's Prices and at Producer's Prices ( 66 Sector Classification) . . ... . . .. ... . . .. .... . .... . . .. .. ... ....... .. ... ..... 114
8-7 Inverse .Matrix at Producer's Prices: (l-A)- 1
(66 Sector Classification) ..... .. .. .. ... .. ....... .. . . .. .. ... ... ..... . . . .. .... 130
8-8 Inverse Matrix at Producer's Prices: [l-(I-M)AJ-1 (66 Sector: Classification) ........ . ... .. . .. ... .. ...... .. . . .. . ... . .. . . ... ..... 137
- 10 -
7 {
l 7 7 7 7 7 l 7 l 7 l l l 7 l 7 7 7
I
....J B-9 Domestic Outputs Induced by Each Final Demand Component (66 Sector Classification) ........................... . ...... - - - - • • • • • • • • • • • • • 144
8-10 Imports Induced by Each Final Demand Component (66 Sector Classification) ...................................... - - . - - . - - - - · · - 145
B-11 Total Import Coefficient (66 Sector Classification) ................................................... 146
B-12 Gross Value Added Induced by Each Final Demand Component (66 Sector Classification) ............................................. • - - - • .147
B-13 Total Gross Value Added Coefficient (66 Sector Classification) ................................................... 148
B-14 Employment Induced by Each Final Demand Component (66 Sector Classification) ................................................... 149
8-15 Total Employment Coefficient (66 Sector Classification) ................................................... 149
B-16 Net Foreign Exchange Earnings from Exports (66 Sector Classification) ................................................... 150
8-17 Power of Dispersion and Degree of Sensitivity . (66 Sector Classification) ................................................... 150
C-6 Input Coefficient Table at Purchaser's Prices and at Producer's Prices ( 19 Sector Classification) .................................................. -151
C-7 Inverse Matrix at Producer's Prices: (I-A)- 1
(19 Sector Classification) . .. .. .. .. ....... .... .... ..... ....... .... ........ ... 158
C-8 Inverse Matrix at Producer's Prices: f l-(I-M)AJ- 1
(19 Sector Classification) .. ... .... . ...... ... .................... . ...... . ..... 158 C-9 Domestic Outputs Induced by Each Final Demand Component
(19 Sector Classification) ................................................... 160 __, C-10 Imports Induced by Each Final Demand Component
(19 Sector Classification) .. .. ............. ....... ........... ............. .. . 160
C-11 Total Import Coefficient
'---' (19 Sector Classification) ................................................... I 60
C-12 Gross Value Added Induced by Each Final Demand Component
(19 Sector Classification) .. .. ........ ...... .... ..... ............... ......... 161 ...._; C-13 Total Gross Value Added Coefficient
(19 Sector Classification) ...................... ... ..... . ........... . ........ 161
C-14 Employment Induced by Each Final Demand Component
(19 Sector Classification) ....... ... ........ .... ..... ........... .. . . ... .... .. I 62 C-15 Total Employment Coefficient
( 19 Sector Classification) ........................... . ....................... I 62
C- I 6 Net Foreign Exchange Earnings from Exports.
(19 Sector Classification) ................................................... 162
C-17 Power of Dispersion and Degree of Sensitivity
(19 Sector Claddification) .................................................. 162
APPENDIX: SECTOR AND COMMODITY CLASSIFICATION FOR 1971 INPUT-OUTPUT TABLE OF INDONESIA .................. ... ..... ..................... 163
.....,

LIST OF FIGURES AND TABLES
Figure 4.1 : Supply and Demand ( 19 ~ector Classification) .... ... . ... . .... .. . ....... . ...... . .... . . . .. . .. .. . .
Figure 4.2: Gross Value Added and Wages and Salaries ( 19 Sector Oassification) ... . ... . .... .... . ..... . .. . ........ . .. . .. ..... . . .. .
Figure 4.3: Number of Employees by Sector
i 1 I
( 19 Sector Classification) . . . . . . . . . . . . . . . . . . . . . . . . . . . . . . . . . . . . . . . . . . . . . . . . . . :
Figure 4.4: Imports and Exports by Sector ( 19 Sector Oassification) . . . . . . . . . . . . . . . . . . . . . . . . . . . . . . . . . . . . . . . . . . . . . . . . . . 3
Figure 4.5: lllustration . ... .. . .. ... ....... ... ............ .. .... .. .. ..... . .. . . ... .. . . 4
Figure 4.6: Intermediate Input Ratio and Intermediate Demand Ratio (66 Sector Oassification) . ... . ... ... ........ . ... . . . .. .... .. ... ..... . ... . .. . 4
Figure 4.7: Illustration .. ..... . . . .... . ... ..... . ... ...... . . .. . ... . .. . .... . . .... . . .. .. 4 ,
Figure 4.8: Power of Dispersion and Degree of Sensitivity (66 Sector Oassification) . .. .. . .. ... . . ... ........... .. . .. .. .. .. ... . . . .. . . .. 41
Table 2.1: lllustrative Input-Output Table . .... ....... . ........ . .. .. . .. . . .. . .. . . . . . .. . . IC
Table 2.2: Output Transfer Method ... .. ... . ... .. .. .... ... . .. ... . .... . . .. . . . ..... ... . 17
Table 2.3: Negative Input Method · . .. .... . . ... . .... . .. .. . .. .. . ... . .. ..... . .. . . . .. . ... 17
Table 2.4: Input and Output Transfer Method .. .. . .... . . ...... . . . . .... . ..... . .... . ... . . 18
l ' I
l 7 7 7 7 l 7
Table 2.5: Transaction Table at Purchaser's Prices l (5 Sector Classification) . . . . . . . . . . . . . . . . . . . . . . . . . . . . . . . . . . . . . . . . . . . . . . . . . . . 19
Table 2.6: Transaction Table at Producer's Prices (5 Sector Oassification) . . . . . . . . . . . . . . . . . . . . . . . . . . . . . . . . . . . . . . . . . . . . . . . . . . . 19 ·
Table 4.1 : Supply and Demand at Producer's Prices ( 19 Sector Oassification) . ... . .. .. .. . .. ... ...... . .. . ............. ... . .. . .. . 30
Table 4.2: Major Output Sectors (66 Sector Oassification) ..... . .. .. ...... ·.'. · . . . . . .. .. .. ... .. ...... . ... . .... . 32
Table 4.3: Gross Value Added and the Ratio by Sector (19 Sector Oassification) ............... .. .. . . . .. .. . .... ..... ..... . . . . .. . . .. . 3 2
Table 4.4: Major Gross Value Added Sectors (66 Sector Oassification) .. . .. ... . . . .. . . . . . . . . ... . . . .. . . ... . . . . ... . . . .. .. . . 34
Table 4.5 : Value Added by Item ....... .. . ... ... . . . . : . . . .. . ......... . .. . .... ... ..... . 34
Table 4.6: Final Demand by Item . . .. . .. . ....... . .. ... . . ... . .. . ....... . . . . . ... ..... . . 34
Table 4.7: Composition of Final Demand at Purchaser's Prices (19 Sector Oassification) . .. .. .......... .. ...... ...... ...... . .... . ; . ...... . .. 35
Table 4.8 : Composition of Private Consumption Expenditures . · .. . ... . .... . . .. . ... . .... . ... . 35
Table 4.9: Number of Employees by Sector (66 Sector Oassification) ... . . . . .... .... . .. .. ... . ....... .. ... .... . . ........ 36
Table 4.10: Net Foreign Exchange Earnin~ from Exports (66 Sector Oassification) .... .. . . . . .... . . .... ... .. . ... . .. . .. .. .. . ... .. ..... 39
Table 4.11: The Impact of Each Final Demand Component on Output, Imports, Gross Value Added and Employment .. . . . ......... .. .. .. ........ .. ........... 40
-12-
7 7 7 7 7 7 l l l

- : I u
Table 4.12: Intermediate Input Ratio and Intermediate Demand Ratio (66 Sector Classification) .................................................. 41
Table 4. 13 : Value Added Ratio ( 19 and 66 Sector Classification) ............. . . . ............. . .......... ... . 44
Table 4.14: Total Gross Value Added Coefficient, Total Employment Coefficient, and Total Import Coefficient ( 19 Sector Classification) .................................................. 45
Table 4.15 : Power of Dispersion and Degree of Sensitivity (66 Sector Classification) ...... . . .. .. .. . .... ...... ..... . . ... . ....... ....... 46
Chart I : Organization . . . . . . . . . . . . . . . . . . . . . . . . . . . . . . . . . . . . . . . . . . . . . . . . . . . . . . . . . . . 2
Chart 2: Flow Chart of the Compilation Procedure for the Input-Output Table . . . . . . . . . . . . . . . . 5
Chart 3: Example of Trade Margin. and Transport Costs Matrices ......................... 21

CHAPTER 1
INTRODUCTION
On January 22nd, 1973 the "Agreement on a Joint Project of Inter-.lndu'Strial Relations Study in Indonesia" was signed between Indonesia, represented by the Central Bureau of Statistics (CBS) and Bank Indonesia (BO, and Japan, represented by the Institute of Developing Economies (IDE) and Kyoto University's Center for South-East Asian Studies (SEAS). This project is hereafter called the "Input-Output Joint Research Project, Indonesia, 1971 ". For this project both parties agreed to make a joint study of inter-industrial relations of the Indonesian economy in order to compile "The Input-Output Table of Indonesia, 1971". The year 1971 was taken as a base because statistical data in 1971 was considered more complete than in other years. Preparations for this project were commenced by CBS and BI in April 1973.
1.1. SUMMARY OF THE 1971 INPUT-OUTPUT TABLE
The "197f Input-Output ,Table, Indonesia", was compiled in order to present an over-all picture of the Indonesian Economy with emphasis on the transactions of goods and services. In this section, the main findings about gross value added, final demand, and foreign trade are summarized. The detailed explanation and analysis of the findings are given in Chapter 4.
1.1.1. Gross Value Added The 1971 Input-Output Table shows that the Indonesian economy generated 4,270 billion
rupiahs of gross value added: This was composed of 1,495 billion rupiahs (35.0% of the total gross value added) from the agricultural sector, 310 billion rupiahs (7.3%) from the mining and quarrying sector, 517 billion rupiahs (12.1 %) from the manufacturing sector, 196 billion rupiahs (4.6%) from the construction sector, 754 billin rupiahs (17 .6%) .from the trade sector, 329 billion rupiahs (7.7%) from the transport sector, and 669 billion rupiahs (15.7%) from the other sectors. The gross value added was allocated in wages and salaries of 1,246 billion rupiahs (29.2% of total gross value added), in operating surplus of 2,663 billion rupiahs (62.4%), in depreciation of 228 billion rupiahs (5.3%) and in net indirect taxes of 133 billion rupiahs (3.1%).
1.1.2. Final Demand The total •final demand in 1971 amounted to 5,076 billion rupiahs. This consisted of 3,178
billion rupiahs in pri_vate consumption expenditures (62.6% of the total final demand), 323 billion rupiahs of government consumption expenditures (6.4%), 937 billion rupiahs in fixed capital formation (18.5%), 68 billion rupiahs towards a change in inventories ( 1.3%) and 570 billion rupiahs in exports (11.2%). Expressed at purchaser's prices, final demand for output of the agricultural sector was 1,559 billion rupiahs (30.4%), of the mining and quarrying sector 210 billion rupiahs (4.1 %), of tne manufacturing sector 1,735 billion rupiahs (34.2%), of the construction sector 503 billion rupiahs (9.9%), of the transport and communi.cation sector 227 billion rupiahs (4.4%), and of the other sectors 842 billion rupiahs (16.6%). Since these values are given at purchaser's prices, the trade margins and transport costs are, of course, included in each value. In the table at producer's prices the final demand by sector was 1,196 billion rupiahs for the output of the agricultural sector (23.5%), 201 billion rupiahs for the mining and quarrying sector
- 1 -
7
l 7 l 7 7 7 7 7 7 7 7 7 7 7
7 l
(4 .0%), 1,382 billion rupiahs for the manufacturing sector (27.2%), 503 billion rupiahs for the construction sector (9 .9%), 584 billion rupiahs for the commerce sector (I 1.5%), 368 billion rupiahs for the transport and communication sector (7 .2%) and 842 billion rupiahs for the other
sectors (I 6.6%).
1.1.3. Imports Indonesia imported, in 1971, 711 billion rupiahs (at C.I.F. prices) worth of goods and services.
These imports consisted of 22.0 billion rupiahs in agricultural products (3.1 % of the total imports). 3.3 billion rupiahs in mining and quarrying products (0.5%), 622 billion rupiahs in manufactured products (87 .5%), and 64 billion rupiahs in other services (9.0%).
1.1.4. Exports Total export of goods and services in 1971 amounted to 570 billion rupiahs (at F.O.B. prices).
These consisted of 187 billion rupiahs in agricultural products (32.8% of total exports), 192 billion rupiahs in mining and quarrying products (33 .7%), 60 billion rupiahs in manufactured products (10.5%), and 131 billion rupiahs in other services (23.0%).
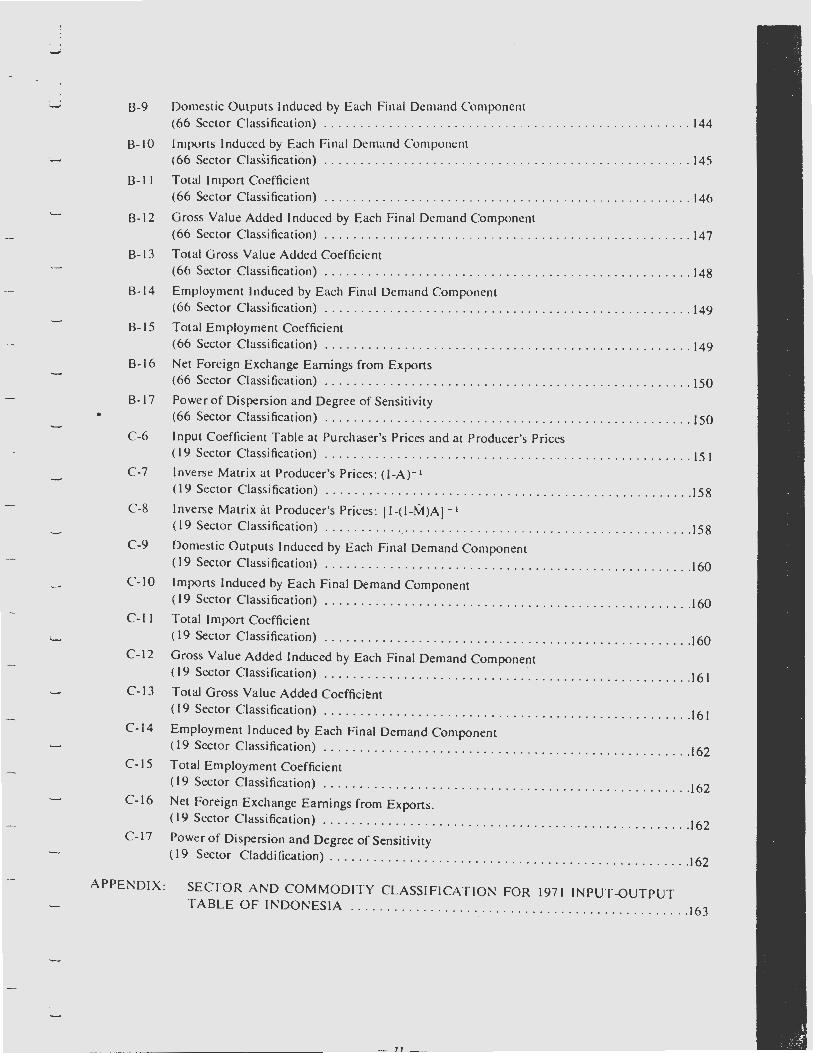
1.2. ORGANIZATION
Many institutes and government agencies assisted in this project by working on the lnput-Out-ut Team. For the actual implementation and day to day activities, a Nucleus Team was set up
la-om officials of CBS and Bl. Other members (outside CBS-BI) contributed to the project by becoming members of the various Sector Teams. Each Sector Team was directly responsible to the Executive Committee. A rough sketch of the organization follows:
Chart 1 Organization
Project Manager
Director General Central Bureau of Statistics
l Board of Directors
,CBS: Deputy, -Director General.CBS
r-- - -------------. HI: Managing Director, BI
Advisor
I -IDE: President, IDE
~ ' Group I SEAS: Director, SEAS, KYODAI.
I 1 I I I I Executive Committee I I I CBS : Chief, Basic Statistics Bureau L-------•
BI: Chief, Economics & Statistics Department IDE: Chief, Statistics Division
l
I s I. -Sector Team ,. I . I Government- Ministries I
B
! ,1 Nucleus Team I ·1 1'
I T
I Japanese Adyisers I
- 2 -

The obligations and responsibilities of the respective posts were:
Project Manager: Board of Directors:
Advisory Group: Executive Committee: Sector Team: Nucleus Team:
responsible for the implementation of the project. establish guidelines, supervise ·general activities of the project, and assist the Project Manager. supply suggestions and advice in the project at all stages. responsible for the daily management of the project. responsible for all research in its respective sector of study . implementation of the technical aspects of the project. .
The Indonesian Government Ministries which were members of the Sector Team, were: The Ministry of Finance, Ministry of Agriculture , Ministry of Trade, Ministry of Industry, Ministry of Transport and Communication, Ministry of Public Works and Electric Power. and Ministry of Mining.
1.3. SEQUENCE OF ACTIVITIES
From the signing of the agreement four years ago until the publication of this report, the following activities had been undertaken:
First Year (April 1973 - March 1974) (I) Preliminary studies (April - June, 1973)
(i) Setting up of a working group whose members were representatives of Indonesian Governmental Ministries and other Agencies. lnntroductory courses were held for this group by the Advisory Group.
(ii) Studies on "The Input-Output Table of Indonesia, 1969", undertaken by LEKN AS (Indonesian side) and SEAS-KYODAI (Japanese side).
(2) Drafting of working manual (July - September, 19731 (i) Drawing up of a working procedure and time schedule for the whole project.
(ii) Taking inventories of related statistical material and information. (iii) Discussion and. determination of concepts, definitions, commodity classification,
and standardization. (3) Compilation of preliminary domestic supply table (October 1973 - March 1974)
(i) Compilation of production statistics. (ii) Compilation of import and export statistics.
(iii) Estimation of domestic supply.
Second Year (April 1974 - March 1975) (I) Evaluation, correction and adjustment of preliminary domestic supply table . (2) Special sample surveys aimed at getting data on input structures, output structures,
trade margins, transport costs, etc.
Third Year (April 1975 - March 1976) (I) Evaluation of special survey results (April-August, 1975) (2) Check surveys (August-September, 1975) (3) Constructing preliminary input-output table from the input point of view (October
1975) (4) Preparatory work for reconciliation (November- December, 1975) (S) Reconciliation (January-March, 1976)
(i) The Input-Output Table at purchaser's prices. (ii) The Input-Output Table at producer's prices.
(iii) Construction of tables on _ trade margins and trarn;port costs. (iv) The construction of aggregated tables (66 and 19 Sector Classifications) .
- 3 -
7
l 7 l l 7 7 l
7 7 7 7 7 7
7 l

Fourth Year (April 1976 - March 1977) (l) Preparation for and implementation of a panel discussion on preliminary results
(April-June ·1976) (i) Drafting the reports and related tables.
(ii) Construction of guideline/key tables. (iii) Comparative studies: the 1971 Input-Output Table versus the 1969 Input-Output
Table (LEKNAS-KYODAI). (iv) First panel discussion (23 June 1976) .
(2) Revisions based on suggestions raised · by the panel discussion (July-September, 1976)
(i) Reclassification of sectors. (ii) Reconciliation of the Input-Output Table at purchaser's prices, trade margins and
transport costs. (iii) Construction of aggregated tables. (iv) Second panel discussion (20 September 1976). (v) Construction of the analytical tables.
(vi) Analysis of the structure of the Indonesian economy. (3) Drafting and printing of the final report (October 1976 - March 1977)
(i) General framework of compilation procedures, concepts and definitions. (ii) Data report.
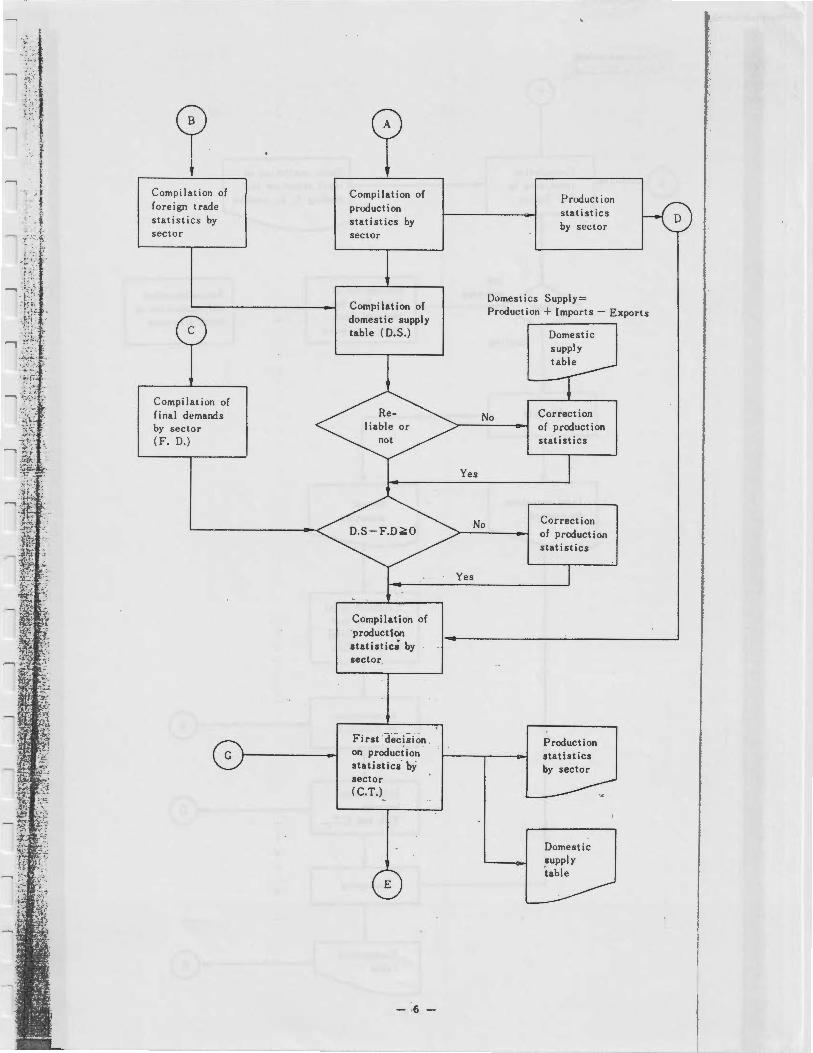
The process of compilation is described in the following Chart;
,, ,.
-4-

Chart 2: Flow Chart of the Compilation Procedure for the Input-Output Table
Sector Classi fication
Basic statistics on foreign trade
Coding 1-0 classification
Basic statistics on final demand & national income
Coding I-0 classification
C
Preparatory studies
Ora.ft of "Detailed Programme of Input -Output Table.
-0
Definition & scope of sectors
Basic statistics on production
Coding I-0 classification
Compilation of production ata.ti stics by I-0 sector
-6-
No
Estimation methods and data sources
l-0 commodity classification
Estimation of production of sector not obtained from basic statistics
National income stat I 1tics
l 7 7 l l 7 7 7 7 7 7 7 7 7 ,
7 l l
•t:·1-.
Jrt t\?.
ll_r1:-- -~~ ... ~
.:.:.:·:_
*'·· \.,//'..J,
;it, . ... :'.4 •
:~-... :~ r
1\{ :a,.-~
~t.~ --~;
l.f;.:-
~
-,
~ :ii~~}
cp t
Compilation of foreign trade statistics by sector
Compilation of final demands by sector (F. D.)
G
Compilation of product ion statistics by sector
Com pi lat ion of domestic supply table ( D.S.)
Compilation of product ton statistic; by sector
First · decision on produciion statistics by sector (C.T.)
E
Product ion statistics by sector
Domestics Supply= Product ion + Imports - Exports
No Correction
Yes
No
of product ion statistics
Correction of product ion statistics
Production statistics by sector
Domestic supply table

•
J
F
Comp i lation input data by 1-0 Sector
not existing
existing
Merging
Input structure by sectors
Bas ic statistics on input structure including F. D. sectors
Estimation of input data not obtained from basic statistics
Output structure
Establish total output by row sector= Total Output = T.O.
Computation of _T.0./C.T.
Differences between T.O. and C.T.
Balancing
Reconsideration and estimation of input structure
E
G
Transaction ,able ---0
- 7 -
7 ) r.
l 7 l 7 7 7 7 l 7 l 7 7 7 7 7 7 7

\
1-l }
Transaction table ( 66 and 19 sector classification)
Panel discussion
Reclassification according to panel discussion
Reconciliation work
Magnetic tape of basic table at purchaser's and producer's prices (175 sector classification)
Aggregation (66 and 19 sector classification)
Inverse matrix and
other analytical tables
-8-
Drafting the final report and analysis
Publication

Special Surveys on Production, Input Structure, Output Allocations and Others
Basic statistics
Design of special survey
1-0 Commodity classification
Yes
No
Stop
Stop
Preparatory steps for· s_pecial su.rvey 1-------------'-----,
Training of supervisor/ enumerator
Fi"ldwork by branch offices
Editing and processing in CBS
- 9 -
Field work by special i5t
Results of special survey
7 7 7 7 7 7 7 7 7 7 7 7 7 7 7 7 7 7

CHAPTER 2
CONCEPTUAL FRAMEWORK OF THE INPUT-OUTPUT TABLE
2.1. INTRODUCTION
The present Input-Output Table presents a picture of the interrelationship between different kinds of economic activities, hereafter called sectors. Through this study of interrelationship of sectors, it is intended to develop a picture of the Indonesian economy as a whole.
The following pages outline the basic framework and describe the aim of the 1971 Table. This chapter explains the basic features of the table and should be of assistance in understanding the scope and reliability of the data contained in the table. The concepts and definitions described in this chapter are particularly important when making international comparisons and other analytical purposes using the input-output table. Of course, such definitions should also facilitate comparisons between economic estimates based on this table and those derived from other sources and procedures.
2.2 FEATURES OF AN INPUT-OUTPUT TABLE
2.2 .1. Transaction Table An input-output table is a statistical description, in a matrix form, that shows the transactions
of goods and services and the interrelationship of the activities of each sector to the others, in a given area over a specified period of time. As a quantitative method of analysis of economic activities, the main problem is to identify and measure the diverse and numerous transactions between sectors.
In the case of an input-output model which is open and static, the following basic assumptions are made in respect to the transactions under study.
(1) Each sector produces a single output, with a single input structure, and there is no automatic substitution between the outputs of different sectors.
(2) The inputs into each sector are a linear function only of the level of output of that sector; · i.e., the amount of each kind of input absorbed . by any particular sector goes up or down in direct proportion to the increase or decrease in that sector's total output.
(3) The total effect of carrying out production in several sectors is the sum of the separate effects.
To clarify how the input-output table is constructed, an example is presented below, depicting an economic system consisting of three sectors of production, namely, sectors r, 2, and 3.
Table 2.1: Illustrative Input-Output Table
~ :M Intermediate Demand Final Total
Product ion Sectors Demand Output In
1 2 3
Intermediate , Production 1 Xu Xu Xu F, X, Input Sectors 2 Xu x .. Xu F, X,
3 Xu Xu Xu F, X,
Primary Input V, V, v, Total Input X, X, X,
- 10 -
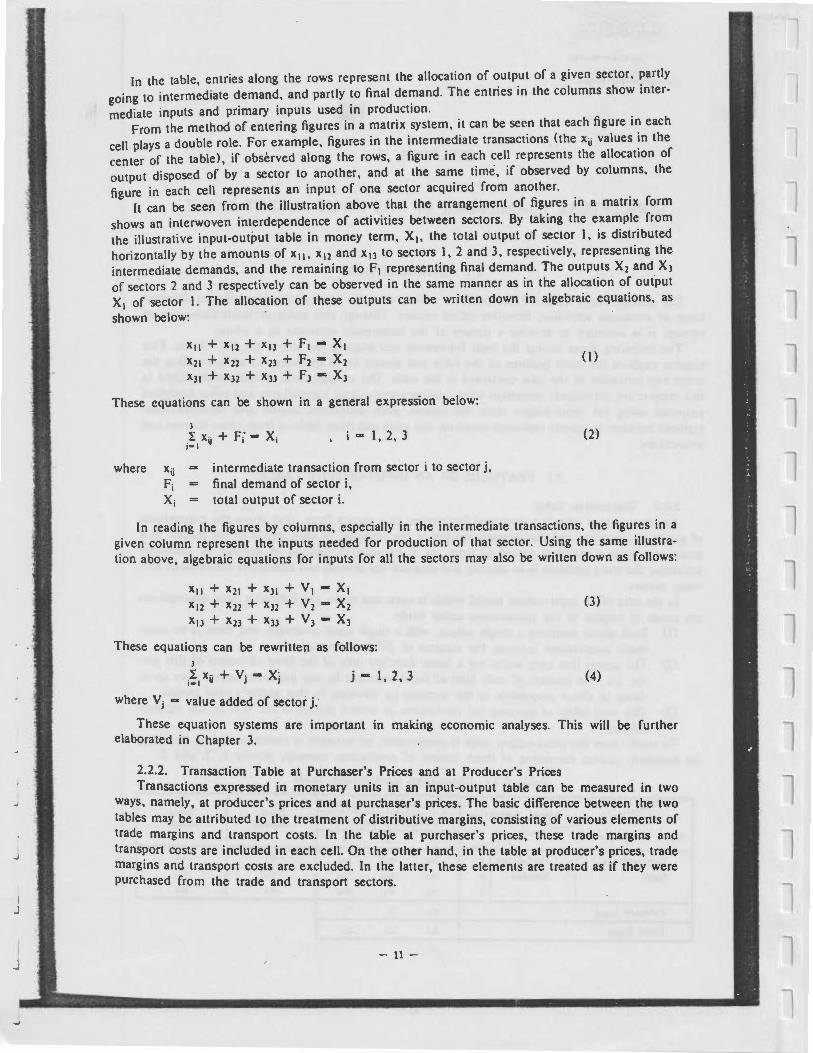
In the table, entries along the rows represent the allocation of output of a given sector, partly going to intermediate demand, and partly to final demand. The entries in the columns show inter• mediate inputs and primary inputs used in production.
From the method of entering figures in a matrix system, it can be seen that each figure in each cell plays a double role. For example, figures in the intermediate transactions (the xii values in the center of the table), if observed along the rows, a figure in each cell represents the allocation of output disposed of by a sector to another, and at the same time, if observed by columns, the figure in each cell represents an input of ona sector acquired from another.
It can be seen from the illustration above that the arrangement of figures in a matrix form shows an interwoven interdependence of activities between sectors. By taking the example from the illustrative input-output table in money term, Xi, the total output of sector 1, is distributed horizontally by the amounts of x11 , x12 and x 13 to sectors 1, 2 and 3, respectively, representing the intermediate demands, and the remaining to F1 representing final demand. The outputs X2 and X3
of sectors 2 and 3 respectively can be observed in the same manner as in the allocation of output X
1 of sector 1. The allocation of these outputs can be written down in algebraic equations, as
shown below:
X11 + X12 + X13 + F1 .., x. X21 + X22 + X23 + F2 - X2
X31 + X32 + X33 + F3 .., X3
These equations can be shown in a general expression below:
where xii Fi X;
, i - I, 2, 3
intermediate transaction from sector i to sector j, final demand of sector i, total output of sector i.
(1)
(2)
In reading the figures by columns, especially in the intermediate transactions, the figures in a given column represent the inputs needed for production of that sector. Using the same illustration above, algebraic equations for inputs for all the sectors may also be written down as follows:
X11 + X21 + X31 + VI - X1 X12 + X22 + X32 + V2 - X2
X13 + X23 + X33 + V3 - X3
These equations can be rewritten as follows: 3 I x .. + V. - X';-1 u J J
where Vi - value added of sector j.
j - 1, 2, 3
(3)
(4)
These equation systems are important in making economic analyses. This will be further elaborated in Chapter 3.
2.2.2. Transaction Table at Purchaser's Prices and at Producer's Prices Transactions expressed in monetary units in an input-output table can be measured in two
ways, namely, at producer's prices and at purchaser's prices. The basic difference between the two tables may be attributed to the treatment of distributive margins, consisting of various elements of trade margins and transport costs. In the table at purchaser's prices, these trade margins and trans~ort costs are included in each cell. On the other hand, in the table at producer's prices, trade margins and transport costs are excluded. In the latter, these elements are treated as if they were purchased from the trade and transport sectors.
- 11 -
7 7 7 l 7 7 7 7 l l l 7 l 7 7 7 7 7 7
;'·
·1 f .
- f r )
'
In practice, the construction of an input-output table is made easier when transactions are based on purchaser's prices, because most statistics about transactions are measured at purchaser's prices rather than at producer's prices. However, tables at purchaser's prices have limited uses. For analytical purposes, tables at producer's prices are preferred, because estimates at producer's prices are expected to have more stable input coefficients.
2.2.3. Economic Units In the compilation of an input-output table, the initial task is to clarify and define the concept
of economic units. The data on output can be compiled according to the following statistical units: (1) Commodity units, in which the statistical units are defined on the basis of one or more related commodities; (2) Establishment units, in which statistical units are defined on the basis of a single. location; (3) Activity units, in which statistical units are defined on the basis of the same kind of production activity; (4) Institutional units, in which statistical units are defined as all kinds of
activities under one organization. In compiling the input-output table, the measure of output based on commodity units is
perhaps the most useful in view of homogeneity of output. However, economic units with a single , commodity output are rare, except perhaps in agriculture and mining. Allocation of output based on commodities is rather easy to determine, but it is difficult to obtain adequate data on the input i
structure, because there are few economic units that may readily provide information about this aspect. On the other hand, under the classification based on establishment units, as in manufactturing, data on the structure of inputs can easily be obtained. However, it is very difficult to separate the inputs for an individual commodity if the establishment produces more than one com
modity .
2.2.4. Treatment of Imports Imports form a part of the domestic supply of commodities for intermediate and final con
sumption, and as such, also have a role in the input-output table. There are two possible methods of treating imports in the table, namely, competitive imports and non-competitive imports. With competitive imports, all imported commodities are treated on an equal basis with commodities that are domestically produced. In the case of non-competitive imports, the imported commodities are treated differently from the · domestically produced, and separate rows are provided for commodities from the two different sources. In the 1971 Input-Output Table of Indonesia, imports have been treated as competitive imports, due to the limitation of available data.
2.3. SECTOR CLASSIFICATION
The main purpose of grouping the economic activities into sectors is to make the output of each sector as homogeneous as possible. The two main criteria taken into account in the grouping of these economic activities into sectors are:
(I) Economic activities should be grouped according to similarities in the input structures, even though the utilization of the output may be different. . Ccinversely, economic activities producing output for similar uses, but having different input structures should not be classified under the same sector.
(2) Several economic units that are consecutive steps in the production process may be grouped under one sector, provided that a change in one output is always followed or preceded by changes in the other outputs in the same proportion. This may be especially true for such economic activities as the carding of cotton, spinning of yarn, textile weaving, dyeing, finishing and printing of textiles.
In working out a classification system for the 1971 lnput-Outout Table of Indonesia the existing Indonesian industrial classifications and the International Standard Industrial Classification had ' been taken as a base. However, the sector classification in the I-0 table was extended to include '.
. I
identification of given sectors by their characteristic products (or commodities).
- 12 -

In the J 971 Input-Output Table of Indonesia, most economic units were, in principle, grouped n the basis of commodity and activity. Therefore, the measure of output based on activity unit
0 . . . . . dealt with the production of one or more than one related commod1t1es or acllv1t1es. .
For the agricultural and mining sectors, the sector classification used for the 1-0 table 1s based on and identical with the classification of commodities produced. For the activities under manufacturing industries, the selection of commodities was based mainly on the itemization of output contained in the "Report of Annual Survey of Manufacturing Establishments". For the other sectors such as trade, transport, construction, etc., except for the government sector, the sector classification is based on the activities undertaken. For the government sector, the institutional unit concept has been applied for measuring output. For exports and imports, the available commodity classification is designed for foreign trade statistics. However, in this table, the commodities have been directly linked to their corresponding sectors.
The basic input-output table consists of 175 sectors of production. The number of commodities or groups of commodities composing the sectors is more than 600 items.
For specific purposes. based on this basic table, two aggregated tables have been prepared. One table consists of 66 sectors and the other of 19 sectors. The relationship between the 17 5 sector classification and their commodities in the basic table, in the 66 sector aggregated table, and in the 19 sector aggregated table, is shown in Appendix A.
2.4. INTERMEDIATE TRANSACTIONS
Industrial sectors use commodities in their economic activities as intermediate inputs and combine them with primary i_nputs to produce output. The producing sectors have to be distinguished from the final demand sectors, and they are called the intermediate sectors. The transactions taking place between these intermediate sectors are called intermediate transactions. Entries along the rows represent the allocation of output to meet the intermediate demand, while the entries by columns show the composition of inputs into production activities. These intermediate transactions form a matrix enabling the computation of input coefficients and their inverse matrix useful in economic analyses. The intermediate transactions reflect current expenditures for production activities. However, the purchase of capital goods (such as machinery and equipment), the construction of building, etc., are not included in these intermediate transactions, instead they are treated as capital formation which is a component of final demand.
2.5. FINAL DEMAND
Final demand consists of private consumption expenditures, government consumption expen-ditures, fixed capital formation, change in inventories, exports.
Definitions of these concepts follows:
2.5.1. Private Consumption Expenditures The private consumption expenditures consist of outlays which households and private non
profit institutions make for goods and services (i.e .• new durable goods such as furniture, radios and automobiles, and non-durable goods such as rice, vegetables, meat, and beverages), less net sales of second-hand goods and scraps. Also included in the private consumption expenditures are goods and services received from abroad.
Some special points to be noted regarding private consumption expenditures are: (1) Purchases of new dwellings by households are treated as gross fixed capital formation of
the construction sector. So, the imputed rent of owner occupied dwellings is part of the gross output of the real estate sector and is included in private consumption expenditures. In same way, purchases of materials for repair and maintenance of dwellings by households are treated as construction activity consumed in the real estate sector as
- 13 -
l 7 l 7 7 7 7 7 7 7 7 7 7 7 7 7 7 7 7

-- i.
--, ..
intermediate input. This part is finally consumed by households from the real estate sec
tor.
(2) The products of agriculture, forestry, fishing and quarrying, which are produced by households for their own consumption, are outputs of those sectors and so regarded as private consumption expenditures. Payments for domestic services such as maid services , cooking, child-care, gardening, etc., are the outputs of the personal services sector and are regarded as private consumption expenditures.
2.5.2. Government Consumption Expenditures The consumption expenditures by the government (the central as well as the local) comprises
the purchase of goods and services which are not capital in nature. Purchases of capital goods are not included in this sector.
2.5.3 . Fixed Capital Formation Fixed capital formation covers the purchases of new capital goods by sectors. Second-hand
capital goods, that are inported from abroad, are also included. Capital formation consists of the following items:
(l) Purchases of capital goods which are durable for more than one year. (2) Expenditures for renovation of existing capital stock that have the effort of increasing
the productivity and/or extending the life time of that capital stock. (3) Expenditures for the reclamation of land, development and extension of forest land,
mines, and new planting and replanting of commercial and other perennial crops. (4) Purchases of productive animals for such purposes as breeding, milking, transportation,
etc. (5) Trade margins and transport costs connected with the purchases of the above items.
Capital formation by the armed forces for national defense purposes is not included.
2.5.4. Change in Inventories Change in inventories is the difference between the values of the inventory of a certain com
modity at the beginning and at. the end of a given period. This can be grouped as follows: ( 1) Change in inventories of finished goods and work in . progress, held by producers,
including change in livestock and poultry, and materials held by the government. (2) Change in inventoriees of intermediate goods that consist of raw materials and supplies
held by producers but not yet used in production. · (3) Change in commercial inventories held by the trade sectors. These consist of all kinds
of goods up for sale but still unsold, whether held by wholesalers or retailers.
2.5 .5. Exports and Imports Exports and imports are goods and services transacted between residents of Indonesia and
other countries. These transactions may include merchandise, transportation, communication, insurance and other services. ' Export transactions are expressed in F.O.B. prices, which include domestic transportation costs, export taxes, loading costs paid in the exporting country, .irrespective of whether the exporter or the foreign importer bears the expenses. In the input-output table, imported goods are 'Valued at C.I.F. prices with the addition of import duties and ·other related taxes. The freight and insurance costs paid for by foreign countries to domestic companies are regarded as exports of services.
2.6. PRIMARY INPUTS
The rewards to productive factors are called the primary inputs, or gross value added. The gross value added can be calculated by deducting all costs of intermediate inputs from the value of
- 14 -

output. The primary inputs consist of four components, (I) wages a~d _salaries, (2) opera_ting surplus, (3) depreciation of fixed assets, and (4) net indirect taxes. Net indirect taxes are obtained by deducting total indirect taxes paid by the amount of subsidies received by producers.
2.6.1. Wages and Salaries Wages and salaries are the payments to employees for participation in productive activity. They
are paid in money as well as in kind, except the case of the unpaid family workers. The payments in kind are valued at market prices.
2.6.2. Operating Surplus The value of the operating surplus is obtained by deducting wages and salaries, net indirect
taxes and depreciation from the gross value added .
2.6.3 . Depreciation of Fixed Assets This component of value added consists of allowances for the consumption of fixed assets that
are used in the process of production. In the case of those assets that are made available on lease, the depreciation of these assets is included in the sector leasing that is owning them.
2.6.4. Net Indirect Taxes Net indirect texes are obtained by deducting subsidies from total amount of indirect taxes.
Indirect taxes are levied on the production, sales of goods and services. Concrete examples of these texes are import duties, export taxes, sales taxes, performance taxes, license and transaction fees, real estate taxes, e~c. In the present table with the competitive import type, the import duties (with negative signs) are not included here, but tri>ated as a part of import.
In an input-output table, the indirect taxes an~. in principle, allocated to the sectors paying these taxes. But, if these taxes are collected from the trade sector, these are entered in the column of the trade sector. Taxes which are assessed on capital goods are allocated to the sector using the capital assets, except in the case of leasing of these assets.
2.7. VALUATION
2.7 . l Valuation of Domestic Outputs Domestic outputs are valued at producer's . prices which are defined, in principle, as the ship
ment price from producer to purchaser. It should be noted here that the selling price by the producers does not include the transportation and other distribution costs when the output is directly distributed by the producers. In the case of a sector where units of activities operate without a fixed location, as in forestry and fisheries, the price in the nearest market is regarded as the producer's price. Commodity taxes which form a part of the indirect taxes are included in the output of the sector to which the taxes are levied, while the indirect taxes levied at the distribution stage are charged to the trade sector. Semi -finished products and goods in the process of production are, in principle, valued at the average price of the products during a given period. The value of change in inventories is covered under the output of the sector.
2.7.2. Valuation of Exports and Imports In the input-output table at producer's prices, exports are valued at producer's prices, while in
the table at purchaser's prices, these are valued at F.O.B. prices. Since the F.O.B. prices includes domestic trade margins and transport costs, · adjustments for these two components have to be made in order to arrive at producer's prices.
In recording transactions in the table both at producer's prices and purchaser's prices, imports are valued at C.I.F. prices.
- 15 -
l l 7 l l 7 7 7 l 7 l 7 l l l l 7 l 7

.- 2.8. DOMESTIC OUTPUT
The value of the total output by sector is used to check the distribution of the output values along the rows and input values along the columns in the table . For this reason, it is called a "Control Total" (C.T.) . The reliability of these estimates is a decisive factor in producing a inputoutput table. Total output is the domestic output resulting from production activities within the boundaries of the country, irrespective of whether the activities are undertaken by nationals or foreigners . The inventories of semi-finished goods and work in progress are also included in the total output by sector.
The control totals are estimated by adding the change in inventories to the values of shipments. Also included are the values of good~ produced for own consumption. In general, the control totals of the service sectors are estimated on the basis of receipts. Most of these se.vice sectors are not covered in currently available statistical information. Hense, special ad-hoc surveys'of establishments were undertaken to arrive at estimates of the output of these service sectors. The estimation methods adopted for the trade, banking, government as well as the dummy and unspecified sectors are discussed below.
2.9. TREATMENT FOR SPECIAL SECTORS
2. 9.1. Trade and Transport Sectors If every transaction through the trade sector is recorded in the transaction table, it does not
give a clear picture of the inter-sectoral transactions. To prevent this, an evaluation was made regarding additional activities undertaken by the trade sectors in serving as the connecting link between producers and ·consumers in ithe distribution of outputs.
The output derived from this distribution activity of the trade sector is measured in terms of trade margins. In recording transactions at purchaser's prices, these trade margins are included in the price of the purchased commodity so that there are no entries in the rows for the trade sector. However, at a producer's prices, the trade margins are not included in transactions, so that these trade margins are recorded along the rows for the trade sector.
The activities of the transport sector differ from those of trade sector in the sense that the transport sector does not conduct any purchasing or sale of goods. The control total of the transport sector is treated in the same way as the trade sector. On the other hand, in the case of transport activities directly serving the process of production, the transport costs are treated ·as a part of the production costs of the goods and services in question.
2.9.2. Imputation Method The sectors for which imputation procedures are needed in the estimation of outputs are bank
ing, other financial intermediaries, and a part of the real estate sector (for example, dwellings provided free by the government or other employers and owner-occupied dwellings). It should be noted that there are no actual transactions. If the values of these outputs are not included, the control totals will be under-estimated.
In case of the output of dwellings, the imputation is made on the basis of actual transactions at market prices.
2.10. BY-PRODUCTS, SUBSIDIARY PRODUCTS, AND SCRAP AND WASTE
Take the case of a production activity where two products are produced, say product A and B. Consider product A as main product. Product B may be classified into three:
2.10.1. By-Products This is the case if product B is simultaneously produced in a single technical process of pro
duct A.
- 16 -

13.
o-
2.10.2 Subsidiary Products Product B is produced side by side in a technologically independent process.
2.10.3 Scrap and Waste Scrap and waste are an unusable product B created during the production process (e.g., iron
scrap) or simply used an~ discarded items (e.g., old newspapers and used bottles).
2.10.4. Treatment of By-products, Subsidiary Products, and Scrap and Waste The three methods of entering by-products, subsidiary products, and scrap and waste are
explained below. Suppose sector l produces product A and product B. Product B is the same as the characteristic product of sector 2.
Method 1: Output Tranifer Method (See Table 2.2.) In column I, showing the input structure in producing product A, the total input of sector l is
shown without any specific treatment of product B. The value of product B is then transfered out to sector 2. In other words, the value of B is entered in the cell representing the intersection of the row of sector l and the column of sector 2 initially, and then allocated to other sectors in the row of sector 2. In this method, the value of product B is included in sector l as well as in sector 2.
Method 2: Negative Input Method (See Table 2.3.) In this method, the column of Sector l which produces product A, is treated in the same way
as in the transfer method above but product B is entered as the negative input from sector 2 to sector I. The value (w_ith a negative sign) of the product B is entered initially in the cell representing the intersection of the row of sector 2 and the column of sector l, and then allocated to other sectors from sector 2. This method is also called the Stone Method.
Method 3: Input and Output Transfer Method (See Table 2. 4.) In this method, product B is assumed to be produced as a subsidiary product, but not always in
the same proportion to product A. The input used for producing product B is separated out from total inputs of the sector, and is transfered to sector 2.
In the compilation of the 1971 Input-Output Table the negative input method (Method 2) was used for the treatment of scrap and waste, and the input and output transfer method (Method 3) for by-products and subsidiary products.
Table 2.2: Output Transfer Method
~ F l 2 Others Output
1 10 90 100
2 10 10
Others 100 100
Input 100 10 100 210
Table 2. 3: Negative Input Method
~ r 1 2 Others Output
1 90 90
2 -10 10 0
Others 100 100
Input 90 0 100 190
- 17 -
l l l 7 l 7 7 7 l 7 l l 7 7 7 7 7 7
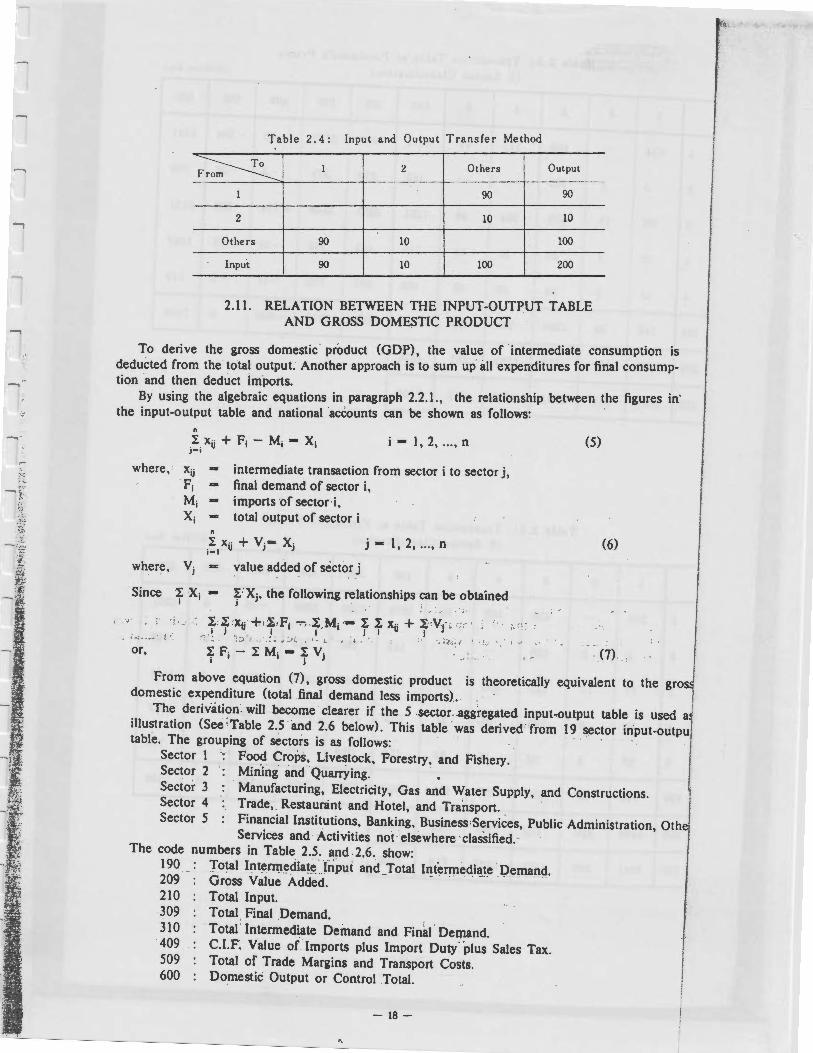
Table 2. 4: Input and Output Transfer Method
T o I 2 Others Output From
l 90 90
2 10 10
Others 90 10 100
Input 90 10 100 200
2.11. RELATION BETWEEN THE INPUT-OUTPUT TABLE AND GROSS DOMESTIC PRODUCT
To derive the gross domestic product (GDP), the value of intermediate consumption is deducted from the total output. Another approach is to sum up all expenditures for final consumption and then deduct imports.
By using the algebraic equations in paragraph 2.2.1., the relationship between the figures in' the input-output table and national accounts can be shown as follows: ·
n
_I xij + F; - M; - X; i - 1, 2, ... , n ,-, where, xu intermediate transaction from sector i to sector j,
F; - final demand of sector i, M; - imports of sector i, X; total output of sector i
n
IX·· + v.- X. j - 1, 2, .. . , n ;-1 y J J
where, Vi - value added of sector j
Since I X; - ~: Xj, the following relationships can be obtained I J ' .
......... .,· 1 •
or, I F- - I M- - .I Y. j I I j J . ' .,t . .
(5)
(6)
,'.'·"
' (7) .
From above equation (7), gross domestic product is theoretically equivalent to the gros domestic expenditure (total final demand less imports) ..
The derivation. will become clearer if the 5 sector .aggregated input--0utput table is used a illustration (See :Table 2.5 and 2.6 below). This table was derived · from 19 sector iriput-outpu table. The grouping of sectors is as follows:
Sector I Food Crops, Livestock, Forestry, and Fishery. Sector 2 Mining and Quarrying. Sector 3 Manufacturing, Electricity, Gas and Water Supply, and Constructions. Sector 4 Trade,. Restaurant and Hotel, and Transport. Sector 5 Financial Institutions, Banking, Business ,Services, Public Administration, 0th
Services and · Activities not ·· elsewhere ·classified.· The code numbers in Table 2.5. and .2.6. show:
190 _ : Total Inttm~~diate.· Input and _Total Intennedia,te I;>_emand. 209 Gross Value Added. · 210 Total Input. 309 Total _ Final .Demand. 310 Total · Intermediate Demand and Final · Demand.
· 409 C.I.F. Value of Imports plus Import Duty-'plus Sales Tax. 509 Total of Trade Margins and Transport Costs. 600 Domestic Output or Control Total.
- 18 -
l

1 2
1 €14 ...
2 3 2
3 95 19
4 17 4
5 17 5
190 746 30
209 1495 310
210 2241 340
1 2
1 559 ...
2 2 2
3 77 17
4 91 6
5 17 5
190 746 30
209 1495 310
210 2241 340
Table 2. 5: Transaction Table at Pnrchaser's Prices (5 Sector Classification)
3 4 5 190 309 310 409
469 117 11 1211 1559 2770 -25 . 163 ... ... 168 210 378 -3
675 304 98 1191 2257 3448 -714
39 36 14 110 453 563 -33
53 48 35 158 597 755 -31
1399 · 505 158 2838 5076 7914 -806
752 1152 561 4270
2151 1657 719 7108
Table 2.6: Transaction Table at Producer's Prices ( 5 Sector Classification)
3 4 5 190 309 310 409
400 101 10 1070 1196 2266 -25 ,•
139 ... ... 143 200 343 -3
525 258 83 960 1905 2865 -714
283 99 32. 511 1179 1690 • -33
52 · 47 33 154 596 750 -31
'. 1399 505 158 2838 5076 · 7914 · ~806 :, ·,
, . 752 1152 561 4270
2151 1657 719 7108
- 19 -
{Billi on Rp. )
509 600
-504 2241
-35 340
-583 2151
1127 1657
-5 719
0 7108
(Billion Rp.)
· 509 600
0 2241
0 340
0 2151
0 1657
0 719
o· 7108
1 l l l -,
7 l l 7 7 7
l 7 7 7
7

CHAPTER 3
THE SUPPORTING AND ANALYTICAL TABLES
3.1. INTRODUCTION
Several auxiliary tables are usually attached to an input-output table. In the case of the 1971 Input-Output Table of Indonesia, two sets of tables are attached; the first set represents the supporting tables and the second set represents the analytical tables. The supporting tables, which give the statistical information in terms of actual values, were prepared during the compilation of the inputoutput table. The analytical tables, wpich give information for analytical purposes, were calculated after the compilation. In this chapter, brief explanations about such tables as the trade margins matrix, transport costs matrix, employment table, transaction of capital goods, input coefficients table, inverse matrix, etc., are given. The actual tables on the import matrix and on transaction of capital goods, however, could not be presented at this time because of an absence of adequate data.
3.2. TRADE MARGINS AND TRANSPORT COSTS MATRICES (TABLES A-3, A-4, B-3, B-4, C-3 and C-4 in Volume II)
The trade margins and transport costs matrices play an importantt role in the derivation of the producer's prices from the purchaser's prices in the input-output table. Values in each cell of the two matrices showing the trade margins and transport costs respectively, represent the distribution costs of each transaction from the row -: sectors to the · column · sectors.--It · should be noted that transpoi't costs for the production activity within its own sector are excluded.
-· A simplified explanation -0f the role ~of -the -two matrices can be made through the following example, which indicates the procedure of deriving the input-output table at producer's prices. In the example,•C' and 'T' denote the trade and transport sectors respectively; while 'TM' and 'TC' denote trade margins and transport costs respectively. •A' and •s• in the example denote other sectors.
Now, consider the numerical entries: in this example. The entry of 5 units in the matrix of trade margins and of 3 units in the matrix of transport costs· at the intersection cells of row sector A and column sector B represent the costs for distributing 12 units of output from sector A to sector -B. The entry of 12 units in the input-output table at producer's prices represents the value of output of sector A purchased by sector B, at producer's price. This is obtained by subtracting the total of _trade margins and transport costs from the value of 20 units in the input-output table at purchaser's prices. · ... :.. __ 1 __
The ,method of compiling these matrices is as follows: (1) Each transaction in the input-output ~a~le at P_l:'_rch_aser's _pri~s is_ d!sti(!gi.iished whether or not the trade margins and the transport costs are charged. (2) The rates of trade-·margiris and tninspor-taiioo ·costs are estimated . . (3) The amounts of trade margins and transport costs of each cell are calculated, only for the transaction on which the trade margins and transport costs are charged, as the product of the values at purchaser's prices and their corresponding ·rates. -
When compiling a matrix of trade margins; tables: of--wholesale and retail -trade -margins ere

Chart 3: Example of Trade Margin and Transport Cost Matrices
Input-Output Table at Purchaser's Prices
-A B TM TC
A 1 20 5 3
8 5 40 4 4
C - - 9 -
T 0 2 - 7
Matrix of Trade Margins
A 8 :TM
A 0 5 0
B 0 4 0
C 0 9 0
T - - -
A 8 TM TC
A 1 15 .o 3
B 5 36 0 4
C 0 9 0 -T 0 2 0 7
Matrix of Transport Costs
A 8 TM
A 0 3 0
B 0 4 0
C - - -T 0 7 -
Input-Output Table at Producer's Prices ! . .. ., .·,
A B TM · . TC
A 1 12 '
0 0
B 5 32 0 0
C 0 ·9 0 0
T 0 9 0 0 '
- 21 -
TC
0
0
0
-
TC
0
0
-0
7 7 l 7 7 7 7 7 7 7 7 7 7 7 .7
l l 7

initially prepared separately, and then, the two are aggregated to arrive at the trade margin matrix . In the same manner, for the transport cost matrix, separate tables of costs of different types of transportation, such as railways, road transport, ships, etc., were initially prepared and then the transport cost matrix was compiled by the aggregation of these tables.
When a wholesale trade sector or a retail trade sector bears the transport costs, two methods are possible. One is to enter the cost, in the matrix of trade margins, as the cost of the trade sector and the other is to enter it in the matrix of transport costs . The output of the trade sector in the latter treatment would be smaller than in the former one reflecting the amount of transport costs . One of the merits of the former approach is that the figures would show the actual vaiue of payments . But, the ratio of transport cost to trade margins differs from commodity to commodity . Since it is desirable to keep the ratio stable for each commodity, transport costs were not included in trade margins, but entered it in the matrix of transport costs.
Trade margin matrices and transport costs matrices in the three kinds of sector classifications (I 75 sectors, 66 sectors and 19 sectors) were compiled following the above procedure . (See Tables A-3, A-4, B-3, B-4, C-3 and C-4 in Volume II).
The following aspects of trade margins should be noted: (I) In the input-output table at purchaser's prices, the values in row of trade sectors are
z~ro. though all trade margins are included in each transaction figure . (2) Margins on second-hand goods are not covered. The assumption is that trading activities
in second-hand goods are not carried out by commercial establishments (second-hand stores, etc.).
Attention should also be given to the following points regarding transport costs: (I) Transport costs are defined as the transport cost only for the distribution of goods from
producers to consumers. Transport facilities in Indonesia are: railways, road freight transport, sea and river transport, air transport, and storage and services allied to transportation.
(2) Since the estimation of transport cost is based on output by sector multiplied by the rate of transport cost, the table at transport cost reflects only transport cost on production, while transportation of household goods and the like are not included here. These are included under intermediate sectors.
3.3. IMPORT MATRIX
This table, compiled from the input-output table at producer's prices, shows the distribution of imported goods into the intermediate and final demand sectors. In other words, it consists of import portion of each transactions. Through this table, it becomes clear which sectors are consuming which kinds of imported goods.
It is also possible to draw up a transaction table of domestic products by deducting these imports from the input-output table at producer's prices. The transactions in this table would be valued at C.I.F. plus custom duties and sales taxes. However, since adequate information is not available at the present time, it was not possible to compile this Import Matrix.
3.4 . EMPLOYMENT TABLE (TABLE B-5 in Volume II)
The input-output technique is applicable in the estimation of demand for labor. This approach is very useful in estimating the interindustrial repercussions of labor requirements. For example, in introducing ·a 'new industry the needed manpower input can be estimated. For such analytical purposes a table of labor input by sectors was compiled.
One desirable aspect of this table is the cross classification of occupations and industries. In such a table the relationship between industrial categories and kinds of occupations can be observed. For example, such a table can present a breakdown of each sector by occupational
- 22 -

categories like professional and technical workers, administrative and managerial workers, clerical workers, sales workers, craftsmen, etc. However, in the present effort, information was limited only to the number of employees in each sector.
3.5. TABLE' ON TRANSACTIONS OF CAPlT AL GOODS
Although the table on transactions of capital goods has not been compiled because of the limited available information, the idea of this table is introduced here.
This table may be compiled by breaking down the column of fixed capital formation into sectors purchasing them. For analytical purposes, it is recommended that the fixed capital formation should be classified into two groups, one of production activity and one of social overhead .
3.6. INPUT COEFFICIENT TABLE (TABLES A-5, B-6 and C-6 in Volume II)
The input coefficient table should be read vertically. Each column shows the coefficient values of intermediate inputs and primary inputs required in the production of one unit of output in that sector.
The derivation of this input coefficient table from each transaction table can be explained as follows:
In the transaction table, let us denote:
Xj = Output of sector j xu = Output of sector i consumed as input in sector j to produce the
outpul Xi vhj = Value added of sector j of primary input h .
In the input coefficient table, let us denote:
Intermediate input coefficient of sector j from sector i. a;j 6ttj Primary input coefficient (or value added coefficient) of sector j
about primary input h.
Then, intermediate input coefficient and primary input coefficient are calculated as follows:
au X··
* i, j - 1, 2, ..... , n (3.1)
~ 6tii == X ,
J j - 1, 2, ..... , n; h - 201, ... .. , 204 (3.2)
3.7. INVERSE MATRIX (TABLES B-7, B-8, C-7 and C-8 in Volume II)
An inverse matrix of input-output table is the most fundamental analytical tool. It is, in principle, a function which links a certain level of final demand to a . certain . level of production. Therefore, by using this matrix in impact analysis, if a certain level of final demand is assumed, the production in each sector required to meet that level of demand can be computed.
Several kinds of inverse matrices are defined according to . the treatment of imports in the input-output model. The inverse matrices based on non-competitive imports and competitive imports are different from one another. In the 1971 Input-Output Table of Indonesia, the compilation was made only on the basis of the competitive type of treatment, due to the lack of adequate information.
The inverse matrix, used with competitive imports, and treating imports as an exogenous variable, can be derived through the following model. The equations of supply and demand in the input-output table are first expressed by
- 23 -
,.._
...._
L....
...._
'--
L...

X11 + X12 + •··· · + Xtn + F, - X1 + M1 X 2 t + X 22 + . • • • • + X 2n + F 2 """ X 2 + M 2
. . . . X0 1 + Xn2 + ..... + Xnn + Fn - Xn + Mn
(3.3)
Here Fi and Mi respectively show final demand and imports of sector i. By using the assumption (3.I), the equations (3.3) becomes:
a 11 X1 + a 12X2 + ..... + a1nXn + F1 - X1 + M1 a21 X1 + a22X2 + ..... + a2nXn + F2 - X2 + M2 . . . . . .
an;x 1 + an;X2 + .. : .. + a~Xn + Fn - Xn + Mn
Equation (3.4) can be expressed in matrix from as follows:
all··· .. aln
= A,
anl··· ··ann
Then the equation becomes:
AX + F - X + M
which can be written as:
(I - A) X - . F M I •
and the solution of X is obtained.
x, F1 X2 F2
-= X, -Xn Fn
(3.4)
M, M2
F, =M (3 .5)
Mn
(3.6)
(3.7)
(I-A)- 1 is the inverse matrix, and this was computed in respect to the 175, 66 and 19 sectors (See Tables B-7 and C-7 in Volume II).
Equation (3.7) shows that, by assuming a certain level of (F-M), the level of output required for the (F- M) can be estimated. However, when this inverse is used, attention must be paid that the final de~and and the· level of imports are given exogenously. Therefore, if (I..:. A)- 1 is computed by using F instead of (F- M), the solution for X would be only an approximation of output level. assuming that all .commodities are domestically produced ..
Considering such imports as an c~dogenous variable, anothe~ inverse matrix may be defined. Here, it is assumed that imports -by each sector are proportionate to , the level of domestic consumption in that sector . . If this proportion is defined as import coefficient µ. 1 for each sector, µ. is computed . as
l , '
µ. Intermediate Demand + Final Demand Imports · ·
Exports (3.8)
Den~ting (Final Demand -:: .f;xports) by fC. we get
i - 1, 2, ..... , n (3.9)
or (3.10)
- 24 -

Now, equation 0.6) . can be modified as follows:
-X = AX + P + E - M (AX + P) (3 .11)
Here, the notations are
E1
E = I = E, I En
-
-exports, M =
JJ.1 0 . ····· ·· ··· 0 0 JJ.2° •• .
. · . . 0 0 ····· ·· ··· · 0 JLn
(3 .12)
where M represents import coefficient matrix. Therefore, the ·solution of X from equation (3.11) would be
X""' [I-(I-M)A]- 1[(1-M)P+E] (3 .13)
where [I - (I- M) A]- I is the inverse matrix which is used in the analytical tables. As is clear from equation 0.13), this equation is composed of two parts:
X - [1-(l-M)A]-l(I-M)P (3 .14)
and X"" [l-(1-M)A]-IE (3.15)
So, to know the level of output required for a certain level of final demand (except exports), equation 0.14) can be·used, and for exports equation 0.15) can be used. In equation (3.14), the leak of P to foreign countries in the form of imports is also taken into account.
In case the effect of P and E are both observed at the same time, of course, equation (3.13) should be used.
The inverse matrix [l-(l-M)A] - 1 was computed for 175, 66 and 19 sectors (See Tables B-8 and C-8 in Volume II).
3.8. DOMESTIC OUTPUT INDUCED BY EACH FINAL DEMAND COMPONENT (TABLES A-6, B~9 and C-9 in Volume II)
In the previous section, it was mentioned that there is a one-to-one correspondence between the level of final demand ' and the level ·or output. In a similar manner, the extent of the domestic production (output) induced by each· final demand component can be computed. The equation is as follows:
xk - U-<I-M)AJ-10-M)Fk
X305 - [I-(I-M)A]- 1E
k - 301, ..... , 304 (3 .16)
(3.17)
For example, in equation (3.17), the output induced by the present export level is calcualted. In other words, this shows · the extent of output to be produced if the exports reach their present level. This was computed for 175, 66 and 19 sectors. Also at the bottom of this table, "index of output induced by each final demand sector" is calculated. This index,, denoted by p·, indicates the degree of impacts by each final demand component on direct and indirect production (output). Thus, this can be called a multiplier which gives the output level according to a specified level of each final demand. The index for final demand component k is defined as,
Pk -Total Output Induced by _f_k
Total of Fk
- 25 -
k - 301, ..... , 305 (3.18)
I,_
..._
--
~
'--
L

-,
3.9. IMPORTS INDUCED BY EACH FINAL DEMAND COMPONENT (TABLES A-7, B-10 and C-10 in Volume II)
Like the computation of induced output in the previous section, imports generated by each final demand component can be calculated. This table clarifies what portion of imports are induced by each final demand component. A table is computed according to the following equations for 175, 66 and 19 sectors:
Mk - MA[I-(l-M)AJ- 1(1-M)Fk+MFk k - 301, ..... , 304 (3.19)
M305 - MA[I-(l-M)A)- 1E (3.20)
3.10. TOTAL IMPORT COEFFICIENT (TABLES B-11 and C-11 in Volume II)
This coefficient is usually defined separately for exports and the rest of final demand. The total import coefficient of final demand (except exports) denoted as Ar, indicates the direct and indirect imports which are induced by one unit of final demand (except exports) for sector i. For example, suppose that the direct import coefficient is 0.5 and the indirect import coefficient is 0.1, with respect to sector i. This means that one unit of final demand (except exports) for sector i directly generates 0.5 unit of imports, and indirectly 0.1 unit of imports of raw materials for the production of the commodity. Naturally, the total import coefficient is the total of direct and indirect import coefficients. This coefficient is computed with respect to the 66 and 19 sector classifications, according to the following equation:
Ar= i MA[I-(I-M)A)- 1(1-M)+iM (3.21)
A total import coefficient of exports denoted as A e, is calculated with respect to the 66 and 19 sector classifications, by the following equation:
Ac= i MA[l-(1-M)AJ-I (3.22)
This coefficient shows th~ indirect imports induced by one unit of export of sector i. Since there are no re-exports, except in ' the case of enterpot trade, the total _ import coefficient of exports is equal to its indirect import coefficient.
3.11. GROSS VALUE ADDED INDUCED BY EACH FINAL DEMAND COMPONENT (TABLES B:-12 and C-12 in Voh~me II) ·
The gross value added induced by each final demand component is derived in a similar manner as induced output. These tables show the value added for each producing sector generated by the present level of its final demand. The computation has been undertaken for 175, 66 and 19 sectors according to the following equations:
vk - V[I-'(I-M):'-J-1(1:...M)Fk · k - 301, .; ... , 304 (3.23)
V305 - V[I-(I-M)AJ- 1E (3.24)
I I I

J
)
J
j
I .J
J
where
V
A
V
V1 V2
vn
= value added by sector,
61 o . ... .. . . . ... 0 0 62 . . .. .
. · . ·. 0 0 . .... .. · ... ..-: · ·o. 6n
(3 .25) .
(3.26)
where 6i denotes value added coefficient as follows:
6- -. J
Value Added of Sector j Output of Sector j
(3 .27)
3.12. TOTAL GROSS VALUE ADDED COEFFICIENT (TABLES B-13 and C-13 in Volume II)
The derivation of the coefficient of total gross value added is done in almost the same manner as the total input coefficient. This coefficient is computed for tables with 66 and 19 sector classifications with the fallowing equation: . ....
9 - V[l-(1-M)A]-I (3.28)
Here 9 is the matrix of coefficient of total and each component of gross value added and
where
61 62 ..... 6n
• V 611 612 ..... 6,n 621 622 . .... 62n I 631 632 ..... 63n 641 642 ... .. 64n
6i ... Ratio of "value added" to output of sector j 6u == Ratio of "wage and salaries" to output of sector j 62i - Ratio of "operating surplus" to output of sector j 63i .., Ratio of "depreciation" to output of sector j 64i - Ratio of "net indirect taxes" to output of sector j
(3 .29)
These coefficients show the totaLand each component of value added, induced by one unit of final demand for sector j. For example, suppose that there is one unit of final demand fDr the domestic output of sector j and that 6i .(total value added coefficient) is 0.9, 6IJ · (wage and salary coefficient) is 0.25 and so forth. This means that 0.25 unit of wages and salaries, and 0.9 of total value added were induced by one unit of final demand for this sector. In this case, 0.1 is the leak to foreign countries in the form of imports.
-'l:l-

3. 13. EMPLOYMENT INDUCED BY EACH FINAL DEMAND COMPONENT (TABLES 8-14 and C-14 in Volume II) .
This table shows the number of employees induced by the present level of each final demand component. So, if the intersection of a producing sector and household consumption sector is 2,000, this indicates that the household consumption induces the employment of 2,000 workers in the producing sector.
Computation was made with respect to 66 and 19 sector classifications with the following equations:
where
Lk = L[l-(I-M)A)- 1(1-M)Fk
L305 =L[l-(l-M)A]- 1E
k = 301, ..... , 304
= Vector of the number of employees
'Y1 0 . . . .... 0
.... 0 'Y2 • •••
L · .. · · . . . 0
0 ...... :· o·Yn
(3.30)
(3.31)
(3 .32)
(3.33)
where Yj denotes employment coefficient of sector j as follows:
Yj _ Number of Employees in Sector j Output in Sector j
3.14 TOTAL EMPLOYMENT COEFFICIENT . (TABLES B-15 and C-15 in Volume II)
(3.34)
This total employment coefficient, denoted by E, was computed for 66 and 19 sectors with the following equation:
E -iL [1-(1-M)A]-I (3.35)
This ·coefficient shows ·the ·number -of employees induced by one unit of final demand for domestic output of sector . j. For example, · suppose that E of sector j is 19.5. Then, this 19.5 workers are required for one unit of final demand for this sector, directly and indirectly.
3.15 NET FOREIGN EXCHANGE EARNINGS BY EXPORTS (TABLES B-16 and C-16 in Volume II)
This table was also computed for 66 and 19 sectors, by using the following equation: Z ... E - iM[I-(I-M)AJ-1E (3.36)
- 28-

where
z
A
E
Z1 Z2
Zn
Net foreign exchange earnings by exports
E1 0 . ...... 0 0 E2 · · . .
0 0 ...... ·.o. En
(3.37)
(3 .38)
where E; is exports of sector i. The index of net foreign exchange earnings of sector i, x, was computed by the following equation:
X = Z/E; i = 1, 2, .. ... , n (3.39)
This table shows the net foreign exchange earnings from exports of each sector. Net foreign exchange earnings are defined as the balance of the direct foreign exchange earnings by the exports of sector i and the imported inputs required for the production of the exported goods. This table also shows the ratio of net foreign exchange earning to export by sector.
3.16. POWER OF DISPERSION AND DEGREE OF SENSITIVITY (TABLES B-17 and C-17 in Volume II)
The indices of the power of dispersion, a;, and the degree of sensitivity, /3;, are defined as follows:
Q' · J
/3; =
Ib-i u
- 1-IIbij n ; i
Ib-· j u
_I_· IIb n ; j u
where bu - element of the inverse matrix '.
j .. 1, 2, ..... , n (3.40)
i - 1, 2, .. ... , n (3.41)
In this analysis, the above indices were computed by using the inverse matrix, [I - (I-M) AJ- 1• The column sum of the inverse matrix, ~bu, shows the output induced by one unit of final demand for sector j, and the power of dispersion, aj, is the normalised index of the column sum to the total sum (~~bu)· The row sum of the inverse matrix, ~bu, shows the output induced by one unit of final derttand of each secto~, and the degree of sen§itivity, /3;, is the normalised index of the row sum to the total sum.
If ai is high, it means that the influence of sector j to other sectors is large. If /3i is high, ~hen the sector i is sensitive to the impact from other sectors. ai and /3; are similar concepts with . the "backward linkage effect" and the "forward linkage effect" in A.O. Hirshman's terminology.
- 29 -
~
'--
~
L
'-

CHAPTER 4
THE STRUCTURE OF THE INDONESIAN ECONOMY
4.1. INTRODUCTION
The 1971 Input-Output Table is a good analytical tool that, by showing the interrelation of economic activities, can aid in anticipating economic forcasting, structural analyses and development planning for the Indonesian economy in the future. In this chapter, input-output analytical techniques are employed to show the structure of economic activities in Indonesia. There are however still some limitations to this Input-Output Tabel due to lack of statistical data for certain sectors.
4.2. SUPPLY AND DEMAND
In 1971, total supply was Rp 7,914.3 billion which consisted of Rp 7,107.9 billion of total domestic output and Rp 806.4 billion of total imports. Total demand, which equals to total supply, consisted of Rp 7,344.0 billion of total domestic demand and Rp 570.3 billion of total exports.
Table 4.1 and Figure 4.1 are provided to explain the structure of supply and demand by sector. Looking at the manufacturing sectors, the other manufacturing industries (sector 09) depends heavily upon imports. That is, 45% of the demand for this sector is supplied by imports and it occupies 80% of the total imports. On the other hand, domestic supplies in the other sectors almost completely meet domestic demands. The other agricultural crops (sector 03), forestry (sector 05) and mining (sector 07) differ from other sectors in that these sectors are highly exportoriented. 25% of the domestic output of other agricultural products, 27% of forestry and 56% of
-, mining are exported. These exports occupy 63% of · the total exports.
Table 4.1: Supply and Demand at Producer's Prices
( 19 Sector Classification)
Input-Output Sectors Domestic
Code Description ' Demand
01 Paddy 463.8 02 Other Farm Food Crops 721.5 03 Other Agricultural Crops 389.0 04 'Livestock & Products 162.5 05 Forestry 125.3 06 Fisheries 217.3 07 Mining & Quarrying 151.5 08 Food, Beverages & Tobacco Industries 584.9 09 Other Manufacturing Industries 1,400.6 10 Petroleum Refining 189.7 11 Electricity, Gas & Water Supplies 82.7 12 Construction 546.7 13 Trade 835.l 14 Restaurants & Hotels 261.3 15 Transport & Communication 464.3 16 Financial, Real Estate & Business Services 234.7 17 Public Administration 185.9 18 Other Services 279.0 19 Unspecified 48.0
Total 7,344.0
Note: ( 1) Including import duties and import sales taxes.
- 30-
Exports (F.O.B.)
0.0 11.2
121.4 2.6
45.8 5.6
192.0 36.1 14.0 10.1 0.0 0.0
34.9 0.0
94.3 0.0 0.0 0.0 2.2
570.3
(Bil lion Rupiahs)
(I) Domestic Imports
Output ( C.I.F.)
463.8 0.0 731.6 1.1 487.8 22.6 164.0 1.1 170.9 0.2 222.8 0.1 340.0 3.5 560.1 61.0 771.2 643.5 · 190.8 9.1 82.7 0.0
546.7 0.0 870.0 0.0 261. 3 0.0 525.5 33.1 216.9 17.9 185.9 0.0 278.6 0.4 37.4 12.7
7,107.9 806.4

I Co)' -
II ..... 0 3 0
"8 3 ~ :! "' ,,. (')
0 ~
-0
~
DI [TJ ><
"8 ~
0 0 3 ~
"' ,,. (')
0 ~
3 "" 6.
;;;
0 8 8 8 8 8
Fisheries
8 ._, 00
~ § 8 8
Paddy \
Other farm food crops
Other agricultural crops \
w 8 I
r··········· .. ······· ·······················, ~ Mining & quarrying 111111111111011111 c,,
Food, bevetage & tobacco industries
:; 8 I
%111111111111111~
Construct ion
mffiumnm1rmwnnnnmnrmmrornn@mm·1nffifiiimiiiii111111111111 diWfo"jjjjjjjjjfff ···1 ~ Trade
Transport & Communication
services
administration & defence
Other services
;:;; 8 ;:c o:i
C: - ·
I -0 -; · ::: ::,- 0 "' :,
Other manufacturing industries
"T1 OQ. C: ..., (b
.I>-
{f) C:
-c --c '< p, ::, p.,.
0 (b
3 p, ::, p.,.
-<D
{f) (b n 0 ...,
n p,
"' "' -. n "" ,... 0 ::,
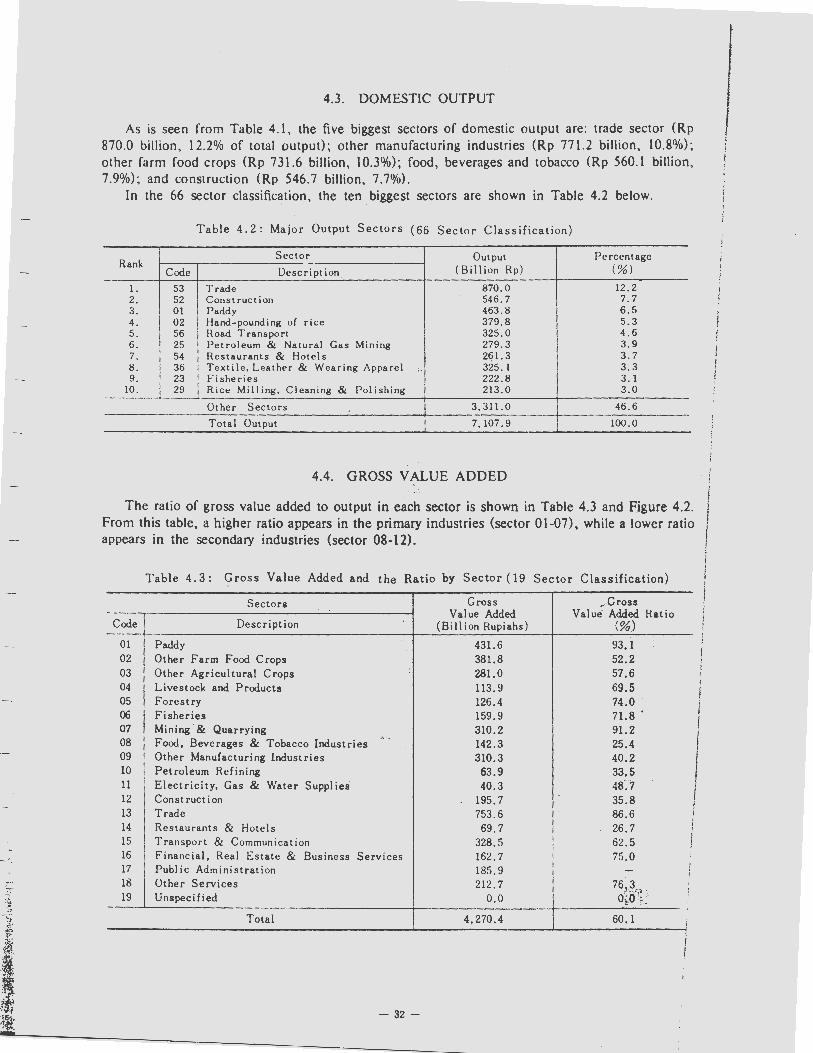
-,
--,
7
,. ,, j -~ --··/. ~,
j I r , .
4.3. DOMESTIC OUTPUT
As is seen from Table 4.1, the five biggest sectors of domestic output are: trade sector (Rp 870.0 billion, 12.2% of total output); other manufacturing industries (Rp 771.2 billion, 10.8%); other farm food crops (Rp 731.6 billion, 10.3%); food, beverages and tobacco (Rp 560.1 billion, 7.9%); and construction (Rp 546.7 billion, 7.7%).
In the 66 sector classification, the ten biggest sectors are shown in Table 4.2 below.
Table 4.2: Major Output Sectors (66 Sector Classification)
Sector Output Percentage Rank -
(Billion Rp) (%) Code Description
1. 53 Trade 870.0 12.2 2. 52 Construction 546. 7 7. 7 3. 01 Paddy 463.8 6.5 4. 02 Hand-pounding of rice 379.8 5.3 5. 56 Road Transport 325.0 4.6 6. 25 Petroleum & Natural Gas Mining 279.3 3.9 7. 54 Restaurants & Hotels 21?1.3 3.7 8. 36 Textile, Leather & Wearing Apparel .. 325.l 3.3 9. 23 Fisheries 222.8 3. 1
10. 29 Rice Milling, Cleaning & Polishing 213.0 3.0
Other Sectors 3,311.0 46.6
Total Output 7,107.9 100.0
4.4. GROSS VALUE ADDED
The ratio of gross value added to output in each sector is shown in Table 4.3 and Figure 4.2. From this table, a higher ratio appears in the primary industries (sector O 1-07), while a lower ratio appears in the secondary industries (sector 08-12).
-Code
01 02 03 04 05 06 07 08 09 10 11 12 13 14 15 16 17 18 19
Table 4.3: Gross Value Added and the Ratio by Sector (19 Sector Classification)
Sectors Gross • _Gross Value Added Value· Added Ratio
Description (Billion Rupiahs) (%)
Paddy 431.6 93.l Other Farm Food Crops 381.8 52.2 Other Agricultural Crops 281.0 57.6 Livestock and Products 113.9 69.5 Forestry 126.4 74.0 · Fisheries 159.9 71.8 ' Mining · & Quarrying 310.2 91. 2 Food, Beverages & Tobacco Industries
". 142.3 25.4 Other Manufacturing Industries 310.3 40.2 Petroleum Refining 63.9
.. 33.5
Electricity, Gas & Water Supplies 40.3 4s·:·1 Construction 195.7 35.8 Trade 753.6 86.6 Restaurants & Hotels 69.7 26.7 Transport & Communication 328.5 62.5 Financial, Real Estate & Business Services 162.7 75.0 Public Administration 185.9 -Other Services 212.7 76~~,:,;(,. Unspecified 0.0 o~o. ;:
Total 4,270.4 60.1
- 32 -
I I 1 I
I

I ~ I
I ~ I»
OQ (I) ., R<> ., I»
I» ., ;;· .,
Fl tD
0 -::r (I) .,
OQ ., 0 ., ., < ~ C (I)
8: 8..
0 8 8 8 8 8 ...., 8
s~ ·,:,:,:.:,:.:,:-:,•❖:-:-:-:,w,>•····························:·. ·. ·. ·. ·.·:·:· .·. ·.·.·. ·:·:·1] § Paddy
2 Other farm food crops '················u:c : : : : :: :Xu.~·~·!1+:+1+············!·i)H] ~ .1!~.}iHWl!(~WHH(((~-(~·((~-~-(((~~ ~ Other agricultural crops 0
"'
~ !-" Livestock and products flllL•·•·•·•·•·•·•·•··,•,•-•;•,•,•1 c.o
~ Forestry
~ Fisheries
0 ...., -: ·: ·: ·: · · -: ·: ·: · :: '· :: ·: ·: · .'. ·: ·: · ::::;·;:;:;:;:;:::.:;:;:::;:;:;:;::::·:::::·::::;:;J ~ Mining & quarrying
i Food, beverage & tobacco industries
£ .:::·:·:·•:=:=:=:=:=:=:=:=:=:=:=:=:=:'.:'.:'.:'.:'.:'.:'.:'.:::=:)~illj ~ Other manuf act u ring industries
0 refini~g
gas & water supplies
;;; I I I I I I II I 1111111111111111 tf =~=~:l:l:~:~:l:l:~:l:~:a ~ Construction
;;; .. U.U.U.U.U.U.LU.LU. ~:~1~.~.·1·i·i·ri·i·i·rr~·i·i·~·i·ri·i·~·!·j·.·r.·.·.·.·~-~·~·~-:·~·~·A v·:·:·:·:-:-:-:-:·:-:·1 ~
:: Restaurants & hot1?ls
t;; .{mmmrnrmmmu ~.~:(-:-:-:-:-:-::;()·.: ::~·((i ~ Transport & communication
;;; Financing. real estate & bisiness services
~ 111111m111m1m11111111111111111111111111111 ~ Public administration & defence
~llllllllllllllllllllllllllllllll[i.i.i.i.i~i.i1i.i/?i~ ~ Other services
:OI~ Unspecified & provisional sector
~~- .-. __ ,_, __ ...,,..,._.,_,...,. __________ __,,~,•·•~~--P9 lt -i,.~NI) jl •• < -. _,._,.,,,,., ·~ --- ,,.~ .... !..,
(
00
8
Trade
::0 0:, C -·
"C = ;· o· ~:,
'TJ CIQ C .., (1)
~
N
0 - .., <.O 0
(/)
U) (I)
(1)
< (')
0 "' .., C
0 (1)
-► "' p.. (/) p.. (/) (1)
::.; ~ (')
I»
"' :, p..
::, ::,
:i: "' (IQ r:, Vl
"' ::, p..
U)
"' ii," .., (1) (/)
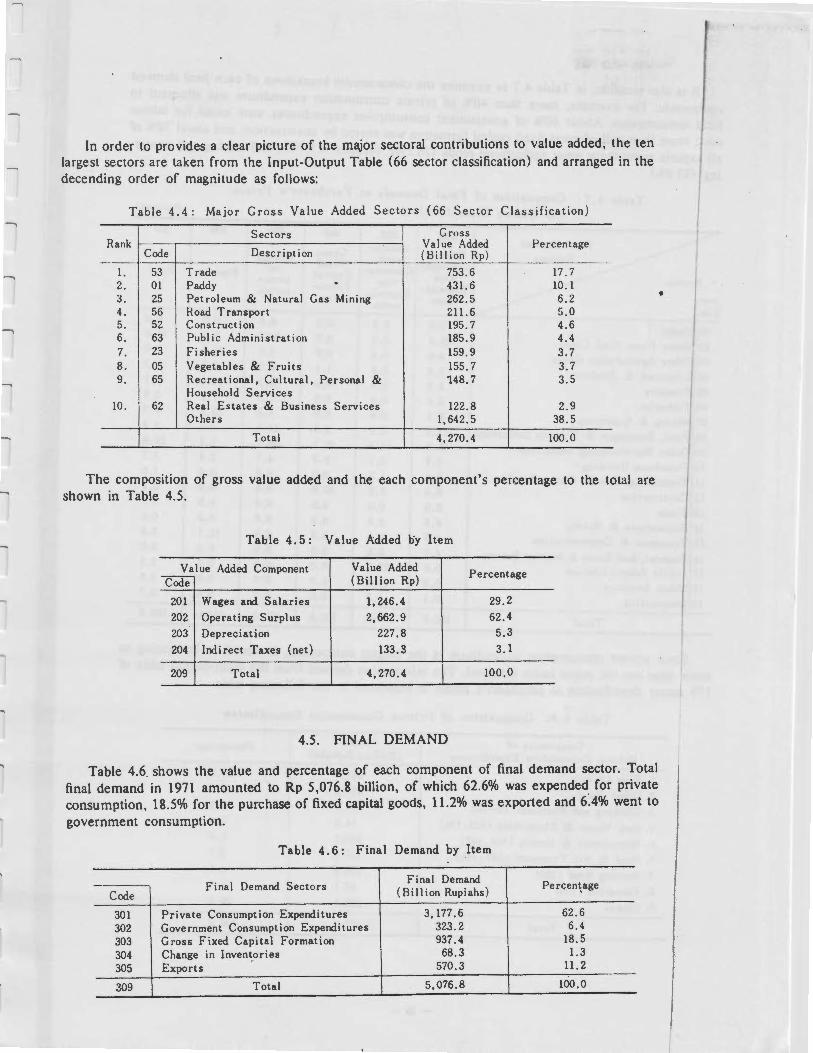
In order to provides a clear picture of the major sectoral contributions to value added, the ten largest sectors are taken from the Input-Output Table (66 sector classification) and arranged in the decending order of magnitude as follows:
Table 4.4: Major Gross Value Added Sectors (66 Sector Classification)
Sectors Gross Rank Value Added Percentage
Code Description (Billion Rp)
1. 53 Trade 753.6 17.7 2. 01 Paddy . 431.6 10. 1 3. 25 Petroleum & Natural Gas Mining 262.5 6.2 4. 56 Road Transport 211.6 5.0 5. 52 Construction 195.7 4.6 6. 63 Public Administration 185.9 4.4 7. 23 Fisheries 159.9 3.7 8. 05 Vegetables & Fruits 155. 7 3.7 9. 65 Recreational, Cultural, Personal & 148.7 3.5
Household Services 10. 62 Real Estates & Business Services 122.8 2.9
Others 1,642.5 38.5
Total 4,270.4 100.0
The composition of gross value added and the each component's percentage to the total are shown in Table 4.5.
Table 4.5: Value Added oy Item
~lue Added Component Value Added Percentage Code (Billion Rp)
201 Wages and Salaries 1,246.4 29,2 202 Operating Surplus 2,662.9 62.4 203 Depreciation 227.8 5.3 204 Indirect Taxes (net) 133.3 3. 1
209 Total 4,270.4 100.0
4.5. FINAL DEMAND
Table 4.6 shows the value and percentage of each component of final demand sector. Total final demand in 1971 amounted to Rp 5,076.8 billion, of which 62.6% was expended for private consumption, 18.5% for the purchase of fixed capital goods, 11.2% was exported and 6.4% went to government consumption.
Table 4. 6: Final Demand by Item
Final Demand Sectors Final Demand Percentage
Code (Billion Rupiahs)
301 Private Consumption Expenditures 3,177.6 62.6 302 Government Consumption Expenditures 323.2 6.4 303 Gross Fixed Capital Formation 937.4 18.5 304 Change in Invent_ories 68.3 1.3 305 Exports 570.3 11.2
309 Total 5,076.8 100.0
•
I I I
I
I
I

It is also possible, in Table 4.7 to examine the characteristic breakdown of each fianl demand component. For example, more than 40% of private consumption expenditure was allocated to food consumption. About 60% of government consumption expenditures were made for labour cost: more than half of gross fixed capital formation was shared by construction: and about 70% of all exports come from other agricultural crops (26.1 %) , forestry (11 .4%), and mining and quarrying (33.6%).
Table 4. 7: Composition of Final Demands at P~rchaser's Prices
( 19 Sector Classification)
Final Demand 301 302 303 304
Sectors Private Govern- Gross Consump- ment Fixed Change
305
Sector tion Consump- Capital in Exports tion lnven-- Expendi- Expendi- Forma- tori es Cooe tures tures tion
01 Paddy 0.0 0.0 0.0 0.0 0.0 02 Other Farm Food Crops 25.4 0.0 0.0 18. 7 2.2 03 Other Agricultural Crops 4.6 0. 1 0.0 3.7 26.1 04 Livestock & Products ,2.8 0.0 1. 1 0.0 0.5 05 Forestry 1. 3 0.0 0.0 1. 3 11. 4 06 Fisheries 6.6 0.0 0.0 7.3 1.1 07 Mining & Quarrying 0.4 0.0 0.0 5.9 33.6 08 Food, Beverages & Tobacco Industries 18.2 0.0 0.0 14.3 7.1 09 Other Manufacturing Industries 15.0 11. 5 46.1 44.1 3.1 10 Petroleum Refining • 2.9 2.1 0.0 4.7 2.4 . 11 Electricity, Gas & Water Supplies 0.4 . 1.8 0.0 0.0 0.0 12 Construction 0.0 2.5 52.8 0.0 0.0 13 Trade 0.0 0.0 0.0 0.0 0.0 14 Restaurants & Hotels 6.6 4.8 0.0 0.0 0 .0 15 Transport & Communication 4.6 4.1 0.0 0.0 12.1 16 Financial, Real Estate & Business Services 4.2 2.5 0.0 0.0 0.0 17 Public Administration 0.0 57.5 0.0 0.0 0.0 18 Other Services 6.9 11. 9 0.0 0.0 0.0 19 Unspecified 0.1 1. 2 0.0 0.0 0.4
Total 100.0 100.0 100.0 100.0 100.0
( Percent)
309
Total
6.0 11.8 8.0 2.3 3.1 3.9 4.7 9.2
22.8 3.7 1.0 6.9 0.0 0.0 3.8 3.0 2.3 3.5 0.7
100.0
Since private consumption expenditure is the biggest component, it would be interesting to know what are the major items involved. The information derived from the input-output table of 175 sector classification at purchaser's prices is presented in the following table.
Table 4.8: Composition of Private Consumption Expenditures
Components of Value Percentage Private Consumption · Expenditures (Billion Rupiahs)
1. Rice (2, 61) 681.6 21. 5
2. Other Food 891. 2 28.0
3. Clothing and Footwear(74-84) 261. 5 6.8
4. Gas, Water & Electricity (133,134) 14 .0 0.4
5. Hestaurants & Hotels ( 144, 145) 210.2 6.6
6. Road & Air Transport ( 147, 152) 117. 9 3.7
7. Housing Rent (159) 128.9 4 . 1
8. Education ( 163) 27.1 0.9
9. Others 890.1 28.0
Total 3,177.6 100.0
- 35-
~
·~
L.
L.
L.
L...

--,
From the above table il is observed that food consumption accounts for almost 50% of the total private consumption expenditures.
4.6. EMPLOYMENT
Figure 4.3 shows the sector distribution of employment as derived from the "1971 Population Census" . There are seven sect9rs among the 19 .sectors which provide employment lo more than one million persons. The biggest three are: other farm food crops (16. 7 million persons or 40% of the total employment); paddy (7 .5 million persons or 18%); and trade (3.3 million persons or 8%). Manufacturing sectors still provide relatively few employment opportunities (0.6 million persons or 1.5% in the food, beverages and tobacco industries, and 2.0 million persons or 5% in the other manufacturing ~ctor) .
More detailed information on employment is given in Input-Output Table of 66 sector classification. The ten sectors which have the highest capacity of absorbing man power (labour intensive sectors) are arranged in decending order of magnitude in the Table 4.9 below:
Rank '-Code 1. 01 2. 05 3. 04 4. 53 5. 65
6. 02 7. 63 8. 03 9. 64
10 . 06
Table 4. 9: Number of Employees by Sector
(66 Sector Classification)
Sectors Employment
( persons)
Paddy 7,489,982 Vegetables & Fruits 7,020,266 Root Crops 5,954,602 Trade 3,323,070 Rec reational, Cultural, Personal & 1,803,413 Household Services Hand-pounding of Rice 1,717,440 Public Administration 1,325,666 Maize 1,054,739 Social & Community Services 990,473 Other Farm Food Crops 969,778 Other 9,611,787 Total 41,261,216
Percentage
18.15 17.02 14.43 8.05 4.37
4.16 3.21 2.56 2.40 2. 35
23.30 100.00
From the above table, it can be concluded that the paddy sector (Sector: 01) employs the greatest number of people, followed by the vegetables and fruits sector (Sector: 05) and root crops (Sector: 04) . These three sectors account for more than 50% of the total employees.
4.7. FOREIGN TRADE
4. 7 .1. Imports and Exports Figure 4.4 shows the values of imports and exports by sector in the 19 sector classification:
(1) The sectors with extensive imports are food, beverages and tobacco industries (sector: 08), other manufacturing industries (Sector: 09), and transport and communication (Sector: I 5) . (2) Significant sectors for exports are mining and quarrying (Sector: 07), other agricultural crops (Sector: 03) and transport and communication (Sector: 15).
- 36 -

r
I ~
w
... •
... "' ... 0,
:::;
... 00
...
0 N N W W • ._ VI u, 0\ Cl -..a -.J -..a o ~ 0 ~ 0 ~ b ~ 0 ~ 0 ~ 0 ~ 0 ~ 0 ~~
~ ~ 0
Other farm food crops Other agricul~ural crops
'""'"""'" -· Livestock and products
Fisheries
& quarrying
Food, beverages & tobacco industries
Other manufacturing industries
refining
Construction
trade
Restaurants & hotels
Transport & communication
estate & business services
Public administration & defence
Other services
Paddy ~ ::s
UTll ~ .UJN
<D Jllllllllllllllll llllllllllllllllllllllllllllllllll Unspecified & provisional sector
r r r r r
'T]
(IQ C: ., n,
~
c,.,
..... z ~ C:
3 C/l er n, n, 0 _., ... 0 0 ., -() [TJ -3 :~ fl) 0
3~ 0 "'
"' ... er c5· '-< ::, ~ C/l
n, ()
0 .,
r r

0 0 ~ ~ ~ g: 8 cl
Paddy
Other farm food crops
~ :g 8 0 -N 0 ~ § cl ~
1:;;J·'·'·'·'·'''·''''''''''''', 22
./::;:·:·:·;:·, ·;;::·:·:·;,. • ·:·,. • ·;·; ; : ; ; · ... ; ...... :···· ··•·········· .. · · . ·::·:·:i 12 1.4 Other agr I cu It ura I crops
Livestock and products
Forestry
Fisheries
1 :g 8
:.:.:.:.:.:.:. :. :.:: :. :::.:.,.,·,·,=,=, :. :.:.:. :.:.: •.. :.:.:.:.:.: :: :, : ':':':' :,:,:.: .:. : . : .: ,: . : .:::.:: :;: . :·:;:.: ·:. :;::: ·: ;:: : ·:;:·:· :·:.: ;: ·:. :· :;: ·:·: ·:;:····; \.:.:. :·: :; : . ·: ... :.: .... ·:.:.: •........ :·: ·3 192. 0
Mining & quarrying
@r:::;;;;;;: .. ;·;" · !361 J61.0 Food, beverage & tobacco industries
0 ::0 0:, C: ::.: -a -~ p;· ;;· ::r :, (/l
I
~ I
r .. ··········~1• o g:::::::::::::. . \ '-----------~ □ 643.5
refining
::1g:g Electricity, gas & water supplies
-10.0 C . .,, o.o onstruct1on
c:;; t o:o .............. -.-.-.·.·.·.-.·.-.·.·.-.·.·.·.·.·.1 34. 9 Trade
.:1g:g Restaurants & hotels
<:;; r···················-··'·'·'·'·'·'·'· f :33. o· ·:·:·:·:·:·~.:.:.: .:.:.__::·························•:•:•:•:•:•:• 94.3 Transport & communication
0.0 <;;I 1!7.9 Financing, real estate & business services
0.(, :ilo.o
0.0 coho.•
Public administration & defence
Other services
~~ r·---.~ ~ ----- ~ 12.7 Unspecified & provisional sector
Other manufacturing industries
□ f-:0:l w 3
"C 0
~
trl >< -a 0
~
'TJ OQ C ., 11>
""' ""'
.... 3 <.O "C
0 (f) ., ... (1) (/l n ... II> 0 ::, ., 11-
(') [Tl - >< II> "C ~ 0 -· ., - ... -· (/l n p, 0-::. '< 0 ::, U) ~ (1)
n ... 0 .,
I J

4.7.2. Net Foreign Exchange Earnings from Exports Exports earn foreign exchange that finances imports of capital goods, raw materials and con
sumer goods. However, the production of export goods requires imported raw materials. Therefore, the effect of exports on foreign currency earnings should be measured on a net basis. Table 4.10 shows the net foreign exchange earnings of exports by sector in the 66 sector classification. The petroleum mining sector, which is the largest export industry, imported only Rp 1.4 billion in intermediate inputs but exported Rp 173.6 billion. Thus, its net foreign exchange earnings were 99.2%. The rubber industry which is the second largest export sector, imported only Rp 4.8 billion in intermediate inputs but exported to the amount of Rp 82.6 billion. Thus this sector's net foreign exchange earnings were 94.2%. With other export sectors, the ratios of net foreign exchange earning are also very high. They were almost more than 90%. This indicates that export industries have only a slight relation to the imports. In other words, these industries use domestic inputs. They have a high value added ratio.
-Code
25 07
57
21 53
24
28
32
Note
Table 4.10: Net Foreign Exchange Earnings from Exports
(66 Sector Classification)
Gross I rnport Net
Sectors Earning Require- Foreign
of rnents for Exchange Exports Exports Earnings
Petroleum and Natural Gas 173.6 l. 4 172.2 Rubber 82.6 4.8 Tl.8 Water Transport 69.8 6.7 63. l
Logging & Sawrni 11 ing 45.3 1. 7 43.6
Trade 34. 9 1.0 33.9
Coal and Metal Ore Mining 18.4 0.9 17.5
Oil & Fats 17.5 0.9 16.6
Food Products, n. e. c. 16.5 l. 1 15.5
Others 111. 7 6.2 105.5
Total 570.3 24.7 545.6
Net Foreign Exchange Earnings Ratio of Net Foreign Exchange Earnings= Gross Earnings of Exports
(Billion Rupiahs)
Ratio of Net
Foreign Exchange Earnings
(%)
99.2 94.2
90.4
96.2
97.1
95.2
9~.8 93.6
94.4
95.7
4.8. IMPACT OF EACH FINAL DEMAND COMPONENT
The impact of one unit's increase of each component of final demand (private consumption expenditure, government consumption expenditure, gross fixed capital formation, change in inventories and exports) on output, gross vaiue added, imports and employment has been computed. The figurees representing the impacts on output, gross value added, imports, and employment can be found in analytical tables. Tables A-6, B-9 and C-9 in Volume II show each domestic product induced by each component of final demand. Tables B-12 and C-12 in Volume II show gross value added induced by each component of final demand. Tables A-7, B-10 and C-10 in Volume II show imports induced by each component of final demand. Tables B-14 and C-14 in Volume II show employment induced by each component of final demand.
From the input-output table, it is seen that Rp 5,076.8 billion of final demand creates Rp 7,107.9 billion in output. For example, Rp 3,177.6 billion in private consumption expenditures generated Rp 4,564.5 billion in output. Because of the differences in commodity con:iposition between each component of the final demand sectors, the extent of outputs induced differs. The inducement of output is greatest in the case of private consumption expenditure, where induced output is 1.4365 times that of private consumption expenditures. In the case of government con-
- 39-
L
L-
.._
'--
'--
~

sumption expenditures, gross fixed capital formation, change in inventories and exports, the inducement coefficients with respect to output are 1.1598, L368 I, 1.2622 and 1.4026, respectively.
The same analysis was made with respect to gross value added, imports and employment. The results are summarised in Table 4.11 below:
Table 4. 11: The Impact of Each Final Demand Component on Output,
Imports, Gross Value Added and Employment
Final Induced Induced Induced
Induced Gross
Components of Demand Output Imports Value Added
Employment
Final Demand
Code I Bill ion %
Billion %
Billion % Billion % 1,000
% Rp Rp Rp Rp Men
---· 301 Private Household 3,177.6 62.6 4,564.5 64.2 430.9 53.3 2. 746. 7 14.3 33,415 81.0
Consumption Expendi -tu res
302 Government Consump-t ion Expenditures
323.2 6.4 374.9 5.3 29.0 3.6 294.2 6.9 2,310 5.6
303 Gross Fixed Capital Formation
937.4 18.5 1,282.4 18.0 297.5 36.8 639.9 15.0 2,891 7.0
304 Change in Invent o ries 68.3 1.3 86.2 1. 3 17.2 2. 1 51.1 I. 2 567 I. 4
305 Exports i 570.3 11.2 799.9 11. 2 31.8 4.0 538.5 12.6 2,079 5.0
Total 5,076.8 100.0 7,107.9 100.0 806.4 100.0 4,270.4 100 . 0 41,261 100.0
The main conclusions that can be derived from the above table are: (1) Gross fixed capital formation has a greater impact on imports than other components of
final demand. (2) Private consumption expenditures have the strongest ability to generate employment.
4.9. THE FEATURES OF PRODUCTION SECTORS
4.9.1. Intermediate Demand Ratio and Intermediate Input Ratio The intermediate demand ratio is defined as
Intermediate Demand Ratio - Intermediate Demand ..... : : . . . . . . . . . . . . . . . (4.1) Supply
And, the intermediate input ratio is also defined as
Intermediate Input Ratio -= Intermediate Input . . . . . . . . . . . . . . . . . . . . . . . . . . . (4.2) Output
The average intermediate input ratio in 197 t' was 0 .. 4394, ·and the · average intermediate demand ratio was 0.4719. These ratios were also calculated for each sector. Based on these results, sectors are grouped into four categories. Group I: high intermediate demand ~nd low intermediate input; Group II: high intermediate demand and high intermediate input; Gro~p 'm: low intermediate demand and high intermediate input; and Group IV: low intermediate demand and low intermediate input.
Intermediate Demand Ratio
~verage
Figure 4.5: Illustration
Group I Group II I
- - - - - - - - - - - -- T - - - - - - - - - - - -
Group IV . I I. I
Average
Group III
These ratios are shown in Table 4J2 -and in Figure 4.6.
Intermediate Input Ratio
- 40 -

Tab!P. 4.12: Intermediate Input Ratio and Intermediate Demand Ratio (66 Sector Classification)
----Code
-+ 01 ! 02 03 04 05 06 07
I 08 09 10 11 12 13 14 15 16 17 18 19 20 21 22 23 24 25 26 27 28 29 30 31 32 33 34 35 36 37 38 39 40 41 42 43 44 45 46 47 48 49 50 51 52 53 54 55 56 57 58 59 60 61 62 63 64 65 66
Sectors
--------- --- ---- ___ ___ J l'adJy Hand- pounding of Rice Maize Hoot Crops Vegetables & Fruits Other Farm Food Crops Rubber Sugar Cane & Brown Sugar Coconut Coconut & Palm Oil Tobacco Leaves and Tobacco Processed Roasted Coffee Tea Leaves & Farm Processed Tea Cloves Nutmeg Other Spices Other Crops Livestock Slau~htering Poultry & Products Logging & Sawmi 11 ing Other Forest Products Fisheries Coal & Metal Ore Mining Petroleum & Natural Gas Other Quarrying Processing & Preserving of Foods Oil & Fats Rice Milling, Clearing & Polishipg Wheat Flour & Products Sugar Refining Food Products, not elsewhere classified Beverages Industries Cigarettes Spinning Industries Textile, Leather & Wearing Apparel Wood & Wood Products Paper, Paper Products & Printing Fertilizers & Pesticides Chemical Industries Petroleum Refining Rubber Products Non-metal I ic Mineral Products Cement Iron & Steel Industries Non-ferrous Basic Metal Industries Prefabricated Metal Products Machinery, Electrical Appliances & Acces$ories Manufacture & Repairs of Transport Equipment Other Manufacturing Industries, not elsewhere classified Electricity, Gas & Water Supplies Construct ion Trade Restaurants & Hotels Railways Road Trans port Water Transport Air Transport Services Allied to Transport Communication Financial Services Real Estate & Business Services Pub! ic Administration Social & Community Services Recreational, Cultural, Personal & Household Services Unspecified
Total
Average
- 41 -
I I
lntermcdiatl' Intermediate
Input Kat in l)pmand Kat io
---------ll . O(j\14 1.0000 tl . 7986 0.0294 0.0742 o. 1219 0.2695 0.2475 0.0568 o. 1006 0 . 1288 0.5656 0.5787 0.4255 0.3772 0.7549 0.0441 0.6809 0.5396 0.4660 0 . 5723 0.5309 0 . 3566 0.4627 0.4729 0.3330 0.0490 0.9980 o. 1573 0.2443 0.0652 0.1155 0.0931 0.8745 0.0829 0 . 7921 0.6491 o. 1905 0.0873 0.4696 0.2919 0.5694 0.0459 0.7579 0.2823 0.3217 0.3023 0.3749 0.0603 0.5752 o. 1282 0. 4281 0.7498 0.3377 0.8068 0.0369 o. 84 72 0.3850 o. 7477 0.3837 0.5655 0.0397 0.6744 0.1711 0.6370 0.6532 0.6733 0.0898 o. 7044 0.9484 0.6857 0.3034 0. 7154 0. 5294 0. 4548 0.6236 0. 7301 0.9993 0.6320 0.5360 0.6649 0.6634 o. 6511 0.9100 0.4372 0.8875 0.6968 1.0000 0.7338 0.9303 0.6326 0.6759 0.6359 0.6779 0.5588 0.0950 0. 4 701 0.5007 0.6204 0.3384 0.5130 o. 7528 0.6421 0.0799 0. 1338 0.3284 0.7332 0. 1356 0.6672 0.5846 0.3489 0.3906 0.4982 0. 1762 0.4341 0.2764 0. 1828 0.2699 0.4494 o. 4475 0.3205 0.8427 0.2235 0.2197 0.0000 1.0000 0.2788 0.4195 0.2168 0.0045 1.0000 0.0717
'.!9.0015 31. 1460
0.4394 0.4719
L
~
L__
,.__
'-
L...
L-

IDR
17 .
18
0.75_ 22 . 9 .
25 . 0.50 _
Figure 4.6: Intermediate Input Ratio (IIR) and Intermediate Demand Ratio ( !DR) (66 Sector Classification)
43
*
38 .
49 .
44 39 . .
42 .
47 46•• -41
33 • .
35 • 45 .
0.47 t-----------------4~---------------------12 ~ 10
0.25-
0.00
zo
3
16 5 • .
63 . 59 .
15 .
65
64
56 24 . .
23 . 58 .
13 .
31 . 48 •
7 . 50 .
:,0 29 . . 27 .
36
52 ~ . •
'--------L.'-l,-------'--~-----~, ------T.....--~- IIR o.« I 0.25 0,50 0. 75 1.00
- 42 - ____ I
I I
I
I I
f f

Group 01 06 08 09 14 17 18 21 22 25 43 61 63
Group II 11 33 35 37 38 39 40 41 42 44 45 46 47 49 51 55
Group III 02 07 10 13 19 27 28 29 30 31 32 34 36 48 50 52
GROUPING OF SECTORS FOR FIGURE 4.6
Paddy Other Farm Food ·crops Sugar Cane & Brown Sugar Coconut Cloves Other Crops Livestock Logging & Sawmilling Other Forest Products Petroleum & Natural Gas Non-metalic Minerals Financial Intermediaries Public Administratiion
Farm Processed Tobacco Beverage Industries Spinning Industries Wood & Wood Products Paper, Paper Products & Printing Fertilizers & Pesticides Chemical Industries Petroleum Refineries Rubber Products Cement Iron & Steel Industries Non-ferrous Basic Metal Industries Prefabricated Metal Products Manufacture & Repairs of Transportation Equipment Electricity, Gas & Water Railways
Handpounding of Rice Rubber Coconut & Palm Oil Tea Leaves Slaughtering Processed & Preserved Foods Oil & Fats Rice Milling, Cleaning & Polishing Wheat Flour & Products Sugar Refining Food Products, not elsewhere classified Cigarettes Textile, Leather & Wearing Apparel Machinery, Electrical Appliances & Accessories Other Manufacturir!g Industries, not elsewhere classified Construction
- 43 -
L..
~
L-

.....,
54 57 60 66
Group IV 03 04 05 12 15 16 20 23 24 26 53 56 58 59 62 64 65
Restaurants & Hotels Water Transport Communication Unspecified Sector
Maize Root Crops Vegetables & Fruits Roasted Coffee Nutmeg Other Spices Poultry (& Products) Fisheries Coal & Metal Ore Mining Other Quarrying Trade Road Transport Air Transport Services Allied to Transport Real Estate & Business Services Social & Community Services Culture & Amusement Services
From another point of view, intermediate input ratio is the reverse of the value added ratio. The sector which has the highest value added ratio in 19 sector classification is paddy (sector 01) which has a ratio of 0.9306. In 66 sector classification, coconut (sector 09) has the highest ratio at 0.9559. The other value added ratios for all sectors can be found in the following Table 4.13.
Table 4.13 :. Value Added Ratio ( 19 and 66 Sector Classification)
19 Sector 66 Sector Classification Classification
Sector Ratio Sector Ratio Sector Ratio Sector Ratio·
01 0.9306 01 0.9306 23 0.7177 45 0.2662 02 0.5218 02 0.2014 24 0.6977 46 0.3674 03 0.5760 03 0.9258 25 0.9397 47 0.3641 04 0.6943 04 0.7305 26 0.8718 48 0.4412 05 0. 7385 05 0.9432 27 0.2502 49 0.5299 06 0.7177 06 0.8712 28 0.1932 50 0.3776 07 0.9125 07 0.4213 29 0. 1528 51 0.4870 08 0. 2541 08 0.6228 30 0.2523 52 0.3579 09 0. 4024 09 0.9559 31 0.4345 53 0.8662 10 0.3351 10 0.4604 32 0.3256 54 0.2668 11 0.4878 11 0.4277 33 0.3630 55 0.3327 12 0.3579 12 0.6434 34 0.3267 56 0. 6511 13 0.8662 13 0.5271 35 0.2956 57 0.5018 14 0.2668 14 0. 9510 36 0.3143 58 0.5659 15 0.6252 15 0.8427 37 0.2846 59 0.8172 16 0. 7502 16 0.9348 38 0.5452 60 0.3306 17 1.0000 17 0.9069 39 0.2699 61 0.6795 18 0.7635 18 0.9171 40 0.3680 62 0.7765 19 0.0000 19 0.3509 41 0.3351 63 1.0000
Average 0.'6008 20 0.9127 42 0.3489 64 0.7213 21 0.7081 43 0.5628 65 0.7832 22 0.9541 44 0.3032 66 0.0000
Average 0.6008
- 44 -

4.9.2. Total Gross Yalu~ Added Coefficients, Total Employment Coefficients, and Total
Import Coefficients In Volume II, the total gross value added coefficient in Tables B-13 and C-13, the total
employment coefficient in Tables B-15 and C-15 and the total import coefficient in Tables B-11 and C-11 show the direct and indirect impact of one unit increase in final dt!mand for a given sector on its gross value added, employment and imports. These coefficients are useful in economic planning. Table 4.14 shows the total gross value added coefficients, total employment coefficients and total import coefficients.
-Code
01 02 03 04 05 06 07 08 09 10 11 12 13 14 15 16 17 18 19
Tabel 4.14: Total Gross Value Added Coefficients, Total Employment Coefficients, and Total Import Coefficients ( 19 Sector Classification)
Total Total Gross Employment
Sectors Value Added Coefficients Coefficients (Persons/
Million Rp)
Paddy 0.977 16.5 Other Farm Food Crops 0.978 30.1 Other Agricultural Crops 0.935 4. 4 Livestock and Products 0.987 3.2 Forestry 0.962 1.6 Fisheries 0.977 3.8 Mining & Quarrying 0.985 0.6 Food, Beverages· & Tobacco Industries 0.929 9.2 Other Manufacturing Industries 0.784 4.9 Petroleum Refining 0.946 1. 4 Electricity, Gas & Water Supplies 0.927 2.7 Construction 0.830 3.2 Trade 0. 969 4.6 Restaurants & Hotels 0.931 10.0 Transport and Communication 0.881 2.9 Financial, Real Estate & Business Services 0.946 1.3 Public Administration 1.000 7. 1 Other Services 0.929 11. 9 Unspecified 0.765 60 .6
4.9.3. Net Foreign Exchange Earning Coefficients by Exports
Total Import
Coefficients
0.023 0.023 0. 119 0.020 0.040 0.024 0.038 0. 167 0.576 0.099 0.072 0.170 0.031 0.069 0. 182 0.126 0.000 0.072 0.438
These coefficients can be obtained from Table B-16 and C-16 in Volume II, which show net foreign exchange earnings by exports. As already known, exports earns foreign exchange, but a certain amount of imported inputs are required for the production of exported goods. This coefficient gives the foreign exchange earning on a net basis. In other words, the sector which has a higher coefficient is more effective in earning foreign exchange.
Exports of primary goods usually have high coefficients, but for manufactured goods it is rather low. Among manufactured goods, the goods which use more domestic inputs also have a higher coefficient.
4.9.4. Power of Dispersion and Degree of Sensitivity The following is the table which shows the power of dispersion and degree of sensitivity .
- 45, -
l 7 l 7 7 7 7 7 7 I
7 7 7 l 7 l 7 7
7

Table 4.15 · Power of Cispersion and Degree of Sensitivity (66 Sector Classification )
Code
01 02 03 04 05 06 07 08 09 10 11 12 13 14 15 16 17 18 19 20 21 22 23 24 25 26 27 28 29 30 31 32 33 34 35 36 37 38 39 40 41 42 43 44 45 46 47 48 49 50 51 52 53 54 55 56 57 58 59 60 61 62 63 64 65 66
Paddy Hand-pounding of Rice . Maize Root Crops Vegetables & Fruits Other Farm Food Crops Rubber Sugar Cane & Brown Sugar Coconut Coconu & Palm Oil
Sectors
Tobac c o Leaves and T obacco Processed Roasted Coffee Tea Leaves, Farm Processed Tea Cloves Nutmeg Other Spices Other Crops Livestock Slaughtering Poultry & Products Logging & Sawmilling Other Forest Products Fisheries Coal & Metal Ore Mining Petroleum & Natural Gas Other Quarrying Processing & Preserving of Foods Oil & Fats Rice Mi 11 ing, Cleaning & Polishing Wheat Flour & Products Sugar Refining Food Products, not elsewhere classified Beverage Industries Cigarettes Spinning Industries Textile, Leather & Wearing Apparel Wood & Wood Products Paper, Paper Products & Printing Fertilizers & Pesticides Chemical Industries Petroleum Refining Rubber Products Non-metal ic Mineral Products Cement Iron and Steel Industries Non-ferrous Basic Metal Industries Prefabricated Metal Products Machinery, Electrical Appliances & Accessories Manufacture & Repair of Transport Equipment Other Manufacturing Industries, not elsewhere classified Electricity, Gas & Water Supplies Construction Trade Restaurants & Hote Is Railways Road Transport Water Transport Air Transport Services Al 1 ied to Transport Comminication Financial Services Real Estate & Business Services Public Administration Social & Community Services Recreational , Cultural, Personal & Household Services Unspecified
- 46 -
Power of Dispersion
0.6429 1.0929 0.6414 0.8129 0 . 6840 0.6747 1. 2367 0.9555 0.6173 0.9615 I. 2351 0.8924 1. 0300 0.6229 0. 7121 0.6307 0.6715 0.6470 1.0076 0.6362 0.8455 0.6151 0.8166 0.8898 0.6317 0.7241 l. 3408 1.2985 l. 1420 l. 3144 1.1436 l. 1337 1.2592 1.1144 l. 1745 1.3898 l. 2128 1.0207 1.2377 l. 2671 1.0487 l. 3292 0.9919 1. 2706 1.4323 1. 1478 l. 3183 l. 1802 1.0960 l'.0630 1.1012 1. 1915 o:'7121 1.2509 1. 2642 0.9360 1.0956 1.0228 0. 7559 1. 0319 0.8958 0.8076 0.5711 0 . 8708 0 . 8108 1. 6870
Degree of Sensitivity
1.6328 0.6496 0.6999 o. 7940 0.6650 0.8244 1. 2763 1.0500 I. 1176 0.9941 I. 1074
.0. 8631 0.7990 0.8002 0.5766 0.5835 0.9117 1. 0089 0.6555 0.7141 1.1623 0.6992 1. 0883 1. 1702 1.9286 0. 7575 o. 7855 0.8947 0.6709 0.7625 0.6639 0. 7437 0.6452 0.6308 0.8327 1. 2421 0.7875 1. 3424 0.7773 1.5399 2. 1462 0.7379 0 . 7232 0.6547 l. 383i 0.9650 1.0161 1.0931 1: 8670 0.6566 1.4402 1. 0696 3.6145 1.0699 0.6539 1. 9621 0.7323 o. 7140 0. 7842 0.6953 1. 114 7 0.9408 0. 5711 0.6410 0.7656 1. 1382

To get a comprehensive picture of the relationship between the power of dispersion and the degree of sensitivity, sectors are classified into 4 groups.
Degree of Sensitivity
Average
(1.0)
Figure 4 .7: Illustration
Group I I I
Group Ill
--------, -----------Group II ' I
Average (1.0)
Group IV
Power of Dispersion
Group I includes sectors with low power of dispersion and high degree of sensitivity. Group II includes sectors with low power of dispersion and low degree of sensitivity. Group III includes sectors with high power of dispersion and high degree of sensitivity, and finally, Group IV includes sectors with high power of dispersion and low degree of sensitivity. In general, Group I and II are made up of the primary and service sectors, and Group III and IV the heavy and light manufacturing sectors. Detailed information about the relationship between power of dispersion and degree of sensitivity can be obtained from Figure 4.8 . The grouping of sectors is as follows:
Group 01 08 09 18 21 23 24 25 53 56 61
Group II 03 04 05 06 10 12 14 15 16 17 20 22 26 43 59 62 63 64 65
Paddy Sugar Cane & Brown Sugar Coconut Livestock Logging & Sawmilling Fisheries Coal & Metal Ore Mining Petroleum & Natural Gas Trade Road Transport Financial Services
Maize Root Crops Vegetables & Fruits Other Farm Food Crops Coconut & Palm Oil Roasted Coffee Cloves Nutmeg Other Spices Other Crops Poultry & Products Other Forest Products Other Quarrying Non-metalic Minerals Services Allied to Transport Real Estate & Business Services Public Administration Social & Community Services Recreational, Cultural, Personal & Household Services
- 47 -
t.....
~
,__
~
---
.._
'-
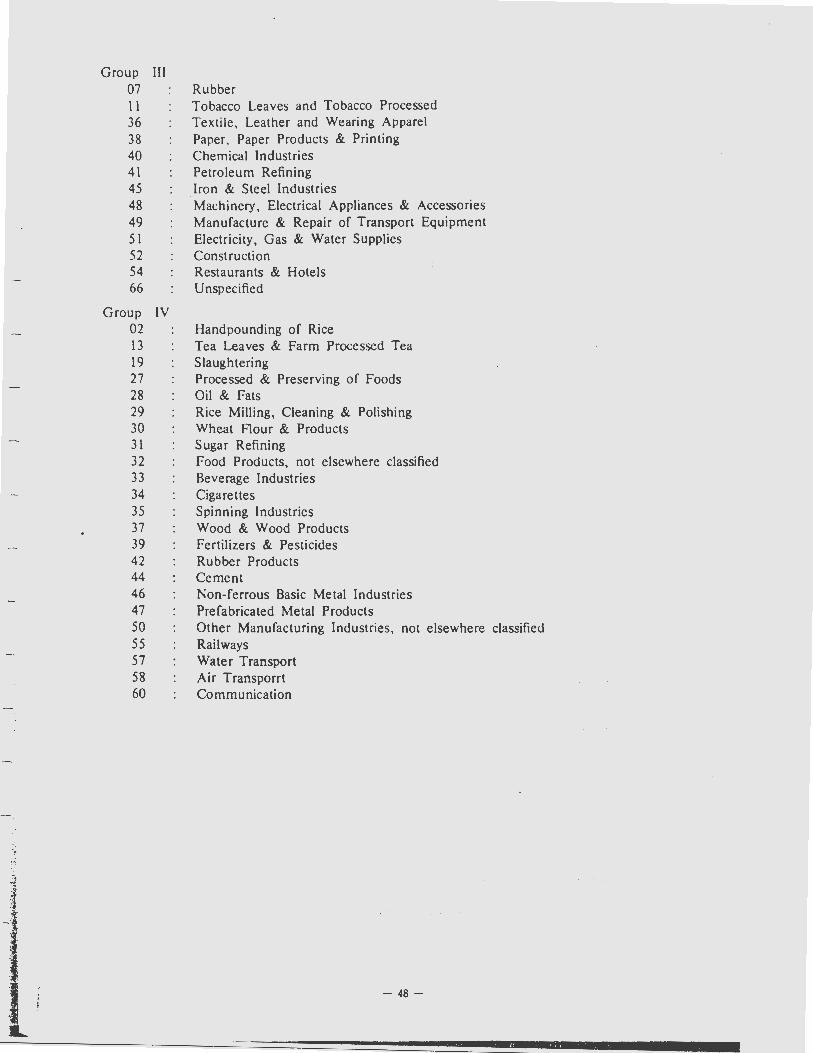
Group III 07 11 36 38 40 41 45 48 49 51 52 54 66
Group IV 02 13 19 27 28 29 30 31 32 33 34 35 37 39 42 44 46 47 50 55 57 58 60
Rubber Tobacco Leaves and Tobacco Processed Textile, Leather and Wearing Apparel Paper, Paper Products & Printing Chemical Industries Petroleum Refining Iron & Steel Industries Machinery, Electrical Appliances & Accessories . Manufacture & Repair of Transport Equipment Electricity, Gas & Water Supplies Construction Restaurants & Hotels Unspecified
Handpounding of Rice Tea Leaves & Farm Processed Tea Slaughtering Processed & Preserving of Foods Oil & Fats Rice Milling, Cleaning & Polishing Wheat Flour & Products Sugar Refining Food Products, not elsewhere classified Beverage Industries Cigarettes Spinning Industries Wood & Wood Products Fertilizers & Pesticides Rubber Products Cement Non-ferrous Basic Metal Industries Prefabricated Metal Products Other Manufacturing Industries, not elsewhere classified Railways Water Transport Air Transporrt Communication
- 48 -

Degree of Sensitivity
(D.S.)
3.8
3.7
3.6
3.5
~
L2
Ll
LO
1.9
1.8
1.7
I~
1.5
1.4
I~
1.2
1.1
Q9
Q8
Q7
Q6
Q5
OA
Q3
Q2
QI
QO
Figure 4. 8: Power of Dispersion ( P.O.) and
Degree of Sensitivity ( D.S. )
63
(66 Sector Classification)
s.J
~
9 21 24 . . . 61
Z3 . . 18
17 6: .
12 . ~4
26 59 ! . .
20 • 65
... 3 5 22 • 64 . 16 15 . .
4)
56 . 49
SJ
!
~
II 48 • 54 . .
¥
52 • 47
10
o.
46 ~
If ~
sz~ ·•60 2 29 . . . : 9 50 .31
34
37- 27 •-:' ~. 42
55
Jj. 44
45 .
6!>
0.1 0.2 0:3 0.4 0 .5 0.6 0.7 0 .8 0.9 1.0 1.1 1.2 1.3 1.4 1.5 1.6 1.7 1.8 1.9 .2.0
- 49 -
Power of Dispersion
(P.O.)
L...-
L.-
L
L-
'-
L-
I-
L ·
.._.
~
.......
'-

APPENDICES
- 51 -

APPENDIX A: SECTOR AND COMMODITY CLASSIFICATION FOR
1971 INPUT - OUTPUT TABLE OF INDONESIA
Komoditi/Commudiry Tabc:I da.sar/ 175 X 175
Tabc:I dipcrinakas/ 66 X66 &sic tab/, Anr,,at,d tab/,
Kodc/Cod, Uraian/ De scrip/ion Kode/Cod, Judul/Titlr Kode/Cod, Judul/Titl,
(I) (2) (3) (4) (S) (6)
1110-01-1 Padc/Paddy 1-0(11 Padi/Paddy 1-01 Padi/Paddy 2 Jcrami/Stra w
3116-01-1 Beras lurnbuk/HandP_oundt>d rict> 1-002 Pcnumbukan padi/ 1-02 Pcnumbukan 2 Dcdak/Ric, bran HandpoundinJ of ricr padi/ 3 Mcrani/Straw Handpounding
of ricr
1110-02-1 JaaunaJMaiu 1-003 JaaunaJMaiu 1-03 Jaauna/Maiu 2 Jaauna muda/ Younx nwiu ) Klobot/ Klobot 4 Batana}St,m s Jonuol/Jon11110I
1110-03-1 Kctcla pohon/Canava 1-004 Kctcla pohon/ 1-04 Tanaman umbi-2 Daun sinek.on&/Cauava kavrs Cassawi umbian/Root 3 Batana sinak.on&JCassava sum crops
3116-03-1 Gaplck/Drit>d cassaya 1-005 Gaplck dan tcpun11 2 Tcpun11 tapioka/Tapioca flour tapioka/Dri,d ca.uava 3 Ampas tapioka/Tapioca ca~ and tapioca /lour 4 Saau/Sago
1110-04-1 Kctcla rambal/Swut pouuon 1-006 Umbi-<nnbian lainnya/ 2 Kcntanll/Potato,s 01hrr rool crops 9 Umbi-umbian lainnya & hasil-hasilnya/
Othu root crops & products thu,of
1110-0S-I Bawana/Onion 1-007 Sayur-uyuran/ I-OS Sayur-uyuran 2 Wortcl/Carrot v,,r1abln & buah-buahan/ ) Kobis/CabbaK, V,grtabln & 4 Kctimun/Cucumb,r fruits s Cabe/Chili 6 Tomat/Tomato 7 Bay am/Spinach 8 Kacana pal"ijana}String beans 9 Lainnya/Othtrs '
1110-06-1 Piuna}&nana 1-008 Buah-buahan/ Fruits 2 Pcpaya/ Pupaya 3 Man&aa/ MangKO'S . 4 JcrukJOrangt 5 Nanas/Pin,appl, 6 Durian/ Durian 7 Advolr.at/Avocado 8 R.imbutan/Rambutan 9 Lainnya/Othtrs
1110-07-1 Kacan11 tanah dikupai/Pranut sh,lkd 1-009 Kacana tanah/ 1--06 Tanaman bahan 2 Kulit k.acana tanah/Ptanut sh,11 hanuls makanan lain-3 Daun kacan11 tanah/hanut /,.avts ny&/Othtr farm
1110-08-1 Kacan11 kedelc dikupai/Soy b,an food crops
1-010 Kacan11 kedelc/ Jh,11,d Soy /wans
2 Kulit kacana kedclc/Soy /wan sh,.// 3 Daun kcdclc/Soy bran /,.avts
1110--09-1 Kacan11 hijau/Grttn b,ans 1-011 Kacan11-kacanaan & 2 Kulit kacana-l<ac:in11an/&an, & nut biji~ijian lainnya/
shtll Othtr b,ans dt nuts 3 Ratana kacana-lcacanaan/ &an & nut
Sl~m
9 K.acan11-kacan11an lainnya/Oth,r b,ans &: nuts
1110-10-1 Latcb/Ult~x 1-012 Latcks/Lat,x 1-07 Karcl/R,,bb,r
3552-01-1 K.arct aupan/Smo~d rubb,r 1-013 Penauapan & rcmil-2 K.arct rcmilinll/R..mi/1,d rwbb,r lu.ret1Smokin1 &
r,mi/lln1 a[ rubb,r
1110-11-1 Tcbu/Su1arcan, 1-014 Tcbu/ 1-08 Tcbu 11ula & 2 Daun tcbu/Can, ltuv,s Su1ar can, 1ula ralcyal/
3118-01-1 Gula mc:rah/Brown su1ar Sugar can, &:
1-015 Gula mcrah/Brown brown SU6ar .1u1ar
1110-12-1 Kela pa/Coconut 1-016 Kelapa/Coconut 1-09 Kclapa/Coconut 2 Kopra/Copru 3 Daun kelapa/Coconut l,av,s 4 Lidi/ l..ref ribs 5 Sabut kclapa/Coconut fibr,s 6 TcmpurunaJCoconut shtll 9 Lainnya/Othtrs
3 I I S-01-1 Minyak lcclapa/Coconut oil 1-017 Minyak k.clapa ralcyat/ 1-10 Minyalc kelapa 2 Bunalcil kopra/Copra calu Farm coconut oil rakyat & aawit/
I l 10-t3-I Coconut &
Minyalc aawil/Palm oil 1-018 Kclapa aawitJPalm palm oil 2 Biji aawit/Pa/m /urn,/ oil
Tabc:I dipcrinaka•/ (9 X )9 Aur,iatrd rabl,
Kodc/Cod, Judul/Titk
(7) (8)
1-01 Padi/Padd)'
1-02 Tanaman bahan makanan lainnya/Othrr farm food crop.<
1-03 Tanaman pertanian lainnya/Othu a1rlcwltural crops
7 7
l
7 7 7 7 7 l 7 7 7 7 7 7 7 7 l l

..
Ko modi t i/Commodl ty Tabel dasar/ 175 >< 17' Tabel dipcrin,kasi 66 " 66
Tabel dipcrinakas/ 19 x 19 Basic tablt Aurt1a1,d tublt A1grtt.,i,d tablt
Kodc/Cod, Uraianl~1crlptl,1tt Kode/Codt Judul/Tuu. Kodl:/Codr Ju<lJI/Tit/, Kode/Cod, Judul/T/1/,
(I) (2) (3) (4) (5) (6) (7) (8)
1110-13-3 Sabul kelapa sawil/Pa/m Jih,,., Tanaman 4 Tcmpurunaf Pulm shr/1 Kclapa sawi1, ,-..,,i..,
1-018 1-10 1-03 penanian oil lainnya/Othtr 1110-15-1 D~~m lcmbak.lu/Tobacco ,...,,,.._, .
2 Bu, tcmbak.lu/Tobacco .,,.,, 1-020 T embakauJ TOll,at-cu 1-11 Tembakau daun atrlcw/1ural & olahan/ rrops
3140-01-1 Tcmbauu lcmpenaf Ptocru,-,1· ,..,_, Tobacco l,ovr1
2 Tcmbauu irir./Cut tobac"" uo 1-021 Tcmbakau olanu.nl & 1obacco
9 LainnyaJOt/i,rs Ptocrssrd t~o pra,,.~rurd
1110-16-1 Kopi biji kerinaJCo/Ju .,,.,4 1 t,lr,·J 1-022 kopi/Cofl,r 1-12 Kopi & kopi
3121-01-1 Kopi aorcna}Rcxuud co/fr, Sottna/ Roasrrd 1-023 Kopi olahan rrwcyat/ ca/fu
· Farm procc-.mct coffee 1110-17-1 Tch daun/T,a /raws
1-024 Tch daw\/T-v•w• 1-13 Tch daun & teh 3121-01-1 Tch hitam/8/ack tra olahan ral<)'al/
f'-025 Teh olahan ,-Yat/ Tro kaws & Farm proc.-4 "" far,., proc,u,d
"" II 10-18-1 Ccnakch/Clovu 1-026 Cenakch/a.,...,, 1-14 Ccnakeh/Clovu
II 10-19-1 Pala/Nu1mrg 2 Biji pala/Mac, 1-027 Pala/Nw•- 1-15 P,Ua/Nut-t 3 Fulli/Ful/i
1110-20-1 Lada/Ptpptr 2 Kuli1 kayu manis/Cinna- 1-028 Rcmpah-" lain- 1-16 Rrmpah-rcmpah 3 Vanili/ Vanilla nya/Otltrr _,.., lainnya/Othrr 4 Krmiri/K.tmiri spicrs
5 PinanaJArrcanut 9 LainnyaJOthus
1110-14-1 Kapas/Cotton 2 Kapok/Kapok 1-019 Tanaman scm.t/Crops 1-17 Tanaman lain-3 Sera1 rosella/ Roulla fiMr for matti,q ~ uxr/1,s nya/Othrr crops 4 Sera! manila/Man/lo fib,,-5 Sera! pandlln/Pandan /iJ»., 6 Sera1 si•al/ Hard ropr 7 Sera1 rami/&mi fibr, 9 Lainnya/Ot/ius . .
1110-14-1 Coklai/Cocoa 2 Minyak scrch/Citron,llo yo( 1-029 Tan&m&D. llamnya/ 3 Mtnyak kayu pu1ih/Kay",..,.,.. .
1 o,i,,.,~
4 Krlcmbak/K.tkmbak 0 • 5 Pirclrum/Pirnhrum 6 Gambir/Gambir 7 Kuli1 kina/Cinc/iona bear .. 8 Bunaa/F/ow,rs 9 Lainnya/Othtrs
II 10-22-1 Sapi/Ca11/~ ••.
2 1Co1oran sapi/ Manwr, 1-030 Petemaba upi/ 1-18 Peternakan/ 1-04 Pflffllakan.l: Cattlr---, Uvntock hasil~ilnya/
1110-23-1 Susu seaar/Fr~,h milk Uw11ockand 1-031 Pfl~upl prodtters
perabl--.c-ow
1110-2-4-1 >
, .. 1s .... ~rbau/&,/Jalo
2 Kambina/Goat 1-032 Peter----.. lainnyl/ 3 Domba/Shup Orlw,._,ock
---, I " Babi/Pir 5 Ku,uJHors,
..J 6 1Co1oran lalMya/Orh,r----., 9 Lalnnya/Othrrs
-, I
_.;
3111-01-1 Daaina upi/Bu/ · 2 Daaina kcrbau/&,/Ja/o ....._ 1-033 p- CLI 1emak/ 1-19 Pcmotonaan 3 Daaina kambinaJMun- ' Sl"M ....... 1emak/Slow1h-4 Daaina babi/ Pork tnlnr 5 Dqina unaaaa/Poultry ......, 6 Jcroan/0/fa/s 7 Kulil/Hldrs
1110-25-1 AyamJChlcun 2 llikJDuck 1-034 P~/Poultry 1-20 Pcrunaaasan & 3 Kalkun/Turk,y hasil-hasilnya/ 4 Anasa/Goou Poultry & 9 Lainnya/Ot/irrs produc11
i ...,;
1110-26-1 Tclur/£,rs -9 Lainnya/Othtr, 1-035 Has.il----.il unaaas/
1220-01-J P04tbr,, :,rodwcu
Kayu rimba/For,11......, 2 Kayu ja1i/T,ak wood 1-036 r-· 11 DYii 1-21 Pcnebanpn & · 1-05 · ac.llul&nan/ 3 Kayu bakar/F/r, woo,t h..._.&ac,tnf penaaeraajian ,_.,,, 4 Kayu aabu1/Cork kayu/Lt>11tn1 & 5 Arana}Charcoal saw mlllln1
-54 -

Tabcl dasar/ )75 X 175 Tabcl dipcrinalr.as 1 66 ><66
Tabcl diperinakas/ 19 >< 19 Komodili/Commodily BaJlc tablr Aur,wa1,d tabl, AKll"lfOlrd tubl, 7
Kode/Codr Uraian/ Dt! .~crip1lo11 Kode/Cod, Judul/Tit/r Kodc/Codr Judul/T/t/, Kodc/Codr Judul/Tir/,
(I) (2) (3) (4) (5) (6) (7) (8)
3311-01-1 Kayu jati 1cr1ajian/Truk wood, .,uwm 1-037 Pcn11craajian kayu di 1-21 Pcncb tnJan &. 1-05 Kchutanan/
2 Kayu rim:>a 1er11ajinn/Forrs1 wood, hutan/Sawml//inr in pcnn•· : iiajian Fur,,,,,. .rowm forrsls kayu/1.,0111(/n,c & 7
9 Kayu lainnya/Othrr woods su111 milli11i
1220-02-1 Barnbu/&,mboo 1-038 Bambu/Bamboo 1-22 Hasil !,utan 2 Rcbun&fBamboo shoot lainnyn/Otllrr
for,sl prodwcts 1220-02-1 Huil hutan lainnya/Othrr forrsl 1-039 Hasil hutan lainnya/ l
products Othrr fortsl prodwcts 2 HasiJ perburuan/Huntin1 . trappin1 &
xam, propaxation
1301-01-1 lkan taut/Marin, fehrs 1-040 Pcrikanan laut/ 1-23 Pcrikanan/ t-06 Pcrikanan/ Marini' fi._t:hinK FiJhrri,J Fish,ri,s 7
1302-01-1 lkan cmpan&JPond fehrs I-OU Pcrikanan darat/ 2 titan peliharaan lainnya/Othrr Inland fi.1hln1
cultivatrd fish<> 3 !Ir.an darat lainnya/Othrr inland fishrs 7
3114-01-1 lkan lr.crin&JDrird fish 1-042 Pcnuararnan & pen-2 titan asin/Saltrd fish 1eri,wan ikan/Fislr 9 Penpwetan hasil laut lainnya/ .roltin1 a,ul dry int
Othrr prtsrrvrd sra food
2100-01-1 Li11rtit dan batubara/LJ1nitr and coal 2-043 Penambanaan batu• 2-24 Penam~na•n 2-07 Pcrtambaniian 2 Antruit & bituminous/Anthradtr 4, bara/Coal mlninr batuba ra & & pcnualian/
7 bituminous coal bijih lopm/ MininK &
Coal de _,al quarryinw 2301-01-1 Pasir bcsi//ron sand 2-045 Penamba,wan bijih or, minin1
bcsi//rOft orr lftininr 7 2302-01-1 Bijih timah/Tin Ort 2-046 Penambanaan bijih
tirnah/Tin orr minin1
2302-02-1 Bijih nikcl/Nic~I ort 2-047 I Pcnambanaan bijih ni-lr.cl/Nicul ort mlnin1 7
2302-03-1 Bauksit/ Bau xi ts 2-048 Pcnamba"'an bauk.sit/ &u.xiu ,.,;,.;n,
2302-04-1 Bijih tcmba1a/Copp,r ort 2-049 Pcnamba,wan bijih 2 Bijih emu/Gold orr t01am bukan bcsi 7 3 Bij ih pcrakJ Silvrr or, lainnya/Otlrrr ,.,,... 4 Bijih manaaan/Man1an,sr frrrous m,tal orr 9 LainnyaJOthrrs minln1
2200-01-1 Minyak bumi/Crud, p,1rolr11m 2-0M Penambanpn minyalr. 2-25 Penaml>anaan l Gas alam/Natural ras memah & 1•• bumi/ minyak·&ps 7
Crv,u fHlroh11m & bumi/1\•lrolrwm
'""""" , ... 1"lnln1 4, ""'"'"' ,as "''"'"If
2901-01-1 Batu plian/Stonr 2-050 Penualian/Qwarrylnr 2-26 Pcngalian 2 Tanah liatJC/ay lainnya/Otllrr 7 3 Pui,t.sand pits quarryi."11 4 Gampinl/Umrstonr 5 Koral/Gravt'/s 6 Mar mer/ Marbl,s 9 Lainnya/Othrrs l
2902~1-I Bclcran&/Swlphur 2-051 Penambanaan bahan 2 Yodium//odinr k.imia & pupukJ J Foafor/ Pliosphor11s Chrmlcal 4, frrtilisrr 9 Lainny&/Othrrs mlnrral mlnln1
' 2903-01-1 Garam kasar/Crudr salt 2-052 Guam kaaar/So/t l
~w,porat/Oft
2909-02-1 A.opal/ Asphalt 2-053 Pcnambanpn aspal/ . Aspllalt mln/111
2909-02-1 Gips/Cyp111m 2-0S-4 Penuatlan mineral 2 Batu api/Flinu lainll)'a/Othrr non 3 lnlan/D/amonds nwtaU/c 1,-Jn,ral 4 A.lbcs/Ar~SIOI """'n' 9 Lainnya/Othrrs
3111-02-1 Dendc:na & abon/Prtpartd mrat 3-055 lndustri pcnaolahan & 3-27 lndustri 3-08 lndustri 2 Daaina lr.ornct/Corn~d ~rf pcnaawetan da,ing/ peoiiolahan & mak.anan, 3 Da11in1 babi kalcnii/Corn,d pork Conn/111 .t pr, srrvinz penaawc·.an minuman & 4 So&ls/Sawsarrs mral malr.anan/ tembakau/Food. 5 Daaln1 olahan lainnya/Othrr mrat Procrs,l,01 & brvrra1rs &
prtparatlon prtsrrvlnr of tobacco
l l
9 Lainnya/Otllrrs food., lndustri,s
3112-01-1 Susu & upala IUSU, cair/Afilk & 3-056 lnduatri makanan dat i cr,am , llq11/d ausU/Da/ry produc/J
-2 Suau & kepals rnsu, bubukJMi/k de 7

7
-t ,. ~· -~ '. ',!q
- •· ... ¾:~ '-.; .. .
~R:
Kodc/Cod,
(I)
3112-01-3 4
3113-01-1
2
3
4
5
9
3114-01-4 9
3115-01-1
2
3115-02-1 2 3 4 s 6
7
9
3116-01-1 2 3
3116-02-1 9
3117-01-1 2
3117--02-1
3118-01-1 2 3 4
3119-01-1 2
)
4
9
3121-01-2
3121-02-1
3121-03-1 2 3 9
3121--04-1
2 3
Komoditi/Commodity
Uraian/!Nscriprion
(2)
crram, powdrr Es krimJ/ce cuanr Mcnteaa & kcjuJRu11rr & chresr
Buah-buahan & sayur-cayuran dike-rin11kan & dibckukan/Fruiu & \'t'Xt'lablrs. drird & fro:.rn Buah-buahan & sayur-cayuran dalam kalcna & botol/C<1nn,d or bo11J,d fruits &: WKrtablrs Sclai & sc,icnisnya/Jam, marmalad,s, fellirs & similar products Sari buah-buahan & sayur-cayuran/ Fruit &: vt'grtablr juicrs Buah-buahan & sayur-cayuran yana di-awctkan dcnaan cara lainnya/Fruit &: vt'grtablrs prrparrd or prrsrrvt'd by mrthod not rluwl,rr, classifi,d Lainnya/Orhns
lkan dalam kalcnll/Cann,d fish Olahan & awctan ikan & hasil laut lainnya/Othrr procrss,d & prrurvrd fish & othn ua foods
Minyak aorcn& dari kclapa/Coconut cooking oil Bunakil kopra/Copra cal<,
Minyak sawil/Palm oil Maraarin/ Margarinr Bunakil sawit/Palm cak, Minyak kacan&i P,anut oil Mcntcsa kacan&JP,anur burur Minyak & lcmak dari sayur~ayuran/ V,gnabl, oil &fats Minyak & lcmak dari hcwanJ Animal oil &fats LainnyaJOthus
Beras sosohan/Polish,d ria Dcdak/Ria bran Mcranll/Straw
Tcpuna tcria:u/Wh,at flour Tcpung yan11 bcrasal dari scrcalia lainnya/Oth,r grain flour
Roti/Br,ad Biskuit & lwch, scaala jcniS/ Othu bak,ry produc/J, all kinds
Mic, makaroni & sc,icnisnya/ Noodk, macaroni & similar products
Gula pasir/Can, sugar Gula tctcs/Molasus Arnpu tcbu/Sugar wast, Lainnya/Othus
Coklat bubuk/Cocoa powd,r Coklat & hasil-hasilnya/Chocolat, & chocolat, products Mcntcaa coklal/Cocoa buuu K.embans aula, acaala macam/Su1ar co,if,ctionary Lainnya/Othns
Kopi bubuk/Coffu powd,r
Tch/T,a
Kccap/Soya saucr Tahu/&an cak, Tcmpc/T,mp, Lainnya/Oth,rs
Krupuk, ac:11ala krupuk/ Kn,puk, all kinds Garam mcjaJTabl, salt Ea batu//c,
Tabcl dasar/ I 75 >< 175 Tabcl dipcrinakas/ 66 ><66
Tabcl dipcrinakas/ 19 >< 19 &sic tab/, Agrr,xat,d tab/, Agxr,rat,d tab/,
Kodc/Cod, Judul/Tit/, Ko~/Cod, Judul/Tit/, K~/Cod, Judul/Tit/,
(3) (4) (5) (6) (7) (8)
3-056 lndustri makanan dari 3-27 lndustri 3-08 lndustri p<n11olahan & makanan, susu/ D,,ir)• produc/J pcnaawctan minuman & makanan/ tcmbakau/Food.
3--057 lndustri pcnaolahan & Proceuing & brvrraflt'S &
pcn11awetan buah- prrst'rvinx of tobacco
buahan & sayur- foods industrit's
sayuran/Canninf & pr,urvinJ offrvl/J & WRrtablrs
3-058 I nduatri pcnaalcn11an & penaawctan ikan & hasil laut lainnya/ Canni111 &: prrsrrving fish & othu ua foods
3-059 lndustri minyak 3-28 lndustri minyak kclapa/Coconut oil & & lcmak/Oi/ & cooking oil fats
3--060 lndustri minyak & lcmak nabati lainnya & hcwani/Othn w,r,ablrs and animal oils &fats
3-061 Pcna,ilinaan & pcnyo- 3-29 Pcn111ilinaan & sohan bcras/ Ric, pcnyosohan mi/lint, cl,anln1 & bcras/ Ric, mil-polishing ling, clraning &
polishing
3-062 lndustri tcpuna teriau 3-30 lndustri tcpuna & biji-bijian lainnya/ tcriau & biji-Wh,at flour & othu bijian lainnya/ 1raln mil/ products Wh,at flour &
producu 3-064 lndustri roti,biskuit
& ac:,icnisnya/ Br,ad & bak,ry products
3-065 lndustrl mic, makaroni & acjcnisnya/ Noodl, . macoronl & similar products
.. 3-063 lndustrt pcmumian 3-31 lndustri
1ula/Su1ar rrfinlng pemumian sula/ Su1ar r,jinln1
' 3-066 lnduatrt coklat & 3-32 lndustri
kemban1 sula/Cocoa, makanan lain-dtocolai, & su1ar nyaJFoods co,ef,crlon,,ry products 1101
,Js,wh,r, class/-fed
3-067 lndustri pen111ilin11an kopi/Co/Ju grlndln1
3-068 lndustri pcnaolahan tch/T,a prcx,sslnt
3-069 lnduatrl pcnaolahan kacana kcdclc/ Svy-b,,an products
3-070 lnduatrl malulnan lain-nya/Otlt,r food products, not ,luwh,r, classifed
- 56 -

Komoditi/Commodity Tabcl dasar/ 175 X 175 Tabcl diperinakas/ 66 x 66 Tabcl dipcrinakas/ 19 X 19
Basic tab/, Aggrrgattd tab/, A1111rr11attd tubl,
Kode/Cod, Uraian/ Drscrip1ion Kode/Cod, Judul/Titl, Kode/Codr Judul/Titl, Kode/Cod, JudullTitlr
(I) (2) (3) (4) (S) (6) (7) (8)
3121-04-4 Kacanv goreng/ l'tanul , roaJltd 3-070 lndustri makanan l~in- 3-32 3-08 lndumi
s Saus, Segala macam/Svucr . all kinds nya/Othrr food makanan,
6 Dodol/Dudol products, not minuman &
9 Lainnya/Others tlsr-...1hrrr cla.uifed tembakau/Food, 3128-01-1 Makanan tcrnak/Preparrd unimal./rrd IH,•rrugr.t &
tobarcu 3131-01-1 Etil alkohol/£thi·I alcohol 3-071 lndustri minuman 3-33 lndustri minu- indu.Hrit'J
2 Araki Arrack menaanduna alkohol/ man} v, \'tTUKt'
3 Wiski/Whisky Alcoholic bnrragn industries l 9 Lainnya/Othu,
3132-01-1 Anaaur/ Win, 2 Tuak & scjenisnyalNativ, alcohol
IHv,ru~t'S 3133-01-1 Bir/B,,r
9 Lainnya/Othrrs 7 3134-01-1 Minuman ringan/Soft drink.t 3-072 lndustri minuman tak
2 Air soda/Carbonated wutrr me .. aduna alkohol/ 9 Lainnya/Oth,n Soft drinks &
carbonatt'd waur 7 3140-02-1 Rokok putih/Whit, cigarrllu 3-073 lndustri rokok/ 3-34 I nd·.,stri rokok/
2 Rokok kretek/C/ow•d ciguret/t' .t CiKar,1us Cig,rrrttes 3 Ccrutu/Cigars 9 Hasil tembakau lainnya/Othrr
tobacco producu 7 3211-01 -1 Banana kapas/Collon yarn 3-074 lndustri pcmintalan/ 3-3S lndustri pemintal- 3-09 Jndustri
2 Bcnana sutera/Si/k )'arn Spinning industrirs an/Spinning nyaJOth,r 3 Serat sisaUSisal yarn indu.urieJ manw/acturinx 4 Serat .abut kelapa/Coconur yarn induslrirs 9 Sere! lainnya, berasal dari tanaman 7
serat/Othus .from fibr, crops 3211-02-1 Sera! buatan polyamidc/
Polyamid, s)'nthrlic fibr, 2 Scrat buatan polyvinil/
Polyvinil synth,tic fibri I
3 Rayon allulosa/Rrgrnrratrd 7 crllulosr rayon
4 Rayon kuat kenyal/Hiah tercaci ty viscose
9 Scrat buatan lainnyaJ Othu synth,iic fibr,
3211-03-1 Bcnana kapas campuran/ Mixrd 7 collon yarn
3211-04-1 Bena .. jahit, scaala jeni•/ Thrrads, all kinds
3212-01-1 Bahan cita, scluruhnya dari kapas/ 3-075 Jndustri tenun/ 3-36 IndJstri tekstill, Apparrl fabrics, wholly of col/on W,avin1 industrirs kulit & pakaian/
2 Bahan cila dari campwan kapas/ Tu1ile, leather Appard fabrics, of mixrd col/on & w~aring
3 Bahan cita, scluruhnya dari serat appar,/ buatan/Appartl fabrics, wholly of synthrtic fibr,
4 Cita pcnutup, tirai & hias lainnya/
7 7
Fabrics for upholsttry, drapery & decoration
9 Lainnya/Othrrs
3213-01-1 Pm1erjann & pcnyelesaian benana & 3-076 lndustri pcnalupan, cita, terbuat dari kapas/Proc,ulng pcnp,lantansan & &finishing cotton yarn &fabrics pcncetakan tekstil,
2 Penaerjaan & pcnyelcsaian bcnana & kecuali batik/
7 cita, terbuat dari scrat alam lainnya/ Trxtlk bkadrlng, Procrssing &finishing of other printing, dyeing & natural fibr~ yarn d: fabrics fin/shin& excludinr
3 Penaerjaan & pcnyelesaian bcnana & batic cita, terbuat dari scrat campuran kapas/Processing &finishing of mlx,d co/Ion yarn &fabrics
9 Lainnya/Orhrrs
3213-02-1 Batik/Batie 3-077 Jndustri batik/ 7
Batie lndustrl,s
3213-01-1 Kaos oblon&fT-,hirt 3-078 lndustri pcrajutan/ 2 Sinalel/Athl,tic shirt Kni1tin1 lndustrirs 3 Kaos nilon/ Nylon shirt 4 Kaos banlon&/Banlon shirt
l s Kaos kaki, dari nilon/Nylon socks 7 Celana dalam/Unduwear 8 Pakaian anak, sqala jcnis/
Chlldrtn cloths, all kinds 9 Lainnya/Others 7
321S-01-1 Kain kasur/Mallreu covrrs 3-079 lndustrl barana 2 Hunduk/Tow,/s tckstil jadl, kccuall
7 - 57 - l

Tabet dasar/ 175 X JJS Tabet dipcringkas/ 66 x 66 Tabet dipcrinakas/ 19 X 19 Komoditi/Commodit>•
Basic rabl, A1u1rr11e1red rabl, Ai,:rrl(ar,d lab/,
Kode/Cod, Uraian/ Dr.'fcription Kodc/Cod, Judul}Tirl, Kodc/Cod,, Judul/Tirl, Kode/Cod, Judul/Tirl,
(I) (2) (3) (4) CS) (6) (7) (8)
321~-01 -3 Sclimut/ Blunkrr., 3-079 pakain/Madr-<•P 3-36 lndustri tckstill, 3-09 lndustri 4 Scpr<i/B,d .,hur.< r, xril, 11oods , kulit & pakaian/ nya/Othn s Krlambu/M,uqui1e, ""'·' rxcludinR 'M'earing l cxtile, leather mamifacturinK 6 Kain lirai/Drapf'r)' & luct'.t appurt'I & Wt'arinR induHrir.t 1 Kain layar/Sail.t uppar,I 8 Taplak/Tabl, cloth., 9 Lainnya/0.hers
3220-01-1 Jas pria/Suit.t & coat.t, m.rn 3-080 lndustri pakaian jadi 2 Jakct pria/Jacket & .t""'tatrr.t , '""" kecuali alas kaki/ 3 Calana pria & anak/ Trou .H•r .,. mt'n Weurit1R uppurrl .
& bO)'S rxcludinx Jootwt'CIT
......., 4 Krmrja pria & anak/Shirt.'i , men & bon·
5 Pakaian wanita & anakJ Drt's .u .t , womrn & xirl.t
6 Rok, celana & shons wanita & anak.JSl<i,u, .flack ., d: .thort.1
--, 7 Blus/Blouus & .thirt., 8 Tutup kepala/hrud warn 9 lainnya/Othrr.1
3221-01-1 Pcrmadani, dari wol/Carp,ts, woolrn 3-081 lndustri pcrmadani, 2 Pcrmadani, dari bahan lainnya/ babut, tambana, dan
CarpelS . not woolrn scbaeainya/Carp,ts, 3 Kescd, scaala jcnis/Rug.,. all kind.< ri,,.:1. rop,.s &: othrn
3222-01-1 Karun&1Gunn)' ba11.< 2 Tali, scgala jcnis/Rop,s all kind., 3 Jaring ikan , sevala jcnis/
fl:rh nrt .r. all kind.s 9 Lainnya/Othn.•
3231-01-1 Kulit sol. sapi/Cow so/r leather 3-082 lndustri pcnyamaan & 2 l<.ulit sol , kerbau/Beffulo sol, lrath,r pcnecrjaan kulit/ 3 Kulit domba/Shup l,ath,r Tann,rlrs & leather 4 K.ulit kambing/Goar leathrr finishinK s K111it pcnutup/Upp,r 1,athn 9 Lainnya/Othn.,
3233-01-1 Ban kulit untuk industri/ 3-083 Jndustri barana: dari Industrial b,lts kulit kccuali alas kaki/
2 Tas wanita/ Womt'n 's pursrs L,athtr products, & handba11.< rxcludin1 footwrar
3 Koper/ Luuag,s indu1trirs 9 Lainnya/Others
3240-01-1 Scpatu pria/Sho,s, ,,.,n 3-084 lndustri alas kaki ---, · 2 Scpatu wanita/Sho,s , wo""'n dari kulit/Foo11,•,ar
3 Sepatu analc/ShO<'s, chlldr,n oflrathn 4 Sandal/Sandals & slipp,rs 9 Lainnya/Othrrs
3311-01-1 Kayu jati aeraajian/T,ak wood, sawn 3-085 lndustri pcnqcraajian 3-37 I ndustri kayu 2 K.ayu hutan acraajian/For,s/ wood, sawn & pcnaolahan kayu/ & barana dari 3 K.ayu diawetkan sceala :,Cnls/Woods , Sawmills, planing kayu/wood &
prrsrrwd all kinds & oth,r wood wood products 4 K.ayu lapis/Plywood processing 5 Kcraneka banaunan dari kayu/
Wood,n bulldinl( matnlals 9 Lainnya/Oth,rs
3312-01-1 Kotak & pcti dari kayu/ 3-086 lndustri barana dari Wooden boxes & containers kayu & eabus/Wood &
2 Kerartjana dari bambu & rotan sceala cork products jcnis/Rallan & bamboo bask,ts, all kinds
3 Barana dari aabus/Cork products 9 Lainnya/Othns
3320-01-1 Meja & meja tu lies, sceala jenis/ 3-087 lndustri pcrabot Tablr, & d,sks , all kinds rumah tanua, kecuali
2 Lc:mari & rak, oeeala jenis/ yane terbuat dari Wardrob,s & sh,(f, all kinds loeam/Furniture &
3 Kuni seaala jenis/Chairs, all kinds fixtur,s, ,xcludln1 4 Kuni oofa/Sofas primarily of ,,.,.,al 5 Tempat tidur/Hrds 9 Lainnya/Othrrs
3411-01-1 Bahan kcrtas/Pulp 3-088 lndustri pulp , kertas 3-38 lndustri kcnas, 2 Kenas tulis & cctak/ & karton/Pulp, pap,r barana dari WritlnK & printinK paprr & carboard kcrtas & pcrce-3 Kenas pcmbun11kus & sejcnisnya takan/Pap,r & Wrapping papt>r , and tht> Ilk~ pap,r products 4 Karton/Cardbourd & pr/11tlng s Lainnya/Olh,rs
3412-01-1 Kotak karton/Cardboard box,s 3-089 lndustri barana dari 2 Kantone kenas/Pap,r bags kcrtas/Paprr products 9 Lainnya/Othns
3419-01-1 Barana dart k<:nas & kanon, sc:eala ' Jcnis/Pap,r & papnboard art/c/,s,
- 58 -
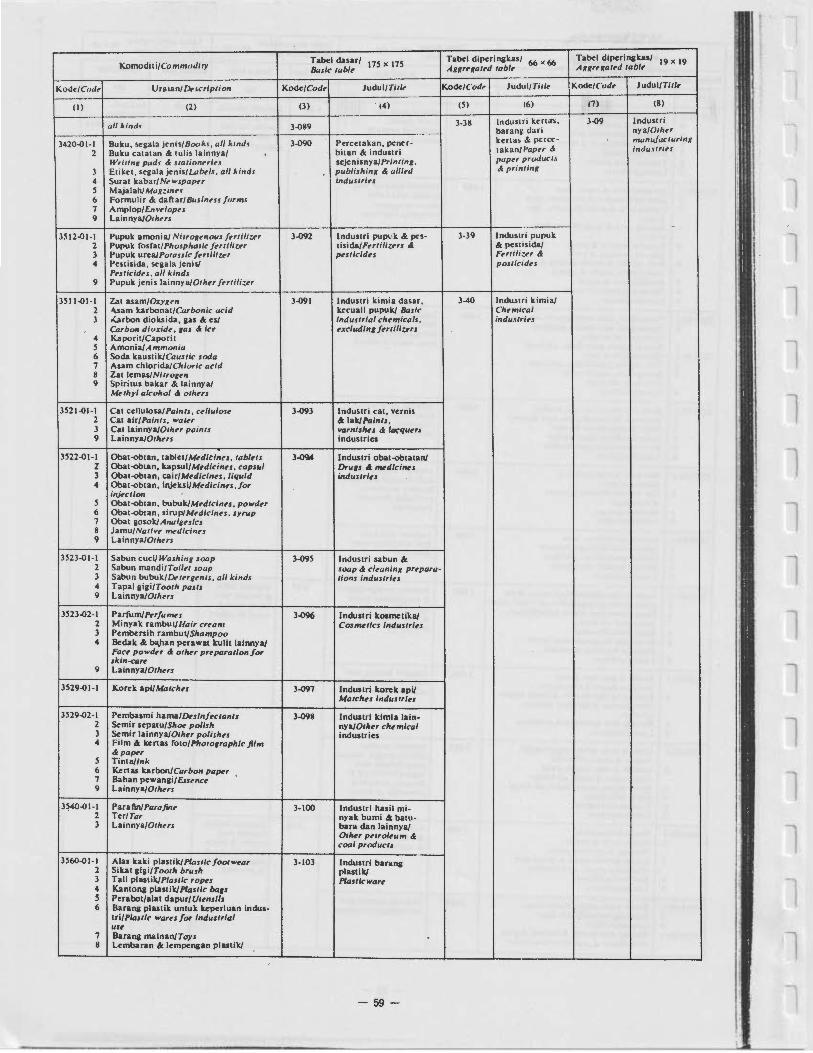
Tabel dasar/ 175 >< 175 Tabel dipcrinakas/ 66 x 66
Tabel dipcrinakas/ 19 >< 19 Ko modi li/Co mmodi ty Basic 1ubl, Aur,11at,d tub/, Al(Kr,Jlat,d tab/,
Kodc/Cod, Uraian/ Dc- .l"Cription Kode/Cod, Judul/Tit/, Kode/Cod, Judul/Titl, Kade/Cod, Judul/Titl,
(I) (ll (3) ' (4) (5) (6) m (8)
u/1 ldndJ 3-089 3-3K lndustri ken~. 3-09 lndustri barang dari nya/Othrr
3420-01 -1 Buku, sq;ala jcnis/Book.,, all ki,od., 3-090 Pcrcctakan, pencr • kenas & pcrcc • mur1&ifu<·turi111
2 Buku ca1atan & lulis la innya/ bilan & industri lakan//'upn & irid,utrirs
WritinK pud.'f & stalirmerir.t scjcnisnya/Pr/ntin11, puprr product.\
3 Etikct, segala jcnis/u,b,/.1, all kind., publi.,hinK & ulli,d & printin>:
4 Surat kabar/N,wspap,r induslrirs 5 Majalah/ Mug:in,.. 6 Formulir & dafiar/Busin,s.< form., 7 Amplop/ En,•rlope, l 9 Lainnya/Othrrs
-3512-01-1 Pupuk amonia/ Nitrox,nous f,r1ili:.rr 3-092 lndustri pup,,k & pcs- 3-39 lndustri pupuk
2 Pupuk fosfat/Phosphatlc frrtlliur tisida/F,rti/iurs &: & pestisida/ 3 Pupuk urca/Potassit: /rrtilll,r p,stlc/d,s Frrtili :.er & 4 Pcstisida, sc11ala jcnis/ postlc1drs l
Prsticidrs , alt kind.I 9 Pupuk jenis lainnya/Oth,r frrtiliur
3511-01-1 Z.at asam/Oxyg,n 3-091 lndustri kimia dasar . 3-40 lndustri kimia/ 2 4.sam karbonat/Curbonic acid kccuali pupukJ &ulc Ch,micul 3 -<arbon dioksida, aas & cs/ indu11rlal ch,mica/J, indu.Hri,.1 l
Carbon dioxidt', gaJ &. icr ,xcludin1 f,rtillurs 4 Kaporit/Caporit 5 Amonia/ Ammonia 6 Soda kaustikJCau11ic soda 7 Asam chlorida/Chloric acid 7 8 Zat lcmas/Nitror,n 9 Spiritus bakar & lainnya/
M,ihy/ akohol & oth,rs
3521-01 -1 Cat ccllulosa/Painls, ullulou 3-093 lnduslri cal . vernis 2 Cat air/Paints, wakr & lak/ P,.ints, 7 3 Cat lainnyaJOthrr paints >'Ornlsh,s & /Ofqu,rs 9 Lainnya/O1/i,rs induslrics
3522-01-1 Obat-<>bian, tablcttM,dlein,s, tabl,ts 3-0ll4 I ndustri obat -obtatan/ z Obat-<>btan, upsultM,dicin,s , capsul Druts & =dlcin,s 3 Obat-<>btan, cair/ M,dicin,s, liquid industr/,s 7 4 Obat-obtan, injck.si/M,dicin,s, for
injrction 5 Obat-obtan, bubukJ M,dicin,s, powdu 6 Obat-obtan, sirup/M,dicin,s, S)'rup 7 Obat 11osokJAnalg,sics 8 Jamu/Nath•r mrdicinrs l 9 Lainnya/Othus
3523-01-1 Sabun cuci/ Washin1 soap 3-095 lndustri sabun & 2 Sabun rnandi/Toi/,t soap soap & clt>aninx prrpara• 3 Sabun bubuk/D,1urrnts, all kinds tions industrirs 4 Tapal llilli/Toolh pasts 7 9 Lainnya/O1h,rs
3523-02-1 Parfum/Prrfu=s 3-096 lndustri k.osmetika/ 2 Minyak rambutJHair crram Cosrnrtlcs lndustrlrs 3 Pcmbersih rambul/Shampoo
• Bcdak. & baJian pcrawat k.ulit lainnya/ l Fact> powdrr & otht>r prt>paration for skin-carr
9 Lainnya/Othrrs
3529-01-1 Korck api/Match,s 3-097 lndustri k.orck. api/ 7 Match,s lndustr/,s
3529-02-1 Pcmbasmi hama/D,slnfutanr, 3-098 lndustri kimia lain-l Scmir scpatu/Sho, polish nya/Othrr chrmlcal 3 Scmir lainnyaJOth,r polisl,,s industries • Film cl kt!nas foto/P/io101rap/ilc film l
&paper 5 Tinta/lnk 6 Kcnu k.arbon/Carbon pap,r 7 Bahan pcwanlli/ Esunc, 9 Lainnya/Othus l
3~40-01-1 Para fin/ Para/in, 3-100 lndustri hasil mi-2 Tcr/Tur nyak bumi & batu-3 Lainnya/Othrrs bara dan lainnya/
Othrr p,trol,um & coal products 7 -3560-01-1 Alas kaki plastikJ Plastic foot wrar 3-103 lndustri barana
2 Sikat llilli/Tooth brush plastik/ 3 Tali plutikJP/asllc ropes Pla11/cwau 4 ~ntona plastik/Plastlc ba1s 5 Pcrabot/alat dapur/ Utrnslls 6 Barana plastik untuk. k.cperluan indus- 7
tri/Plastic war,s for Industrial usr
7 Barana malnan/Toys 8 Lcmbaran & lcmpcnaan plastikJ 7
- 59 - 7

Komoditi/Commodlty Tabel dasar/ 175 X 175 Tabet dipcrinakas/ 66 x 66 Tabet dipcrinakas/ 19 X 19 Basic tub/, Aggregai,J tab/~ Ag1r,1at,d tab/,
Kodc/Cod, Uraian/ Drl·cription Kodc/Cod, Judul/Titk Kodc/Cod, Judul/Tlt/r Kodc/Cod, Judul/Tit/,
(I) (2) (3) (4) (5) (6) (7) (8)
Plas 1fr· pk,t,s & .thet>l .t 3-103 lndustri baran& 3-40 lndustri kim1a/ 3-09
plastik/ Ch,mical 3560-01-9 Lainnya/Othrn Plas tic wurr indu)·trit's
3530--01-1 Bcnsin/Gasolin, 3-099 Pcnailanaan minyak/ 3-41 Pcn11ilan11an 3-10 P•nailanaan 2 Minyak lanah/K,.,o.St'nt' Prtrolt'um rrfining minyak/ minyak/ 3 Aviaas & av1ur/Avigus & UV/UT Prtrolrum htrofrum 4 Minyak dicscVDi,u/ oil r,fining r,finin11 5 Pclurnas & pclincir/Lubrican di 1'""" 6 LPG 1 Lilin/Wuxrs 8 Aspal/ Asphalt 9 Lainnya/Oth,rs
7
3551-01-1 Ban luar kendaraan di luar jalan raya/ 3- 101 lndustri ban/ 3-42 lndustri barana 3-09 lndustri lainnya 7 r, for off-ti,, rO<ld v,/,/c/,s Tyrrs and tubrs dari karct/ (lal\iutan)I
2 Ban luar truk, mobil, scpcda, scpcda industrit's Rubbar products Othrr manufac-motor/Typt' for truck . car , bicyclt's , turina industries mOlorcyc/,.s, rte
3 Ban dalam sqala jenis/Tub, s, ull kinds
3559-01-1 Alas kaki dari karct/Rubb,r footw,ar 3-102 lndustri bara1111 2 Kacct busa/Foam rubb,r karct lainnya/ 3 Kacct compound, scgala macam/ Oth,r rubb,r
Rubb,r compound , all kinds products 4 Lcmbaran & lcmpcnaan karct/
Rubb,r plat,s di shuts 5 Pipa & tabun11 karctJRubb,r pip,.,
di tubrs 6 £1onit/£bonitr 9 Lainnya/Othus
3610--01·1 Pcrabot rumah tan&&a dari kcramik/ 3-104 lndustri barana dari 3-43 lndustri barana Housrhold warrs of c,ramics keramik & tanah liat/ ya1111 terbuat
2 Perabot rumah tanua dari tanah liat/ Crrumlcs di ,arthrn dari mineral Earthrn housrhold war, s wo,,, bukan lo11am/
3 Barana kcramik & tanah liat untuk kc- Non-m,taJlc pcrluan industri/Ct>ramic & t'artlarn mwral
-, wart's for industrial w, produc:ts
4 Barana keramik untuk kepcrluan sanitcr/Sanitary crramic fi11in11
9 Lainnya/Othrrs
6320--01-1 Botol & wadah dari &elas sc11ala jenis/ 3-105 lndustri kaca & 11clas/ Glass bottlrs cl Olhrr contai~r Glass di tlass products of 1/ass
2 G,las minum/Drinkint glass 3 K.oca lcmbaran/Sh,,i 1/assrs 4 Semprona lampu/Lamp chim,ys 9 lainnya/Orl,,rs
3691--01-1 Batubata/Bricks 3-106 lndustri bahan 2 Gcntena/Roofs, inc/udint slat,s ba111unan dasi tanah 3 UbinJTlus liat/Structural clay 4 Pipa saluran/S..wa,, plp,s products 9 Lainnya/Orhus
3699--0H Gips/Gypsum 3-108 lndustri baran& dari 2 Elcrnit/ Etunit, mineral bukan toaam 3 Batako/Concr,t, blocks lainnya/Orhrr non-4 Pipa beton/Concrrtr pip,s ,rvtaUlc mJnual 5 A1tbel/Asbrstos products 9 Lainnya/Othus
3692-01-1 Semen/C,mrnt 3-107 lndustri aemen/ 3-4-4 I ndustri semen/ 2 Kapur/Um, unwnt C,mrnt 9 Lainnya/Othrrs
3710--01-1 Bcai co ran/ Pit Iron 3-109 lndustri besi & baja 3-45 lndustri besi & 2 Desi tua//ron scrap dau.r//ron di stul baja dasar//ron 3 Beja batan11an/S1,r/ ingot basic lndustr/,s 4: stul basic 4 Beai campuran/ F,rro alloy l11dustrl,s 5 Baja 11ulun11an/Hot ro//,d stul 6 Pipa & tabun11 baja/S1,,1 pips di tub,s 1 Bcsi lampcnaan/Cold finish,d di
plat,d 11ul II Bcsi & bllja tuan11an & tampaanJ
9 Iron & 11,rl casting di for1ln1 Lainnya/Otht'rs ,
3720--01-1 Tcmbaaa dasar/Copp,r basic mrtal 3-110 lndunri toaam dasar 3-46 lnduatri toaam 2 Timah dasar/Tl,r basic nwtal bukan beai/Non• dasar bukan 3 Sena dasar/Zlnc basic m,tal f,rrous basic m,tal besi/Non-4 Aluminium dasar/Alumlnium Industries Ii:rrous basic basic mrtal m,ta/ lndustrl,s 5 loaam bekaa bukan beai/Non-f,rrous m,,a/ scraps
6 Lopm duar lainnya bukan beal/ Other non-lcrrous metal
1 Tembaaa 11ulwt11an/Rolud copp,r
--,
- 60 -

7 Tabc:I dasar/ Tabel dipcrinakas/ 66 x 66
Tabc:I dipcrinakas/ 19 >< 19 Komo di t i/Commodi ry Basic tablt 175 X 175 Agirtfattd tablt A,xrr11a1td tablt
Kade/Cod, Uraianl lNscription ~ode/Cod, Judul/Tit/r Kode/Codr Judul/Tlt/r Kode/Codr Judul/Tlt/r 7 (I) (2) (3) (4) (5) (,~ ) m (8)
3720-0H! Aluminium aulungan/Ro//rd aluminium 3-110 3~ 3-09 lndustri lainnya (lanjulan)/ 9 Lainnya/Orhus Othtr nwnufuc• ·- 7
3811-01-1 Peralatan & perkakas pertanian/ 3-111 lnduslri alat-alat 3-47 lndustri barang turin~ industries
Agricultural imp/tmrnt & tools potona & perkakas dari loiam/ 2 Alat.alat potona,/CutlrritJ pertanian/Cut/,ry Prr}abrlcattd 3 Pcrkakas tanaan/ Hand tools han11 tools & 11rn,ral l?k'tul products 4 Lain-iain pcralatan & pcrkakas/ hardwarr
Other implements & tools 7 3812-01-1 Meja & mcja tulis, scaala jcnis/ 3-112 lndustri pcrabot
Tab/rs & dtsks, all kinds rumah tanaaa, tcru-2 Lemari & rak scaala jenis/ tama dari loaam/
Wardro~s & sh,lf, all kinds Furnlturt & f11t1urrs. 3 Kursi scaalajcnis/Chalrs, all kinds primarily of metal 7 4 Kursi sofa/Sofas 5 Tempat tidur/&ds 9 Lainnya/Oth,rs
3813-01-1 Ranaka jcmbatan & banaunan/ 3-113 lndustri bahan Structural compoMnlS of bridgrs, banaunan dari loaam/
7 buildinr and th, likt Structural nvtal
2 Tanaki & kc tel/Tanks & boiltrs. products 3 Kisi-k.isi jcndcla & paaar/ l.Alliet 9 Lainnya/Othtrs 7
3819-01-1 Paku/Nails 3-114 lndustri barana 2 Kalen&JTin containrrs l0t1am lainnya/ 3 Kabc:I & kawat/Cab/ts dt wir,s Othtr fabricattd 4 Sckrup, baut & m,r/Scr,ws, boltJ m,-tal produc/J
& nuts 5 Teko, panci & pirini/Cans, pans 7
dt plaits 6 Dn,m/Drums 9 Lainnya/Oth,rs
3821-01-1 Mesin, scaala jcnis/£nrin,i, all kinds 3-115, Jndustri mcsin, kccuali 3-48 lndustri mesin, 2 Turbin, scaala jcnis/Turbints, mcsin listrik/ mesin listrik,
all kinds Non~l,ctrical alat•alat dan 7
3822-01-1 Mes in pertanian, scaala jcnis/ machin,ry perlenakapan ,tgricultural machin,ry, all kinds listrilt/
3823-01-1 Mcsin untuk mcnacrjakan loaam & kayu/ Machinrry, Mttal & wood work.in~ machintry ,kctrlcal
3824-01-1 Mesin inwstri khusus, kccuali untuk applia,u:~ s, menacrjakan loaam & kayu/Sp,cial apparaius and industrial machintry, tictpt rrvtal &. a«tsscrits
l wood working machinery
3825-01-1 Mcsin-mcsin kantor, hituna & 1ejanis-nyaJOf/ict, computin1 dt accountint machlMrits 7
3829-01-1 Mesin-mcsin lainnya/ Othtr machin,r/,s
3831-01-1 Pcmbanak.it listrilt/~n,rators 3-116 Industri mcsin-mesin 2 Transformator/Tran.efor,rvrs listrik untuk kcpcrluar 3 Motor listrik/ Ekctric motors industri/lndustria/ • Perlenakapan listrik untuk kcpcrluan ,1,ctrlcal machln,ry
indu,tril/ndustrial tkctrical dt apparatus apparatus
9 Lainnya/Oth,rs
3832-01-1 Pcsawat radio,'&dto r,c,ivtrJ 3-117 lndustri radio, tclc-2 Pcsawat tclcvisi/T,l,viJlon stts · visi & alat komunikasi
7 7
J Penwat tilpon/T,kphon, sits scrta pcrlenakapan-4 Alat-alat komunikasi, 1eaala jcnis/ nya/Radlo, trltvlslon
Communication rqulp=nt, all kinds & communication 5 Pcrekam pita & kascl/ ,quiprrvnl and
Tap, &. casstllt' rtcordtr apparatus 6 Pcsawat pe~cras suara, lenakap/
7 Sound sysums
7 Spare-parts alat-alat diatas/ Spart parls for antmbly ur rtpair
9 LainnyaJOthtrs 7 3833-01-1 Kipas anainJEltctric fans 3-118 lndustri alat-alat
2 Kornpor li11rilt/&ctric J/ows listrik untuk kepcrlu-3 Mcsin pcndinain & pcmbeku/ an rumah tan&&a/
Rlfrirtrators &fruurs Eltcll"/ca/ app/lanc,s 4 Pcnanak nasi/Ric, cooklrs &. houst warts 5 Sctrika li1trilt/ Eltetric Irons
7 6 Pe1awat penaatur hawa/
Air condltlon,rs 7 Perkaka, listrik, 1c:11ala jcni1/
El,ctr/c tools, all kinds 8 Pompa lillrilt/ Eltetrlc pumps 7 9 Lainnya/0,h,rs
3839-01-1 AJ<.i/ Accumulators 3-119 lndustri aki & batu ba-2 Batu batcrai/Dry ba11,rl,s tcrai/Accumulator & dfJ
balltry lndustrlts 7 - 61 - 7

Tabel dasar/ 17Sx 175 Tabel diperinakas/ 66 x 66 Tabd dipcrinakas/ 19 X 19 Komoditi/Commodity Basic tab/, Anrr11at,d tablr A1111rtratrd tabl,
Kodc/Cod, Uraian/ Description Kodc/Cod, Judul/Tit/, Kodc/Cod, Judul/Tit/e Kodc/Cod, Judul/Tit/,
(I) (2) (3) (4) (5) (6) (7) (8)
3839-02-1 Bola lampu/U11ht bulh.• de lump., 3-120 Industri alat listrik 3-48 lndus1ri mcsin, 3-09 lndustri lainnya 2 K.lbcl & kawat, sepia jcnis/ lainnya, spare parts mcsin listrik , (lal\iutan)I
Cablrs de wirts , all kinds & pcrlcnakapan listrik alat-alat dan Othrr manufac-3 Tombol pcmutus & pcnyambuna scna rcparuinya/ pcrlcnakapan 1urina indus1rit~
listrik/Switch,s de fittinrs Othu ,kctrical listri k/ 4 Pcsawa1, pcrlcnakapan & pcrscdiaan appuralus & supplirs Mud,inrr)',
lainnya/Apparatus, applianct>s &: & r,pairin1 ,-/,.c1rical ,upp/i,s uppliunc,s ,
5 Pcrbaikan scaala pesawat & pcrlcna• appuratu.t and kapan listrik/R,pai, of all ,1,ctric ucc,.uorirs apparatus &: applianc,s
9 Lainnya/Othrr,
3841-0J.1 K.apal laut/~a~oing carrirrs 3-121 Galanaan kapal & 3-49 lndustri alal 2 K.lpal tanaki/Tunkrrs pcrahu dan perbaikan- pcnaanakutan & 3 Kapa! su(l£ai//n/and watt-r Vf' .u,ls nya/Ship de boat pcrba ikannya/ 4 Pcrbaikan kapal & perahu/ buildirtl( de r,pairing Mar11,Jacturt de
Repair of ships de boa/J rrpair of trans-9 Lainnya/Othrn port t>quipnwnt
3842-01-1 Lokomotif, scaala jcnis/ 3-122 Jndustri pcrlcnakapan Locomotiv,s. all kinds kcrcta api/Railroad
2 Kucta pcnumpan&J rquip~n, P'"srnger railroad cars
3 Kcrcta baran&J Fnitht railroad cars
4 Pcrbikan sciiala jcnis/ Repairs, all kinds
9 Lainnya/Oth,rs
3843-01-1 Mobil pcnumpang/Pasun1,r cars 3-123 lndustri kcndaraan 2 Bus & scjcnisnya/Buu, de th, likr bermotor/ 3 Truk & scjcnisnya/Trucks ·de th, Ii~ Motor vrhiclrs
3844-01·1 Sepeda motor/ Motor cycl,s 3-124 lndustri scpeda motor, 2 Skutcr/Scootrrs scpcda & kcndaraan 3 Hclicak & scjcnisnya/Hdicak & lainnya/Motor cycl,s,
th,li~ bicycl,s & othu 4 Scpcda/Bicycl,s Yihic~s s Bccak/&caJu
3849-01-1 Dokar/Carts 9 Lainnya/Othrr,
3844-02-1 Pcrbaikan scaala jcnis kcndaraan 3-125 Pcrbcnakclan ken• bcrmotor & tak bcrmotor/ daraan bermotor &pair of all kinds of molori;;,,d & & tak bermotor/ non•motori.:1d 'Yehicles &pairing of motpriud
non•moloriud vrhlclrs
3845-0J.I Pcsawat tcrbana untuk penumpana & 3-126 lndustri pesawat barana/Commcrcial p:i.sscnacr & terbanaf carao planes Aircreft Industry
2 Mcsin pcsawat tcrban&J £n1in,s qf aircreft
3 Turbin pcsawat tcrban&J Turbinrs /or aircrq/1
4 Pcrbaikan pcsawat 1crban&1 &pairs of aircr<J./t
3851-01·1 Pcrkakas ilmu pcniictahuan/ 3-127 lndustri alat &. pcrka- 3-50 lndustri barana Scirntific lnstrum,nts us profesionil & ilmu lain yan,
2 Alat-alat pcnaukur/ pcnactahuan/ tidek dapat Measurint instrum.ents Profrsslonal & diJ<>lonakan
3 Pcrkakas & pcralatan kcdoktcran/ scientific equip~nl ditnana-mana/ Medical inslrurn<nts Othu manu•
4 Pcrbailuln pcrkakas & peralatan diatas/ facturing indus· Repair thrr,of tries, not t'l.sewl
9 Lainnya/Othrr, cla,sljkd
3852-01-1 Pcralatan optik & analitik/ 3-128 lndustri alat-alat Optical de analytical lnstrurn,nts f01oarafi &. optik/
2 Kamcra foto/St/11 carn,ras Photorraphlc de 3 Kamcra film/Cinr camuas optical 1oods 9 Lainnya/Oth,rs
3901-0J.1 Pcrhiasan & pcrmata dan lainnya/ 3-129 lndustri barana per-Jrwrlry and rtlatrd artic/,s de hiuan & pcrmata/ others Jrwrlry & rr/at,d
artlc/,s
3902-01-1 Alat-alat musik, scaala jcnis/ 3-13_0 lnduuri alat-alat Musical lnstrum,nlJ, all kinds musik scaalajcnis/
Musical instruments
3903-0J.I Alat-alat olah raaa, scaala jcnis/ 3-131 lndustri ala1-ala1 Sportln1 de athlrtic roods, all,kinds olah raaa sqala
jeni1/Sportln1 de athlrtlc roods
3909-01 -1 Pcnsil & scJcnisnya/Prnclls de th, II~ 3-132 lndustri penaolahan
- 62 -

Tabel dasar/ 175 x 175 Tabel dipcrin&kH/ "6 x 66 Tabcl dipcrinakas/ 19 >< 19 Komoditi/Commod/ry Basic ,.,bl, AUrt/laltd table Aurt/1<1t,d lab/,
Kode/Cod, Uraian/ D,sc:rlplion Kode/Cod.- Judul/Tit/, Kode/CoJ, Judul/7'i1/, Kodc/Cod, Judul/Titl, 7 (I) (2) (3) (4) (5) (6) (1) (8)
--3909-01-2 Pena & sejenisnya/P,ns & 1hr lilu 3-132 lainnya/ 3-50 3-09 lndustri lainnya
7 3 KJlncin& & sejenisnya/ 01hrr manu/aC'turln1 (lartju1an)/
Fas1,n,rs & the like i11du1trirs Othc•r naa11u./,JC' • 4 Mainan anak, bukan terbuat dari turinJ inc.Jus1ric~
plastik/Toys, oth,r than plastics ,
"" kinds 5 Baran& kesenian & kerajinan/
Art & h"ndic:r<ifts 9 Lainnya/Orhrrs
7 4101-01-1 Listrik, tena&a air/ 4-133 Lisuik/E/rc:/rldry 4-51 Lislrik, eas & 4-11 Listrik, aas &
Hydro-,l,c:trlc: """'II)' air minum.' air minum/ 2 Lis1rik, tenaaa uap/ Elrctricit)' , £/rctrlcity,
Suam...,lrctric rnrrl)' ias &: tt1attr 1as & -,.•at,r 3 Listrik, tenap mesin diesel/ supplit'J .,uppli,s
7 Dit'st'l...,kctric rnc-r1y
4 Listrik, tenaaa aas/Gus~l,:c·tric
""''V' 5 Listrik pcroranaarJPrivQtr/y 1,n,.,a,,d ,I,ctric ,n,rty 7
4102-01-1 Gas kota/Ciry gas 4-134 I ndustri ps & air 4200-01-1 Air ninum/ Pip, 'Wat,, minurrJG"s & watu
supply
5000-01-1 Rumah permanen/Pc-rman,nt 5-135 Ba111unan tempat 5-52 Ban,unan/ 5-12 Banaunan/ dwr//ing units tin&&al/ Cons/ruction C on.r true Ii OIi
2 Rumah semi perrnanen/ Rf'lidrnlial
7 Mml p~rman~nl dw,/Ung unil.J buildings
3 Rurnah sementara/ T,mporary dw,llint unilJ 7
5000-02-1 B:.anaunan ~rmancnJPc-rmanc-n, 5-136 · Ban,unan bukan buildtnrs tempat tin&&al/Non-
2 Ba~unan •emi-pcrmanen/ r,sldrnllal buildings S..mi purnanenl buildtnrs .
5000-03-1 Banaunan iripsi, oleh pemerintah/ 5.137 Pekerjaan umum /rlgQ//on works, by govunm,n/ uNuk penanian/
2 Lainnya/01hus 1'1,bl/c: worlu, In lltr
7 .,gr1cu/1urr uc:tor
5000-04-1 Jalan raya/Road S-138 Pekerjaan umum 2 Jembatan/Brldg,s untuk jalan dan
7 jambatan/ 1'1,bllc: works on roods tutd brld,rs
5000-05-1 Banaunan pembanakit listrikJ 5.139 Bansunan liatrik & Ekc1rtc: pltu,t 1rammi1inya/
2 Jarinaan transmisi/Tr.,nmissions /ln,s /nslal/41/on qf 3 Terminal 1ra11Smisi/ rkc:lrlc:lty
Transmission t,rminals 9 Lainnya/Othus
5000-06-1 Pelabuhan laut/ Harbour 5-140 Bansunan & kon-2 Pelabuhan udara/Airpor/ struksi lainnya/ 3 Lintasan kereta api/&llrO<Jd Other co,urrwcllon 4 Saluran air/S..rwQgr 9 Banaunan lainnya, 11e1ala jenis, seper
ti jarinaan pipa untuk minyak , aas &
7 7 7
air pertamanan, tcmpat park.ir, ban• aunan & Jarinaan tilpon, dan scba1ainya/Oth~r construction works, "" kinds, such"' pipe /Ines.for p,irolrum, g"• cf, walrr, parks, porklnr lou. c:o,..,,.,,nkallon 7 ull///1,s, ,,c:.
5000-07-1 Perbaikan banaunan tempat tlnqal/ 5-141 Perbalkan b&ntunan/ Rlp.,/rs of ruid,111/.,/ buildings Cwrrrnt r,poln Qnd
2 Perbaikan banaunan bukan tempat tin&- rnalnlrMnc:r of aal/Rrpalrs of non-r,sldrntlal bulldinrs bu//,1/nr•
3 Lainnya/01/lus 7
6100-01-1 Perdaaanaan besar/ Who/~, .. ,,. tradr 6-142 Perdaaanpn besar/ 6-53 Pcrdaaanaan/ 6-13 Perdaaanaan/ Wholf'Jal, tradr Trade TrQdr
6200-01-1 Perdaaanaan eceran/ R;,,,u 1rudr 6-143 Perda,anaan eceran/ 7 RI/QI/ trod,
6310-01-1 Rumah rnakan & tempat minum/ 6-144 Rumah makan 6-54 Rumah makan 6-14 Rumah makan RIS/Quranu & drinking plac:f'J & tempat minum/ & hotel/R,stau- & hotel/Rcstau-Rlslauran1s cf, ran/J & hotrls rQnts 4, hotrls drlnklnt p/ac..,
7 6320-01-1 Hotel/ Ho1rls 6-145 Perhotelan/ Holrb .r.
2 Tempat pen&inapan lainnyaf lodglnt plac:rs
I 01/t,r lodging plac:f'f 7 - 63 - 7

Ta~I dasar/ 175 >< 175 Ta~I dipcrinakas/ 66 " 66 Ta~I dipcrinakas/ 19 >< 19 Komodi Ii/Commodity &sictablr A1111r,rartd tab/, Anr,gartd tab/,
Kodc/Cod, UraianJCNscriplion Kodc/Codr Judul/Titlt Kade/Cod, Judul/Tlt/, Kode/Cod, Judul/Titlr
(I) (2) (3) (4) (5) (6) (7) (8)
7111-01-l Anakulan pcnumpana kcrala api/ 7-146 Kcrcla api/Rai/ways 7-55 Kcrcla api/ 7-15 Pcn1an1lauan & lwilwuys puurngrr uanJporl Rail,.,ays komunikasi/
2 An11ku1an baran11 kcrcla api/ Transport & Jwilwa,•J /rright transport communication
7112-01-l Anakutan bus aruar kota/ 7-147 Pcnaan1lr.u1an daral, 7-56 Pcn1anaku1an lnt,rcily bus transport pcnumparwJRoad darat/Road
2 An1ku1an bus kota/Ci ty bus transport passrngt'r lransporl transport 9 Lainnya/Othrrs
711,kll-l Anak.utan truk/Truck traruport 7-148 Pcn1an1lr.utan daral, 2 Lainnya/Othus barana/Road fright
lrunspprt
7121-01-l Pclayaran samudra/Oc,an shipping 7-149 Pclayaran/Shippinf 7-57 Pcn1an1kulan 2 Pclayaran nusantara, lokal & fcr.ry/ air/Watrr
lntrrisland and local shipping transport
7122-01-1 Anakulan sun11ai & danau/ 7-150 Pcnaanakulan sunaai & Inland waur transport danau/lnland war,r
transport
7123-01-1 Jasa pelabuhan/Port srrvicrs 7-151 Jasa pclabuhan/ Port srrvicrs
713 l-01-l An&kulan udara pcnumpanl/ 7-152 Pcn&aakutan udara/ 7-58 Pcn&a1kutan Passrngrr air transport Air transport ud.l.ra/Air
2 Anaku1an udara baranl/ transport Frright air transport
7132-01-1 Jasa pclabuhan udara/ Airport srrvicr s
9 Lainnya/Othu,
7191-01-1 Kcaacnan, ckspcdisi & biro pcrjalan• 7-153 Jasa pcnul\ian& 7-59 Jasa pcnuf\iana &n/Agrncl,s, rxprditlon & anaku1anJSuvicu anaku1an/ travtl bMrtau all~d to transport Srrvius allird
2 Parlr.ir kcndaraan/Parkinr St'rvic,s to transport
7192-0l·l Pcr1udan1Jln/Stora1, & wauhousln1 7-154 Pcrsudanaan &. bon1kar 2 Bonalr.ar mua1/Loadin1 & wnloadint mual)Loadin1/wnload-
lnr a,,d J/Ot'Qlt'S 4, warehousln1
7200-01-1 Jasa pos/Postal ur-.,lcts 7-155 Komunilr.asi/ 7-«l komunikasi 2 Tclckomunilr.asi/Tdrcommunication Com,,.,,nlcatlon Communication
8101-01-l Bank Scntral/C,n1a/ Bank 8-156 Pcrbankan &. lembqa 8~1 Lcmba1a 8-16 Lemba1a 2 Bank UmumJComlftt'rlca/ &nk kcuanaan lainnya/ kcuanaan/ kcuanaan, uuha 3 Bank Pcmbanaunan/Drvelop- Banklfl6 & othrr Ji· FinanckJI banaunan &
mtnt bank nanclal lnstltwt/o,u strvictJ jasa pcrusaha-4 Bank Tabun1an/Savln1 &nk anJFinancint, 5 Bank Rural/Rural Bank ~alrJ/atr & 6 Lcmbaga kcuanean lainnya/ bwsln,ss
Oth,r financial Institution• Mrvlcts
8200-01-l Asuransi jiwa/Uft insuranct 8-157 Asuransi jiwa/ Ufe lnswrance
82()().(1\.1 Asuransi kcbakaran/Firt lnsuranct 8-158 Asuransi bukanjiwa/ 2 Asuransi pcnaan1kulan/ Non-Jlfr lnsuranc,
FrtiKht insuranct 3 Asuransi kcsehatan/ Htalth insurunc,
8200-02-9 Asuransi kcruaian lainnya, tcrmasuk dana pcnsiun/Othu casualty lnsuranct, including ptnsion funds
8310-01-1 Scwa rumah/Dwtllin1 rtal tstaU 8-159 Usaha ban1unan & 8~2 Usaha ban-2 Scwa ban1unan usaha/ lanah/ lual ,sat, 1unan &jasa
Buslrwss rtal tstatt perusahaan/ buslMu services
8321-01-l Jasa pcnaschat hukum/ural srrvlcu 8-160 Jasa pcrusahaan/ 8322-01-l Jasa akuntansi/Accountlnr strvlcts Buslntss strvicts 8323-01-1 Jasa pcnaolahan &. labulasi dala/
8324-01-l Data prouulnr & tabula/Int urvlc,s Jasa konsultan pcrmcsinan, arlr.ilcklur & tckhnik/£n1lnuln1, archltrctural 4, ttchnlcal St'r11icts
8325-01-1 Jasa pcriklanan/Advrrt/slnt urvlc,s 8329-01-1 Lainnya/Othu1 8330--01-1 Pcrscwaan mcsin & pcralatan/
Machlnrry & ,qulpmrnt r,ntal &lrasln1
9100-01-l Pcmcrinlah pusal) 9-161 Pcrmcrintahan umum & 9~3 Pcmcrintahan 9-17 Pcmcrlnlahan C,ntral 1ov,rnwvnt pcrtahanant umum &per- umum &. per-2 Pcrmcrinlah dacrah/ Public admlnl1trotlon lahanan/Publlc tahanan/ Public
Local ravunmrnt & dr/,ncs admlnlJ/ratlon administration & dt'frnc, & drfrnce
- 64 -

7
Tabel dasar/ 175 >< 175 Tabel dipcrinakas/ 66 " 66 Tabet dipcrinakas/
19 • 19 Komoditi/Commodit)' &sic tab/, AKl(Trl/ai,J tab/, A11rr1atrd tublr
K.odc/Cudr Uraian/ Dcs<·ripdon Kodc/Cod, Judul/Tit/e Kodc/Cud, Judul/Tit/e Kode/Codr JudullTit/, 7 (I) (2) ()) (4) (5) (6) (7) (8)
9200-01-1 Kc&iatan pcmbuan&an sampah/ 9-162 K.c&iatan pcmbcrsihan 9-64 Jasa ,-osial & 9-18 Jua-ja~a/Othcr Garbogt' &. s, tft.'UKt' dispusul & sc:jcnisnya/Sanitar)' k.cmasyarakatan/ 1rn•icr1
9 Lainnya/Othus &. sr milar 1~rvicr s Social and C"um• 7
munit)' s,rvicrs
9310-01-1 Sekolah negcril/'l,b/ic school 9-163 Pcndidikan/ 2 Sekolah swasta//'rivat, school Educational 3 Pcndidikan lainnya/Othrrs Krvicrs 7
9320-01-1 Lamba&a pcnelitian pcmcrintah/ 9-164 Lcmbaga pcnclitian/ Gov,rnl'r&<nl rt'srurch inJlitutiun.s R,uarch & sci,nti]iL"
2 Lcmba&a pcncli1ian swasla/ inslitutions Priva/t' Tt'ft'Urch instilutions 7
9331-01-1 Ru mah sakit negcri/Pub/ic ha,pital 9-165 Jau kcschatan/ 2 Rumah sakit swasta/Privu,,- hcHpitul M,dical, otMr 9 Lainnya/Other.s hralth srrvicrs
-9350-01-1 K.caiatan pcrkumpulan-perkumpulan & 9-166 Pcrkumpulan dunia
pcrhimpunan, scgala jcnis/ usaha, profcsi & per- 7 Aclivitirs ofassocia1ions, ull kinds buruhan/ Busln, ss,
profrssional & labour ossociatio11s
9340-01-1 K.caiatan palan11 rncrah & lcmba11a 9-167 Jasa kcrnasyarakatan 50sial laiMya/R,d cross & oth,r lainnya/Oth,r social 7 charitablr or1ani:.ations and r,/at,d communi-
9391-01-1 Or11anisasi kca11amaan1 ty srrvicts R,ligiou.s organiu,tions ,
9399-01-1 Lainnya/Othrrs
9411-01-1 Produksi film/Motion pictur, production 9-168 Produksi & distribusi ~5 Jasa hiburan, 9412-01·1 Distribusi Nm/Motion picture film/Motion picturr kcbudayaan,
distribution production & pcroransan &
l distribution rumah tanua/
Rlcr,ation,al, 9412-02-1 Bioskop/Movi, houus 9-169 I Gcdun& k.csenian & cultura, ptr• 9414-01-1 Gcdun1 kesc:nian/Th,atr,s bioskop/Thratr,s & sonal & hous,• 7
movie hou.s,s hold strvic,.1
9413-01-1 Studio radio/Radio broadcasting 9-170 Studio radio & tcle-2 S1udio tclevisi/T,kvision visi/Radlo, i,/,vision
broadcasting &. rtlated servicts 9 Lainnya/Othrrs 7
9420-01 -1 Perpustak.aan,f Ubrarir s 9-171 Pcrpustakaan, 2 Museum, kcbun binatan11 & tumbuh.an/ museum, kcbun
Mus,um , botanical & wolorical binatanii & jasa 6(Jrdans kcbudayaan lainnya/
9 Lainnya/Othrrs Ubrarlrs, musrum, 7
natural rard,ns & otlwr cultural strvic,s
9490-01-1 Jasa hiburan & rckrcasi, sc:11ala jcnis/ 9-172 Jasa hiburan & rckrcasi/ Amustmt'nl &. recr,ational strvicts. Oth,r r,cr,ational all kinds s,rvic,s
l 9510-01-1 Pcrbaikan, yana tak termasuk dimana- 9-173 Pcrbaikan, yana tidak
man&/ tcrmasuk dirnana-mana/ R,pairs, not rls,whrrr class/fed R,palrs s,rvlc,s, not
rls,whur c:lassifed 7 9520-01-1 Jasa binatu/u,undry & c/raning 9-174 Jau pcroranaan/
srrvicrs Ptrsonal strvicrs 9530-01 -1 Jau rumah tanga/Domrstlc suvic:,s 9591-01-1 Cukur rambut & salon kccan1ikan/
&rbar & b,auty parlour 7 9599-01-1 Lainnya/Oth,rs
9900-02-1 K.c11iatan yan11 tidak jelas batasannya/ 9-175 K.c11iatan yan11 tidak 0~ K.c11i tan y anii 0-19 K.c1iatan yana Unrp,cifed & provisional srclor jclas bataunny a/ tidakjclas tidak,iclas
Unsp,clfed & batasannya/ batasannya/ provisioMI sector Unsp,clfed & Unspuifed &
l provisional provisional 9900-01-1 Produ bi baranii b~ kas & produ k 0-176 Produksi baranii bckas stctor ~ctor tercecer/Scrap de wastes & produk tcrccccr/
Scrap & wastrs
190 Jumlah input -antara/Total intermediate input (untuk bari11for thr row) Jumlah pcrmintaan antarll/Tota/ intrrm,diat, drmMnd (untuk kolomlfor th, column)
201 Upah & &aji/War,s & salari,s 202 Surplus usaha/Oprratint surplus 203 Pcnyusutan/Drpr,clation 204 Pajak tak lanasun&J/ndir,c:t ta:us, n,t 209 Nilai tambah bruto/Gross valu, addrd
7 7
210 Jumlah input/Total input 301 Penacluaran konsumsi rumah-<an1111a//'rivat, consumption up,ndltur,s 302 Pen,eluaran konsumsi pcmerintah/Gov,,nnwnt consumption txprndlturrs 303 Pcmbcntukan modal tetap/Gross fi:ud c:apltal formation 304 Perubahan stokJChangt In invt-,1 Jries 7
- 65 - 7
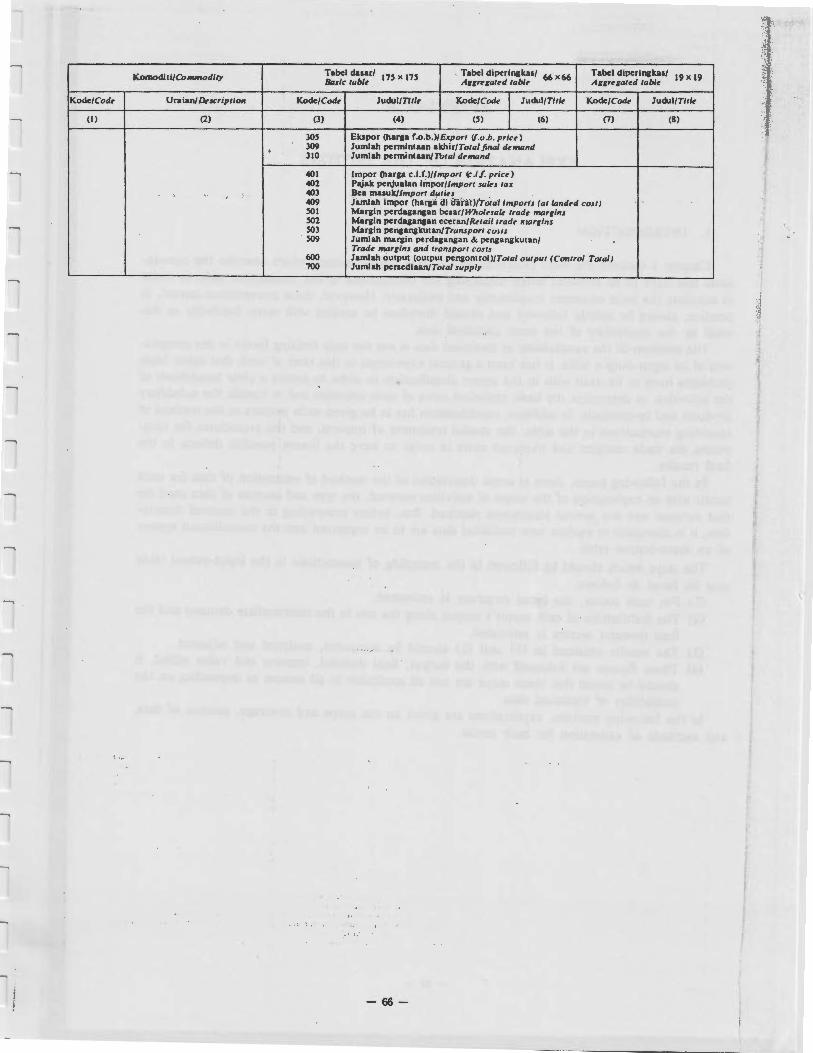
Komoditi/Commodll)'
Kode/Cod, Uraian/ Duer/pt/on
(I) (2)
. ·,
Tabcl dasar/ 175 x 175 Tabcl diperlnakas/ 66 X66 Tabcl diperinakas/ 19 X 19 Basic tabl, A11r,1a1,d tablr A11rr1c,i,d tc,b/,
K.ode/Cod, Judul/Tltl, Kode/Cod, I Judul/Tltk Kode/Cod, Judul/T/11,
(3) (4) (5) I (6) (7) (8)
305 Ekspor (har1a f.o .b .)/Export (/.o.b. prier) 309 Jumlah permlnlun akhir/Total Jina/ dnr11Jnd 310 Jumlah perminlun/7btc,/ dnnand
401 lmpor (har1a c.i.f.)//mporl ~ .IJ. pried 402 P,jak pel\Jualan linpor//mporl saks tax 403 Bea ma1uk//mpor1 duti,s 409 iamfah lmpor (har1a ell ifih'tJfTotal lmporis (at landrd cost/ 501 Ma,sln perda1ansan bcsar/Who/rsc,k tradr mcir1lns 502 Mal'iin perdqansan eceran/Rrtai/ trc,dr a,arrlns 503 Mal'iin penaanalcutan/Transport CO>IS
509 Jumlah mar1in perda1anaan & penaanakutan/ Trad~ mor1tns and transport cosu
600 Jamlah output (ou1pu1 penaontrol)/Total output (Control Tote,// 700 Jumlah persediaan/Totc,/ supply
-66-
I :;
j
t
APPENDIX B
EXPLANATION OF THE SECTORS
1. INTRODUCTION
Chapter 2 outlines the basic principles or concepts and definitions which describe the conventions that have to be followed when measuring the transactions in the transaction table in order to calculate the basic estimates consistently and uniformly. However, these conventions cannot, in practice, always be strictly followed and should therefore be applied with some flexibility as dictated by the availability of the basic statistical data.
The problem of the aavailability of statistical data is not the only limiting factor in the compilation of an input-output table. It has been a general experience in this kind of work that many basic problems have to be dealt with in the sector classification in order to secure a clear breakdown of the activities, to determine the basic statistical units of such activities and to handle the subsidiary products and by-products. In addition, consideration has to be given such matters as the method of recording transactions in_ the table, the special treatment of imports, and the procedures for computing the trade margins and transport' costs in order to have the fewest possible defects in the final results.
In the following pages, there is some description of the method of estimation of data for each sector with an explanation of the ' scope of a~tivities covered, the type and sources of data used for that purpose and any special treatments required. But, before proceeding to the sectoral description, it is necessary to
0
explain how statistical data are to be organized into the consolidated system of an input-output table.
The steps which should be followed in the recording of transactions in the input-output table may be listed as follows:
(1) For each sector, the input structure is estimated. (2) The distribution of each sector's output along the row in the intermediate demand and the
final demand sectors is estimated. (3) The results obtained in (1) and (2) should be compared, analyzed and adjusted. (4) These figures are balanced with the output, final demand, imports and value added. It
should be noted that these steps are not all applicable to all sectors as depending on the availability of statistical data.
In the following sections, explanations are given on the scope and coverage, sources of data, and methods of estimation for each sector.
- 67 -
7 7 7 7 7 7 7 l 7 7 7 7 7 7 7 7 7 7 7

2. AGRICULTURE, LIVESTOCK, FORESTRY AND FISHERIES (Input-Output Code: 1-001 to 1-042)
The agricultural division is divided into 29 sectors which cover the cultivation of field crops, fruits, nuts, seeds, trees ( with the exception of forest trees), bulbs, vegetables, flowers (both in the open and under glass). tea, coffee, cocoa and rubber. Also included are the processing of agricultural products on farms and estates. But, when this processing can be separated from farms and estates, it is defined as a manufacturing sector. For example, rice milling, sugar refining, coconut oil extraction in factories, coffee roasting in factories, tea processing in factories, etc., are classified in the manufacturing sector.
The livestock division is divided into 6 sectors which cover the raising of livestock, poultry, and forbearing or other animals and the production of milk, wool, fur and eggs.
The forestry division is divided into 4 sectors which cover the operation of timber tracts and forest tree nurseries, the planting, replanting and conservation of forests, the gathering of uncultivated materials, charcoal burning, timber cutting, and the production of rough, round, hewn or riven forest wood. Also included are saw mills located in forests.
The fisheries division is divided into 3 sectors which cover commercial fishing in ocean, coastal, off-shore, estuary and inland waters. Also included are fishery services.
1-001. Paddy
Scope and definition: The main product in this sector is dry stalked paddy. By "dry" is meant godown-dry, i.e.,
paddy which has been such dried for a couple of days. By stalks is meant the stems to which the paddy grains are attached, nonnally 20 to 30 centimeters in length. The straw is covered as a by-product of the sector.
Source · of data and method of estimation: The source of data for the main product was the CBS, while the estimate for straw was
derived from the Special Agricultural Survey (SAS). The figure for the output was derived from production data on dry stalked paddy and the price data available from the survey on cost structure in agriculture undertaken by the CBS in 1971 within the framework of the National Socio Economic Survey (NSES). The NSES also presented the cost structure and producer's prices by provinces for Java and Madura and by islands for outside Java and Madura. The value of byproduct straw was estimated at 0.75% of the value of the main product, this percentage was from the SAS.
Note: In fact, there are many varieties of paddy in Indonesia, especially new high-yielding varieties. In general, short stalked paddy belonging to high-yielding varieties, the grains drop easily from the stalk. This is not the case with most of the local tall varieties which retain the grain firmly on the stalk. So, · in practice, there are two methods of harvesting paddy. One is to cut the base of the paddy stalk, the other is to harvest just only paddy grains. There were problems in estimating production figures for stalked paddy. This was not only for Quantity but also for prices, because price data in some regions was available only for grain (gabah).
1-002. Handpounding of Rice
Scope and definition: This sector· covers the manual processing of paddy into rice by households. The main pro
duct of the sector is hand-pounded rice; the by-product is husk.
- 68 -

Source of data ·and method of estimation: Due to the scarcity of the available information concerning this activity, it was not possible
to estimate the output of this sector directly . Hence the indirect method of starting with output information on rice mill production derived from the industrial sector was adopted. The other independent estimate used was that of total rice production derived from total production of paddy. An estimate of hand-p1unded rice was derived as the difference between total production and the output of rice mills. The estimate so derived was subjected to further adjustments to insure consistency. The source of information on rice milling factories is the CBS publication "Industrial Statistics, 1971" (IS-1971-CBS).
1-003. Maize
Scope and definition: The main product of this sector is dry grain maize, i.e., corn grains separated from the cob
and then dried in the sun. Corn broken down into smaller pieces (beras jagung) is not included here, but in the industrial sector. The by-products of this sector are the leaves, stalks, cobs and young maize.
Source of data and method of estimation: The source of information for quantity of production and prices as well as the valuation
method of the production and the input structure were the same as in the case of paddy. The value of the by-products, young maize, leaves, stalks and cobs were respectively considered as 0.80%, 1.50%, 0.60% and 0. 70% of the value of the main product. These percentages were derived from the results of the s1s.
Note: The output of corn is expressed here in dry grain maize. It is to be noted that in daily life in Indonesia, a significant quantity of corn is consumed in the form of cob-maize which is roasted or boiled and consumed as a vegetable, especially the young maize and nearly ripe corn. In some areas, the farmers even store the corn in the form of cob-maize.
1-004. Cassava
Scope and definition:
• The main product of cassava is fresh cassava, while the young leaves and stalks are considered as by-products. The dry roots, or dry cassava, and also dry cassava-flour are included in sector 1-005.
Source of data and method of estimation:
The source of data and the method of evaluating the cassava production was the same as in the case of paddy; the output of by-products was estimated as 1.50% for leaves and 4.60% for stalks in relation to the value of the main product (source: SAS) .
1-005. Dried Cassava and Tapioca Flour
Scope and definition:
This sector covers drying cassava and the production of flour from cassava and sago. The output consists of dry cassava flour, sago flour, dry cassava, and the residue of tapioca flour production.
Source of data and method of estimation:
The estimation of quantity of production was based on the data of consumption. For this purpose, IS-1971-CBS and NSES undertaken by the CBS in 1971 were used. The producer's price was used for the valuation except for sago, for which price was available from IS-I 971-CBS.
- 69 -

-
1-006. Other Root Crops
Scope and definiiion: This sector includes all edible roots (except cassava) such as: potatoes, sweet potatoes, black
potatoes, and other roots. The main product is the fresh root, while the leaves are considered as the by-products.
Source of data and method of estimation: The data source and estimation method of production of swe.et potatoes are the same as in
the case of paddy; the value of by-products, leaves and stalks, was estimated at 0.20% of value of the main product. The quantity data of potato production were supplied by the Directorate General of Agriculture and the retail prices in several localities were obtained from the CBS. To get the producer's prices, the trade margins and transport costs, which were 115.10% of the producer's prices (source: SAS), were deducted from the retail price. The same method could not be applied to the other root crops due to lack of data. In that case, the output was estimated as 11.24% of the total output of sweet potatoes and potatoes, based on information from the Directorate General of Agriculture, the Institute of Agriculture in Bogor (IPB), and the CBS.
1-007. Vegetables
Scope and definition: In this sector are included various kinds of leaves, branches, stalks, and fruits which are
usually consumed as vegetables. The main products are those in fresh condition. Two groups of vegetables were considered:
a} Low-land vegetables i. onions V. spinach
II. chillies vi. eggplants iii. cucumbers vii. kangkung iv. string beans VIII. others
b) High-land vegetables i. sawi V. radishes
ii. tomatoes vi. bush-beans iii. cabbages vii. others iv. carrots
Source of data and method of estimation: Production of vegetables was estimated from consumption based on the Household Con
sumption Expenditure Surveys III and IV. In this case, it might be mentione_d that NSES indicates a per capita consumption of vegetables in Java and Madura of 0.4977 kg per week and of 0.7300 kg per week outside Java and Madura. To those figures, an additional 0.08217 kg per capita per week was added because the NSES figures do not cover the consumption of onions and chillies. To take into account the consumption outside of households (e:g. , in restaurants), 1.20% of the total household consumption of vegetables was also added (source: NSES) .
The production data described above covers all kinds of vegetables in total. To arrive at separate production figures for the thirteen kinds of vegetables, the p;oduction data collected by the Directorate General of Agriculture was used. The gross output of each kind of vegetable was estimated by using the weighted average of retail prices. The calculation of producer's price was made by deducting the trade margins and transport costs at th(: rate of 139 .36%. The percentages of trade margins and transport costs and input structure wet'! based on data from SAS.
- 70 -
..
l 7 7 l 7 7 7 l 7 l l l 7 7 l 7 l l 7
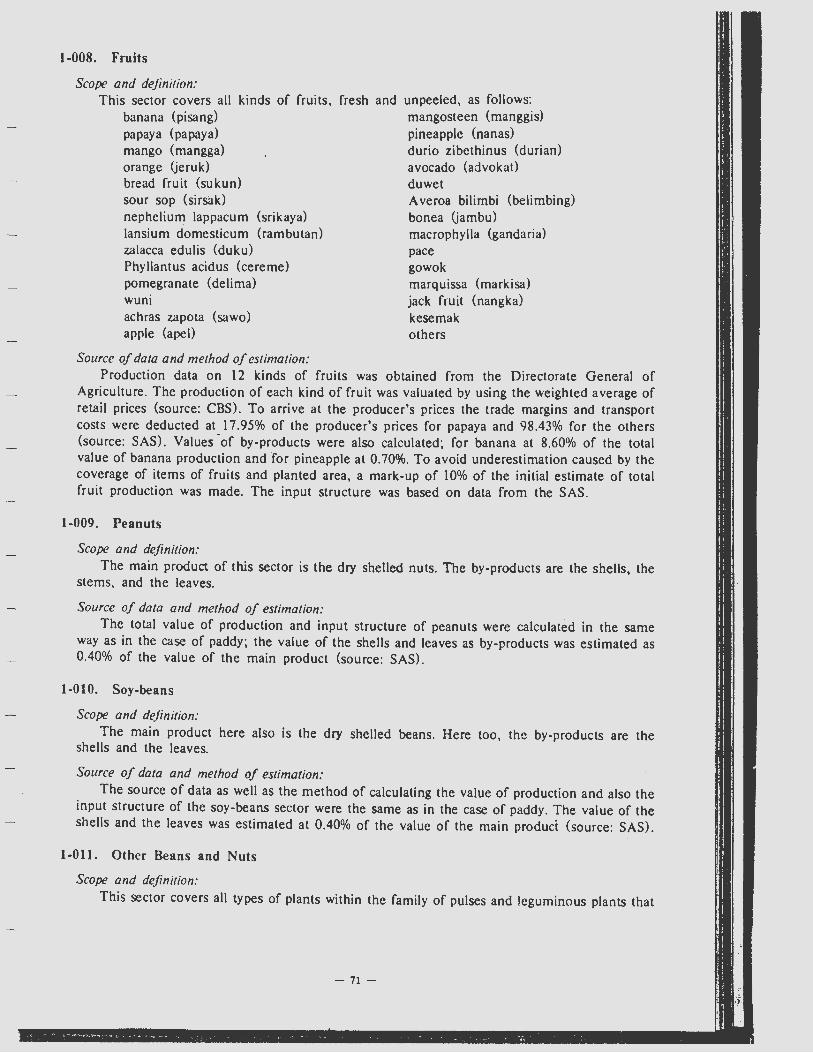
1-008. Fruits
Scope and definition: This sector covers all kinds of fruits, fresh and
banana (pisang) papaya (papaya) mango (mangga) orange (jeruk) bread fruit (sukun) sour sop (sirsak) nephelium lappacum (srikaya) lansium domesticum (rambutan) zalacca edulis (duku) Phyllantus acidus (cereme) pomegranate (delima) wuni achras zapota (sawo) apple (apel)
Source of data and method of estimation:
unpeeled, as follows: mangosteen (manggis) pineapple (nanas) durio zibethinus (durian) avocado (advokat) duwet Averoa bilimbi (belimbing) bonea (jambu) macrophylla (gandaria) pace gowok marquissa (markisa) jack fruit (nangka) kesemak others
Production data on 12 kinds of fruits was obtained from the Directorate General of Agriculture . The production of each kind of fruit was valuated by using the weighted average of retail prices (source: CBS). To arrive at the producer's prices the trade margins and transport costs were deducted at 17.95% of the producer's prices for papaya and 98.43% for the others (source: SAS). Values ·or by-products were also calculated; for banana at 8.60% of the total value of banana production and for pineapple at 0.70%. To avoid underestimation caused by the coverage of items of fruits and planted area, a mark-up of 10% of the initial estimate of total fruit production was made. The input structure was based on data from the SAS.
1-009. Peanuts
Scope and definition: The main product of this sector is the dry shelled nuts. The by-products are the shells, the
stems, and the leaves.
Source of data and method of estimation: The total value of production and input structure of peanuts were calculated in the same
way as in the case of paddy; the value of the shells and leaves as by-products was estimated as 0.40% of the value of the main product (source: SAS) .
1-010. Soy-beans
Scope and definition:
The main product here also is the dry shelled beans. Here too, the by-products are the shells and the leaves.
Source of data and method of estimation: The source of data as well as the method of calculating the value of production and also the
input structure of the soy-beans sector were the same as in the case of paddy. The value of the shells and the leaves was estimated at 0.40% of the value of the main product (source: SAS) .
1-011. Other Beans and Nuts
Scope and definition:
This sector covers all types of plants within the family of pulses and leguminous plants that
- 71 -

produce beans such as green beans, red beans, green peas, etc. The main products are the dry peeled beans, and the by-products are the shells and the leaves.
Source of data and method of estimation: There are in fact man"y varieties of leguminous plants producing , beans and peas; but due to
lack of data, separate calculation could be made for only one variety of these plants. The others have been grouped into the family of green beans, and calculated at 10% of the output of green beans (source : Directorate General of Agriculture, lPB and CBS) . The production of dry peeled green beans was obtained from the Directorate General of Agriculture, while the weighted average of wholesale prices was calculated by using data from the CBS and from publications on regional income estimates. To get the value at producer's prices, the trade -margins and transport costs of 27.46% of the producer's price were deducted (source: SAS). The value of byproducts was estimated at 0.40% of the main products. The data on input structure was also obtained from the SAS.
1-012 . Latex
Scope and definition: The main product of this sector is latex, i.e., the white milky juice from the rubber trees
before coagulation of other processing.
Source of data and method of estimation: Production data on the smallholders' rubber is from the Directorate of Smallholders' Plan
tations, while that on the estate rubber is from the CBS. The latter is only in the form of sheets and crepes. From the production figures of this dry form of rubber, figures on latex production were calculated by adopting a conversion factor of 25.10% for smallholder's latex (converted into dry sheets) and that of 27.80% for estate production. Then, the price of latex has to be estimated. However, data for this price was only available for 1974 (source: SAS). So that, a backward projection was made for the 1971 price of latex by assuming a parallel trend with the wholesale prices for sheets collected by the CBS. The trade margins and -the transport costs of latex were estimated as the difference between the producer's price of latex and the purchaser's price of rubber products. The resulting rate was 16.31%. The rate was applied only to transactions between the smallholders and the manufacturing units. The trade margins and transport costs between the estate enterprises and the manufacturing units were not calculated, as the estate enterprises usually process their own latex into sheets and/or crepe. The input structure was also obtained from SAS.
Note: The various end points of ·processing in the field of rubber can be summarised as follows: Estate rubber: latex } ·
smoked rubber sheet C::::::::: crumb rubber crepe export
Smallholder's rubber
latex } estate lumb --E=:=::=:=:::=:~ manufacturing sheet crumb rubber
In the case of estate rubberr processing units, the quality of products is normally standardized by the government. The form of production can be smoked rubber · sheets or crepe of various types. Almost every rubber estate has its own processing unit, and, in general, a clear cut distinction is not made between estate activity and processing activity. To avoid complications, all processing units, both those of estates as well as those of smallholders, are included in sector 1-013. The output of the smallholders is heterogeneous; some produce only lat,:x which is sold to nearby estates, while others produce lumbs or sheets of inferior quality. Therefore, the output of .smallholders is calculated in terms of latex.
- 72 -
-4i !( t~: .. "
.'
7
7 J
7 7 I
7 7 7 7 l l 7 l 7
I 1
l l 7
7 7

1-013. Smoking and Remilling of Rubber
Scope and dejinition: This sector covers the processing of latex by the smallholders and the estates into dry rub
ber forms such as crepe, sheet and lumb. The activities referred to here are coagulation, smok-ing, remilling, etc. ·
Source of data and method of estimation: Data on production, prices and input structure were all obtained from IS-1971-CBS and
NSES. The lack of data in these sources has been adjusted for the supply of latex and also for the demand for smoked and remilled rubber going to manufacturing industries and exports.
1-014. Sugar Cane
Scope and definition: The main product of this sector is fresh cane and the by-product is the leaves. Neither
refined sugar nor brown sugar are included as products of this sector.
Source of data and method of estimation: The cultivation of cane is divided into two groups, i.e., that by the smallholders and that by
the estates. The smallholders generally produce brown sugar, and estates produce refined sugar. The data on smallholders was obtained from the Directorate of Smallholders Plantations, and data on estates was obtained from the CBS. Both brown sugar and refined sugar, in this calculation, were assumed -to have been produced from sugar cane. The conversion rates derived from the SAS are 16.40% for cane into brown sugar and 10.60% for cane into refined sugar. Since wholesale prices and retail prices for the cane were not available, the cane price was obtained from the SAS (producer's price) and used in the valuation. To arrive at the 1971 cane price, the price obtained from the SAS wa·s extrapolated backwards to 1971 on the basis of the trend in the wholesale prices of refined sugar and brown sugar. The trade margins and transport costs were calculated for the smallholders' cane only at 19.62% of the producers' price (source: SAS). Those for the estates were not taken into account, as cane from the estates is normally processed into cane-sugar by the estates themselves. The by-products of the smallholders' cane are leaves and sprouts estimated at 6.00% of the value of the main product.
Note: There are some cane processing factories that do not have farm. The cane that comes into those factories is from cooperatives or smallholders. Thus, there arc cane factories that stand completely autonomous as an industrial unit and there are cane factories as units in estates. The main product of both the estates and the smallholders is cane.
1-015. Brown Sugar
Scope and definition: This sector includes the production of various kinds of brown sugar, usually at the village
level. The raw materials for this kind of sugar production are the unfermented juices from palms like the arenga palm and the coconut palm, as well as sugar cane.
Source of data and method of estimation: Data on quantity was obtained from the IS-1971-CBS and also from the annual publication
of the Directorate General of Plantations. The prices used for valuation were producers ' prices obtained from the Special Trade Survey (STS) and the SAS. The data for the cost structure was based on data from the IS-1971-CBS with some adjustments.
- 73 -

' - I
1-016. Coconut
ScopC' and d<'.finition: The main products of this sector are coconut and copra. Activities from the plucking of the
nuts from the tree to the production of copra including peeling and drying are covered in this sector. The by-products are the leaves, leaf-ribs, shells, the unfermented palm juice and milk.
Source of data and method of estimation: As in the case of rubber and sugar cane, the coconut is also cultivated by both smallholders
and estates. The estate coconut production is in the form of copra only, while the smallholders' production is in the forms of both copra and nuts. Data on the smallholders' coconut production compiled by the Directorate General of Plantations and data on estate coconut production compiled by the CBS are both expressed in copra.
To arrive at production data for fresh nuts, the per capita coconut consumption based on NSES was used. This was multiplied by the mid-year population data to arrive at the figure of total production. This data on per capita consumption turned out to be equal to 0.329 coconuts per week in Java and Madura, while that for outside Java and Madura was 0.499. The mid-year population was 75,854,000 for Java and Madura and 42,955,000 for outside Java and Madura. The production figure of fresh nuts calculated above was deducted from the production data of the smallholders' copra. Based on the SAS, the conversion factor used was 450 fresh nuts to 100 kg of copra. The retail price of fresh nuts in Java and Madura was obtained from the CBS's "Economic Indicators", while prices outside Java and Madura were calculated on the basis of the ratio of the copra prices of Java and Madura to other islands. Both the smallholder's as well as the estate copra was evaluated at wholesale prices compiled by the CBS. For Java and Madura the copra was valuated on the basis of the SAS results and adjusted to 1971. This adjustment was necessary as the available data ,was not complete.
The trade margins, transport costs, and input structure were estimated from the SAS, with the weighted average of trade margins and transport costs of fresh coconuts being 19.25% and that of copra was 72.02%, and that of the by-products estimated at 10.45% of the producers' price. The by~products for which estimates could be calculated were the leaves (estimated at 0.70%); leaf-ribs (0.50%); fibre . (2.40%); and shells (1.00%) and others (1.00%). The source was the SAS.
Note: As a consequence of the above definition, the production of copra by copra-mills, despite the use of machines, is included in the coconut sector rather than in manufacturing. Since coconut production is expressed in copra, it might seem that Indonesia's production in this sector is only copra. This is misleading since coconuts are often consumed directly before being dried as copra; both ripe and young coconut meat, milk and water arc used for snacks and for various Indonesian dishes. As a result, the data on total production is not consistent with that of the allocation of production, because if all products are expressed in copra there should be no consumption in the form of fresh nuts. To overcome this problem, the following procedure has been adopted. Though all production is in terms of copra, care was taken to allocate output to other sectors (for example, coconut or copra for cooking oil, for exports, for direct' consumption, etc.). ,All were converted to copra by using the conversion factor obtained from the SAS. Among the by-products, the unfermented palm juice can be consumed directly as a drink, and can .also be processed into brown sugar. Although the method of processing is quite simple, this activity is not included here but under the sector of brown sugar.
1-017. Farm, Coconut Oil
Scope and definition: This sector covers the production of coconut oil by the smallholders. The process of produc
tion is simple and done in the traditional way. The main product is coconut oil, the by-product is the oil cake.
- 74 -
l ,. ·~ ~
l
7 7 !
7 7 7 7 l 7 l 7 7 7 l 7 7 7 7 7

Source of da1a and me1hod of estimation: , The total production of coconut oil was estimated based on the copra production (source:
Directorate General of Plantations). Then the production of coconut oil produced by factories and input structure were estimated from the IS-1971-CBS and "Survey on Small Scale Manufacturing and Handicraft, 1971" (SSMH-1971-CBS). The coconut oil produced by the smallholders is derived as a residual of the production in factories .
1-018. Palm Oil
Scope and definition: The main products of this sector are palm oil and palm kernel , and the by-products are fibre
and shells. The major part of the cultivation of these palms is undertaken by estate enterprises which also operate the processing units. So the processing of the kernels into palm oil belongs to this sector.
Source of data and method of eslimalion: In general, the oil is processed by the processing units of respective estate enterprises. Pro
duction is in the form of oil as well as kernels. The data used in the calculation is from the CBS. For valuating the oil and kernel products, the prices were derived from the SAS by adjusting it to the year 1971 based on the trend of the F.O.B. prices of palm oil and palm kernels. The value of the by-products was estimated at 0.05% of the main products (source: SAS).
1-019. Crops for Matting and Textiles
Scope and definilion: · , This secto_r covers all production of basic materials for making thread, yarn and other raw
materials for textiles, such as cotton, kapok, and various kinds of fibers (agave, mendong, pandan, manilla fibers) . The main products are dried fibers. The by-products are kapok seeds and cotton seeds. Simple processing like peeling and drying is also included in this sector.
Source of da/a and method of estimalion: Of the different products of this sector, separate estimates could be made for kapok fiber
and kapok seeds, cotton and cotton seeds, rosella fiber and hardrope fibers. Production data concerning the smallholders' production of cotton and kapok fiber were obtained from the Directorate General of Plantations, while production data on the estates' cotton and kapok fiber were from the CBS. The production of kapok fiber was valued on the basis of the wholesale price, while the production of cotton fiber was valued on the basis of the input price of the manufacturing sectors because the wholesale price was not available. Production data for hardrope fiber and rosella fiber was from the CBS. For valuation of both hardrope and rosella fiber, the export prices were used. Since production data for cotton seeds and for kapok seeds was not available, the quantity was derived from the export and domestic consumption. Information on domestic consumption is limited to that part entering large and medium scale industries as input. So the domestic consumption was underestimated, especially in the case of kapok seeds. Therefore a mark up of 10% of the initial production figure of kapok seeds was made. The trade margins and transport costs were estimated at 17.10% of the producers' price for kapok and at 83.15% for the others. The input structure was from the SAS.
1-020. Tobacco
Scope and definilion: The main product of this sector is dried tobacco leaves, either cut or not. The cutting and
drying processes are usually simple without the blending with any other ingredient or sauce. Drying and cutting with the use of machines are not included here. Also further proce~sing, like smoking which usually' increase the tobacco's value, is not included in this sector.
- 75 -

Source of data and method of estimation: The production data of tobacco cultivated by the smallholders is divided into tobacco leaves
(or smallholders' tobacco) and virginia tobacco, while that of the estates is only available in total. The production data on smallholders is obtained from the Directorate General of Plantations and the production data on estate is from the CBS . In calculating the value, the wholesale price is obtained from the CBS, and the regional income estimation is also used. The trade margins and transport costs are estimated as 29.00% of the producers' price for smallholders (source: SAS), but those of estates are not calculated because the estates usually process their own tobacco leaves. The by-product is estimated as 2.60% of the main product. The input structure was from the SAS.
1-021. Processed Tobacco
Scope and definition: The products of sector 1-020 are dry tobacco leaves and cut tobacco leaves, usually pro
cessed by smallholders' household. These products normally need further processing like better drying with · machines, blending with tobacco sauce made from sugar, perfume and spices, to give better aroma, or special drying for cigar making. These kinds of processing are included in this sector.
Source of data and method of estimation: The data used for estimating the output was derived from NSES and IS-1971-CBS. Some
adjustments were made to fit the total domestic supply with the total domestic demand.
l-OJ2. Coffee
Scope and difinition: The main products of this sector is the dry unshelled coffee bean. What is meant here by
dry is the simple drying by the sun or by a simple heating system to eliminate water content. Heating in the sense of roasting is covered in sector 1-023 (Fam1 Processed Coffee).
Source of data and method of estimation: The production data on smallholders' coffee was obtained from the Directorate of
Smallholders' Plantations, and production data on estate coffee was from the CBS. For the evaluation of both the smallholders' and the estate coffee, the wholesale prices compiled by the CBS were used. The trade margins and transport costs of coffee were estimated at 29.09% of the producer's price, those percentages and input structure were from the SAS.
1-023. Farm Processed Coffee
Scope and definition: The activities covered in this sector are the further drying, roasting and grinding of coffee
beans by the smallholders without using modern machinery. The processing done by factories using modern machinery is included in the manufacturing sector.
Source of data and method of estimation: The data used was obtained from the Directorate General of Plantations and the CBS
(Agricultural Statistics, NSES, Industrial Statistics and Foreign Trad~ Statistics). To get the output of this sector, the total output of all coffee bean processing was first estimated. By using IS-1971-CBS, the output of the factories was calculated. Then the output of this sector was obtained by subtracting the output by factories from the output. The input structure of this sector was derived from the data on that ·or factories with some adjustments.
- 76 -
l 7 7 7 l l 7 l 7 7 l l 7 7 7
l

1-024. Tea Leaves
Scope and definition: The main product of this sector is dry green leaves. The drying process here is limited to a
simple drying of the young fresh leaves. The heating and breaking process of producing balck tea is not covered in this sector.
Source of data and method <>f estimation: Data on production of the smallholders' tea was from the Directorate of Smallholders' Plan
tations and that on the estate tea from the CBS. The total value of tea was obtained by multiplying the production by the wholesale price collected by the CBS. The trade margins and transport costs of tea were estimated al 48.6 l % of the producer's price (source: SAS). The input structure was also based on the special survey.
Nore: The above distinction in production may appear to lack clarity because in practice both smallholders' as well as estates' tea is available in the form of black (or red) tea ready for consumption. In fact the difference between dry green tea and red tea is not significant. The green tea is produced through a drying process while black (or red) tea is produced through a drying and breaking process. In places where fragrant tea is produced, the dry green leaves from either the smallholders or the estates or both are further processed by the factory by heating them again and blending them with perfume until the tea becomes black. The green tea leaves used as the raw material for fragrant tea are defined as a product of this sector.
1-025. Farm Processed Tea
Scope and definition: This sector includes the further drying and breaking of the tea leaves and branches as well
as the mixing of the sauce by the smallholders as a household activity, without the use of machinery. The products are red or black tea processed by the smallholders.
Source of data and method of estimation: The source of data as well as the method of estimation were the same as in the sector of
farm processed coffee.
1-026. Cloves
Scope and definition:
The output of this sector is dry cloves. The drying process is limited to that done in the traditional manner.
Source of data and method of estimation:
PrQduction data on smallholders' cloves was obtained from the Directorate of Smallholders' Plantations. Data on the wholesale price was from the CBS. Trade margins and transport costs were 23 .25% of the producer's price (source: SAS). The input structure was derived from the SAS.
1-027. Nutmeg
Scope and definition:
The outputs of this sector are the flesh of the nutmeg, the hard seeds, and the mace (flower) .
Source of data and method of estimation:
Production data on the dried fruit was from the Directorate of Smallholders' Plantations. Production data on the mace and the nutmeg were not available. These were derived from export statistics, the input of large and medium scale manufacturing industries, and the quantity
-17-

of household consumption. The quantity of mace consumption by households was assumed to be proportionate to the quantity of seed consumption by households. The calculation of the production of the flesh was based upon the conversion factor between the seeds and the flesh; this factor being obtained from the SAS. The prices used were wholesale prices for the valuation of nutmeg, while those for the mace and flesh were derived from the ratio of the input price of mace and flesh to that of nutmeg in the manufacturing sectors. The trade margins and transport costs of this sector were 23.42% of the producers' price (source : SAS). The input structure of this sector was also based on the SAS.
1-028. Other Spices
Scope and definition: This sector covers primary agricultural products customarily used as flavouring ingredients
such as pepper, cinnamon, vanilla, and kemiri. The production is expressed in terms of the dried products.
Source of data and method of estimation: Production data for pepper and cinnamon were from the Directorate of Smallholders' Plan
tations. Since production data for vanilla and kemiri were not available, they were estimated from the figures of export and domestic consumption. F: or pepper and cinnamon, the valuations were based on the wholesale prices (source: CBS). For vanilla, the value of output was taken to be equal to the input value of large and medium scale manufacturing industries. For the other items, F.O.B. prices were used. The trade margins and transport costs were 13.72% for pepper and 35.54% for cinnamon, vanilla, and the other spices. Those percentages and the input structure were derived from the SAS. A mark-up of 10% was made due to the exclusion of the other spices from the calculations (source: Directorate General of Agriculture).
1-029. Other Crops
Scope and definition: This sector covers all crops not included in the previous sectors. The activities involved
here are peeling, drying, etc. The items covered here are: Cocoa (dry unshelled beans) fragrant grass (sereh) (leaves) kayu-putih (leaves) fragrant wood (kelembak) (dry, wood) cubebs (dry seeds) gambir (dry fruit) cinchona bark (dry bark) flowers (decorations/ ornaments) caster seeds (dry seeds)
Source of data and method of estimation: Production data for cinchona dry bark and cocoa were from the CBS, while data on caster
seeds was available from the Directorate of Smallholders' Plantations. Production data on the other items was not available and was therefore estimated from the export statistics and from domestic consumption (input of factories). To avoid under-estimation (partly due to the above method of calculation and partly due to crops that might not have been included), 10% was added to the total value. The value of cocoa production was calculated based on the wholesale price, and the values of the other items were based on F.O.B. prices. To arrive at the value of
· . the producer's prices, 32.20% of trade margins and transport costs were used for cocoa; for the other items this percentage . was. 35.54% (source: SAS).
The trade margins transport costs, and input structure were based on data from the SAS.
- 78 -
-:jl·
11 '•
f A. -.~ :,
i ~ J. 1< .., .,. J! j :i .Ji -~
I ,g:
·.!
I "!.-
1
i I -~ /J
~ { ' -i ' '
7
7
l 7 7 7 7 l l l l l 7 l 7 ,
7 7 7

--,
1-030. Cattle Raising
Scope and definition: The main products of this sector are cattle breeding and the gain in weight; while the by
product is cattle dung.
Source of data and method oj fStimation: The production of cattle is equal to the number of cattle slaughtered (without distinction
between milk cows and others), plus change in inventories (i.e., the difference in the cattle population at the end and the beginning of the year), plus net export of cattle. Data on slaughtering and the catle population were available from the Directorate General of Livestock and Animal Husbandry, and export data came from the CBS. The above product was valued at wholesale prices (source: CBS). The trade margins and transport costs were 25. 91 % (source: SAS). To avoid underestimation and to cover the by-products, a mark-up of 5% of the value of production was added.
1-031. Milk Cows Raising
Scope and definition: The main product of this sector is fresh milk. To make calculations easier, the production of
young stock, dung, etc., are covered in the previo~s sector (Cattle Raising).
Source of data and method of estimation: Data on the production of fresh milk was obtained from the Directorate General of
Livestock and Animal ·Husbandry, and the data on retail prices was from the CBS. The trade margins and transport costs were estimated at 85.49% of the producers' rrice (source: SAS). The input structure of this sector was based on the results of surveys undertaken by the Directorate General of Livestock and Animal Husbandry.
1-032. Other Livestock
Scope and definition: This sector covers the breeding of buff aloes, goats, sheep, pigs, horses, etc·. The main pro
ducts are the breeding stock and the by-products are the dung.
Source of data and method of estimation: · Data on the slaughtering of buffaloes, pigs and that on the population of buffaloes, goats,
sheep, pigs, and horses was from the Directorate General of Livestock and Animal Husbandry. This data on the slaughtering of sheep· arid goats were underestimates compared with information on hides exported, so th.e slaughtering data was derived from the export data on hides. The prices used here were generally wholesale prices compiled by the CBS. The trade margins and transport costs were 16.18% of the producer's prices for buffaloes, 26.26% .for sheep and goats, 21.29% for pigs, .and 20.86% for horses. The data was obtained from the Price Survey for National Income Estimation (PSNI). To cover any under-estimation and also the by-products, a 5% mark-up was made for buffaloes, pigs, sheep and goats, these percentages and input structure were from the SAS, Directorate General of Livestock and Animal Husbandry and IPB.
1-033. Slanghtering
Scope and definition:
Included in this sector are all activities relating to slaughtering. The output covers fresh meat, .intestines, bones, hides, etc.
Source of data ·and method of estimation:
The sources of data were IS-1971-CBS, "Food Balance Sheet, 1971 "; NSES, and the Direc-
- 79 -

torate General of Livestock and Animal Husbandry. The calculations of output were based on the domestic consumption, i.e., the consumption of fresh meat and the intermediate consumption by the canned (corned) beef industry, dried and fried meat industries, etc.
The input structure was from the IS-1971-CBS and some other animal husbandry surveys,
with some adjustments.
1-034. Poultry
Scope and definition: This sector includes the breeding of various kinds of fowls such as domestic chickens,
imported chcikens, ducks, manila ducks, swans, etc. The main product is the population growth during the year. The by-products are not included here, but in the next sector on po\)ltry products.
Source of data and method of estimation: The types of fowls which could be covered in the calculations are chickens and ducks. The
number of chickens slaughtered was estimated from consumption (source: NSES) . It was assumed that the weight of one living fowl is 1 kg and that the stock is equal to the difference between the number of fowls in 1970 and 1971 (source: Directorate General of Livestock and Animal Husbandry) .
The valuation of chickens was based on retail prices (source: CBS), and trade margins and transport costs of 32.49% were used (source: SAS). Slaughtering and the stock of ducks were obtained from the Directorate General of Livestock and Animal Husbandry, the valuation here was also based on retail prices (CBS) with trade margins and transport costs of 32.44% (source: SAS).The intermediate input of this sector was obtained from Directorate General of Livestock and Animal Husbandry. To avoid under-estimation a mark-up of 5% was made.
1-035. Poultry Products
Scope and definition: This sector covers all products resulting from the raising of fowls except for the young fowls
and their growth. The products are eggs, feathers and excreta.
Source of data and method of estimation: Data on chicken and duck eggs and the input structure were from the Directorate General
_of Livestock and Animal Husbandry. The by-products were calculated to be 5% of the value of the output and of the increase in stock for chicken and ducks. To assign a value to egg production, retail prices (CBS) were used, with trade margins and transport costs of 45.74%.
1-036. Logging
Scope and definition: This sector covers logging done outside as well as in the forest. The main products are logs,
firewood, and charcoal. Sawmilling, i.e., making boards, rafters, roof-laths, etc., is not included in this sector.
Source of data and method of estimation: Production data on wood from forest areas was obtained from the Directorate General of
Forestry, but no data was available for that outside the forests. Hence, for the latter, indirect methods of estimation was adopted. One method adopted was based on data of wood production by smallholders collected by the Forest Service in 1964 when it amounted to 2,271,000 cubic meters. The figure for 1971 was estimated by using data on the number of households (source: Population Census, 1971), with the assumption that the production of wood by smallholders in Java and Madura is inversely related to the number. of households; if the latter is n times larger,
- 80 -
l
7 l 7 7 7 l 7 l l 7 7 7 7 l
7
7

the production of wood by smallholders is n times smaller. This, however, is not the case out• side Java and Madura, where the relationship seems to be directly proportional. To arrive at the value of production, data on wholesale prices (CBS) collected for the Regional Income Estimation and from Perhutani (State Enterprise on Forestry) were used. Trade margins and transport costs were 79.72% of the producer's price (SAS) . The calculation of the value of production for firewood was almost the same a!i for wood production, but a slight adjustment was made by taking into account the consumption of kerosene. The value of kerosene consumption was derived from the domestic sales statistics of Pertamina (the State Oil Enterprise). The production of charcoal was estimated from consumption and assumed to be equal to the per capita value of consumption multiplied by the population. To value the production, the producer's price obtained from Perhutani was used. The input structure was also based on information from Perhutani .
1-037. Sawmilling in Forests
Scope and definition: This sector covers various logging activities, such as the splitting and sawing of wood, by
wood factories within the forest boundaries. The products are blocks, boards, rafters, roof -laths, flattened wood for floors, etc. Splitting and sawing activities which occur outside the forest boundaries are not included here.
Source of data and method of estimation: Data obtained from the Directorate General of Forestry, Perhutani, and IS-1971-CBS have
been used. The output as well as input structure were both adjusted . . 1-038. Bamboo
Scope and definition: The main product of this sector is bamboo stalk grown both outside and inside forest boun
daries. The by-product is the bamboo sprout.
Source of data and method of estimation: A problem in estimating the value of bamboo production was raised by a lack of informa
tion, especially for bamboo produced outside forest areas. The 1963 figure for production from the Forestry Service (350,000,000 stalks of smallholder's bamboo) has been used as a base for further projection, using a set rate of growth of bamboo cutting (Bamboo Survey, March 1973). The 1973 survey also supplied the information that the ratio of sprout consumption to sprouts left alive is 8.10% for Java and Madura and 4.80% for outside Java. Both the bamboo from the
7 jungle and that from the smallholders were valuated at the wholesale price (CBS) with trade margins and transport costs of 22.75% for bamboo and 47.06% for the sprouts (SAS). The price of bamboo sprouts was estimated at 50% of the price of bamboo (source: Bamboo Survey 1973). These percentages and input structure were from the SAS.
1-039. Other Forest Products
Scope and definition: This sector covers forest products not classified elsewhere. The products are rattan, all kinds
of resins (benzoin, torch, turpentine, incence, etc.), various kinds of leaves such as nipah and nibung (oncosperma filamentosum), barks, roots, etc. The non-recreational hunting of deer, pigs and crocodiles is also included.
Source of data and method of estimation: In fact, there are many products to be considered as other forest products and products of
hunting, but due to lack of information a complete calculation could be made only for rattan
- 81 -
I 1!
·'-·1 ·,

and the other products have been lumped together under "others" . Production data on rattan was obtained from the Directorate General of Forestry, and data
on price is from the Regional Income Estimates (CBS). Trade margins and transport costs for rattan were estimated at 79. 72% (source: SAS). Data on prices as well as on production for items under "others" were obtained from export statistics and the national income estimates. The input structure of this sector was obtained from the Directorate General of Forestry and from Perhutani.
1-040. Marine Fishing
Scope and definition: The products of this sector are fresh fish and other sea products.
Source of data and method of estimation: The Directorate General of Fishery compiles production statistics on marine fishing every
year, including 1971. The data for 1972 provided not only for the quantity of production of various fishes by province but also the values at producer's prices. To arrive at the 1971 prices, the price index of salted fish in various cities was used and extrapolated. The input structure was from Fishery Census 1973.
Note: The problem in this sector is that fishing is done not only within the boundaries of a country but also on the open sea. To avoid ambiguity and to adhere to the definition above, production covers not only fish from Indonesian territorial waters whether caught by Indonesians or not but also activities by Indonesians . on the open sea outside Indonesian territorial waters. Fish that are directly canned (sardines) or otherwise preservated, as in dried or sailed fish, are not included in this sector.
1-041. Inland Fishing
Scope and definition: This sector covers fishing and raising fish in inland waters. The main products are fresh fish,
fresh frogs, etc. Inland fishery is devided into the following three groups according to location: (1) Fish culture in fresh water such as ponds and wet paddy fields. (2) Fish culture in seawater. (3) Fishing in open waters such as rivers, swamps, reservoirs, etc.
Source of data and method of estimation: The source of data, as well as the method of estimation, was the same as those for marine
fishery .
1-042. Fish Salting and Drying
Scope and definition:
What is meant here by the preservation of fish is the drying and salting of fish and the like. The products consists of dried fish, salted fish, dried shrimp, dried jelly-fish, etc. The canning of fish and the preparation of fish-paste (terasj) are not included in this sector.
Source of data and method of estimation: The source of data is IS-1971-CBS. The input structure as well as the output deviate slightly
from the original information due to adjustments which were made.
- 82 -
_ :: :=-=-=-=-=-=-=-=-=-=-=-=-=-=-=-::::::::::::::::::::::~~~-----1
7 l 7 7 7 l 7 l
7 7 7 7 l 7

7
3. MINING AND QUARRYING (Input-Output Code: 2-043 to 2-054)
Mining and quarrying covers drilling, quarrying, washing, grading, and extracting all minerals occurring naturally in the form' of solids, liquids or gases. The activities e xcluded from the scope of_ mining and quarrying are:
(1) Crushing, pulverizing, smelting, and other processing of primary mineral products not undertaken in conjunction with mining and quarrying activities (these are included under manufacturing).
(2) Development and preparation of mining sites performed on a contract or fee basis ( these are included under construction) .
(3) The purification and distribution of water (these are included under water supply and works) .
(4) The exploration and prospecting for minerals usually carried out by consultant organizations (these are included under business services) .
The output of mining and quarrying is generally valued at the producer's price, as follows:
X; = q; X P; where : X; Value of output of mining sector i.
7 q; = Quantity of output of sector i. P; = Producer's price of output of sector i.
The method above has .been adopted except for stone quarrying, sand quarrying, salt evaporation and the like where th.ere is an absence of production information .
The input structure of mining and quarrying activities was generally valued at the purchaser's prices based on the An nu.al Mining Survey (AMS), the Industrial Census in 1974 and the Special Quarrying Survey (SQS).
In the present table, mining and quarrying activities are classified into 12 sectors.
2-043. Coal Mining
Scope and definition: This sector covers mining for coal and its concentrates to produce coal, anthracite, lignite
and natural coke. Also included here is the agglomoration of coal and lignite into briquettes and other package fuels at the mining sites. Excluded from this sector is the manufacture of briquettes.
Source of data and method of estimation: Quantity of output was obtained from the •.• Annual Report of Mining, Indonesia" (ARMI)
published by the Ministry of Mining, and the price used is the shipment price. The input structure was derived from the AMS.
2-044. Crude Petroleum and Natural Gas Mining
Scope and definition:
Included in this sector are the production of crude petroleum and natural gas: the drilling, completing and equipping of wells on own account; the operation of separators, emulsion breakers, and distilling equipment; and topping and other activities involved in making oil and gas marketable up to the point of shipment from the production area
Source of data and method of estimation: The quantity of crude petroleum production has been obtained from the "Annual Report of
Pertamina", which covers production by Caltex, Stanvac, Pertamina, and others . The price of
- 83 -

crude petroleum used here is the average transaction price of each enterprise. The quantity of natural gas has also been obtained from the "Annual Report of Per
tamina ", and the Stanvac domestic sales price was used for valuation. The input structure of crude petroleum and natural gas were derived from the AMS.
2-045. Iron Ore Mining
Scope and definition: This sector covers the extraction of iron sand.
Source of data and method of estimation: The quantity of production was obtained from the ARMI, and the F.O.B. price was used for
valuation. The input structure was derived from the AMS.
2-046. Tin Ore Mining
Scope and definition: This sector covers extracting, dredging, and squirting of deposits which contain tin con
centrate. The production is tin ore. The smelting of tin ore to produce metal by tin smelting establishments is not covered here, but rather under manufacture.
Source of data and method of estimation: The quantity of production was obtained from the ARMI, and the valuation was based on
the F.O.B. price and the input price of tin manufacturing. The input structure was derived from the AMS.
2-047. Nickel Ore Mining
Scope and definition: This sector covers the extraction of deposits containing nickel concentrate. The product is
nickel ore.
Source of data and method of estimation: The quantity of production was obtained from the ARMI, and the F.O.8. price was used for
valuation. The input structure was derived from the AMS.
2-048. Bauxite Mining
Scope and definition: This sector covers the extraction and dredging of deposits which contain bauxite concentr
ate. The product is bauxite ore .
Source of data and method of estimation: The quantity of production was obtained from the. ARMI, and the F.O.8. price was used for
valuation. · · ·
The input structure was derived from the AMS.
2-049. Other Non-Ferrous Metal Ore Mining
Scope and definition: Included in this sector are mining for gold, silver, manganese, platinum and other ores.
(1) Gold ore: The extraction of sediments which contain gold concentrate. The product is gold ore.
(2) Silver ore: The extraction of sediments which contain , silver concentrate.
-84 -
''
7 7 7 7 l 7 l l l l l l 7 l 7 7 l 7

The product is silver ore . (3) Manganese ore: The extraction of manganese ore . The product is manganese ore
containing high-bearing ore. (4) Copper ore: The extraction of deposits which contain copper concentrate.
The product is copper ore . (5) Platinum ore: · The extraction of mineral ores which contain platinum concentr
. ate. The product is platinum ore.
Source of data and method of estimation: Of the commodities in this sector, complete information is available only for gold, silver,
and manganese ore. The quantities of gold, silver, and manganese ore produced were obtained from the ARMI. The prices of gold and silver ores were the input prices of the manufacturing sectors. For manganese ore the F.O.B. price was used.
The input structure of these ores were derived from the AMS.
2-050. Quarrying
Scope and definition: This sector covers the quarrying and extraction of stone, sand, limestone, clay, marble,
which occurs underground or on the surface.
Source of data and method of estimation: Due to the lack of production information, the output of this sector was estimated from
demand. The input structure was obtaineq from the SQS.
2-051. Chemical and Fertilizer Mineral Mining
Scope and definition: This sector covers the extraction of minerals which contain chemical and fertilizer materials
such as iodine, sulphur, and phosphate.
Source of data and method of estimation: Due to the lack of production information for this sector, the output was estimated on the
basis of the inputs of the manufacturing sectors. The input structure was based on the SQS.
2-052. Salt Evaporation
Scope and definition:
This sector covers the evaporation, screening of sea water. The product is crude salt (evaporated salt). The refining of crude salt for edible purposes, as in the production of brick salt, table salt, and the like, which is not done in conjunction with evaporation is not included here, but under manufacturing.
Source of data and method of estimation: There is no information on production for this sector. Hence, the output was estimated
from demand. The input structure was based on the SQS.
2-053. Asphalt Mining
Scope and definition:
This sector covers the extraction of deposits which contain bitumen. The product is natural asphalt.

Source of data and method of estimation: The quantity of production was obtained from the ARM!, and the domestic shipment price
was used for valuation. The input structure was derived from the AMS.
2-054. Other Non-Metalic Mineral Mining
Scope and de_/inition: This sector covers the quarrying and extraction of minerals not covered in the sectors
above. The main products are diamonds, gypsum, and asbestos.
Source of data and methods of estimation: Since production information for this sector was not available, output was estimated from
demand. The input structure was based on the SQS.
- 86 -
.... -,
7
l l l 7 7 l l l 7
l , 7
l l 7 l 7

4. MANUFACTURING (Input-Output Codes: 3-055 to 3-132)
Manufacturing is defined as the mechanical or chemical transformation of organic or inorganic substances in the form of either raw materials or semi-finished goods into new products. This transformation process covers all activities whether the work is performed by power-driven machines or by hand. Included is production carried out by large , medium and s~all scale establishments as well as households.
Included in the manufacturing sector are the processing and preserving of meat, fish, fruit and vegetables; the processing of tea, coffee and coconut oil; sugar refining, rice milling and polishing performed by machinery in factories; petroleum refining; smelting of metal ore ; the assembling and repair of motor vehicles; and industrial machinery. Also included are sawmills and wood processing in factory units using machinery, separate from wood cutting in forests.
The main sources of information on manufacturing are the "Report of the Annual Survey of Large and Medium Manufacturing Establishments" and the "Report of the Survey on Small Scale Manufacturing and Handicraft" which are periodically published by the CBS. In addition, supplementary information was obtained from various government or private agencies in the form of publications: bulletins or other printed materials, both published and unpublished. Further, several documents of the Industrial Census of 1974 were used to obtain the input structure for some of the sectors.
Information available from the two main sources cited above is essentially based on establishment as the reporting unit. Since classifi'1<ltions are based on activities in this Input-Output Table of Indonesia 1971, especially in respect to the manufacturing sectors, adjustments were made from establishment information into the corresponding activities.
The output of the manufacturing sectors also includes by-products which are technologically produced together with the characteristic products. Processing services rendered to others and other revenues are also included in the output of the sector. This treatment was adopted due to the limited details of information on miscellaneous revenue.
By-products and subsidiary products were transferred to other sectors where they are the characteristic product. For example, coconut cake is a by-product which is p1:oduced as a result of the production of coconut oil or cooking oil from copra; and therefore it is placed in the coconut oil sector. On the other hand, if some of these establishments also produce soap as a secondary product, this soap is transferred to the sector of soap manufacture.
By adoption .of the above treatment, detailed input structures of the group of establishments were carefully examined to arrive at the proper input structures of the different sectors.
The control total of output as well as that for input structure derived from the above procedures were further revised and adjusted taking into account the supply and demand of manufactured products and exports and imports.
The manufacturing activities are grouped into 78 sectors from input-output sector 3-055 up to 3-132. Follo~ing are the detailed sectoral descriptions of scope and definition, source of data, and the method of estimation which were adopted.
3-055. Canning and Preserving Meat
Scope and definition: The processing and preserving of meat, except an output of the slaughtering sector, are
included in this sector. The products of the sector are dendeng (dried meat) , abon, canned beef, canned pork, sausages and other preserved meats.
Source of data and method of estimation: The value of output and the input structure were obtained from the CBS publication, "Re-
- 87 -

r l
port of the Annual Survey of Large and Medium Manufacturing Establishments 1971" {IS-1971-CBS) .
3-056. Dairy Products
Scope and definition: This sector covers the production of food items from milk. Products are milk and cream,
condensed or powdered, butter and cheese.
Source of data and method of estimation: The value of output and the input structure were derived from IS-1971-CBS.
3-057. Canning and Preserving of Fruits and Vegetables
Scope and definition: This sector covers the processing and preserving of fruits and vegetables by canning, freez
ing, drying and bottling. The products of the sector are dried, frozen and canned fruits and vegetables; bottled fruits and vegetables; fruit and vegetable juices; jams, marmalades, jellies and so forth .
Source of data and method of estimation: The value of output and the input structure were obtained from IS-1971-CBS.
3-058. Canning and Preserving of Fish and Other Sea Food
Scope and definition: This sector covers the freezing, canning and preserving of seafood. The products are canned
fish, salted and dried fish, terasi (fish paste), petis (fish sauce), frozen shrimps, and other processed and preserved seafood.
Source of data and method . of esiimation: The value of output and the input structure were derived from IS-1971-CBS.
3-059. Coconut ·ou and Cooking Oil
Scope and definition: • This sector covers the extraction of. coconut .oil and the production of refined c;ooking oil in
factories . The products are cooking oil, coconut cake, and residue of coconut oil (glendo/blen· ·do) :: ,
. Source of data and method of estimation: The value of output and the input · structure were obtained from IS-1971 ~CBS.
3-060. Other Vegetables and Animal Oils and Fats
Scope and definition: This sector covers the factory production of cooking oil ·. from raw materials -other- than
copra. Also included here is the production of all animal oils and fats. The products of the sector are the refined palm oil, margarine, peanut oil, peanut butter, other , vegetable and animal oils and fats, and their by-products.
Source of dala and method of estimation: The value of output and .the input structure were derived from IS-1971-CBS.
I l ·'
7
l 7
l l l l 7 l l l l l l l 7 l l 7
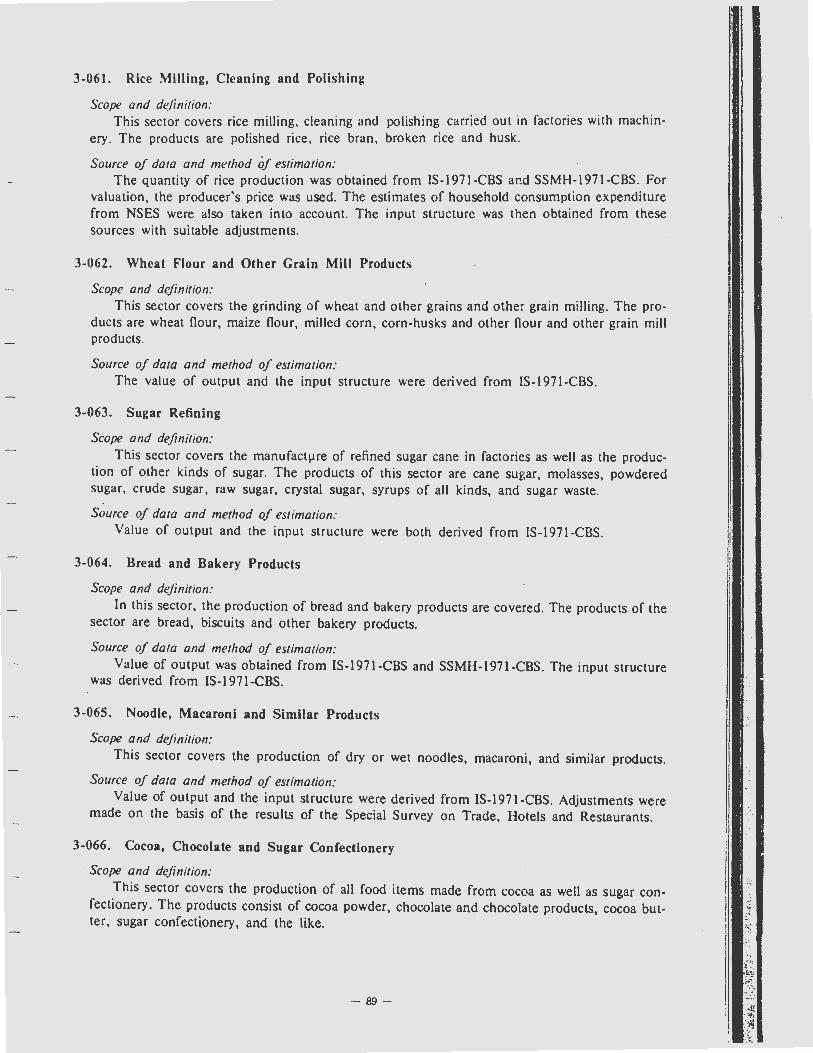
3-061. Rice Milling, Cleaning and Polishing
Scope and definition: This sector covers rice milling, cleaning and polishing carried out in factories with machin
ery . The products are polished rice, rice bran, broken rice and husk .
Source of data and method of estimation: The quantity of rice production was obtained from IS-1971-CBS and SSMH-1971-CBS. For
valuation, the producer's price was used. The estimates of household consumption expenditure from NSES were also taken into account. The input structure was then obtained from these sources with suitable adjustments.
3-062. Wheat Flour and Other Grain Mill Products
Scope and definition: This sector covers the grinding of wheat and other grains and other grain milling. The pro
ducts are wheat flour, maize flour, milled corn, corn-husks and other flour and other grain mill products.
Source of data and method of estimation: The value of output and the input structure were derived from IS-1971-CBS.
3-063. Sugar Refining
Scope and definition: This sector covers the manufactµre of refined sugar cane in factories as well as the produc
tion of other kinds of sugar. The products of this sector are cane sugar, molasses, powdered sugar, crude sugar, raw sugar, crystal sugar, syrups of all kinds, and sugar waste.
Source of data and method of estimation: Value of output and the input structure were both derived from IS-1971-CBS.
3-064. Bread and Bakery Products
Scope and definition: In this sector, the production of bread and bakery products are covered. The products of the
sector are bread, biscuits and other bakery products.
Source of data and method of estimation: Value of output was obtained from IS-1971-CBS and SSMH-1971-CBS. The input structure
was derived from IS-1971-CBS.
3-065. Noodle, Macaroni and Similar Products
Scope and definition: This sector covers the production of dry or wet noodles, macaroni, and similar products.
Source of data and method of estimation: Value of output and the input structure were derived from IS-1971-CBS. Adjustments were
made on the basis of the results of the Special Survey on Trade, Hotels and Restaurants.
3-066. Cocoa, Chocolate and Sugar Confectionery
Scope and definition:
This sector covers the production of all food items made from cocoa as well as sugar confectionery. The products consist of cocoa powder, chocolate and chocolate products, cocoa butter, sugar confectionery, and the like.
- 89 -

Source of data and method of estimation: Value of output and the input structure were obtained from IS-1971-CBS and SSMH-1971-
CBS.
3-067. Coffee Grinding
Scope and definition: This sector covers coffee processing (roasting, grinding, etc.) carried out by factories . The
products are roasted coffee and coffee powder, both fine and coarse.
Source of data and method of estimation: Estimates of value of output and the input structure for this sector were derived from
1S-1971-CBS.
3-068. Tea Processing
Scope and definition: This sector covers tea processing carried out by factories. The product of this sector is facto
ry processed tea, either packed or loose. Simple household processed tea is excluded from this sector and included in the agricultural sector.
Source of data and method of estimation: Both value of output and the input structure were obtained from IS-1971-CBS, and adjust
ments to the total output were made to account for underreporting.
3-069. Soybean Products
Scope and definition: This sector covers the production of food items from soya beans. The products consist of
soya sauce, bean cakes (tahu, tempe), etc.
Source of data and method of estimation: Value of output and the input structure were derived from IS-1971-CBS .and SSMH-1971-
CBS. To compensate for the underestimation of production, adjustments were made based on domestic consumption.
3-070. Other Food Products, not e_lsewhere classified
Scope and definition: This sector covers the production · of food · articles not elsewhere classified. · The products
consist of krupuk of all kinds, table salt, ice, ice cream, sauces of all kinds such as tomato and chilli sauce, dodo!, roasted peanuts, prepared animal feed, etc.
Source of data and method of estimation: The output and the input structure were obtained from IS-1971-CBS and SSMH-1971-CBS,
and adjustments to the output were made on the basis · of information ·on private domestic consumption. from NSES.
3-071. Alcoholic Beverages
Scope and definition: This sector covers the production of alcoholic beverages. The products consist of ethyl
alcohol, arrack, whisky, wine, beer, etc.
Source of data and method of estimation: Value of output of this sector' was based on information from IS-1971-CBS and
SSMH-1971-CBS. The input structure was also obtained from: these ·sources'.
- 90 -
7 7 7
7 7 7 7 7 7 l 7 l 7 7 l 7 7 l 7

3-072. Soft Drinks and Carbonated Water
Scope and definition: The production of non-alcoholic beverages for direct consumption without dilution or mix
ing are included in this sector. The products of this sector are soft drinks of all kinds, carbonated soda water, etc.
Source of data and method of estimation: The value of output and the input structure were derived from IS-1971-CBS and
SSMH-1971-CBS. The output was also based on information on private consumption expenditure .
3-073. Cigarettes
Scope and definition: Included in this sector are the production of cigarettes and other tobacco products such as
white cigarettes, clove cigarettes (kretek), and cigars. Also included here is tobacco processing carried out by factories. The products consist of white cigarettes and clove cigarettes, cigars and other tobacco products.
Source of data and method of estimation: Value of output and the input structure were derived from IS-1971-CBS and SSMH-1971-
CBS.
3-074. Spinning Industries
Scope and definition: This sector covers the spinning of fibers such as cotton, sisal , cocoon, and silk. Also
included is the spinning of synthetic and artificial fibers such as polyamide and polyvenil. The products consist of cotton yarn, silk yarn, synthetic yam, mixed cotton yarn, thread of all kinds, etc.
Source of data and method of estimation: Value of output and the input structure were derived from 1S-1971-CBS and SSMH-1971-
CBS.
3-075. Weaving Industries
Scope and definition: The weaving industry covers the transformation of yam into cloth and textiles. The use of
automatic and semi-automatic machinery in factories as well as traditional handicrafts using handlooms in the household are covered here. The products are all kinds of textiles.
Source of data and method of estimation: To obtain the value of total output of this sector, upward adjustments were made to the
information available from 1S-1971-CBS and SSMH-1971 -CBS since both of these sources were considered to have a downward bias. The input structure was derive,d from 1S-1971-CBS.
3-076. Textile Bleaching, Printing, Dyeing and Finishing, excluding Batik
Scope and definition: This sector covers the bleaching, printing, dyeing and finishing of uncolored textile goods or
yarn. The products are all kinds of bleached, colored, and finished yarn and fabrics .
Source of data and method of estimation: Value of output and the input structure were obtained from IS-1971-CBS and SSMH-1971-
CBS with adjustments made upward. ·
- 91 -
,. •-• > .-r .. • • -~-- - -- - - -~ - -

.....
3-077. Batik Industries
Scope and dejinition: The batik industry involves the production of batik. All kinds of batik products, whether
usable directly or indire~tly, are covered in this sector.
Source of data and method of estimation: Value of output and input structure were derived from IS-1971-CBS and SSMH-1971-CBS.
Considering the large scope of this activity in Indonesia, it was felt that the information from both sources was underestimated. Based on the observed inequality between domestic demand and supply, upward adjustments were made to the output.
3-078. Knitting Industries
Scope and definition: The knitting industry covers the production of knitted wearing apparel. The products of
this sector are athletic shirts, T-shirts, other knitted shirts, socks, men's briefs, etc.
Source of data and method of estimation: Value of output and the input structure were derived from IS-1971-CBS and SSMH-1971-
CBS.
3-079. Made-up Textile Goods, excluding Wearing Apparel
Scope and definition: This sector covers the production of finished textile goods, excluding wearing apparel. The
products of this sector consist of mattress covers, towels, blankets, bed-sheets, mosquito nets, pillow covers, draperies and laces; -sails, table cloths, linens, etc.
Source of data and method of estimation: Both IS-1971-CBS and SSMH-1971-CBS underestimate the total output of this sector.
Therefore, the output was adjusted based on the supply of raw materials available for this sector and the demand for the goods produced. The input structure was derived from the two sources cited above.
3-080. Wearing Apparel, excluding Footwear
Scope and definition: This sector covers the production of wearing apparel, excluding footwear, for men, women
and children. The products consist of suits, coats, jackets, sweaters, trousers, shirts, dresses: blouses, slacks, shorts, underwear, skirts, caps, hats, and so forth.
Source of data and method of estimation: The sources of data for this sector also were IS-1971-CBS and SSMH-1971-CBS.
3-081. Carpets, Rugs, Ropes and Others
Scope and definition: This sector covers the production of carpets, rugs, ropes, ~nd the like. The products consist
of carpets of wool or other materials, rugs of all kinds, gunny bags, ropes, fish nets, etc.
Source of data and method of estimation: Value of output and the input structure were obtained from IS-1971-CBS and SSMH-1971-
CBS.
-92 -
t 7 'If ' '<'.
.~.:.
i '.~
·~ ,, '_\ {· •: ·::-:
,l
.. ~
7 7
7 7 l l l 7 7 7 l 7 7 l l 7 l 7

3-082. Tanneries and Leather Finishing.
Scope and definition: The tanning and processing of animal hides and skins are included here . The products of
this sector are leather of cow, buffalo, sheep, goat, and other kinds of leather.
Source of data and method of estimation: The input structure was obtained from IS-1971-CBS. The value of output was estimated
based on the supply of raw hides from the animal slaughtering sector and on the demand for processed leather.
3-083. Leather Products, excluding Footwear
Scope and definition: This sector covers the production of leather goods except for footwear. The products consist
of belts, purses and handbags, luggage and similar items.
Source of data and method of estimation: The sources for the input and the output of this sector were IS-1971-CBS for large and
medium establishments and SSMH-1971-CBS for small-scale establishments and cottage industries.
3-084. Footwear of Leather
Scope and definition: . Included in this sector is the ~roduction of footwear from leather for men, women and
children. The products consist of shoes, sandals, slippers, and the like.
Source of data and method of estimation: The estimate of the total output was from demand, with suitable allowance made for the
import and export of these commodities. The input structure was derived from 1S-1971-CBS.
3-085. Sawmills, Planning and Other Wood Processing
Scope and definition:
This sector covers the sawing and processing of wood performed in factories using machinery and independent of the cutting of wood in the forest. The products consist of all kinds of sawn wood, playwood, and preserved wood.
Source of data and method of estimation: Information on value of output and the input structure was initially derived from IS-1971-
CBS, and adjustments were made on the basis of demand by manufacturing, construction, and so on.
3-086. Wood and Cork Products
Scope and definition:
This sector covers the production of wood and cork products of all kinds. Also included here are handicraft products made of bamboo, rattan, cork, etc . The products of this sector are wooden boxes and containers; rattan and bamboo baskets; wood, rattan and bamboo handicrafts; cork products; and similar items.
Source of data and method of estimation: Value of output and the input structure were obtained from IS-1971-CBS and SSMH-1971-
CBS, with some minor adjustments.
- 93 -
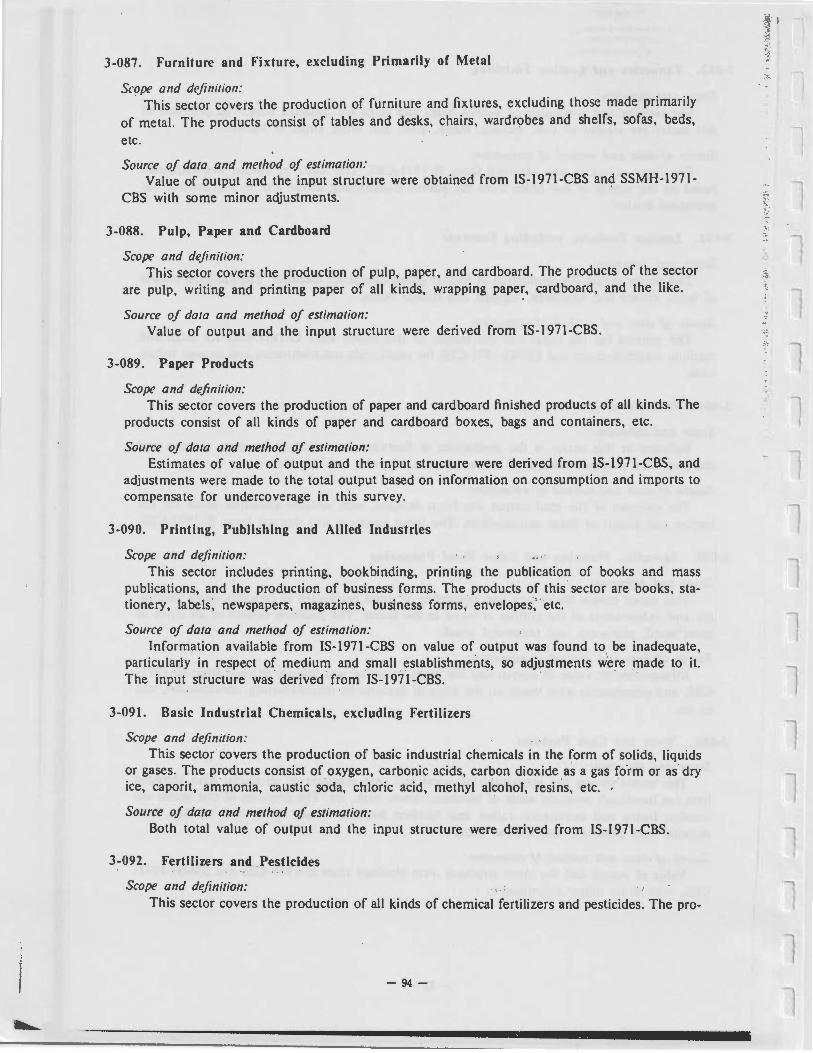
3-087. Furniture and Fixture, excluding Primarily of Metal
Scope and definition: · This sector covers the production of furniture and fixtures, excluding those made primarily
of metal. The products consist of tables and desks, chairs, wardrobes and shelfs, sofas, beds,
etc.
Source of data and method of estimation: Value of output and the input structure were obtained from IS -1971-CBS an~ SSMH-1971-
CBS with some minor adjustments.
3-088. Pulp, Paper and Cardboard
Scope and definition: This sector covers the production of pulp, paper, and cardboard. The products of the sector
are pulp, writing and printing paper of all kinds, wrapping paper, cardboard, and the like.
Source of data and method of estimation: Value of output and the input structure were derived from IS-1971-CBS.
3-089. Paper Products
Scope and definition: This sector covers the production of paper and cardboard finished products of all kinds. The
products consist of all kinds of paper and cardboard boxes, bags and containers, etc.
Source of data and method of estimation: Estimates of value of output and the input structure were derived from IS-1971-CBS, and
adjustments were made to the total output based on information on consumption and imports to compensate for undercoverage in this survey.
3-090. Printing, Publishing and Allied Industries
Scope and definition: This sector includes printing, bookbinding, printing the publication of books and mass
publications, and the production of business forms. The products of this sector are books, stationery, labels, newspapers, magazines, business forms, envelopes,'· etc.
Source of data and method of estimation: Information available from IS-1971-CBS on value of output was found to. be inadequate,
particularly in respect of medium and small establishments, so adjustments were made to it. The input structure was derived from IS-1971-CBS. ·
3-091. Basic Industrial Chemicals, excluding Fertilizers
Scope and definition: This sector covers the production of basic industrial chemicals in the form of solids, liquids
or gases. The products consist of oxygen, carbonic acids, carbon dioxide as a gas fo'rm or as dry ice, caporit, ammonia, caustic soda, chloric acid, methyl alcohol, resins, etc. . .·
Source of data and method of estimation: Both total value of output and the input structure were derived from IS-1971-CBS.
3-092. Fertilizers and Pesticides
Scope and definition: This sector covers the production of all kinds of chemical fertilizers and pesticides. The pro-
- 94 -
I
' .. ·. ..
,,
7 7
7 7 7 l 7
7 l 7 7 7 7 l 7 7 l 7

ducts of this sector are urea (potassic fertilizer), phosphate fertilizers, nitrogenous fertilizers, and pesticides of all kinds.
Source of data and method of estimation: Total value of output and the input structure were derived from IS-1971-CBS.
3-093. Paints, Vernishes and Lacquers Industries
Scope and definition: Included in this ieCtor is the production of paints, varnishes, lacquers and similar products.
The products consist of water and cellulose paints, oil paints, varnishes, lacquers, and all other kinds of paints.
Source of data and method of estimation: Value of output and the input structure were derived from IS-1971-CBS, and adjustments
were made to the output based on the demand for production.
3-094. Drugs and Medicines Industries
Scope and definition: This sector includes the production of drugs and medicines including traditional medicines.
The products of this sector consist of tablets, capsules and liquid medicines; medicines for injection; powder, syrup and analgesic medicines; and traditional medicines of all kinds.
Source of data and method of estimation: Value of output" was obtained ,from IS-1971-CBS and SSMH-1971-CBS, while the input
structure was derived from IS-1971-CBS. An upward adjustment of the estimates for output was made particularly for native or traditional medicines, which are mostly produced by cottage industry.
3-095. Soap and Cleaning Preparations Industries
Scope and definition: This sector covers the production of soaps, tooth paste and detergents. The products consist
of bath and toilet soaps, washing soaps, detergents, tooth paste, etc.
Source of data and method of estimation: IS-1971-CBS and SSMH-1971-CBS were the main sources of information for the value of
output and the input structure. Adjustments were made since many establishments are producing these items as subsidiary products.
3-096. Cosmetics Industries
Scope and definition:
This sector covers the production of cosmetic articles. The products consist of perfumes, pomade, hair lotion, shampoo, face powder, talcum powder, and other cosmetic articles in liquid or solid form.
Source of data and method of estimation:
The main source of data for value of output and the input structure was IS-1971-CBS. Adjustments were necessary based on information on demand for the products of this sector.
3-097. Matches Industries
Scope and Definitioni
. This sector covers the production of matches. The products consist of all kinds of matches
- 95 -

made of wood or paper.
Source of data and method of estimation: Information on value of output and the input structure of this sector were derived from
IS-1971-CBS.
3-098. Other Chemical Industries
Scope and definition: This sector covers the production of chemical products not covered in the other sectors.
The products of this sector are disinfectants such as carbolic, creolin, shoe and other polishes, photographic films and paper, carbon paper, essences, etc.
Source of data and method of estimation: The source of data for value of output and the input structure was IS-197 l-CBS.
3-099. Petroleum Refining
Scope and Definition: This sector covers the processing and refining of crude oil. The products of the sector are
gasoline, kerosene, aviation fuel, diesel oil, lubricants and greases, LPG, residues oil, asphalt and other residues of oil refining.
Source of data and method of estimation: The quantities of commodities produced were obtained from PERTAMINA, the oil state
enterprise carrying out oil refining in Indonesia. T.he price used here was the reported price at the first stage of transaction from the refinery to the distributors. The input structure was derived from the same source and adjusted on the basis of comparisons with the input structures of other refineries.
3-100. Other Petroleum and Coal Products
Scope ,and definition: . This sector covers the production of such items as paraffin and tar from crude petroleum
and coal. · · '
Source of data and method of estimation: Data for the output and the input structure was · obtained from the processing factories .
3-101. Tyres and Tubes Industries
Scope and definition: This sector covers the production of all kinds of tyres and tubes. The products are tyres and
tubes for cars, trucks, motorcycles, bicycles and for other kinds of vehicles, made of natural rubber or syhthetic rubber.
Source of data and meth~d of estimation: IS-1971-CBS was the main source of information both for value of output and the input
structure.
3-102. Other Rubber Products
Scope and definition:
The production of other rubber products is covered here. The products of thi·s -~~ctor consist of rubber footwear, foam rubber, rubber compounds of all kinds, rubber sheets and plates, rubber pipes and tubes, ebonite, etc. Products made of synthetic rubber are ·alsc> in'clu<led here.
- 96 -
7
' V
i,,
7
l l l ,,
,. . 7 •. 7 ' I
7 ;~
i 1 :J l ~
~i
l l l 7 l 7 l 7

-,
Source of data and method of estimation: Information on both the value of output and the input structure was obtained from 1S-1971-
CBS and SSMH-1971-CBS and suitable adjustments were made.
3-103. Plasticware
Scope and definition: This sector covers the production of plasticware. The products are tooth brushes, plastic
ropes, plastic bags, utensils, plasticware for industrial use, plastic toys, plastic sheets and plates, cloth hangers. hair combs, and all other kinds of plasticware.
Source of data and method of estimation: As in the case of the sectors above, the main source of the value of output and the input
structure was IS-1971-CBS. However, adjustments were made to insure consistency between the demand for the products of the sector and the supply of raw materials for production.
3-104. Ceramics and Earthenwares
Scope and definition: This sector covers the production of ceramic and earthenwares. The products are ceramic
household wares, earthen household wares, ceramic and earthenwares for industrial use, sanitary ceramic fittings, ceramic electrical goods, etc.
Source of data and method of estimation: Total value of output and the input structure were derived from IS-1971-CBS.
3-105. Glass and Glass Products
Scope arid definition: This sector covers the production of glass and glass products for household, industrial or
construction use. The products of this sector consist of bottles and other glass containers, drinking glasses, sheet glass, chimneys for lamps, and oiher glass products.
Source· of data and method of estimation: : · ·· Information on value of output was taken from IS-1971-CBS and then adjustments were
made to compensate undercoverage. The input structure was also derived from IS-1971-CBS.
3-106. Structural Clay Products
Scope and definition: This sector covers the production of structural products of clay and cement. The products
consist of bricks, roof and floor tiles, slates, pipes and similar products.
Source of data and method of estimation: IS-1971-CBS and SSMH-1971-CBS were the basic sources of information for value of out
put and the input structure. However those sources are subject to undercoverage, so adjustments in the value of output were made based on the input of . the construction sector. .
3-107. Cement
Scope and definition: The • production of cement and lime is covered here. The products are cement and lime.
Source of data and method of estimation: The quantity of cement production was obtained from the Ministry of Industries, while the
producer's price and the input structure were derived from IS-1971-CBS . Value of output and
- 97 -
·:.J ! '~·~
t-· : ~ '

the input structure of lime production were derived from IS-1971-CBS and SSMH-1971-CBS, with the estimate of output adjusted upward based on information on input in the construction sector.
3-108. Other N on-Metalic Mineral Products
Scope and definition: This sector covers the production of non-metalic mineral products not elsewhere classified.
The products consist of gypsum, asbestos, caolin, eternite sheets, and the like.
Source of data and method of estimation: Information from IS-1971-CBS and SSMH-1971-CBS on value of output were adjusted for
undercoverage. The input structure was also derived from these sources.
3-109. Iron and Steel Basic Industries
Scope and definition: This sector covers the smelting and processing of iron and steel. The products include pig
iron, processed iron scrap, steel ingots, ferro-alloys, steel pipes and tubes, steel plates, iron and steel castings and forgings.
Source of data and method of estimation: Information for this sector was not readily available. Hence, the total output was estimated
based on the demand for production.
3-110. Non-Ferrous Basic Metal Industries
Scope and definition: This sector covers the smelting and processing of non-ferrous metal ores for the production
of metal. The products consist of tin bars; the precious metals, gold and silver; and other nonferrous metals such as zinc, aluminium, and copper.
Source of data and method of estimation: IS-1971-CBS was the main source of information for the value of output of this sector,
except for tin smelting and gold and silver refining. The ·quantity of production of tin, gold and silver was obtained from 'Mining Statistics' (periodically published by the Ministry of Mining), while prices available from the CBS were used for valuation. The input structure was derived from the returns of the Industrial Census of 1974.
3-111. Cutlery, Hand Tools and General Hardware
Scope and definition: This sector covers the production of cutlery, hand tools, and other implements and tools
made of iron, steel or other metals. The products of this sector consist of agricultural imple-ments, cutlery, hand tools and other imple~ents and tools. ·
Source of data and method of estimation: Total value of output and the input structure were derived from IS-1971-CBS with supple-
mentary information from the CBS. ·
3-112. Furniture and Fixtures Primarily of Metal
Scope and definition: This sector covers the prodution of furniture and fixtures made primarily of metal. The pro
ducts consist of tables, chairs,. ·. desks,; ·wardrobes, shelfs, . beds and other metal items. ; . ,: . ; : ·.; · 1:
-98-
l
7 l l 7 7 7 7 7 7 l 7 l 7 7 7 7

Source of data and method of estimation: The basic sources of information were the IS-1971-CBS and supplementary information
available from the CBS .
3-113. Structural Metal Products
Scope and definition: This sector covers the production of structural metal products. The products of this sector
are the structural components of bridges and buildings, tanks and boilers, lattices, and other structural metal products made of iron or steel.
Source of data and method of estimation: The main sources of data are IS-1971-CBS and SSMH-1971-CBS with necessary adjust
ments.
3-114. Other Fabricated Metal Products
Scope and definition: Included under this sector is the production of other fabricated metal products such as nails,
tin containers, cables and wires, screws, bolts and nuts, drums, cans, pans, and plates.
Source of data and method of estimation: The basic information was from IS-1971-CBS and SSMH-1971-CBS. The value of output
and the input structure were derived through procedures similar to those described ~bove .
. 3-115. Non-Electrical Machinery '
Scope and definition: This sector covers the production of all non-electrical machinery. The products consist of
engines and turbines; agricultural machinery; metal, wood working and other industrial machinery; office, computing and accounting machinery; spare parts, etc.
Source of data and method of estimation: The only source of information is IS-1971-CBS. Due to the limitations of this information,
adjustments were made for the estimates of the value of output and the input structure.
3-116. Industrial Electrical Machinery and Apparatus
Scope and definition: Included in this sector is the production of electrical machinery and apparatus. The products
consist of generators, transformers, electric motors, and other electrical machinery and apparatus for industrial use.
Source of data and method of estimation: Basic information for the estimation of the value of output and the input structure were
derived from IS-1971-CBS with some adjustments to take into account its underestimation .
3-117. Radio, Television and Communication Equipment and Apparatus
Scope and definition: This sector covers the production of radio, television sets, telephone sets, communication
equipments, tape and casette recorders, stereo components, and parts and spare parts. Assembling and repairing of the above items is also included in this sector.
Source of data and method of estimation: Both the value of output and the input structure were derived from IS-1971-CBS. This was
- 99 -

supplemented by other information available from CBS, such as that on the import of spare parts and components.
3-118. Electrical Appliances and Housewares
Scope and definition: Included under this sector are the production of electrical appliances and housewares. The
products include electric fans, electric stoves and ranges, refrigerators and freezers, electric irons, air conditioners, electrical pumps, and electric tools.
Source of data and method of estimation: The source of data and method of estimation of this sector were similar to those for the
earlier sectors.
3-119. Accumulator and Dry Battery Industries
Scope and definition: This sector covers the production of accumulators and dry batteries. The products are all
kinds of accumulators and dry batteries.
Source of data and method of estimation: The output and the input structure were derived from IS-1971-CBS.
3-120. Other Electrical Apparatus and Supplies and Repairing
Scope and definition: Included under this sector is the production of electrical apparatus and supplies such as light
bulbs and lamps; electrical cables and wires; switches and fittings; and · repairs thereof.
Source of data and method of estimation: The value of output and the input structure were derived from IS-1971-CBS.
3-121. Ship and Boat Building and Repairing
Scope and definition: 'This _sector covers the building and repairing of ships, boats and oth~r. ~ater transport vehi
cles: The products consist of ships, tankers, motor vessels, and inland water vessels. Repairs and services of ships and boats are also included.
Source of data and method of estimation: The value of output and the input structure were basically derived from IS-1971°-CBS. These
figures ·were supplemented by other information such as that for the import or' machinery for ships and boats and for the demand · for products by other sources.
3-122. Railroad Equipment
Scope and definition: · The production and repairing of railroad equipment are included here: Products of this sec
tor are railroad passenger cars, locomotives, spare parts and components. Repair work is also included.
Source of data and method of estimation: The value of output and the input structure were basically derived from the ·reports of Rail
ways State Enterprise and IS-1971-CBS.
I ,•
-100-
,
7
7 ·• 7 ,.
·:;. ;it·
7 7 7 l 7 7 l 7 7 7 l l 7 7

7
7
3-123. Motor Vehicles
Scope and definition: This sector covers the producing and assembling of motor vehicles. The products consist of
trucks, passenger cars, bu~s. and spare parts.
Source of data and method of estimation: IS-1971-CBS was the basic source of information for estimating the value of output and the
input structure. Data on imports of parts for completely knock-down motor vehicles as supplementary infor
mation on the number of cars assembled was used in estimating the output.
3-124. Motorcycles, Bicycles and Other Vehicles
Scope and definition: This sector covers the producing and assembling of motorcycles, bicycles and other vehicles.
The products consist of motorcycles, scooters, helicaks and similar vihicles, becaks, bicycles, carts, and other non-motorized vehicles.
Source of data and method of estimation: The source of information and estimation method were similar to those for the previous
sector.
3-125. Repairing of Motorized and Non-Motorized Vehicles
Scope and definition: This sector covers repairs of motorized and non-motorized vehicles.
Source of data and method of estimation: The activities under this sector were not covered by the annual survey of manufacturing es
tablishments. To obtain the value of output and the input structure, the initial estimation was made based on demand side, and attempts were also made to use various kinds of input indicators relevant to the activity of this sector, such as the consumption of tyres, spare parts, and components.
3-126. Aircraft Industry
Scope and definition: Included here are the production of aircraft and spare parts and their repair. The products
consist of commercial passenger and cargo planes, and engines and turbines for aircraft. Repairs of the above items are also included.
Source of data and method of estimation: Data on this sector is .very limited. Initial estimates were made for the output and the input
structure by using the method of estimation of the previous sector (3-125) .
3-127. Professional and Scientific Equipment
Scope and definition: Included here are the production of professional and scientific equipment and their repairs .
The products consist of scientific and medical equipment, measuring instruments, and spare parts for these . Repairs of the above items are also included.
Source of data and method of estimation: The initial estimates of the value of output and the input structure were obtained through
an appraisal of the relationship between supply and demand for the products of this sector, with
-101-
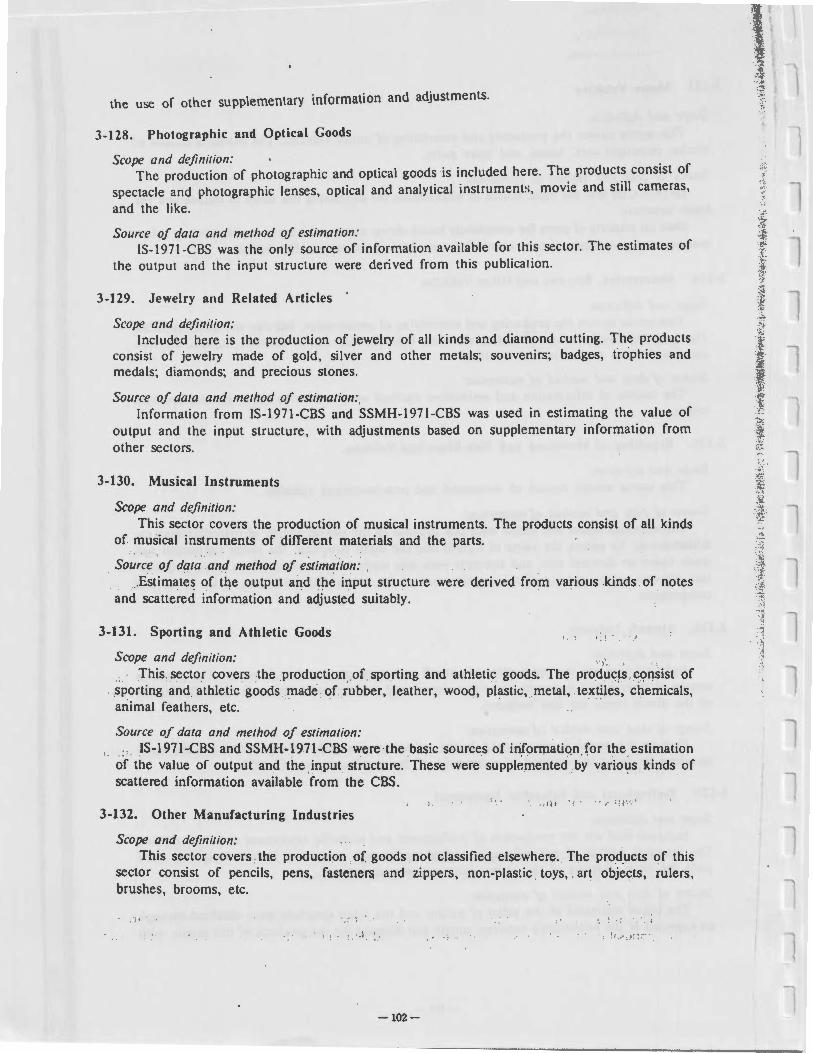
the use of other supplementary information and adjustments.
3-128. Photographic and Optical Goods
Scope and definition: • . The production of photographic and optical goods is included here. The products consist of
spectacle and photographic lenses, optical and analytical instruments, movie and still cameras, and the like.
Source of data and method of estimation: IS- 1971-CBS was the only source of information available for this sector. The estimates of
the output and the input structure were derived from this publica1 ion.
3-129. Jewelry and Related Articles ·
Scope and definition: Included here is the production of jewelry of all kinds and diamond cutting. The products
consist of jewelry made of gold, silver and other metals; souvenirs; badges, trophies and medals; diamonds; and precious stones.
Source of data and method of estimation:, Information from IS-1971-CBS and SSMH-1971-CBS was used in estimating the value of
output and the input structure, with adjustments based on supplementary information from other sectors.
3-130. Musical Instruments
Scope and definition: This sector covers the production of musical instruments. The products consist of all kinds
of musical instruments of different materials and the parts.
Source of data and method of estimation: . .. Estimates of tqe output and the input structure were derived from various .kinds of notes
and scattered information and adjusted suitably.
3-131. Sporting and Athletic Goods
Scope and definition: . This sector covers the production .of sporting and athletic goods. The products co~sist of sporting and . athletic goods made of rubber. leather, wood, plastic, metal, textiles. chemicals, animal feathers, etc. .
Source of data and method of estimation: , . .. IS-1971-CBS and SSMH-1971-CBS were the basic sources of information for the estimation
o'r the value of output and the input structure. These were suppl~mentect' by various kinds of scattered information available 'rrom the CBS. · ·
3-132. Other Manufacturing Industries
Scope and definition:
,. ,,, ' :• .. . ,- ;:;· .. ·
This sector covers . the production of goods not classified elsewhere. The prod_ucts of this sector consist of pencils, pens, fasteners and zippers, non-plastic . toys, . art objects, rulers, brushes, brooms, etc.
' I
, . I
-102-
, .. ,.
7 7 7 l 7 7 7 l 7 7 7 7 7 l 7 l 7
I
7

-,
Source of dara and merhod of esrimation: Information from IS-1971-CBS and SSMH-1971-CBS was used as the basic sources for the
initial estimation of the value of output and the input structure with necessary adjustments and revisions.
-103-

S. ELECTRICITY, GAS AND WATER SUPPLIES (Input-Output Code: 4-133 and 4-134)
4-133. Electricity
Scope and definition: This sector covers the generation, transmission and distribution of electricity carried out by
the Electricity State Enterprise (PLN) as well as that by local governments and other industrial sectors. The electric power is generated by water, steam, diesel, gas or other fuels. The production is defined in terms of total kilo-watt-hours (kwh) produced, to include quantity sold as well as losses during transmission.
Source of data and method of estimation: Data on the value of production and the input structure for PLN was obtained from the
Annaul Report of PLN. Information on the value of output and the input structure outside PLN was derived from the data collected in the 1974 Industrial Census. Data on electric power generated by manufacturing establishments was obtained from the annual survey of manufacturing establishments.
4-134. Gas and Water Supply
Scope and definition: This sector covers the production and distribution of gas and drinking water. The produc
tion of gas in gas works from coal and its distribution to industries and households is included here. The refining and bottling of natural gas is not included here . The by-products of gas production such as coke and tar are also included here. Water supply only covers activities carried out under the auspices of local governments (municipalities).
Source of data and methods of estimation: Information on the value of output and the input structure of the gas sector was obtained
from the annual report of the gas companies. The value of output of water supply was estimated based on information contained in the report of the meeting of Water Supply Companies in 1972, while the input structure was derived from the 1974 Indt1.strial Census data with some adjustments.
-104-
7 7
7 l 7 7 l 7 7 l 7
7
7
-.,

6. CONSTRUCTION (Input-Output Codes: 5-135 to 5-141)
(I) Scope and definition: The construction activity· includes new construction, the extension, alteration, and repairs of
dwellings and non-residential buildings; irrigation projects and the like; roads and bridges; electric plants; harbours; airports; railways; sewers; telephone and telegraph lines; etc. For the input-output table estimation, the total construction activity has been classified into seven sectors as described below.
5-135. Residential Buildings
A residential building is defined as a building used for household residential purposes. The total value of residential buildings covers value of work put in place on the construction of residential buildings during 1971. Also included here are outlays for extension, alteration, addition and capital repairs of residential buildings, as well as expenditures on the installation of electricity, air conditioning and other fittings usually installed before dwellings are occupied. Excluded is the value of the land where the buildings are constructed.
5-136. Non-Residential Buildings
A non-residential building is defined as a building not used for residential purposes. Examples are mosques, ch~rches, offices, shops and other non-residential buildings. The total value of non-residential buildings constructed during 1971 includes expenditures on extension, additions, alterations and capital repairs. Also included are outlays for the installation of electricity, air conditioning and other fittings usually installed before the building is put into use. The value of the land where the buildings are constructed is excluded.
5-137. Public Works in the Agricultural Sector
This sector includes new construction, extension, and repairs of irrigation projects, river dredging and the like financed by central and local governments.
--, 5-138. Public Works on Roads and Bridges
-,
--,
7
--,
Included here are new construction, extensions, and repairs of roads and bridges by central and local governments.
5-139. Installation of Electricity
This sector covers electric installation in buildings after the buildings are used or occupied, as well as the transmission and distribution of electricity. The repairs are also included.
5-140. Other Construction
New construction, extensions, alterations, and repairs of harbours, airports, railroads, sewers, telephone and telegraph lines, and other kinds of construction are covered in this sector.
5-141. Current Repairs and Maintenance of Buildings
Current repair of buildings is defined as repair and maintenance which does not lengthen the expected normal lifetime and only maintains normal conditions; for example, the painting of walls, doors and windows, the replacement of broken tiles, etc.
-105-

t ! ' '
I
(2) Sources of data and method of estimation:
(i) Output The method of estimation of the output of the construction sector was based on the
commodity flow approach, i.e., through information on imports and domestic production of construction materials, on the installation of machinery and equipment before the buildings are used on administration costs and on gross value added. Information on the imports of construction materials was derived from import statistics classified by commodity (CBS). Sales tax, import duty, and other truces were added to the C.I.F. value. The trade margins and transport costs derived from the Special Survey for Trade Margins and Transport Costs (STT) were also added to the value of imported construction materials to arrive at the value at purchaser's prices. The value of domestically produced construction materials at producer's price was estimated on the basis of IS-1971-CBS, while the corresponding trade margin and transport costs were also derived from the STT. The percentages of administrative cost and value added were derived from the survey on construction enterprises conducted in six cities by the CBS.
Residential (5-135) and non-residential buildings (5-136): The method of estimation for these sectors was based on the expenditure approach. Infor
mation on output was obtained from the 1973 survey of building construction which was undertaken through a supplementary questionnaire under the 1974 Industrial Census. The information covers the value of new buildings, extensions, alterations and capital repairs of residential and non-residential buildings. The value at 1971 prices was estimated by using the price index and the total population as indicators.
Public works in the agricultural sector (5-137), public works on roads and bridges (5-138) and the installation of electricity (5-139):
The method of estimation in these sectors was also based on the expenditure approach. Information on output was derived from the central government development budget and the actual receipts and expenditures of construction activities at provincial, regency, municipal, and village level.
Other construction (5-140): The value of other construction was obtained as a residual, i.e., as the difference between
the total output of the construction sector and the total of. the outputs of the other six sectors.
Current repairs of residential and non-residential buildings (5-141): The value of current repair of residential and non-residential buildings was derived from the
results of the 1973 survey of building construction. The value of current repairs at 1971 prices was estimated by using the price index and figures of the total population.
(ii) The input structure The input structure of each construction sector Wa5 obtained from the survey on
construction enterprises in six cities. The input structure in each sector was obtained by multiplication of input coefficients and output. Subsequently, adjustments were made for each cell within the sectors.
-106-
7
l l 7 7 l 7 l l l l 7 7 7 7 7 7 l 7

7.
........
7. TRADE, RESTAURANTS AND HOTELS (Input-Output Codes: 6-142 to 6-145)
This division covers wholesale and retail trade, restaurants and hotels, following the International Standard l~dustrial Classification (ISIC) .
6-142. Wholesale Trade and
6-143. Retail Trade
Scope and definition: These sectors cover wholesale and retail trading activities. Wholesale trade is the providing
of distribution services in conveying commodities from producers to purchasers; the purchasers being (1) those consuming the commodities as raw materials for the production of other commodities (here the consumer is the non-household consumer), (2) traders who sell the ·commodities as the next step in the chain of transaction. Included here are the activities of exporters, importers, large and medium traders and auctioneers, to the extent that they serve nonhousehold consumers. Included under retail trade are the activities of businesses serving households (such as shops, stores, kerosene retailers, gasoline pumps, other pumps, and other small traders).
Sources of data and method of estimation:
The output of these sectors is •the wholesale and retail trade margin which is generated by the trade of commodities. Therefore, the estimation of the total output was made by multiplying the output of each commodity sold by the ratio of the trade margin. The calculations were made separately for the wholesale trade margin and the retail trade margin. The ratios used were obtained from miscellaneous sources: (1) for some agricultural products, special surveys were undertaken and supplemented by the results of the Agro-Ecocomic Survey conducted by the Ministry of Agriculture, (2) for cattle, a special survey on prices undertaken for national income compilation supplemented by a research paper by Gajah Mada University on cattle marketing channels, (3) for fishery production, the Fishery Survey conducted by the Directorate General of Fishery, and (4) for manufactured goods, the Survey on Commerce in Yogyakarta and other special surveys conducted by Input-Output Team.
The input structure of the trade sector was based on a special ad-hoc survey. Included in the input of trading activity are the cost of packing materials, administrative expence, repairs and maintenance of buildings and equipment, etc.
Note: In the definition of trading activity to decide the ratio of total output marketed, two concepts were considered; First concept: Trading activity is defined as including all transactions whether undertaken by traders or not. This is called 'market surplus' concept because of the assumption that all production which is sold, regardless of the distribution channel, represents marketed surplus. Second concept: Trading activity is defined as including only that conducted by traders. Transactions by others, e.g., by producers (farmers selling their production directly to manufactures, manufacturers selling their products directly to consumers in the market, etc.) would not be included as trading activity . Trade margin here is only for commodities where there is a price increase due to trade. Hence, the ratio of trade margin for these commodities should be estimated together with information on the percentage of total transactions undertaken by traders and others. As a consequence, the calculations will become more complicated. However, the second concept is more consistent than the first.
The equations used in the, calculations are :
-107-

Wholesale Trade Margin: W; = X; x (MSi x V wi x TR..,i) Retail Trade Margin: R; - X; x (MS; x V,i x TR,;)
where: X; Output of sector i MS; Marketed ratio of the commodity of sector i
V wi Ratio of commodity sold by wholesaler V,; Ratio of commodity sold by retailer
TRwi - Ratio of wholesale trade margin TR,; - Ratio of retail trade margin
• A problem in the adoption of the above equations was that separate information on the wholesaler and retailer was not always available. In that case, the two ratios, V wi and V ri were estimated., based on the assumption that non-household consumption good were traded only through wholesalers while household consumption goods were traded through both wholesalers and retailers.
6-144. Restaurants and Drinking Places and
6-145. Hotels and Lodging Places
Scope and definition: These sectors cover activities of restaurants and hotels in accordance with ISIC. It was
decided that restaurant activities would include restaurants, coffee houses, drinking places, and bars whether undertaken separately or as part of department stores, hotels, or night clubs.
The coverage of hotels is of all activities of hotels whether they are regular hotels, motels or other lodging places. ·
Sources of data and method of estimation: The output of restaurants and hotels was calculated on the basis of the average output per
employee multiplied by the total number of employees in these sectors. The average output per employee was based on a special survey conducted for this purpose. It should be noted that the survey was conducted only in Jakarta and mainly covered the large establishments with better administration and bookkeeping. This information was utilized in estimating the output as a whole, using per capita consumption expenditure for food in Jakarta compared with that outside Jakarta based on 1969/1970 NSES. To adjust the total output from 1974 prices to 1971 prices, the commodity index of the input of restaurants was used.
The output of hotels was estimated based on the average output per employee from the figures compiled by the Transport Statistics Division of the CBS, and the total number of . employees in this sector estimated from the 1971 Population Census.
The input structures of both restaurants and hotels were based on a special survey undertaken for that purpose .
-108-
7 n 7 7 7 7 7 7 7 l 7 7 l 7 7 7 7 7 7

--, 8. TRANSPORTATION AND COMMUNICATIONS
(Input-Output Codes: 7-146 to 7-155)
This division consists of the transportation of goods and p·assengers by road, rail, ship, and plane, as well as services allil!d to transportation and communication activities. This division is classified into ten sectors described below.
7-146. Railways
Scope and definition: The activities of this sector are carried out by a state enterprise, which was called
'Perusahaan Negara Kereta Api' (PNKA) but has operated from 1973 under the name 'Perusahaan Jawatan Kereta Api' (PJKA). The activities of this enterprise include transportation by railways, shipping and other supporting activities as well as non-transportation activities. Covered under this sector is only transportation by railways; the other activities were transfered to other sectors.
Source of data and method of estimation: The output and the input structure for this sector were obtained from the profit and loss
account in the Annual Report of PNKA for 1971. Some adjustments were made in the input structure especially to account for overhead cost.
Note: PJKA has a special workshop for the repair and maintenance of transport equipment (Balai Yasa) . The activities of this workshop were transfered to the relevant input-output sector. But, as the data of the value of output was not available, this was calculated as the total cost charged to this activity.
7-147. Road Passenger Transport
Scope and definition: Under the sector are included the transportation of passengers by motorized vehicles such
as city buses, intercity buses, taxies, oplets, microbuses, bemoes, helicaks and also by nonmotorized vehicles such as becaks and dokars. This sector covers transport vehicles used for general and specialized transportation, and vehicles used for private purposes are excluded
Sources of data and method of estimation: The indicators which were used to estimate the output of this sector were the total number
of vehicles and the average revenue per vehicle calculated separately for each type of vehicle. The total number of motorized vehicles, excluding bemoes and helicaks, was taken from 'Statistik Kendaraan Bermotor' (Motor Vehicle Statistics) published by the CBS. The total number of other kinds of motorized vehicles and that of non-motorized vehicles were taken from the regional publications. The average output per vehicle was obtained from the special surveys conducted for this purpose during March and April, 1975, when information for 1974 was collected. This average revenue for 1974 was extrapolated to that for 1971 by using the passengerkm price index.
The gross output of this sector done separately for each type of vehicle, was calculated by multiplying the .total number of vehicles by the average revenue per vehicle. The input structure was based on the results of the special survey conducted for this purpose.
In practice, these types of vehicles also undertake freight transport, but it is difficult to separate freight transport and passenger transport. Hence, it was assumed that these vehicles are used for passenger transport.
-109-

7-148. Road Freight Transport
Scope and definition: This sector includes freight transport by trucks and the like (gerobaks and pedaties).
Source of data and method of estimation: The indicators which were used for estimating the output of this sector were the total num
ber of vehicles and the average revenue per vehicle, calculated separately for each type of vehicle. The total number of gerobaks/pedaties was taken from the regional publications. The average revenue per vehicle for each type of vehicle was obtained from the special survey conducted for this purpose. The survey was conducted during March and April 1975 and the collected data were for 1974. Extrapolation was made on the average output in 1974 to arrive at that for 1971 by using the passenger-km price index.
The gros.5 output of this sector was calculated separately for each type of vehicle by multiplying the total number of vehicles by the average revenue per vehicle. The input structure was based on the special survey conducted for this purpose.
Note: Although freight transport vehicles also undertake passenger transport in the country side, it has been assumed that these_are used only for freight transport. Further, it was felt that this would cancel out with road passenger transport vehicles being used for freight transport.
7-149. Shipping
Scope and definition: This sector includes freight abd passenger transport by vessels. Chartering by state and pri
vate enterprises is also included. The shipping enterprises, in general, also perform other supporting activities such as hand.ling, loading, unloading, storage and werehousing, docking, but these activities are excluded from this sector and transferred to the relevant sector.
Source of data and method of estimation: The indicators which were used in estimating the output of this sector were the total
,a.mount of freight, the number 9f passengers transported and the average revenue per unit of cargo and per pas.5enger. The total quantity of cargo was obtained from export, import and interinsular trade statistics compiled by 'the CBS. The quantity was estimated separately as dry cargo (including logs), liquid cargo, or oil tankers.
Data on average output per ton of dry cargo transport by ocean-going shipping was obtained from PN. Jakarta Lloyd, and that for interinsular shipping from PN. PELNI. Information on average revenue per ton of oil transportation by ocean going tankers and that for interinsular shipping was based on figures obtained from PN. PERTAMINA. The number of passengers and average revenue per passenger were both obtained from the Directorate of Sea Transportation and PN. PELNI. The gros.5 output of this sector was the total of the outputs of each type of shipping. The input structure was obtained based on the special survey conducted for that purpose.
7-150. Inland Water Transport
Scope and definition: This sector includes the operation of motorized and non-motorized boats in rivers and
lakes. The activities of this sector cover both freight and passenger transport activities. River and lake transport activi'ties are prevalent in Kalimantan and some provinces of Sumatera.
Sources of data and method of estimation: The indicators used to estimate the output of this sector were the total number of boat calls
at the different river and lake harbors and the average revenue per call. Source of data for the
-110-
l l l 7 l 7 7 l 7 l 7 7 7 7 7 7 7 7 7

total number of boat calls was 'Inland Water Transport in Indonesia (Angkutan Sungai dan Danau di Indonesia)' published by the ·oirectorate of Transport (Directorat Latu Lintas dan Angkutan Sungai, Danau dan Ferry) . The available information was for I 972 and I 973, and the 1971 figure was estimated based on the increase in the total number of boats in Kalimantan. The average revenue per call was obtained from the river transport survey conducted in West Kalimantan for the calculatipn of regional income. The figure collected was for 1973 and was the average output per boat per year. This was multiplied by the total number of boats and then divided by the total number of boat calls. To extrapolate the average revenue in 1971• from that in 1973, the consumer price index of transportation was used. The gross output of this sector was obtained by m~ltiplying the total number of boat calls by the average revenue per boat call.
The input structure for this sector was obtained in a way similar to that used in the shipping sector.
7-151. Port Services
Scope and definition: This sector includes rendering services for ships through the provision of port facilities such
as anchoring, piering, floating, pilotage, fresh water supply, and embarkation and disembarkation arrangements for passengers.
Other activities such as loading and unloading, storage and warehousing, docking, etc., are covered under the other relevant sectors.
Sources of data and method of estimation: The indicators used in the estimation of the output of this sector were the number of
vessels by tonnage size which called at. all ports throughout Indonesia, the total supply of fresh water, the number of embarkations and disembarkations of passengers, and the amount of fees collected for each of the services rendered.
Information on the number and tonnage of vessels which called at ports throughout Indonesia was obtained from the 'Monthly Reports of the Port Administration Tanjung Priok (Badan Pengusahaan Pelabuhan Tanjung Priok) ' . Information on the total supply of fresh water, the number of embarkations and disembarkations of passengers, and the tariff from each of the services rendered was obtained from the PN. PELNI.
The gross output of this sector is the total of the outputs of the different types of activities. The input structure was obtained based on the Special Transport Survey (STS).
7-152. Air Transport
Scope and definition: This sector includes freight and passenger transport by aircraft, including the chartering of
aircraft. Most of these activities are by government . enterprises with very few air transport activities carried out by ·private enterprises. Supporting activities, such as loading and unloading, expediting, storage and warehousing, etc., are also covered in this sector because of the difficulty of their separation, especially for the input structure.
Source of data and method of estimation: The indicators which were used to estimate the output of this sector are the production
indicator of airline and airport services and the average revenue per unit of each production. The production indicator of airline services consists of the number of passenger-km, the number of ton-km of freight and the number of ton-km of parcels; the production indicator of airport services consists of the number of aircraft departures, arrivals, the number of passenger departures, arrivals, and transits, and the amount of freight loaded and unloaded for all airports throughout Indonesia.
The data on 'production was taken from the air transport statistics published by the CBS. Data on the average revenue per unit of production was obtained from, the reports of PN. GIA
-111-

......
and PN. MNA for airline activity and from the report of PN. Angkasa Pura, for airport activity. The gross output of this sector was the total output from all the activities, including the output of supporting activities.
7-153. Services Allied to Transport
Scope and definition: This sector includes the activities of delivery agencies, expedition and travel bureaus. The
agencies and expeditions that are covered in this sector are only those serving shipping. Activities which serve the other forms of freight transport are not covered in this sector due to the non-availability of information. The travel bureau activities covered here include those support of passenger transport by railways, intercity buses, shipping and airlines.
Source of data and method of estimation: The indicators which were used to estimate the outp,ut of agencies and expeditions are:
(1) The amount of dry cargo loaded and unload'ed in the different ports throughout Indonesia under the assumption that all of these were served by agency and expediter activities.
(2) The average output per ton of freight for each of the activities. The amount of dry cargo loaded and unloaded in each port throughout Indonesia was taken
from export, import and interinsular trade statistics published by the CBS. Information on the average output per ton o( freight for agency and expediter activities was obtained from the 'Data Series of PELNI (Serie Data-data Komersil Cabangcabang PELNI)' published by PN. PELNI.
The gross output of agency and expediter activities was calculated by multiplying the quantity of freight by the average output per ton.
The procedure used to estimate the output of the travel bureaus was based on a certain percentage of each output of passenger transportation by railways, intercity · buses, shipping and airlines. ·
The gross outpuf of the sector was_ the total of the outputs of the· component activities. The ·,input structure of this sector was obtained based on the special survey ' conducted for that pur
pose.
7-154. Loading, Unloading, Storage and Warehousing -
Scope and definition: This sector includes loading, unloading, storage and warehousing in support of transporta
tion. Loading, unloading, storage and warehousing activities in harbors only are covered in this sector. Activities in support of land transport and air transport were covered in those sectors because of the difficulty in separating the required information. ·
Source of data and melhod-of estimation: . The indicators which were used to estimate the output of this-. sector are:
(1) The amount of dry cargo loaded and unloaded in the different ports throughout Indonesia.
(2) The average revenue per ton of goods handled -for each of" the activities. Data on the quantity of dry cargo loaded and unloaded in the different ports throughout
Indonesia was obtained from the export, import, and interinsular trade statistics published by the CBS. Information on the average revenue per ton of goods handled for each of the activities was obtained from PN. PELNI. '.
The gross output of this sector was the total of the outputs of each· activity. This was calcul.ated by multiplying the quantity of goods handled by the average revenue · per ton. The input .structure of this sector was obta.'ined based on the special survey conducted for ' this·' purpose. ·• .. .· , • • • • ' · j '.
-112-
l l l l 7 7 7 7 l l 7 l 7 7 7 7 7 7 7

7-155. Communication
Scope and definition: The communication sector covers all postal and telecommunication services rendered to the
public whether by telephone, telegraph, radio telephone or telex, excluding radio and television broadcasting.
The output of the postal services is the revenue from handling mail and parcels, and the income from postal saving services.
The value of the parcels handled is not included in the output of this sector in the same manner that the value of commodities sold by traders is not included in the output of the trade sectors.
The output of the telecommunication services is the revenue estimated from the total minutes of local and interlocal telephone calls, the number of words having telegraph service, minutes of telex time, etc. The revenue received from advertisements by the post office, receipts from the renting of buildings or roorris or from other activities are excluded from the coverage of this sector.
Source of data and method of estimation: The indicators, which were used in the output estimation for this sector were obtained from
the monthly reports of PN. POS dan GIRO (Post and Saving State Enterprise) as well as those of Perusahaan Umum Telekomunikasi (Telecommunication State Enterprise). The profit and loss accounts of those Enterprises were also obtained from the Directorate General of Post and Telecommunication. The input structure of this sector was obtained from these profit and loss accounts.
-113-
I ,.

9. FINANCING, REAL ESTATE, AND BUSINESS SERVICES (Input-Output Codes: 8-156 to 8-160)
This division covers activities of banking and other financial institutions, insurance, real estate and business services.
8-156. Banking and Other Financial Institutions
Scope and definition: The banking and financial institution sector covers all activities of monetary institutions and
other financial institutions and services. Included are the central bank, commercial banks, development banks, savings banks, rural banks, pawnshops, credit cooperatives and foreign exchange dealers.
A financial institution can be a bank or a non-bank. At the present time banks play a larger role than other financial institutions in Indonesia. Hence, stress has been placed on banks in the later descriptions of this sector.
The main operations of the financial institutions are to give credit and to render services in financial transactions and money supply. The functions provided by the banking system as a whole can be summarized as follows:
(1) Deposit and credit services: (a) Accept deposits into current accounts, time deposits and savings deposits and
issue medium and long term securities. (b) Extend short-term and medium-term loans and invest in securities. (c) Participate in the share capital of enterpreises.
(2) Money supply and financial transactions: (a) Issue bank notes and coins, transfer money, maintain current accounts, and
collect debts. (b) Discount, buy and sell securities. (c) Buy credit guarantees. (d) Issue bank guarantees. (e) Rent vaults for storage of valuables.
Source of data and method of estimation: For the financial activities mentioned in (1) above, the output is defined as the revenue
from those services. Since the service charge is not taken directly from the depositors and borrowers, the revenue from this service is defined as the difference between the interest paid and the interest received. More strictly speaking, the calculation formula is as follows:
Service charge - l~terest and dividends received - Interest paid.
The output from the activities mentioned in (2) above is the total commission, including profit from foreign exchange transactions.
Therefore, the output of the financial sector is the total of the service charges and commissions.
The source of data used to calculate the output and input structure is the reports of the state and private banks, and the data was compiled by Bank Indonesia.
8-157. Life lnsura.nce
Scope and definition: Life insurance is defined as the activities of life insurance and related services. The gross output of this sector is equal to the income from lifo insurance services, including
income from investments.
-114-
~ 7 7 7
' 7 ~
\: . ~'
- 7 ,(.: •;, ,r',f.
<~, -·i. /,-. ·;:.:
7 ··t .... :J~ ·.t ·+ 7 -~ a; .. ~ "" .':~ t~
7 ~J .. ,f
'-:i •.i;._.
7 l , ·-
.. 7 7 7 7 7 7 7 7 7 7
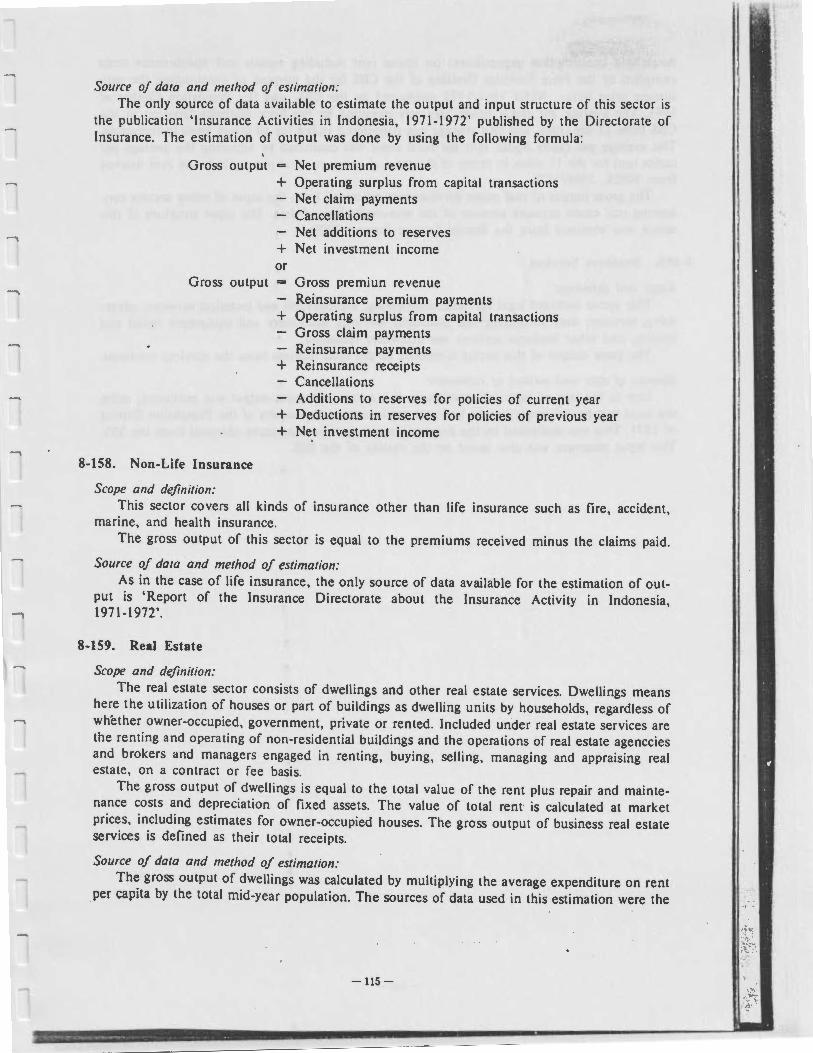
....., Source of data and method of estimation:
The only source of data available to estimate the output and input structure of this sector is the publication 'Insurance Activities in Indonesia, 1971-1972' published by the Directorate of Insurance. The estimation of output was done by using the following formula:
Gross output Net premium revenue
Gross output
8-158. Non-Life Insurance
Scope and definition:
+ Operating surplus from capital transactions Net claim payments
+ or
+
+
+ +
Cancellations Net additions to reserves Net investment income
Gross premiun revenue Reinsurance premium payments Operating surplus from capital transactions Gross claim payments Reinsurance payments Reinsurance receipts Cancellations Additions to reserves for policies of current year Deductions in reserves for policies of previous year Net investment income
This sector covers all kinds of insurance other than life insurance such as fire, accident, marine, and health insurance.
The gross output of this sector is equal to the premiums received minus the claims paid.
Source of data and method of estimation: As in the case of life insurance, the only source of data available for the estimation of out
put is 'Report of the Insurance Directorate about the Insurance Activity in Indonesia, 1971-1972'.
8-159. Real Estate
Scope and definition: The real estate sector consists of dwellings and other real estate services. Dwellings means
here the utilization of houses or part of buildings as dwelling units by households, regardless of whether owner-occupied, government, private or rented. Included under real estate services are the renting and operating of non-residential buildings and the operations of real estate agenccies and brokers and managers engaged in renting, buying, selling, managing and appraising real estate, on a contract or fee basis.
The gross output of dwellings is equal to the total value of the rent plus repair and maintenance costs and depreciation of fixed assets. The value of total rent· is calculated at market prices, including estimates for owner-occupied houses. The gross output of business real estate services is defined as their total receipts.
Source of data and method of estimation: The gross output of dwellings was calculated by multiplying the average expenditure on rent
per capita by the total mid-year population. The sources of data used in this estimation were the
-ll5-

...._
household consumption expenditures on house rent including repairs and maintenance costs compiled by the Price Statistics Division of the CBS for the purpose of constructing the consumers price index, NSES 1969/1970 conducted by the CBS, and the Population Census of 1971. The average per capita house rent was compiled by the Price Statistics Division of the CBS from 11 big cities, and this average was considered valied for all urban areas in Indonesia. The average per capita .house rent for rural areas was estimated by adjusting the average per capita rent for the 11 cities in terms of the ratio of urban to rural per capita house rent derived from NSES, 1969/1970.
The gross output of real estate services was estimated from the input of other sectors consuming real estate services because of the non-availability of data. The input structure of this sector was obtained from the Special Service Survey (SSS).
8-160. Business Services
Scope and definition: This sector included legal services; engineering, architectural and technical services; adver
tising services; data processing and tabulating services; machinery and equipment rental and leasing; and other business services not elsewhere classified.
The gross output of this sector is defined as the total receipts from the services rendered.
Sources of data and method of estimation: Due to the lack of basic information on this sector, the gross output was estimated, using
the total number . of employees in business services from the results of the Population Census of 1971. This was multiplied by the average gross output per employee obtained from the SSS. The input structure was also based on the results of the SSS.
-116-
7
I
7 l 7 7 7 l 7 7 7 7 7
7 7 7 7 7 7

....,
-,
10. SER VICES (Input-Output Codes: 9-161 to 9-174)
These sectors cover services for sale by private individuals, government and private institutions. According to the nature and the purpose of the activities, these may be classified into 3 groups:
(1) Social and community services, covering social services rendered to the public such as education, health, public security, and defense.
(2) Entertainment and cultural services, covering services to private households and the public, such as those of movie houses, theaters, recreactional parks, and gardens.
(3) Personal and household services, covering services for personal and household needs, such as those of barbers, laundries, and tailors.
In the present tabfe, these services are classified into 14 sectors as explained below.
9-161. Public Administration and Defense
Scope and definition: This sector covers all units of government (central and local) engaged in public administra
tion and defense, including the armed forces and police. The gross output of this sector is equal to the gross value added, which consists of the com
pensation of employees in cash and in kind, and depreciation of fixed assets.
Source of data and method of estimation: The information regarding the compensation of employees was derived from the figure of
the routine and development expenditures supplied by the Ministry of Finance. The compensation of employees in government schools, research institutions and hospitals were excluded from this sector as these activities were included in sectors 163, 164 and 165, respectively. The depreciation of fixed assets was estimated as 5% of the total compensation of employees.
9-162. Sanitary and Similar Services
Scope and definition: This sector covers services such as garbage and sewage disposal; the operation of a drainage
system; chimney, window and office cleaniing; exterminating, fumigating and disinfecting; and similar services. These kinds of services in Indonesia are generally provided by the government, especially the local government.
The gross output of this sector is equal to the total expenditure for these services.
Source of data and method of estimation: Due .to a lack of data and because these services usually exist in big cities, the calculated
estimates cover only the capital cities of the provinces and were based on the receipts and expenditures of the Jakarta metropolitan government.
Total output was obtained by multiplying the average per capita expenditure for these services of Jakarta by the total population of all the capital cities in Indonesia.
9-163. Educational Services
Scope and definition: This sector covers all levels of public and private educational institutions such as kindergar
tens, elementary schools, secondary schools, high schools, colleges, and universities. All government educational institutions are included here and excluded from the government sector. Educational activities such as on-the-job training and other short-term special courses oper-
-117-

ated by the government for their own personnel were excluded from this sector and included under the government sector. Private.profit-making educational establishments such as typing and driving schools, are not covered here due to the absence of adequate information.
The gross output of educational services was defined as the total cost of producing the services, i.e., the outlays on the intermediate consumption of goods and services, compensation of employees, the depreciation of fixed assets, and the payment of indirect taxes.
Source of data and method of estimation: The gross output of educational services was estimated by multiplying the aveerage gross
expenditure per student by the total number of students. The data of average gross expenditure per student was obtained from the mannual inquiries which the Ministry of Education and Culture collected from private and public educational institutions. Information on the total number of students was available from the CBS publication.
The input structure used was based on data collected through the SSS.
9-164. Research and Scientific Institutes
Scope and definition: Included in this sector are all public and private institutions primarily engaged in basic ano
general research in social and cultural fields and natural sciences.
Source of data and method of estimation: Most of the research activities in Indonesia at the present time are undertaken by the
government. Hence the gross output and the details of the input structure were estimated on the basis of the actual government expenditure on research.
9-165. Medical and Other Health Services
Scope and definition: This sector covers all kinds of medical and health services rendered to the public through
institutions such as general hospitals, maternity hospitals, and child welfare clinics; as well as those by medical practitioners, and midwives, working on own-account.
Excluded are clinics and medical units operating under the auspices of private or government offices exclusively for their own employees. The gross output of general hospitals and maternity hospitals is defined as the total cost of producing the services, while the gross output of medical practitioners and midwives working on own-account is equal to their receipts.
Source of data and method of estimation: Due to the limited data available, the estimates of gross output of general hospitals and
maternity hospitals were calculated by multiplying average gross output per bed by the total number of beds. For medical practitioners and midwives working on own-account, average gross outputs per doctor and midwife were multiplied by the total number of doctors and midwives, respectively. The total number of beds, doctors, and midwives were obtained from the 'Social Indicators' published by the CBS. The average gross output per bed, doctor, and midwife, as well as the input structure, were obtained from the SSS.
9-166. Business, Professional and Labor Associations
Included here are trade and industry associations, professional associations, sports associations etc. Due .to the lack of data, the gross output was estimated indirectly through the input of the other sectors.
-118-
l l l 7 7 l 7 l 7 l 7 7 7 7 7 7 7 7 7

-, 9-167. Other Social and Related Community Services
Scope and definition: This sector covers social institutions such as the Red Cross, religious organizations,
orphanages, institutions for handicapped childredn, and homes for the aged. The gross output of this sector is equal to the total cost of producing the services.
Source of data and method of estimation: From the SSS, information on the average expenditure per institution and the input struc
ture was obtained. The gross output was estimated by multiplying the average expenditure per institution by · the· 'fofaf' number of insti'tutions (Source:· CBS)':~. . .
I
9-168. Motion Picture Production and Distribution
Scope and definition: This sector·covers motion picture production . The gross output of the motion picture estab
lishments is equal to the total receipts from the sale or rental of the motion pictures produced . . Source of data and method of estimation:
The data of the input structure and the average cost per film produced were obtained from the SSS. The average gross output per motion picture was considered to be equal to the total direct cost plus profit and administration costs; estimated at around 20% of the total cost.
The gross output of motion picture production was calculated by multiplying the total number of films produced during the year by the average gross output per film. The data of the total number of films produced was obtained from the Directorate of Radio, Film and Televisionn, Ministry of Information.
9-169. Theaters and Movie Houses
Scope and definition: This sector covers theaters, movie houses, and other entertainment services. The gross out
put is defined as the total receipt from sales of tickets.
Source of data and method of estimation: The gross output of this sector was estimated on the basis of total entertainment taxes col
lected by the local government in Indonesia. Data on the entertainment taxes was obtained from the 'Local Government Financial Statistics' compiled by the CBS. In the Jakarta region, entertainment tax represents 20% of the ticket price. The gross output of this sector was calculated on the assumption that this percentage is also valid for the whole of Indonesia. The input structure was based on the SSS.
9-170. Radio, Television and Related Services
· Scope and definition: Due to the restricted coverage of available data, this sector is considered to cover only
government and private radio studios. For government radio studios, the gross output is equal to the total expenditures in produc
ing these services, while for private radio studios it is equal to the total receipts.
Source of data and method of estimation: The gross output was calculated by multiplying the average gross output per studio by the
total number of studios which was obtained from the Ministry of Information. The average gross output per studio and the input structure were collected through the SSS.
-119-

9-171. Libraries, Museums and Other Cultural Services
Scope and definition: This sector includes libraries, museums, zoological gardens, botanical gardens, sport halls
and swimming pools. 1he gross output is equal to the total receipts.
Source of data and method of estimation: The gross output and the input structure per establishment, or per visitor for libraries, were
obtained from the SSS. To estimate the total gross output, the average output per establishment was multiplied by the total number of museums, sports halls, swimming pools, zoos and botanical gardens; while for libraries the total number of visitors was multiplied by the average gross output per visitor. Data on the numbers above were based on the data compiled by the CBS.
9-172. Other Recreational Services
Scope and definition: Included here are night clubs and other recreational places. The gross output of this sector_
is defined as the total receipts.
Source of data and method of estimation: Due to the inadequacy of data, an approximate gross output of this sector was estimated
based on the total number of employees multiplied by the average gross output per employee. The total number of employees in this sector was derived from the 1971 Population Census. The average output per employee and the input structure were obtained from the SSS.
9-173. Repair Services, not elsewhere classified
Scope and definition: lncludedd in this sector are the repairs of household appliances and equipment such as the
repairs of radios, refrigerators, typewriters and sewing machines; the repairs of footwear and other leather goods; and other repairs not elsewhere classified. The gross output .of this sector is equal to the total receipts from services rendered. · ·
Source of data and method of estimation: . . _,. The ,gross output is estimated by multiplying the total number of employees in this sector
by the ~verage gross output per employee. The total number of empioyees in . this sector was , b~ed on •the 1971 Population Census, while the average gross output per employee and the .input structure. were obtained from the S_SS. . . . . . -·
9-174. Personal Services
Scope and definition: This sector covers mechanical or hand laundries, cleaning and dyeing plants; domestic ser
vices such as those rendered by maids, cooks, baby sitters, gardeners ancl c.aretakers; barbers and beauty. shops; photographic studios; tailors and dress makers; ~assage. parlours; and cemetery upkeep and all other personal services not elsewhere classified. The gross output . of this
. sector is equal to the total receipts from services rendered.
Source of data and method of estimation: The gross output of personal services except that for domestic service was calculated by
multiplying tbe total number of person engaged by the average gross output· per person. For domestic. services, the gross output was obtained by multiplying the .av.erage per capita house-hold expenditure on domestic services by the total population. · ·. ·. . '. . . .
The estimate of the total number of persons engaged in re~dering person~l . s~~vices was derived from the 1971 Population Census. The average output per person engaged and the
-120-
7
l 7 7 1 7 7 7 7 7 7 7 l 7 7 7

......,
input structure were obtained from the SSS. For domestic service, the average per capita expenditure was based on the data collected for
the purpose of constructing consumer price indices in 11 cities, as well as from NSES 1969/1970 by the CBS.
10-175. Unspecified and ProYlslonal Sector
This sector is considered as the sector that covers all activities and commodities not belonging to any particular sector. This sector plays an important role in the adjustment of discrepancies between input and output.
10-176. Scrap and Waste
This·sector is treated as the dummy sector which will be eliminated through the distribution of entries to other sectors. The method adopted for this •distribution is the negative input method as described in Chapter 2. :
, \
-121-
i I I .
' I
·, I ,._
,.

t
' . ' -( , ¼ 1
i .
I f I
11. VALUE ADDED, FINAL DEMAND, IMPORT, TRADE AND TRANSPORT (Input-Output Codes: 201 to 204, 301 to 305, 401 to 403, 501 to 503)
201. Wages and Salaries
Code 201 is the row for the wages and salaries of each sector as defined in Chapter 2.
202. Operating Surplus
Code 202 is the row for the operating surplus of each sector as defined in Chapter 2.
203. Depreciation
Depreciation has been defined in Chapter 2. Generallly, the depreciation in each sector is estimated on the basis of the results from the special surveys conducted for the purpose of the input-output oompilation. For manufacturing, electricity and gas and water supply, estimates were based on information available at the CBS.
204. Indirect Taxes, Net
As defined in Chapter 2, net indirect truces are indirect truces minus subsidies. But since data on subsidies for the sectors are not available except for electricity, gas and water supply, this was not taken into account. The control total of indirect truces was obtained from the Financial Report of the Ministry of Finance.
301. Private Consumption Expenditures
Scope and definition: The soope and definition has· been -presented in Chapter 2.
Source of data and method of estimation:
The sources of the data used in this estimation are the Household Consumption Expenditure Survey (NSES) and the Cost of Living Survey (CLS), both conducted by the CBS. It should be noted that the CLS was conducted only in 11 big cities (Medan, Palembang, Jakarta, Bandung, Yogyakarta, Surabaya, Pontianak, Banjarmasin, Menndo, Ujungpandang and Denpasar), while the NSES oovered both urban and rural areas of Indonesia.
Further, the CLS had the tendency to select households in the middle income group, while the NSES covered households at all income levels. Therefore, the NSES was used for estimat-ing the household consumption expenditures. .
The NSES results rover Java and regions outside Java only for 1969/1970. To obtain the household consumption expenditure for 1971, the consumer price index from the CBS was used.
The method adopted was as follows:
Qitl Pitl Citl .., Cito X ~ X P:L
'-lilo I 0
where: Citl - The value of per capita household consumption expenditure of commodity i, ' 1971.
Cito The value of per capita household consumption expenditure of cpmmodity i, 1969/1970. .
Qitl - The quantity of per capita consumption of commodity i, 1971. Qito - The quantity of per capita oonsumption of commodity i, 1969/1970 .
-122-
7 l
7 7 1 7 7 7 7 7 7 7 l 7 7 7 7 7 7

-;
Pit1 The price per unit of commodity i, 1971 . Pito -= The price per unit of commodity i, 1969/1970.
The 1969/1970 NSES represents consumption during October-December 1969 and JanuaryApril 1970 only. Hence, the price data which ~as used here is related to those periods.
Since Qit1 was not avl\ilable ay all, this was estimated from quantities of consumption in 1969/1970 based on the rate of incrase in per capita consumption from 1965 to 1969/1970 (NSES). For the commodities which were not covered in the 1965 NSES, the estimation was based on the increase from 1969/1970.
The NSES results used in this estimation are detailed by type of commodity divided into food and non-food groups. The food group consists of cereals and cereal products, roots and root products, fish, meat, eggs, milk, vegetables, fruits, nuts, prepared foods, beveragges and tobacco. The non-food group consists of housing, fuel, electricity and water, clothing, footwear and caps, durable goods, taxes, insurance, ceremonial expenses and other goods and services.
The above method of estimation was adopted for the food group only. For the non-food group, consumption quantities were assumed as constant:
The household consumption expenditure estimated on the basis of the NSES and CLS results was subsequently adjusted.
302. Government Consumption E~penditures
Scope and definition: The scope of the general government consumption expenditures has been defined in
Chapter 2.
Source of data and method of estimation: The data used in estimating the central government expenditure was supplied by the Budget
Directorate, Ministry of Finance. To this, an amoutn of 8. 7% of the actual Development Expenditure, regarded as current expenditure, was added. This percentage was derived from a special study of the Development Budget for 1971/1972. From the government routine expenditures, purchases of inventory like office machinery and other functional equipment which are regarded as capital formation were excluded and included in the sector of capital formation (303).
The local government consumption expenditure, due to a lack of data, was calculated on the basis of the average consumption per employee of the central government multiplied by the total number of local government employees obtained from the Ministry of Interior. The expenditure on the purchase of materials was estimated on the basis of the same ratio as the central government purchases of materials to the total consumption.
The classification of the total government consumption expenditure according to the InputOutput Classification was based on the ·detailed itemised information derived from the routine budget of the central government.
303. Gross Fixed Capital Formation
Scope and definition: Gross fixed capital formation is defined as the value of new capital goods or second-hand
capital goods imported from other countries, minus the net sales of similar second-hand goods. Capital goods are goods having a lifetime of a year or more and are not used for consumption purposes. Based on this method of estimation, gross fixed capital formation was considered under the two broad categories of (1) construction and (2) machinery and equipment.
-123-

f I :,
-i
I
(1) Construction Gross fixed capital formation in the construction sector is the value of new construction,
extensions, alterations and capital repairs of residential buildings and non-residential buildings; public works in the agricultural sector; public works on roads and bridges; construction of electric plants; and other construction such as that of harbor facilities, airport facilities, railroads, sewers, telephone and telegraph facilities, radio and television transmission towers and stations, and crude oil pipe lines.
(2) Machinery and equipment _ Gross fixed capital formation in machinery and equipment is defined as the value of new
capital good (or second-hand capital goods imported from other countries) such as transportation equipment, agricultural machinery and equipment, and other industrial machinery and equipment, including outlays on replacement, alteration and capital repairs. Dealer's margins and other transfer costs in the purchase and sale of second-hand capital goods are also included. Classified in this category are the net increases in breeding stock, dairy cattle, draught animals and the like.
Source of data and method of estimation:
(I) Construction The source of data and method of estimation of the control total for construction has been
explained under the construction sector. The gross output of construction except current repair was allocated to the fixed capital for
mation.
(2) Machinery and equipment The method of estimation .of the gross fixed capital formation in machinery and equipment
was based on a commodity flow approach covering both values of imported and domestically produced machinery and equipment. Outlays on machinery for offshore oil drilling are also included here (source: PERTAMINA). The value of imported machinery and equipment was derived from import statistics (CBS). Sales tax, import duties and other taxes for each kind of
· commodity were -added to ·the C.I.F. value in rupiahs. The value of machinery and equipment · which were·· produced domestically was based -on the IS-197\-CBS. The ·trade margins and transport costs were obtained through STS.
304. · Change in Inventories
Scope ·and definition: The scope: and definitio11 of change in inventories has been described in Chapter 2.
Source of data and method of estimation: The data on change in inventories was estimated during tlle process of reconciliation, i.e.,
the balancing between output allocation and its control total. It should be noted that these · result:5 cannot be used for analytical purposes.
305. Exports (F .O.B.)
Scope and definition: The general scope and definition of exports have been described in Chapter 2.
Source of data ,and method of estimation: The estimates on goods exported were based on the'"' foreign trade statistics compiled by the
,'. CBS. Since_ the data on services obtained from the balance of payments are on a net basis with a negative. sign,_ all. of _ these_ services .are regarded as · imports. · ' ·
On the other hand; the transport services undertaken by lndcinesian 'cairiers were added to
-124-
7
7 7 I
l 7 7 7 7 7 7 7 7 l 7 7 7 7 7 7

exports. The estimates of the transport services were based on the output of national ocean shipping.
401. Imports (C.I.F.)
Scope and definition: As in the case of exports, imports include imports of merchandise as well as services.
Source of data and method of estimation: The import of merchandise was valued at C.I.F., while the import of services was based on
information contained in the balance of payments, which is stated on a net basis, i.e., after deducting exports.
In this Input-Output Table, import figures have been adjusted by the amount of direct import of machinery for the purpose of offshore operations by Pertamina oil company and also the direct import of rice by the Board of Logistics, which were not covered in the import statistics compiled by the CBS. Rice directly imported by the Board of Logistics was valued at the wholesale price.
509. Trade Margins and Transport Costs ·
Scope and definition: The treatment of the commerce sector has been discussed in general in Chapter 2. Here,
the specialized concepts and definitions adopted in this 1971 Input-Output Table are explained. The definition decided on was: the output of commerce is the trade margin obtained from the trading activities of commodities (domestically produced or imported) by traders.
In the 1971 input-Output Table, trade margins and transport costs are coded as follows: (1) 501 Wholesale Trade Margin .......................... . ... (W) (2) 502 Retail Trade Margin . .. .. . .. .. .. .. .. . .. .. . .. .. .. . .. .. .. (R) (3) 503 Transport Costs . . . . . . . . . . . . . . . . . . . . . . . . . . . . . . . . . . . . . . . (T)
The chart below is presented to a better understanding of this concept.
I I 1 Producers r
3 ( ) 5 03
I (2)503
1) 503 1 ~
(7) 501+503 ,I Non-household I I I consumers
(5) . (6) 501+503
501+503
(4) 503 ) l (8) 501+503 I W.II I
'-
(~)501+503
(IO) 502+503 IR ·1 I j Household f -1 eta1 er 1
According to the definitions used for the 1971 Input-Output Table, the wholesale channel is the channel from Wholesaler I (W.I) or Wholesaler II (W.11) to the retailer or to the nonhousehold consumers. The activity of the trader who serves households are considered retail activity. In the case of Wholesaler I selling directly to households, this is considered retail trade. On the other hand, the retail sales to intermediate sectors such as manufacturers, hotels, and restaurants, are considered wholesale trade. These assumptions had to be made for convenience in calculation. As a consequence of the definition of the activity of producers, their sales to wholesalers or to retailers or directly to consumers (household or non-household) are assumed
-125-

J
not to be contributing to the trade margin. If numbers are assigned to the channels in the above chart:
In Channels (1), (2), (3) and (4), only transport costs are relevant (503). In Channels (5), (6), (7), (8) and (9), both wholesale trade margins and transport costs are relevant (501+503). In Channel (l0) the retail trade margins and transport costs are relevant (502 + 503). Output of wholesale trade ... Total of 501 Output of retail trade -= Total of 502 Output of transport (parts) - Total of 503
Source of data and method of estimation: In the input-output.table at purchaser's ps;ices, trade margins and transport costs are entered
on the right side of the table in the column sectors 501, 502, and 503 with a negative sign against the appropriate row sector, say Sector i. Then the equation is as follows:
Xi - Ix--• + IF-k • - (M- + W- + R- + T-1) j U k I I I I I
(i = 1, 2, ... n; j = 1, 2, ... n; · k - 301 ... 305; l - 5031 ... 5039)
where x/ Intermediate demand from i to j at purchaser's price Fik • = Final. demand from i to k at purchaser's price Xi -= Gross output of sector i at producer's price Mi Import of i at landed cost Wi == Wholesale trade margin on i Ri Retail trade margin on i Til - Transport cost by transport sector on i.
Concerning each intermediate demand, the relationship between the producer's value and purchaser's value is as follows:
and Xij = x/ .:.... (Wij + Rij + Tui> ..
Fik - Fik. - . (Wik + Rik + Tiki)
where xu = Intermediate demand from i to j at producer's prices Fik = Final demand from i to k at _producer's prices.
Then the following estimation formula can be used:
where Ei -
~-- W- X --.--------' ~xu• + fFik• +Mi+ Ei
J
export of i at F.0.8. prices
Wholesale trade margin of commodities used in final demand:
Wholesale trade margin of C~?1ffi<>dities imported:
M-- W-X I
' Ixij• ;+ IF. .. ~ + M1- .+, E1- . , j . . k ... . ,
-126-
7 !
7 l l 7 7 7 7 7 l 7 7 7 7 7 7 7 7

Wholesale trade margin of commodities exported:
Ei Wi X ----------
Ix/+ IFik• +Mi+ E; j k
Retail trade margin of commodities used in final demand:
Rix----IFik• + M; k
Retail trade margin of commodities imported:
Mi Ri X -----'---IFk • + M-k I I •
Transport cost of commodities used in intermediate sector:
Tiil - Tux fx/ + tFik• +Mi+ Ei
Transport cost of commodities used in final demand sector:
Fik. T;kl· ... Til X ----------
fjc/ + ~Fik• +Mi+ Ei
Transport cost of commodities imported:
Mi -= T-1 X ----------
' Ix--• + IF • + M-, + E,-. I) k 1k J •
Transport cost of commodities exported:
Ei - Til X ---------fx/ + fFik• +Mi+ Ei
Summary Table of Trade Margins and Transport Costs
Code 501 502 5031 5032 5033 5034
001 002
wj R; T;, Ti• T, • T,.
174 175
Total w R T, T, T, T,
Notes: (1) W,, . R, .- T,, TTM,, W, R, T and TTM are givens.
(2) Ti/ is defined as : Ti1 = T, X ~
-127-
5035 5036
Tj I T, •
T, T,
\ '
5039 509
T, TTM,
T TTM

' . ' ,.. ' '
1. United Nations, . !.}~~5.L. - :r:· ~j\. •.
2. United _Natiqns, ... .,_ rn1t.,1'1 --,,J, t1 i \• <"
3.
4.
6. United; t:latiops, . .. -:, l :\~Q\" ~~-,"·1;(:;,\ .,
·' .- Pfn~~ tJi.J tc- : 1_; (.
/' '\ .. .,- :,,. ~ f; ·••• ;,. •••I .
7. ' ' Uni tec:11.Nafioiis; ·, ' . .:c ;_ .-:..-:.,:1 •,;- -•·~1:M, 1 . • ,
__, ;r_: r,f~ i . : ~~ ~ t·1 . r/ · . . r,rt::.\ \\JC'f,;1\·,~\ "\o :b 1- -:
8. Abraham, William I., ; ':;•!.\i_U~J ~~ "f~'\ ') C:, .
, ; ":'_mi:.\ h:v~i'Jl\l'\°i \~1-hr, -
APPENDIX C
LIST OF REFERENCES
A System of National Accounts, Studies in Methods, Series F, No.2, Rev.3, New York, 1968.
Problems of Input-Output Tables and Analysis, Studies in Methods, Series F, No.14, New York, 1966.
Input-Output Tables and Analysis, Studies in Methods, Series F, No.14, Rev.I, New York, 1973.
International Standard Industrial Classification of all Economic Activities, Statistical Papers, Series M, No.4, Rev.2, New York, 1968.
Statistical Classification, International Standard Classification of All Goods and Services (ICGS), (Draft): E/CN. 3/457, Geneva, 1974.
International Standard Classifications, International Standard Classification of All Goods and Services (ICGS), Draft, E/ CN. 3/493, New Delhi, 1976.
Classifications of Commodities by Industrial Origin (CC/0), Statistical Papers, Series M, No.43, Rev. l, New York, 1973 .
National Income and Economic Accounting, Prentice-Hall, Inc., Englewood Cliffs, New Jersey, 1969.
9. Kendrick; ; John/ ' Economic Accounts and Their Uses, Mc.Graw Hill, New
·•,!' :;;d{ ',\~itiI~\~i\\,J;, York, 1972. -- l0.,;,.;~LCQJ)~f.,,;WiW.•,1t\r,-,•. , . Input-Output Economics, Oxford University Press, New
· r~l ~-: .. --~t;; , · · York, 1966.
1 L • Leont~f,~_J',\ 'Y•ni! < :\ -! The Structure of American Economy 1919-1939, Oxford •, :-- 9➔ii~·t,Jiihz~1 1:f. -· ;,Vi University Press, New York, 1951.
12 . .. ,.Cheneryf ,H.J3~ an~:hP,G. Clark, .~: iiC' ! _; : ;i .;l ;; l Interindustry Economics, J. Wiley & Sons, Inc., New York,
.U1iik~ l-' -~?,.: ,· ;,:;:-'(,(r,.. . ., 1959. 13, ))~.¥~,•ti ~~.J?,\1:!~n"~Jllcl Marvin Hoffenberg, , -): ,;,i(.\;~i:H- ;. f< Y1.,, .. 1f!,mi.·. : _ The lnte:industry Relations Study for 1947, The Review of
· Economics and Statistics, Vol. XXXIV (2), May 1952.
Input-Output and National Accounts, OEEC, Paris, June 1961.
The Elements of Input-Output Analysis, Random House, Inc., New York, 1965.
Input-Output Table and Input-Output Analysis, ESD, Bank Indonesia, Jakarta, 1973.
-129-
7 7 7 7 7 7 7 7 7 7 7 7 7 7 7
l

--,
17. Kaneko, Yukio,
18 . Yamashita, Shoichi,
On the Treatment of Imports 111 the Entry of the Input-Output Table, ESD, Bank Indonesia, Jakarta, 1973.
Elementary Mathematics for Input-Output Analysis, ESD, Bank Indonesia, Jakarta, 1973.
19. Institute of Developing Economies, Detailed Programme of 1970 input-Output Table of Japan, Tokyo, 1974.
20. Institute of Developing Economies,
21. Government of Japan,
International Input-Output Table Japan-Korea 1970, Tokyo, 1975.
1970 Input-Output Tables, Explanatory Report , Tokyo, 1974.
22. LEKNAS-KYODAI, Input-Output Table of Indonesia, 1969 Inter-Industrial Transactions Studies, Kyoto, 1973.
23 . Central Bureau of Statistics, Statistical Pocketbook, Indonesia, 1974/1975, Jakarta, December 1975.
24. Central Bureau of Statistics, E:conomic Indicators, Monthly Statistical Bulletin, Various Issues, Jakarta.
25 . Central Burea of Statistics, Cost of Living Survey, 1968-1969 & 1970-1971, (covering 11 large cities in Indonesia), Jakarta, 1973.
26. Central Burea_u of Statistics, Population of Indonesia, 1971 Population Census, Jakarta, - 1975.
27. Central Bureau f Statistics, Production of Principal Foodstuffs in Indonesia 1971, Jakarta, 1972.
28 . Central Bureau of Statistics, Survey of Agriculture, January-April 1972, Jakarta, 1974.
29. Central Bureau of Statistics, Production of Food Crops in Java & Madura 1972, Jakarta.
30. Central Bureau of Statistics, Planted Area, Production and Stock of Principal Estate Crops, Semester I 1971, Jakarta.
31 . Central Bureau of Statistics, Planted Area, Production and Stock of Principal Estate Crops, Semester II 1971, Jakarta.
32. Central Bureau of Statistics, National Socio-Economic Survey, Fourth-Round, October 1969 - · April 1970, Household Consumption Expenditure, Jakarta, 1973. (NSES).
33. Central Bureau of Statistics, Animal Husbandry and Poultry Survey 1967, Production and · Uses of Livestock, Report No.2, Jakarta, 1969.
34. Central Bureau of Statistics, Animal Husbandry and Poultry Survey 1967, Production and Uses of Poultry, Report No.3, Jakarta, 1969.
35. Central Bureau of Statistics, Census of Agriculture 1963, Final Report, Jakarta.
36. Central Bureau of Statistics, Special Agricultural Survey, for Compilation of Input-Output Table of Indonesia, 1971, December 1974 (Unpublished). (SAS).
37. Central Bureau of Statistics, Bamboo Survey, Jakarta, March 1973 (Unpublished).
38. Central Bureau of Statistics, Regional Income-Data of Several Provinces. 1971, Several Provincial Issues.
39. Central Bureau of Statistics, Annual Minir,g Survey, Survey on Mining Establishments, 1971,' 1972 _and ,1973 (Unpublished). (AMS).
-130-

40. Central Bureau of Statistics,
41. Central Bureau of Statistics,
42. Central Bureau of Statistics,
43. Central Bureau of ~tatistics,
44. Central Bureau of Statistics,
45. Central Bureau of Statistics,
46. Central Bureau of Statistics,
4 7. Central Bureau of Statistics,
48. Central Bureau of Statistics,
49. Central Bureau of Statistics,
50. Central Bureau of Statistics,
51. Central Bureau of Statistics,
52. Central Bu·reau of Statistics,
53. Central Bureau of Statistics,
54. Central Bureau of Statistics,
55. Central Bureau -0f ~tatistics,
56. Central Bureau of Statistics,
57. Central Bureau of Statistics,
58. Central Bureau of Statistics,
Special Quarrying Survey, 1974 (Unpublished). (SQS).
Industrial Statistics 1971. Indonesia, IND/3, Jakarta, 1973 (IS-1971-CBS).
Survey on Small Scale Manufact11rin,: and Handicraft, Report 1/1971, Jakarta, 1972 (SSMH-1971-CBS).
Selected Data on 1974 Industrial Census, Jakarta, 1975 (Unpublished).
Household and Cottage Industries. SI-76-01, Jakarta, ·1976.
Data on Non-PLN Electric Establishments, Jakarta, I 976 (Unpublished).
Special Construction Survey, /974 (Unpublished). (SCS).
Special Survey for Trade Margins & Transport Costs, 1974 (Unpublished). (SIT).
Price Survey for National Income Estimation, Jakarta, 1974 (Unpublished).
Export by Commodity, Country of Destination and Port of Export, Various Issues 1970, 1971 and 1972, Jakarta.
Import by Commodity and Country of Origin, Various Issues, for 1970, 1971, 1972 and 1973, Jakarta.
/nterinsulair Trade by Commodity and Shipping, 1971, (Unpublished).
Railways Statistics, 1961-1973, Jakarta, 1975.
Vehicles and ler;gth of Road Statistics, 1974, Jakarta, 1975.
Special Survey on Road Transport, 1974, (Unpublished) . (STS).
Cargo loading and Unloading at Ports in Indonesia 1969-:-1972, Jakarta, 1974.
Special Survey on Air Transport, /971, (Unpublished).
Air Transport Statistics, Indonesia 1974, Jakarta, 1974.
Post & Telecommunication Statistics, Volume V, 1972, Jakarta, 1974.
59. Central Bureau of Statistics, Annual Survey on Post & Telecommunication, Jakarta, (Unpublished).
60. Central Burea1:1 of Statistics, Financial Statistics, 1973/1974, Jakarta, 1974.
61. Central Bureau of Statistics, local Government Finance Statistics, 1972/1973 & 1973/1974, Jakarta.
62. Central Bureau of Statistics, Special .Services Survey, I 9 74, (Unpublishedf (SSS).
63. Central Bureau of Statistics, Social Indicators, Social Statistics, Various Issues, Jakarta.
64. Ministry of Agriculture, Directorate General of Animal Husbandry, Survey Ekonomi Usaha Ternak Ayam Ras, 1971, (Economic Survey on Imported Chicken Breed, 1971), Jakarta.
65. Ministry of Agriculture, Directorate General of Agriculture, Luas Panen don Produksi Hortikultura, 1971, (Harvested Area and Production of Horticulture, 1971), Jakarta.
-131-
7 7 17
7 7 7 7 7
:7
7 7 7 l

7
66. Ministry of Agriculture, Directorate General of Forestry, Laporan Tahun Dinos 1971/1972, (Annual Report of 1971/1972), Jakarta.
67. Ministry of Agriculture, Directorate General of Fisheries, Statistik Perikanan Indonesia 1972, (Fisheries Statistics of Indonesia 1972), Jakarta, 1973.
68. Ministry of Agriculture, Directorate General of Animal Husbandry, Laporan Tahuman 1973/1974, (Annual Report 1973/1974), Jakarta.
69. Ministry of Agriculture, Directorate General of Estate, Data StatisJik Perkebunan /969:-1974, (Statistics on Estate Crops 1969-1974), Jakarta.
70. Forestry State Enterprise (PERHUTANI), StatisJik Tahun 1971, (Statistics, 1971), East Java Perhutani, March 1972.
71. Forestry State Enterprise (PERHUTANI), StatisJik Tahun 1971. (Statistics, 1971), Central Java Perhutani, 1972.
72. Bogor Institute of Agriculture (IPB), Survey Tanaman Serat Dahan Pengepak, 1967, (Survey on Fibre Crops for Packing, 1967), Jakarta, March 1968.
73. Agro-E~nomic Survey (SAE), Survey Intensifikasi Padi Sawah di Sumatera Barat, MH /970/1971 dan MK /971, (Survey on Wet Land Paddy Intensification in West Sumatera, Period of Rainy Season 1970/1971 and Ory Season 1971), Padang.
74. Agro-Economic Survey (SAE), Pendapatan Petani Padi di Beberapa Kabupaten selama Taun 1970/1971, (Paddy Farmers' Income in Several Regencies, during 1970/1971 cultivation period), Several issues, 1972.
75. Agro-Economic Survey (SAE), Laporan singkat Tentang Study Pupuk Nasional, (Brief Report on the National Fertilizer Study), Jakarta, April 1972.
76. Agro-Economic Survey (SAE), Survey Produksi dan Tataniaga Kopi dan Sayur-sayuran di Sumatera. lltara 1971, (Survey on Production and Marketing of Coffee and Vegetables in North Sum~tera, 1972), Medan, April 1972.
77. Agro-Economic Survey (SAE), Survey Produksi dan Tataniaga Karel Rakyat di Sumatera · Utara 1972, (Survey on Production and Marketing of Small-holder Rubber in North Sumatera, 1972), Medan.
78 . Agro-Economic Survey (SAE), Survey Produksi dan Tataniaga Karel Rakyat di Kabupaten Sanggau, Kalimantan Baral, (Survey on Production and Marketing of Small-holder Rubber in Kabupaten Sanggau, West Kalimantan), Pontianak, August 1972.
-132-
j
J I
l !

79. Ministry of Mining,
80. Ministry of Mining,
81. Ministry of Mining,
82. Ministry of Mining,
83. PERTAMINA,
84. PERTAMINA,
Buku Tahunan Pertambangan Indonesia . Ondonesian Min• ing Yearbook), Various issues for 1970, 1971, 1972, 1973 and 1974, Jakarta. (ARMI).
Statistik Pertambangan Indonesia, (Indonesian Mining Statistics), Various issues for 1970, 1971, 1972 and 1973, Jakarta.
Laporan Perkembangan Pertambangan Indonesia 1968-1972, (Report on Trend of Indonesian Mining 1968-1972), Jakarta, January 1973. Bohan Golian Indonesia, (Indonesian Minerals), Jakarta, 1969. Laporan Tahunan Pertamina, (Pertamina Annual Report), Various issues for 1970, 1971 and 1972, Jakarta.
Statistik Perminyakan Indonesia, Ondonesian Oil Statistics), Various issues for 1971, 1972, 1973 and 1974, Jakarta.
85. TIMAH. P.N., (Tin State Enterprise), Timah Indonesia 1973. (Indonesian Tin, 1973), Jakarta, 1973.
86. ANEKA TAMBANG, P.N., (General Mining State Enterprise), Aneka Tambang, (Various Mineral), Jakarta, 1972.
87. ANEKA TAMBANG, P.N., (General Mining State Enterprise), Aneka Tambang, (Various Mineral), Jakarta 1973.
88. Timmer, C. Peter, Choice of Technique in Rice Milling on Java, Bulletin of Indonesian Economic Studies, Vol. IX, No.2, ANU Canberra, July 1973.
89. In~titute of Developing Economies,
' 'I -· ·
Manufacturing Statistics of The Philippines 1956- J 970, Tokyo, Japan, 1974.
90:-'. PJ~.N., (Electric State Enterprise), Perhitungan Tahunan 1972, (Audit Report for 1972), Jakar
92.
ta, October 1973.
(Electric State E.nterprise), Grajik-Grafik Tahun Kerja. (Electricity Graph), Various issues for 1971, 1972 and 1973, Jakarta.
P.G.i•f· (Gas State Enterprise), Neraca Tahun Buku 19 71, (Audit Report for 1971), Jakarta, 1972.
93. P.N.K.A. (Railways State Enterprise), Laporan Tahunan 1971, (Annual Report, 1971), Bandung, 1972.
94. PELNI, P.N., (Shipping State Enterprise), Facts and Figures, Various edition for 1971, 1972 and 1973, Jakarta.
95. PELNI, P.N., (Shipping State Enterprise),
-:{_~· :.\
Masters and Agents' Guide to Ports and Terminals, 1971, Jakarta, 1971.
-133-
7 7 f
l 7 1 7 7 7 7 7 7 7 l 7 7 7 7 7
.&: .... •-;r:
. ;. ,
.:c- .

-,
.....,
-,
96. Djakarta Lloyd, P.T., (Djakarta Lloyd Ltd), Statistik 1974, Ocean Shipping, Jakarta, 1975.
97 . INSA (Indonesian Shipowners Association), Program Kerja Tahun /968 dan laporan Kegiatan Tahun 1967, (Work Programme for 1968 and Report of 1967), Jakarta.
98. Ministry of Transport, Communication and Tourism, Directorate General of Sea Transport,
Angkutan Barang Antara Pu/au di Indonesia /973, Onterisland Sea Transport in Indonesia 197 3), Jakarta.
99. Ministry of Transport, Communication and Tourism, Proyek Survey Km-Ton dan Km-Penumpang Angkutan Dorat Bus dan Truk, (Project Survey on Ton-Km and PassengerKm Road Transport for Bus and Truck), Bandung, 1975.
100. Ministry of Transport, Communication and Tourism, Directorate General of Land Transport,
Angkutan Sungai dan Danau di Indonesia, (Inland Water Transport in Indonesia), 1972, 1973, Jakarta.
101. Ministry of Transport, Communication and Tourism, Transportation in Indonesia, Various Volumes, Jakarta.
102. POS & GIRO, P.N., (Post and Saving State Enterprise),
103. Ministry ·or Finance,
Laporan Bula nan. (Monthly Report), (unpublished) .
Nota Keuangan dan RAPBN, (Financial Note · and Budget of the Government), Republic of Indonesia, Various issues for 1974/1975 - 1976/1977.
104. Ministry of Finance, Directorate of Insurance,
105. Bank Indonesia,
106. Bank Indonesia,
107. Bank Indonesia,
Statistik Perasuransian di Indonesia 1971-1972, (Insurance Statistics in Indonesia 1971-1972), Jakarta, 1973.
StatisJik Ekonomi - Keuangan Indonesia, (Indonesian Financial Statistics), Monthly Bulletin, · Various issues, Jakarta
Laporan Bulanan Neraca Rugi/laba, (Monthly Banking Reports on · Profit and Loss f:tatement), Jakarta, Various issues (urt'published).
Laporan Tahun Pembukaan 1972/1973, (Report of Fiscal Year_ 197~/1973), Jakarta, 1973;
108. BAPINDO, (Development Bank ~f ·Indonesia), laporan Tahunan 1972, (Annual Report, 1972), Jakarta, 1973.
-134-