Aruba Happy Flow; the first - biometric single token solution
Upload
khangminh22Category
view
0download
0
Graduate Theses, Dissertations, and Problem Reports
2015
Avoidance of Token-Loss by Pigeons Avoidance of Token-Loss by Pigeons
James E. Cook
Follow this and additional works at: https://researchrepository.wvu.edu/etd
Recommended Citation Recommended Citation Cook, James E., "Avoidance of Token-Loss by Pigeons" (2015). Graduate Theses, Dissertations, and Problem Reports. 7072. https://researchrepository.wvu.edu/etd/7072
This Dissertation is protected by copyright and/or related rights. It has been brought to you by the The Research Repository @ WVU with permission from the rights-holder(s). You are free to use this Dissertation in any way that is permitted by the copyright and related rights legislation that applies to your use. For other uses you must obtain permission from the rights-holder(s) directly, unless additional rights are indicated by a Creative Commons license in the record and/ or on the work itself. This Dissertation has been accepted for inclusion in WVU Graduate Theses, Dissertations, and Problem Reports collection by an authorized administrator of The Research Repository @ WVU. For more information, please contact [email protected].

Avoidance of Token-Loss by Pigeons
James E. Cook
Dissertation submitted
to the Eberly College of Arts and Sciences at West Virginia University
in partial fulfillment of the requirements for the degree of
Doctor of Philosophy in
Psychology
Kennon A. Lattal, Ph.D., Chair
Claire C. St. Peter, Ph.D., BCBA-D
Michael Perone, Ph.D.
Steven G. Kinsey, Ph.D.
Daniel E. Hursh, Ph.D., BCBA-D
Department of Psychology
Morgantown, West Virginia
2015
Keywords: token; avoidance; conditioned reinforcement; negative reinforcement; pigeon;
variable-cycle schedule
Copyright 2015 James E. Cook

ABSTRACT
Avoidance of Token-Loss by Pigeons
James E. Cook
The response-dependent delivery and removal of tokens can reinforce and punish the responding
of humans and nonhuman animals. The responding of humans can be maintained by the
avoidance of token-losses, but this has not been demonstrated with nonhuman animals. Across
three experiments, it was demonstrated that the responding of pigeons could be maintained in a
token-loss avoidance arrangement. Tokens were delivered response-independently at the
beginning of a token-loss avoidance period. Tokens were scheduled to be removed on a variable-
cycle schedule. Responding canceled scheduled token-losses. Those tokens that remained were
exchangeable for food during programmed exchange periods. Several parameters of the token-
loss avoidance arrangement were manipulated to assess their effects on responding. In
Experiment 1, responding was a function of the frequency of scheduled token-losses. In
Experiment 2, responding was a function of the frequency of exchange periods. In Experiment 3,
no consistent changes in responding occurred whether a single token produced multiple
reinforcers or multiple tokens were required to produce a single reinforcer. Across all
experiments, local response rates were an inverse function of the number of tokens present. The
similarity of these results to those obtained in previous experiments, the possible functions of
tokens in the token-loss avoidance arrangement, and the implications of the methods used in the
present series of experiments are discussed.

iii
Acknowledgements
I would like to thank Andy Lattal, Claire St. Peter, Mike Perone, Steve Kinsey, and Dan Hursh
for serving on my committee, for their helpful comments on the design and implications of this
work, and for their patience along the way. I would like to thank Ezra Hall, Stephanie Kincaid,
Tyler Nighbor, and Sean Brown for their help in running these experiments and the many
conversations about this and other projects. I would like to thank Donna and Dennis Cook for
supporting and teaching me across my 25 years of education. Lastly, I am especially grateful to
Andy Lattal for advising me on this project and across my graduate career, guiding me towards
being a better researcher and behavior analyst, and for letting me drill holes in his operant
chamber.

iv
Table of Contents
Introduction………………………………….…………………………………………………….1
Literature Review………………………………………………………………………….2
Functions of Tokens……………………………………………………………….2
Conditioned Reinforcers…………………………………………………..2
Pavlovian Processes……………………………………………………….3
Generalized Conditioned Reinforcers……………………………………..4
Discriminative Stimuli…………………………………………………….7
Response cost…………………………………………………………….10
Parameters of Token Schedules of Reinforcement……………………………....12
Negative Reinforcement in Token Economies………………………………..…17
Theoretical Benefits of Tokens…………………………………………………..18
Statement of the Problem………………………………………………………………...21
Experiment 1……………………………………………………………………………………..22
Method…………………………………………………………………………………...23
Subjects…………………………………………………………………………..23
Apparatus………………………………………………………………………...24
Procedure………………………………………………………………………...24
Pretraining………………………………………………………………..24
Effects of VC Schedules of Token-Loss Avoidance…………………….27
Extinction………………………………………………………………...28
Results and Discussion…………………………………………………………………..28
Experiment 2……………………………………………………………………………………..32
v
Subjects and Apparatus…………………………………………………………………..33
Procedure………………………………………………………………………………...33
Pretraining………………………………………………………………………..33
Effects of Exchange Period Frequency…………………………………………..33
Results and Discussion…………………………………………………………………..34
Experiment 3……………………………………………………………………………………..39
Subjects and Apparatus…………………………………………………………………..40
Procedure………………………………………………………………………………...40
Results and Discussion…………………………………………………………………..41
General Discussion………………………………………………………………………………44
Limitations……………………………………………………………………………….45
Functions of Tokens in the Current Token-Loss Avoidance Arrangement……………...47
Negative Reinforcement…………………………………………………………………50
Basic Research/Theoretical Implications………………………………………………...51
Conclusions………………………………………………………………………………………54
References………………………………………………………………………………………..56
Tables…………………………………………………………………………………………….67
Figures……………………………………………………………………………………………71
Appendix A: Reinstatement of Responding in a Token-Loss Avoidance Arrangement……...…91
Method…………………………………………………………………………………...91
Extinction………………………………………………………………………...91
Token Reinstatement…………………………………………………………….91
Token+Food Reinstatement……………………………………………………...92

vi
VC 10 s…………………………………………………………………………..92
Results and Discussion…………………………………………………………………..92
References………………………………………………………………………………..95
Appendix B: Responding on a Multiple Schedule of Token-Loss Avoidance and Token-
Production…………………………………………………………………………………….101
Method……………………………………………………………………………………...101
Results and Discussion……………………………………………………………………..103
References..…………………………………………………………………………………105

vii
List of Tables
Table 1: Order of Conditions and Number of Sessions in Experiment 1………………………..67
Table 2: Order of Conditions and Number of Sessions in Experiment 2………………………..68
Table 3: Order of Conditions and Number of Sessions in Experiment 3………………………..70
Table B1: Average Frequency of Exchange Periods and Food Deliveries and the Percentage of
Available Tokens Exchanged in the Avoidance and Production Components……………….107

viii
List of Figures
Figure 1: Diagram of the first phase of pretraining……………………………………………...71
Figure 2: Diagram of the second phase of pretraining…………………………………………...72
Figure 3: Diagram of the general procedure across the present series of experiments…………..73
Figure 4: Overall response rates in each condition of Experiment 1…………………………….74
Figure 5: Local responding across tokens present in Experiment 1……………………………..75
Figure 6: Aggregate local responding across tokens present in Experiment 1…………………..76
Figure 7: Percent of scheduled token-losses canceled in each condition of Experiment 1……...77
Figure 8: Rate of exchange periods across conditions of Experiment 1…………………………78
Figure 9: Rate of food deliveries across conditions of Experiment 1……………………………79
Figure 10: Overall response rates across conditions of Experiment 2…………………………...80
Figure 11: Local responding across tokens present in Experiment 2……………………………81
Figure 12: Aggregate local responding across tokens present in Experiment 2…………………82
Figure 13: Percent of scheduled token-losses canceled across conditions in Experiment 2…….83
Figure 14: Rate of exchange periods across conditions of Experiment 2………………………..84
Figure 15: Rate of food deliveries across conditions of Experiment 2…………………………..85
Figure 16: Overall response rates in each condition of Experiment 3…………………………...86
Figure 17: Local responding across tokens present in Experiment 3……………………………87
Figure 18: Percent of scheduled token-losses canceled across conditions in Experiment 3…….88
Figure 19: Rate of exchange periods across conditions of Experiment 3………………………..89
Figure 20: Rate of food deliveries and token exchanges across conditions of Experiment 3…...90
Figure A1: Overall response rates across conditions in Experiment A………………………….96
Figure A2: Local response rates across tokens present in Experiment A………………………..97

ix
Figure A3: Percent of scheduled token-losses across conditions in Experiment A……………...98
Figure A4: Rate of exchange periods across conditions of Experiment A………………………99
Figure A5: Rate of token exchanges across conditions of Experiment A……………………...100
Figure B1: Overall response rates in the avoid and production components…………………..108
Figure B2: Local response rates in the avoid and production components across tokens present in
Experiment B…………………………………………………………………………………109

AVOIDANCE OF TOKEN-LOSS 1
Avoidance of Token-Loss by Pigeons
When a reinforcer is delivered, it often is not delivered in isolation. When the hopper is
raised for a pigeon, a light may turn on. When a pellet is dispensed for a rat, a tone may sound.
When a client receives a toy for appropriate behavior, the therapist may also deliver praise.
Through Pavlovian and operant processes, stimuli repeatedly and reliably paired with reinforcer
delivery can acquire eliciting, discriminative, and reinforcing properties of their own (Williams,
1994). One use of these processes that has been useful in research and practice has been the
development of the token economy (for reviews, see Dickerson, Tehhula, & Green-Paden, 2005;
Hackenberg, 2009; Kazdin, 1982; Kazdin & Bootzin, 1972; Maggin, Chafouleas, Goddard, &
Johnson, 2011; Matson & Boisjoli, 2009)
A token is an object or symbol that is exchangeable for goods or services. Tokens may be
manipulable objects (e.g. coins, poker chips, stickers, etc.) or other stimuli (e.g., LED lights,
points, check marks). Tokens are usually conceptualized as conditioned reinforcers that acquire
their reinforcing function through repeated exchanges for unconditioned reinforcers (e.g., food)
or established conditioned reinforcers (e.g., money). Tokens have a long history of being used in
the laboratory as reinforcers for both humans (Byron, Himoff, Catania, & Sagvolden, 1977;
Critchfield, Paletz, Macaleese, & Newland, 2003; King & Logue, 1990; Magoon & Critchfield,
2008; Silberberg et al., 2008; Weiner, 1962, 1963, 1969a, b) and nonhuman animals (Bullock &
Hackenberg, 2006, 2015; Cowles, 1937; Hackenberg, 2009; Kelleher, 1956, 1958; Malagodi,
1967a, b, c; Webbe & Malagodi, 1978; Wolfe, 1936). Token schedules of reinforcement also
underlie both monetary systems and critical components of behavior-management programs
across numerous applied settings (e.g., Ayllon, & Azrin, 1968; Conyers et al., 2004; DeLeon,

2
Bullock, & Catania, 2013; Fox, Hopkins & Anger, 1987; Kahng, Boscoe, & Byrne, 2003;
Kazdin, 1982; Kazdin & Bootzin, 1972; Phillips, 1968).
In token economies, behavior is generally reinforced and maintained by the response-
dependent production of tokens. With a few exceptions (e.g., Donaldson, DeLeon, Fisher, &
Kahng, 2014; Iwata & Bailey, 1974; Magoon & Critchfield, 2008), token economies have been
studied almost exclusively in the context of their production following responses. The present
series of experiments extends the analysis of token reinforcement to an avoidance (i.e., negative
reinforcement) procedure with nonhuman animals.
Literature Review
Functions of Tokens
Conditioned reinforcers. Research on responding maintained by token delivery has a
long history dating back to work by Wolfe (1936) and Cowles (1937). They conducted a series
of experiments aimed at assessing the conditioned reinforcing effects of tokens. In their
experiments, chimpanzees were trained to deposit poker chips into an apparatus that dispensed a
variety of primary (or backup) reinforcers. Initially, Wolfe (1936) trained chimpanzees to
discriminate between white tokens that were exchangeable for food and similar brass tokens that
were not exchangeable for food. After this discrimination was trained, responding maintained by
the delivery of food was compared to responding maintained by the delivery of tokens
immediately exchangeable for food in a variety of conditions. For most of the chimpanzees, there
was little difference between responding maintained by food delivery and responding maintained
by token delivery.
Cowles (1937) used the same subjects in a follow-up to Wolfe’s (1936) work. In a couple
of Cowles’s experiments, correct responding in a position discrimination task was reinforced

3
immediately with food or with tokens exchangeable for food at the end of the session. The
discrimination was acquired in both conditions. In these experiments, token delivery was a
reinforcer for correct responding, but performance improved more rapidly when correct
responses were immediately reinforced with food.
In subsequent experiments, Cowles (1937) demonstrated that the reinforcing functions of
tokens were the result of their pairing with food. Chimpanzees responded in a delayed match-to-
sample task. In different conditions, correct responses resulted in the delivery of one of two types
of tokens. Opportunities to exchange these tokens were delayed until the end of each session.
Tokens were exchanged for either food (food-paired tokens) or nothing (nonfood-paired tokens).
Accuracy improved in both conditions, but was higher when responding produced food-paired
tokens. In a follow-up experiment, correct responding resulted in the delivery of food, food-
paired tokens, or nonfood-paired tokens. When tokens were delivered, their immediate exchange
was required to start new trials. Accuracy was slightly higher when correct responses produced
food than when correct responses produced food-paired tokens. Accuracy was significantly
higher when correct responses produced food-paired tokens than when correct responses
produced nonfood-paired tokens. In all of Cowles’s experiments described above, the delivery of
food-paired tokens functioned as a reinforcer for accuracy when exchanges for food were
delayed or immediate.
Pavlovian processes. Tokens, like other conditioned reinforcers (Williams, 1991, 1994a,
1994b), may in part function to maintain responding by mediating delays between when
responses occur and the exchange for backup reinforcers (Hackenberg, 2009; Jackson &
Hackenberg, 1996; Shahan, 2010). Wolfe (1936) evaluated how long responding would persist
under various conditions of immediate token delivery and delayed food delivery. Four conditions
4
were used: 1.) food-paired tokens were delivered immediately for a response, but exchanges for
food occurred after a delay; 2.) food was earned for a response but was delivered after a delay;
3.) nonfood-paired tokens were delivered immediately for a response and food was delivered
after a delay, but exchanges were not required; 4.) food-paired tokens were delivered and
exchanged immediately after a response, but food was delivered after a delay. After each delayed
food delivery, the delay to the next food delivery was increased. Delays were increased in this
manner in each condition until a breakpoint delay was reached when responding stopped for 5
min. The longest delays were reached in the condition associated with immediate food-paired
token delivery and delayed exchanges for food. Wolfe (1936) suggested that tokens functioned
as a means to an end or a medium of exchange that mediated delays to reinforcement (cf.
Shahan, 2010). However, delays may have also been mediated by the Pavlovian processes
involved in marking (Lieberman, Davidson, & Thomas, 1985), bridging (Rescorla, 1982), and
conditioned reinforcement (Hackenberg, 2009; Williams, 1991). Immediate token delivery
served to mark the response and signal impeding food delivery. The presence of tokens served to
bridge the delay to food delivery. The temporal pairing of tokens with food delivery via
exchanges imparted conditioned reinforcing properties to the tokens. All three of these processes
were present and thus responding maintained over the longest delays in the condition that
resulted in immediate token delivery and delayed exchanges for food (Hackenberg, 2009).
Generalized conditioned reinforcers. That tokens function to immediately reinforce
behavior and mediate delays to the delivery of other reinforcers has long been a boon to
clinicians. Since Allyon and Azrin’s (1968) work with psychiatric in-patients, token economies
have been one of the most successful, widely used behavioral modification techniques (Kazdin &
Bootzin, 1972; Kazdin, 1982). Token economies have been used across a variety of populations

5
and locations to promote appropriate behavior and improve performance including psychiatric
in-patients and others diagnosed with mental disorders (Allyon & Azrin, 1968; Dickerson et al.,
2005), at-risk youths, juvenile delinquents, and adult felons (Milan & McKee, 1976; Phillips,
1968; Phillips, Phillips, Fixsen, & Wolf, 1971), individuals with developmental disabilities and
autism spectrum disorders (DeLeon et al., 2013; Matson & Boisjoli, 2009), typically developed
school children (Maggin et al., 2011), and in workplace settings (Fox et al., 1987). One of the
advantages of using token economies is that tokens can function not just as conditioned
reinforcers, but also as generalized conditioned reinforcers.
Generalized conditioned reinforcers are conditioned reinforcers that are paired with
multiple backup reinforcers and thus are not as likely to be affected by changes in motivating
operations (e.g., deprivation or satiation) for a single backup reinforcer (Catania, 2007). Money
(a kind of token) is the most common example given for a generalized conditioned reinforcer.
Human participants in laboratory settings often come into the laboratory with a long, rich history
of behavior previously reinforced with money. Though having a pre-established generalized
conditioned reinforcer is convenient for many research questions, it makes it difficult or
precludes determining what is required to create generalized conditioned reinforcers (DeFulio,
Yankelevitz, Bullock, & Hackenberg, 2014). Understanding the use and development of
generalized conditioned reinforcers is important as generalized conditioned reinforcers and
conditioned reinforcement, generally, are used to explain how human behavior is reinforced and
maintained (Skinner, 1953; Williams, 1994a, 1994b). Despite its importance as a concept, only a
few studies have investigated the necessary and sufficient conditions to create generalized
conditioned reinforcers.

6
The use of token schedules of reinforcement with nonhuman animals has almost
exclusively used tokens paired with only a single primary reinforcer. When tokens are only
paired with a single reinforcer, a functional relation is observed between responding and the
degree of deprivation for that single reinforcer (DeFulio et al., 2014; Wolfe, 1936). Wolfe (1936)
deprived chimpanzees of either peanuts or water for 16 or 24 hr prior to presenting them with a
choice situation where they could respond for tokens paired with either peanuts or water. More
responding occurred on the alternative associated with the tokens for the currently deprived
reinforcer. This effect was greater for those chimpanzees that were deprived of the specific
reinforcer for longer periods of time. DeFulio et al. (2014) found a similar effect with the
responding of pigeons maintained by the delivery of food-paired or water-paired tokens. DeFulio
et al. expanded on Wolfe’s (1936) work by also reinforcing responding on an alternative
associated with the delivery of generalized tokens that could be exchanged for either food or
water. DeFulio et al. (2014) found evidence to support that the generalized tokens functioned as
more effective reinforcer. Under water restriction, more responding occurred on the alternative
associated with delivery of the generalized tokens than alternatives associated with food- or
water-paired tokens. Also, using a behavioral-economic method of comparing reinforcers,
demand curves for generalized tokens tended to be more inelastic under increasing response
requirements (i.e., with greater inelasticity suggesting greater reinforcer value) than those for
food- or water-paired reinforcers.
Similar results were found by researchers who systematically established tokens as
generalized conditioned reinforcers for children diagnosed with developmental disabilities
(Becraft & Rolider, 2015; Moher, Gould, Hegg, & Mahoney, 2008). In both experiments,
response rates were compared when responding resulted in the delivery of either tokens paired

7
with a single reinforcer (nongeneralized tokens) or tokens paired with multiple reinforcers
(generalized tokens). Both the nongeneralized and generalized tokens were paired with a highly
preferred edible reinforcer. Comparisons of response rates were then made under conditions of
either 24-hr deprivation or satiation (i.e., prefeeding) of the highly-preferred edible. Higher
response rates tended to occur when responding resulted in the delivery of the generalized
tokens. This difference was greater under conditions of satiation of the highly preferred edible in
part because response rates decreased for responding maintained by delivery of the
nongeneralized tokens.
In the experiments by DeFulio et al. (2014) with pigeons and those by Moher et al.
(2008) and Becraft and Rolider (2015) with individuals with autism spectrum disorders, pairing
tokens with multiple backup reinforcers made the tokens function as generalized conditioned
reinforcers. In all these experiments, the generalized tokens functioned more effectively as
reinforcers than did tokens paired with a single reinforcer. Response rates were higher and
persisted under greater response requirements when responding resulted in generalized token
delivery response rates. Additionally, responding maintained by generalized token delivery was
not affected as much by deprivation or satiation associated with a single reinforcer. Given these
similarities, it is possible that the same processes involved in creating generalized conditioned
reinforcers are at work in both humans and nonhuman animals. These similarities are important
because the experimental analysis of behavior has long been facilitated by demonstrating that the
behavior of humans and nonhuman animals are the result of shared basic behavioral processes
(DeFulio et al., 2014; Hackenberg, 2009; Higgins & Morris, 1984; Skinner, 1953).
Discriminative stimuli. Stimuli that function as reinforcers also function as
discriminative stimuli. The discriminative function of reinforcers is such that some argue that

8
reinforcers only have a discriminative or signaling function (Baum, 2012). This is in part because
the delivery of reinforcers, whether delivered response-dependently or –independently, may be
indicative of the availability of additional reinforcers (Baum, 2012; Franks & Lattal, 1976; Reid,
1958). Reid (1958) demonstrated this is also true of token delivery. Though some have
questioned the conditioned reinforcing aspects of token delivery, there is agreement that tokens
have discriminative or signaling functions that serve to organize behavior around primary
reinforcer deliveries (Baum, 2012; Davison & Baum, 2006; Shahan, 2010).
One of the most common findings regarding the discriminative functions of tokens is that
token schedules of reinforcement function like a chain schedule (Hackenberg, 2009). A chain
schedule is a schedule of reinforcement in which reinforcers are delivered after the completion of
two or more successive component schedules (i.e., links), and each component schedule is
associated with a different stimulus (Catania, 2007). In token schedules of reinforcement, each
successive production of a token functions like the next link of the chain. As each successive
token is produced, response rates tend to increase as the opportunity to exchange those tokens for
primary reinforcers is closer in time (Bullock & Hackenberg, 2006; Foster, Hackenberg, &
Vaidya, 2001; Foster & Hackenberg, 2004). These increasing response rates with each
successive token production segment are similar to increasing response rates observed across
successive links in chain schedules (Jwaideh, 1973).
Bullock and Hackenberg (2015) conducted a series of experiments to further investigate
the multiple potential functions of tokens. Across three experiments, they had pigeons respond
on a two-component multiple schedule. One component used a token schedule of reinforcement,
and the other component used a schedule of an equivalent response requirement or frequency of
reinforcer delivery. In their first experiment, Bullock and Hackenberg compared responding

9
under a token schedule of reinforcement to an equivalent tandem schedule. A tandem schedule is
arranged in the same manner as a chain schedule, but each component is associated with the
same stimulus (Catania, 2007). In Bullock and Hackenberg’s case, the tandem schedule
delivered primary reinforcers after an equivalent number of responses were made, but no tokens
were produced. Bullock and Hackenberg found that responding under a token schedule of
reinforcement compared to an equivalent tandem schedule produced similar results to those
obtained in a previous comparison of responding under chain and tandem schedules (Jwaideh,
1973). Pauses tend to be longer and response rates lower in the first few links of the token
component compared to pauses and response rates in the first few links of the tandem
component.
In their second experiment, Bullock and Hackenberg (2015) compared responding in a
standard token schedule of reinforcement to multiple variations on a standard token economy.
One variation was what they called a reverse-chain token economy. In the standard token
economy, tokens were produced on a fixed-ratio (FR) 50 schedule. Each token produced
signaled the completion of a link of the schedule. When four tokens were produced, an exchange
period began in which each token could be exchanged for food. In the reverse-chain token
economy, pigeons started with four tokens that were removed on a FR 50 schedule. When all
four tokens were removed, the exchange period began. Four tokens were then illuminated and
exchanged for food. In the reverse-chain token economy, each successive removal of a token
signals the completion of each link of the schedule and the approaching exchange period.
Bullock and Hackenberg found similar patterns of responding in the standard and reverse-chain
token economies. In both token economies, after each link of the chain was completed, when
exchange periods were closer in time, response rates were higher. In the standard token

10
economy, the production of each token is usually conceptualized as an appetitive event, a
conditioned reinforcer that also signals the completion of each link of the schedule and the
approaching exchange period. By the same reasoning, in the reverse-chain token economy, the
removal of each token may be conceptualized as an appetitive event, a conditioned reinforcer
that also signals the completion of each link of the schedule. The discriminative and conditioned
reinforcing function of the token production or removal is influenced by its relation to the
operant contingencies in effect (Bullock & Hackenberg, 2015).
In their third experiment, Bullock and Hackenberg compared responding on a standard
token economy where tokens and exchange periods were produced response-dependently to a
yoked schedule where tokens and exchange periods were delivered response-independently at
the same rate. They also found that response rates were higher at all points under the response-
dependent schedule. However, they also found that responding persisted on the yoked schedule
and, much like responding on the standard token economy, responding tended to be faster on the
yoked schedule when in later links of the schedule, when the exchange period was closer in time.
They suggested that the tokens had eliciting functions much like stimuli used in autoshaping
procedures (Ricci, 1973).
Bullock and Hackenberg stated that tokens served multiple functions—as eliciting
stimuli, discriminative stimuli, and conditioned reinforcers. Bullock and Hackenberg went on to
state that it is the experimental arrangements, the contingencies in effect, which define the
function of the tokens in each context. Furthermore, the acknowledgement of one function did
not necessarily deny the importance of the any other potential function.
Response cost. Just as the response-dependent presentation of tokens functions as an
appetitive event, the response-dependent loss of tokens can function as an aversive event (Pietras

11
& Hackenberg; Raiff, Bullock, & Hackenberg, 2008; Rasmussen & Newland, 2008). Response-
cost procedures consist of contingencies that result in the loss or removal of reinforcers
dependent on a response (Azrin & Holz, 1966). Such procedures are routinely employed to
discourage dangerous or criminal behavior in everyday life (e.g., monetary fines for speeding,
drunk driving, vandalism, etc.). Similar contingencies that result in the response-dependent loss
of tokens have suppressed the responding of nonhuman animals (Pietras & Hackenberg, 2005;
Raiff, Bullock, & Hackenberg, 2008), humans in laboratory settings (Critchfield et al., 2003;
Pietras, Brandt, & Searcy, 2010; Rasmussen & Newland, 2008; Weiner, 1962), and inappropriate
or maladaptive behavior in applied settings (Capriotti, Brandt, Ricketts, Espil, & Woods, 2012;
Conyers et al., 2004; Fox et al., 1987; Kazdin & Bootzin, 1972; Kazdin, 1982).
Pietras and Hackenberg (2005) demonstrated that response-cost contingencies functioned
to suppress responding in pigeons. Pigeons responded on a two component multiple schedule. In
each component, tokens were produced on a variable ratio (VR) 4 (random interval [RI] 30-s)
schedule. In one of the components, a FR 2 or 10 response cost contingency was imposed.
Pietras and Hackenberg found that responding decreased in the response cost component, and the
FR 2 response-cost contingency decreased responding to a greater degree than did the FR 10
response-cost contingency. As the opportunity to exchange tokens for food rarely happened in
the response-cost component, it was possible that response rates declined because of the reduced
reinforcement rate in that component.
Raiff et al. (2008) conducted a follow-up study that compared responding under a
response-cost condition in which tokens were removed response-dependently to a yoked-token-
loss condition in which tokens were removed response-independently. The yoked-token-loss
condition was designed to equate the frequency of token-losses and food deliveries with the

12
response-cost condition. Degree of response suppression was evaluated by comparing rates of
responding in the response-cost and yoked-token-loss conditions to rates of responding in a
baseline standard token economy. Lower rates of reinforcement did suppress responding in both
the response-cost and yoked-token-loss conditions, but greater response suppression occurred in
the response-cost component. The response-dependent removal of tokens appeared to function as
a punisher for pigeons (Pietras & Hackenberg, 2005; Raiff et al., 2008) in much the same manner
as response-cost contingencies do with humans (Critchfield et al., 2003; Higgins & Morris, 1984;
Pietras et al., 2010; Rasmussen & Newland, 2008; Weiner, 1962, 1963, 1964).
Response-cost procedures have also long been used in application. Iwata and Bailey
(1974) compared the effects of two different token-economy arrangements on students’
performance of academic tasks and the frequency of disruptive behavior. In one arrangement,
students were awarded tokens throughout a class period for not violating class rules (e.g., being
off-task, disrupting other students, etc.). In another arrangement, students were given ten tokens
at the beginning of a class period and lost tokens for each instance of violating the class rules.
Iwata and Bailey found that both arrangements resulted in equal reductions of rule violations and
off-task behavior, and that students equally preferred both arrangements. Additionally, as off-
task behavior decreased, on-task behavior necessarily increased, suggesting a possible negative
reinforcement effect on behavior maintained by avoiding the loss of tokens.
Parameters of Token Schedules of Reinforcement
Token schedules of reinforcement function as second-order schedules comprised of three
separate but interrelated parts: 1.) A token-production schedule that determines under what
conditions responding produces tokens (e.g., one token is produced on a FR 50 schedule). 2.) An
exchange-production schedule that determines under what conditions opportunities to exchange

13
tokens for other goods (i.e. reinforcers) occur (e.g., tokens may be exchanged every 10 min or
after 5 tokens are produced). 3.) A token-exchange schedule that determines how many tokens
are required to produce a reinforcer (e.g., 1, 3, or 6 tokens may be required to produce a single
reinforcer). Each part of a token schedule of reinforcement contributes to the overall pattern of
responding (Hackenberg, 2009).
The token-production schedule produces patterns of responding similar to those
maintained by equivalent schedules that result in the delivery of primary reinforcers (e.g., food).
When the responding of chimpanzees produced tokens on either FR or fixed-interval (FI)
schedules, responding to produce individual tokens tended to occur in a break-and-run pattern
under FR schedules and was positively accelerated under FI schedules (Kelleher 1956, 1958).
Malagodi (1967a, b, c) and Bullock and Hackenberg (2006) used rats and pigeons, respectively,
to extend Kelleher’s work by conducting more detailed examinations of responding under FR
and variable ratio (VR) token-production schedules. As with Kelleher’s results, response patterns
to produce individual tokens conformed to schedule-typical behavior under FR and VR
schedules (Ferster & Skinner, 1957). In addition, an inverse functional relation was observed
between response requirements to produce individual tokens and response rates.
The production of individual tokens may be viewed as a unit in a larger chain of behavior
controlled by the exchange-production schedule. The pattern of responding across successive
token-productions generally resembles schedule-typical patterns of behavior. Webbe and
Malagodi (1978) compared the responding of rats under FR 6 or VR 6 exchange-production
schedules (i.e., opportunities to exchange tokens occurred when this schedule requirement was
met) when each individual token was always produced on a FR 30 schedule. Webbe and
Malagodi found that the VR exchange-production schedules maintained higher response rates

14
than did the FR exchange-production schedules. They found that most of this difference was the
result of long post-reinforcement pausing that occurred after tokens were exchanged in the FR
exchange-production schedule condition. Pausing was greater in early token-production
segments under the FR exchange-production schedule than in later token-production segments,
resembling a break-and-run pattern of responding typical of FR performance. Foster et al. (2001)
found similar patterns of behavior with pigeons across successive token-productions with a wider
range of FR and VR exchange-production schedules.
Bullock and Hackenberg (2006) expanded on previous experiments (Foster et al., 2001;
Webbe & Malagodi, 1978) by examining changes in responding across combinations of small
and large token-production and exchange-production schedules. Bullock and Hackenberg had
pigeons respond on token-production schedules ranging from FR 25-100 and exchange-
production schedules ranging from FR 2-8. They found an inverse functional relation between
response rates and token-production schedules at each exchange-production ratio. They also
found an inverse relation between response rates and exchange-production schedules at each
token-production ratio. The highest response rates tended to occur when the frequency of token
delivery and exchange periods was greatest. They also found that response rates tended to
increase as successive tokens were produced.
In application, schedule control by the exchange-production schedule can also be
observed, even when opportunities to exchange tokens are produced response-independently.
Similar patterns of behavior were observed in the application of token economies at the
Achievement Place (Phillips, 1968; Phillips et al., 1971). At Achievement Place, youths referred
by the local juvenile court received and lost points for engaging in appropriate and inappropriate
behavior, respectively. Points were exchangeable for various privileges. Phillips et al. (1971)

15
noted that when exchange periods occurred every Friday, a fixed-time (FT) 1 week exchange-
production schedule, the participating youths tended to earn fewer points early in the week. As
the week passed, the youths began earning increasing numbers of points, similar to performance
in interval schedules. Phillips et al. also found levels of appropriate behavior were improved
more rapidly following intake at Achievement Place when youths started on a daily exchange
program, FT 1 day, versus the weekly exchange program. Frequency of appropriate behavior
further improved when Phillips et al. (1971) implemented a daily response requirement. This
change required the youths to earn so many points each day or lose privileges for each
subsequent day until the response requirement was met. By imposing an avoidance of privilege-
loss contingency, Phillips et al. were able to improve levels of appropriate behavior.
Recently DeLeon et al. (2014) compared the frequency of exchange periods on the
responding of individuals diagnosed with developmental disorders. In their first experiment,
DeLeon et al. had participants respond in two conditions. In the distributed condition, each time
the participant performed some socially significant skill (e.g., academic activity), the participant
was given 30 s of access to a preferred activity. In the accumulated condition, the participant was
given a token for completing a similar skill. The participant was required to earn 10 tokens
before being given the opportunity to exchange the tokens. Each token in the accumulated
conditions was worth 30 s of access to the preferred activity. In each condition, sessions ended
when 10 tokens were earned or 5 min elapsed, not including reinforcer consumption time.
DeLeon et al. found that higher response rates occurred in the accumulated condition, the
condition associated with a lower frequency of exchange opportunities.
In their second experiment, DeLeon et al (2014) had participants respond on a concurrent
chains choice procedure. Participants were prompted to choose either the accumulated or

16
distributed condition. Following a FR 1 choice response, participants responded under the chosen
condition until 10 tokens or reinforcer deliveries occurred. Preference for either condition was
measured as the cumulative number of choice responses across choice opportunities. DeLeon et
al also assessed how choice responses were affected by the use of either activity or edible
reinforcers. More choice responses occurred on the accumulated condition alternative than on the
distributed condition alternative when activity or edible reinforcers were delivered, but the
difference in choice responses between alternative was smaller when edible reinforcers were
used. DeLeon et al (2014) suggested some reinforcers might only function as reinforcers when
they can be consumed over an extended period of time. Thus, the temporally extended
consummatory behavior associated with an activity reinforcer may have increased choice
responses for the accumulated condition when an activity reinforcer was delivered. The
frequency of exchange opportunities can affect response rates (Bullock & Hackenberg, 2006;
Foster et al., 2001), but DeLeon et al (2014) demonstrated that the type of reinforcer (e.g.,
activity or edible) and the number of reinforcers that can be consumed in an exchange period can
also influence response rates, though this effect was weak.
In all of these studies, the token-exchange schedule was held constant at FR 1—one
token was exchangeable for one reinforcer. In the only study to manipulate the token-exchange
schedule, Malagodi, Webbe, & Waddell (1975) had rats respond on either a FR or FI exchange-
production schedule in which each token was produced on a FR 20 schedule. Across conditions,
the token-exchange schedule was changed such that multiple tokens were required to produce
each reinforcer. Response rates were lower when more tokens were required to produce a single
reinforcer.

17
Negative Reinforcement in Token Economies
As token-loss functions as an aversive event, responding may also be maintained by the
avoidance of token-loss. For example, municipalities may encourage health and safety behavior
by imposing monetary fines that can be avoided if residents regularly mow their lawns, if drivers
and passengers in cars buckle their seat belts, and if restaurants maintain clean kitchens. These
contingencies are commonplace but, like most areas of aversive control, receive little attention in
research (Critchfield & Rasmussen, 2007).
In the laboratory, Weiner (1963, 1969a) conducted experiments in which human
participants began sessions with a maximum point total and were instructed to keep the total as
high as possible. Responding was maintained on postponement schedules that avoided or
escaped point-loss periods in which the total number of points was reduced rapidly. The
responding of participants maintained by the avoidance or escape of these point-loss periods
continued even when each response deducted one point (Weiner, 1963). Weiner (1969a)
gradually increased the periods of escape produced by responding over the course of the
experiment. When responding produced longer periods of escape/avoidance of the point-loss
periods, responding tended to be lower.
In application, several studies have compared the relative effectiveness of token
economies in which responding was maintained by token delivery or the avoidance of token-loss.
Iwata and Bailey (1974) compared the effects of two different token economy arrangements on
students’ performance of academic tasks and frequency of disruptive behavior. In one
arrangement, students were awarded tokens throughout a class period for not violating class rules
(e.g., being off-task, disrupting other students, etc.). In another arrangement, students were given
ten tokens at the beginning of a class period and lost tokens for each instance of violating the

18
class rules. Iwata and Bailey found that both arrangements resulted in equal reductions of rule
violations and off-task behavior, and students equally preferred both arrangements. Additionally,
as off-task behavior decreased, on-task behavior necessarily increased. The researchers this was
the result of a possible reinforcement effect on behavior maintained by avoiding the loss of
tokens. Lippman & Motta (1993) in their comparison of token-gain and token-loss contingencies
suggested that using negative reinforcement contingencies to teach individuals may be beneficial
when used in conjunction with positive reinforcement contingencies. Such contingencies may be
adaptive for transitions to independent living situations in which mowing the lawn, doing dishes,
and washing laundry may not produce immediate programmed positive reinforcers, but will
avoid complaints, fines, and unsanitary living conditions.
More recently, Donaldson et al. (2014) also found that symmetrical token-gain and loss
contingencies decreased disruptive behavior. For some participants, however, greater decreases
were observed in the token-loss contingency condition, and more participants preferred the
token-loss contingency. Additionally Donaldson et al. suggested that token-loss contingencies
may be simpler to implement. A better understanding of the contingencies that operate to
maintain avoidance of token-loss may serve to make these token economies more effective and
give practitioners additional treatment options.
Theoretical Benefits of Tokens
The use of token schedules may also offer a unique avenue for research into the processes
of positive and negative reinforcement. Researchers in the past have attempted to examine
whether appetitive events (e.g. food delivery) exert the same control over behavior that aversive
events (e.g., shock delivery) do. The problem with this line of research often involves asking
how much food is equivalent to a shock. De Villiers (1980) attempted to quantify this relation,
19
but other researchers have instead opted to use token systems and human participants to address
this issue.
By using token schedules of reinforcement, contingent gains and losses can occur along
the same dimension. This allows the potential of assessing the symmetry of the law of effect.
Under a symmetrical law of effect equivalent losses and gains have equivalent effects on
behavior. For example, Magoon and Critchfield (2008) maintained the responding of humans,
mouse-clicks, on concurrent variable-cycle (VC) schedules. VC schedules are arranged similarly
to variable interval (VI) schedules. They differ in that VI schedules reinforce the first response
that occurs after the interval elapses; VC schedules set up an event to occur (e.g., reinforcer
delivery, a scheduled shock is avoided) contingent on the first response that occurs during the
interval. If the interval elapses in a VC schedule without a response occurring, the response-
dependent event is cancelled (e.g., no reinforcer delivery, a scheduled shock occurs). In Magoon
and Critchfield’s arrangement, responding on one schedule delivered monetary gains and
responding on the other avoided monetary losses of the same amount. The results conformed to
expectations based on the generalized matching law. Responding occurred on either schedule as
a function of the relative distribution of reinforcement. That is, when money-gain was relatively
more frequent, more responding occurred on the money-gain option and vice versa. The
researchers suggested that producing monetary gains and avoiding monetary losses of the same
amount had similar effects on responding.
According to another theory borne from behavioral economics, loss-aversion, aversive
events (e.g., money loss) exert greater control over behavior than do appetitive events (e.g.,
money gain) (Brosnan, Jones, Lamberth, Mareno, Richardson, & Schapiro, 2007; Chen,
Lakshminarayanan, & Santos, 2006; Kahneman & Tversky, 1979, 2000; Pelé, Broihanne,
20
Thierry, Call, & Dufour, 2014). Some research from behavior analysis supports this theory
(Donaldson et al., 2014; Rasmussen & Newland, 2008). Rasmussen & Newland (2008), for
example, analyzed responding of human participants, mouse-clicks, on concurrent schedules in
which one alternative produced only money-gains and the other produced both money-gains and
response-dependent money-losses. More responding occurred on the money-gain only alternative
than would be expected if money-gains and money-losses were of equal effectiveness. The
researchers suggested response-dependent money-losses exerted greater control over responding
than did equivalent gains.
However, the robustness of loss aversion across other species and even within the human
species is unclear (Magoon & Critchfield, 2008; Pelé et al., 2014; Silberberg et al., 2008).
Experiments examining factors that affect responding for gains and losses in a token economy
may further illustrate what factors influence the appearance of loss aversion or a symmetrical law
of effect. Demonstrations of responding maintained by token-gain and avoidance of token-loss in
nonhuman animals may provide evidence illustrating whether loss aversion is a product of
human cultural practices or a basic behavioral process (Chen et al., 2006; Harbaugh, Krause, &
Berry, 2001; Harbaugh, Krause, & Vesterlund, 2001; Silberberg et al., 2008). Additionally,
pursuing such research would shed light on how contingencies operating in a token-loss
avoidance arrangement affect responding, which may have value to both basic and applied
research.
This research taken together supports the idea that behavior under token schedules of
reinforcement where responding produces tokens is a joint function of the token-production,
exchange-production, and token-exchange schedules. It is possible that behavior maintained by
the avoidance of token-losses will be affected by manipulations in similar components: the

21
frequency with which token-losses are avoided, the frequency with which opportunities to
exchange the tokens occur, and the token-exchange schedule in effect. Pursuing this line of
research will immediately provide greater general knowledge about responding maintained by
the avoidance of token-losses and conditioned reinforcers. In the long run, this research may
have additional value by providing another method for further examination of the symmetrical
law of effect and loss-aversion (Magoon & Critchfield, 2008; Silberberg et al., 2008).
Additionally, this research may have translational relevance by providing more information
about factors that affect responding in response-cost token economies used in applied settings
(Iwata & Bailey, 1974; Donaldson et al., 2014) and in the broader culture (e.g., municipal fines).
Statement of the Problem
The experimental analysis of token systems has implications for both basic research and
application. In the laboratory, tokens often are used as reinforcers for both humans and
nonhuman animals (Hackenberg, 2009). In terms of application, token systems are pervasive. In
everyday life they exist in the form of monetary rewards and losses. In applied settings, they are
components of behavior-management plans. The response-dependent delivery and loss of tokens
can reinforce and punish behavior, respectively (Hackenberg, 2009), but less research has
examined the parameters that affect responding that avoids or escapes the loss of tokens
(Donaldson et al., 2014; Lippman & Motta, 1993; Magoon & Critchfield, 2008; Weiner, 1963,
1969) even though such contingencies exist in everyday life. Laboratory research with
nonhuman animals has provided more knowledge about the parameters that affect responding
maintained by the delivery of tokens (Bullock & Hackenberg, 2015; Hackenberg, 2009).
Laboratory research with nonhuman animals may provide us with more knowledge about the

22
parameters that affect responding maintained by the avoidance of token-losses and what
conditions are necessary to establish such behavior.
Theoretically, the analysis of token systems allows for the examination of the processes
of positive and negative reinforcement using the same stimulus, in which presentations and
losses of tokens correspond to equivalent gains and losses of reinforcement. Thus, responding
can be maintained by the response-dependent presentation of tokens and the response-dependent
avoidance of the loss of tokens. Responding under token schedules of reinforcement that result in
the presentation of tokens (a positive reinforcement arrangement) are a joint function of the
token-production, exchange-production, and token-exchange schedules. It is not as well
understood how parameters similar to the token-production, exchange-production, and token-
exchange schedules may affect responding that avoids the loss of tokens (a negative
reinforcement arrangement).
This study examined whether similar factors that affect responding to produce tokens
have a similar effect on responding to avoid token-loss. This study assessed how parameters
similar to the token-production, exchange-production, and token-exchange schedules used in a
positive reinforcement arrangement operate in a negative reinforcement arrangement. This was
done to inform our understanding of responding to avoid token-loss generally. Such information
may have value in future basic research comparing the influence of equivalent losses and gains
on responding (Magoon & Critchfield, 2008; Rasmussen & Newland, 2008; Silberberg et al.,
2008) and on the use of token-loss contingencies in applied settings (Donaldson et al., 2014).
Experiment 1
Responding in a token economy is a joint function of three separate but interrelated
components, the first of which is the token-production schedule. Token-production schedules

23
that delivered tokens more frequently maintained higher rates of responding (Bullock &
Hackenberg, 2006; Kelleher, 1958). A similar parameter may function in a token-loss avoidance
arrangement, the schedule of how frequently token-losses occur. Higher rates of responding
occur when shocks or point-loss are scheduled more frequently (Courtney & Perone, 1992; de
Villiers, 1972, 1974; Weiner, 1969a).
In previous studies, responding was maintained by postponement of point-loss periods
(Weiner, 1963, 1969a) and VC schedules of shock (Courtney & Perone, 1992; de Villiers, 1972,
1974; Logue & de Villiers, 1978) and money-loss avoidance (Magoon & Critchfield, 2008).
Variable-cycle schedules allow the experimenter to eliminate the fixed temporal relation between
responses and aversive events that exists in postponement schedules, but still measure the
frequency of scheduled events (e.g. token-loss) and their avoidance (Anger, 1963; de Villiers,
1972). In the first experiment, responding under VC schedules of different average durations was
examined to determine if higher rates of responding to avoid token-loss would occur when
token-losses were scheduled more frequently.
Method
Subjects
Three White Carneau pigeons were used. Pigeons 267 and 819 were experimentally naïve
at the beginning of this experiment, and Pigeon 847 had a history of responding on a variety of
reinforcement schedules. Each was maintained at 80% of free-feeding weight (± 15 g) by post-
session feedings occurring at least 30 min after sessions. Food used in sessions and post-session
feedings consisted of Purina Nutri-Blend™ pellets. Pigeons were housed individually with free
access to water and health grit in a vivarium on a 12:12 hr light/dark cycle.
24
Apparatus
One operant chamber with a work area of 31 cm H x 30 cm W x 33 cm L was used. The
work panel had three 2-cm diameter Gerbrands Co. response keys. Keys were evenly spaced
horizontally across the work panel. The center key was located along the midline of the panel 7
cm from the ceiling with another key located 5 cm on either side. Keys were transilluminated by
7-W, 28-V bulbs. The center and left keys were transilluminated by a green and red light,
respectively. The right key was dark and inoperative. Responding on the keys produced auditory
feedback clicks. Reinforcers were delivered by raising a Gerbrands Co, model G610, hopper
filled with Purina Nutri-Blend™ pellets. The hopper was located behind a 5-cm square aperture,
7 cm below the center key. During reinforcer deliveries, the aperture was lit by a 7-W, 28-V
bulb. A 7-W, 28-V houselight was located behind a 5-cm diameter circular aperture 2 cm from
the right side of work panel and 2 cm from the floor provided general illumination. A row of 7
green 40-mcd LEDs were centered 2 cm above the center key with each LED spaced 1 cm apart
on either side. A ventilation fan and white noise generator provided ventilation and masked
extraneous sound. A computer running Med-PC IV® software controlled experimental
procedures and recorded data.
Procedure
All sessions occurred at approximately the same time each day, 7 days a week.
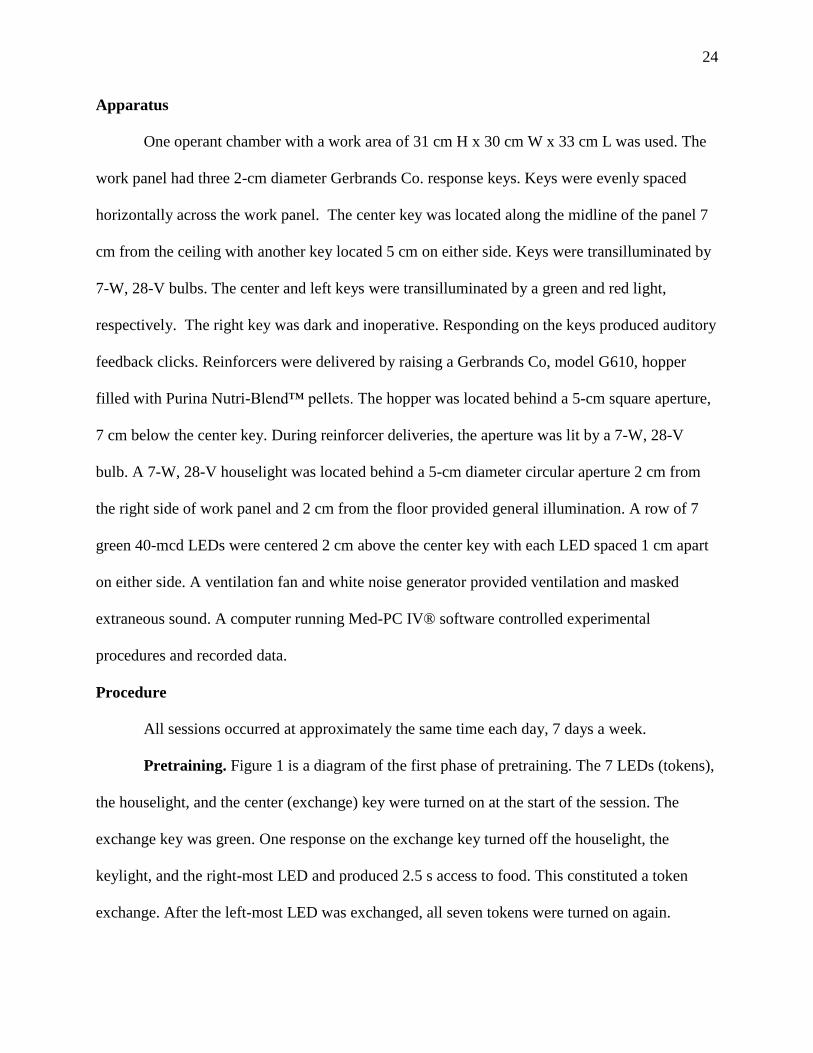
Pretraining. Figure 1 is a diagram of the first phase of pretraining. The 7 LEDs (tokens),
the houselight, and the center (exchange) key were turned on at the start of the session. The
exchange key was green. One response on the exchange key turned off the houselight, the
keylight, and the right-most LED and produced 2.5 s access to food. This constituted a token
exchange. After the left-most LED was exchanged, all seven tokens were turned on again.
25
Sessions ended when 63 tokens were exchanged. Sessions continued in this way until all
exchange responses occurred with short latencies (< 5 s) following reinforcer delivery. Hand-
shaping was used to train the key-peck response to the exchange key for Pigeons 267 and 819.
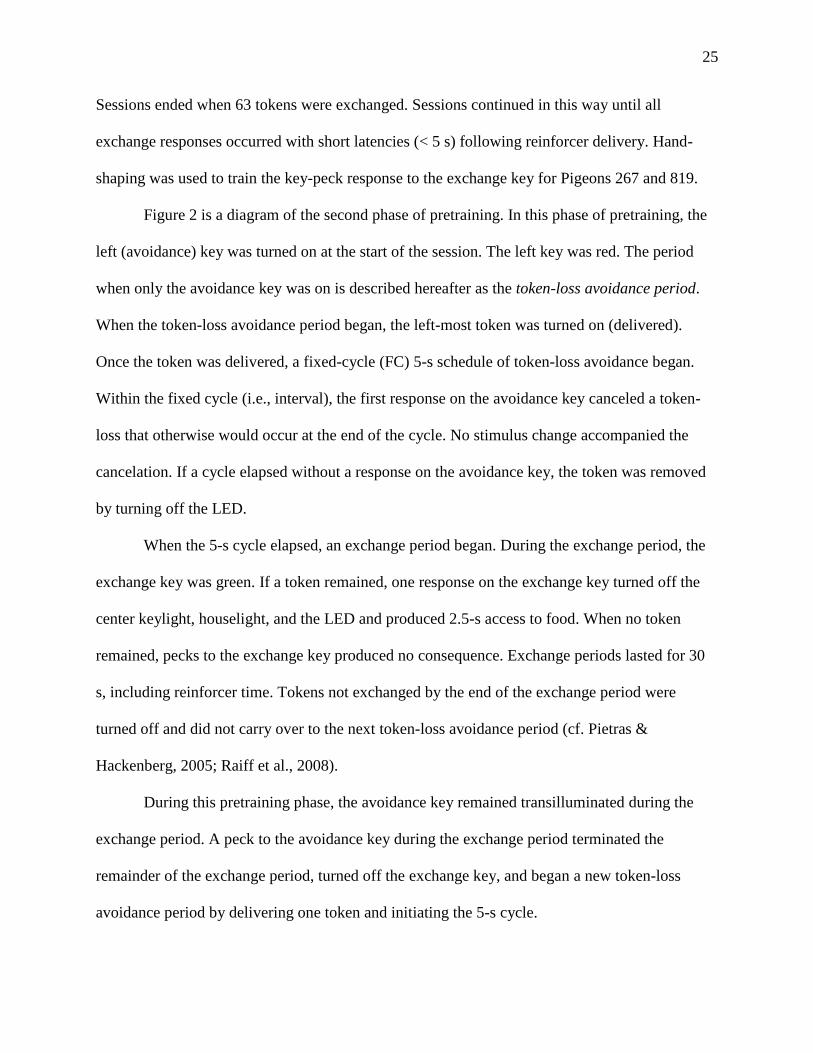
Figure 2 is a diagram of the second phase of pretraining. In this phase of pretraining, the
left (avoidance) key was turned on at the start of the session. The left key was red. The period
when only the avoidance key was on is described hereafter as the token-loss avoidance period.
When the token-loss avoidance period began, the left-most token was turned on (delivered).
Once the token was delivered, a fixed-cycle (FC) 5-s schedule of token-loss avoidance began.
Within the fixed cycle (i.e., interval), the first response on the avoidance key canceled a token-
loss that otherwise would occur at the end of the cycle. No stimulus change accompanied the
cancelation. If a cycle elapsed without a response on the avoidance key, the token was removed
by turning off the LED.
When the 5-s cycle elapsed, an exchange period began. During the exchange period, the
exchange key was green. If a token remained, one response on the exchange key turned off the
center keylight, houselight, and the LED and produced 2.5-s access to food. When no token
remained, pecks to the exchange key produced no consequence. Exchange periods lasted for 30
s, including reinforcer time. Tokens not exchanged by the end of the exchange period were
turned off and did not carry over to the next token-loss avoidance period (cf. Pietras &
Hackenberg, 2005; Raiff et al., 2008).
During this pretraining phase, the avoidance key remained transilluminated during the
exchange period. A peck to the avoidance key during the exchange period terminated the
remainder of the exchange period, turned off the exchange key, and began a new token-loss
avoidance period by delivering one token and initiating the 5-s cycle.

26
Sessions continued until the first exchange period after at least 56 tokens were delivered
ended. The second phase of pretraining continued until the pigeon canceled at least 80% of token
losses across three consecutive sessions. Across the last 3 sessions of the second phase of
pretraining, Pigeons 267, 819, and 847 cancelled 86.67%, 90.76%, and 91.56% of scheduled
token losses, respectively.
Figure 3 is a diagram of the third phase of pretraining and the arrangement used in the
rest of Experiment 1 (described below). In this phase of pretraining, the token-loss avoidance
period began with the response-independent delivery of a number of tokens and the avoidance
key turning on. The number of tokens delivered at the beginning of the token-loss avoidance
period was increased gradually across sessions. Initially, only a single token was delivered at the
beginning of each token-loss avoidance period. Decisions to increase the number of tokens were
based on visual analysis of responding on the avoidance key. If no systematic trends were
observed in responding across three consecutive sessions, the number of tokens was increased.
The number of tokens delivered was increased by expanding an array from which the number of
tokens delivered was selected randomly without replacement. The initial array consisted only of
the value 1. This was increased to an array consisting of two values: 1 and 2. This next was
increased to an array consisting of three values: 1, 2, and 3, etc. At the end of training, a variable
number of tokens were delivered by selecting randomly without replacement from an array of
seven values ranging from 1-7 with an average of 4 tokens. As 56 tokens were delivered in each
session, this ensured each value from the array was selected twice in each session.
Time in the token-loss avoidance period varied depending on the number of tokens
delivered. Token-loss avoidance periods ended and exchange periods began when a number of
cycles equal to the number of tokens delivered elapsed. For example, if one token was delivered
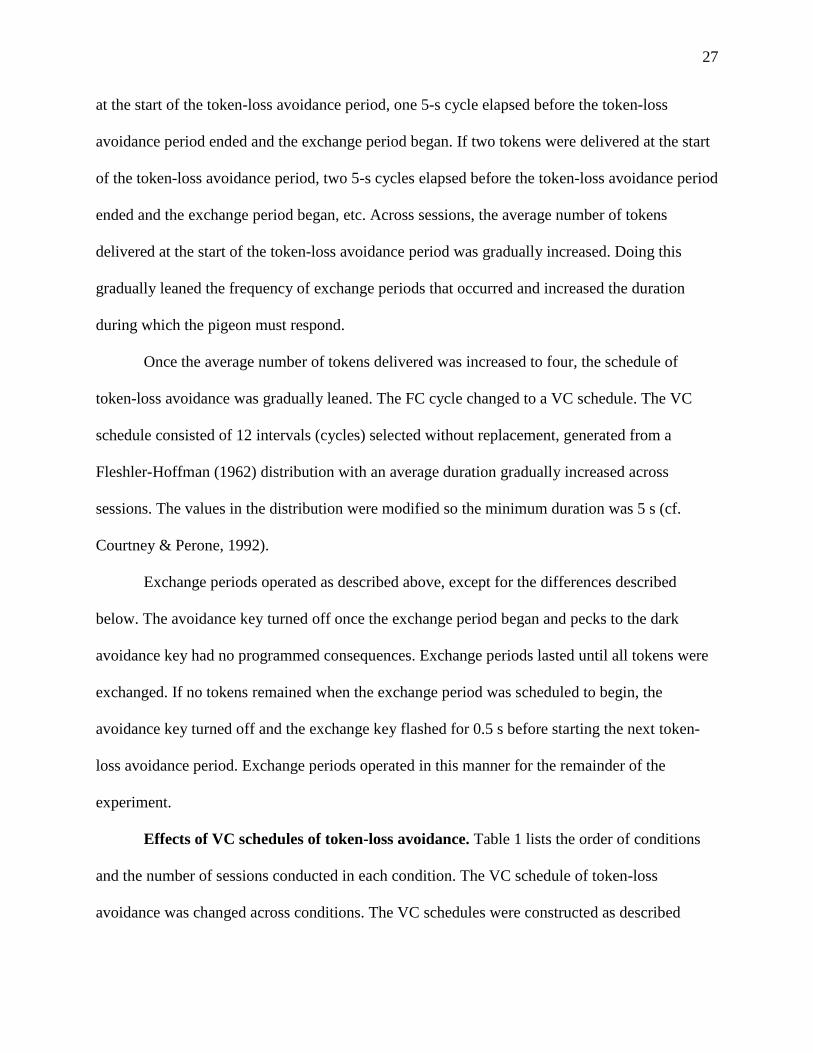
27
at the start of the token-loss avoidance period, one 5-s cycle elapsed before the token-loss
avoidance period ended and the exchange period began. If two tokens were delivered at the start
of the token-loss avoidance period, two 5-s cycles elapsed before the token-loss avoidance period
ended and the exchange period began, etc. Across sessions, the average number of tokens
delivered at the start of the token-loss avoidance period was gradually increased. Doing this
gradually leaned the frequency of exchange periods that occurred and increased the duration
during which the pigeon must respond.
Once the average number of tokens delivered was increased to four, the schedule of
token-loss avoidance was gradually leaned. The FC cycle changed to a VC schedule. The VC
schedule consisted of 12 intervals (cycles) selected without replacement, generated from a
Fleshler-Hoffman (1962) distribution with an average duration gradually increased across
sessions. The values in the distribution were modified so the minimum duration was 5 s (cf.
Courtney & Perone, 1992).
Exchange periods operated as described above, except for the differences described
below. The avoidance key turned off once the exchange period began and pecks to the dark
avoidance key had no programmed consequences. Exchange periods lasted until all tokens were
exchanged. If no tokens remained when the exchange period was scheduled to begin, the
avoidance key turned off and the exchange key flashed for 0.5 s before starting the next token-
loss avoidance period. Exchange periods operated in this manner for the remainder of the
experiment.
Effects of VC schedules of token-loss avoidance. Table 1 lists the order of conditions
and the number of sessions conducted in each condition. The VC schedule of token-loss
avoidance was changed across conditions. The VC schedules were constructed as described

28
above with average durations of 10, 30, and 90 s. The effects of VC 10, 30, and 90-s token-loss
avoidance schedules on responding were compared across conditions. Pigeons were exposed to
VC avoidance schedules of different average durations for a minimum of 15 sessions and until
responding on the avoidance key appears stable. Stability was defined as no systematic trends
over the last 5 sessions based on visual inspection. This stability criterion was used before all
condition changes across the experiment.
Extinction (EXT). In the final condition, responding on the avoidance key was placed on
extinction by making keypecking ineffective in avoiding token loss. Instead, token losses
occurred independently of responding, on a variable time (VT) 10-s schedule, arranged in a
similar manner to the VC 10-s schedule. The effect of this schedule was that each exchange
period occurred with zero tokens remaining. Parameters of the schedule during this condition
were, except for the response-independent token loss contingency, similar to conditions in which
the VC schedules were in effect.
Results and Discussion
Figure 4 shows overall response rates on the avoidance key during the token-loss
avoidance period across different VC schedules of programmed token-loss frequency. Overall
response rates were determined by dividing the number of responses emitted on the avoidance
key by the amount of time spent in the token-loss avoidance period. Overall response rates
increased as a function of the frequency of scheduled token-losses. When responding on the
avoidance key did not prevent token-losses in the EXT condition, responding dropped to zero or
near zero for Pigeons 267 and 819. Responding did not entirely stop for Pigeon 847 during EXT,
but response rates were at their lowest.

29
Pigeon 267 was not exposed to the VC 90-s condition because overall response rates
were very low in the VC 30-s condition. It seemed unlikely that further reductions in overall
response rates would be observed under a VC 90-s schedule of token-loss because of a possible
floor effect. Overall response rates increased in the following VC 10-s conditions relative to the
VC 30-s condition, but overall response rates in the second VC 10-s condition were lower than in
the first VC 10-s condition. Response rates in one condition may have been influenced by
responding in the previous condition (i.e., sequence effects). Given the low rate of responding in
the second VC 10-s condition, rather than replicate the VC 30-s condition, the EXT condition
was implemented. Responding in the EXT condition dropped to near zero.
Changes in response rates also were assessed in relation to the number of tokens present
to evaluate whether proximity to the exchange period affected responding (Bullock &
Hackenberg, 2006; Foster et al., 2001). Local response rates on the avoidance key were
calculated by dividing the number of responses on the avoidance key by the amount of time
elapsed from the beginning of the token-loss avoidance period until either the right-most token
was removed or the exchange period occurred, whichever came first. Figure 5 shows the average
local response rates as a function of the number of tokens present from the last 5 sessions of each
condition. Figure 6 shows these same data aggregated for each VC schedule for ease of
comparison. Local response rates increased when fewer tokens were present. As with the overall
response rates in Figure 4, local response rates increased as function of frequency of scheduled
token-losses. Differences in local response rates between different VC schedules were greater
when fewer tokens were present.
Figure 7 shows the percentage of scheduled token-losses that were canceled for each
pigeon. This index was determined by dividing the total number of scheduled token-losses

30
canceled by the total number of tokens delivered in a session (56). The percentage of scheduled
token-losses canceled did not change systematically as a function of the frequency of scheduled
token-losses. For Pigeons 819 and 847, there was little variation in the percentage of scheduled
token-losses that were canceled across conditions. The percentage of scheduled token-losses
canceled across VC 10-90-s conditions averaged 59.21% (range, 37.50-82.14%) for Pigeon 819
and 58.36% (range, 46.43-75.00%) for Pigeon 847. For Pigeon 267, the percentage of scheduled
token-losses canceled in the first VC 10-s condition averaged 69.29% (range, 53.57-73.57%).
The percentage of token-losses canceled decreased in the following VC 30-s and VC 10-s
conditions to an average of 32.14% (range, 8.93-50.00%) and 38.93% (range, 19.64-51.79%),
respectively.
Figures 8 and 9 show the frequency of exchange periods and token exchanges across
conditions, respectively. The frequency of exchange periods was determined by dividing the total
number of exchange periods that occurred in each session by the time spent in the token-loss
avoidance period. Each token exchange was followed by food delivery. The frequency of token
exchanges was determined by dividing the total number of tokens exchanged by the total session
time minus food delivery time (2.5 s/food delivery). Conditions associated with more frequent
scheduled token-losses were associated with more frequent exchange periods and token
exchanges. The EXT condition was associated with the same frequency of exchange periods as
the VC 10-s condition. Because no token-losses were canceled in the EXT condition, these
exchange periods were brief (.5-s) and were not associated with token exchanges. These brief
presentations of the exchange period stimuli in the EXT condition were not sufficient to maintain
responding without being paired with token exchanges relative to the other conditions (Figures 4,
5, and 6).

31
Overall response rates were a function of the frequency of scheduled token-losses (Fig.
4). This relation is similar to that obtained between response rates and the rate of programmed
electric shock delivery under electric-shock avoidance schedules (e.g., Courtney & Perone, 1992;
de Villiers, 1972, 1974; Logue & de Villiers, 1978). This relation is also similar to the relation
between response rates and the frequency of scheduled point- or money-losses observed when
responding of humans is maintained by the avoidance of point- or money-loss (Magoon &
Critchfield, 2008; Weiner, 1969a).
The relation between the overall rate of responding of pigeons and the frequency of
scheduled-token losses in this experiment is similar to previous experiments in which the
responding of nonhuman animals was maintained by the delivery of tokens. The rate of
responding of nonhuman animals in previous experiments changed as a function of the frequency
of token-deliveries (Foster et al., 2001; Malagodi 1967a, b, c). The frequency of scheduled
token-losses in a token-loss avoidance arrangement appears to function in the same manner the
as the frequency of token-deliveries in a token-production arrangement.
There also appeared to be some similarities in the changes in local response rates in this
experiment and previous experiments in which responding was maintained by the delivery of
tokens. In those previous experiments (Bullock and Hackenberg, 2006; Foster et al., 2001;
Webbe & Malagodi, 1978), response rates increased across token-production segments (i.e., the
number of tokens so far produced and accumulated on the counter). There was a functional
relation between the number of tokens and local response rates. This may have been because the
more tokens present, the closer subjects were temporally to exchange periods and food. In this
experiment, there was an inverse relation between the number of tokens and local response rates.
The fewer tokens present, the closer pigeons were to exchange periods and food. The closer

32
pigeons were to exchange periods and food, response rates increased (Figures 5 and 6). Bullock
and Hackenberg (2006) also found that local response rates tended to be highest in those
conditions associated with the most frequent token-deliveries. In the present experiments, higher
local response rates occurred in the conditions associated with the more frequent scheduled
token-losses.
Bullock and Hackenberg (2006) found that response rates were affected by both the
token-production and exchange-production schedule. Response rates were higher when tokens
and exchange periods were produced more frequently. A limitation of this experiment was that
the frequency of scheduled token-losses and exchange periods varied concurrently. In
Experiment 2, the effect of the frequency of exchange periods on responding was examined
when the VC schedule of token-loss was held constant.
Experiment 2
This experiment investigated the effects on token loss avoidance of the second of the
three variables described in the statement of the problem, the frequency of exchange periods.
When responding is maintained by the delivery of tokens, response rates are higher when
exchange periods occur more frequently. In previous experiments, more frequent opportunities to
exchange tokens maintained higher rates of responding than did less frequent opportunities for
such exchanges (Bullock & Hackenberg, 2006; Foster et al., 2001; Waddell, Leander, Webbe, &
Malagodi, 1972; Webbe & Malagodi, 1978; Phillips et al., 1971). Therefore in this second
experiment, token-loss avoidance responding was examined as a function of the frequency of
exchange periods when the VC schedule of token-loss avoidance was constant.

33
Subjects and Apparatus
Three pigeons (different pigeons from those in Experiment 1) were used. Pigeon 942 was
experimentally naïve at the beginning of this experiment. Pigeons 1022 and 1104 had previous
experience responding on various schedules of reinforcement. Maintenance was as described in
Experiment 1. The same apparatus described in Experiment 1 was used.
Procedure
Pretraining. Pretraining described in Experiment 1 was conducted. Pigeons 942, 1022,
and 1104 cancelled on average 82.32, 87.72, and 87.5% of scheduled token-losses across the last
three sessions of pretraining.
Effects of exchange period frequency. Table 2 lists the order of conditions and the
number of sessions conducted in each condition. Pigeons responded initially on the VC 30-s
avoidance schedule as described in Experiment 1. Pigeons 942 and 1104 responded on a VC 10-s
schedule in later conditions following low rates of responding on the VC 30-s schedule. The
stability criteria were as described in Experiment 1.
The effects of different exchange-production schedules on responding in the context of a
token-loss avoidance schedule were assessed across conditions. The frequency of exchange
periods was manipulated by changing the number of tokens that were delivered at the start of
each token-loss avoidance period. As in Experiment 1, time in the token-loss avoidance period
varied depending on the number of tokens delivered. Across conditions a fixed number (FN) of
tokens were delivered at the start of each token-loss avoidance period. Either FN 2, 4, or 6 tokens
were delivered at the start of each token-loss avoidance period and the token-loss avoidance
period lasted until 2, 4, or 6 VC cycles elapsed. For example, when VC 30-s cycles were used,
exchange periods occurred on average every 60, 120, or 180 s. Once initiated, exchange periods
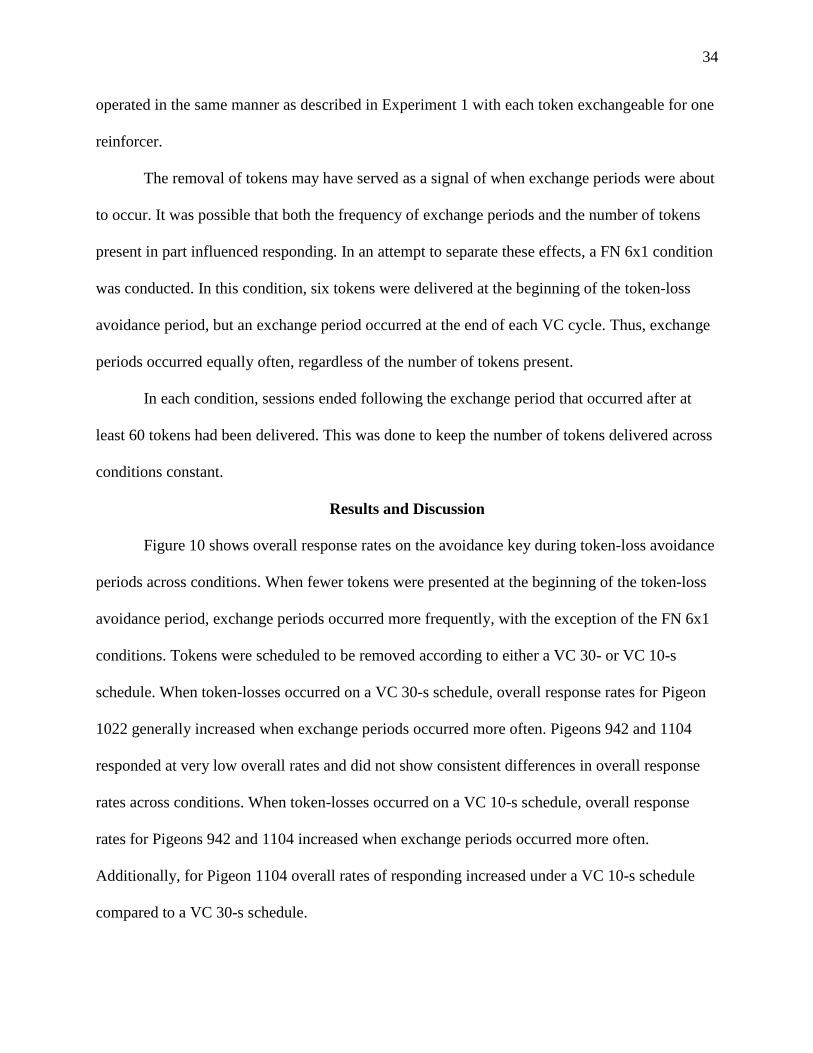
34
operated in the same manner as described in Experiment 1 with each token exchangeable for one
reinforcer.
The removal of tokens may have served as a signal of when exchange periods were about
to occur. It was possible that both the frequency of exchange periods and the number of tokens
present in part influenced responding. In an attempt to separate these effects, a FN 6x1 condition
was conducted. In this condition, six tokens were delivered at the beginning of the token-loss
avoidance period, but an exchange period occurred at the end of each VC cycle. Thus, exchange
periods occurred equally often, regardless of the number of tokens present.
In each condition, sessions ended following the exchange period that occurred after at
least 60 tokens had been delivered. This was done to keep the number of tokens delivered across
conditions constant.
Results and Discussion
Figure 10 shows overall response rates on the avoidance key during token-loss avoidance
periods across conditions. When fewer tokens were presented at the beginning of the token-loss
avoidance period, exchange periods occurred more frequently, with the exception of the FN 6x1
conditions. Tokens were scheduled to be removed according to either a VC 30- or VC 10-s
schedule. When token-losses occurred on a VC 30-s schedule, overall response rates for Pigeon
1022 generally increased when exchange periods occurred more often. Pigeons 942 and 1104
responded at very low overall rates and did not show consistent differences in overall response
rates across conditions. When token-losses occurred on a VC 10-s schedule, overall response
rates for Pigeons 942 and 1104 increased when exchange periods occurred more often.
Additionally, for Pigeon 1104 overall rates of responding increased under a VC 10-s schedule
compared to a VC 30-s schedule.

35
Changes in local response rates also were assessed as a function of the number of tokens
present to determine if proximity to the exchange period affected local response rates, as
described in Experiment 1 (Bullock & Hackenberg, 2006; Foster et al., 2001). Unlike Figures 5
and 6, Figures 11 and 12 include all responses emitted when a given number of tokens were
present. This was done because across conditions, a fixed number of tokens was given at the
beginning of each token-loss avoidance period, and, within a condition, the number of tokens
present only changed as tokens were lost. This allowed for comparisons of local responding
across conditions when tokens were first presented and as tokens were lost.
Figures 11 and 12 show average local response rates as a function of the number of
tokens present. Figure 11 shows the average local response rates from the last 5 sessions of each
condition. Figure 12 shows these results aggregated for each VC schedule and FN condition for
ease of comparison. Similar rates of responding occurred when 6, 4, and 2 tokens were presented
in the FN 6, 4, and 2 conditions, respectively. Within each condition, local response rates
increased as fewer tokens were present. Exceptions were the FN 6 condition for Pigeon 1022 and
the FN 6 condition for Pigeon 942 under the VC 10-s schedule, where response rates were
unchanged across the number of tokens present.
Figure 13 shows the percentage of scheduled token-losses canceled across conditions. For
Pigeon 942 there was little variation in this percentage under the VC 30-s schedule. Under the
VC 10-s schedule, the percentage of scheduled token-losses canceled was lower in the FN 6 and
FN 6x1 conditions compared to the FN 2 condition. For Pigeon 1104, the percentage of token-
losses canceled did not vary systematically across conditions under the VC 30-s schedule
conditions. Under the VC 10-s schedule conditions, a higher percentage of scheduled token
losses were canceled when exchange periods were more frequent. For Pigeon 1022, a higher
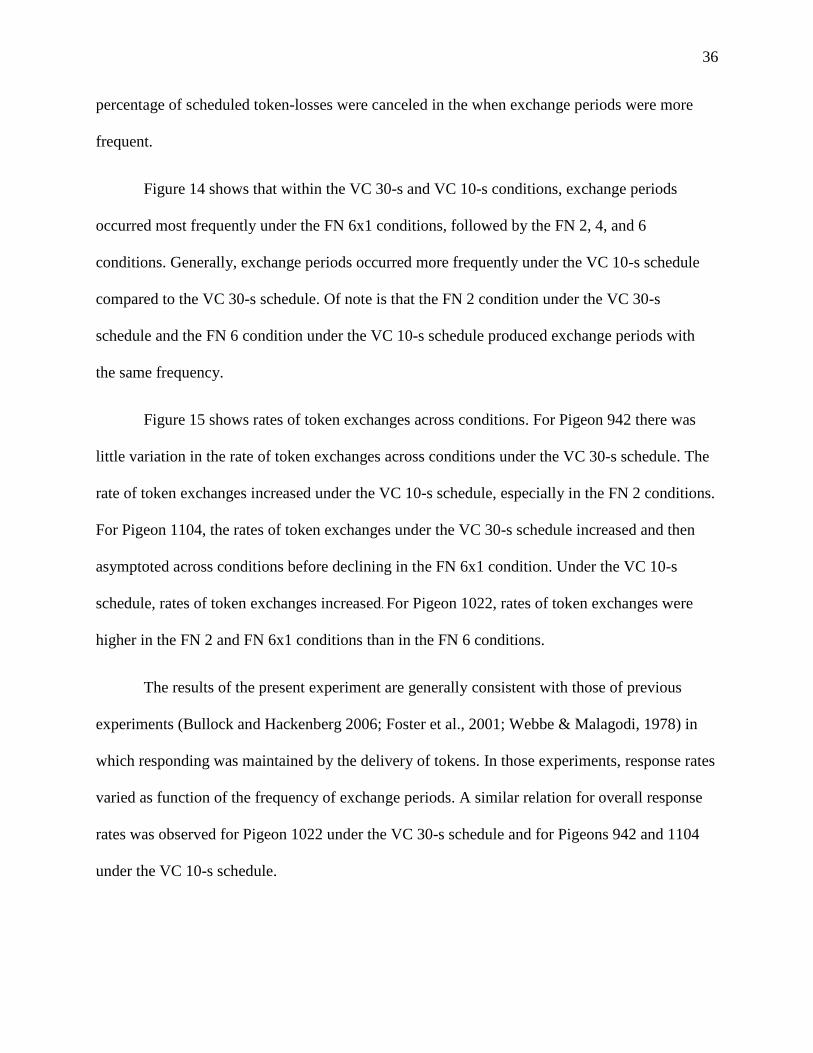
36
percentage of scheduled token-losses were canceled in the when exchange periods were more
frequent.
Figure 14 shows that within the VC 30-s and VC 10-s conditions, exchange periods
occurred most frequently under the FN 6x1 conditions, followed by the FN 2, 4, and 6
conditions. Generally, exchange periods occurred more frequently under the VC 10-s schedule
compared to the VC 30-s schedule. Of note is that the FN 2 condition under the VC 30-s
schedule and the FN 6 condition under the VC 10-s schedule produced exchange periods with
the same frequency.
Figure 15 shows rates of token exchanges across conditions. For Pigeon 942 there was
little variation in the rate of token exchanges across conditions under the VC 30-s schedule. The
rate of token exchanges increased under the VC 10-s schedule, especially in the FN 2 conditions.
For Pigeon 1104, the rates of token exchanges under the VC 30-s schedule increased and then
asymptoted across conditions before declining in the FN 6x1 condition. Under the VC 10-s
schedule, rates of token exchanges increased. For Pigeon 1022, rates of token exchanges were
higher in the FN 2 and FN 6x1 conditions than in the FN 6 conditions.
The results of the present experiment are generally consistent with those of previous
experiments (Bullock and Hackenberg 2006; Foster et al., 2001; Webbe & Malagodi, 1978) in
which responding was maintained by the delivery of tokens. In those experiments, response rates
varied as function of the frequency of exchange periods. A similar relation for overall response
rates was observed for Pigeon 1022 under the VC 30-s schedule and for Pigeons 942 and 1104
under the VC 10-s schedule.

37
Why this functional relation between overall response rates and frequency of exchange
periods was only observed for two pigeons under the VC 10-s schedule and not under the VC 30-
s schedule is unclear. All pigeons performed equally well under pretraining. Poor performance
on canceling scheduled token-losses may be a factor. The lower percentage of scheduled token-
losses and associated rate of token-exchanges under the VC 30-s schedule may account for
Pigeon 1104’s overall response rates. However, Pigeons 942 and 1022 canceled similar
percentages of scheduled-token losses (Fig. 13) and engaged in similar rates of token-exchanges
(Fig. 15) under the VC 30-s schedules, yet a functional relation between response rates and the
frequency of exchange periods under the VC 30-s schedule was only shown for Pigeon 1022.
Perhaps, under the current token-loss avoidance arrangements, the frequency of exchange
periods is not a particularly potent variable for affecting overall response rates and is only
effective under a narrow range of VC schedules. This range of effective VC schedules may vary
by individual subjects.
It is possible that overall response rates may affected by an interaction between the VC
schedule and frequency of exchange periods. Bullock and Hackenberg (2006) found an
interaction between token-production and exchange-production schedules. The highest rates of
responding occurred when tokens and exchange periods were most frequent. A possible
interaction between the frequency of scheduled token-losses and the frequency of exchange
periods in the present experiment can be evaluated by comparing the FN 2 condition under the
VC 30-s schedule and the FN 6 condition under the VC 10-s schedule in Figures 10 and 14 for
Pigeons 942 and 1104. The frequency of exchange periods was similar in both conditions (Fig.
14), but overall response rates were equal to or greater in the FN 6 condition under the VC 10-s
schedule (Fig 10). These results are similar to those obtained by Bullock and Hackenberg (2006)

38
when responding was maintained by the delivery of tokens. Future research may be conducted to
evaluate the possible interaction of the schedule of token-loss and frequency of exchange
periods.
Other similarities between this experiment and those in which responding was
maintained by the delivery of tokens were present the local response rates. In responding
maintained by token delivery, local response rates increased as a function of the number of
tokens present (Bullock & Hackenberg, 2006; Foster et al., 2001). Under certain conditions in
this experiment, local response rates were inversely related to the number of tokens present. In
both cases, local response rates increased with closer proximity to exchange periods and food.
Local response rates in this experiment may have increased when fewer tokens were present
because when fewer tokens were present may have signaled approaching exchange periods. If
this were the case, then local response rates across tokens present should be constant in the FN
6x1 conditions (i.e. a flat function), because exchange periods occur approximately every 10 or
30 s depending on the VC schedule in effect. A mostly flat function of local response rates was
observed only for Pigeon 942 in the FN 6x1 VC 10-s condition. Local response rates were higher
when fewer tokens were present for Pigeons 1104 and 1022 in the FN 6x1 VC 10-s and VC 30-s
conditions.
Local response rates in the FN 6x1 conditions may have been influenced by histories of
responding in other conditions where higher rates of responding occurred when fewer tokens
were present. Freeman and Lattal (1992) demonstrated that histories of reinforcement of
different response rates could influence responding in conditions where reinforcement
contingencies did not require specific response rates. Weiner (1969a) showed similar effects in
responding maintained by avoidance of point-loss. Tokens have been suggested to have both

39
reinforcing and discriminative or signaling properties (Bullock & Hackenberg, 2015;
Hackenberg, 2009; Mazur, 2014; Shahan, 2010). It is possible that the higher local response rates
in the FN 6x1 conditions when fewer tokens were present was influenced by a history of
responding in previous conditions when fewer tokens present were associated with impending
exchange periods. With extended time responding in the FN 6x1 condition, perhaps local
response rates across tokens present would more closely resemble those of Pigeon 942.
The percentage of scheduled-losses canceled varied across conditions in this experiment
(Fig. 13). These results are different from those of Experiment 1 (Fig. 7), which showed little
variation in the percentage of token-losses canceled across conditions. Perhaps the variability
observed in Experiment 2 was the result of delivering a fixed rather than a variable number of
tokens at the beginning of each token-loss avoidance period. Future research might compare
responding in these conditions more directly.
The frequency of token exchanges also varied across conditions in the present experiment
(Fig. 15). In comparing these results to Figure 10, response rates generally were higher in
conditions associated with more frequent token exchanges. Higher rates of token exchanges may
have contributed to increasing or maintaining overall response rates. These conditions also
happened to be those conditions with a greater frequency of exchange periods. Experiment 3
therefore was conducted to determine whether responding was affected by rates of food
deliveries following token exchanges by manipulating the token-exchange schedule.
Experiment 3
In this experiment, the third of the three variables described in the statement of the
problem, the token-exchange schedule, was investigated. Only Malagodi et al. (1975) has
previously examined the effect of the token-exchange schedule on responding maintained by

40
token delivery. In that study, response rates decreased as a function of the number of tokens
required to produce a single reinforcer. The third experiment was designed to assess the relation
between token-loss avoidance responding and the token-exchange schedule when the VC
schedule of token-loss avoidance and the frequency of exchange periods was held constant.
Subjects and Apparatus
Pigeons 267, 819, and 847 from Experiment 1 were used in this experiment. Maintenance
was as described in Experiment 1. The apparatus was as described in Experiment 1.
Procedure
Following Experiment 1, responding was reestablished and maintained on the VC 10-s
token-loss avoidance schedule described in Experiment 1 (detailed in Appendix A). The same
stability criteria described in Experiment 1 were used in this experiment.
Table 3 lists the order of conditions and the number of sessions conducted in each
condition. The effects of different token-exchange schedules on responding in the context of a
token-loss avoidance schedule were assessed across conditions. The token-exchange schedule
was manipulated by changing the token-to-reinforcer exchange ratio across conditions.
Token:reinforcer ratios of 1:1, 1:3, and 3:1initially were examined. The 1:3 condition was
selected because satiation was considered an issue that might decrease responding. When reliable
differences were not detected in the 1:3 or 3:1 conditions, ratios of 1:12 or 12:1 were used as
Malagodi et al. (1975) detected the greatest changes in responding in the 12:1 token-exchange
schedule.
In the 1:1 condition, each token that remained when an exchange period began was
exchangeable for a single 2.5-s period of access to food as in Experiments 1 and 2. In the 3:1 and
12:1 conditions, each peck of the exchange key exchanged the right-most token and turned off
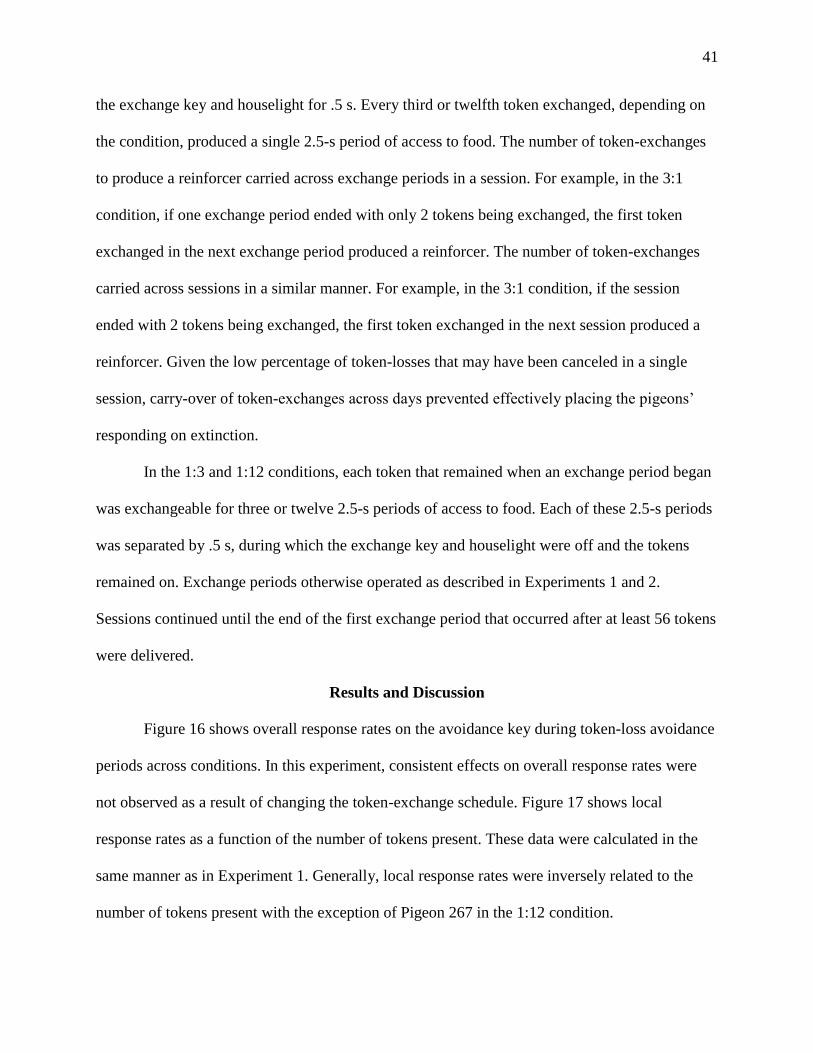
41
the exchange key and houselight for .5 s. Every third or twelfth token exchanged, depending on
the condition, produced a single 2.5-s period of access to food. The number of token-exchanges
to produce a reinforcer carried across exchange periods in a session. For example, in the 3:1
condition, if one exchange period ended with only 2 tokens being exchanged, the first token
exchanged in the next exchange period produced a reinforcer. The number of token-exchanges
carried across sessions in a similar manner. For example, in the 3:1 condition, if the session
ended with 2 tokens being exchanged, the first token exchanged in the next session produced a
reinforcer. Given the low percentage of token-losses that may have been canceled in a single
session, carry-over of token-exchanges across days prevented effectively placing the pigeons’
responding on extinction.
In the 1:3 and 1:12 conditions, each token that remained when an exchange period began
was exchangeable for three or twelve 2.5-s periods of access to food. Each of these 2.5-s periods
was separated by .5 s, during which the exchange key and houselight were off and the tokens
remained on. Exchange periods otherwise operated as described in Experiments 1 and 2.
Sessions continued until the end of the first exchange period that occurred after at least 56 tokens
were delivered.
Results and Discussion
Figure 16 shows overall response rates on the avoidance key during token-loss avoidance
periods across conditions. In this experiment, consistent effects on overall response rates were
not observed as a result of changing the token-exchange schedule. Figure 17 shows local
response rates as a function of the number of tokens present. These data were calculated in the
same manner as in Experiment 1. Generally, local response rates were inversely related to the
number of tokens present with the exception of Pigeon 267 in the 1:12 condition.
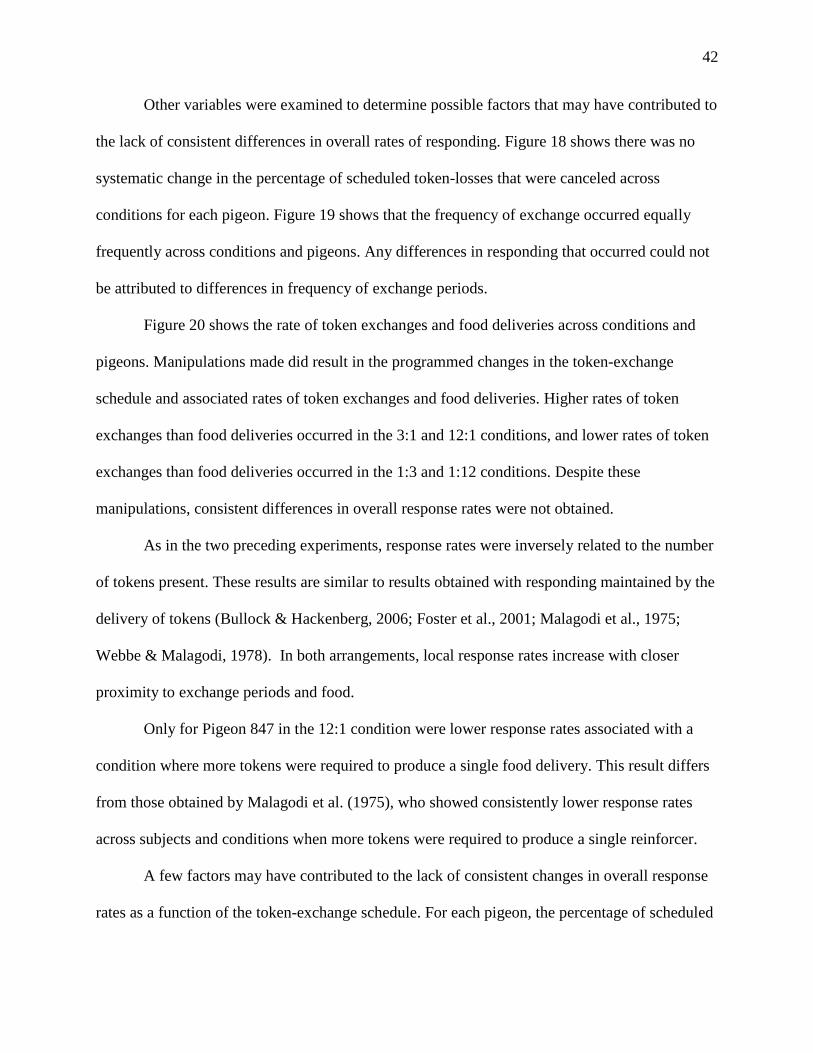
42
Other variables were examined to determine possible factors that may have contributed to
the lack of consistent differences in overall rates of responding. Figure 18 shows there was no
systematic change in the percentage of scheduled token-losses that were canceled across
conditions for each pigeon. Figure 19 shows that the frequency of exchange occurred equally
frequently across conditions and pigeons. Any differences in responding that occurred could not
be attributed to differences in frequency of exchange periods.
Figure 20 shows the rate of token exchanges and food deliveries across conditions and
pigeons. Manipulations made did result in the programmed changes in the token-exchange
schedule and associated rates of token exchanges and food deliveries. Higher rates of token
exchanges than food deliveries occurred in the 3:1 and 12:1 conditions, and lower rates of token
exchanges than food deliveries occurred in the 1:3 and 1:12 conditions. Despite these
manipulations, consistent differences in overall response rates were not obtained.
As in the two preceding experiments, response rates were inversely related to the number
of tokens present. These results are similar to results obtained with responding maintained by the
delivery of tokens (Bullock & Hackenberg, 2006; Foster et al., 2001; Malagodi et al., 1975;
Webbe & Malagodi, 1978). In both arrangements, local response rates increase with closer
proximity to exchange periods and food.
Only for Pigeon 847 in the 12:1 condition were lower response rates associated with a
condition where more tokens were required to produce a single food delivery. This result differs
from those obtained by Malagodi et al. (1975), who showed consistently lower response rates
across subjects and conditions when more tokens were required to produce a single reinforcer.
A few factors may have contributed to the lack of consistent changes in overall response
rates as a function of the token-exchange schedule. For each pigeon, the percentage of scheduled

43
token-losses canceled generally was less than 50%. It was found in Experiment 2 that increasing
the frequency of exchange periods increased overall response rates (Fig. 10) and the percentage
of token-losses canceled (Fig. 13). Perhaps more consistent or robust effects would have been
obtained if a greater percentage of token-losses were canceled.
In Malagodi et al.’s (1975) experiments, the responding of rats was maintained by the
delivery of manipulable tokens (marbles) on an FR 20 schedule. Exchange periods occurred on
either FR or FI exchange-production schedules. When the exchange period became available, the
rats were required to carry each token to a nearby receptacle to deposit enough tokens to produce
a food pellet. As the number of tokens that had to be deposited to produce a single food pellet
increased from 1 to 12, response rates declined. These systematic effects may have been
facilitated by the use of manipulable tokens. Moving multiple tokens into a separate receptacle
likely requires more physical effort and entails longer delays until food delivery as compared to
the exchange periods used in Experiment 3. In the present experiment, nonmanipulable tokens
were exchanged with a single key-peck. Another method of manipulating the token-exchange
schedule besides the ratio of tokens to food could involve manipulating the amount of
responding required to exchange a single token. Malagodi et al.’s (1975) rats had to engage in a
sequence of responses just to make an exchange (i.e., retrieve the marble, carry it to the
receptacle, then deposit it). Perhaps increasing the response requirement (e.g., from FR 1 to FR
10) to exchange each token would have produced more consistent differences in overall response
rates. Additionally, each exchange was followed by either food delivery (one or multiple) or all
the other stimuli that were paired with food delivery except for the raising of the hopper. The use
of all these stimuli may have had conditioned reinforcing effects that attenuated the effects of
changing the token-exchange schedule.

44
General Discussion
Across three experiments, nonmanipulable tokens were delivered to pigeons response-
independently. These tokens were scheduled to be removed on various VC schedules. If the
pigeons responded during a designated period, the upcoming scheduled token-loss was canceled.
After a number of cycles equal to the number of tokens delivered elapsed, an exchange period
began. In the exchange period, whatever tokens remained were exchangeable for food. Across
all experiments, responding was maintained in this negative-reinforcement-based token economy
by the avoidance of token-losses. Responding in positive-reinforcement-based token economies
is influenced by the token-production, exchange-production, and token-exchange schedules.
Similar components of this negative-reinforcement token economy were manipulated in three
experiments: the frequency of scheduled token-losses, the frequency of exchange periods, and
the token-exchange schedule. In Experiment 1, a functional relation was demonstrated between
the rate of responding and frequency of scheduled token-losses. In Experiment 2, a functional
relation was demonstrated between the rate of responding and the frequency of exchange
periods. In Experiment 3, a consistent relation between the rate of responding and the ratio of
tokens to food was not demonstrated, but several procedural factors may have contributed to this
outcome.
Across all three experiments, an inverse functional relation was observed between the
number of tokens present and the rate of responding. These results are similar to those found in
previous research that examined responding maintained by token delivery across token-
production segments (Hackenberg, 2009; Bullock & Hackenberg, 2015). In those experiments,
response rates tended to increase as each successive token was produced. Each token produced
thus functioned like a link in a chain schedule, signaling the approaching exchange period and

45
primary reinforcer delivery (Bullock & Hackenberg 2006; Foster et al., 2001). In the reverse-
chain token economy Bullock & Hackenberg (2015) used in their second experiment, response
rates increased with the removal of each token, signaling the approaching exchange period. In
the present series of experiments, response rates tended to increase when fewer tokens were
present, as fewer tokens being present was associated with exchange periods being closer in
time. What follows is a discussion of the results describe above, how well they align with those
of previous experiments on responding maintained by token schedules of reinforcement, and the
limitations of these experiments.
Limitations
The use of these or similar methods used in these experiments may facilitate further
inquiry into factors that affect responding maintained by the avoidance of token-loss and
aversive control generally (Critchfield & Rasmussen, 2007). That said, further refinement of
these methods would be beneficial. For example, response rates generally were low across
experiments. This is common in avoidance procedures (Courtney & Perone, 1992; DeFulio &
Hackenberg, 2007; Richardson & Baron, 2008). For example, differences as a function of
frequency of exchange periods were found in Experiment 2, but very low response rates under
the VC 30-s schedule made detecting any consistent differences difficult for Pigeons 942 and
1104.
There are ways to increase response rates in a token-loss avoidance arrangement.
Scheduling token-losses more frequently likely would increase overall response rates
(Experiment 1). However, under the current arrangement, when token losses were scheduled to
occur more frequently, exchange periods also became more frequent. These concurrent changes
make evaluating the individual contribution and possible interaction of VC schedules and

46
frequency of exchange periods to overall response rates difficult. A more thorough assessment of
responding across a range of VC schedules and frequency of exchange periods may provide
additional information useful in controlling behavior with negative-reinforcement-based token
reinforcement.
Although all pigeons canceled greater than 80% of scheduled token-losses on average
across the last three sessions of pretraining in Experiments 1 and 2, their performance generally
declined in each experiment. This decline may have contributed to the inconsistent effects in
Experiment 3 and under the VC 30-s schedule in Experiment 2. Changes in responding in part
may have been the result of low overall rates of primary reinforcement. Canceling a greater
percentage of token-losses in Experiment 3 would have led to more frequent token exchanges.
This would have increased the pigeon’s contact with the changes in the token-exchange schedule
and perhaps would have affected overall response rates.
There may be ways to increase overall rates of responding and the percentage of
scheduled token-losses canceled in the current token-loss avoidance arrangement, for example by
making the VC schedule of token-losses more frequent and increasing the frequency of exchange
periods. However, this may mean having to work within a relatively narrow range of schedule
parameters. Although this may limit the range of schedule values that can be assessed, consistent
effects can still be observed as a function of manipulating schedule values within this narrow
range. Reliable differences in responding occurred across VC schedules with an average duration
of 10-90 s. This is not much different from the methods of Magoon and Critchfield (2008), who
used VC schedules with an average duration of 11-100 s. Other research with pigeons
responding on token economies (Foster et al., 2001; Foster & Hackenberg, 2004; Bullock &

47
Hackenberg, 2006) produced reliable and robust effects across a small range of exchange-
production schedules (FR or VR 2-8).
Functions of Tokens in the Current Token-Loss Avoidance Arrangement
Tokens generally are conceptualized as conditioned reinforcers that acquire their
reinforcing properties through repeated and reliable pairings with primary reinforcers
(Hackenberg, 2009). Tokens also may have discriminative and eliciting functions as their
accumulation may signal approaching opportunities for exchange for other reinforcers (Baum,
2012; Bullock & Hackenberg, 2015; Shahan, 2010). Separating the conditioned reinforcing and
discriminative/eliciting aspects of stimuli may not be entirely possible, but numerous methods
attempting to do so have been investigated (Bullock & Hackenberg, 2015; Royalty, Williams, &
Fantino, 1987; Williams 1994a, 1994b). Responding was maintained across the present series of
experiments, but what the precise function of the tokens in the present series of experiments were
is not clear.
There is some supporting evidence for possible conditioned reinforcing functions of the
tokens in the present series of experiments. In Experiment 1, response rates changed as function
of scheduled token-loss frequency. These results are similar to those of Magoon and Critchfield
(2008), in which humans responded to avoid money-losses (i.e., token-losses, generalized
conditioned reinforcer-losses) and response rates changed as a function of scheduled money-
losses. The results of the present series of experiments also are similar to those obtained in
experiments where responding of nonhuman animals is maintained by token delivery. In those
experiments (Bullock & Hackenberg, 2006; Kelleher, 1958), response rates changed as a
function of the frequency of token delivery. In all the experiments described in this paragraph,

48
the consequence of responding and the putative reinforcer that maintained responding was token-
delivery or avoidance of token-loss.
Another effect of and a major advantage of using tokens as conditioned reinforcers is that
they can be used in the acquisition of new behavior (DeLeon et al., 2013; Hackenberg, 2009;
Kazdin & Bootzin, 1972). After chimpanzees learned to discriminate food-paired tokens from
nonfood-paired tokens, food-paired tokens were used as reinforcers for performance on a variety
of different tasks (Cowles, 1937; Wolfe, 1936; Zimmerman, 1957). Appendix B describes a pilot
study with a single pigeon with a history of responding in a token-loss avoidance arrangement. In
one component of a two-component multiple schedule, responding on the left key resulted in the
avoidance of scheduled token-losses on a VC 10-s schedule. In the other component, responding
on the right key, a response that had not been reinforced in the past, resulted in the delivery of
tokens on a VC 10-s schedule. Responding on the key associated with token-delivery was
maintained at slightly lower rates than responding on the key associated with avoidance of token-
losses. Response-dependent delivery of the food-paired tokens used in the present series of
experiments functioned to reinforce and maintain a new response. This may indicate the possible
conditioned reinforcing properties of the tokens used in the present series of experiments.
There is some supporting evidence for possible discriminative functions of the tokens in
the present series of experiments. Across all three experiments, there was an inverse functional
relation between local response rates and the number of tokens present. In the present series of
experiments, the fewer tokens present, the closer in time exchange periods and food were. In
previous experiments in which the responding of nonhuman animals was maintained by token
delivery, local response rates increased as more tokens were produced (Foster et al, 2001;
Bullock & Hackenberg, 2006). As more tokens were produced, the closer in time exchange

49
periods and food were. Bullock and Hackenberg (2015) found an inverse relation between the
number of tokens present and local response rates in their reverse-chain schedule arrangement.
Bullock and Hackenberg (2015) did not find these changes in local response rates when
responding across token-production segments in token economies were compared to equivalent
sections in tandem schedules. In all of these experiments, the number of tokens present served a
discriminative function that signaled the temporal proximity of exchange periods and food.
Regardless of how tokens were delivered or whether positive- or negative-reinforcement
contingences were arranged, local response rates increased when the number of tokens signaled
that exchange periods and food delivery were closer in time.
Further evidence of the discriminative function of the tokens was provided by the results
described in Appendix A. Appendix A details a brief series of manipulations that showed the
response-independent cancellation of scheduled token-losses and the stimuli associated with
token exchange (without food delivery) were sufficient to reinstate responding. The pattern of
faster responding when fewer tokens were present was also reinstated even though responding
had no effect. The tokens and the stimuli that accompanied their exchange likely had
discriminative functions that occasioned these patterns of responding. This is much like how the
response-independent delivery of food will reinstate patterns of responding previously
maintained by food (Franks & Lattal, 1972). When food was reintroduced, responding increased
further. When a VC 10-s schedule of token-loss avoidance was reimplemented, responding
increased or was maintained at the current levels despite decreases in the rate of food deliveries.
The response-dependent avoidance of token-loss served to increase responding, possibly as a
result of a reinforcing function of avoidance of token-loss.

50
Negative Reinforcement
The results from Experiments 1 and 2 are similar to previous research where responding
maintained by negative reinforcement contingencies was investigated. The results from
Experiment 1 are similar to previous experiments with the responding of nonhuman animals
maintained by shock-avoidance (Courtney & Perone, 1992; de Villiers, 1972, 1974) and
avoidance of timeout from positive reinforcement, (DeFulio & Hackenberg, 2007), and the
responding of humans maintained by avoidance of point- or money-loss (Higgins & Morris,
1984; Magoon & Critchfield, 2008; Weiner, 1969a). In each of the studies cited, a direct relation
between rate of responding and frequency of scheduled aversive events was demonstrated. The
results from Experiment 2 are similar to those of Richardson and Baron (2008) who
demonstrated a direct functional relation between rate of responding maintained by avoidance of
time-out from food delivery and the frequency of food delivery. In both experiments, the
functional relations described above were extended to the responding of pigeons maintained by
the avoidance of token-loss.
The number of tokens may function to stimuli used in a signaled avoidance task (de
Moreaes, & Todorov, 1977; Higgins & Morris, 1984; DeFulio & Hackenberg, 2007). In clock
schedules, a kind of signaled avoidance task (Baron & Galizio, 1976; Field & Boren, 1963;
Grabowski & Thompson, 1971), clock stimuli are arranged that sequentially time down (e.g., the
rightmost of a string of lights is turned off) to the occurrence of an aversive event (e.g., electric
shock or timeout from positive reinforcement). In clock schedules, the majority of responding
tends to occur in the segment of time just before the aversive event occurs. Responding results in
the clock stimuli resetting to the stimulus arrangement that is associated with the time furthest

51
from the aversive event. This resetting of the clock stimuli signals the avoidance of the aversive
event and may function as a conditioned reinforcer (Higgins & Morris, 1984).
In the present series of experiments, local response rates were highest when only one
token was present. When only one token was present served as a signal for the segment of time
just before the exchange period occurred. If no responding occurred during the token-loss
avoidance period up to that point, no token-losses would be canceled and no tokens could be
exchanged for food until the next scheduled exchange period. It is possible that responding was
maintained in part by avoiding a time-out from or delay to positive reinforcement (DeFulio &
Hackenberg, 2007; Richardson & Baron, 2008) and the number of tokens present could function
like clock stimuli, signaling the approach of a time-out.
However, although the number of tokens could serve to signal the approach of the
exchange period, they did not function exactly like clock stimuli. Responding in the present
series of experiments did not produce a programmed stimulus change and the associated
conditioned reinforcement that may accompany the cancellation of a scheduled token-loss.
Additionally responding canceled scheduled token-losses, leaving more tokens present even as
the exchange period continued to approach. More tokens present when the exchange period
occurred would degrade any association between the number of tokens present and occurrence of
the exchange period.
Basic Research/Theoretical Implications. Token-production functions as a reinforcer
and token-loss functions as a punisher for both humans and nonhuman animals (Hackenberg,
2009; Pietras et al., 2010; Rasmussen & Newland, 2008). Token-loss avoidance has been shown
to function as a reinforcer for humans (Magoon & Critchfield, 2008) in past research but not for
nonhuman animals. The responding of pigeons was maintained by token-loss avoidance in the

52
present series of experiments, demonstrating cross-species generality of such behavior.
Demonstrating cross-species generality of responding maintained in token schedules of
reinforcement is relevant because this illustrates that human behavior and nonhuman behavior
are the result of similar basic behavioral processes (Hackenberg, 2009; Higgins & Morris, 1984).
Previous research in which the responding of nonhuman animals was maintained on token
schedules of reinforcement has provided information about the various parameters that affect
responding in a token economy (Hackenberg, 2009). Understanding these parameters and
conducting further research on behavior maintained by token delivery or token-loss avoidance
with nonhuman animals may provide additional information the basic behavioral processes
associated with responding maintained by the production of appetitive events, the avoidance of
aversive events, and how those contingencies may interact.
Additionally, this work may provide a method for future research focused on examining
the effects of equivalent gains and losses on behavior, thereby allowing further assessment of the
symmetry of the law of effect. A symmetrical law of effect assumes that equivalent losses and
gains have equivalent effects on behavior. If this were the case, then an organism ought to
respond equally as much in a token-loss avoidance arrangement as in a token-production
arrangement. Another perspective, loss-aversion (Kahnemann & Tversky, 1979, 2000), supposes
that losses exert greater control over behavior than equivalent gains. If this were the case, then an
organism ought to respond more in a token-loss avoidance arrangement than in a token-
production arrangement. In the operant literature, the results of some experiments support a
symmetrical law of effect (Iwata & Bailey, 1974; Magoon & Critchfield, 2008) and others
support loss-aversion (Donaldson et al., 2014; Rasmussen & Newland, 2008). Loss aversion is
well documented in humans (Baumeister, Bratslavsky, Finkenauer, & Vohs, 2001; Kahneman &

53
Tversky, 1979, 2000; McGraw, Larsen, Kahneman, & Schkade, 2010; Yechiam & Hochman,
2013), but has not been demonstrated in nonhuman animals (Silberberg et al., 2008). Future
research may use this method to examine loss aversion in nonhuman animals and determine
whether it is a basic behavioral process found in multiple species or perhaps something unique to
humans (Chen et al., 2006; Silberberg et al., 2008).
Pilot work for such a potential examination is detailed in Appendix B. In this pilot study,
the responding of a pigeon with previous experience responding in a token-loss avoidance
arrangement was examined in a two-component multiple schedule. Responding in one
component canceled scheduled token-losses on a VC 10-s schedule. Responding in the other
component delivered tokens on a VC 10-s schedule. After 15 sessions of responding under the
multiple schedules, slightly higher rates of responding occurred in the component associated
with token-loss avoidance than in the component associated with token-delivery on an equivalent
VC schedule. Although these results would be in line with predictions based on loss-aversion,
further investigation is required to assess how much of the differences in response rates may the
result of side bias or the pigeon’s history of responding under the token-loss avoidance
arrangement.
Similarities between responding on the two components of the multiple schedule can be
seen when local response rates are examined. In Figure B2, there is functional relation between
the number of tokens present and rate of responding when responding is maintained by token
delivery. There is also an inverse functional relation between the number of tokens present and
rate of responding when responding is maintained by token-loss avoidance. In both components,
higher rates of responding occur as time to the exchange period approaches as signaled by the

54
number of tokens present. These results provide some evidence for similar processes operating in
both positive- and negative-reinforcement-based token economies.
Conclusions
Token schedules of reinforcement have long been an object of study in the experimental
analysis of behavior and its application. Previous research with human and nonhuman animals
has demonstrated that the response-dependent delivery and removal of tokens functioned as
appetitive and aversive events, respectively. Laboratory research with nonhuman animals has
provided more data about the parameters of token economies (i.e., token-production, exchange-
production, and token-exchange schedules) that influence responding maintained by token
delivery and the conditioned reinforcing and discriminative functions tokens serve in those
arrangements (Bullock & Hackenberg, 2015; Hackenberg, 2009). The experimental analysis of
behavior has long been served by demonstrating cross-species generality of basic behavioral
processes (Higgins & Morris, 1984). The body of research on token schedules of reinforcement
has shown that the basic processes that underlie common contingencies used to govern human
behavior can be modeled and examined in the laboratory. Previously, responding maintained by
the avoidance of token-losses had only been demonstrated in humans. The present series of
experiments demonstrates that the responding of pigeons also can be maintained by the
avoidance of token-losses.
The methods used in the present series of experiments already have demonstrated some
of the parameters that influence responding in a token-loss avoidance arrangement (i.e.,
frequency of scheduled token-losses and exchange periods). These results extend and replicate
the findings of previous research with the responding of humans maintained by avoidance of
point- or money-loss (Magoon & Critchfield, 2008) and the responding of nonhuman animals
55
maintained by shock avoidance (de Villiers, 1972, 1974; Higgins & Morris, 1984) to the
responding of pigeons maintained by token-loss avoidance. Similar basic behavioral processes
may be involved in maintaining responding in all of the experiments just mentioned. Although
further refinement of the methods used in the present series of experiments may be necessary,
these methods allow for further examination of factors that influence responding maintained by
the avoidance of token-losses (e.g., the token-exchange schedule) and the possible functions
those tokens serve.
The results and methods of the present series of experiments may inform future basic
research aimed at examining a number of theoretical issues. The methods used here describe one
manner of establishing responding maintained by token-loss avoidance in pigeons. Previous
research describes how to establish responding maintained by the delivery of tokens in pigeons
(Hackenberg, 2009). Knowing the factors affecting behavior maintained by avoidance of token-
loss and the delivery of tokens may allow for further investigation of the symmetrical law of
effect, loss aversion, possible interactions of responding maintained by concurrent positive and
negative reinforcement contingencies, and can inform future applications of token schedules of
reinforcement.

56
References
Anger, D. (1963). The role of temporal discriminations in the reinforcement of Sidman
avoidance behavior. Journal of the Experimental Analysis of Behavior, 6, 477-506.
Ayllon, T., & Azrin, N. H. (1968). The token economy: A motivational system for therapy and
rehabilitation. New York: Appleton-Century-Crofts.
Azrin, N. H., & Holz, W. C. (1966). Punishment. In W. K. Honig (Ed.), Operant behavior:
Areas of research and applications (pp. 380-447). East Norwalk, CT: Appleton-Century-
Crofts.
Baron, A., & Galizio, M. (1976). Clock control of human performance on avoidance and fixed-
interval schedules. Journal of the Experimental Analysis of Behavior, 26, 165-180.
Baum, W. M. (2012). Rethinking reinforcement: Allocation, induction, and contingency. Journal
of the Experimental Analysis of Behavior, 97, 101-124.
Baumeister, R. F., Bratslavsky, E., Finkenauer, C., & Vohs, K. D. (2001). Bad is stronger than
good. Review of General Psychology, 5(4), 323-370.
Becraft, J. L., & Rolider, N. U. (2015). Reinforcer variation in a token economy. Behavioral
Interventions. Advance online publication. Doi: 10.1002/bin.1401
Brosnan, S. F., Jones, O. D., Lamberth, S. P., Mareno, C., Richardson, A. S., & Schapiro, S. J.
(2007). Endowment effect in chimpanzees. Current Biology, 17, 1704-1707.
Bullock, C. E., & Hackenberg, T. D. (2006). Second-order schedules of token reinforcement
with pigeons: Implications for unit price. Journal of the Experimental Analysis of
Behavior, 85, 95-106.
Bullock, C. E., & Hackenberg, T. D. (2015). The several roles of stimuli in token reinforcement.
Journal of the Experimental Analysis of Behavior, 103, 269-287.

57
Byron, M. A., Shimoff, E., Catania, C. A., & Sagvolden, T. (1977). Uninstructed human
responding: Sensitivity to ratio and interval contingencies. Journal of the Experimental
Analysis of Behavior, 27, 453-467.
Capriotti, M. R., Brandt, B. C., Ricketts, E. J., Espil, F. M., & Woods, D. W. (2012). Comparing
the effects of differential reinforcement of other behavior and response-cost
contingencies on tics in youth with Tourette syndrome. Journal of Applied Behavior
Analysis, 45, 251-263.
Catania, A. C. (2007). Learning (4th ed.). Cornwall-on-Hudson, NY: Sloan Publishing.
Chen, M. K., Lakshminarayanan, V., & Santos, L. R. (2006). How basic are behavioral biases?
Evidence from Capuchin monkeys trading behavior. Journal of Political Economy, 114,
517-537.
Conyers, C., Miltenberger, R., Maki, A., Barenz, R., Jurgens, M., Sailer, A.,…Koff, B. (2004). A
comparison of response cost and differential reinforcement of other behavior to reduce
disruptive behavior in a preschool classroom. Journal of Applied Behavior Analysis, 37,
411-415.
Cowles, J. T. (1937). Food-tokens as incentives for learning by chimpanzees. Comparative
Psychological Monographs, 12, 1-96.
Courtney, K., & Perone, M. (1992). Reductions in shock frequency and response effort as factors
in reinforcement by timeout from avoidance. Journal of the Experimental Analysis of
Behavior, 58, 485-496.
Critchfield, T. S., Paletz, E. M., Macaleese, K. R., & Newland, M. C. (2003). Punishment in
human choice: Direct or competitive suppression? Journal of the Experimental Analysis
of Behavior, 80, 1-27.

58
Critchfield, T. S., & Rasmussen, E. R. (2007). It’s aversive to have an incomplete science of
behavior. Mexican Journal of Behavior Analysis, 33, 1-5.
Davison, M., & Baum, W. M. (2006). Do conditional reinforcers count? Journal of the
Experimental Analysis of Behavior, 86, 269-283.
de Moraes, A. B., & Todorov, J. C. (1977). Signaled free-operant avoidance of shock by pigeons
pecking a key. Journal of the Experimental Analysis of Behavior, 27, 281-291.
de Villiers, P. A. (1972). Reinforcement and response rate interaction in multiple random-
interval avoidance schedules. Journal of the Experimental Analysis of Behavior, 18, 499-
507.
de Villiers, P. A. (1974). The law of effect and avoidance: A quantitative relationship between
response rate and shock-frequency reduction. Journal of the Experimental Analysis of
Behavior, 21, 223-235.
de Villiers, P. A. (1980). Toward a quantitative theory of punishment. Journal of the
Experimental Analysis of Behavior, 33, 15-25.
DeFulio, A., & Hackenberg, T. D. (2007). Discriminated timeout avoidance in pigeons: The
roles of added stimuli. Journal of the Experimental Analysis of Behavior, 88, 51-71.
DeFulio, A., Yankelevitz, R., Bullock, C., & Hackenberg, T. D. (2014). Generalized conditioned
reinforcement with pigeons in a token economy. Journal of the Experimental Analysis of
Behavior, 102, 26-46.
DeLeon, I. G., Bullock, C. E., & Catania, A. C. (2013). Arranging reinforcement contingencies
in applied settings: Fundamentals and implications of recent basic and applied research.
In G. J. Madden (Ed.) APA handbook of behavior analysis (Volume 1, pp. 483-512).
Washington, D. C.: American Psychological Association.

59
DeLeon, I. G., Chase, J. A., Frank-Crawford, M. A., Carreau-Webster, A. B., Triggs, M. M.,
Bullock, C. E., & Jennett, H. K. (2014). Distributed and accumulated reinforcement
arrangements: Evaluations of efficacy and preference. Journal of Applied Behavior
Analysis, 47, 293-313.
Dickerson, F. B., Tenhula, W. N., & Green-Paden, L. D. (2005). The token economy for
schizophrenia: Review of the literature and recommendations for future research.
Schizophrenia Research, 75(2-3), 405-416.
Donaldson, J. M., DeLeon, I. G., Fisher, A. B., & Kahng, S. (2014). Effects of and preference for
conditions of token earn versus token loss. Journal of Applied Behavior Analysis, 47,
537-548.
Ferster, C. B., & Skinner, B. F. (1957). Schedules of reinforcement. Acton, MA: Copley
Publishing Group.
Field, G. G., & Boren, J. J. (1963). An adjusting avoidance procedure with multiple auditory and
visual warning stimuli. Journal of the Experimental Analysis of Behavior, 6, 537-543.
Fleshler, M., & Hoffman, H. S. (1962). A progression for generating variable-interval schedules.
Journal of the Experimental Analysis of Behavior, 5(4), 529-530.
Foster, T. A., & Hackenberg, T. D. (2004). Unit price and choice in a token-reinforcement
context. Journal of the Experimental Analysis of Behavior, 81, 5-25.
Foster, T. A., Hackenberg, T. D., & Vaidya, M. (2001). Second-order schedules of token
reinforcement with pigeons: Effects of fixed- and variable-ratio exchange schedules.
Journal of the Experimental Analysis of Behavior, 76, 159-178.

60
Fox, D. K., Hopkins, B. L., & Anger, W. K. (1987). The long-term effects of a token economy
on safety performance in open-pit mining. Journal of Applied Behavior Analysis, 20,
215-224.
Franks, G. J., & Lattal, K. A. (1976). Antecedent reinforcement schedule training and operant
response reinstatement in rats. Animal Learning & Behavior, 4(4), 374-378.
Freeman, T. J., & Lattal, K. A. (1992). Stimulus control of behavioral history. Journal of the
Experimental Analysis of Behavior, 57, 5-15.
Grabowski, J., & Thompson, T. (1971). Response patterning on an avoidance schedule as a
function of time-correlated stimuli. Journal of the Experimental Analyiss of Behavior, 18,
525-534.
Hackenberg. T. D. (2009). Token reinforcement: A review and analysis. Journal of the
Experimental Analysis of Behavior, 91, 257-286.
Harbaugh, W. T., Krause, K., & Berry, T. R. (2001). GARP for kids: On the development of
rational choice behavior. American Economic Review, 91, 1539-1545.
Harbaugh, W. T., Krause, K., & Vesterlund, L. (2001). Are adults better behaved than children?
Age, experience, and the endowment effect. Economic Letters, 70, 175-181.
Higgins, S. T., & Morris, E. K. (1984). Generality of free-operant avoidance conditioning to
human behavior. Psychological Bulletin, 96(2), 247-272.
Iwata, B. A., & Bailey, J. S. (1974). Reward versus cost token systems: An analysis of the effects
on students and teacher. Journal of Applied Behavior Analysis, 7, 567-576.
Jackson, K., & Hackenberg, T. D. (1996). Token reinforcement, choice, and self-control in
pigeons. Journal of the Experimental Analysis of Behavior, 66, 29-49.
61
Jwaideh, A. R. (1973). Responding under chained and tandem fixed-ratio schedules. Journal of
the Experimental Analysis of Behavior, 19, 259-267.
Kahneman, D., & Tversky, A. (1979). Prospect theory: An analysis of decisions under risk.
Econometrica, 47, 263-291.
Kahneman, D., & Tversky, A. (Eds.) (2000). Choices, values, and frames. New York:
Cambridge University Press.
Kahng, S. W., Boscoe, J. H., & Byrne, S. (2003). The use of an escape contingency and a token
economy to increase food acceptance. Journal of Applied Behavior Analysis, 36, 349-
353.
Kazdin, A. E. (1982). The token economy: A decade later. Journal of Applied Behavior Analysis,
15, 431-445.
Kazdin, A. E., & Bootzin, R. R. (1972). The token economy: An evaluative review. Journal of
Applied Behavior Analysis, 5, 343-372.
Kelleher, R. T. (1956). Intermittent conditioned reinforcement in chimpanzees. Science, 124,
679-680.
Kelleher, R. T. (1958). Fixed-ratio schedules of conditioned reinforcement with chimpanzees.
Journal of the Experimental Analysis of Behavior, 1, 281-289.
King, G. R., & Logue, A. W. (1990). Humans’ sensitivity to variation in reinforcer amount:
Effects of the method of reinforcer delivery. Journal of the Experimental Analysis of
Behavior, 53, 33-45.
Lieberman, D. A., Davidson, F. H., & Thomas, G. V. (1985). Marking in pigeons: The role of
memory in delayed reinforcement. Journal of Experimental Psychology: Animal
Behavior Processes, 11, 611-624.

62
Lippman, M. R., & Motta, R. W. (1993). Effects of positive and negative reinforcement on daily
living skills in chronic psychiatric patients in community residences. Journal of Clinical
Psychology, 49, 654-662.
Logue, A. W., & de Villiers, P. A. (1978). Matching concurrent variable-interval avoidance
schedules. Journal of the Experimental Analysis of Behavior, 29, 61-66.
Maggin, D. M., Chafouleas, S. M., Goddard, K. M., & Johnson, A. H. (2011). A systematic
evaluation of token economies as a classroom management tool for students with
challenging behavior. Journal of School Psychology, 49(5), 529-554.
Magoon, M. A., & Critchfield, T. S. (2008). Concurrent schedules of positive and negative
reinforcement: Differential-impact and differential-outcomes hypotheses. Journal of the
Experimental Analysis of Behavior, 90, 1-22.
Malagodi, E. F. (1967a). Acquisition of the token-reward habit in the rat. Psychological Reports,
20, 1335-1342.
Malagodi, E. F. (1967b). Fixed-ratio schedules of token reinforcement. Psychonomic Science, 8,
469-470.
Malagodi, E. F. (1967c). Variable-interval schedules of token reinforcement. Psychonomic
Science, 8, 471-472.
Malagodi, E. F., Webbe, F. M., & Waddell, T. R. (1975). Second-order schedules of token
reinforcement: Effects of varying the schedule of food presentation. Journal of the
Experimental Analysis of Behavior, 24, 173-181.
Matson, J. L., & Biosjoli, J. A. (2009). The token economy for children with intellectual
disability and/or autism: A review. Research in Developmental Disabilities, 30(2), 240-
248.

63
Mazur, J. E. (2014). Rats’ choices with token stimuli in concurrent variable-interval schedules.
Journal of the Experimental Analysis of Behavior, 102, 198-212.
McGraw, A. P., Larsen, J. T., Kahneman, D., & Schkade, D. (2010). Comparing gains and
losses. Psychological Science, 21, 1438-1445.
Milan, M. A., & McKee, J. M. (1976). The cellblock token economy: Token reinforcement
procedures in a maximum security correctional institution for adult male felons. Journal
of Applied Behavior Analysis, 9, 253-275.
Moher, C. A., Gould, D. D., Hegg, E., & Mahoney, A. M. (2008). Non-generalized and
generalized conditioned reinforcers: Establishment and validation. Behavioral
Interventions, 23, 13-38.
Pelé, M. Broihanne, M. H., Thierry, B., Call, J., & Dufour, V. (2014). To bet or not to bet?
Decision-making under risk in non-human primates. Journal of Risk and Uncertainty,
49(2), 141-166.
Phillips, E. L. (1968). Achievement place: Token reinforcement procedures in a home-style
rehabilitation setting for “pre-delinquent” boys. Journal of Applied Behavior Analysis, 1,
213-223.
Phillips, E. L., Phillips, E. A., Fixsen, D. L., & Wolf, M. M. (1971). Achievement place:
Modification of the behaviors of pre-delinquent boys within a token economy. Journal of
Applied Behavior Analysis, 4, 45-59.
Pietras, C. J., Brandt, A. E., & Searcy, G. D. (2010). Human responding on random-interval
schedules of response-cost punishment: The role of reduced reinforcement density.
Journal of the Experimental Analysis of Behavior, 93, 5-26.

64
Pietras, C. J., & Hackenberg, T. D. (2005). Response-cost punishment via token loss with
pigeons. Behavioural Processes, 69, 343-356.
Raiff, B. R., Bullock, C. E., & Hackenberg, T. D. (2008). Response-cost punishment with
pigeons: Further evidence of response suppression via token loss. Learning & Behavior,
36 (1), 29-41.
Rasmussen, E. B., & Newland, M. C. (2008). Asymmetry of reinforcement and punishment in
human choice. Journal of the Experimental Analysis of Behavior, 89, 157-167.
Reid, R. L. (1958). The role of the reinforcer as a stimulus. British Journal of Psychology, 49,
202-209.
Rescorla, R. A. (1982). Effect of a stimulus intervening between CS and US in autoshaping.
Journal of the Experimental Psychology: Animal Behavior Processes, 8, 131-141.
Ricci, J. A. (1973). Key pecking under response-independent food presentation after long simple
and compound stimuli. Journal of the Experimental Analysis of Behavior, 19, 509-516.
Richardson, J. V., & Baron, A. (2008). Avoidance of timeout from response-independent food:
Effects of delivery rate and quality. Journal of the Experimental Analysis of Behavior, 89,
169-181.
Royalty, P., Williams, B. A., & Fantino, E. (1987). Effects of delayed conditioned reinforcement
in chain schedules. Journal of the Experimental Analysis of Behavior, 47, 41-56.
Shahan, T. A. (2010). Conditioned reinforcement and response strength. Journal of the
Experimental Analysis of Behavior, 93, 269-289.
Silberberg, A., Roma, P. G., Huntsberry, M. E., Warren-Boulton, F. R., Sakagami, T., Ruggiero,
A. M., & Suomi, S. J. (2008). On loss aversion in capuchin monkeys. Journal of the
Experimental Analysis of Behavior, 89, 145-155.

65
Skinner, B. F. (1953). Science and Human Behavior. New York: The Free Press.
Waddell, T. R., Leander, J. D., Webbe, F. M., & Malagodi, E. F. (1972). Schedule interactions in
second-order fixed-interval (fixed-ratio) schedules of token reinforcement. Learning and
Motivation, 3, 91-100.
Webbe, F. M., & Malagodi, E. F. (1978). Second-order schedules of token reinforcement:
Comparisons of performance under fixed-ratio and variable-ratio exchange schedules.
Journal of the Experimental Analysis of Behavior, 30, 219-224.
Weiner, H. (1962). Some effects of response cost upon human operant behavior. Journal of the
Experimental Analysis of Behavior, 5, 201-208.
Weiner, H. (1963). Response cost and the aversive control of human operant behavior. Journal
of the Experimental Analysis of Behavior, 6, 415-421.
Weiner, H. (1964). Response cost and fixed-ratio performance. Journal of the Experimental
Analysis of Behavior, 7, 79-81.
Weiner, H. (1969a). Conditioning history and the control of human avoidance and escape
responding. Journal of the Experimental Analysis of Behavior, 12, 1039-1043.
Weiner, H. (1969b). Controlling human fixed-interval performance. Journal of the Experimental
Analysis of Behavior, 12, 349-373.
Williams, B. A. (1991). Marking and bridging versus conditioned reinforcement. Animal
Learning & Behavior, 19, 264-269.
Williams, B. A. (1994a). Conditioned reinforcement: Experimental and theoretical issues. The
Behavior Analyst, 17, 261-285.
Williams, B. A. (1994b). Conditioned reinforcement: Neglected or outmoded explanatory
construct? Psychonomic Bulletin & Review, 1, 457-475.

66
Wolfe, J. B. (1936). Effectiveness of token rewards for chimpanzees. Comparative
Psychological Monographs, 12, 1-72.
Yechiam, E., & Hochman, G. (2013). Loses as modulators of attention: Review and analysis of
the unique effects of losses over gains. Psychological Bulletin, 139(2), 497-518.
Zimmerman, D. W. (1957). Durable secondary reinforcement: Method and theory. Psychological
Review, 64(6), 373-383.

67
Table 1
Order of Conditions and Number of Sessions in Experiment 1
Subject Condition Sessions
267 VC 10 s 22
VC 30 s 25
VC 10 s 45
EXT 16
819 VC 10 s 15
VC 30 s 23
VC 90 s 17
VC 30 s 47
VC 10 s 22
EXT 17
847 VC 10 s 15
VC 30 s 19
VC 90 s 16
VC 30 s 18
VC 10 s 31
EXT 42

68
Table 2
Order of Conditions and Number of Sessions in Experiment 2
Subject VC Schedule Condition Sessions
942 VC 30 s FN 2 16
FN 4 18
FN 6 21
FN 4 22
FN 2 18
FN 6 15
FN 2 18
VC 10 s FN 6 19
FN 2 18
FN 6 49
FN 6x1 20
1022 VC 30 s FN 2 15
FN 4 16
FN 6 15
FN 4 20
FN 2 16
FN 6 17
FN 2 16
FN 6 19
FN 6x1 39
FN 2 17
1104 VC 30 s FN 6 24

69
FN 4 44
FN 2 19
FN 6 34
FN 6x1 16
VC 10 s FN 6x1 31
FN 6 25
FN 2 21
FN 6 15

70
Table 3
Order of Conditions and Number of Sessions in Experiment 3
Subject Condition
(Token:Food) Sessions
267 1:1 36
3:1 16
1:3 18
1:1 18
1:12 22
819 1:1 19
1:3 19
3:1 15
1:3 30
12:1 30
847 1:1 24
1:3 28
3:1 27
12:1 17
1:1 17

71
Figure 1. Diagram of the first phase of pre-training. Sessions began with 7 tokens being
illuminated. Responding on the exchange key (a) exchanged (i.e., turned off) the right-most
token and produced access to food (b).

72
Figure 2. Diagram of the second phase of pre-training. The token-loss avoidance period began
with one token being delivered (a). Responding on the avoidance key (b) avoided token-loss on a
FC 5-s schedule (c). If no response occurred on the avoidance key, the token was removed at the
end of the cycle (d). Exchange periods began at the end of the FC 5-s cycle. If a token remained,
responses on the exchange key (e) exchanged (i.e., turned off) a token and produced access to
food. Exchange periods lasted for 30 s before removing any remaining tokens and returning to
the token-loss avoidance period. A response on the avoidance key during the exchange period (f)
escaped the remainder of the 30-s exchange period and returned to the token-loss avoidance
period.

73
Figure 3. Diagram of the general procedure across the present series of experiments. The token-
loss avoidance period will begin with a number of tokens being delivered at the start of the
token-loss avoidance period (a). Responding on the avoidance key (b) will avoid token-loss on a
cycle schedule (here VC 30-s) (c). If no responding occurs on the avoidance key, a token will be
removed at the end of the cycle (d). Exchange periods will begin when a number of cycles equal
to the number of tokens delivered elapses. If no tokens remain, the exchange key will flash for .5
s before returning to the token-loss avoidance period. If any tokens remain, responding on the
exchange key (e) will exchange one token and produce access to food (f). Exchange periods will
last until all tokens are exchanged.

74
Figure 4. Overall response rates on the avoidance key across the last 5 sessions in each condition
of Experiment 1. Labels indicate schedule of token-loss frequency in effect.

75
Figure 5. Local response rates on the avoidance key as a function of the number of tokens
present in the last 5 sessions of each condition of Experiment 1. Data points represent responding
between token delivery and the removal of a single token or the beginning of the exchange
period, whichever occurs first. Error bars represent ± 1 standard error.

76
Figure 6. Aggregate local response rates on the avoidance key as a function of the number of
tokens present in the last 5 sessions of each schedule of token-loss frequency in Experiment 1.
Data points represent responding between token delivery and the removal of a single token or the
beginning of the exchange period, whichever occurs first. Error bars represent ± 1 standard error.

77
Figure 7. Percent of scheduled token-losses canceled across the last 5 sessions in each condition
of Experiment 1. Labels indicate schedule of token-loss frequency in effect.
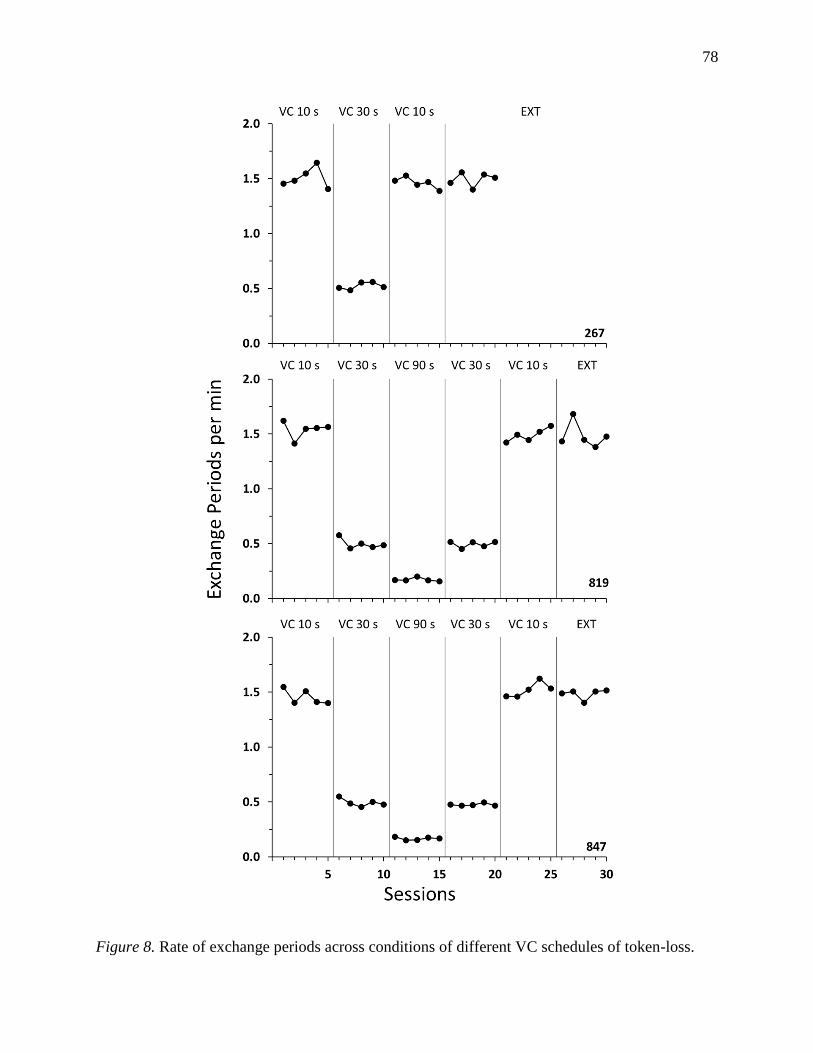
78
Figure 8. Rate of exchange periods across conditions of different VC schedules of token-loss.

79
Figure 9. Rate of food deliveries across conditions of different VC schedules of token-loss. Each
token exchanged resulted in one 2.5-s access to food.

80
Figure 10. Overall response rates across the last 5 sessions of each condition in Experiment 2.
Labels indicate the schedule of token-loss frequency and the number of tokens presented at the
beginning of each token-loss avoidance period.

81
Figure 11. Local response rates on the avoidance key as a function of the number of tokens
present in the last 5 sessions of each condition in Experiment 2. A VC 30-s and VC 10-s
schedule of token-loss frequency was in effect for graphs in the left and right columns,
respectively. Data points represent responding between token delivery and the beginning of the
exchange period. Error bars represent ± 1 standard error.
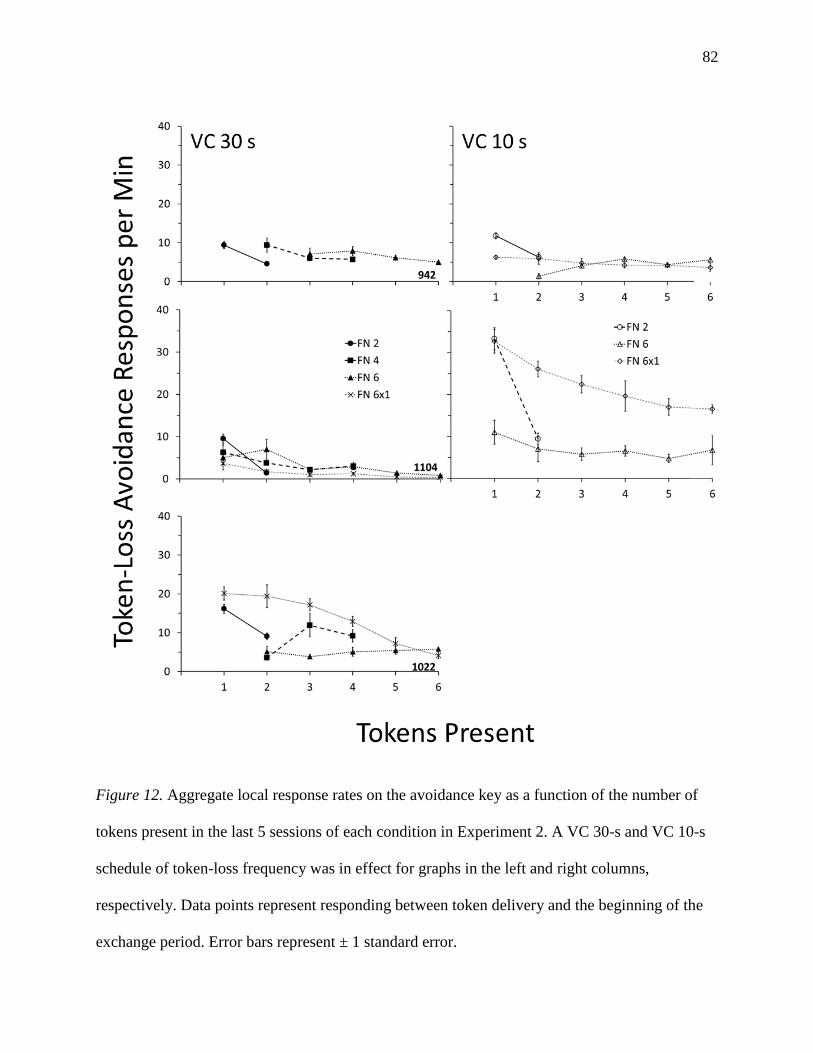
82
Figure 12. Aggregate local response rates on the avoidance key as a function of the number of
tokens present in the last 5 sessions of each condition in Experiment 2. A VC 30-s and VC 10-s
schedule of token-loss frequency was in effect for graphs in the left and right columns,
respectively. Data points represent responding between token delivery and the beginning of the
exchange period. Error bars represent ± 1 standard error.

83
Figure 13. Percent of scheduled token-losses canceled across the last 5 sessions in each
condition of Experiment 2. Labels indicate schedule of token-loss frequency of the number of
tokens delivered at the beginning of each token-loss avoidance period.

84
Figure 14. Rate of exchange periods across conditions of Experiment 2.

85
Figure 15. Rate of food deliveries across conditions of Experiment 2. Each token exchanged
resulted in one 2.5-s access to food.

86
Figure 16. Overall response rates across the last 5 sessions of each condition in Experiment 3.
Labels indicate the ratio of tokens to food involved in each token exchange.

87
Figure 17. Local response rates on the avoidance key as a function of the number of tokens
present in the last 5 sessions of each condition of Experiment 3. Data points represent responding
between token delivery and the removal of a single token or the beginning of the exchange
period, whichever occurs first. Error bars represent ± 1 standard error. The y-axis for Pigeon 267
is scaled differently.

88
Figure 18. Percent of scheduled token-losses canceled across the last 5 sessions in each
condition of Experiment 3. Labels indicate the token-exchange schedule as a ratio of tokens to
food.

89
Figure 19. Rate of exchange periods across conditions in Experiment 3. Labels indicate the
token-exchange schedule as a ratio of tokens to food.

90
Figure 20. Rate of food deliveries (filled circles) and token exchanges (open squares) across
conditions in Experiment 3. Labels indicate the token-exchange schedule as a ratio of tokens to
food. The y-axis for Pigeon 267 is scaled differently.

91
Appendix A: Reinstatement of Responding in a Token-Loss Avoidance Arrangement
Reinstatement involves the recurrence of a previously extinguished response following
the response-independent delivery of a reinforcer or stimuli associated with reinforcer delivery
(Franks & Lattal, 1976; Shaham, Shalev, Lu, Wit, & Stewart 2003; Thrailkill, & Shahan, 2012).
Following the EXT condition of Experiment 1, response rates were at or near zero for all three
pigeons. Rather than immediately begin the undertaking of the extensive pretraining required
with pigeons naïve to the token-loss avoidance arrangement, it was seen if responding previously
maintained in a token-loss avoidance arrangement could be reinstated.
Method
Pigeons 267, 819, and 847 from Experiment 1 served as subjects. Sessions were
conducted in the same operant chamber described in Experiment 1. Sessions were conducted in
the same manner as described in Experiment 1 except as noted below.
Extinction. The last five sessions of the EXT condition from Experiment 1 were used as
a baseline against which to compare the effects of subsequent conditions.
Token Reinstatement. This condition lasted for 5 sessions. Sessions operated similarly
to the EXT condition except that a predetermined number of token-losses were canceled in each
session. Which token-losses were canceled was determined by first creating an array of 56 zeroes
and ones. The number of ones in the array was equal to the average number of token-losses
canceled in the last five sessions of the second VC 10-s condition from Experiment 1, rounded to
the nearest integer. These numbers were 22, 27, and 31 token-losses canceled for Pigeons 267,
819, and 847, respectively. At the end of each cycle in session, a zero or one would be drawn
from the array randomly without replacement. If a one was drawn, the scheduled token-loss was
canceled. Responding on the avoidance key was recorded but had no programmed effect.
92
If any tokens remained when an exchange period began, responses on the exchange key
turned off the right-most token, the houselight, and exchange key for 2.5 s. The hopper was not
raised, and no food was presented. Exchange periods ended when all remaining tokens were
exchanged or 30 s elapsed, whichever came first.
Token+Food Reinstatement. This condition lasted for 5 sessions. Sessions operated as
described in the Token Reinstatement condition except that when a token was exchanged, the
hopper was raised and food was presented.
VC 10 s. Sessions operated as described in the VC 10-s conditions in Experiment 1.
These sessions served as the first 5 sessions of Experiment 3.
Results and Discussion
Figure A1 shows overall response rates across conditions. Responding for all pigeons
was at or near zero levels across the last five sessions of EXT. In the Token Reinstatement
condition, response rates increased for all pigeons when scheduled token-losses were canceled
response-independently and could be exchanged for the stimuli associated with food delivery.
For Pigeon 267, the increase in responding occurred in the first session followed by a rapid
decline back to zero. For Pigeon 819, responding recurred across the first four sessions before
dropping back to zero. For Pigeon 847, response rates increased above those in the EXT
condition in the fourth session. Overall response rates increased for all pigeons in the
Token+Food Reinstatement condition. Response rates increased further for Pigeons 267 and 819
when the VC 10-s schedule of token-loss avoidance was reimplemented.
Figure A2 shows response rates as a function of the number of tokens present across
conditions. Data points were determined in the same manner as in Experiment 1. For all pigeons,
response rates were lowest in the EXT condition. For Pigeons 819 and 847, higher rates of

93
responding occurred when fewer tokens were present in the other conditions. This pattern of
responding did not occur for Pigeon 267. When scheduled token-losses were canceled response-
independently and could be exchanged for the stimuli associated with food delivery, patterns of
responding recurred that were similar to those that occurred when scheduled token-losses were
canceled response-dependently.
Figure A3 shows the percentage of scheduled token-losses canceled across conditions.
Zero scheduled token-losses were canceled in the EXT condition. The percentage of scheduled
token-losses canceled in the Token Reinstatement and Token+Food Reinstatement conditions
differed between subjects but were the same within subjects. In the VC 10-s condition, the
percentage of scheduled token-losses canceled declined for Pigeons 819 and 847 and increased
overall for Pigeon 267. Figure A4 shows there was no change in exchange period frequency
across conditions.
Figure A5 shows the rate of token exchanges across conditions. In each condition except
the Token Reinstatement condition, each token exchange resulted in the delivery of food. Zero
token exchanges occurred in the EXT condition. Token exchanges declined across sessions for
all pigeons in the Token Reinstatement condition as food was never delivered in this condition.
The rate of token exchanges recovered in the Token+Food Reinstatement condition. In the VC
10-s condition, the rate of token exchanges declined overall for Pigeons 819 and 847 and
increased overall for Pigeon 267.
Despite declining rates of token exchanges in the VC 10-s condition (Figures A4 and
A5), response rates increased or remained the same compared to those in the Token+Food
Reinstatement condition (Fig. 1). Imposing the operant contingency of the VC schedule

94
maintained or increased overall response rates relative to the Token+Food Reinstatement
condition.
Tokens and stimuli associated with their exchange may have had discriminative or
reinforcing properties (Bullock & Hackenberg, 2015; Shahan, 2010). These properties were
sufficient to reinstate responding previously maintained in a token-loss avoidance arrangement.
Bullock and Hackenberg (2015) state that tokens have multiple functions: as eliciting stimuli,
discriminative stimuli, and as conditioned reinforcers. They also state that these functions depend
on the contingencies in which they are embedded. In this case, when token-losses were canceled
response-independently, response rates that varied as a function of the number of tokens present
were reinstated. The tokens and the stimuli that accompanied their exchange likely had
discriminative properties that occasioned these patterns of responding. When the operant
contingency of the VC 10-s schedule was reimplemented, those patterns persisted and response
rates increased or maintained despite decreasing rates of primary reinforcement. The response-
dependent avoidance of token-loss served to increase responding, likely because of a reinforcing
function of avoidance of token-loss.
These results may invite further investigation into reinstatement and recurrence more
generally as it pertains to responding maintained by conditioned reinforcers (Thrailkill &
Shahan, 2012) and negative reinforcement (Bruzek, Thompson, & Peters, 2009; Li et al., 2007).

95
References
Bruzek, J. L., Thompson, R. H., & Peters, L. C. (2009). Resurgence of infant caregiving
responses. Journal of Experimental Analysis of Behavior, 92, 327-343.
Bullock, C. E., & Hackenberg, T. D. (2015). The several roles of stimuli in token reinforcement.
Journal of the Experimental Analysis of Behavior, 103, 269-287.
Franks, G. J., & Lattal, K. A. (1976). Antecedent reinforcement schedule training and operant
response reinstatement in rats. Animal Learning & Behavior, 4(4), 374-378.
Li, Y., Liu, X., Chen, H., Deng, H., Xiang, X., Chen, H., & Hao, W. (2007). Development,
extinction, and reinstatement of morphine withdrawal-induced conditioned place aversion
in rats. Addiction Biology, 12, 470-477.
Shaham, Y., Shalev, U., Lu, L., de Wit, H., & Stewart, J. (2003). The reinstatement model of
drug relapse: History, methodology, and major findings. Psychopharmacology, 168(1-2),
3-20.
Shahan, T. A. (2010). Conditioned reinforcement and response strength. Journal of the
Experimental Analysis of Behavior, 93, 269-289.
Thrailkill, E. A., & Shahan, T. A. (2012). Resistance to change and relapse of observing. Journal
of the Experimental Analysis of Behavior, 97, 281-304.

96
Figure A1. Overall response rates on the avoidance key during token-loss avoidance periods
across conditions. Labels indicate the condition in effect.

97
Figure A2. Local response rates on the avoidance key as a function of the number of tokens
present in the last 5 sessions of each condition of Experiment 1. Data points represent responding
between token delivery and the removal of a single token or the beginning of the exchange
period, whichever occurs first. Error bars represent ± 1 standard error.

98
Figure A3. Percent of scheduled token-losses canceled in each condition. Labels indicate the
condition in effect.

99
Figure A4. Rate of exchange periods across conditions. Labels indicate the condition in effect.
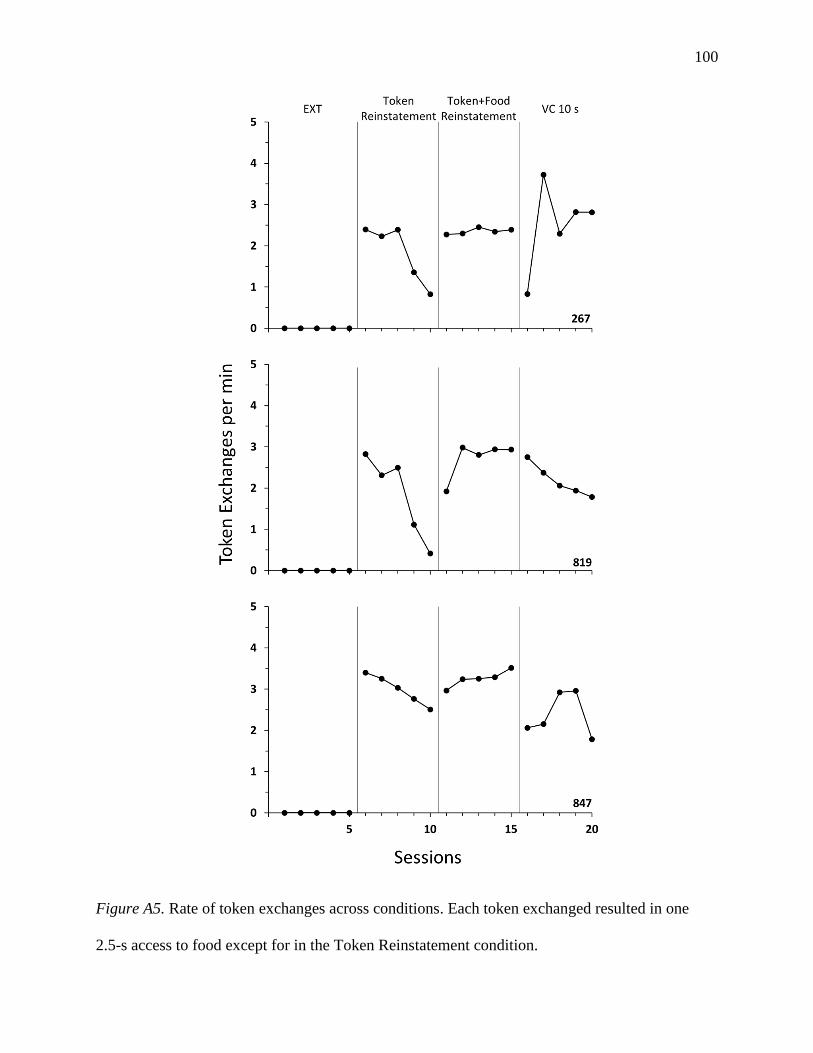
100
Figure A5. Rate of token exchanges across conditions. Each token exchanged resulted in one
2.5-s access to food except for in the Token Reinstatement condition.

101
Appendix B: Responding on a Multiple Schedule of Token-Loss Avoidance and Token-
Production
A symmetrical law of effect supposes that equivalent gains and losses should have
equivalent effects on behavior. Under this assumption, an organism ought to respond equally as
much to avoid a loss as it would to produce an equivalent gain. Loss-aversion (Kahnemann &
Tversky, 1979, 2000) supposes that losses exert greater control over behavior than do equivalent
gains. Under this assumption, an organism ought to respond more to avoid a loss than it would to
produce an equivalent gain. In the operant literature, the results of some experiments support a
symmetrical law of effect (Iwata & Bailey, 1974; Magoon & Critchfield, 2008) and others
support loss-aversion (Donaldson, DeLeon, Fisher, & Kahng, 2014; Rasmussen & Newland,
2008).
Following Experiment 2, Pigeon 1022 was placed on a multiple schedule. In one
component, responding resulted in token-loss avoidance. In the other component, responding
resulted in token production on an equivalent schedule. This was done as pilot work in assessing
whether equivalent schedules of token production or token-loss avoidance would maintain
equivalent levels of responding.
Method
Pigeons 1022 from Experiment 2 served as the only subject. Sessions were conducted in
the same operant chamber described in Experiment 1. Sessions were conducted in the same
manner as described in Experiment 1 except as noted below.
A two-component multiple schedule operated in each session. One component (Avoid)
operated as the VC 10-s token-loss avoidance condition described in Experiment 1. In the other
component (Production), a VC 10-s token-production schedule operated. In this component, the

102
token-production period began with no tokens illuminated. A response on the right (production)
key during each VC 10-s cycle resulted in the left-most token turning on at the end of the cycle.
If no response occurred during the VC 10-s cycle, no change occurred at the end of the cycle.
The number of cycles in each token-production period of the Production component was
determined by randomly selecting without replacement from an array consisting of the numbers
1-7. For example, if the number 1 was selected, one VC 10-s cycles would elapse during the
token-production period. If the number 2 was selected, two VC 10-s cycles would elapse during
the token-production period. After the selected number of cycles elapsed, the production key
turned off and the center (exchange) key was illuminated green. This began the exchange period.
Exchange periods operated in the same manner described in Experiment 1 for both components.
Whatever tokens were produced during the token-production period could be exchanged for 2.5-
s access to food.
Each component continued until the first exchange period ended following 28 VC 10-s
cycles. A maximum of 28 tokens could be exchanged in each component. Each component
occurred twice in each session. The first component was randomly determined. Each component
occurred once before either occurred twice. The left key was illuminated red during the token-
loss avoidance period of the Avoid component and the center and right keys were dark. The right
key was illuminated white during the token-production period of the Production component and
the left and center keys were dark. Responses on dark keys had no programmed effect.
A minimum of 15 sessions were conducted until responding on both responding in both
components appeared stable as determined by visual analysis.

103
Results and Discussion
Fifteen sessions were conducted in this pilot study. Table B1 shows the average
frequency of exchange periods, food exchanges, and the percentage of available tokens
exchanged in both components across the last 5 sessions. Exchange periods occurred with about
the same frequency in both components. The average rate of food deliveries was greater in the
Avoid component. The average percentage of available tokens exchanged represents the
percentage of scheduled token-losses canceled in the Avoid component and the percentage of
available tokens produced in the Production component. Fifty-six tokens total could be
exchanged in each component if all token-losses were canceled in the Avoid component and all
available tokens were produced in the Production component. A greater percentage of the 56
possible tokens were exchanged in the Avoid component than in the Production component. The
greater rate of food deliveries and percentage of token exchanges may have affected the
differences in responding described below.
Figure B1 shows response rates in the Avoid and Production components across the last 5
sessions. Generally higher rates of responding occurred in the Avoid component, but response
rates converged in the last session. Greater rates of responding in the Avoid component would
support token-loss avoidance having functioned as a more potent reinforcer than token-
production on an equivalent schedule. The higher rates of responding shown in Figure B1 would
seem to support loss-aversion over a symmetrical law of effect, but further investigation is
warranted. It is possible that Pigeon 1022’s longer history of responding on the key associated
with the Avoid component and this key’s position in the box may have contributed to a bias in
responding on the this key. Future conditions will involve switching the contingencies associated

104
with each key to evaluate whether key color or position has any influence on responding in these
components.
Figure B2 shows average response rates in the Avoid and Production components across
the last 5 sessions as a function of the number of tokens present. In the Avoid component,
generally higher levels of responding occurred when fewer tokens were present except for a
slightly higher response rate when 7 tokens were present. These results are similar to those
obtained in Experiments 1-3. In the Production component, a high response rate occurred when 0
tokens were present. Lower response rates occurred when 1 or 2 tokens were present followed by
increasing response rates as more tokens were present. In both components, response rates
tended to be higher when closer in time to the exchange period. This pattern of responding is
generally similar to that produced in other research that has examined changes in responding
maintained by token production (Bullock & Hackenberg, 2006, 2015; Foster, Hackenberg, &
Vaidya, 2001; Malagodi, Webbe, & Waddell, 1975). Additionally, the patterns of responding
that occurred as a function of the number of tokens present in the Avoid and Production
components were generally symmetrical. This provides further support that the tokens were
providing similar discriminative functions in both components.
Further research should be conducted along this line comparing responding maintained
by token-loss avoidance and the production of tokens. Further investigation may provide better
understanding about the symmetrical law of effect and loss-aversion as basic behavioral
processes.

105
References
Bullock, C. E., & Hackenberg, T. D. (2006). Second-order schedules of token reinforcement
with pigeons: Implications for unit price. Journal of the Experimental Analysis of
Behavior, 85, 95-106.
Bullock, C. E., & Hackenberg, T. D. (2015). The several roles of stimuli in token reinforcement.
Journal of the Experimental Analysis of Behavior, 103, 269-287.
Donaldson, J. M., DeLeon, I. G., Fisher, A. B., & Kahng, S. (2014). Effects of and preference for
conditions of token earn versus token loss. Journal of Applied Behavior Analysis, 47,
537-548.
Foster, T. A., Hackenberg, T. D., & Vaidya, M. (2001). Second-order schedules of token
reinforcement with pigeons: Effects of fixed- and variable-ratio exchange schedules.
Journal of the Experimental Analysis of Behavior, 76, 159-178.
Iwata, B. A., & Bailey, J. S. (1974). Reward versus cost token systems: An analysis of the effects
on students and teacher. Journal of Applied Behavior Analysis, 7, 567-576.
Kahneman, D., & Tversky, A. (1979). Prospect theory: An analysis of decisions under risk.
Econometrica, 47, 263-291.
Kahneman, D., & Tversky, A. (Eds.) (2000). Choices, values, and frames. New York:
Cambridge University Press.
Magoon, M. A., & Critchfield, T. S. (2008). Concurrent schedules of positive and negative
reinforcement: Differential-impact and differential-outcomes hypotheses. Journal of the
Experimental Analysis of Behavior, 90, 1-22.

106
Malagodi, E. F., Webbe, F. M., & Waddell, T. R. (1975). Second-order schedules of token
reinforcement: Effects of varying the schedule of food presentation. Journal of the
Experimental Analysis of Behavior, 24, 173-181.
Rasmussen, E. B., & Newland, M. C. (2008). Asymmetry of reinforcement and punishment in
human choice. Journal of the Experimental Analysis of Behavior, 89, 157-167.

107
Table B1
Average Frequency of Exchange Periods and Food Deliveries and the Percentage of Available
Tokens Exchanged in the Avoidance and Production Components across the Last 5 Sessions
Dependent Variable Avoid Production
Percent of Available Tokens Exchanged 55.71 42.14
Exchange Periods per min 1.48 1.55
Token Exchanges per min 3.27 2.62

108
Figure B1. Overall response rates in the Avoid and Production components across the last 5
sessions.

109
Figure B2. Local response rates in the Avoid and Production components across the last 5
sessions as a function of the number of tokens present. Error bars represent ± 1 standard error.
Copyright © 2022 FDOKUMEN