Regulation of the Innate Immune Response during the Human ...

Innate and adaptive T cells in asthmatic patients:Relationship to severity and disease mechanisms
Timothy S. C. Hinks, MD,a,b Xiaoying Zhou, PhD,a Karl J. Staples, PhD,a Borislav D. Dimitrov, MD,b,c
Alexander Manta, PhD,d Tanya Petrossian, PhD,e Pek Y. Lum, PhD,e Caroline G. Smith, RN,c Jon A. Ward, BSc,a,b
Peter H. Howarth, MD,a,b Andrew F.Walls, PhD,a Stephan D. Gadola, MD,a,f and Ratko Djukanovi�c, MDa,b Southampton,
United Kingdom, Geretsried, Germany, Palo Alto, Calif, and Basel, Switzerland
Background: Asthma is a chronic inflammatory diseaseinvolving diverse cells and mediators whose interconnectivityand relationships to asthma severity are unclear.Objective: We performed a comprehensive assessment of TH17cells, regulatory T cells, mucosal-associated invariant T (MAIT)cells, other T-cell subsets, and granulocyte mediators inasthmatic patients.Methods: Sixty patients with mild-to-severe asthma and 24control subjects underwent detailed clinical assessment andprovided induced sputum, endobronchial biopsy,bronchoalveolar lavage, and blood samples. Adaptive andinvariant T-cell subsets, cytokines, mast cells, and basophilmediators were analyzed.Results: Significant heterogeneity of T-cell phenotypes wasobserved, with levels of IL-13–secreting T cells and type 2cytokines increased at some, but not all, asthma severities. TH17cells and gd-17 cells, proposed drivers of neutrophilicinflammation, were not strongly associated with asthma, even in
From aClinical and Experimental Sciences, University of Southampton Faculty of
Medicine, Sir Henry Wellcome Laboratories, bthe NIHR Southampton Respiratory
Biomedical Research Unit, and cPrimary Care and Population Sciences, University
of Southampton Faculty of Medicine, Southampton University Hospital;dMantaMatics UG, Geretsried; eAyasdi, Palo Alto; and fthe Novartis Institute of
Biomedical Research, Novartis, Basel.
Supported by a Wellcome Trust Clinical Research Fellowship (088365/z/09/z; to
T.S.C.H.). Infrastructure support was funded by the NIHR Southampton Respiratory
Biomedical Research Unit. X.Z. was supported by the Medical Research Council
(G0500729), Asthma UK (06/026), and the Foundation for the Study of Infant Death
(254). K.J.S. was supported by a project grant fromAsthmaUK (08/026).We acknowl-
edge the support of the National Institute for Health Research through the Primary
Care Research Network and through an Academic Clinical Fellowship awarded (to
T.S.C.H.).
Disclosure of potential conflict of interest: X. Zhou has received funding from Novartis
and holds patents EP 1982191 and USPA 12/161409. K. J. Staples has received fund-
ing fromAsthmaUK and GSKBio, as well as personal fees fromNovartis. A.Manta is
employed part-time by Roche, which has received funding from MantaMatics UG. T.
Petrossian has received stock options from Ayasdi. P. Y. Lum has received stock op-
tions from Ayasdi. P. H. Howarth has received funding from the Medical Research
Council. A. F. Walls has received funding from Thermo Fisher and Novartis and re-
ceives money from patents EP 1982191 and USPA 12/161409. S. Gadola is employed
by Novartis. R. Djukanovi�c holds stock in Synairgen and has received consultancy fees
from TEVA Pharmaceuticals, payment for delivering lectures from Novartis, and
compensation for travel and other meeting-related expenses from Boehringer Ingel-
heim. The rest of the authors declare that they have no relevant conflicts of interest.
Received for publication June 24, 2014; revised January 12, 2015; accepted for publica-
tion January 16, 2015.
Corresponding author: Ratko Djukanovi�c, MD, Clinical and Experimental Sciences,
University of Southampton Faculty of Medicine, Sir Henry Wellcome Laboratories,
Southampton University Hospital, Southampton SO16 6YD, United Kingdom.
E-mail: [email protected].
0091-6749
� 2015 The Authors. Published by Elsevier Inc. on behalf of the American Academy
of Allergy, Asthma & Immunology. This is an open access article under the CC BY
license (http://creativecommons.org/licenses/by/4.0/).
http://dx.doi.org/10.1016/j.jaci.2015.01.014
severe neutrophilic forms. MAIT cell frequencies werestrikingly reduced in both blood and lung tissue in relation tocorticosteroid therapy and vitamin D levels, especially inpatients with severe asthma in whom bronchoalveolar lavageregulatory T-cell numbers were also reduced. Bayesian networkanalysis identified complex relationships between pathobiologicand clinical parameters. Topological data analysis identified 6novel clusters that are associated with diverse underlyingdisease mechanisms, with increased mast cell mediator levels inpatients with severe asthma both in its atopic (type 2 cytokine–high) and nonatopic forms.Conclusion: The evidence for a role for TH17 cells in patientswith severe asthma is limited. Severe asthma is associated with astriking deficiency of MAIT cells and high mast cell mediatorlevels. This study provides proof of concept for diseasemechanistic networks in asthmatic patients with clusters thatcould inform the development of new therapies. (J Allergy ClinImmunol 2015;nnn:nnn-nnn.)
Key words: Asthma, T lymphocytes, cytokines, mast cells, pheno-type, endotype, regulatory T, TH17, TH2, mucosal-associatedinvariant T-cell
Asthma is characterized by airways inflammation and remodel-ing. Based on initial studies in animal models1 and human T-cellclones2 and bronchoscopic studies in patients with mild steroid-naive asthma,3,4 it has been viewed as a disease driven by activatedTH2 cells producing the type 2 interleukins IL-4, IL-5, and IL-13.These cytokines are believed to orchestrate the functions of mastcells,5,6 eosinophils,7 and IgE-producing B cells/plasma cells.This concept has been challenged with increasing recognition ofconsiderable heterogeneity of asthma mechanisms and definablepatient subpopulations associated with immunopathology thatcannot be explained by TH2 inflammation alone.8-11 Discoveriesof novel T-cell subsets, notably anti-inflammatory regulatory T(Treg) cells12,13 and proinflammatory IL-17–secreting (TH17)
14
and invariant natural killer15T cells,which are implicated in asthmapathogenesis on the basis of studies in animal models and limitedevidence in human asthma, have added complexity to our under-standing of immunoregulation. Recent studies have revived interestinmast cells,6,16 a subject of intense research in the 1980s and early1990s but not widely seen as candidate targets, possibly because oflimited evidence of their role in severe disease.6,17,18
Most studies of asthma pathobiology to date have focused onindividual or limited numbers of inflammatory cell types, makingit difficult to appreciate the cell-cell interactions withincomplex networks that characterize inflammatory diseases, suchas asthma. Therefore we have undertaken a comprehensiveassessment of bronchial and circulating T cells, including
1
J ALLERGY CLIN IMMUNOL
nnn 2015
2 HINKS ET AL
Abbreviations used
ACQ: A
sthma Control QuestionnaireBAL: B
ronchoalveolar lavageBNA: B
ayesian network analysiseNO: E
xhaled nitric oxideFOXP3: F
orkhead box protein 3GINA: G
lobal Initiative for AsthmaICS: In
haled corticosteroidIQR: In
terquartile rangeMAIT: M
ucosal-associated invariant TTc: C
ytotoxic TTDA: T
opological data analysisTreg: R
egulatory Tmucosal-associated invariant T (MAIT)19 cells, a novel cell typenot yet studied in patients with asthma or other chronic lung dis-eases, and relevant TH2/TH1/TH17 cytokines, as well as mediatorsreleased in the lungs by mast cells and basophils. We have com-bined these pathobiologic findings with standard clinical param-eters used to define asthma severity20 and interrogated the richmultidimensional clinicopathobiologic data set using the noveltechniques of the machine learning approach (ie, Bayesiannetwork analysis [BNA] and topological data analysis[TDA]).21,22 This enabled an in-depth investigation of the rolesof individual cell types in relation to asthma severity, character-ization of the complex interconnectivity between the diverse clin-ical and pathobiologic parameters, and identification ofclinicopathobiologic clusters that could point to novel asthmaendotypes.
METHODS
ParticipantsEighty-four participants (18-70 years) were enrolled from the Wessex
Severe AsthmaCohort, NIHRSouthamptonRespiratory Biomedical Research
Unit, and outpatient clinics at University Hospital Southampton: 24 healthy
nonatopic participants, 15 patients with mild asthma receiving b2-agonists
alone, 23 patients with moderate asthma receiving inhaled corticosteroids
(ICSs), and 22 patients with severe asthma with persistent symptoms despite
high-dose ICSs (n5 16) and oral corticosteroids (n5 6, Table I and see Fig E1
in this article’s Online Repository at www.jacionline.org) classified on enroll-
ment according to previously used criteria (see Table E1 in this article’s Online
Repository at www.jacionline.org).15 One hundred seven participants were
consented to achieve an approximate minimum group size of 15, according
to the physician’s assessment of severity at enrollment, which was estimated
to provide 80% power at the .05 significance level to detect differences in the
primary outcomes of TH17 andMAIT cell frequencies in each tissue compart-
ment after loss of missing data.
Study proceduresParticipants were assessed based on history, examination results, skin prick
test responses to common aeroallergens, spirometric results, exhaled nitric
oxide (eNO) levels, serum IgE levels, and (except for patients with severe
asthma) methacholine responsiveness. Lung samples were obtained by means
of sputum induction,23 bronchoalveolar lavage (BAL), and endobronchial bi-
opsy.15,17 By using flow cytometry, the following T-cell subsets were charac-
terized by their surface markers and intracellular cytokines15 in the circulation
(blood) and lungs (sputum and BAL cell pellets; cells from collagenase-
dispersed endobronchial biopsy specimens were used to provide bronchial
mucosal cells): TH17-cells, TH1-cells, and IL-13–secreting-TH2 cells;
CD31CD41 (or CD82) forkhead box protein 3 (FOXP3)1 Treg cells;
cytotoxic T (Tc) cells (TC1 and TC2); gd-17 T cells; and MAIT cells. Like
other authors,24 we could not detect with confidence IL-4– or IL-5–secreting
T cells using intracellular cytokine staining. Levels of type 1 (IFN-g, IL-2, and
12p70) and type 2 (IL-4, IL-5, and IL-13) cytokines, IL-10, IL-17A, mast cell
proteases, and basophil-derived basogranulin were measured in serum,
sputum, and BAL fluid by using standard methods (for details, see the
Methods section, Table E2 and Fig E2 in this article’s Online Repository at
www.jacionline.org).
The study was approved by the Southampton and South West Hampshire
Research Ethics Committee B. All participants provided informed consent.
Statistical analysisData were first analyzed by using standard statistical methods, classifying
subjects as healthy or having mild, moderate, or severe asthma as defined
above and in the Methods section in this article’s Online Repository.15 BNA
was then applied to all the pathobiologic and clinical features to seek associ-
ation in relation to asthma severity. Finally, TDAwas applied to the same data
to create a network of distinct clinicopathobiologic clusters.
Data elaboration and standard statisticsData distribution was tested by using the Shapiro-Wilk test, and data were
logarithmically transformed if they were not normally distributed. For all
analyses, 2-tailed P values of less than .05 were considered significant. Data
were compared between the healthy and control groups (Mann-WhitneyU or
Student t tests) and between each asthma severity group and the control sub-
jects (Kruskal-Wallis test or ANOVA), depending on the distribution of the
data. For the latter, an overall 5% significance level was adjusted for multiple
comparisons by using the Bonferroni method. Groups ranked according to
disease severity were tested for linear trend by using polynomial contrasts
(or the Jonckheere-Terpstra test, if not normally distributed). Data are ex-
pressed as medians with interquartile ranges (IQRs) unless stated otherwise.
Correlations were tested by using the Spearman r coefficient. Kolmogorov-
Smirnov tests identified significant differences between distributions within
a single cluster. Data were analyzed with Prism 6.0 (GraphPad Software, San
Diego, Calif) and SPSS 21.0 (IBM, Armonk, NY) software.
Network analysesFor network analyses (BNA and TDA), data were used from 62 participants
with the most complete data. Missing data were imputed by using average
values specific to each tissue and disease severity subgroup.A composite value
was generated for each parameter by using a weighted average across each
compartment: sputum and BAL fluid for concentrations of soluble mediators
and blood, sputum, BALfluid, and biopsy specimens for cell counts, providing
airway and tissue composite readouts, respectively, with a matrix of 62
participants and 26 pathobiologic and 26 clinical parameters (see theMethods
section and Tables E2 and E3 in this article’s Online Repository at www.
jacionline.org for definitions of terms). Interconnectivity between clinical
and pathobiologic parameters was first explored with BNA (Genie 2.0; Deci-
sion Systems Laboratory, Pittsburgh, Pa). Data were discretized to describe
nonlinear correlations into 2 bins for binary variables or 5 to 9 bins for contin-
uous variables.
TDATo use the full range of available clinical and pathobiologic data
simultaneously to identify multidimensional features within the data set,
which might not be apparent with traditional methods, we used the novel
technique of TDA, which is particularly suited to complex biological data
sets. This approach represents a high dimensional data set as a structured
3-dimensional network in which each ‘‘node’’ comprises subjects similar to
each other in multiple dimensions. Lines or ‘‘edges’’ are drawn between
nodes that contain shared data points. Statistical tests can then be performed
on groups or features that emerge from the inherent structure of the data set.
This method combines features of standard clustering methodologies and

TABLE I. Clinical characteristics of participants
Parameters
Healthy control
subjects
Patients with
mild asthma
Patients with
moderate asthma
Patients with
severe asthma
No. 24 15 23 22
Demographics
Sex (M/F), no. (%) 14 (58)/10 (42) 8 (53)/7 (47) 10 (43)/13 (57) 8 (36)/14 (64)
Age (y), median (range) 28 (20-65) 26 (21-64) 36 (21-56) 53 (23-67)
Pulmonary function
FEV1 (% predicted) 108 (105-113) 88 (86-103) 99 (86-107) 65 (49-82)
FEV1 reversibility (%) 3.3 (1.8-7.4) 13 (11-19) 10 (2.2-17) 13 (2.6-25)
PEFR (% predicted) 108 (97-116) 98 (89-107) 95 (85-100) 70 (53-82)
PEFR variability (%) 0 (0-11) 17 (10-25) 22 (17-32) 17 (12-24)
PD20 (mg methacholine) Negative 0.19 (0.050-0.79) 0.25 (0.063-0.73) Not done
eNO (ppb [at 50 L/s]) 16 (11-21) 53 (27-107) 26 (15-51) 20 (13-38)
Clinical
Atopy (positive skin test result, Y/N), no. (%) 0 (0)/24 (100) 15 (100)/0 (0) 20 (87)/3 (13) 15 (68)/7 (32)
No. of positive skin test results to allergens 0 (NA) 6 (4-7) 3 (2-5) 3.5 (0-5.3)
Peripheral eosinophil count (109/L) 0.1 (0.1-0.2) 0.2 (0.1-0.6) 0.2 (0.15-0.3) 0.2 (0.1-0.3)
Total IgE (IU/mL) 26 (10-61) 172 (21-451) 105 (35-188) 84 (31-669)
Body mass index (kg/m2) 24.4 (22.5-28.1) 23.6 (22.7-26.5) 25.3 (23.3-30.9) 31.0 (27.1-40.9)
Smoking status
Never smoker, no. (%) 21 (88) 14 (93) 19 (83) 17 (77)
Former smoker, no. (% [mean pack-years]) 3 (13 [4.2]) 1 (7 [6.7]) 4 (17 [5.8]) 4 (18 [26])
Current smoker, no. (% [mean pack-years]) 0 (0) 0 (0) 0 (0) 1 (5 [49])
Duration of asthma (y) NA 18 (15-26) 22 (9-27) 36 (21-49)
ACQ score NA 0.60 (0.43-1.3) 1.0 (0.60-1.4) 2.8 (2.2-3.5)
GINA level of control, no. (%)
Controlled NA 8 (53) 5 (22) 0 (0)
Partly controlled NA 6 (40) 15 (65) 2 (9.5)
Uncontrolled NA 1 (6.7) 3 (13) 19 (90)
Treatment
Inhaled steroids No No Yes Yes
Dose (equivalent mg BDP) NA NA 400 (200-400) 1600 (1280-2000)
Maintenance oral corticosteroids (Y/N), no. (%) No No No 6 (27)/16 (73)
Mean dose if taken (mg prednisolone/d) 11
Short-acting b-agonist (Y/N), no. (%) No Yes Yes Yes
Long-acting b-agonist (Y/N), no. (%) No No 10 (43)/13 (57) 22 (100)/0 (0)
Leukotriene receptor antagonist (Y/N), no. (%) No No 1 (4)/22 (96) 15 (68)/7 (32)
Step on GINA treatment algorithm NA 1 2-3 4-5
Inflammatory subtype, no. (%)
Total with valid data 16 13 18 21
Neutrophilic 4 (25) 2 (15) 2 (11) 10 (48)
Eosinophilic 1 (6.3) 3 (23) 3 (17) 6 (29)
Mixed granulocytic 0 (0) 0 (0) 0 (0) 1 (4.8)
Paucigranulocytic 11 (69) 8 (62) 13 (72) 4 (19)
Sputum cell differential (%)
Macrophages 52 (31-66) 49 (35-64) 47 (30-62) 30 (19-43)
Neutrophils 31 (11-65) 34 (22-54) 33 (16-56) 61 (32-76)
Epithelial 3.6 (2.0-24) 4.3 (1.7-10) 4.1 (1.1-21) 2.9 (0-7.8)
Eosinophils 0.38 (0-0.94) 1.5 (0.75-1.8) 0.75 (0.25-1.5) 0.69 (0-6.1)
Lymphocytes 0.1 (0-0.75) 0.3 (0-0.75) 0 (0-0.68) 0.0 (0-0.25)
BAL cell differential (%)
Macrophages 84 (74-89) 70 (60-80) 81 (73-89) 72 (46-94)
Neutrophils 2.5 (1.0-5.9) 2.5 (1.6-4.8) 3.5 (1.8-6.4) 6.5 (1.4-29)
Epithelial cells 9.9 (3.9-18) 21 (13-35) 11 (5.6-19) 8.7 (3.3-11)
Eosinophils 0.25 (0.0-0.56) 2.0 (0.75-3.6) 1.0 (0-3.0) 0.1 (0-1.6)
Lymphocytes 1.4 (0.94-2.4) 1.5 (0.38-3.0) 1.3 (0.5-2.3) 1 (0-1.6)
Relevant comorbidities, no. (%)
Allergic rhinitis 0 (0) 12 (80) 11 (58) 10 (46)
Nasal polyps 0 (0) 0 (0) 1 (5.3) 5 (23)
Eczema 3 (13) 7 (47) 6 (32) 4 (19)
Bronchiectasis 0 (0) 0 (0) 1 (5.3) 1 (4.5)
Values are medians with IQRs, unless stated otherwise. The inflammatory subtype is based on sputum differentials using the following cut points: neutrophilic, >61%; eosinophilic,
>3%. Percentages given are derived from subjects with valid data.
BDP, Beclomethasone dipropionate; NA, not available; PEFR, peak expiratory flow rate.
J ALLERGY CLIN IMMUNOL
VOLUME nnn, NUMBER nn
HINKS ET AL 3

0.1
1
10
100
0.1
1
10
100
0.1
1
10
100
0.1
1
10
100
1
10
(% C
D4+
or C
D8-
T ce
lls)
Sputum BAL Biopsy
Healthy Mild Mod. Severe Healthy Mild Mod. SevereHealthy Mild Mod. Severe
Healthy Mild Mod. Severe Healthy Mild Mod. SevereHealthy Mild Mod. Severe
0.1
1
10
100
0.1
1
10
100
0.1
1
10
100
0.1
1
10
100
T H2
cell
frequ
enci
es(%
CD
4+ o
r CD
8-T
cells
)
Healthy Mild Mod. Severe Healthy Mild Mod. SevereHealthy Mild Mod. Severe
0.1
1
10
100
0.01
0.1
1
10
100
0.01
0.1
1
10
T2
cell
frequ
enci
es(%
CD
4+ o
r CD
8-T
cells
)
HealthAsthma
PBMC Sputum BAL Biopsy
ANOVA P=0 004 ANOVA P=0 03 ANOVA P=0 02
***
PBMC Sputum Biopsy
P=0 04
A
B
C
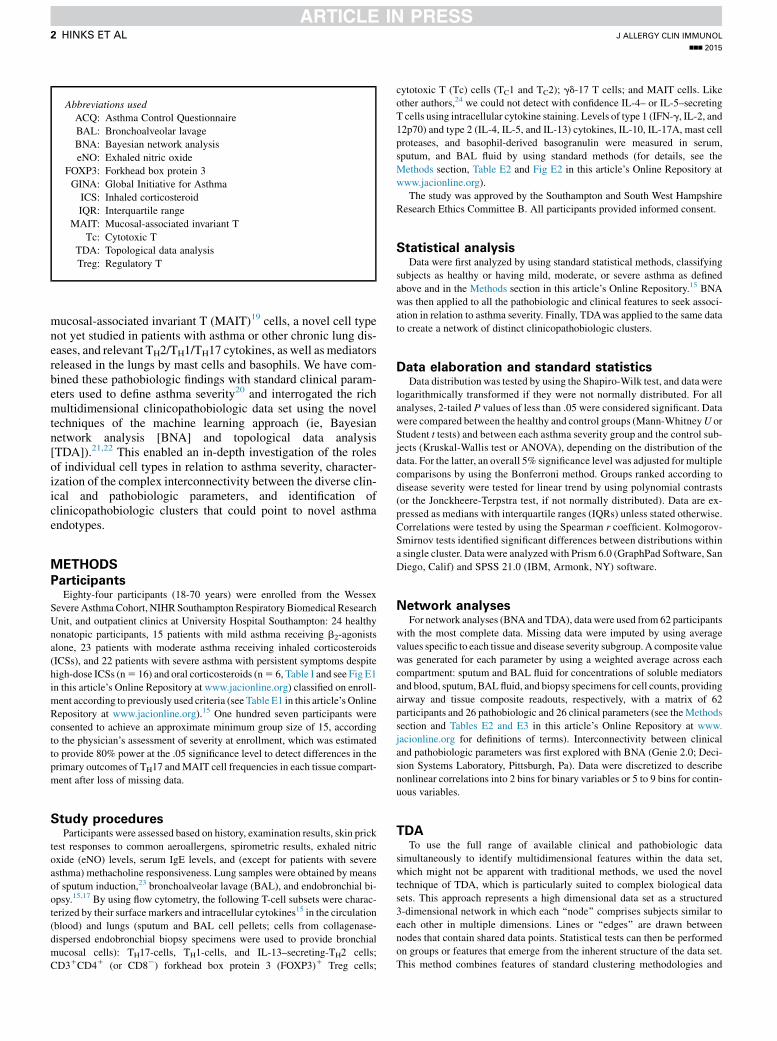
FIG 1. Frequencies of CD31CD41 T cells expressing IL-13 (TH2 cells; A), IL-17 (TH17 cells; B), and FOXP3
(Treg cells; C) in PBMCs, sputum, BAL fluid, and bronchial biopsy specimens as a percentage of live
CD31CD41 T cells or, for endobronchial biopsy specimens, a percentage of CD31CD82 T cells. Horizontal
lines show medians. Left columns, Healthy control subjects versus asthmatic patients with Mann-
Whitney U P values. Right 3 columns, Stratified by disease severity with Kruskal-Wallis P values (P < .05).
*P < .05 and **P < .01, post hoc Dunn test compared with healthy subjects.
J ALLERGY CLIN IMMUNOL
nnn 2015
4 HINKS ET AL
also provides a geometric representation of the data.21,22 In contrast to most
other techniques that depend on prior hypotheses and that focus on pairwise
relationships within the data,25 this geometric visualization allows recogni-
tion of multidimensional features (patterns) within the data in a less super-
vised, data-driven manner to identify meaningful subgroups that become
apparent (self-define themselves) on visualization (please see the TDA plots).
In addition, TDA does not require an a priori definition of the number of clus-
ters anticipated.
TDA was performed, as previously described,21 with IRIS 2.0 software
(Ayasdi, Palo Alto, Calif), constructing networks with parameters from
Table E3. Three inputs were used: a distance metric, 1 or more filter functions,
and 2 resolution parameters (‘‘resolution’’ and ‘‘percent overlap’’ or ‘‘gain’’).
A network of nodes with edges between them was created by using a force-
directed algorithm. The nodes represent bins or ‘‘microclusters’’ of data
points, and 2 nodes are connected if their corresponding collections of data
points have a point in common.21 Variance-normalized Euclidean distance
was used as a distance metric, with 2 filter functions: principal and secondary
metric singular value decomposition (for further explanation, see the Methods
section in this article’s Online Repository). Resolution and gain settings were
selected where the network structure permits identification of subgroups.
Kolmogorov-Smirnov tests identified parameters that differentiate each sub-
group from the rest of the structure and create clusters. Comparisons between
multiple clusters used 1-way ANOVA, with post hoc tests with the Bonferroni
correction.
For additional methods used, see the Methods section in this article’s On-
line Repository.
RESULTSData were first analyzed by using standard statistical methods
without imputation or composite averages, classifying subjects ashealthy or as having mild, moderate, or severe asthma (see TableE1 and the Results section in this article’s Online Repository atwww.jacionline.org). Previous observations that mild steroid-naive asthma is characterized by a bias toward type 2 inflamma-tion were confirmed, with increased numbers of IL-13–secretingCD41 (TH2) cells in sputum, BAL fluid, and endobronchial bi-opsy specimens from patients with mild asthma (Fig 1, A) and ra-tios of IL-13– to IFN-g–secreting CD41 (TH1) cells (see Fig E3 inthis article’s Online Repository at www.jacionline.org). However,this bias was not seen in patients with severe asthma, in whom fre-quencies of IL-13–secreting TH2 cells were not significantlydifferent from those in healthy subjects, although we did not mea-sure frequencies of IL-4– or IL-5–secreting T cells. Similarly, inpatients with mild asthma, there were significant increases inmedian concentrations of the type 2 cytokines IL-5 (median,

J ALLERGY CLIN IMMUNOL
VOLUME nnn, NUMBER nn
HINKS ET AL 5
0.13 pg/mL; IQR, 0.05-0.19 pg/mL) compared with those inhealthy subjects (0.003 pg/mL; IQR, 0.001-0.006 pg/mL; P <.001) and IL-13 (0.009 pg/mL; IQR, 0.0009-0.026 pg/mL)compared with those in healthy subjects (0 pg/mL [IQR, 0-0.0008 pg/mL]; P < .05) in BAL fluid (see Fig E4 in this article’sOnline Repository at www.jacionline.org). In sputum neither IL-5nor IL-13 levels were increased in patients with mild or moderateasthma. In patients with severe asthma, IL-5 levels were alsosignificantly increased in both BAL fluid (0.015 pg/mL; IQR,0.007-0.19 pg/mL; P < .05) and sputum (6.18 pg/mL; IQR,3.13-14.8 pg/mL) compared with levels seen in healthy subjects(1.19 pg/mL; IQR, 1.0-2.2 pg/mL; P5 .005; see Fig E4, B), sug-gesting that its secretion might be relatively steroid insensitiveand might be derived from cellular sources other than airwayTH2 cells.
Analysis showed no significant differences in TH17 cell or gd-17 T-cell frequencies between asthmatic patients and healthy sub-jects (Fig 1,B, and see Fig E5 in this article’s Online Repository atwww.jacionline.org). Furthermore, we found no evidence of dys-regulation of the TH17 response during cold-induced exacerba-tions of asthma (see the Results section and Figs E6 and E7 inthis article’s Online Repository at www.jacionline.org). Likewise,IL-17 levels were not increased in BAL fluid, sputum, or serumfrom asthmatic patients (see Fig E4, B, and data not shown; P >.05 in all compartments). However, when asthma was stratifiedaccording to severity, IL-17 levels in BAL fluid were increasedin patients with mild asthma (P 5 .04; see Fig E4, A). IncreasedIL-17 levels were associated with the presence of allergic rhinitis(0.017 pg/mL [IQR, 0.0065-0.043 pg/mL] if present and 0.005pg/mL [IQR, 0.0033-0.010 pg/mL] if absent, P 5 .02), withairway eosinophilia (rs5 0.34,P5.04) and high serum IgE levels(rs 5 0.42, P 5 .007; see Fig E4, C).
TH17 cells share functionally and developmentally antagonisticrelationships with the immunoregulatory Treg cells that regulateairway hyperresponsiveness in murine asthma models.26
We observed a slight but significant deficiency of BALCD41FOXP31 Treg cells in asthmatic patients (median fre-quency, 5.3%; IQR, 4.3% to 8.2%) comparedwith those in healthysubjects (8.1%; IQR, 5.6% to 10%; P5 .03; Fig 1, C), which wasrestricted to patients with severe asthma (Fig 1, C) and was notevident in blood, sputum, or bronchial biopsy specimens.
There was a striking deficiency of T-cell receptorVa7.21CD1611 MAIT cells in blood, sputum, and biopsy spec-imens from asthmatic patients, which was related to diseaseseverity and treatment with ICSs (Fig 2 and see Fig E8 in this ar-ticle’s Online Repository at www.jacionline.org). There was evi-dence of seasonal variation in MAIT cell frequencies andassociation with serum vitamin D3 concentrations and use oforal corticosteroids (see the Results section and Fig E9 in this ar-ticle’s Online Repository).
Application of BNA to pathobiologic and clinical features inrelation to asthma severity showed complex nonlinear associa-tions (Fig 3). Five nodes (eNO, IL-17, IFN-g, neutrophils, andvitamin D) without strong interactions with other parameterswere not connected and therefore remained outside the network.The asthma severity node was strongly connected with mast cellmediators, tryptase, chymase, and carboxypeptidase A3 and withIL-13– and IFN-g–secreting CD81 cytotoxic T cells (TC2 andTC1 cells, respectively). There was a strong negative associationbetween MAIT cell frequencies and ICS use that, in turn, waspositively associated with asthma severity.
To look further for novel associations between clinical andpathobiologic features, we applied TDA to all acquired clinicaland pathobiologic data (Figs 4 and 5 and see Table E4 in this ar-ticle’s Online Repository at www.jacionline.org). Data weretreated as composite averages for T-cell subsets (across blood,sputum, BAL fluid, and biopsy specimens), cytokines and eosin-ophils (across blood, sputum, and BAL fluid), neutrophils, macro-phages, lymphocytes, mast cell mediators, and basogranulin(across sputum and BALfluid). One healthy and 6 asthma clusterswere identified.
The TDA-derived cluster 1, comprising predominantly patientswith mild atopic asthma, had (compared with other asthmaticpatients) better lung function, lower Asthma Control Question-naire (ACQ)27 scores (mean, 0.88), and lower severity, as assessedby a physician on enrollment or based on Global Initiative forAsthma (GINA) criteria,20 and patients were mostly not receivingICSs. They had increased IL-13–secreting TH2 cell numbers andlower IL-13 and tryptase levels andwere predominantly paucigra-nulocytic (sputum neutrophils, <_61%; eosinophils, <_3%; Fig 4, B,and see Table E4).
Cluster 2 consisted of patients with well-controlled asthma(mean ACQ score, 0.5), with little evidence of inflammation (theonly abnormality being eosinophilia) and lower frequencies ofTreg cells and IFN-g–secreting CD81 T cells (Fig 4).
Cluster 3 consisted of patients with moderately severe (definedby enrollment criteria) and partially controlled asthma (based onGINA criteria20) despite ICSs; they had the highest bronchodi-lator reversibility and eNO levels. Their pathobiologic profileconsisted of type 2 inflammation, with the highest levels of IL-5 and IL-13 and high frequencies of IL-132secreting TH2 cellsin bronchial biopsy specimens (Fig 5, A, and see Figs E10 toE12 in this article’s Online Repository at www.jacionline.org)but also other T-cell subsets, TH1 cells, TH17 cells, and Treg cells.
Cluster 4 was a small group with later-onset (mean, 28 years)moderately severe disease based on a physician’s assessment,nasal polyposis, salicylate sensitivity, and low IL-17 levels.
Cluster 5 asthmatic patients were older (mean age, 50 years),with high BMI (mean, 32.6 kg/m2), poor lung function, highsymptom scores (mean ACQ score, 2.1), and high treatment re-quirements (predominantly GINA step 4-5 and a mean of 1500mg/d beclomethasone dipropionate equivalent). Their pathobio-logic profile was high type 2 cytokine levels (IL-5 and IL-13),IL-13–secreting CD81 T (TC2) cells (see Fig E13, D, in this arti-cle’s Online Repository at www.jacionline.org), and high tryp-tase, chymase, and carboxypeptidase A3 levels (Figs 4 and 5,C, and see Figs E10 to E12 in this article’s Online Repository).However, when compared with cluster 3 (also type 2 cytokinehigh), cluster 5 had fewer Treg cells and higher ICS use (mean dif-ference, 1250 mg/d).
Cluster 6 was predominantly female, obese (mean BMI,35 kg/m2), and nonatopic, with salicylate sensitivity and lateronset (mean age, 25 years). They were the most severe clusterbased on GINA classification, physician’s assessment, symptomscores (mean ACQ score, 3.2), and lung function (mean prebron-chodilator FEV1, 62%), despite high-dose ICSs (see Fig E12,B, inthis article’s Online Repository at www.jacionline.org) and,frequently (50% of the group), maintenance oral corticosteroids(mean, 14 mg/d prednisolone). Their key pathobiologic featureswere high carboxypeptidase A3 levels and profound MAIT celldeficiency (Figs 4, E, and 5, D, and see Fig E9, D). They alsohad low TC1, TH17, and IL-132secreting TH2 cell numbers

A MAIT cells
MA
IT c
ell f
requ
enci
es(%
CD
3+ c
ells
)
0
2
4
6
8
10
MA
IT c
ell f
requ
enci
es(%
CD
3+ c
ells
)
PBMC Sputum BAL Biopsy
Healthy
Asthma
P=0 02P=0 002P=0.005
0 .0 1
0 .1
1
1 0 * ***
0.1
1
10 * **
0 .1
1
1 0
0 .1
1
1 0
Test for linear trend P <0 0001 Test for linear trend P=0 006
Healthy Mild Moderate Severe Healthy Mild Moderate Severe
B PBMC C Sputum
Healthy Mild Moderate Severe Healthy Mild Moderate Severe
D Bronchoalveolar lavage E Bronchial biopsies
FIG 2. MAIT cells (Va7.21CD1611) as proportions of CD31 T cells in blood, sputum, BAL fluid, and endobron-
chial biopsy specimens in healthy subjects and asthmatic patients (A) and stratified by disease severity (B).
Horizontal lines showmedians. Unpaired t testswere used for log-transformed data.MAIT cell deficiency cor-
relates with severity by linear trends across groups using residuals on log-transformed data (where P < .05).
*P < .05, **P < .01, and ***P < .001, post hoc Dunnett test compared with healthy subjects.
J ALLERGY CLIN IMMUNOL
nnn 2015
6 HINKS ET AL
(see Fig E9, A) but increased tryptase (Figs 4, E, and 5, C) andchymase levels. This cluster contained a higher proportion of par-ticipants who could be classified as cluster 5, as described by theSevere Asthma Research Program9 (see Fig E13, B) and theobese, noneosinophilic cluster reported by Haldar et al.10
The majority of participants with sputum neutrophilia, whichwas defined as neutrophil numbers of greater than 61%,28 were inclusters 5 and 6, whereas eosinophilic asthma was distributedacross clusters 1, 2, 3, and 5 but not clusters 4 or 6 (Fig 4, B).
DISCUSSIONAsthma is a common diseasewith a clinical severity that ranges
frommild forms controlled withb2-agonists alone or low doses ofICSs to very severe forms requiring high doses of ICSs and oralcorticosteroids and, increasingly, biologics, such as the anti-IgE
mAb omalizumab.29 In this study comprehensive analysis of Tcells, granulocytes, cytokines, and mast cell mediators acrossthe airway lumen, mucosa, and blood compartments pointed totheir relative roles within the asthma syndrome that have notbeen recognized before: reducedMAIT cell frequencies as a strik-ing feature that is related to asthma severity, reduced Treg cell fre-quencies in severe disease, and increased mast cell mediatorlevels in patients with severe disease, which is consistent withcorticosteroid-insensitive mast cell activation. This study showsthat the asthma spectrum can be broken down into several multi-dimensional clusters defined by combined clinical parameters andunderlying mechanisms (pathobiology), which provides proof ofconcept for endotyping asthma for better understanding of itsmechanisms and more focused drug development.
Original descriptions of asthma pathobiology3 suggested akey role for TH2 mechanisms. Consistent with this concept,

FIG 3. Bayesian belief network showing the strongest interactions between pathobiologic parameters
across a range of clinical severities of asthma or health. Nodes without strong interactions are excluded.
Line thickness represents strength of interaction (Euclidean distance). Line colors: green, positive associa-
tions; red, negative associations; black, nonlinear associations. Asthma severity is based on overall physi-
cian’s assessment at enrollment (see Table E1). BMI, Body mass index; TC1, CD81IFN-g1 T cells; TC2,
CD81IL-131 T cells.
J ALLERGY CLIN IMMUNOL
VOLUME nnn, NUMBER nn
HINKS ET AL 7
when all the asthmatic patients in this study were compared as agroup with healthy participants, the most significant asthmadiscriminators were airway eosinophilia and higher levels ofmast cell mediators (carboxypeptidase A3, chymase, and tryp-tase), IL-5, IL-13, eNO, and serum IgE but lower IFN-g levels,a pathobiologic profile classically associated with TH2 inflam-mation (Fig 1, A, and see Fig E11). The application of BNAshowed high connectivity between the asthma severity nodeand nodes for mast cell mediators and IL-13– and IFN-g–secreting CD81 cytotoxic T cells (TC2 and TC1 cells, respec-tively) and a strong negative association between MAIT cellfrequencies and asthma severity and ICS consumption.Applying the recently developed TDA method21,22 to thesame data set showed complex multidimensional clusters (ie,possible endotypes defined by a combination of clinicopatho-biologic features).8,11 The advantage of TDA over standardclustering methodologies is that it provides geometric represen-tations of complex and multidimensional data sets that revealand stratify distinct subgroups.22 It combines features of stan-dard statistical methods, such as singular value decompositionsand similarity metrics, to construct a network that clusters mostsimilar data points into nodes. A node in a TDA network rep-resents a group of most similar data points (in this case >_2 sub-jects who are similar in multiple dimensions). Each node can bejoined to the next node if they share common data points (ie,subjects). This allows a natural continuous network when thephenomenon is not disjointed.21 TDA can deal with both linearand nonlinear associations and identifies significant subgroups
in a data-driven manner, allowing for finer stratification.21
Furthermore, TDA is sensitive to both large- and small-scalepatterns that other techniques, such as clustering and multidi-mensional scaling, often do not detect because they sometimesobscure geometric features captured by using topologicalmethods. Hierarchical clustering cannot easily identify thesesubgroups because it tends to separate points that might infact be close in the data.21
The finding of clinicopathobiologic clusters in the data set inthis study should improve our understanding of asthma andinform drug development. Overexpression of the TH2 cytokinenetwork in cluster 1 is similar to the original reports incorticosteroid-naive asthmatic patients, highlighting the role oftype 2 mechanisms in asthmatic patients.3 Clusters 3 and 5 sharemany clinical features, including atopy, allergic rhinitis, andemotion-related symptoms (see this article’s Online Repository).Both are characterized by type 2 inflammation, with the highestlevels of IL-5, IL-13, and IL-10, suggesting that these clustersreflect asthma endotypes that might be particularly suitable for bi-ologics, such as mepolizumab30 and lebrikizumab,31 thatcurrently use indirect biomarkers (ie, eosinophil counts and serumperiostin levels) to select patients to maximize clinical efficacy.However, important differences between these 2 clusters wereidentified: higher Treg cell frequencies in cluster 3 might explaintheir lower corticosteroid requirements, whereas lower IL-13–secreting TH2 cell frequencies and higher tryptase levels in cluster5 suggest distinct, steroid-insensitive mechanisms.32 It should benoted that we stained only for IL-13, and therefore we cannot

FIG 4. A, Multidimensional clinicopathobiologic clusters in asthmatic patients and healthy subjects. Topo-
logical network analysis of clinical and pathobiologic features generates 1 healthy (blue) and 6 distinct clin-
icopathobiologic asthma clusters (1-6). The network is colored by disease severity (GINA classification),
with patients with the most severe disease in red and patients with the milder forms in varying shades of
orange, yellow, and green. B, The same network as Fig 4, A, overlaid with distribution of neutrophilic
(sputum neutrophils >61%, green) or eosinophilic (sputum eosinophils >3%, red) asthma. C, Frequencies
of MAIT cells. D, The network is colored based on average concentrations of the type 2 cytokines IL-4, IL-
5, and IL-13 in serum, sputum, and BAL fluid. E, The network is colored based on concentrations of mast
cell tryptase in sputum and BAL fluid. In Fig 4, B-E, the colors represent concentrations or frequencies,
ranging from low (blue) to high (red) concentrations. The TDA used 62 subjects with most complete
data. The variance normalized Euclidean metric was used. The lenses used were principal and secondary
singular value decomposition (resolution, 32; gain, 4.0/3.53; equalized). Node size is proportional to the
number of subjects in the node.
J ALLERGY CLIN IMMUNOL
nnn 2015
8 HINKS ET AL
exclude an increase in TH2 cells secreting IL-4 or IL-5 in themoresevere asthma clusters. We observed some differences betweenpatterns of cytokine secretion in sputum and BAL fluid, whichmight arise because BAL samples the distal airways and alveoli,whereas sputum measurement reflects changes in more proximalairways.33
The strong association between asthma severity and mast cellmediator levels in clusters 5 and 6 suggests that severe asthma is adisease in which mast cell activation plays an important role. Ourdata add to evidence implicating mast cells in patients with severeasthma, providing additional confirmation that should stimulatethe development of drugs that target mast cells. Brightling et al6

FIG 5. Analysesgenerated fromtheclinicopathobiologicTDAnetwork inFig4showconcentrationsof IL-5aver-
agedacross serum, sputum,andBALfluid (A); eNOconcentrations (B);mast cell tryptase levels inBALfluidand
sputum (C); andMAIT cells in blood, sputum, BAL fluid, and bronchial biopsy specimens (D). Box and whisker
plots showmedians, IQRs, and ranges. Statistical tests indicate 1-way ANOVA, with post hoc t tests compared
with healthy subjects by using the Bonferroni correction. *P < .05, **P < .01, and ***P < .001.
J ALLERGY CLIN IMMUNOL
VOLUME nnn, NUMBER nn
HINKS ET AL 9
have described increased numbers of tryptase-positive mast cellsinfiltrating the airway smoothmuscle in patients withmild and se-vere34 asthma in numbers that correlate with airway hyperrespon-siveness.6,18 In the Severe Asthma Research Program Balzaret al16 reported that severe asthmawas associated with an increasein numbers of bronchial mast cells staining positive for both tryp-tase and chymase and with BAL concentrations of PGD2, a lipidmediator associated with mast cells and shown to increase afterallergen challenge.5
The current study adds to the evidence5,16,35 that mast cell acti-vation is insensitive to corticosteroids and suggests that patientswith severe asthma, in whom mast cell mediator levels areincreased, can be stratified further by clinical features, such asatopic status and also by evidence of type 2 cytokine–mediatedmechanisms in cluster 5 but not cluster 6. We speculate that theanti-IgE antibody omalizumab might exhibit some of its benefi-cial effects in patients with severe atopic asthma through inhibi-tion of IgE-mediated mast cell activation. This finding mightyield a prognostic biomarker for this biologic, which is currentlymissing, and could extend the indication for omalizumab to non-atopic asthma, in which a preliminary trial has suggested clinicalefficacy.36
Several asthma studies have reported increased IL-17levels,37,38 but this study found only limited evidence for TH17cells and none for gd-17 cells during either a period of clinical sta-bility or an exacerbation. This is consistent with the findings of arecent trial in which the anti–IL-17 receptor A mAb brodalumabhad no effect on symptoms or lung function in patients withmoderate-to-severe asthma.39 However, we observed associationsbetween IL-17 concentrations and levels of traditional type 2
biomarkers (airways eosinophils and serum IgE) that have notbeen reported before because IL-17 has mainly been implicatedin neutrophilic inflammation in asthmatic patients.40
Our study also identified, for the first time, reduced numbers ofCD31CD41FOXP31Treg cells in patients with severe asthma. Inhuman subjects some upregulation of the nuclear transcriptionfactor FOXP3 has been observed in nonsuppressive T cells onT-cell receptor stimulation.41 Although we were not able tofurther validate the identity of these FOXP31 TH cells as Tregcells with additional surface markers, we observed low rates ofspontaneous T-cell activation, suggesting that activated T cellswill comprise only a small proportion of the CD31CD41FOXP1
T cells enumerated.An important finding in this study is the striking deficiency of
MAIT cells in both the circulation and lungs, which correlatedstrongly with clinical severity. To our knowledge, MAIT cellshave not yet been studied in any airways disease. This studysuggests that they are more abundant than invariant natural killerT cells,15 comprising up to 10% of blood and airway T cells. Theirmarked evolutionary conservation implies an important role inimmunity.42,43 MAIT cells are the most abundant T-cell subsetable to detect and kill bacteria-infected cells. Recent animalmodels of bacterial airways infection indicate their critical rolein lung host defense.42,44 We found MAIT cell frequencies tobe associated with serum vitamin D3 concentrations and in pilotdata could be suppressed by 1 week of treatment with predniso-lone (see Fig E14 in this article’s Online Repository at www.jacionline.org). The lack of a significant deficiency ofMAIT cellsin BAL fluid might result from low peripheral deposition of ICSsin the more distal airways and alveolar compartments sampled by

J ALLERGY CLIN IMMUNOL
nnn 2015
10 HINKS ET AL
means of lavage.33 Their deficiency in patients with severeasthma, whether primary or resulting from chronic corticosteroiduse, can contribute to increased susceptibility to bacterial infec-tion recognized in patients with severe asthma45,46 and to changesin the airway microbiome47 and might thus effect asthmapathology.44
In summary, this study sheds light on previously unreportedobservations in asthma in relation to disease severity. Theobservation of clusters composed of clinical and pathobiologicparameters will need to be reproduced before these clusters can beaccepted as novel endotypes of asthma. However, this paves theway for future asthma studies in large patient cohorts, such as theSevere Asthma Research Program9 and Unbiased BIOmarkers inPREDiction of respiratory disease outcomes (U-BIOPRED),48 inwhich distinct asthma endotypes could be identified and subse-quently validated, allowing translation to clinical trials androutine clinical practice.
We thank the staff of the NIHR Wellcome Trust Southampton Clinical
Research Facility. We thank Professor Alan Jackson and Dr Stephen Wootton
for their advice on measurements of vitamin D3 and the laboratories of
University Hospital Southampton for conducting the assays. We also thank all
the volunteers who gave of their time and enthusiasm to make this research
possible.
Key messages
d We provide proof of concept for a powerful new analyticapproach to defining multidimensional clinical and path-obiologic clusters: TDA. This underlines the role of mastcells in 2 distinct subgroups of patients with severeasthma characterized by the presence or absence oftype 2 responses.
d Evidence supporting a role for TH17 cells in patients withsevere asthma is limited.
d We describe a striking deficiency of mucosal-associated Tcells, as well as a mild reduction in Treg cell numbers, inpatients with severe asthma.
REFERENCES
1. Mosmann TR, Cherwinski H, Bond MW, Giedlin MA, Coffman RL. Two types of
murine helper T cell clone. I. Definition according to profiles of lymphokine activ-
ities and secreted proteins. J Immunol 1986;136:2348-57.
2. Parronchi P, Macchia D, Piccinni MP, Biswas P, Simonelli C, Maggi E, et al.
Allergen- and bacterial antigen-specific T-cell clones established from atopic do-
nors show a different profile of cytokine production. Proc Natl Acad Sci U S A
1991;88:4538-42.
3. Robinson DS, Hamid Q, Ying S, Tsicopoulos A, Barkans J, Bentley AM, et al.
Predominant TH2-like bronchoalveolar T-lymphocyte population in atopic asthma.
N Engl J Med 1992;326:298-304.
4. Azzawi M, Bradley B, Jeffery PK, Freq AJ, Wardlaw AJ, Knowles G, et al. Iden-
tification of activated T lymphocytes and eosinophils in bronchial biopsies in stable
atopic asthma. Am Rev Respir Dis 1990;142:1407-13.
5. Wenzel SE, Schwartz LB, Langmack EL, Halliday JL, Trudeau JB, Gibbs RL,
et al. Evidence that severe asthma can be divided pathologically into two inflam-
matory subtypes with distinct physiologic and clinical characteristics. Am J Respir
Crit Care Med 1999;160:1001-8.
6. Brightling CE, Bradding P, Symon FA, Holgate ST, Wardlaw AJ, Pavord ID. Mast-
cell infiltration of airway smooth muscle in asthma. N Engl J Med 2002;346:
1699-705.
7. Bousquet J, Chanez P, Lacoste JY, Barneon G, Ghavanian N, Enander I, et al.
Eosinophilic inflammation in asthma. N Engl J Med 1990;323:1033-9.
8. Anderson GP. Endotyping asthma: new insights into key pathogenic mechanisms
in a complex, heterogeneous disease. Lancet 2008;372:1107-19.
9. Moore WC, Meyers DA, Wenzel SE, Teague WG, Li H, Li X, et al. Identification
of asthma phenotypes using cluster analysis in the Severe Asthma Research Pro-
gram. Am J Respir Crit Care Med 2010;181:315-23.
10. Haldar P, Pavord ID, Shaw DE, Berry MA, Thomas M, Brightling CE, et al. Cluster
analysis and clinical asthma phenotypes. Am J Respir Crit Care Med 2008;178:
218-24.
11. Lotvall J, Akdis CA, Bacharier LB, Bjermer L, Casale TB, Custovic A, et al.
Asthma endotypes: a new approach to classification of disease entities within the
asthma syndrome. J Allergy Clin Immunol 2011;127:355-60.
12. Sakaguchi S, Sakaguchi N, Asano M, Itoh M, Toda M. Immunologic self-tolerance
maintained by activated T cells expressing IL-2 receptor alpha-chains (CD25).
Breakdown of a single mechanism of self-tolerance causes various autoimmune
diseases. J Immunol 1995;155:1151-64.
13. Robinson DS, Larche M, Durham SR. Tregs and allergic disease. J Clin Invest
2004;114:1389-97.
14. Fossiez F, Djossou O, Chomarat P, Flores-Romo L, Ait-Yahia S, Maat C, et al. T
cell interleukin-17 induces stromal cells to produce proinflammatory and hemato-
poietic cytokines. J Exp Med 1996;183:2593-603.
15. Vijayanand P, Seumois G, Pickard C, Powell RM, Angco G, Sammut D, et al.
Invariant natural killer T cells in asthma and chronic obstructive pulmonary dis-
ease. N Engl J Med 2007;356:1410-22.
16. Balzar S, Fajt ML, Comhair SA, Erzurum SC, Bleecker E, Busse WW, et al. Mast
cell phenotype, location, and activation in severe asthma. Data from the Severe
Asthma Research Program. Am J Respir Crit Care Med 2011;183:299-309.
17. Djukanovic R, Wilson JW, Britten KM, Wilson SJ, Walls AF, Roche WR, et al.
Quantitation of mast cells and eosinophils in the bronchial mucosa of symptom-
atic atopic asthmatics and healthy control subjects using immunohistochemistry.
Am Rev Respir Dis 1990;142:863-71.
18. Gibson PG, Saltos N, Borgas T. Airway mast cells and eosinophils correlate with
clinical severity and airway hyperresponsiveness in corticosteroid-treated asthma.
J Allergy Clin Immunol 2000;105:752-9.
19. Dusseaux M, Martin E, Serriari N, Peguillet I, Premel V, Louis D, et al. Human
MAIT cells are xenobiotic-resistant, tissue-targeted, CD161hi IL-17-secreting T
cells. Blood 2011;117:1250-9.
20. (Global Initiative for Asthma) GIfA. Global strategy for asthma management and
prevention 2012. http://www.ginasthma.org/ Accessed September 5, 2013.
21. Lum PY, Singh G, Lehman A, Ishkanov T, Vejdemo-Johansson M, Alagappan M,
et al. Extracting insights from the shape of complex data using topology. Sci Rep
2013;3:1236.
22. Carlsson G. Topology and data. Bull Am Math Soc 2009;46:255-308.
23. Djukanovic R, Sterk PJ, Fahy JV, Hargreave FE. Standardised methodology of
sputum induction and processing. Eur Respir J Suppl 2002;37:1s-2s.
24. Mamessier E, Nieves A, Lorec AM, Dupuy P, Pinot D, Pinet C, et al. T-cell acti-
vation during exacerbations: a longitudinal study in refractory asthma. Allergy
2008;63:1202-10.
25. Reshef DN, Reshef YA, Finucane HK, Grossman SR, McVean G, Turnbaugh PJ,
et al. Detecting novel associations in large data sets. Science 2011;334:1518-24.
26. Kearley J, Barker JE, Robinson DS, Lloyd CM. Resolution of airway inflammation
and hyperreactivity after in vivo transfer of CD41CD251 regulatory T cells is
interleukin 10 dependent. J Exp Med 2005;202:1539-47.
27. Juniper EF, O’Byrne PM, Ferrie PJ, King DR, Roberts JN. Measuring asthma con-
trol. Clinic questionnaire or daily diary? Am J Respir Crit Care Med 2000;162:
1330-4.
28. Simpson JL, Scott R, Boyle MJ, Gibson PG. Inflammatory subtypes in asthma:
assessment and identification using induced sputum. Respirology 2006;11:54-61.
29. Busse W, Corren J, Lanier BQ, McAlary M, Fowler-Taylor A, Cioppa GD, et al.
Omalizumab, anti-IgE recombinant humanized monoclonal antibody, for the treat-
ment of severe allergic asthma. J Allergy Clin Immunol 2001;108:184-90.
30. Haldar P, Brightling CE, Hargadon B, Gupta S, Monteiro W, Sousa A, et al. Me-
polizumab and exacerbations of refractory eosinophilic asthma. N Engl J Med
2009;360:973-84.
31. Corren J, Lemanske RF, Hanania NA, Korenblat PE, Parsey MV, Arron JR,
et al. Lebrikizumab treatment in adults with asthma. N Engl J Med 2011;365:
1088-98.
32. Brusselle GG, Maes T, Bracke KR. Eosinophils in the spotlight: eosinophilic
airway inflammation in nonallergic asthma. Nat Med 2013;19:977-9.
33. Staples KJ, Hinks TS, Ward JA, Gunn V, Smith C, Djukanovic R. Phenotypic char-
acterization of lung macrophages in asthmatic patients: overexpression of CCL17.
J Allergy Clin Immunol 2012;130:1404-12.e7.
34. Saha SK, Berry MA, Parker D, Siddiqui S, Morgan A, May R, et al. Increased
sputum and bronchial biopsy IL-13 expression in severe asthma. J Allergy Clin Im-
munol 2008;121:685-91.

J ALLERGY CLIN IMMUNOL
VOLUME nnn, NUMBER nn
HINKS ET AL 11
35. Balzar S, Chu HW, Strand M, Wenzel S. Relationship of small airway chymase-
positive mast cells and lung function in severe asthma. Am J Respir Crit Care
Med 2005;171:431-9.
36. Garcia G, Magnan A, Chiron R, Contin-Bordes C, Berger P, Taille C, et al. A
proof-of-concept, randomized, controlled trial of omalizumab in patients with se-
vere, difficult-to-control, nonatopic asthma. Chest 2013;144:411-9.
37. Molet S, Hamid Q, Davoine F, Nutku E, Taha R, Page N, et al. IL-17 is increased in
asthmatic airways and induces human bronchial fibroblasts to produce cytokines.
J Allergy Clin Immunol 2001;108:430-8.
38. Bullens DM, Truyen E, Coteur L, Couteur L, Dilissen E, Hellings PW, et al. IL-17
mRNA in sputum of asthmatic patients: linking T cell driven inflammation and
granulocytic influx? Respir Res 2006;7:135.
39. Busse WW, Holgate S, Kerwin E, Chon Y, Feng J, Lin J, et al. Randomized,
double-blind, placebo-controlled study of brodalumab, a human anti-IL-17 recep-
tor monoclonal antibody, in moderate to severe asthma. Am J Respir Crit Care Med
2013;188:1294-302.
40. McKinley L, Alcorn JF, Peterson A, Dupont RB, Kapadia S, Logar A, et al. TH17
cells mediate steroid-resistant airway inflammation and airway hyperresponsive-
ness in mice. J Immunol 2008;181:4089-97.
41. Fontenot JD, Gavin MA, Rudensky AY. Foxp3 programs the development and
function of CD41CD251 regulatory T cells. Nat Immunol 2003;4:330-6.
42. Kjer-Nielsen L, Patel O, Corbett AJ, Le Nours J, Meehan B, Liu L, et al. MR1
presents microbial vitamin B metabolites to MAIT cells. Nature 2012;49:
717-23.
43. Brossay L, Chioda M, Burdin N, Koezuka Y, Casorati G, Dellabona P, et al. CD1d-
mediated recognition of an alpha-galactosylceramide by natural killer T cells is
highly conserved through mammalian evolution. J Exp Med 1998;188:1521-8.
44. Meierovics A, Yankelevich WJ, Cowley SC. MAIT cells are critical for optimal
mucosal immune responses during in vivo pulmonary bacterial infection. Proc
Natl Acad Sci U S A 2013;110:E3119-28.
45. Talbot TR, Hartert TV, Mitchel E, Halasa NB, Arbogast PG, Poehling KA, et al.
Asthma as a risk factor for invasive pneumococcal disease. N Engl J Med 2005;
352:2082-90.
46. Klemets P, Lyytikainen O, Ruutu P, Ollgren J, Kaijalainen T, Leinonen M, et al.
Risk of invasive pneumococcal infections among working age adults with asthma.
Thorax 2010;65:698-702.
47. Green BJ, Wiriyachaiporn S, Grainge C, Rogers GB, Kehagia V, Lau L, et al.
Potentially pathogenic airway bacteria and neutrophilic inflammation in treatment
resistant severe asthma. PLoS One 2014;9:e100645.
48. Auffray C, Adcock IM, Chung KF, Djukanovic R, Pison C, Sterk PJ. An integrative
systems biology approach to understanding pulmonary diseases. Chest 2010;137:
1410-6.
Copyright © 2022 FDOKUMEN