Techno-economical study of biogas production improved by steam explosion pretreatment
Upload
khangminh22Category
view
1download
0
HAL Id: tel-02976265https://hal.univ-lorraine.fr/tel-02976265
Submitted on 23 Oct 2020
HAL is a multi-disciplinary open accessarchive for the deposit and dissemination of sci-entific research documents, whether they are pub-lished or not. The documents may come fromteaching and research institutions in France orabroad, or from public or private research centers.
L’archive ouverte pluridisciplinaire HAL, estdestinée au dépôt et à la diffusion de documentsscientifiques de niveau recherche, publiés ou non,émanant des établissements d’enseignement et derecherche français ou étrangers, des laboratoirespublics ou privés.
New insights on the explosion severity of nanopowders:a nano-grain of sand in the gears of the standards
Audrey Santandrea
To cite this version:Audrey Santandrea. New insights on the explosion severity of nanopowders: a nano-grain of sand inthe gears of the standards. Chemical and Process Engineering. Université de Lorraine, 2020. English.�NNT : 2020LORR0104�. �tel-02976265�
AVERTISSEMENT
Ce document est le fruit d'un long travail approuvé par le jury de soutenance et mis à disposition de l'ensemble de la communauté universitaire élargie. Il est soumis à la propriété intellectuelle de l'auteur. Ceci implique une obligation de citation et de référencement lors de l’utilisation de ce document. D'autre part, toute contrefaçon, plagiat, reproduction illicite encourt une poursuite pénale. Contact : [email protected]
LIENS Code de la Propriété Intellectuelle. articles L 122. 4 Code de la Propriété Intellectuelle. articles L 335.2- L 335.10 http://www.cfcopies.com/V2/leg/leg_droi.php http://www.culture.gouv.fr/culture/infos-pratiques/droits/protection.htm

[1]
LABORATOIRE REACTIONS ET GENIE DES PROCEDES, CNRS, UMR 7274
ECOLE DOCTORALE :
Sciences et Ingénieries des Molécules, des Produits, des Procédés et de l’Energie
THESIS
Presented and defended publicly on:
June 15th, 2020
for obtaining a
PhD title from the University of Lorraine
In Process and Product Engineering and Molecules
by
Audrey SANTANDREA
Chemical Engineer - ENSIC
New insights on the explosion severity of nanopowders:
a nano-grain of sand in the gears of the standards
Composition of the Jury:
Referees: Mrs. Valérie TSCHAMBER Pr. Univ. Haute-Alsace
Mr. Fabien HALTER Pr. Univ. Orléans
Members: Mrs. Sophie TRELAT Dr. Ing. IRSN
Mrs. Agnès JANES Dr. Ing. CRAMIF
Mr. Jean-François BRILHAC Pr. Univ. Haute-Alsace
Mr. Arne KRIETSCH Dr. Ing. BAM Berlin
Mr. Alexis VIGNES Dr. Ing. INERIS (Thesis Supervisor)
Mr. Olivier DUFAUD Pr. Univ. Lorraine (Thesis Director)
Guest : Mr. Laurent PERRIN Pr. Univ. Lorraine (Thesis Co-director)

[1]
[2]
Remerciements
Je souhaite dans un premier temps remercier l’Institut National de l’Environnement Industriel
et des Risques (INERIS) d’avoir financé cette thèse et le Laboratoire Réactions et Génie des
Procédés (LRGP) d’avoir rendu ces travaux possibles.
Je tiens à adresser mes plus sincères remerciements à mon directeur de thèse, Olivier Dufaud.
Merci pour ta disponibilité, ton soutien permanent, ta patience et ton intérêt pour mes idées
parfois farfelues, mais également pour ton côté humain et ta gentillesse. Merci pour tous nos
échanges, à la fois professionnels et personnels, et d’avoir cru en moi quand moi-même je ne
le faisais pas (sauf peut-être pour Kansas City 😉). Toujours viser le top !
Je remercie également mon co-directeur de thèse, Laurent Perrin, pour sa confiance et sa
disponibilité. Merci pour tes petites histoires et anecdotes au café, et surtout d’avoir fourni la
preuve que non, je ne « voyais pas des lumières » !
Un grand merci également à Alexis Vignes pour ses encouragements et sa bienveillance. Merci
pour ton enthousiasme et ton intérêt, ainsi que pour nos nombreuses conversations,
professionnelles ou non, et tes conseils avisés.
Mes remerciements vont aux membres du jury, qui ont eu l’amabilité d’accepter de lire et de
juger ce travail de thèse. Un grand merci pour avoir été si conciliants concernant les conditions
particulières de la soutenance de thèse.
Je voudrais également remercier le personnel du LRGP, et plus particulièrement les membres
de l’équipe SAFE, pour leur accueil lors de cette thèse. Merci, entre autres, à Stéphanie, Léa,
Nathalie, Augustin, Dominique et Jean-Christophe pour votre présence, votre gentillesse et
votre soutien. Un merci tout particulier à André Laurent pour nos échanges, son support et sa
confiance. Merci d’avoir tout fait pour être présent à ma soutenance.
Je tiens également à remercier Stéphanie Pacault et Jean-François Remy pour leur aide au
niveau expérimental. Merci également au service électronique et à l’atelier, et plus
particulièrement à David Brunello et à Christian Blanchard, pour leur support concernant le
développement de nouvelles manips.
Je souhaite remercier toutes les personnes que j’ai eu l’occasion de rencontrer et qui ont rendu
ces trois années plus qu’agréables grâce à leur sympathie et leur bonne humeur : Nicolas,
Mathieu, Marine, Xiaojin, Eloïse, Florine, Jean-Patrick ainsi que ceux que je n’ai pas cités.
Et enfin, un énorme merci à ma famille, plus particulièrement ma mère et ma sœur, et à Adrien
pour m’avoir soutenue et encouragée tout au long de ce projet.
Merci à toutes et à tous !
[3]
Abstract
By definition, nanoparticles exhibit at least one dimension below 100 nm. This small size
implies a high specific surface area, which induces original properties when compared to
micropowders, such as chemical, mechanical, optical or biological properties. Among these
new specificities, nanoparticles are subjected to weak cohesion forces, such as van der Waals,
electrostatic or capillary forces, which cause them to agglomerate in a reversible way. However,
dust explosions require the dispersion of the dust in the air, which can lead to a breakage of
these agglomerates. The aim of this work is then to study the influence of nanoparticles
specificities, notably the agglomeration, on their ignition sensitivity and explosion severity, and
evaluate the adequacy of the international standard methods to determine these parameters
when it comes to nanoparticles.
Four types of powders were chosen to highlight the specific behavior of each type of
combustible powder, i.e. carbonaceous, organic or metallic: carbon black, nanocellulose,
aluminum and carbon-coated silicon. The powders were characterized by Scanning Electron
Microscopy (SEM), specific surface measurement and helium pycnometer, and their particle
size distribution (PSD) was measured before and after dispersion using different methods. The
mean surface diameter, used to consider the high surface area of nanoparticles, considerably
decreases after the injection in the 20L sphere, which is the standard equipment to measure the
explosion severity of a dust. This observation highlighted the necessity to characterize the dust
not only before dispersion, but also after injection in the 20L sphere, to accurately evaluate the
explosion risk. Ignition and explosion tests were conducted in standard conditions, but also by
varying the powder preparation (aging, drying, sieving, agglomeration), and the operating
conditions (dispersion procedure, ignition energy, initial turbulence). Specific behaviors related
to the powder nature (carbonaceous, organic or metallic) were then observed, discussed, and
alternative measurement methods were proposed. For instance, alternative dispersion nozzles
were tested to provide a better cloud homogeneity or to reproduce industrial release conditions.
Dispersion procedure and ignition source should be adapted to the minimum ignition energy of
the nanopowders to avoid both pre-ignition and overdriving. Variation of the ignition delay
time can be helpful to obtain the most conservative results.
One of the main proposals consists in the consideration of the laminar burning velocity as a
standard characteristic of the explosion severity. Experiments were conducted in a flame
propagation tube and a vented 20L sphere to evaluate the unstretched burning velocity of
nanocellulose. The results were then compared to an existing correlation based on the pressure-
time evolution during standard experiments. Furthermore, a flame propagation model, initially
designed for hybrid mixtures, was adapted to the flame propagation in a cloud of organic
nanoparticles, showing consistent results with the experiments.

[4]
Résumé
Par définition, les nanoparticules possèdent au moins une dimension inférieure à 100 nm. Cette
petite taille induit une grande surface spécifique, qui procure des propriétés inédites, notamment
chimiques, mécaniques, optiques ou biologiques, comparées aux particules micrométriques.
Parmi ces nouvelles spécificités, les nanoparticules sont soumises à des forces de cohésion plus
intenses, telles que des forces de van der Waals, électrostatiques ou capillaires, ce qui les amène
à s’agglomérer de manière réversible. Cependant, une explosion de poussières nécessite une
dispersion de la poudre dans l’air, ce qui peut mener à une fragmentation de ces agglomérats.
L’objectif de ce travail est ainsi d’étudier l’influence des spécificités des nanoparticules,
notamment de l’agglomération, sur leur sensibilité à l’inflammation et leur sévérité d’explosion,
et d’évaluer l’adéquation des méthodes définies par les standards internationaux pour la
détermination de ces paramètres concernant les nanoparticules.
Quatre types de poudres ont été considérées pour mettre en lumière le comportement spécifique
de chaque type de combustible, c’est-à-dire les poudres carbonées, organiques ou métalliques :
noirs de carbone, nanocellulose, aluminium et silicium enrobé de carbone. Les poudres ont été
caractérisées par microscopie électronique à balayage, mesure de surface spécifique et
pycnométrie hélium. De plus, leur distribution de tailles de particules a été mesurée avant et
après dispersion à l’aide de méthodes complémentaires. Le diamètre moyen en surface diminue
significativement après l’injection dans la sphère de 20L, qui est l’équipement standard utilisé
pour la mesure de la sévérité d’explosion. Cette observation prouve la nécessité de caractériser
la poudre non seulement avant dispersion, mais aussi après injection dans la sphère de 20L,
pour évaluer le risque d’explosion de manière fiable. Des essais d’inflammation et d’explosion
ont été réalisés dans des conditions standards, mais aussi modifiant la préparation de la poudre
(vieillissement, séchage, tamisage, agglomération) ainsi que les conditions opératoires
(procédure de dispersion, énergie d’inflammation, turbulence initiale). Des comportements
spécifiques liés à la nature de la poudre (carbonée, organique ou métallique) ont été observés,
discutés, et des méthodes alternatives de mesure ont été proposées. Par exemple, des buses de
dispersion alternatives ont été testées afin de garantir une meilleure homogénéité des nuages
poudres/air ou reproduire les conditions réelles de génération. La procédure de dispersion et la
source d'inflammation doivent être adaptées à l'énergie d'allumage minimale des nanopoudres
pour éviter à la fois les phénomènes de pré-inflammation et ‘d’overdriving’. Une variation du
délai d’inflammation est également préconisée pour obtenir des résultats les plus conservateurs.
Enfin, l’une des principales propositions consiste à considérer la vitesse laminaire de flamme
comme un paramètre standard représentant la sévérité d’explosion. Des tests ont été réalisés
dans un tube de propagation de flamme et dans une sphère éventée pour évaluer la vitesse non
étirée de la nanocellulose. Les résultats obtenus ont alors été comparés à une corrélation
existante basée sur l’évolution de la pression en fonction du temps lors d’essais standards. De
plus, un modèle de propagation de flamme, initialement développée pour des mélanges
hybrides, a été adapté pour représenter la propagation de flamme dans un nuage de
nanoparticules et a montré des résultats en adéquation avec les résultats expérimentaux.

[5]
Contents
Abstract ______________________________________________ 3
Résumé ______________________________________________ 4
Contents _____________________________________________ 5
List of figures _________________________________________ 9
List of tables _________________________________________ 14
Nomenclature ________________________________________ 16
Chapter 1: Introduction _________________________________ 20
Chapter 2: Generalities on dust explosion ___________________ 24
II.1. A glimpse on the industrial context: feedback and
regulation__ _________________________________________ 25
II.2. Dust explosions phenomenology _____________________ 28
II.2.1. Ignition sensitivity ________________________________________________ 29
II.2.2. Explosion severity ________________________________________________ 32
II.2.3. Burning velocity __________________________________________________ 34
II.2.4. Parameters affecting dust explosions __________________________________ 36
II.2.5. Decreasing the particle size… _______________________________________ 38
II.3. Nanomaterials ___________________________________ 39
II.3.1. Generalities on nanomaterials________________________________________ 39
II.3.2. Agglomeration forces ______________________________________________ 40
II.3.3. Agglomerates breakage ____________________________________________ 43
II.4. Nanoparticles explosions ___________________________ 46
II.4.1. Reaction mechanisms ______________________________________________ 46
II.4.2. Ignition sensitivity ________________________________________________ 48
II.4.3. Explosion severity ________________________________________________ 48
II.4.4. Radiative heat transfer _____________________________________________ 49
Summary____________________________________________ 51
Résumé _____________________________________________ 52

[6]
Chapter 3: Powder and dust cloud characterization ___________ 53
III.1. Powder properties ________________________________ 54
III.1.1. Powder description _______________________________________________ 54
III.1.2. Nanomaterial classification and characterization ________________________ 57
III.1.3. Particle size distribution (PSD) of the powders _________________________ 59
III.2. Dust cloud properties _____________________________ 61
III.2.1. Powders dustiness ________________________________________________ 61
III.2.2. Particle size distribution (PSD) of nanopowders clouds ___________________ 62
III.2.3. Initial turbulence _________________________________________________ 67
III.3. Dimensional analysis of dust dispersion ______________ 69
III.3.1. Determination of the dimensionless numbers ___________________________ 69
III.3.2. Proposal of a correlation describing the dispersion of an agglomerated powder 71
III.3.3. Validation of the correlation ________________________________________ 75
Summary____________________________________________ 77
Résumé _____________________________________________ 78
Chapter 4: Standard evaluation of flammability and explosivity _ 79
IV.1. Ignition sensitivity ________________________________ 80
IV.1.1. Minimum Ignition Energy__________________________________________ 80
IV.1.2. Minimum Ignition Temperature _____________________________________ 82
IV.1.3. Lower Explosion Limit ____________________________________________ 83
IV.1.4. Ignition sensitivity of the powders ___________________________________ 83
IV.1.5. Dimensional analysis: dust cloud ignition _____________________________ 85
IV.2. Explosion severity ________________________________ 89
IV.2.1. Definition and measurement ________________________________________ 89
IV.2.2. Explosion severity of the considered powders __________________________ 91
IV.3. Questioning the standards… ________________________ 95
Summary____________________________________________ 98
Résumé _____________________________________________ 99
Chapter 5: Standards versus reality _______________________ 100

[7]
V.1. Stronger together? Influence of the agglomeration on
nanopowders explosion _______________________________ 102
V.1.1. Effects of PSD selection ___________________________________________ 102
V.1.2. Effects of mechanical agglomeration _________________________________ 105
V.2. To the last drop: influence of humidity _______________ 116
V.2.1. Powder aging ___________________________________________________ 116
V.2.2. Influence of water activity on dust explosions __________________________ 118
V.3. Too much is a waste: role of the ignition energy ________ 121
V.4. Too sensitive or too violent: some considerations on pre-
ignition ____________________________________________ 123
V.5. Scattering little things: nanopowders dispersion in the 20L
sphere _____________________________________________ 126
V.5.1. Nozzle modification ______________________________________________ 126
V.5.2. Injection procedure _______________________________________________ 130
V.6. Punctuality is the politeness of kings: influence of the ignition
delay time __________________________________________ 134
Summary___________________________________________ 139
Résumé ____________________________________________ 140
Chapter 6: Flame propagation study ______________________ 142
VI.1. Experimental determination _______________________ 144
VI.1.1. Flame propagation visualization ____________________________________ 145
VI.1.2. Pressure-time evolution interpretation _______________________________ 156
VI.1.3. Comparison of the laminar burning velocities _________________________ 156
VI.1.4. On the application of the correlation _________________________________ 159
VI.1.5. Influence of the dust concentration __________________________________ 162
VI.2. One dimensional modelling of flame propagation ______ 163
VI.2.1. Model principle _________________________________________________ 164
VI.2.2. Influence of the pyrolysis step _____________________________________ 168
VI.2.3. Influence of the radiative heat transfer _______________________________ 170
VI.3. Application of turbulent velocity models ______________ 173

[8]
Summary___________________________________________ 176
Résumé ____________________________________________ 177
Chapter 7: Conclusion _________________________________ 179
Conclusion (English) _________________________________ 180
7.1. Main results _____________________________________ 180
7.1.1. Dust dispersion __________________________________________________ 180
7.1.2. Dust ignition ____________________________________________________ 181
7.1.3. Dust explosion ___________________________________________________ 182
7.1.4. Flame propagation ________________________________________________ 182
7.2. Come up to standard ! _____________________________ 184
7.2.1. Sample preparation _______________________________________________ 184
7.2.2. Test procedure ___________________________________________________ 185
7.2.3. Test report ______________________________________________________ 187
7.2.4. Flame propagation ________________________________________________ 187
7.2.5. Further considerations _____________________________________________ 187
7.3. Perspectives for further works _______________________ 188
Conclusion (French) _________________________________ 190
Principaux résultats __________________________________ 190
Dispersion de la poudre _________________________________________________ 190
Inflammation du nuage _________________________________________________ 191
Explosion ____________________________________________________________ 192
Propagation de flamme _________________________________________________ 193
Perspectives ________________________________________ 193
Appendix 1: SEM images _______________________________ 196
Appendix 2: A Monte Carlo Simulation ____________________ 207
Appendix 3: Case studies________________________________ 216
References ___________________________________________ 220
[9]
List of figures
Figure 2-1 Requirements to generate a dust explosion ______________________________ 28
Figure 2-2 Schematic of the front flame propagation divided into four zones for organic
particles in air (Haghiri and Bidabadi, 2010) _____________________________________ 34
Figure 2-3 Explosion characteristics as a function of aluminum particle size (Baudry, 2007;
Jacobson et al., 1964; Nagy and Verakis, 1983) ___________________________________ 39
Figure 2-4 Illustration of a primary particle, an aggregate and an agglomerate ___________ 41
Figure 2-5 Useful geometric considerations to present van der Waals forces between two
spherical particles __________________________________________________________ 41
Figure 2-6 Liquid meniscus between two spherical particles (Seville et al., 2000) ________ 43
Figure 2-7 Example of ideal (dotted line) and real (solid line) fracture of an agglomerate
(Rumpf, 1962) _____________________________________________________________ 43
Figure 2-8 Agglomerate fracture model according to Kendall (1988) __________________ 44
Figure 2-9 Theoretical models of agglomerate fracture according to Rumpf (left) and Weiler
(right) (Weiler et al., 2010) ___________________________________________________ 45
Figure 2-10 Scheme of an aluminum particle with the oxide layer, surface reaction and oxygen
diffusion (Rai et al., 2006)____________________________________________________ 47
Figure 2-11 Flame propagation at an ignition delay time of 60 ms for a 12%v. methane/air
mixture a) alone and b) containing 30 mg of carbon black nanoparticles (Torrado, 2017) __ 50
Figure 2-12 Spatial distribution of light scattering for particles of different sizes (Ben Moussa,
2017) ____________________________________________________________________ 50
Figure 3-1 SEM image of aluminum 100 nm _____________________________________ 55
Figure 3-2 SEM image of aluminum 40-60 nm ___________________________________ 55
Figure 3-3 SEM image of carbon black _________________________________________ 56
Figure 3-4 SEM image of silicon coated by carbon ________________________________ 56
Figure 3-5 SEM image of nanocellulose _________________________________________ 57
Figure 3-6 Simplified flow-chart of the method proposed in the NanoDefine project and
explained by Wohlleben et al. (2017) ___________________________________________ 58
Figure 3-7 Histogram of the number granulometric distribution of aerosols emitted by the a)
carbon black and b) nanocellulose by the vortex shaker method (experiments performed by
INRS) ___________________________________________________________________ 62
Figure 3-8 FMPS measurements of a) aluminum and b) nanocellulose powders __________ 63
Figure 3-9 Experimental set-up for the particle size distribution measurement in the
visualization 20L sphere using the laser diffraction sensor (D’Amico, 2016) ____________ 65

[10]
Figure 3-10 Particle size distribution of the powders measured by laser diffraction at the
moment of ignition (R1 lens) _________________________________________________ 66
Figure 3-11 Particle size distribution of the studied powders measured by R3 lens________ 66
Figure 3-12 Experimental arrangement for Particle Image Velocimetry analyses - from Vizcaya
et al. (2018) _______________________________________________________________ 67
Figure 3-13 Evolution of the root-mean square velocity with time after dispersion _______ 68
Figure 3-14 Comparison between the measured and correlated mean surface diameters after
dispersion in the 20L sphere __________________________________________________ 76
Figure 4-1 a) Modified Hartmann tube (TÜV SÜD Schweiz AG, 2020) b) Modified Hartmann
tube during an ignition ______________________________________________________ 81
Figure 4-2 Results of MIE test for nanocellulose, E1 = 10 mJ, E2 = 30 mJ, MIE = 16 mJ ___ 82
Figure 4-3 a) Schema of the Godbert-Greenwald oven (Xu et al., 2017) and b) Godbert-
Greenwald oven during an ignition _____________________________________________ 83
Figure 4-4 Pyrolysis limiting regimes according to the particle size, the external temperature
and the kinetic model of Di Blasi and Branca (2001) (from Cuervo (2015)) _____________ 88
Figure 4-5 Siwek 20L sphere from a) TÜV SÜD Schweiz AG (2020) and b) EN 14034-1-2
(2004; 2006) ______________________________________________________________ 90
Figure 4-6 Pressure-time evolution during an explosion in the 20L sphere ______________ 91
Figure 4-7 Evolution of the explosion overpressure with the concentration for the raw powders
in standard conditions _______________________________________________________ 92
Figure 4-8 Evolution of the rate of pressure rise with the concentration for the raw powders in
standard conditions _________________________________________________________ 93
Figure 5-1 Main influences of the powder and process properties on the dust cloud (dispersion),
the ignition and the flame propagation__________________________________________ 101
Figure 5-2 Particle size distribution of raw and sieved nanocellulose after injection in the 20L
at the moment of ignition ___________________________________________________ 103
Figure 5-3 Effects of nanocellulose sieving on a) the maximum overpressure and b) the
maximum rate of pressure rise _______________________________________________ 104
Figure 5-4 Nanocellulose observed by Scanning Electron Microscopy a) Raw powder b)
Agglomerated powder ______________________________________________________ 106
Figure 5-5 Particle size distribution of the raw and agglomerated nanocellulose after dispersion
in the 20L sphere __________________________________________________________ 106
Figure 5-6 SEM images of a) raw starch powder and b) a starch agglomerate generated by dry
granulation_______________________________________________________________ 107
Figure 5-7 Evolution of the rate of pressure rise of starch with a) the mass concentration and b)
the surface concentration ____________________________________________________ 108
[11]
Figure 5-8 Carbon-coated silicon observed by Scanning Electron Microscopy a) Raw powder
b) Sample A1 (260 g.L-1) c) Sample A2 (400 g.L-1) d) Sample B (400 g.L-1) ___________ 109
Figure 5-9 Particle size distribution of the four samples of carbon-coated silicon after dispersion
in the 20L at the moment of explosion (R1-R3-R5 lenses) __________________________ 111
Figure 5-10 Evolution of the a) maximum overpressure and b) maximum rate of pressure rise
with the mass concentration of the four samples of carbon-coated silicon ______________ 113
Figure 5-11 Evolution of the a) maximum overpressure and b) maximum rate of pressure rise
with the surface concentration of the four samples of carbon-coated silicon ____________ 113
Figure 5-12 Evolution of the stabilized pressure after explosion in the 20L sphere with the mass
concentration of the different samples of carbon-coated silicon ______________________ 115
Figure 5-13 SEM image of carbon black agglomerates in a) 2006, b) 2017 (raw powder) and c)
2017 (dry powder) _________________________________________________________ 117
Figure 5-14 Evolution of the explosion a) overpressure and b) rate of pressure rise with the
concentration for carbon black powder in 2006 and 2017 (raw and dry) _______________ 118
Figure 5-15 a) Overpressure and b) rate of pressure rise of raw or dried carbon black as a
function of the relative humidity in the 20L sphere _______________________________ 119
Figure 5-16 Hydrogen content in the burnt gases after dried carbon nanopowder explosion in
the 20L sphere using standard or modified injection procedure ______________________ 120
Figure 5-17 Evolution of explosion characteristics of aluminum nanopowder in standard
conditions (10 kJ - 60 ms) ___________________________________________________ 123
Figure 5-18 Pressure after explosion and cooling of the sphere at different aluminum
nanopowder concentrations for standard injection and nitrogen injection.______________ 124
Figure 5-19 Pressure-time evolution of an aluminum explosion at 750 g.m-3 with a) air injection
b) nitrogen injection. _______________________________________________________ 125
Figure 5-20 Electrical signal of the electrovalve (blue lower curve) and of the ignition (yellow
upper curve) for ignition delay times of a) 60 ms and b) 120 ms _____________________ 126
Figure 5-21 Schemas of the a) rebound nozzle and b) symmetric nozzle – from Murillo et al.
(2018) __________________________________________________________________ 127
Figure 5-22 Evolution of the a) overpressure and b) rate of pressure rise with the concentration
of carbon black using the rebound and symmetric nozzles __________________________ 128
Figure 5-23 Representation of the a) slotted cylindrical nozzle and b) perforated cylindrical
nozzle (dimensions in mm) __________________________________________________ 129
Figure 5-24 Effect of the nozzle on the particle size distribution of nanocellulose particles 60
ms after dispersion_________________________________________________________ 129
Figure 5-25 Effect of the injection procedure on the particle size distribution of carbon black
nanoparticles at the moment of ignition (tv = 60 ms) ______________________________ 131

[12]
Figure 5-26 Evolution of the root-mean square velocity with time after dispersion for different
dispersion procedures ______________________________________________________ 132
Figure 5-27 Evolution of the a) overpressure and b) rate of pressure rise of aluminum 100 nm
for various injection procedures ______________________________________________ 133
Figure 5-28 a) Time evolution of the root-mean-square velocity within the 20L sphere during a
standard injection for various ignition delay times b) Modifications of the injection dynamic for
various ignition delay times _________________________________________________ 135
Figure 5-29 Particle size distribution of nanocellulose at the moment and place of ignition for
different ignition delay times ________________________________________________ 136
Figure 5-30 Evolution of a) the maximum overpressure and b) the maximum rate of pressure
rise with the root-mean square velocity in the 20L sphere __________________________ 137
Figure 5-31 Evolution of the CO/CO2 ratio of the combustion gases of nanocellulose and
carbon black with the root-mean square velocities ________________________________ 138
Figure 6-1 Representation of the existing methods to assess the explosion risk in an industrial
situation _________________________________________________________________143
Figure 6-2 Schematic of the Schlieren setup and the modified 20L sphere _____________ 146
Figure 6-3 Time evolution of the flame profile in the semi-open tube for a dispersion of 500
g.m-3 of nanocellulose at 340 ms ignition delay time _____________________________ 148
Figure 6-4 Illustration of the burning velocity – stretching factor relation for a 500 g.m-3
nanocellulose-air mixture for tv = 340 ms ______________________________________ 151
Figure 6-5 Evolution of the front flame position, flame area and cross-section with time for a
500 g.m-3 nanocellulose-air mixture for tv = 340 ms ______________________________ 151
Figure 6-6 Illustration of the burning velocity – stretching factor relation after smoothing for a
500 g.m-3 nanocellulose-air mixture for tv = 340 ms ______________________________ 152
Figure 6-7 Flame propagation of 500 g.m-3 of nanocellulose in the tube 5 ms and 20 ms after
ignition for different ignition delay times a) 125 ms b) 235 ms c) 450 ms ______________ 153
Figure 6-8 Evolution of the laminar burning velocity of 500 g.m-3 of nanocellulose with ignition
delay time calculated by the linear and nonlinear relations in a) the propagation tube b) the
vented 20L sphere _________________________________________________________ 154
Figure 6-9 Comparison of linear and nonlinear methods applied to a nanocellulose explosion:
500 g.m-3 concentration, tv=452 ms – tube and tv=380 ms – vented sphere ____________ 155
Figure 6-10 Explosion in the vented 20L sphere and b) visualization of the flame kernel 5 ms
and 10 ms after ignition of 500 g.m-3 of nanocellulose and ignition delay time of 300 ms _ 155
Figure 6-11 Evolution of the laminar burning velocity with the root mean square velocity in the
flame propagation tube and in the vented 20L sphere______________________________ 157
Figure 6-12 Evolution of the laminar burning velocity with the root-mean square velocity in the
flame propagation tube, the vented 20L sphere and the standard 20L sphere ___________ 158

[13]
Figure 6-13 Evolution of the correlation coefficient to calculate the laminar burning velocity
with the root-mean square velocity in the 20L sphere _____________________________ 161
Figure 6-14 Evolution of the laminar burning velocity calculated by a semi-empiric correlation
with the mass concentration _________________________________________________ 163
Figure 6-15 Initial composition of the nanocellulose pyrolysis gases/air mixture considered in
the flame propagation model _________________________________________________ 165
Figure 6-16 Schema of the initial conditions of the temperature and fuel fraction in each zone
of the flame (adapted from Torrado et al. (2018)) ________________________________ 167
Figure 6-17 Evolution of the temperature with time for different control volumes when
modelling the flame propagation of nanocellulose (quiescent conditions, 500 g.m-3) _____ 168
Figure 6-18 Evolution of the flame front position with time during the combustion of
nanocellulose pyrolysis gases ________________________________________________ 169
Figure 6-19 Influence of the a) primary diameter and b) dust concentration considered for the
radiative heat transfer during the combustion of 500 g.m-3 of nanocellulose ___________ 171
Figure 6-20 Influence of the total surface area of the particles implied in the radiative heat
transfer on the flame velocity ________________________________________________ 172
Figure 6-21 Comparison between models listed in Table 6-7 and experimental turbulent burning
velocities measured in the flame propagation tube ________________________________ 174
Figure 7-1 Proposal of standard procedures modifications for the determination of the explosion
severity__________________________________________________________________186
Figure A-1 a) Particle propagating toward an agglomerate and b) particle added to the
agglomerate______________________________________________________________ 208
Figure A-2 Estimation of the fractal dimension of some generated agglomerates ________ 209
Figure A-3 Particles of an agglomerate (Df = 2) covered by dioxygen molecules_________210
Figure A-4 Algorithm flow chart of the molecule propagation and adsorption to the
agglomerate______________________________________________________________ 211
Figure A-5 Evolution of oxygen accessibility with the number of molecules received on the
agglomerates of 15 particles with a primary diameter of 10 nm______________________ 213
Figure A-6 Evolution of the oxygen accessibility toward agglomerates with the fractal
dimension________________________________________________________________215
Figure A-7 Evolution of the oxygen accessibility with the number of particles in agglomerates
of different fractal dimensions________________________________________________ 215
Figure A-8 Scheme of a co-current spray tower equipped with a vibrating bed (from Chaineaux
(2004))__________________________________________________________________ 218
[14]
List of tables
Table 2-1 Definition of ATEX zones concerning dust according to ATEX directive 1999/92/CE
_________________________________________________________________________ 27
Table 2-2 Standard test methods and equipment for the determination of ignition sensitivity
parameters of dust clouds ____________________________________________________ 32
Table 2-3 Classification of powders into St classes ________________________________ 33
Table 2-4 Values of Hamaker constant for the considered compounds _________________ 42
Table 2-5 MIE of aluminum particles (Dufaud et al., 2011) __________________________ 48
Table 2-6 Explosion severity of different aluminum powders (Dufaud et al., 2011; Vignes et
al., 2019) _________________________________________________________________ 49
Table 3-1 Characteristics of the powders and application of the VSSA method __________ 59
Table 3-2 Mean surface diameter of the powders measured by wet dispersion and dry
sedimentation______________________________________________________________ 60
Table 3-3 Number and mass-based dustiness in the respirable fraction of carbon black and
nanocellulose (experiments performed by INRS) __________________________________ 61
Table 3-4 Mean surface and volume diameters after dry dispersion in the Scirocco nozzle _ 64
Table 3-5 Parameters considered for the dimensional analysis of dust dispersion _________ 69
Table 3-6 Expression and physical meaning of the dimensionless number characterizing the
dust dispersion phenomenon __________________________________________________ 71
Table 3-7 Operating conditions and powder characteristics for the determination of the
dimensionless numbers defining the dust dispersion _______________________________ 72
Table 3-8 Dimensionless number calculated for each powder during the dispersion in the 20L
sphere____________________________________________________________________ 74
Table 3-9 Correlation coefficients related to the dust dispersion in the 20L sphere ________ 75
Table 4-1 Ignition sensitivity parameters for the studied powders _____________________ 84
Table 4-2 Parameters considered for the dimensional analysis of dust ignition ___________ 86
Table 4-3 Expression and physical meaning of the dimensionless numbers characterizing the
dust ignition phenomenon ____________________________________________________ 87
Table 4-4 Explosion severity parameters for the studied powders _____________________ 94
Table 5-1 Characteristics of the raw and sieved nanocellulose _______________________ 103
Table 5-2 Mean diameter of the different samples of carbon-coated silicon measured by
sedimentation and wet and dry dispersion ______________________________________ 110
Table 5-3 Characteristics of the raw and dry nanocellulose _________________________ 121
[15]
Table 5-4 Explosion characteristics of 500 g.m-3 of nanocellulose as a function of ignition
energy (values from KSEP 7.1) _______________________________________________ 122
Table 5-5 Influence of the nozzle on the maximum overpressure and maximum rate of pressure
rise of nanocellulose (tv = 60 ms) _____________________________________________ 130
Table 6-1 Root mean square velocities measured in the 20L sphere and in the propagation tube
(Cuervo, 2015; Dahoe et al., 2001) ____________________________________________ 147
Table 6-2 Laminar burning velocity of the nanocellulose estimated by the three different
methods _________________________________________________________________ 159
Table 6-3 Laminar burning velocity of each powder calculated according to equation 3-9__162
Table 6-4 Parameters of the reaction rate constants considered for the pyrolysis of
nanocellulose_____________________________________________________________ 165
Table 6-5 Reaction mechanisms considered for the combustion of the pyrolysis gases (Units
cal, mol, m, s) ____________________________________________________________ 166
Table 6-6 Numerical and experimental values of laminar flame velocity of nanocellulose _ 169
Table 6-7 Some turbulent burning velocity models for premixed flame propagation _____ 173

[16]
Nomenclature
Symbol Description
A (J) Hamaker constant
Af (cm2) Flame surface
As (cm2) Flame section
Aw (-) Water activity
C (kg.m-3) Dust concentration
cedge (m) Length of the edge notch
Cp (J.kg-1.K-1) Heat capacity
D (-) Dimension
d50 (m) Mean surface diameter of agglomerates after dispersion
dagg (m) Diameter of the agglomerate
dc (m) Critical diameter of the dust cloud
dmin-VSSA (m) Smallest particle dimension
dp (m) Primary particle diameter
dP/dtm (bar.s-1) Rate of pressure rise
dP/dtmax (bar.s-1) Maximum rate of pressure rise
Ei (cal.mol-1) Activation energy
Fagglo (N) Cohesion forces of the agglomerates
Fcap (N) Capillary forces
Fdisp (N) Force required for a total dispersion of the agglomerate
Fel (N) Electrostatic forces
Fmean (N) Force required to break a contact between particles
FVdW (N) van der Waals forces
h (W.m-2.K-1) Convection heat transfer coefficient
hp (m) Interparticle distance
k (-) Coordination number
K (s-1) Stretching factor
Ka (m-1) Absorption coefficient
Ks (m-1) Scattering coefficient

[17]
KSt (bar.m.s-1) Explosion index
Lcar (m) Characteristic length
mu (kg) Mass of the unburnt gases
Pm (bar) Explosion overpressure
Pmax (bar) Maximum explosion overpressure
q (C) Particle charge
r (m) Meniscus radius
R (m) Sphere radius
rj (kg.m-3.s-1) Molar reaction rate
Sagg (m²) Total surface of the agglomerate
SS (cm.s-1) Spatial velocity
SSA (m².g-1) Specific surface area
Su (cm.s-1) Burning velocity
Su° (cm.s-1) Laminar burning velocity
T (K) Temperature
u (m.s-1) Fluid velocity
urms (m.s-1) Root-mean square velocity
V (m3) Volume
Vej (m.s-1) Ejection velocity
VSSA (m².cm-3) Volume-specific surface area
Vu (cm3) Volume of the unburnt gases
ΔPcap (bar) Pressure loss in the liquid bridge
μair (Pa.s) Dynamic viscosity of air
Dimensionless number Description
Bi (-) Biot number
BT (-) Spalding number
DaII (-) Damköhler number
Le (-) Lewis number
Nu (-) Nusselt number
Re (-) Reynolds number

[18]
Rep (-) Particle Reynolds number
St (-) Stokes number
Sta (-) Stanton number
We (-) Weber number
πi (-) Dimensionless number
Greek letter Description
γ (-) Ratio of specific heats
Γ (J.m-2) Equilibrium surface energy
γ (J.m-2) Surface tension
Γc (J.m-2) Fracture surface energy
ΔD (%) Mode diameter variation
ΔHcomb (J.mol-1) Enthalpy of combustion of the dust cloud
ΔHvap (J.mol-1) Enthalpy of vaporization of the dust cloud
δM (cm) Markstein length
ε (-) Agglomerate porosity
ε0 (F.m-1) Dielectric permittivity of vacuum
λ (W.m-1.K-1) Thermal conductivity
ρair (kg.m-3) Air density
ρp (kg.m-3) Particle density
ρsk (g.cm-3) Skeletal density
ρu (kg.cm-3) Density of the unburnt gases
σk (Pa) Agglomeration cohesion strength (Kendall)
σR (Pa) Agglomerate cohesion strength (Rumpf)
σw (Pa) Agglomerate cohesion strength (Weiler)
τc (s) Characteristic chemical time
τs (s) Relaxation time
φ (-) Agglomerate solid fraction
𝜙 (N.m-1) Surface energy of agglomerates

[19]
[20]
Chapter 1:
Introduction
Chapter 1: Introduction
[21]
Powders are omnipresent in our modern industry. Produced, handled, conveyed, stored,
powders are involved along the value chain of various industrial sectors like the chemical
industry, the pharmaceutical industry, the cosmetics, the food industry or the metallurgy.
However, powders can be hazardous for the workers, the population and the environment,
especially when it comes to be released in the air: beyond their potential toxicity, combustible
particles can explode when it becomes airborne. Actually, dust explosions frequently occur in
industrial facilities and, over the years, led to loss of life and properties. At the European level,
two main regulations were implemented to prevent dust fires and explosions through two EU
directives. While the first directive, 1999/99/CE directive, is a directive providing minimum
requirements (employer obligations) for protecting health and safety at work, especially
through zone classification of hazardous areas, i.e. areas where explosive atmospheres may
occur, the second directive, 2014/34/UE directive, specifies the equipment to be used in these
hazardous zones (Janes et al., 2011; Jespen, 2016). In order to fulfill the regulatory
requirements, it is necessary to assess explosion risks and to select appropriate equipment. In
order to comply with the ATEX Workplace directive 2014/34/UE, it is generally recommended
for dust to refer to standards like EN 1127-1 and EN 60079-10-2. Further guidance can be
obtained from “codes of good practice” as NFPA standards in the USA or Non-binding
European ATEX guideline or from some industrial specific guidelines. However, despite the
efforts provided so far, explosion risk is still threatening industries and innovative products like
nanomaterials are posing new challenges that require further investigation from fundamental,
experimental and modeling perspectives as stated by Amyotte (2014). Recent work carried out
at the European standardization level in CEN TC 352/WG3/PG3 also highlighted the need to
consider more carefully the current standards used to evaluate the flammability and explosivity
of powders in the case of nanopowders. These standards provide experimental methods to
determine the ignitability parameters of a combustible dust (ASTM E1491-06, 2012; ASTM
E1515-14, 2014; ASTM E2019-03, 2007), and its explosion severity (ASTM E1226-19, 2019;
EN 14034-1, 2004; EN 14034-2, 2006). These international standards describe specific
apparatuses to conduct ignition sensitivity and explosion severity measurements, along with
specific operating conditions. The tests are considered to provide conservative safety
characteristics and, although the testing conditions do not reproduce the industrial conditions
of an explosion event, these characteristics are also essential outputs to design adequate safety
barriers both for explosion prevention and protection (e.g. design of explosion vent).
Since these standards were elaborated before the industrial development of nanotechnologies,
the standard procedures are built to evaluate the explosion characteristics of microparticles and
are currently applied to nanomaterials without further considerations. Nanomaterials are mainly
used because of their original properties due to the size reduction with regard to microparticles,
such as optical, biological or mechanical properties, and an increased reactivity (Stark et al.,
2015). Thus, these specificities can induce a combustion behavior different than microparticles,
which is not considered by the international standards. The recent publication of a technical
specification on the topic (NF CEN TS 17274, 2019) should nevertheless be noted as a first
positive step to adapt current experimental approaches though it provides only preliminary
recommendations. It then appears essential to get more fundamental knowledge on the safety
Chapter 1: Introduction
[22]
profile of nanomaterials and on the tools used to characterize the flammability and explosion
safety parameters of nanomaterials.
In that context, this work will focus on the investigation of the potential limitations of the
current experimental standardized approaches used to evaluate the explosion characteristics of
nanoparticles so that recommendations can be formulated for new approaches based on the
specificities of nanoparticles. This work aims at giving the basis of a practical framework for
process safety engineers confronted to the evaluation of the flammability and explosion severity
of nanomaterials. In order to highlight the diversity of the potential concerns, a variety of
combustible nanopowders were selected: a nanocellulose (organic) powder, a carbon black
(carbonaceous) powder, two aluminum powders (metallic) and a carbon-coated silicon
(metalloid/carbonaceous) powder.
The core of the manuscript is organized in 5 chapters. It is structured so as to reflect the
approach that would be adopted by an explosion safety engineer to get relevant safety
characteristics for either an explosion risk assessment or the modeling of explosion
consequences. The last chapter proposes a new approach to evaluate fundamental safety
parameter related to the explosion propagation of a nanodust cloud. More specifically, the
manuscript is structured as follows :
In chapter 2, the industrial context of this work and a literature review are introduced.
It first focuses on accidents feedbacks and an overview of ATEX regulatory context.
The main parameters related to dust ignition sensitivity and explosion severity are then
defined, along with the main influential factors. Nanoparticles specificities, and more
specifically the agglomeration phenomenon, are also reviewed. The final part of this
chapter summarized the effect of the main influential factors related to nanomaterials
characteristics on the ignition sensitivity and explosion severity of nanomaterials.
The third chapter is dedicated to the characterization of the nanopowders in bulk and in
cloud. First, the selected powders are presented and assessed according to the European
Commission definition for nanomaterials. Then, the airborne behavior of nanomaterials
is investigated through the assessment of the particle size distribution of the dust cloud
after high-energy dispersion in the standardized vessel, i.e. the 20L sphere. In order to
highlight the role of the different influential factors on the dispersion of the cloud, a
dimensional analysis was performed so that to propose a semi-empirical correlation to
support future investigations on a broader range of nanomaterials.
In chapter 4, the ignition sensitivity and explosion severity of the powders is assessed
by strictly following the standard procedure. Based on the knowledge acquired in the
previous chapter, limitations of the standard procedures are highlighted, and some
recommendations are proposed. The first part consists in the presentation of the standard
apparatuses and protocols for the determination of the ignition sensitivity parameters.
The experimental results obtained for each powder are then discussed and completed by

Chapter 1: Introduction
[23]
a dimensional analysis focusing on the ignition phenomenon to support future in-depth
investigations and highlight the main influential factors. The second part of this chapter
is dedicated to the assessment of the explosion severity of the powders. Limitations of
the current experimental approaches are highlighted through a discussion of the
procedures and experimental results and some recommendations are finally proposed.
The fifth chapter is dedicated to an in-depth investigation of the different aspects
identified in the previous chapter and requiring further analysis. This chapter deals
respectively with the influence of agglomeration, humidity, aging, ignition energy,
dispersion procedure and turbulence on the ignition sensitivity and explosion severity
of the powders. First, the impact of the agglomeration on the explosion parameters is
investigated through powder sieving and mechanical agglomeration. Then, the influence
of the moisture content of the powder and atmosphere are evaluated, and a powder aging
phenomenon was highlighted. The third part focuses on the ignition energy to supply
when performing explosion tests in the standard vessel to avoid an excessive amount of
energy that could disturb the flame propagation. Experimental results conducted on
aluminum are also discussed, and an investigation on a so-called ‘pre-ignition’
phenomenon during testing was performed. Another part concerns the effects of the
modification of the dispersion procedure on the particle size distribution after
dispersion, the initial turbulence and the explosion severity. Finally, the last part
evaluates the influence of the initial turbulence on the explosion severity through the
modification of the ignition delay time, i.e. the delay between the dust dispersion and
the beginning of the explosion.
Chapter 6 focuses on the development of an approach enabling to determine a more
fundamental safety parameter, i.e. laminar burning velocity to get free from the
limitations of the experimental standards and provide input of interest for explosion
modeling. The first part consists in an experimental estimation using three methods:
flame propagation visualization in a tube and in a vented standard apparatus and a semi-
empiric correlation based on the pressure-time evolution during a standard test. The
second part presents a numerical one-dimensional model considering the radiative heat
transfer, initially developed for hybrid mixtures and adapted to the flame propagation
of nanoparticles. Finally, turbulent velocity models estimating the burning velocity in
specific (industrial) conditions will be applied on the experimental values in the last
part.

[24]
Chapter 2:
Generalities on dust explosion

Chapter 2: Generalities on dust explosion
[25]
In order to assess correctly the risks related to nanoparticles explosion, the process safety
engineer must first acquire information on past accidents, current regulatory provisions and
explosion phenomenology. This chapter, divided into four parts, then introduces the industrial
context of this work, as well as a literature review, and more specifically nanoparticles
explosions. The first part presents some feedbacks about industrial dust explosion accidents and
an overview of ATEX regulation which aims at preventing and protecting from such incidents.
The second part describes the main parameters to consider when evaluating the ignition
sensitivity and explosion severity of dusts, and the elements generally influencing dust
explosions. A third part is dedicated to nanoparticles specificities, more precisely to the
agglomeration phenomenon and considerations on the agglomerate’s breakage. Finally, some
observations concerning the influence of nanoparticles specificities on their ignition sensitivity
and explosion severity are discussed in the last part.
II.1. A glimpse on the industrial context: feedback and regulation
Any dust capable of burning in air, i.e. any combustible dust, can explode when dispersed with
a certain degree of subdivision (Eckhoff, 2003). More precisely, an explosion being defined as
a fast combustion reaction that induces a sudden release of energy (Eckhoff, 2003; Skjold,
2003), any material that is not already totally oxidized can give rise to a dust explosion. This
notably includes carbonaceous compounds, metallic dust and organic materials, either natural
or synthetic. This wide range of combustible powders implies that dust explosions can occur in
various sectors such as chemical and pharmaceutical industry, metallurgy,
petrochemistry…The statistical features shows that dust explosion accidents mainly happen in
process units like grinders, mills, dust separators, silos, mixers, driers, grain elevators, cyclones,
incinerators and conveyors … (Eckhoff, 2016; Yuan et al., 2015).
Past accidents turned attention to development of systems and devices to better prevent and
protect industrial equipment against these events. The development of new applications and
new materials require the development of specific knowledge on dust explosion phenomenon
in terms of occurrence and consequences, relying both on research activities and accident
feedbacks. To this aim, the BARPI (French acronym of Bureau for Analysis of Industrial Risks
and Pollutions) collects information and experience feedback on accidents in the ARIA
database (Analysis, Research and Information on Accidents). Some accidents are also reported
in the literature by different authors (Abbasi and Abbasi, 2007; Eckhoff, 2003; Theimer, 1973;
Vijayaraghavan, 2004). Recently, Cloney and Snoeys (2019) provided an extensive review on
the main dust explosions incidents that occurred throughout the world.
An explosion involving cellulose occurred in a chemical industry in Bergerac, France,
in 2004, on the cellulose supply of the nitration line. The weighing hopper system, the
storage hopper, the conveyor belt and the roof were damaged during the explosion,
which was caused by a hot spot (mechanical friction on the different systems), an
electrical spark or a static electricity discharge due to the hot, dry weather (BARPI
database).

Chapter 2: Generalities on dust explosion
[26]
To target the objects on which research activities must focus, it is essential to identify the
materials generating dust explosions. When analyzing such incidents, it then appears that a
significant part of dust explosion events implies organic dust such as grains; for instance, the
explosion of a maize silo in Strasbourg, France, in 2018. According to the ARIA database, an
explosion of cellulose followed by a fire also occurred in Bergerac, France, in 2004. These
accidents led to injuries, but, unfortunately, some explosions caused a lot more damages. For
instance, a well-known sugar dust explosion occurred in the Imperial Sugar Company (Georgia,
United-States) in 2008, involving several secondary explosions due to a dust accumulation,
leading to 14 killed (U.S. Chemical Safety and Hazard Investigation Board, 2009).
Carbonaceous dust explosions are also
frequently encountered, such as the
explosion in Dongfeng Coal Mine, one of
China’s national key mines, which caused
171 deaths (Zheng et al., 2009). Another
example is the Benxihu colliery disaster
that occurred in China in 1942 and cost
more than 1500 lives; it is considered as
the world’s worst coal mining explosion
ever (Yuan et al., 2015) and was caused by
a mixture of gas and coal. However, coal
dust explosions are not restricted to coal mining industries, as evidenced by a recent accident
in New Mexico, United States in March 2018, where a coal storage silo collapsed and caused
an explosion and fire (Cloney and Snoeys, 2019).
Since metallic materials are widely used in industries, accidents involving explosion of metallic
powders are relatively frequent as shown by the analysis of accident databases. In the ARIA
database such accidents were reported with major consequences in terms of releases. Aluminum
dust was involved for instance in several devastating explosions, such as an explosion that
occurred in the mixing section of a premix plant at Gullaug, Norway, in 1973, probably caused
by a propagating brush discharge
and leading to 5 deaths, 2 injuries
and the destruction of a significant
part of the plant (Eckhoff, 2003).
Another aluminum explosion was
mentioned by Eckhoff (2003),
concerning an atomized aluminum
powder production plant at
Anglesey, United Kingdom, in
1983, which led to 2 injuries. More
recently, a catastrophic aluminum-
alloy dust explosion also occurred
in a large industrial plant of
In 2018, in New Mexico, United States, a
silo holding more than 600 tons of coal
collapsed, thus causing an explosion and a
fire. Investigations then led to the
conclusion that corrosion and a faulty
weld, holding two sections of the silo
together, induced its collapse. No injuries,
but damages estimated to $15-20 million,
were reported (Cloney, 2018).
In 2014, a large industrial plant in Kunshan,
China, suffered a severe explosion during
polishing of aluminum-alloy. The explosion is
believed to have been initiated by self-ignition of
contaminated aluminum-alloy in the dust
collecting barrel below the external bag filter
unit. Due to a heavy rain for days before the
accident and the discovery of a hole near the
ignition location, water is supposed to have
accelerated the self-ignition process through an
exothermal reaction with the dust (Li et al., 2016).

Chapter 2: Generalities on dust explosion
[27]
Kunshan, China, in 2014, and caused 146 deaths and 114 injuries (Li et al., 2016). This accident
probably involved sub-micrometric metallic particles (e.g. process fumes and deposits).
Even though dust explosion accidents involve, in most cases, grain, coal or metal powders, it
has to be kept in mind that any combustible dust can cause an explosion, including for instance
wood dust and pharmaceutical component. Another example was reported by Eckhoff (2003)
concerning a dust explosion in a silicon powder grinding plant at Bremanger, Norway, in 1972,
in which 5 workers lost their lives.
To prevent and protect industries from dust explosions, numerous regulations and standards
have been elaborated (Center for Chemical Process Safety, 2004; Zalosh, 2019). In Europe, two
directives were adopted more specifically for controlling Explosive Atmospheres (ATEX), i.e.
fuel-air mixtures prone to ignite: 1999/99/CE directive (ATEX Workplace directive) and
directive 2014/34/UE, known as 94/9/CE directive until March 2016 (ATEX Equipment
directive). The first directive defines ATEX zones depending on the formation probability of
an explosive atmosphere, whereas the second specifies the equipment to use into the previously
defined zones through equipment categorization, conformity assessment procedure and CE- and
Ex- marking obligations (Janes et al., 2011; Jespen, 2016). Risk areas must then be identified
and classified according to the probability of provoking an accident, as presented in Table 2-1
for dusts.
Table 2-1 Definition of ATEX zones concerning dust according to ATEX directive
1999/92/CE
Presence of an explosive atmosphere ATEX zone Risk
Continuously, for long periods or frequently in
normal operating conditions 20 Permanent
Likely to occur in normal operating conditions 21 Occasional
Accidently, in cause of process failure, for short
periods 22 Rare
The equipment to use into these zones must comply with the requirements of ATEX directive
2014/34/UE. The aim of ATEX directives is then to ensure explosion prevention, by avoiding
the formation and the ignition of explosive atmosphere, but also to protect worker and industries
from the effects of a potential explosion. The explosion prevention, which is given priority, can
be achieved by suppressing a condition needed to produce the dust explosion. For instance,
removing the combustible through ventilation or frequent cleaning, avoid its dispersion by
modifying the process, suppress the oxygen by inerting the process or limiting the oxygen
concentration, or even eliminate all potential ignition sources (Amyotte and Eckhoff, 2010; EN
1127-1, 2019; Janes et al., 2011). The implementation of those safety measures mainly relies
on the reliable determination of the quantitative explosion characteristics of the dust involved
in the process. In this respect, further work must be dedicated to new materials such as
nanomaterials (Amyotte, 2014; Vignes et al., 2019).
Chapter 2: Generalities on dust explosion
[28]
II.2. Dust explosions phenomenology
This section is dedicated to general aspects on dust explosions and is therefore intended to basic
knowledge acquisition on this subject. Dust combustion requires the simultaneous presence of
a sufficient amount of combustion agent (generally oxygen from air), a combustible material in
a sufficiently divided state and an ignition source providing enough energy to initiate the
reaction.
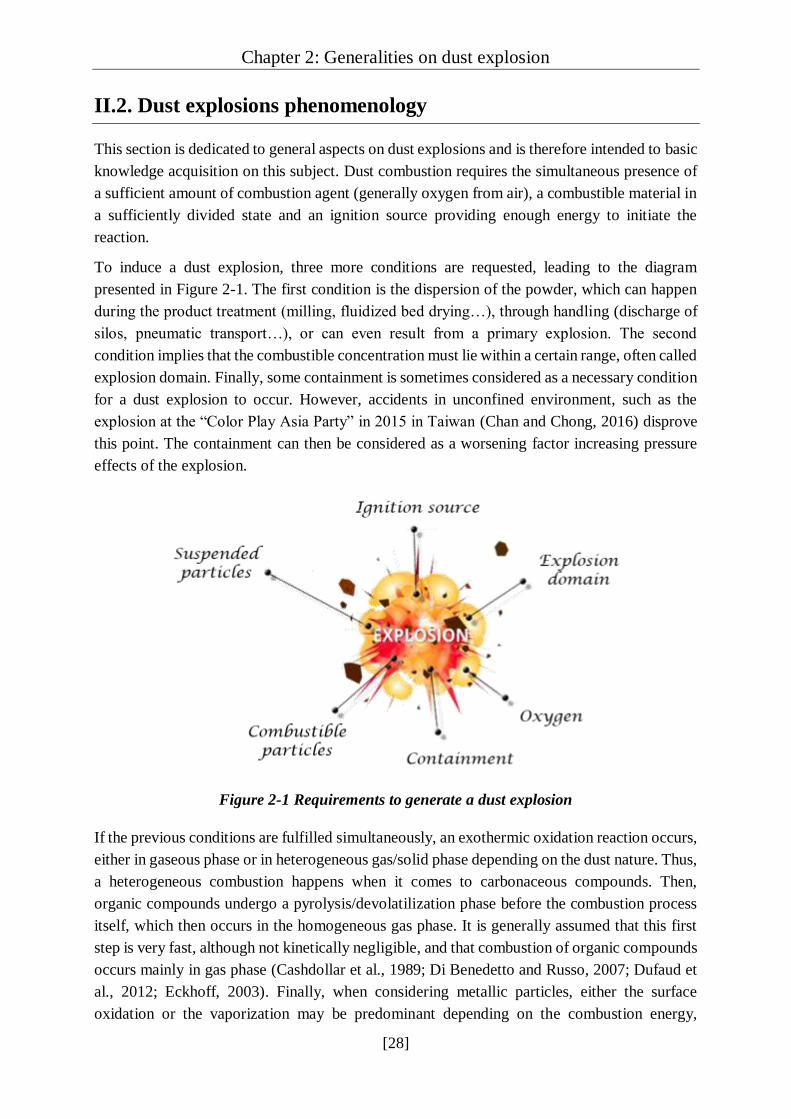
To induce a dust explosion, three more conditions are requested, leading to the diagram
presented in Figure 2-1. The first condition is the dispersion of the powder, which can happen
during the product treatment (milling, fluidized bed drying…), through handling (discharge of
silos, pneumatic transport…), or can even result from a primary explosion. The second
condition implies that the combustible concentration must lie within a certain range, often called
explosion domain. Finally, some containment is sometimes considered as a necessary condition
for a dust explosion to occur. However, accidents in unconfined environment, such as the
explosion at the “Color Play Asia Party” in 2015 in Taiwan (Chan and Chong, 2016) disprove
this point. The containment can then be considered as a worsening factor increasing pressure
effects of the explosion.
Figure 2-1 Requirements to generate a dust explosion
If the previous conditions are fulfilled simultaneously, an exothermic oxidation reaction occurs,
either in gaseous phase or in heterogeneous gas/solid phase depending on the dust nature. Thus,
a heterogeneous combustion happens when it comes to carbonaceous compounds. Then,
organic compounds undergo a pyrolysis/devolatilization phase before the combustion process
itself, which then occurs in the homogeneous gas phase. It is generally assumed that this first
step is very fast, although not kinetically negligible, and that combustion of organic compounds
occurs mainly in gas phase (Cashdollar et al., 1989; Di Benedetto and Russo, 2007; Dufaud et
al., 2012; Eckhoff, 2003). Finally, when considering metallic particles, either the surface
oxidation or the vaporization may be predominant depending on the combustion energy,
Chapter 2: Generalities on dust explosion
[29]
melting point of the metal and particle size (Bazyn et al., 2007; Levitas, 2013; Lomba, 2016;
Moser, 2019; Sundaram et al., 2016).
During the combustion process, the flame propagates gradually, separating the unburnt mixture
from the hot combustion gases, whose expansion induces a pressure wave that precedes the
flame. This pressure wave is then capable of dispersing the dust upstream of the flame,
provoking secondary explosion and, as shown in section II.1, implying a risk for industrial
installations, environment, residents and workers. An accurate risk assessment relies both on
the evaluation of the probability that a dust cloud would ignite, called ignition sensitivity, and
on the estimation of the consequences of a potential explosion scenario, called explosion
severity (Abuswer et al., 2013; Lemkowitz and Pasman, 2014). In the following sections (from
II.2.1 to II.2.4), the different parameters involved in dust ignition and explosion are defined
along with the main factors affecting them. The characterization procedures and apparatuses
will be detailed in chapter 4.
II.2.1. Ignition sensitivity
The ignition sensitivity of a powder represents an estimation of the probability that the powder
would ignite when submitted to certain conditions. It is then possible to determine this
sensibility under specific conditions (e.g. corresponding to an industrial process), or to
determine the conditions corresponding to the highest ignition probability. The ignition
sensitivity is related to i) the ignition source, ii) the explosion domain and iii) the concentration
of oxygen.
i) An ignition source should be sufficiently powerful to ignite the fuel-air mixture. If
the ignition source is present but of too low energy, the oxidation reaction will not
occur, or too slowly to sustain a flame propagation. The Minimum Ignition Energy
(MIE) obviously depends on the dust-air mixture. If this energy is present as a heat
source, the term Minimum Ignition Temperature (MIT) is employed.
ii) For an ignition to propagate, the mixture must contain a minimum amount of dust,
called the Lower Explosion Limit (LEL). It is also possible to define a maximum
explosive concentration above which no explosion can occur, because of a lack of
oxygen. However, since it is difficult to generate a stable high concentrated
suspension of dust and because of the natural sedimentation phenomenon which
tends to decrease the dust concentration of the cloud, this parameter is not usually
considered as a safety parameter.
iii) However, the extinction phenomenon due to the lack of oxygen is considered
through the Limiting Oxygen Concentration (LOC), corresponding to the lowest
oxygen concentration required to produce an explosion.

Chapter 2: Generalities on dust explosion
[30]
II.2.1.1. Minimum Ignition Temperature
Increasing the temperature of a dust-air mixture leads to an increase of its energy, implying the
existence of a temperature above which the mixture can spontaneously ignite (Eckhoff, 2019a).
This temperature generally lies between 150°C and 700°C for a dust cloud and, due to improved
heat transfers, is lower for a dust layer (Eckhoff, 2003). Since this work will mainly focus on
the explosion risk assessment of dust clouds, the minimum ignition temperature of a dust layer
will not be detailed hereafter, but some advanced notions on its determination were previously
discussed by Bideau (2010).
Many process units inherently include the presence of flames or hot surface, such as ovens or
heat exchangers. If a dust cloud is generated near such units, it will ignite if its minimum
ignition temperature is attained by the heat source (Abbasi and Abbasi, 2007). This temperature
can vary with the size and the shape of the hot surface, and with the dust cloud concentration
and initial turbulence, as those parameters have a direct influence on the heat transfer. These
influences are partially considered during the minimum ignition temperature measurement,
detailed in chapter 4, performed in normalized ovens, such as the vertical Godbert-Greenwald
oven (Eckhoff, 2019b) or the horizontal BAM oven (ASTM E1491-06, 2012; EN 50281-2-1,
2000; IEC 1241-2-1, 1994).
II.2.1.2. Minimum Ignition Energy
Sparks generated mechanically, electrically or electrostatically are also commonly encountered
in industrial processes. In the presence of an explosive atmosphere, if a spark with an energy
higher than the MIE of the cloud is generated, an ignition will occur (Siwek, 1995).
The MIE of dust clouds is conventionally measured using a modified Hartmann tube for
energies between 1 mJ and 1000 mJ (ASTM E2019-03, 2007; ISO/IEC 80079-20-2, 2016).
Although it does not allow the measurement of MIE lower than 1 mJ, the “Mike 3” is considered
as the standard apparatus (Eckhoff, 2002; Eckhoff and Randeberg, 2007). A dust is considered
“normally sensitive” if its MIE is greater than 10 mJ, “particularly sensitive” if its MIE lies
between 3 mJ and 10 mJ, and “extremely sensitive” if its MIE is lower than 3 mJ (Gustin, 2004;
Janes et al., 2008). Although other parameters than the powder nature must be taken into
account, metallic particles generally tend to be particularly to extremely sensitive, whereas
carbonaceous compounds are usually not ignitable by a spark of 1 J (Clouthier et al., 2019).
Just like the MIT, the MIE depends on the dust concentration and initial turbulence, and despite
the fact that international standards impose the modification of both parameters during the
experimental estimation of the MIE, it has been shown that, currently, no experimental method
can produce an optimal homogeneous dust cloud for MIE determinations (Eckhoff, 2019c).
Moreover, the MIE is also greatly influenced by the ambient temperature, which implies that a
specific attention should be paid to the testing and operating conditions (American Institute of
Chemical Engineers, 2017).

Chapter 2: Generalities on dust explosion
[31]
II.2.1.3. Lower Explosion Limit
The Lower Explosion Limit (LEL) is defined as the concentration below which no flame can
propagates. This parameter depends on the initial turbulence, but also on the ignition energy
and the volume vessel and shape. It can be measured either in the modified Hartmann tube or
in the 20L sphere according to international standards (ASTM E1515-14, 2014; EN 14034-3,
2006). The LEL of dust generally lies between 30 and 125 g.m-3 (Babrauskas and Britton, 2018;
Clouthier et al., 2019).
II.2.1.4. Limiting Oxygen Concentration
The flame speed and the explosion severity generally tend to increase with the dust
concentration, until reaching a concentration generally higher than the stoichiometric
concentration. For rich mixtures, the oxygen is lacking, and the flame is no longer able to
propagate, inducing a quenching effect. However, the maximum explosible concentration is
rarely estimated, both because of the difficulty to generate a homogeneous high concentrated
suspension and of the limited interest related to uncertainties due to the dust sedimentation.
Indeed, this phenomenon can decrease the concentration back to the explosion domain. Instead,
the Limiting Oxygen Concentration (LOC) is generally evaluated, as its knowledge allows
inerting the process under the limiting value, thus preventing dust explosion.
As previously mentioned, these safety parameters depend on the operating conditions and
methods used for their measurements, implying that standardized conditions, methods and
apparatuses must be respected to compare the powders, but also to design the prevention and
protection equipment (Clouthier et al., 2019; Eckhoff, 2003; Gustin, 2004; Jespen, 2016).
Therefore, the safety parameters obtained through standardized tests must be considered more
as references than as process operating parameters, as they also depend on parameters not
perfectly controlled, such as the particle size distribution, the initial turbulence and the moisture
content. Table 2-2 presents the experimental methods currently accepted as standard tests to
evaluate the minimum ignition energy, minimum ignition temperature and lower explosion
limit.
Those parameters provide information on the ignition probability of a dust cloud and it supports
the design and implementation of ignition prevention strategies. However, explosion prevention
cannot rely only on ignition prevention, one needs to firstly focus on reducing the likelihood of
formation of an explosive atmosphere. Beyond prevention, it is however also necessary to
protect from the explosion by assessing its potential effects.
Chapter 2: Generalities on dust explosion
[32]
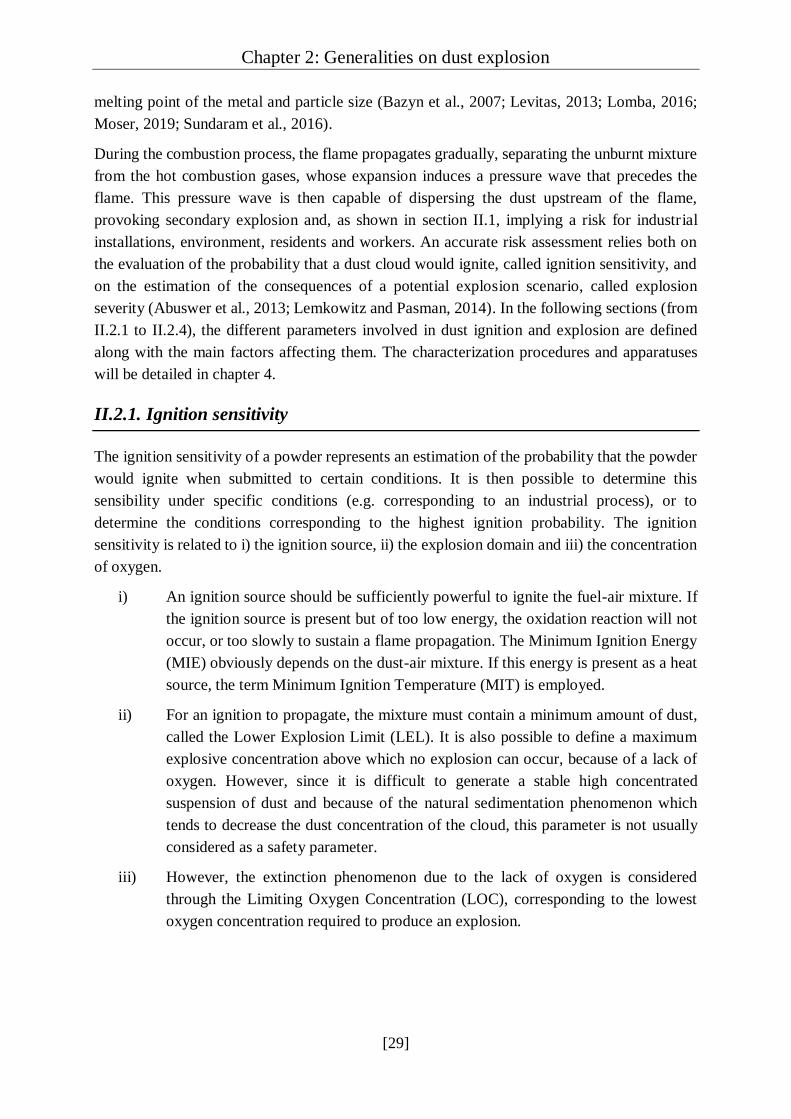
Table 2-2 Standard test methods and equipment for the determination of ignition sensitivity
parameters of dust clouds
Safety
parameter Description Standard method Apparatus Application
MIT Minimum Ignition
Temperature
(ASTM E1491-06, 2012;
EN 50281-2-1, 2000;
IEC 1241-2-1, 1994)
Godbert-
Greenwald Oven
BAM Oven
Control of hot surfaces
temperatures, fire
permit – ATEX
2014/34/UE
MIE Minimum Ignition
Energy
(ASTM E2019-03, 2007;
ISO/IEC 80079-20-2,
2016)
Modified
Hartmann Tube
Removal of potential
ignition sources –
ATEX 1999/92/CE
LEL Lower Explosion
Limit
(ASTM E1515-14, 2014;
EN 14034-3, 2006)
Modified
Hartmann Tube
20L sphere
Control of the dust
concentration
(cleaning)
II.2.2. Explosion severity
If the ignition sensitivity is related to the probability that a powder ignites and produces an
explosion, the explosion severity is linked to the effects and consequences. It usually includes
the maximum explosion overpressure Pm as well as the maximum rate of pressure rise (dP/dt)m
recorded during the pressure growth. The maximum overpressure Pmax and the maximum rate
of pressure rise (dP/dt)max correspond to the maximum values of Pm and (dP/dt)m obtained over
a wide range of dust concentration. These parameters are measured by performing controlled
explosion tests in a closed vessel, which induces a volume-dependence of the results. Therefore,
they must be used as references or indicators for protection equipment design instead of an
absolute value necessarily obtained in case of an accident. Indeed, the explosion severity greatly
depends on the vessel geometry and volume, which can either increase the rate of pressure rise
or disturb the flame propagation and generate quenching phenomenon.
Moreover, other parameters as the particle size distribution or the initial turbulence can also
impact the explosion severity. It is then again recommended to perform the explosion severity
measurements in normalized conditions and equipment (EN 14034-1, 2004; EN 14034-2, 2006;
ISO 6184/1, 1985). Two explosion vessel are mentioned in international standards: a 1 m3
vessel, which has the disadvantage of handling and consuming great amounts of powders, and
a 20L sphere, more generally adopted in process safety labs (Siwek, 1977). However, several
authors (Dahoe et al., 2001; Proust et al., 2007; van der Wel et al., 1992) highlighted that, in
practice, these two vessels are not perfectly equivalent notably due to different evolutions of
the turbulence during the dust dispersion and its combustion. Moreover, the small size of the
20L sphere increases the likelihood of flame quenching to the walls compared to a 1 m3 vessel.

Chapter 2: Generalities on dust explosion
[33]
The maximum overpressure obtained during a gas explosion is generally considered
independent from the vessel in which the explosion occurred and from the initial turbulence, as
it is mainly affected by the explosion thermodynamics. The maximum overpressure of a dust
explosion is commonly considered to behave the same way than gas explosions (Dahoe, 2000),
and the knowledge of this parameter then allows the design of pressure resisting equipment as
well as vents and rupture discs.
While the explosion severity can be measured in two different equipment of different volumes,
the maximum rate of pressure rise depends on the vessel volume. Some experiments were
conducted in vessel of different sizes, from 0.020 m3 to 100 m3, to evaluate the volume
dependency. Based on the propagation of a spherical thin flame in an explosion vessel, some
assumptions were then formulated to deduce a new explosion severity parameter, called
explosion index KSt, independent from the vessel volume. Thus, the combustion rate should be
the same in the testing vessel and in the enclosure in which the explosion severity has to be
predicted. To fulfill this condition, both vessels must be of the same geometry, ignition must
occur in the center of the vessel, the flame thickness must be negligible with respect to the
vessel radius and turbulence temporal and spatial variations must be similar in both enclosures
(Bartknecht, 1989; Eckhoff, 2003; Lewis and von Elbe, 1987). The explosion index is then
defined by the so-called “cube-root law” as follows:
𝐾𝑆𝑡 = 𝑉1
3. (𝑑𝑃
𝑑𝑡)
𝑚𝑎𝑥 2-1
Based on the value of KSt obtained, powders can be classified into different classes, called “St
classes” (Table 2-3). This classification provides information for the design of protection
equipment against the explosion (Bartknecht, 1989).
Table 2-3 Classification of powders into St classes
St class KSt (bar.m.s-1)
St 0 0 (non-explosible)
St 1 1 < KSt ≤ 200
St 2 200 < KSt ≤ 300
St 3 300 < KSt
Due to the previously quoted assumptions related to the cubic law, this latter should be used
carefully. Indeed, in practice, the conditions for its validity are rarely perfectly fulfilled.
Moreover, this relation is based on a single point of the pressure evolution curve for a single
concentration (among other tested), which does not represent the powder global behavior. For
instance, the maximum rate of pressure rise and the maximum overpressure can be obtained at
different concentrations (Dahoe et al., 1996). Additionally, the results obtained in labs are
extrapolated to industrial situations with unknown turbulence, which can lead to misestimations
of the explosion severity, as it greatly depends on the initial turbulence (Dahoe et al., 2002).
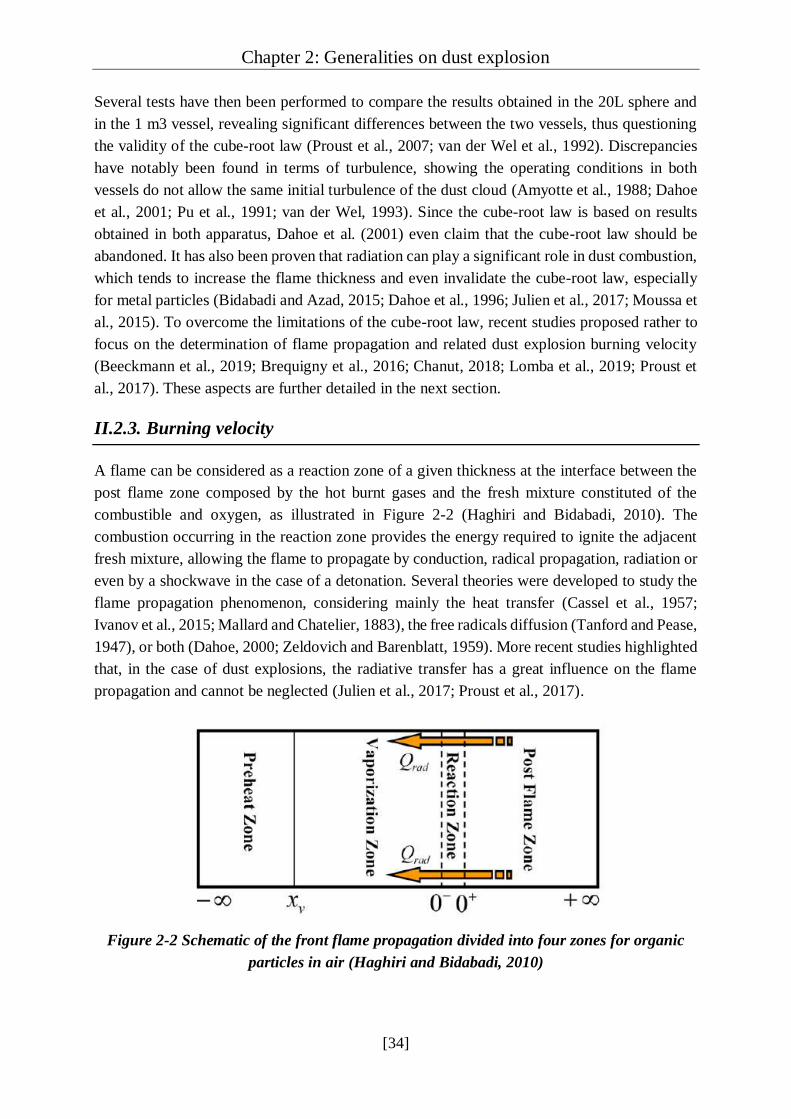
Chapter 2: Generalities on dust explosion
[34]
Several tests have then been performed to compare the results obtained in the 20L sphere and
in the 1 m3 vessel, revealing significant differences between the two vessels, thus questioning
the validity of the cube-root law (Proust et al., 2007; van der Wel et al., 1992). Discrepancies
have notably been found in terms of turbulence, showing the operating conditions in both
vessels do not allow the same initial turbulence of the dust cloud (Amyotte et al., 1988; Dahoe
et al., 2001; Pu et al., 1991; van der Wel, 1993). Since the cube-root law is based on results
obtained in both apparatus, Dahoe et al. (2001) even claim that the cube-root law should be
abandoned. It has also been proven that radiation can play a significant role in dust combustion,
which tends to increase the flame thickness and even invalidate the cube-root law, especially
for metal particles (Bidabadi and Azad, 2015; Dahoe et al., 1996; Julien et al., 2017; Moussa et
al., 2015). To overcome the limitations of the cube-root law, recent studies proposed rather to
focus on the determination of flame propagation and related dust explosion burning velocity
(Beeckmann et al., 2019; Brequigny et al., 2016; Chanut, 2018; Lomba et al., 2019; Proust et
al., 2017). These aspects are further detailed in the next section.
II.2.3. Burning velocity
A flame can be considered as a reaction zone of a given thickness at the interface between the
post flame zone composed by the hot burnt gases and the fresh mixture constituted of the
combustible and oxygen, as illustrated in Figure 2-2 (Haghiri and Bidabadi, 2010). The
combustion occurring in the reaction zone provides the energy required to ignite the adjacent
fresh mixture, allowing the flame to propagate by conduction, radical propagation, radiation or
even by a shockwave in the case of a detonation. Several theories were developed to study the
flame propagation phenomenon, considering mainly the heat transfer (Cassel et al., 1957;
Ivanov et al., 2015; Mallard and Chatelier, 1883), the free radicals diffusion (Tanford and Pease,
1947), or both (Dahoe, 2000; Zeldovich and Barenblatt, 1959). More recent studies highlighted
that, in the case of dust explosions, the radiative transfer has a great influence on the flame
propagation and cannot be neglected (Julien et al., 2017; Proust et al., 2017).
Figure 2-2 Schematic of the front flame propagation divided into four zones for organic
particles in air (Haghiri and Bidabadi, 2010)
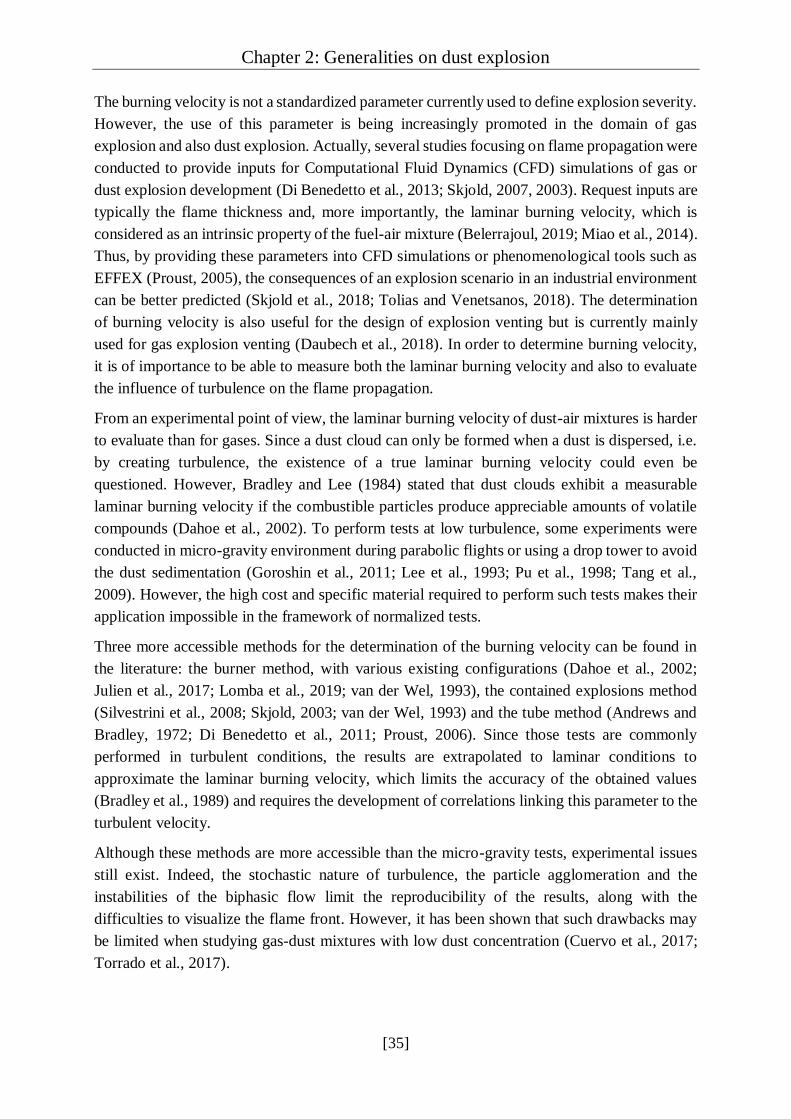
Chapter 2: Generalities on dust explosion
[35]
The burning velocity is not a standardized parameter currently used to define explosion severity.
However, the use of this parameter is being increasingly promoted in the domain of gas
explosion and also dust explosion. Actually, several studies focusing on flame propagation were
conducted to provide inputs for Computational Fluid Dynamics (CFD) simulations of gas or
dust explosion development (Di Benedetto et al., 2013; Skjold, 2007, 2003). Request inputs are
typically the flame thickness and, more importantly, the laminar burning velocity, which is
considered as an intrinsic property of the fuel-air mixture (Belerrajoul, 2019; Miao et al., 2014).
Thus, by providing these parameters into CFD simulations or phenomenological tools such as
EFFEX (Proust, 2005), the consequences of an explosion scenario in an industrial environment
can be better predicted (Skjold et al., 2018; Tolias and Venetsanos, 2018). The determination
of burning velocity is also useful for the design of explosion venting but is currently mainly
used for gas explosion venting (Daubech et al., 2018). In order to determine burning velocity,
it is of importance to be able to measure both the laminar burning velocity and also to evaluate
the influence of turbulence on the flame propagation.
From an experimental point of view, the laminar burning velocity of dust-air mixtures is harder
to evaluate than for gases. Since a dust cloud can only be formed when a dust is dispersed, i.e.
by creating turbulence, the existence of a true laminar burning velocity could even be
questioned. However, Bradley and Lee (1984) stated that dust clouds exhibit a measurable
laminar burning velocity if the combustible particles produce appreciable amounts of volatile
compounds (Dahoe et al., 2002). To perform tests at low turbulence, some experiments were
conducted in micro-gravity environment during parabolic flights or using a drop tower to avoid
the dust sedimentation (Goroshin et al., 2011; Lee et al., 1993; Pu et al., 1998; Tang et al.,
2009). However, the high cost and specific material required to perform such tests makes their
application impossible in the framework of normalized tests.
Three more accessible methods for the determination of the burning velocity can be found in
the literature: the burner method, with various existing configurations (Dahoe et al., 2002;
Julien et al., 2017; Lomba et al., 2019; van der Wel, 1993), the contained explosions method
(Silvestrini et al., 2008; Skjold, 2003; van der Wel, 1993) and the tube method (Andrews and
Bradley, 1972; Di Benedetto et al., 2011; Proust, 2006). Since those tests are commonly
performed in turbulent conditions, the results are extrapolated to laminar conditions to
approximate the laminar burning velocity, which limits the accuracy of the obtained values
(Bradley et al., 1989) and requires the development of correlations linking this parameter to the
turbulent velocity.
Although these methods are more accessible than the micro-gravity tests, experimental issues
still exist. Indeed, the stochastic nature of turbulence, the particle agglomeration and the
instabilities of the biphasic flow limit the reproducibility of the results, along with the
difficulties to visualize the flame front. However, it has been shown that such drawbacks may
be limited when studying gas-dust mixtures with low dust concentration (Cuervo et al., 2017;
Torrado et al., 2017).

Chapter 2: Generalities on dust explosion
[36]
II.2.4. Parameters affecting dust explosions
The ignition sensitivity and explosion severity characteristics depend on the powder
specificities such as the composition, initial particle size distribution, shape and moisture
content, but also on the operating conditions at stake during the explosion: initial turbulence of
the dust cloud, dust concentration, particle size distribution after dispersion, ignition source
nature and energy, and vessel volume and shape (Skjold, 2003). In addition to this non-
exhaustive list, the influence of other parameters, such as the dustiness, on the powder
explosibility is of growing interest (Klippel et al., 2015, 2013; Thomas et al., 2019). Despite
the standardization of equipment and protocols, it should be kept in mind that dust explosion
behavior is still subjected to a strong interdependency between powder specificities and
operating conditions. Thus, the process safety engineer should keep in mind the main
parameters affecting dust explosions, which are presented in the next section.
II.2.4.1. Chemical composition
The most intuitive parameter affecting dust explosions is probably the chemical composition of
the powder. Indeed, in most cases, the combustion agent implied in the reaction is the oxygen
present in ambient air, whose consumption rate directly depends on the chemical composition
of the dust, as the powder nature impacts its combustion enthalpy, shape and porosity as well
as other physicochemical properties. Although it is technically impossible to accurately
estimate the probability of occurrence of an explosion by only knowing the chemical
composition of a dust, using QSPR models for instance (Fayet and Rotureau, 2019), the
presence of functional grouping can increase (COOH, OH, NH2, C≡N, C=N, N=N) or decrease
(halogen compounds) this risk (Grewer, 1991; Rotureau et al., 2010). In a similar way, the
explosivity characteristics of hybrid mixtures cannot be evaluated by only considering the pure
separated compounds properties (D’Amico, 2016; Dufaud et al., 2009; Torrado et al., 2017a).
II.2.4.2. Dust concentration
As previously discussed, the dust concentration also has a direct influence on the ignition
sensibility and explosion severity. However, the experimental optimal concentration for which
the fuel/air mixture would be in equal proportions is generally different from the theoretical
stoichiometry. Indeed, in practice, the fuel is not 100% converted, inducing that the
experimental optimal concentration is generally higher than the theoretical concentration.
Moreover, some quenching effects at the walls can also impact the flame propagation and
combustion reactions, thus modifying the optimal concentration.
II.2.4.3. Moisture content
On an intuitive way, it can be considered that the explosion of a wet powder would be less
severe than an explosion caused by the same dry powder. However, depending on the powder
nature, humidity can either inhibit the reaction or promote it. In most cases, humidity indeed

Chapter 2: Generalities on dust explosion
[37]
decreases the explosion severity, as energy is used for the water vaporization reaction, which
decreases the flame temperature and thus the explosion overpressure (Eckhoff, 2003).
Moreover, agglomeration phenomenon is promoted by moisture and the presence of water in
gaseous phase decreases the oxygen concentration in the atmosphere, which induces a decrease
of the rate of pressure rise (Yuan et al., 2014).
However, high humidity conditions are not necessarily safer, notably when it comes to metallic
particles. Indeed, water can enhance the self-ignition of the dust, such as during the accident in
Kunshan, China, in 2014 mentioned in section II.1. (Li et al., 2016). Moreover, Traoré et al.
(2009) also showed that a humid atmosphere tends to inhibit the explosion of dry aluminum
whereas an explosion of aluminum stored under controlled humidity in ambient atmosphere for
a short time leads to an increase of the maximum rate of pressure rise due to hydrogen
production.
II.2.4.4. Initial turbulence
The initial turbulence of the dust cloud is recognized to be one of the most important parameter
affecting dust explosions (Amyotte et al., 1988; Dahoe et al., 2001; Pu et al., 1991; Tamanini,
1990). Turbulence is closely linked to the dispersion process of the dust and varies from one
apparatus or process to another, as a function of the dispersion system, the injection pressure or
even the vessel volume and geometry (Amyotte et al., 1988). The turbulence is also affected by
the nature of the powder, its particle size distribution and its density, which can lead to
concentration heterogeneities in the cloud (Murillo et al., 2018). The initial turbulence of the
dust cloud evolves with time and is thus directly affected by the delay between dust injection
and ignition, called ignition delay time (Dahoe et al., 2001).
The turbulence intensity can then impact the flame kernel growth and influences the maximum
rate of pressure rise and, less significantly, the maximum explosion overpressure. This
phenomenon raises some difficulties to extrapolate the data obtained in the 20L sphere to bigger
equipment using the “cube-root law” (Equation 2-1). Indeed, one of the main hypotheses of this
relation is that similar turbulence levels must be involved in the different equipment, which is
questioned by several authors when considering the turbulence in the 20L sphere and the 1 m3
vessel at the imposed ignition delay times (Amyotte et al., 1988; Dahoe et al., 2001; Pu et al.,
1991; van der Wel, 1993).
II.2.4.5. Ignition source and energy
As previously explained, each dust-air mixture has its own minimum energy required to be
ignited. Thus, an ignition energy lower than this value will not lead to any explosion, whereas
an energy much greater will increase the explosion severity. Indeed, in this case, the additional
heat, not used for the dust ignition, would modify the flame propagation and participate to the
explosion, leading to a so-called “overdriving” phenomenon which tends to overestimate the

Chapter 2: Generalities on dust explosion
[38]
explosion severity (Dastidar et al., 2001; Going et al., 2000; Zhen and Leuckel, 1997).
Moreover, using chemical igniters delivering a high energy can modify the initial turbulence of
the dust cloud, thus modifying the explosion severity.
II.2.4.6. Particle Size Distribution
The particle size distribution has been long recognized as one of the most important factor
influencing dust explosions (Bartknecht, 1989; Soundararajan et al., 1996). Indeed, fine
particles tend to easily form a stable dust cloud compared to bigger particles. Moreover, those
fine particles develop a high specific surface area, thus presenting a great surface accessible for
the oxygen during the combustion. However, the mean volume diameter d50 is generally
considered to characterize a powder, which does not always provide a correct characterization
as big particles, with a high volume, can occult the presence of smaller ones (Harris et al., 2015;
Tascón, 2018). Indeed, Vignes (2008) reports several studies showing that the particle size
directly impacts the combustion kinetics, which is especially limited by the oxygen diffusion to
the particle surface when considering microparticles, whereas it is limited by the reaction itself
for smaller particles.
Eckhoff (2012) also pointed out that agglomeration phenomenon can happen and impact the
dust explosibility. In such cases, the mean size of the particles involved in the explosion reaction
is modified, and the size of the agglomerates is then considered instead of the size of the primary
particles. It is generally considered that a dust explosion becomes impossible if the size of the
particles exceeds 1 mm (Palmer, 1973). From a safety point of view, agglomeration of particles
for dust transport, handling and storage can then constitute a good option to balance a low
density and an explosion risk, which will notably be demonstrated in chapter 5.
II.2.5. Decreasing the particle size…
The impact of the particle size on dust explosivity has been illustrated by Jacobson et al. (1964)
and Nagy and Verakis (1983), who investigated the evolution of the explosion parameters of
an aluminum powder with the particle size (Figure 2-3). It appears that the smaller the particles,
the easier the ignition and the more severe the explosion, mainly due to the increased specific
surface area. But is this tendency still verified by decreasing even more the particle size, to the
nano-range? Are nanoparticles explosion more likely and more destructive than microparticles?
Further investigations on the previously mentioned aluminum explosion at Gullaug, Norway,
in 1973, revealed that the aluminum thickness was around 100 nm, and MIE of the order of
1 mJ and maximum rate of pressure rise around 2600 bar.s-1 were measured, which seems to
show an extreme ignition sensitivity and explosion severity (Eckhoff, 2003). However, it has
to be noticed that, due to the presence of sulfur in the mixture, the explosion cannot be totally
attributed to the aluminum nanoparticles.
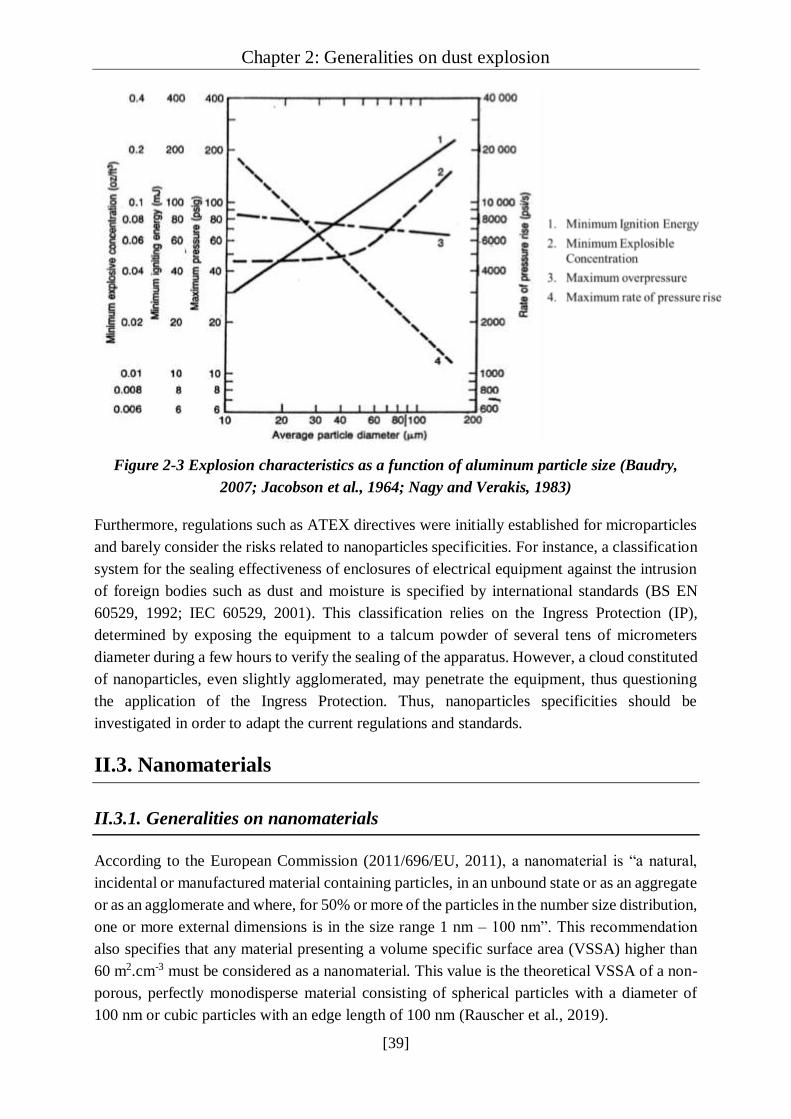
Chapter 2: Generalities on dust explosion
[39]
Figure 2-3 Explosion characteristics as a function of aluminum particle size (Baudry,
2007; Jacobson et al., 1964; Nagy and Verakis, 1983)
Furthermore, regulations such as ATEX directives were initially established for microparticles
and barely consider the risks related to nanoparticles specificities. For instance, a classification
system for the sealing effectiveness of enclosures of electrical equipment against the intrusion
of foreign bodies such as dust and moisture is specified by international standards (BS EN
60529, 1992; IEC 60529, 2001). This classification relies on the Ingress Protection (IP),
determined by exposing the equipment to a talcum powder of several tens of micrometers
diameter during a few hours to verify the sealing of the apparatus. However, a cloud constituted
of nanoparticles, even slightly agglomerated, may penetrate the equipment, thus questioning
the application of the Ingress Protection. Thus, nanoparticles specificities should be
investigated in order to adapt the current regulations and standards.
II.3. Nanomaterials
II.3.1. Generalities on nanomaterials
According to the European Commission (2011/696/EU, 2011), a nanomaterial is “a natural,
incidental or manufactured material containing particles, in an unbound state or as an aggregate
or as an agglomerate and where, for 50% or more of the particles in the number size distribution,
one or more external dimensions is in the size range 1 nm – 100 nm”. This recommendation
also specifies that any material presenting a volume specific surface area (VSSA) higher than
60 m2.cm-3 must be considered as a nanomaterial. This value is the theoretical VSSA of a non-
porous, perfectly monodisperse material consisting of spherical particles with a diameter of
100 nm or cubic particles with an edge length of 100 nm (Rauscher et al., 2019).
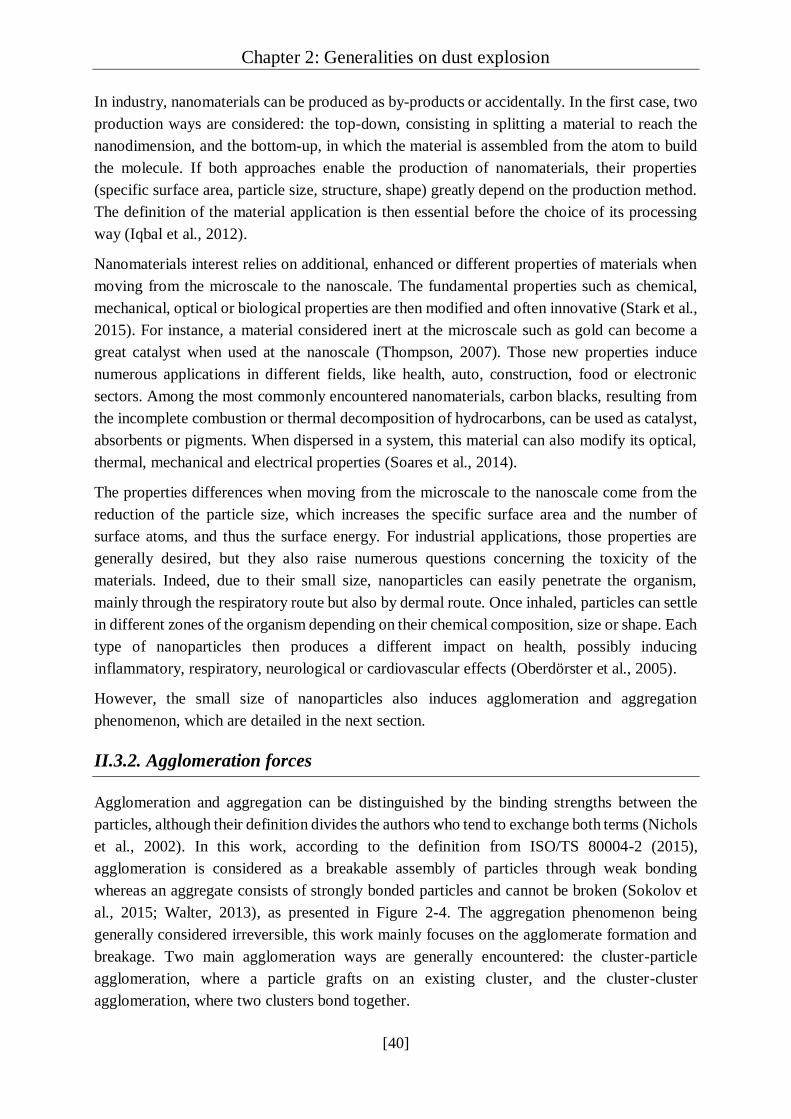
Chapter 2: Generalities on dust explosion
[40]
In industry, nanomaterials can be produced as by-products or accidentally. In the first case, two
production ways are considered: the top-down, consisting in splitting a material to reach the
nanodimension, and the bottom-up, in which the material is assembled from the atom to build
the molecule. If both approaches enable the production of nanomaterials, their properties
(specific surface area, particle size, structure, shape) greatly depend on the production method.
The definition of the material application is then essential before the choice of its processing
way (Iqbal et al., 2012).
Nanomaterials interest relies on additional, enhanced or different properties of materials when
moving from the microscale to the nanoscale. The fundamental properties such as chemical,
mechanical, optical or biological properties are then modified and often innovative (Stark et al.,
2015). For instance, a material considered inert at the microscale such as gold can become a
great catalyst when used at the nanoscale (Thompson, 2007). Those new properties induce
numerous applications in different fields, like health, auto, construction, food or electronic
sectors. Among the most commonly encountered nanomaterials, carbon blacks, resulting from
the incomplete combustion or thermal decomposition of hydrocarbons, can be used as catalyst,
absorbents or pigments. When dispersed in a system, this material can also modify its optical,
thermal, mechanical and electrical properties (Soares et al., 2014).
The properties differences when moving from the microscale to the nanoscale come from the
reduction of the particle size, which increases the specific surface area and the number of
surface atoms, and thus the surface energy. For industrial applications, those properties are
generally desired, but they also raise numerous questions concerning the toxicity of the
materials. Indeed, due to their small size, nanoparticles can easily penetrate the organism,
mainly through the respiratory route but also by dermal route. Once inhaled, particles can settle
in different zones of the organism depending on their chemical composition, size or shape. Each
type of nanoparticles then produces a different impact on health, possibly inducing
inflammatory, respiratory, neurological or cardiovascular effects (Oberdörster et al., 2005).
However, the small size of nanoparticles also induces agglomeration and aggregation
phenomenon, which are detailed in the next section.
II.3.2. Agglomeration forces
Agglomeration and aggregation can be distinguished by the binding strengths between the
particles, although their definition divides the authors who tend to exchange both terms (Nichols
et al., 2002). In this work, according to the definition from ISO/TS 80004-2 (2015),
agglomeration is considered as a breakable assembly of particles through weak bonding
whereas an aggregate consists of strongly bonded particles and cannot be broken (Sokolov et
al., 2015; Walter, 2013), as presented in Figure 2-4. The aggregation phenomenon being
generally considered irreversible, this work mainly focuses on the agglomerate formation and
breakage. Two main agglomeration ways are generally encountered: the cluster-particle
agglomeration, where a particle grafts on an existing cluster, and the cluster-cluster
agglomeration, where two clusters bond together.

Chapter 2: Generalities on dust explosion
[41]
Figure 2-4 Illustration of a primary particle, an aggregate and an agglomerate
The main cohesion forces inducing the agglomeration of nanoparticles are the van der Waals
interactions, electrostatic forces and, in the case of wet particles, capillary effects (Debrincat et
al., 2008; Hartley et al., 1985). Magnetic forces can also act between the particles, but only on
particles presenting a dipole moment, which is not the case of the studied powder (aluminum,
carbon black, cellulose and silicon).
II.3.2.1. Van der Waals forces
Van der Waals electromagnetic interactions act between two close particles or between a
particle and a surface due to their spontaneous electric and magnetic polarization. In the case
of an interaction between a microparticle and a nanoparticle, a sphere-plane contact can be
considered because of the size difference between the particles. However, in this work, only
contacts between nanoparticles are analyzed in the form of sphere-sphere contacts. In the
microscopic scale, the London-van der Waals theory is applied, with the force acting between
two symmetric and neutral molecules (Figure 2-5).
Figure 2-5 Useful geometric considerations to present van der Waals forces between two
spherical particles
Van der Waals forces acting on two spherical particles of radius R1 and R2 with surfaces
separated from a distance hp can be expressed as follows (Israelachvili, 2011):
𝐹𝑉𝑑𝑊 = −𝐴𝑅1𝑅2
6(𝑅1+𝑅2)ℎ𝑝² 2-2
In the case of particles of the same diameter dp = 2 R1 = 2R2, the previous relation becomes:
𝐹𝑉𝑑𝑊 = −𝐴𝑑𝑃
24ℎ𝑝² 2-3

Chapter 2: Generalities on dust explosion
[42]
The Hamaker constant A is a parameter which depends on the nature and density of the material
as well as the environment in which the interaction takes place. Table 2-4 presents some
Hamaker constant values for the compounds of interest in this study.
Table 2-4 Values of Hamaker constant for the considered compounds
System Hamaker constant (J) Reference
Cellulose in water 5.8 x 10⁻²⁰ (Bergstroem et al., 1996)
Aluminum in water 1.84 x 10⁻¹⁹ (Jiang and Pinchuk, 2016)
Aluminum in vacuum 2.56 x 10⁻¹⁹ (Jiang and Pinchuk, 2016)
Graphite in water 1.15 x 10⁻¹⁹ (Dagastine et al., 2002)
Graphite in air 2.53 x 10⁻¹⁹ (Dagastine et al., 2002)
Silicon carbide in n-heptane 2.48 x 10⁻¹⁹ (Médout-Marère, 2000)
It should be noted that, to reach a given concentration, the number of nanoparticles is greatly
higher than that of microparticles, which decreases the distance between the particles and thus
favorizes the van der Waals interactions. Due to the square factor on the interparticle distance,
such forces are non-negligible compared with the gravitational forces for particles smaller than
50-100 µm (Condotta, 2005).
II.3.2.2. Electrostatic forces
Electrostatic interactions result from frequent contacts between particles, thus creating an
electrostatic potential. In the case of two different particles, part of the electrons from the
surface of one particle is transferred to the other, inducing a triboelectric effect leading to
attractive or repulsive interactions. The electrostatic force Fel is expressed by Coulomb law,
where ε0 is the dielectric permittivity of vacuum, q the charge of the particles and h the distance
between the particles:
𝐹𝑒𝑙 = 1
4𝜋 0
𝑞1𝑞2
ℎ𝑝2 2-4
II.3.2.3. Capillary forces
Capillary forces act when the moisture content of the powder is relatively high. The water
retention within the solid depends on its hygroscopicity and the relative humidity of
atmosphere. This force can thus vary by modifying the available quantity of liquid and its
properties (notably the surface tension γ and the viscosity). It is calculated according to relation
2-5, where the first term represents the surface tension force and the second term expresses the
force resulting from a pressure loss in the liquid/capillary bridge (Seville et al., 2000). The
capillary forces are characterized by the apparition of a meniscus between the particles (Figure
2-6) and can be neglected if the moisture content of the powder is low.
Chapter 2: Generalities on dust explosion
[43]
𝐹𝑐𝑎𝑝 = 2𝜋𝑟𝛾 + 𝜋𝑟²∆𝑃𝑐𝑎𝑝 2-5
Figure 2-6 Liquid meniscus between two spherical particles (Seville et al., 2000)
II.3.3. Agglomerates breakage
As previously explained, an agglomerate is an assembly of weakly bounded particles.
Depending on the cohesion forces, each agglomerate possesses its own cohesion strength, i.e.
a force per surface unit to provide for the breakage of the contacts between particles. Over the
years, several methods were developed to calculate the cohesion strength of agglomerates.
II.3.3.1. Simultaneous rupture across a fracture plan (Rumpf, 1962)
The oldest and best-known theory was established by Rumpf (1962), who considered spherical
particles with the same size. This ideal model assumes that the agglomerate is separated in two
parts by a transverse section, without taking into account the actual structure of the agglomerate
(Figure 2-7). Several hypotheses were emitted to define a formula allowing the estimation of
an agglomerate cohesion strength. First, the stressed section contains a great number of bonds,
evenly distributed along this section and in the spatial directions. Then, the particles are
statically distributed within the agglomerate: the stressed section is then homogeneous at the
macroscopic level and presents an average effective force. Finally, the effective cohesion forces
are distributed around a mean value that can be used for calculations and considered equal in
every point of the section.
Figure 2-7 Example of ideal (dotted line) and real (solid line) fracture of an agglomerate
(Rumpf, 1962)
Rumpf (1962) then defines the agglomerate cohesion strength σr as a function of the cohesion
forces acting on the agglomerate Fagglo, the agglomerate porosity 휀, the diameter of the primary
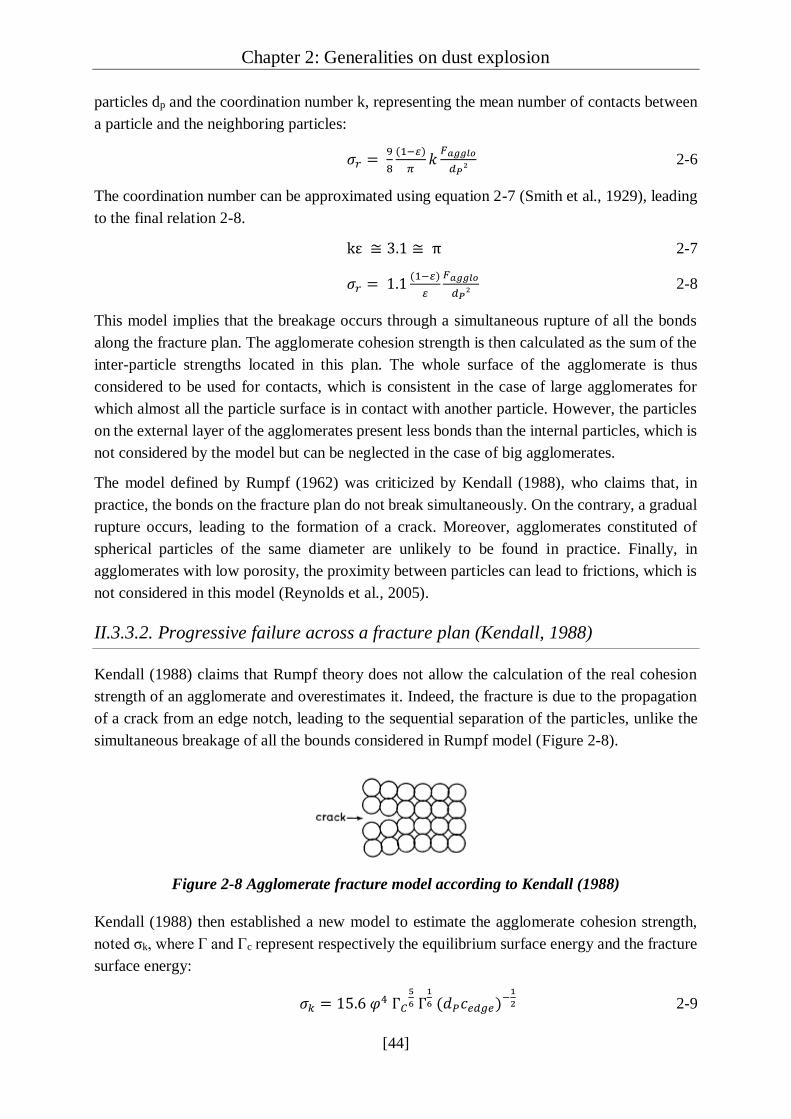
Chapter 2: Generalities on dust explosion
[44]
particles dp and the coordination number k, representing the mean number of contacts between
a particle and the neighboring particles:
𝜎𝑟 = 9
8
(1− )
𝜋𝑘
𝐹𝑎𝑔𝑔𝑙𝑜
𝑑𝑃² 2-6
The coordination number can be approximated using equation 2-7 (Smith et al., 1929), leading
to the final relation 2-8.
kε ≅ 3.1 ≅ π 2-7
𝜎𝑟 = 1.1(1− ) 𝐹𝑎𝑔𝑔𝑙𝑜
𝑑𝑃² 2-8
This model implies that the breakage occurs through a simultaneous rupture of all the bonds
along the fracture plan. The agglomerate cohesion strength is then calculated as the sum of the
inter-particle strengths located in this plan. The whole surface of the agglomerate is thus
considered to be used for contacts, which is consistent in the case of large agglomerates for
which almost all the particle surface is in contact with another particle. However, the particles
on the external layer of the agglomerates present less bonds than the internal particles, which is
not considered by the model but can be neglected in the case of big agglomerates.
The model defined by Rumpf (1962) was criticized by Kendall (1988), who claims that, in
practice, the bonds on the fracture plan do not break simultaneously. On the contrary, a gradual
rupture occurs, leading to the formation of a crack. Moreover, agglomerates constituted of
spherical particles of the same diameter are unlikely to be found in practice. Finally, in
agglomerates with low porosity, the proximity between particles can lead to frictions, which is
not considered in this model (Reynolds et al., 2005).
II.3.3.2. Progressive failure across a fracture plan (Kendall, 1988)
Kendall (1988) claims that Rumpf theory does not allow the calculation of the real cohesion
strength of an agglomerate and overestimates it. Indeed, the fracture is due to the propagation
of a crack from an edge notch, leading to the sequential separation of the particles, unlike the
simultaneous breakage of all the bounds considered in Rumpf model (Figure 2-8).
Figure 2-8 Agglomerate fracture model according to Kendall (1988)
Kendall (1988) then established a new model to estimate the agglomerate cohesion strength,
noted σk, where Γ and Γc represent respectively the equilibrium surface energy and the fracture
surface energy:
𝜎𝑘 = 15.6 𝜑4 Г𝐶
5
6 Г1
6 (𝑑𝑃𝑐𝑒𝑑𝑔𝑒)−1
2 2-9
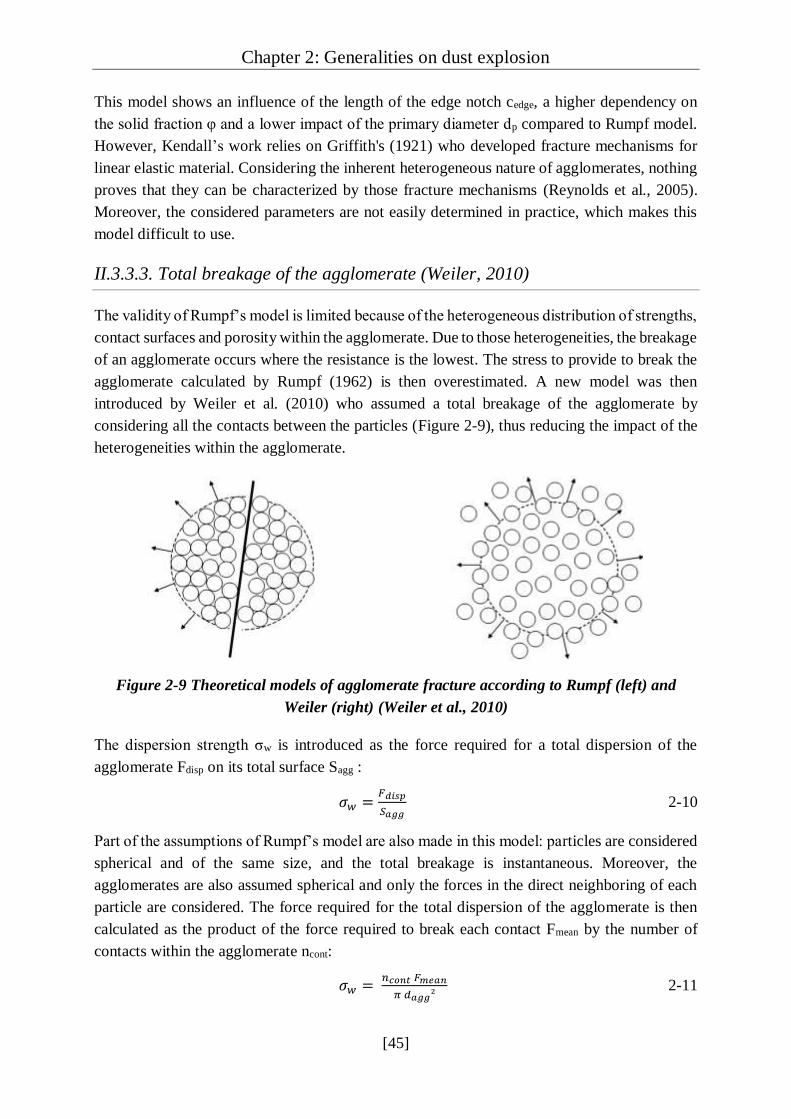
Chapter 2: Generalities on dust explosion
[45]
This model shows an influence of the length of the edge notch cedge, a higher dependency on
the solid fraction φ and a lower impact of the primary diameter dp compared to Rumpf model.
However, Kendall’s work relies on Griffith's (1921) who developed fracture mechanisms for
linear elastic material. Considering the inherent heterogeneous nature of agglomerates, nothing
proves that they can be characterized by those fracture mechanisms (Reynolds et al., 2005).
Moreover, the considered parameters are not easily determined in practice, which makes this
model difficult to use.
II.3.3.3. Total breakage of the agglomerate (Weiler, 2010)
The validity of Rumpf’s model is limited because of the heterogeneous distribution of strengths,
contact surfaces and porosity within the agglomerate. Due to those heterogeneities, the breakage
of an agglomerate occurs where the resistance is the lowest. The stress to provide to break the
agglomerate calculated by Rumpf (1962) is then overestimated. A new model was then
introduced by Weiler et al. (2010) who assumed a total breakage of the agglomerate by
considering all the contacts between the particles (Figure 2-9), thus reducing the impact of the
heterogeneities within the agglomerate.
Figure 2-9 Theoretical models of agglomerate fracture according to Rumpf (left) and
Weiler (right) (Weiler et al., 2010)
The dispersion strength σw is introduced as the force required for a total dispersion of the
agglomerate Fdisp on its total surface Sagg :
𝜎𝑤 =𝐹𝑑𝑖𝑠𝑝
𝑆𝑎𝑔𝑔 2-10
Part of the assumptions of Rumpf’s model are also made in this model: particles are considered
spherical and of the same size, and the total breakage is instantaneous. Moreover, the
agglomerates are also assumed spherical and only the forces in the direct neighboring of each
particle are considered. The force required for the total dispersion of the agglomerate is then
calculated as the product of the force required to break each contact Fmean by the number of
contacts within the agglomerate ncont:
𝜎𝑤 = 𝑛𝑐𝑜𝑛𝑡 𝐹𝑚𝑒𝑎𝑛
𝜋 𝑑𝑎𝑔𝑔² 2-11
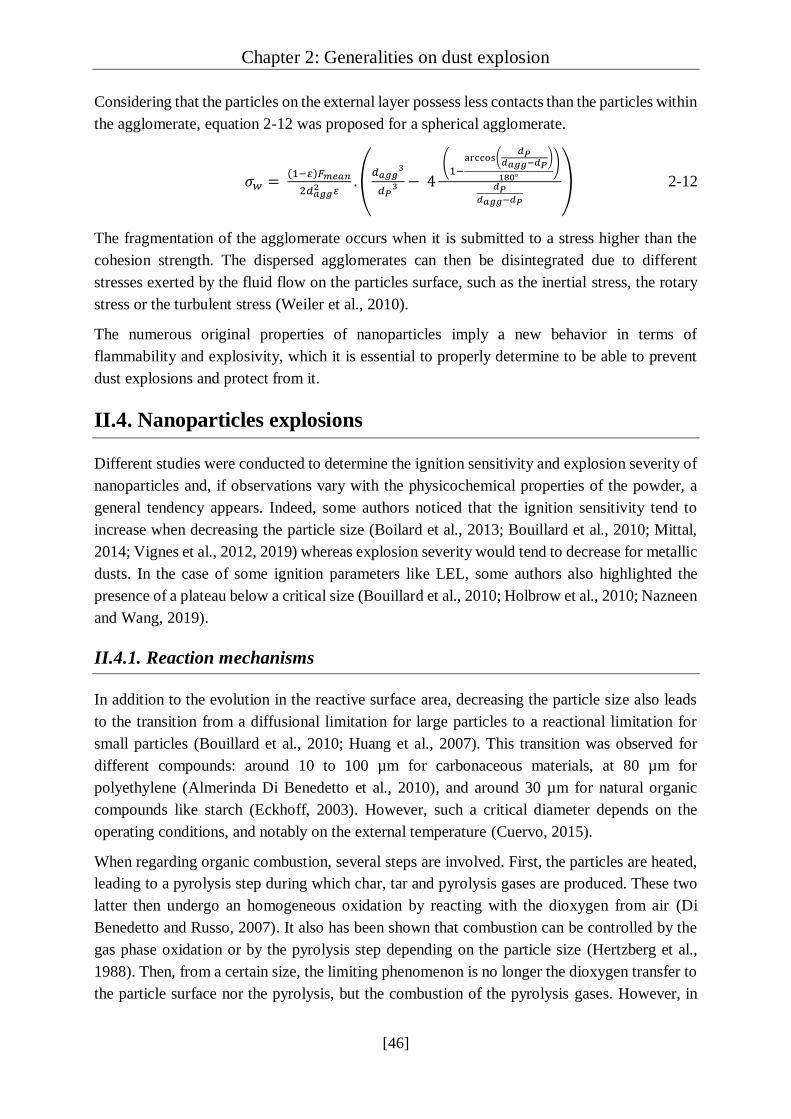
Chapter 2: Generalities on dust explosion
[46]
Considering that the particles on the external layer possess less contacts than the particles within
the agglomerate, equation 2-12 was proposed for a spherical agglomerate.
𝜎𝑤 = (1− )𝐹𝑚𝑒𝑎𝑛
2𝑑𝑎𝑔𝑔2 . (
𝑑𝑎𝑔𝑔3
𝑑𝑃3 − 4
(
1−arccos(
𝑑𝑃𝑑𝑎𝑔𝑔−𝑑𝑃
)
180°
)
𝑑𝑃𝑑𝑎𝑔𝑔−𝑑𝑃
) 2-12
The fragmentation of the agglomerate occurs when it is submitted to a stress higher than the
cohesion strength. The dispersed agglomerates can then be disintegrated due to different
stresses exerted by the fluid flow on the particles surface, such as the inertial stress, the rotary
stress or the turbulent stress (Weiler et al., 2010).
The numerous original properties of nanoparticles imply a new behavior in terms of
flammability and explosivity, which it is essential to properly determine to be able to prevent
dust explosions and protect from it.
II.4. Nanoparticles explosions
Different studies were conducted to determine the ignition sensitivity and explosion severity of
nanoparticles and, if observations vary with the physicochemical properties of the powder, a
general tendency appears. Indeed, some authors noticed that the ignition sensitivity tend to
increase when decreasing the particle size (Boilard et al., 2013; Bouillard et al., 2010; Mittal,
2014; Vignes et al., 2012, 2019) whereas explosion severity would tend to decrease for metallic
dusts. In the case of some ignition parameters like LEL, some authors also highlighted the
presence of a plateau below a critical size (Bouillard et al., 2010; Holbrow et al., 2010; Nazneen
and Wang, 2019).
II.4.1. Reaction mechanisms
In addition to the evolution in the reactive surface area, decreasing the particle size also leads
to the transition from a diffusional limitation for large particles to a reactional limitation for
small particles (Bouillard et al., 2010; Huang et al., 2007). This transition was observed for
different compounds: around 10 to 100 µm for carbonaceous materials, at 80 µm for
polyethylene (Almerinda Di Benedetto et al., 2010), and around 30 µm for natural organic
compounds like starch (Eckhoff, 2003). However, such a critical diameter depends on the
operating conditions, and notably on the external temperature (Cuervo, 2015).
When regarding organic combustion, several steps are involved. First, the particles are heated,
leading to a pyrolysis step during which char, tar and pyrolysis gases are produced. These two
latter then undergo an homogeneous oxidation by reacting with the dioxygen from air (Di
Benedetto and Russo, 2007). It also has been shown that combustion can be controlled by the
gas phase oxidation or by the pyrolysis step depending on the particle size (Hertzberg et al.,
1988). Then, from a certain size, the limiting phenomenon is no longer the dioxygen transfer to
the particle surface nor the pyrolysis, but the combustion of the pyrolysis gases. However, in
Chapter 2: Generalities on dust explosion
[47]
practice, the pyrolysis and the oxidation step are not completely separated, leading to the
simultaneous presence of pyrolysis gases and dispersed particles, which can be regarded as a
hybrid mixture (Dufaud et al., 2012).
A critical diameter was also evidenced for metallic particles, notably around 10 µm for
aluminum particles, although different mechanisms are involved during their combustion
(Glorian et al., 2016; Lomba, 2016). Indeed, the combustion undergoes a surface oxidation, a
melting or a vaporization of the particles depending on their size (Levitas, 2013; Mohan et al.,
2009). The Damköhler number 2 is generally used to determine if the combustion process is
controlled by the diffusion of dioxygen to the particles or by the surface reaction:
𝐷𝑎𝐼𝐼 = 𝜏𝑑𝑖𝑓𝑓
𝜏𝑘𝑖𝑛 2-13
In cases where DaII >> 1, the combustion time of the diffusion-controlled process τdiff is higher
than the one controlled by the surface reaction τkin. The combustion is then limited by the
diffusion of the dioxygen toward the particle surface. The metal below the oxide layer then
melts, and the emitted gas moves away from the particle to meet the dioxygen. A detached
flame is then obtained and nano-sized oxides are produced. On the contrary, if DaII << 1, the
surface reaction limits the combustion, which occurs directly on the surface of the particle,
without vaporization of the metal. A combustion product with a size similar to the one of the
initial particle is then obtained (Lomba, 2016). In practice, both processes operate during the
combustion (Figure 2-10), and only the prevalence of one phenomenon to the other is
distinguished.
Figure 2-10 Scheme of an aluminum particle with the oxide layer, surface reaction and
oxygen diffusion (Rai et al., 2006)
A third combustion way occurs when considering nanoparticles: due to the high curvature,
Laplace pressure induces the fracture and spallation of the shell (Levitas, 2013) leading to the
ejection of nanosized droplets which are then oxidized, leading to a final product which appears
once again in the form of nanoparticles.

Chapter 2: Generalities on dust explosion
[48]
II.4.2. Ignition sensitivity
Generally, the ignition sensitivity tends to increase when decreasing the particle size, until a
critical diameter from which it plateaus. However, the existence of such a critical diameter
cannot be identified in the case of metallic particles: the minimum ignition energy sensitively
decreases when decreasing the particle size, as shown in Table 2-5. It appears that some metallic
powders, such as aluminum, exhibits MIE lower than 1 mJ, and can even ignite spontaneously
when exposed to oxygen (Krietsch et al., 2015). This latter phenomenon, known as
pyrophoricity, is obviously an issue when it comes to powder generation, handling, transport
and storage, and it becomes necessary to evaluate a critical size below which particles can self-
ignite (Sundaram et al., 2013).
Table 2-5 MIE of aluminum particles (Dufaud et al., 2011)
Particles Al (42 µm) Al (3 µm) Al (200 nm) Al (100 nm) Zn (38 µm) Zn (120 nm)
MIE (mJ) 440 14 7 < 1 > 1000 19
The MIE of carbonaceous powders being in the order of 250 to 2500 J (Turkevich et al., 2015),
the influence of the particle size on this parameter cannot be evaluated with the modified
Hartmann tube, which can only generate a maximum energy of 1 J. However, Bouillard et al.
(2010) evidenced that the LEL of carbon black decreases when decreasing the particle size,
until reaching a plateau at 60 g.m-3 from BET diameter of 25 nm. These authors also highlighted
that the MIT decreases when moving from the microscale to the nanoscale, but then could
increase for small particles. The existence of this minimum probably comes from the fact that,
for small particles, cohesion forces are stronger than for bigger ones, thus causing
agglomeration (Eckhoff, 2012). A higher energy amount is then needed to ignite the powder,
explaining the increasing in the MIT. This tendency is also visible when regarding the explosion
severity parameters (Vignes et al., 2019).
II.4.3. Explosion severity
In a similar way than for ignition sensitivity, an increase in the explosion severity is observed
when decreasing the particle size until a critical value. For carbonaceous powders, Eckhoff
(2003) reported this value to be around 50 µm, which is confirmed by Bouillard et al. (2010),
Holbrow et al. (2010) and Turkevich et al. (2016) who obtained an explosion severity similar
to microparticles when testing nanoparticles.
When it comes to the most reactive metallic powders, such as aluminum or magnesium, no limit
value could be found in the literature. However, Dufaud et al. (2011) and Vignes et al. (2019)
evidenced that the explosion severity increases before decreasing when reducing the particle
size by measuring the maximum overpressure and maximum rate of pressure rise of aluminum
and zinc powders with different primary particle diameters, from 40 µm to 20 nm (Table 2-6).

Chapter 2: Generalities on dust explosion
[49]
Table 2-6 Explosion severity of different aluminum powders
(Dufaud et al., 2011; Vignes et al., 2019)
Powder Pmax (bar) (dP/dt)max (bar.s-1) KSt (bar.m.s-1) St class
Aluminum 18 nm 7.3 564 153 St 1
Aluminum 40-60 nm 8.9 2251 611 St 3
Aluminum 50-70 nm 8.3 1573 427 St 3
Aluminum 90-110 nm 7.9 1102 300 St 3
Aluminum 100 nm 8.2 1340 362 St 3
Aluminum 130 nm 7.8 1030 280 St 2
Aluminum 150 nm 10.2 2486 675 St 3
Aluminum 200 nm 9.5 2420 673 St 3
Aluminum 3 µm 9.8 2090 567 St 3
Aluminum 7 µm 9.1 1460 396 St 3
Aluminum 27 µm 7.5 400 106 St 1
Aluminum 42 µm 7.2 360 98 St 1
The explosivity difference between aluminum particles of 130 nm and 150 nm may come from
different passivation degree and from agglomeration phenomenon which is probably more
important for smaller particles. A high explosivity difference appears also between aluminum
of 27 µm and 7 µm, increasing the maximum rate of pressure rise by 1000 bar.s-1 when
decreasing the particle size of 20 µm and moving from class St 1 to St 3, which is the most
violent class. This radical change can be due to a modification in the combustion mechanisms
as previously mentioned, or to a flame propagation mechanism variation (Vignes et al., 2019).
II.4.4. Radiative heat transfer
When examining gas explosions, the radiative heat transfer is commonly neglected as the gases
are generally transparent. However, Torrado (2017) evidenced that adding a small amount of
nanoparticles in a gas considerably increases the radiation emitted during an explosion, as
presented in Figure 2-11. Further investigations (Ben Moussa, 2017; Julien et al., 2017a; Proust
et al., 2017) highlighted the influence of the radiative heat transfer on the flame propagation
and the explosion severity, according to two possible effects. In the first case, the radiative heat
transfer tends to heat the fresh unburnt mixture, which can speed up the flame propagation and
increase the explosion severity (Haghiri and Bidabadi, 2010). On the contrary, in the second
case, the heat losses on the walls tend to decrease the flame temperature, and thus the explosion
overpressure (Bidabadi and Azad, 2015). In both cases, it is admitted that, although a dust

Chapter 2: Generalities on dust explosion
[50]
explosion flame propagates essentially by conduction, like gases, radiation also plays an
important role during the propagation.
Figure 2-11 Flame propagation at an ignition delay time of 60 ms for a 12%v. methane/air
mixture a) alone and b) containing 30 mg of carbon black nanoparticles (Torrado, 2017a)
Flame propagation mechanisms slightly differ depending if particles are micrometric or
nanometric. Indeed, depending on the particle size, the scattering of incident light is modified,
following Mie or Rayleigh theory, which is a limiting case of Mie theory for fine particles.
Thus, for small particles whose diameter is smaller than the incident beam wavelength, i.e.
nanoparticles, Rayleigh theory must be applied (Figure 2-12A). The light scattering then occur
in every direction, inducing significant radiation which can increase the flame thickness. On
the contrary, when examining larger particles, Mie theory is considered (Figure 2-12B and C),
where the light scattering is mainly oriented toward the direction of incident light (Moosmüller
and Arnott, 2009).
Figure 2-12 Spatial distribution of light scattering for particles of different sizes
(Ben Moussa, 2017)
In view of these elements concerning nanoparticle explosions, it appears that standard
procedures, initially conceived for microparticles, may not be adapted to nanoparticles
explosions evaluation. Further considerations on this aspect are then developed in chapter 4.

Chapter 2: Generalities on dust explosion
[51]
Summary
This chapter presents the first step of the evaluation of the explosion risk related to the
production, transport and handling of nanopowders, relying on a literature review divided into
four parts.
First, an analysis of some past accidents involving different types of powders highlighted the
reality and seriousness of the risk represented by dust explosions. Thus, the two European
ATEX directives were introduced: the first one, 1999/99/CE directive (ATEX Workplace
directive) classifies the workplace into zones depending on the formation probability of an
explosive atmosphere. The equipment to use into such zones are then defined by the second
one, i.e. 2014/34/UE directive. The implementation of safety measures to prevent and protect
from dust explosions is then possible through the knowledge of the explosion characteristics of
the dust involved in the process.
In a second part, the dust explosion phenomenology was explained. First, the distinction
between ignition sensitivity, i.e. the probability that a dust ignites, and explosion severity,
characterizing the effects of the explosion, was clarified. The standard parameters describing
the ignition (minimum ignition energy, minimum ignition temperature, lower explosion limit)
and the explosion (maximum overpressure, maximum rate of pressure rise, burning velocity)
were then detailed, along with the main factors influencing them, such as the chemical
composition, the dust concentration, the moisture content, the ignition energy, the initial
turbulence and the particle size.
Since this work focuses on nanoparticles, the third part is dedicated to their specificities. More
precisely, the agglomeration phenomenon inherent to nanomaterials was further investigated.
Indeed, the main cohesion forces, such as van der Waals, electrostatic and capillary forces were
detailed, along with the three main models describing agglomerates breakage established by
Rumpf (1962), Kendall (1988) and Weiler et al. (2010).
Finally, the influence of nanoparticles specificities on their explosion behavior was discussed.
Some authors then observed that the ignition sensitivity tends to increase when decreasing the
particle size (Vignes et al., 2019) whereas the explosion severity shows a plateau (Bouillard et
al., 2010). This plateau can be explained by the agglomeration of the nanoparticles, which then
exhibit an explosion severity similar to microparticles. A transition from a diffusional limitation
for large particles to a reactional limitation for small particles was also highlighted (Bouillard
et al., 2010). This transition was found around 10 to 100 µm for carbonaceous compounds (Di
Benedetto et al., 2010), around 30 µm for organic compounds (Eckhoff, 2003) and around 10
µm for metallic particles (Glorian et al., 2016). For such powders, a pyrophoric behavior was
also mentioned, leading to a spontaneous ignition when exposed to air (Krietsch et al., 2015).
Moreover, a transition from Mie scattering to Rayleigh scattering occurs when decreasing the
particle size to the nano-range, thus inducing differences in the radiative heat transfer with
regard to microparticles, possibly impacting the validity of the use of the cube-root law.
Chapter 2: Generalities on dust explosion
[52]
Résumé
Ce chapitre présente les premières étapes de l’évaluation des risques d’explosion liés à la
production, au transport et à la manipulation de poudres nanométriques, et repose sur une revue
bibliographique divisée en quatre parties.
Dans un premier temps, une analyse d’accidents impliquant différents types de poudres a
souligné la réalité et la gravité du risque représenté par les explosions de poussières. Les deux
directives européennes ATEX ont été introduites : la première, la directive 1999/99/CE classe
les espaces de travail en zones selon la probabilité de formation d’une atmosphère explosive.
Les équipements autorisés dans ces zones sont alors définis par la seconde directive, la directive
2014/34/UE. L’implémentation de mesures de sécurité pour prévenir et protéger contre les
explosions de poussières est alors possible à partir de la connaissance des caractéristiques
d’explosivité des poussières impliquées dans les procédés.
Dans une deuxième partie, la phénoménologie des explosions de poussières a été détaillée.
D’abord, la distinction entre la sensibilité à l’inflammation, i.e. la probabilité qu’une poussière
s’enflamme, et la sévérité d’explosion, qui concerne les effets de l’explosion, a été réalisée. Les
paramètres décrivant l’inflammation (énergie minimale d’inflammation, température minimale
d’inflammation, concentration minimale explosible) et l’explosion (surpression maximale
d’explosion, vitesse maximale de montée en pression, vitesse de flamme) ont ensuite été
détaillés, ainsi que les principaux facteurs influents, tels que la concentration en poussière, le
taux d’humidité, l’énergie d’inflammation, la turbulence initiale et la taille de particules.
Ce travail se focalisant sur les nanoparticules, la troisième partie de ce chapitre a été dédiée à
leurs spécificités. Plus précisément, le phénomène d’agglomération inhérent aux nanomatériaux
a été analysé. En effet, les principales forces de cohésion, telles que les forces de van der Waals,
électrostatiques et capillaires ont été détaillées, ainsi que les trois principaux modèles décrivant
la fragmentation d’un agglomérat.
Enfin, l’influence des spécificités des nanoparticules sur le déroulement de leur combustion a
été discutée. Certains auteurs ont observé que la sensibilité à l’inflammation tend à croître en
diminuant la taille de particules tandis que la sévérité d’explosion se stabilise (Vignes et al.,
2019). Ce plateau peut être expliqué par l’agglomération des nanoparticules, qui présentent
alors une sévérité d’explosion similaires aux microparticules. La transition d’une limitation
diffusionnelle pour de grosses particules vers une limitation réactionnelle pour de petites
particules a également été démontrée (Bouillard et al., 2010). Cette transition a été obtenue vers
10 à 100 µm pour des composés carbonés (Di Benedetto et al., 2010), vers 30 µm pour des
composés organiques (Eckhoff, 2003) et vers 10 µm pour des particules métalliques (Glorian
et al., 2016). Pour ces dernières, un comportement pyrophorique a également été mentionné,
donnant lieu à une inflammation spontanée lors d’une exposition à l’air (Krietsch et al., 2015).
De plus, en diminuant la taille de particules jusqu’à l’échelle nanométrique, la transition d’une
diffusion de Mie vers une diffusion de Rayleigh induit des différences dans le transfert radiatif
par rapport aux microparticules, impactant probablement la validité de la loi cubique.
[53]
Chapter 3:
Powder and dust cloud characterization
Chapter 3: Powder and dust cloud characterization
[54]
To provide reliable explosion safety characteristics and have a better insight on the influential
factors, the process safety engineer needs to assess properly the properties of the powders.
However, a characterization before dispersion is not sufficient, notably due to the
agglomeration phenomenon that can modify the particle size distribution (PSD) after
dispersion. This chapter is dedicated to the powder and dust cloud characterization, and is
divided into three parts: first, the powders are presented and classified according to the
European Commission definition for nanomaterials. A characterization of the PSD of the
powder before dispersion is also presented. In the second part, the dust cloud properties are
investigated through dustiness and PSD measurements, performed according to three different
methods. In addition, the turbulence level after the dust dispersion in the 20L sphere is evaluated
through Particle Image Velocimetry measurements. Finally, a dimensional analysis describing
the dust dispersion phenomenon is realized, and a correlation for the determination of the mean
surface dimeter after dispersion in the 20L depending on the powder properties and operating
conditions was proposed.
III.1. Powder properties
During this work, four different powders were chosen to highlight the specific behavior of each
type of combustible powder, i.e. carbonaceous, organic or metallic: carbon black,
nanocellulose, aluminum and carbon-coated silicon, as explained in chapter 1. Each powder is
constituted of individual primary particles or crystallites of diameter lower than 100 nm.
However, due to the tendency of nanoparticles to agglomerate and aggregate (Sokolov et al.,
2015), the powders essentially contains agglomerates and aggregates of bigger size (Henry,
2013). It is therefore essential to qualify the exact ‘nanometric’ nature of the powders.
The different powders of interest are presented in this section, and a method proposed in the
NanoDefine project (Rauscher et al., 2015; 2019) was applied to examine whether the powders
can be considered as a nanomaterial according to the European Commission (2011/696/EU,
2011).
III.1.1. Powder description
As previously mentioned, the powders were selected depending on their chemical nature
(carbonaceous, organic and metallic), but also as a function of their availability in the market
and the level of knowledge on the materials. The chosen powders are presented in this section,
along with Scanning Electron Microscopy (SEM) images.
Aluminum
With the aim of reducing fossil fuels consumption and carbon dioxide emissions, inorganic
energy carriers are more and more investigated. Hydrogen has already been recognized as one
of the future energy carriers. However, its storage and transportation can present some
difficulties. In this context, some authors consider that aluminum could constitute an interesting
alternative (Shkolnikov et al., 2011), since it can easily be stored and transported, contrary to
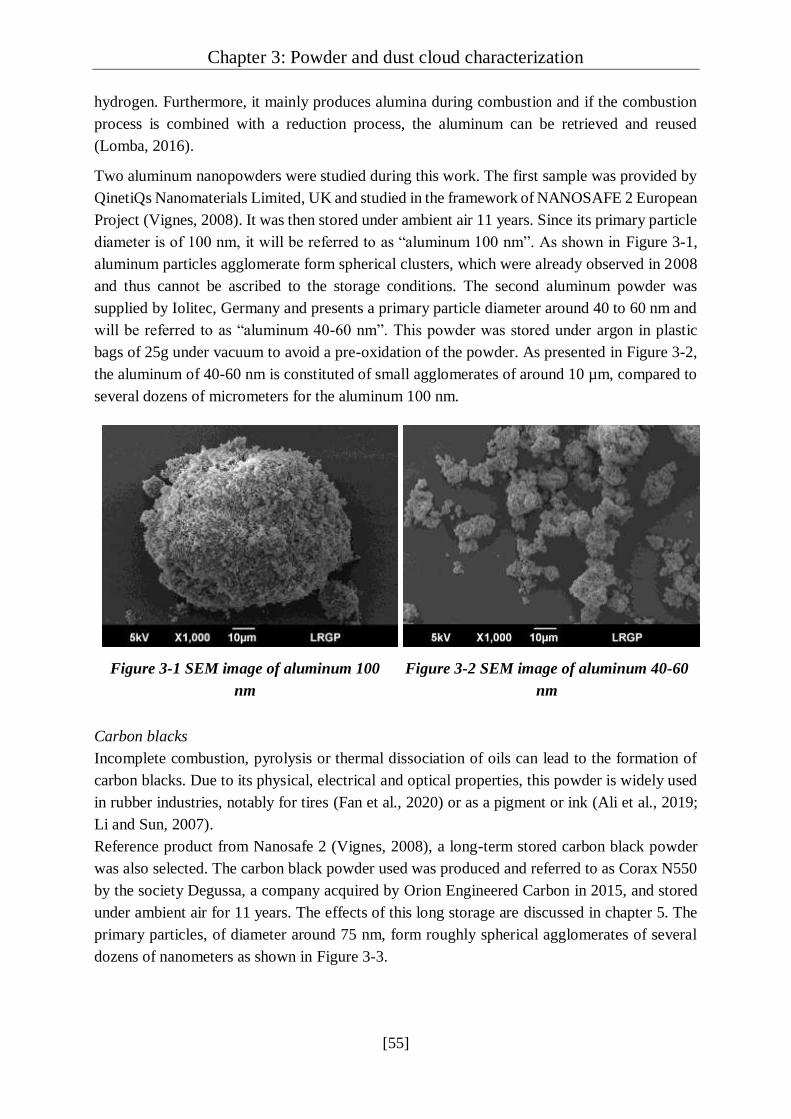
Chapter 3: Powder and dust cloud characterization
[55]
hydrogen. Furthermore, it mainly produces alumina during combustion and if the combustion
process is combined with a reduction process, the aluminum can be retrieved and reused
(Lomba, 2016).
Two aluminum nanopowders were studied during this work. The first sample was provided by
QinetiQs Nanomaterials Limited, UK and studied in the framework of NANOSAFE 2 European
Project (Vignes, 2008). It was then stored under ambient air 11 years. Since its primary particle
diameter is of 100 nm, it will be referred to as “aluminum 100 nm”. As shown in Figure 3-1,
aluminum particles agglomerate form spherical clusters, which were already observed in 2008
and thus cannot be ascribed to the storage conditions. The second aluminum powder was
supplied by Iolitec, Germany and presents a primary particle diameter around 40 to 60 nm and
will be referred to as “aluminum 40-60 nm”. This powder was stored under argon in plastic
bags of 25g under vacuum to avoid a pre-oxidation of the powder. As presented in Figure 3-2,
the aluminum of 40-60 nm is constituted of small agglomerates of around 10 µm, compared to
several dozens of micrometers for the aluminum 100 nm.
Figure 3-1 SEM image of aluminum 100
nm
Figure 3-2 SEM image of aluminum 40-60
nm
Carbon blacks
Incomplete combustion, pyrolysis or thermal dissociation of oils can lead to the formation of
carbon blacks. Due to its physical, electrical and optical properties, this powder is widely used
in rubber industries, notably for tires (Fan et al., 2020) or as a pigment or ink (Ali et al., 2019;
Li and Sun, 2007).
Reference product from Nanosafe 2 (Vignes, 2008), a long-term stored carbon black powder
was also selected. The carbon black powder used was produced and referred to as Corax N550
by the society Degussa, a company acquired by Orion Engineered Carbon in 2015, and stored
under ambient air for 11 years. The effects of this long storage are discussed in chapter 5. The
primary particles, of diameter around 75 nm, form roughly spherical agglomerates of several
dozens of nanometers as shown in Figure 3-3.
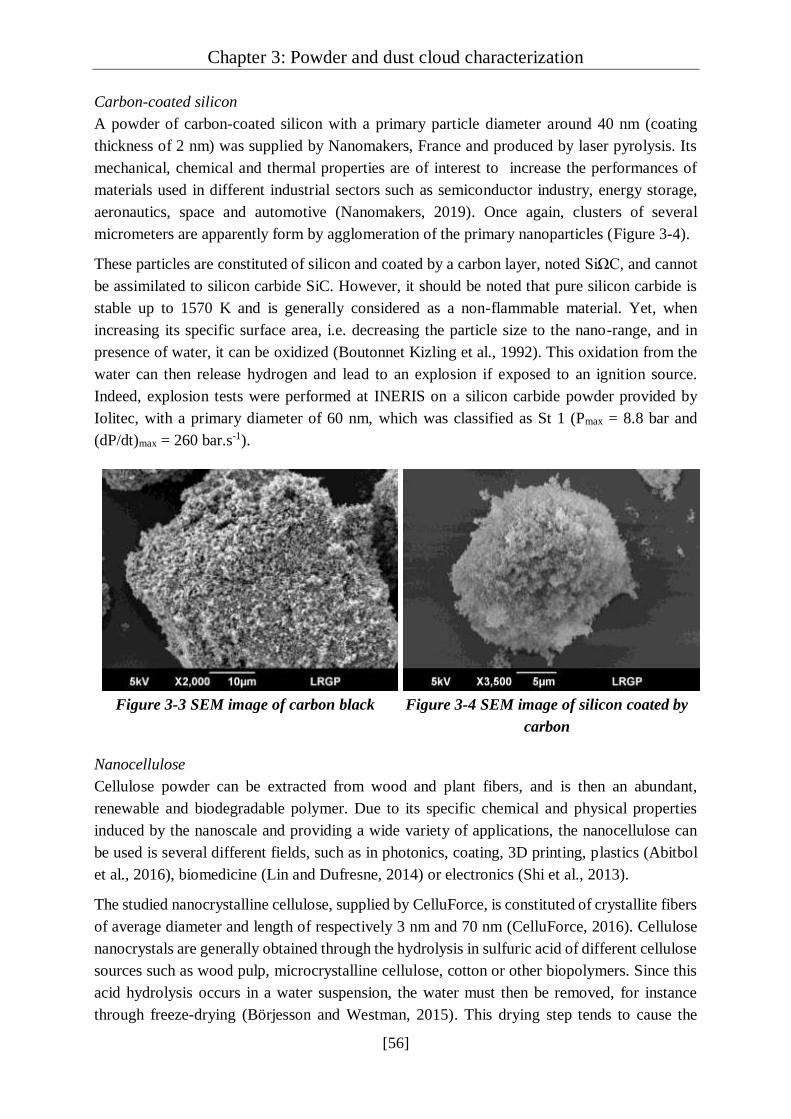
Chapter 3: Powder and dust cloud characterization
[56]
Carbon-coated silicon
A powder of carbon-coated silicon with a primary particle diameter around 40 nm (coating
thickness of 2 nm) was supplied by Nanomakers, France and produced by laser pyrolysis. Its
mechanical, chemical and thermal properties are of interest to increase the performances of
materials used in different industrial sectors such as semiconductor industry, energy storage,
aeronautics, space and automotive (Nanomakers, 2019). Once again, clusters of several
micrometers are apparently form by agglomeration of the primary nanoparticles (Figure 3-4).
These particles are constituted of silicon and coated by a carbon layer, noted SiΩC, and cannot
be assimilated to silicon carbide SiC. However, it should be noted that pure silicon carbide is
stable up to 1570 K and is generally considered as a non-flammable material. Yet, when
increasing its specific surface area, i.e. decreasing the particle size to the nano-range, and in
presence of water, it can be oxidized (Boutonnet Kizling et al., 1992). This oxidation from the
water can then release hydrogen and lead to an explosion if exposed to an ignition source.
Indeed, explosion tests were performed at INERIS on a silicon carbide powder provided by
Iolitec, with a primary diameter of 60 nm, which was classified as St 1 (Pmax = 8.8 bar and
(dP/dt)max = 260 bar.s-1).
Figure 3-3 SEM image of carbon black
Figure 3-4 SEM image of silicon coated by
carbon
Nanocellulose
Cellulose powder can be extracted from wood and plant fibers, and is then an abundant,
renewable and biodegradable polymer. Due to its specific chemical and physical properties
induced by the nanoscale and providing a wide variety of applications, the nanocellulose can
be used is several different fields, such as in photonics, coating, 3D printing, plastics (Abitbol
et al., 2016), biomedicine (Lin and Dufresne, 2014) or electronics (Shi et al., 2013).
The studied nanocrystalline cellulose, supplied by CelluForce, is constituted of crystallite fibers
of average diameter and length of respectively 3 nm and 70 nm (CelluForce, 2016). Cellulose
nanocrystals are generally obtained through the hydrolysis in sulfuric acid of different cellulose
sources such as wood pulp, microcrystalline cellulose, cotton or other biopolymers. Since this
acid hydrolysis occurs in a water suspension, the water must then be removed, for instance
through freeze-drying (Börjesson and Westman, 2015). This drying step tends to cause the
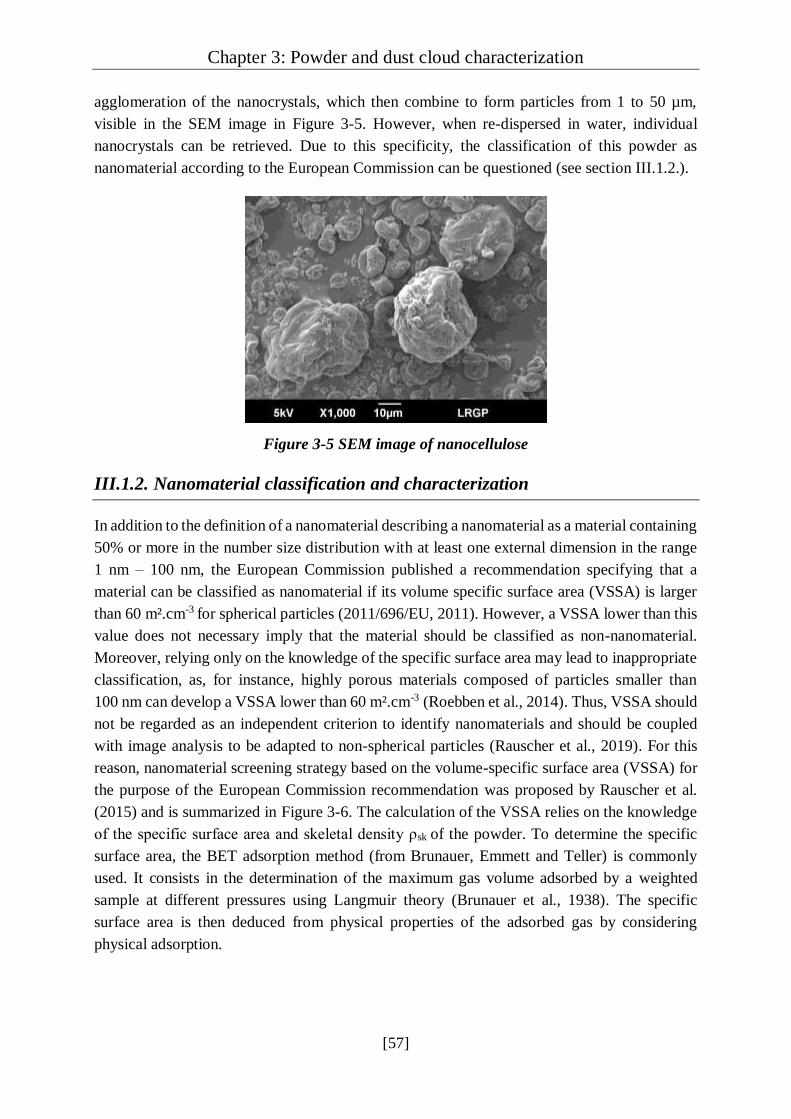
Chapter 3: Powder and dust cloud characterization
[57]
agglomeration of the nanocrystals, which then combine to form particles from 1 to 50 µm,
visible in the SEM image in Figure 3-5. However, when re-dispersed in water, individual
nanocrystals can be retrieved. Due to this specificity, the classification of this powder as
nanomaterial according to the European Commission can be questioned (see section III.1.2.).
Figure 3-5 SEM image of nanocellulose
III.1.2. Nanomaterial classification and characterization
In addition to the definition of a nanomaterial describing a nanomaterial as a material containing
50% or more in the number size distribution with at least one external dimension in the range
1 nm – 100 nm, the European Commission published a recommendation specifying that a
material can be classified as nanomaterial if its volume specific surface area (VSSA) is larger
than 60 m².cm-3 for spherical particles (2011/696/EU, 2011). However, a VSSA lower than this
value does not necessary imply that the material should be classified as non-nanomaterial.
Moreover, relying only on the knowledge of the specific surface area may lead to inappropriate
classification, as, for instance, highly porous materials composed of particles smaller than
100 nm can develop a VSSA lower than 60 m².cm-3 (Roebben et al., 2014). Thus, VSSA should
not be regarded as an independent criterion to identify nanomaterials and should be coupled
with image analysis to be adapted to non-spherical particles (Rauscher et al., 2019). For this
reason, nanomaterial screening strategy based on the volume-specific surface area (VSSA) for
the purpose of the European Commission recommendation was proposed by Rauscher et al.
(2015) and is summarized in Figure 3-6. The calculation of the VSSA relies on the knowledge
of the specific surface area and skeletal density ρsk of the powder. To determine the specific
surface area, the BET adsorption method (from Brunauer, Emmett and Teller) is commonly
used. It consists in the determination of the maximum gas volume adsorbed by a weighted
sample at different pressures using Langmuir theory (Brunauer et al., 1938). The specific
surface area is then deduced from physical properties of the adsorbed gas by considering
physical adsorption.

Chapter 3: Powder and dust cloud characterization
[58]
The skeletal density of fine powders is usually measured using an helium pycnometer (Keng,
1969), which calculates the volume of solid excluding the pores to obtain the real (skeletal)
density, by opposition to the bulk density which includes the volume of the pores.
Figure 3-6 Simplified flow-chart of the method proposed in the NanoDefine project and
explained by Wohlleben et al. (2017)
When applying the method described by Rauscher et al. (2015), the VSSA and the smallest
particle dimension dmin-VSSA are first calculated from the values of specific surface area and
skeletal density ρsk using the following equations (Wohlleben et al., 2017):
𝑉𝑆𝑆𝐴 = 𝑆𝑆𝐴 ∗ 𝜌𝑠𝑘 3-1
𝑑𝑚𝑖𝑛−𝑉𝑆𝑆𝐴 =2𝐷
𝑉𝑆𝑆𝐴 3-2
Since the determination of the dimension D requires knowledge on the particle shape, an
assumption of D = 3, i.e. roughly spherical particles, is generally made for a first estimation of
the parameters. If the VSSA is higher than 6 and the calculated value of dVSSA with D = 3 is
lower than 1 µm, a characterization of the particle shape is then recommended in the method to
consider all types of particles and check for the presence of aggregation or multimodality
(Wohlleben et al., 2017). The accurate value of D should then be used to calculate dmin-VSSA,
which must be lower than 100 nm so that the powder is considered as a nanomaterial.
The studied powders were then characterized in terms of specific surface area and skeletal
density using respectively the BET method (Tristar II Plus, Micromeritics) and a helium
pycnometer (Accupyc 1330C, Micromeritics). The particle dimension was estimated through

Chapter 3: Powder and dust cloud characterization
[59]
SEM images (Figures 3-1 to 3-5 and Appendix 1), every powder being constituted of roughly
spherical particles, which induces a dimension D = 3. The characteristics of the different
powders are then presented in Table 3-1.
Table 3-1 Characteristics of the powders and application of the VSSA method
Nanocellulose Carbon
black
Aluminum
40-60 nm
Aluminum
100 nm
Carbon-
coated silicon
Primary
diameter (nm)
3 nm width,
70 nm length 75 40-60 100 40
Specific surface
area (m2.g-1) N/A 40 24 23 55*
Skeletal density
(g.cm-3) 1.56 1.89 2.67 2.70 2.35
VSSA (m².cm-3) N/A 75.8 64.1 62.1 129
dmin-vssa (nm) N/A 79.2 93.5 96.7 46.5
Nanomaterial ?
(*Nanomakers, 2019)
From the available measurements and image characterization, both aluminum powders as well
as carbon black and carbon-coated silicon present a minimum VSSA diameter dmin-VSSA lower
than 100 nm, which allows their classification as nanomaterial according to European
Commission definition (Table 3-1). As previously mentioned, the nanocellulose is constituted
of nanocrystals agglomerated to form microparticles. However, the estimation of the specific
surface area by BET method relies on the adsorption of nitrogen on active sites, which are
sparse on microparticles. Indeed, the experiments conducted on nanocellulose did not allow the
validation of the five criterions required to validate the measurement of the specific surface
area. It should be noticed that the specific surface area mentioned in the product specifications
is of 400 m2.g-1 (CelluForce, 2016), which corresponds to the geometric surface area developed
by the individual nanocrystals in water suspension, and was not experimentally validated. Due
to the lack of a reliable VSSA value, this powder cannot accurately be classified strictly as a
nanomaterial according to the EU definition using this method.
This work focuses on particles specificities after dispersion in air. Further characterization,
notably concerning the particle size distribution (PSD) of the dust cloud, are then required, and
will be developed in section III.2.
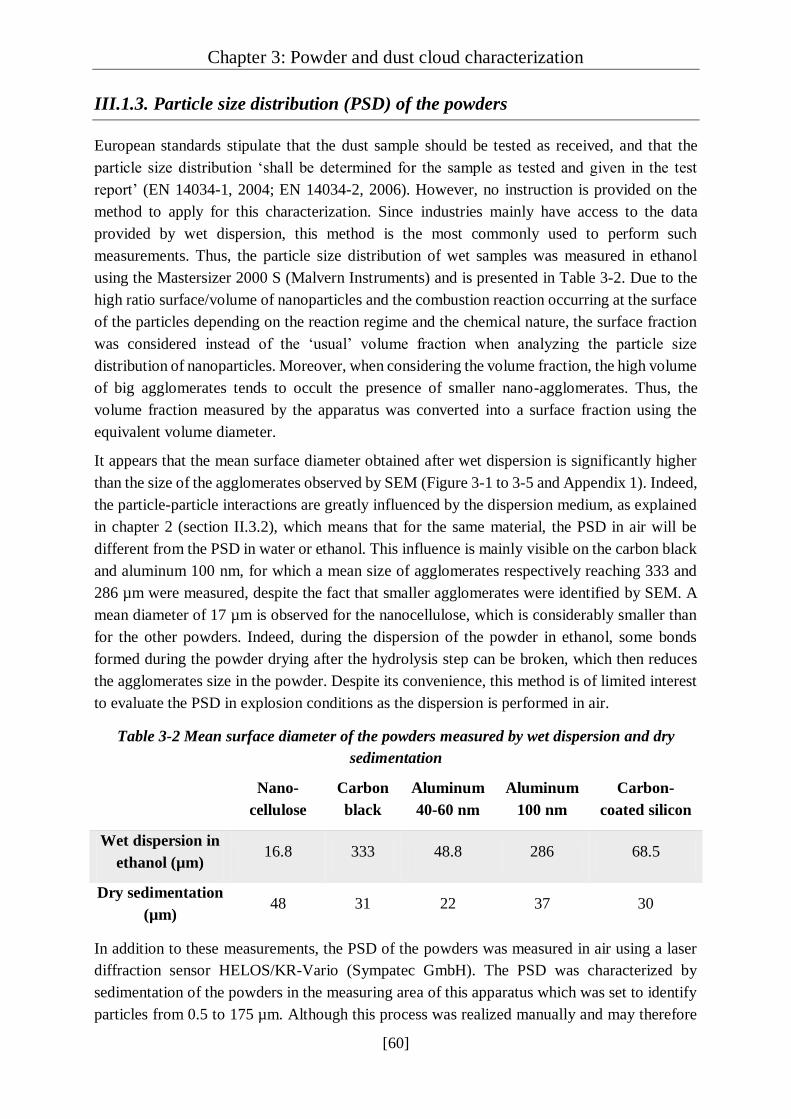
Chapter 3: Powder and dust cloud characterization
[60]
III.1.3. Particle size distribution (PSD) of the powders
European standards stipulate that the dust sample should be tested as received, and that the
particle size distribution ‘shall be determined for the sample as tested and given in the test
report’ (EN 14034-1, 2004; EN 14034-2, 2006). However, no instruction is provided on the
method to apply for this characterization. Since industries mainly have access to the data
provided by wet dispersion, this method is the most commonly used to perform such
measurements. Thus, the particle size distribution of wet samples was measured in ethanol
using the Mastersizer 2000 S (Malvern Instruments) and is presented in Table 3-2. Due to the
high ratio surface/volume of nanoparticles and the combustion reaction occurring at the surface
of the particles depending on the reaction regime and the chemical nature, the surface fraction
was considered instead of the ‘usual’ volume fraction when analyzing the particle size
distribution of nanoparticles. Moreover, when considering the volume fraction, the high volume
of big agglomerates tends to occult the presence of smaller nano-agglomerates. Thus, the
volume fraction measured by the apparatus was converted into a surface fraction using the
equivalent volume diameter.
It appears that the mean surface diameter obtained after wet dispersion is significantly higher
than the size of the agglomerates observed by SEM (Figure 3-1 to 3-5 and Appendix 1). Indeed,
the particle-particle interactions are greatly influenced by the dispersion medium, as explained
in chapter 2 (section II.3.2), which means that for the same material, the PSD in air will be
different from the PSD in water or ethanol. This influence is mainly visible on the carbon black
and aluminum 100 nm, for which a mean size of agglomerates respectively reaching 333 and
286 µm were measured, despite the fact that smaller agglomerates were identified by SEM. A
mean diameter of 17 µm is observed for the nanocellulose, which is considerably smaller than
for the other powders. Indeed, during the dispersion of the powder in ethanol, some bonds
formed during the powder drying after the hydrolysis step can be broken, which then reduces
the agglomerates size in the powder. Despite its convenience, this method is of limited interest
to evaluate the PSD in explosion conditions as the dispersion is performed in air.
Table 3-2 Mean surface diameter of the powders measured by wet dispersion and dry
sedimentation
Nano-
cellulose
Carbon
black
Aluminum
40-60 nm
Aluminum
100 nm
Carbon-
coated silicon
Wet dispersion in
ethanol (µm) 16.8 333 48.8 286 68.5
Dry sedimentation
(µm) 48 31 22 37 30
In addition to these measurements, the PSD of the powders was measured in air using a laser
diffraction sensor HELOS/KR-Vario (Sympatec GmbH). The PSD was characterized by
sedimentation of the powders in the measuring area of this apparatus which was set to identify
particles from 0.5 to 175 µm. Although this process was realized manually and may therefore
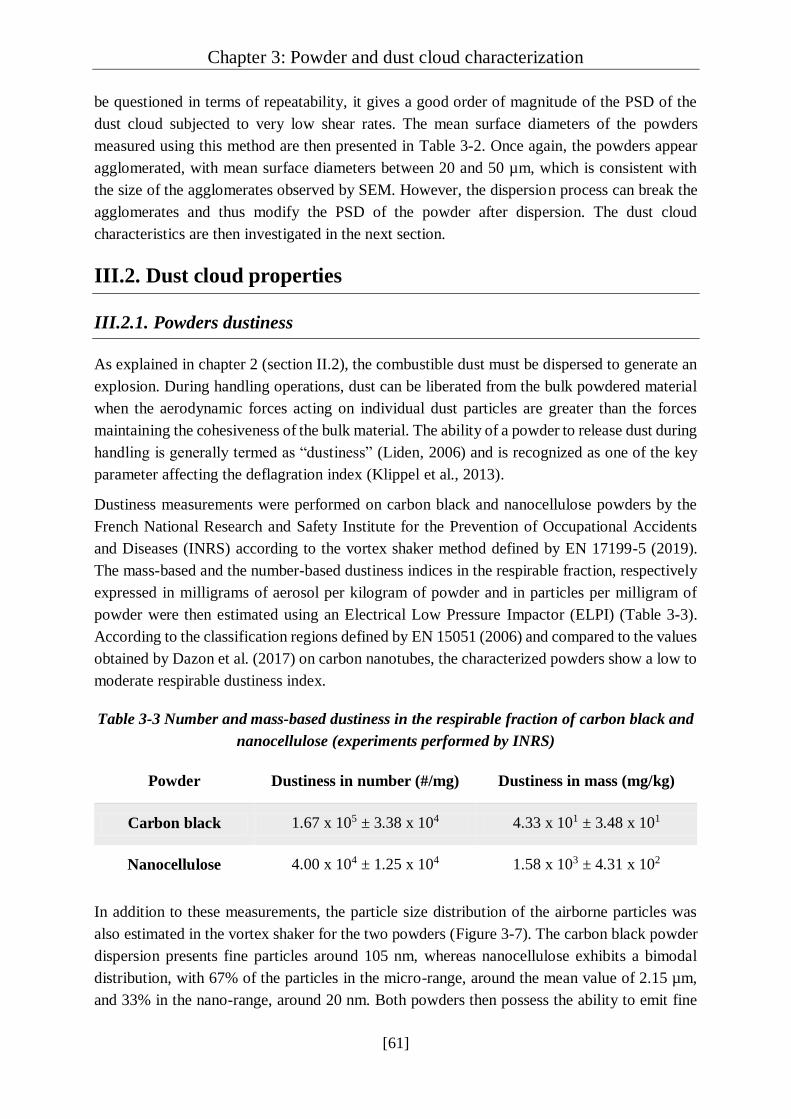
Chapter 3: Powder and dust cloud characterization
[61]
be questioned in terms of repeatability, it gives a good order of magnitude of the PSD of the
dust cloud subjected to very low shear rates. The mean surface diameters of the powders
measured using this method are then presented in Table 3-2. Once again, the powders appear
agglomerated, with mean surface diameters between 20 and 50 µm, which is consistent with
the size of the agglomerates observed by SEM. However, the dispersion process can break the
agglomerates and thus modify the PSD of the powder after dispersion. The dust cloud
characteristics are then investigated in the next section.
III.2. Dust cloud properties
III.2.1. Powders dustiness
As explained in chapter 2 (section II.2), the combustible dust must be dispersed to generate an
explosion. During handling operations, dust can be liberated from the bulk powdered material
when the aerodynamic forces acting on individual dust particles are greater than the forces
maintaining the cohesiveness of the bulk material. The ability of a powder to release dust during
handling is generally termed as “dustiness” (Liden, 2006) and is recognized as one of the key
parameter affecting the deflagration index (Klippel et al., 2013).
Dustiness measurements were performed on carbon black and nanocellulose powders by the
French National Research and Safety Institute for the Prevention of Occupational Accidents
and Diseases (INRS) according to the vortex shaker method defined by EN 17199-5 (2019).
The mass-based and the number-based dustiness indices in the respirable fraction, respectively
expressed in milligrams of aerosol per kilogram of powder and in particles per milligram of
powder were then estimated using an Electrical Low Pressure Impactor (ELPI) (Table 3-3).
According to the classification regions defined by EN 15051 (2006) and compared to the values
obtained by Dazon et al. (2017) on carbon nanotubes, the characterized powders show a low to
moderate respirable dustiness index.
Table 3-3 Number and mass-based dustiness in the respirable fraction of carbon black and
nanocellulose (experiments performed by INRS)
Powder Dustiness in number (#/mg) Dustiness in mass (mg/kg)
Carbon black 1.67 x 10⁵ ± 3.38 x 10⁴ 4.33 x 101 ± 3.48 x 101
Nanocellulose 4.00 x 10⁴ ± 1.25 x 10⁴ 1.58 x 10³ ± 4.31 x 10²
In addition to these measurements, the particle size distribution of the airborne particles was
also estimated in the vortex shaker for the two powders (Figure 3-7). The carbon black powder
dispersion presents fine particles around 105 nm, whereas nanocellulose exhibits a bimodal
distribution, with 67% of the particles in the micro-range, around the mean value of 2.15 µm,
and 33% in the nano-range, around 20 nm. Both powders then possess the ability to emit fine

Chapter 3: Powder and dust cloud characterization
[62]
and ultrafine particles when dispersed, and the presence of nanoparticles along with the
agglomerates after dispersion has been confirmed. In particular, through the example of the
nanocellulose, this study evidences the risks concerning powders not classified as
nanomaterials according to the EU definition that can release nanocrystals when dispersed.
Figure 3-7 Histogram of the number granulometric distribution of aerosols emitted by the
a) carbon black and b) nanocellulose by the vortex shaker method (experiments performed
by INRS)
Another parameter, the dustability index, was introduced by Marmo et al. (2019) and considers
the following properties: i) the dust tendency to disperse fine particles in air when handled, i.e.
the dustiness ii) the dust tendency to settle in aggregates or fine particles iii) the dust behavior
when lifted by an air blast. These authors then suggested that this dustability index is a key
parameter affecting the dust explosivity by correlating it to the explosion index KSt (Di
Benedetto et al., 2019). More specifically, preliminary results show that the KSt values increase
with the dustability index (Marmo et al., 2019).
However, the dustiness and the PSD of the airborne particles are representative of the
experimental conditions of the apparatus and cannot be scaled up directly to the flammability
and explosivity test equipment which involves different level of mechanical stress energy. Thus,
to accurately evaluate the influence of the characteristics of the dust cloud on its flammability
and explosivity, measurements should be conducted in the same apparatuses.
III.2.2. Particle size distribution (PSD) of nanopowders clouds
To characterize the PSD of the dust during explosion tests, measurements were conducted after
dispersion. However, no apparatus or technique currently allow the determination of particle
size distributions over a range from 10 nm (primary particle) to 500 µm (agglomerates), at high
frequency (each 1 millisecond or at least each 10 ms) and at high concentration (above the lower
explosion limit). Thus, different techniques were combined.

Chapter 3: Powder and dust cloud characterization
[63]
III.2.2.1. Fast/Scanning Mobility Particle Sizer (FMPS/SMPS)
First, the presence of nanoparticles after dispersion of each powder in the 20L sphere, without
ignition, was investigated using a Fast Mobility Particle Sizer (FMPS from INRS – S. Bau)
measuring particles from 5.6 to 560 nm with 1 Hz time resolution and a Scanning Mobility
Particle Sizer (SMPS– TSI) providing one measurement every two minutes. The dust dispersion
follows the same procedure than during explosion tests, which is fully described in chapter 4,
section IV.2: the weighted sample is placed in the dust container, and the sphere is evacuated
at 0.4 bara. The container is then pressurized at 20 barg, and the electrovalve connecting the
dust container and the 20L chamber opens, inducing the dispersion of the powder within the
sphere. Despite the low frequency and mass concentration which prevent an accurate
characterization, the presence of nanoparticles was observed even two minutes after dispersion,
thus implying that nanoparticles were still present a few tens of milliseconds after dispersion
(Figure 3-8) and confirming the results obtained by the Vortex Shaker method. However, the
dispersion method, the observation time and physical principle of the measurement (electrical-
mobility diameter) being different, the PSD cannot be quantitatively compared.
Figure 3-8 FMPS measurements of a) aluminum and b) nanocellulose powders
Although these apparatuses are commonly used to measure the particle size distribution of
nanoparticles in air, the low measurement frequency compared to the ignition delay time, i.e.
the delay between the dust dispersion and ignition, and the low mass concentration that can be
tested make these equipment not adapted to the characterization of the PSD involved in
explosion tests.
III.2.2.2. Dispersion in the Scirocco nozzle
Dry PSD measurements were also conducted using the Mastersizer 2000 particle size analyzer
(Malvern Instruments) equipped with a dispersion system called Scirocco. The powder
dispersion is ensured before the measurement by an air jet in a Venturi configuration (Ali et al.,
2015; Bonakdar et al., 2016). Although this measurement is not conducted in the same
conditions as the explosion tests, the evaluation of the particle size distribution after dispersion
of the powder still provides information on the agglomerate breakage during the dispersion.
Experiments were conducted on nanocellulose and carbon-coated silicon, and were previously
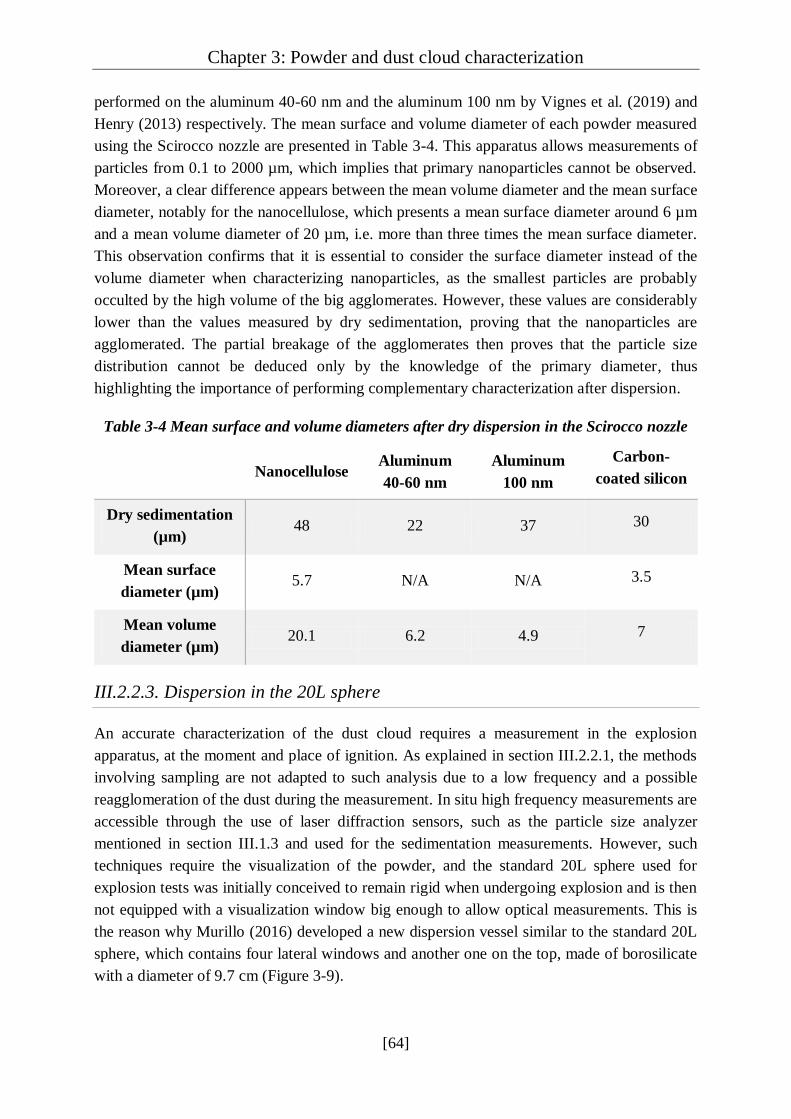
Chapter 3: Powder and dust cloud characterization
[64]
performed on the aluminum 40-60 nm and the aluminum 100 nm by Vignes et al. (2019) and
Henry (2013) respectively. The mean surface and volume diameter of each powder measured
using the Scirocco nozzle are presented in Table 3-4. This apparatus allows measurements of
particles from 0.1 to 2000 µm, which implies that primary nanoparticles cannot be observed.
Moreover, a clear difference appears between the mean volume diameter and the mean surface
diameter, notably for the nanocellulose, which presents a mean surface diameter around 6 µm
and a mean volume diameter of 20 µm, i.e. more than three times the mean surface diameter.
This observation confirms that it is essential to consider the surface diameter instead of the
volume diameter when characterizing nanoparticles, as the smallest particles are probably
occulted by the high volume of the big agglomerates. However, these values are considerably
lower than the values measured by dry sedimentation, proving that the nanoparticles are
agglomerated. The partial breakage of the agglomerates then proves that the particle size
distribution cannot be deduced only by the knowledge of the primary diameter, thus
highlighting the importance of performing complementary characterization after dispersion.
Table 3-4 Mean surface and volume diameters after dry dispersion in the Scirocco nozzle
Nanocellulose Aluminum
40-60 nm
Aluminum
100 nm
Carbon-
coated silicon
Dry sedimentation
(µm) 48 22 37 30
Mean surface
diameter (µm) 5.7 N/A N/A 3.5
Mean volume
diameter (µm) 20.1 6.2 4.9 7
III.2.2.3. Dispersion in the 20L sphere
An accurate characterization of the dust cloud requires a measurement in the explosion
apparatus, at the moment and place of ignition. As explained in section III.2.2.1, the methods
involving sampling are not adapted to such analysis due to a low frequency and a possible
reagglomeration of the dust during the measurement. In situ high frequency measurements are
accessible through the use of laser diffraction sensors, such as the particle size analyzer
mentioned in section III.1.3 and used for the sedimentation measurements. However, such
techniques require the visualization of the powder, and the standard 20L sphere used for
explosion tests was initially conceived to remain rigid when undergoing explosion and is then
not equipped with a visualization window big enough to allow optical measurements. This is
the reason why Murillo (2016) developed a new dispersion vessel similar to the standard 20L
sphere, which contains four lateral windows and another one on the top, made of borosilicate
with a diameter of 9.7 cm (Figure 3-9).
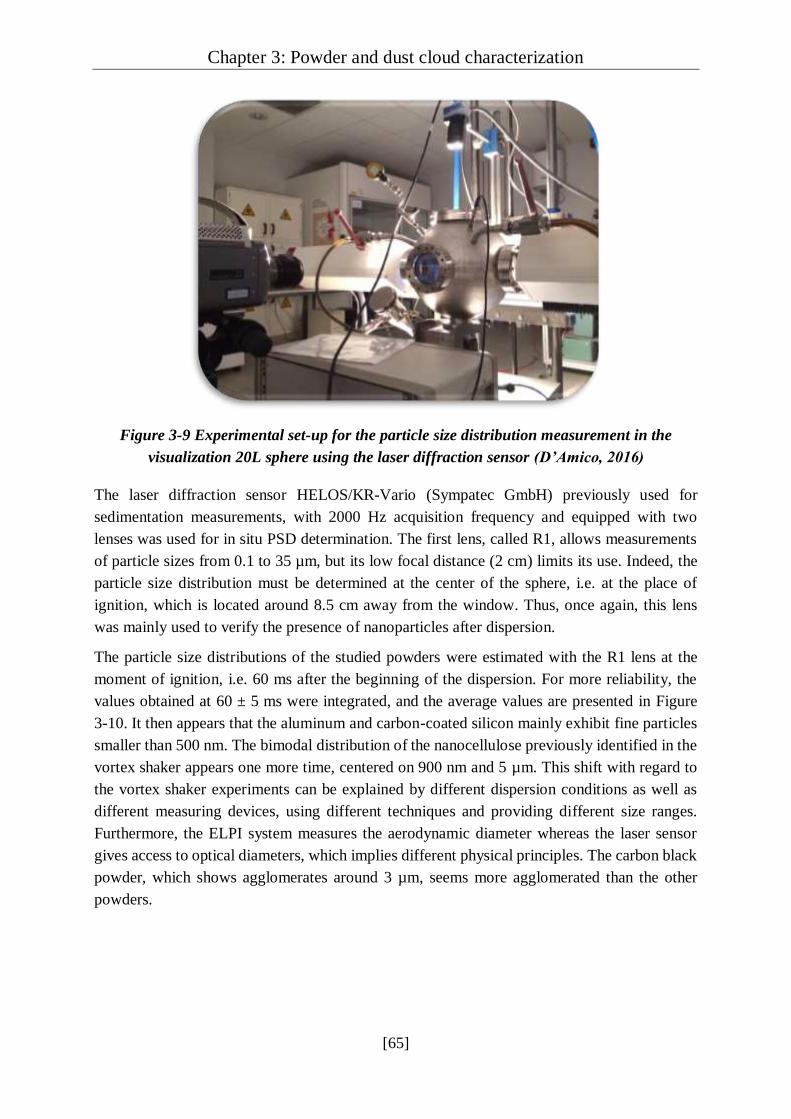
Chapter 3: Powder and dust cloud characterization
[65]
Figure 3-9 Experimental set-up for the particle size distribution measurement in the
visualization 20L sphere using the laser diffraction sensor (D’Amico, 2016)
The laser diffraction sensor HELOS/KR-Vario (Sympatec GmbH) previously used for
sedimentation measurements, with 2000 Hz acquisition frequency and equipped with two
lenses was used for in situ PSD determination. The first lens, called R1, allows measurements
of particle sizes from 0.1 to 35 µm, but its low focal distance (2 cm) limits its use. Indeed, the
particle size distribution must be determined at the center of the sphere, i.e. at the place of
ignition, which is located around 8.5 cm away from the window. Thus, once again, this lens
was mainly used to verify the presence of nanoparticles after dispersion.
The particle size distributions of the studied powders were estimated with the R1 lens at the
moment of ignition, i.e. 60 ms after the beginning of the dispersion. For more reliability, the
values obtained at 60 ± 5 ms were integrated, and the average values are presented in Figure
3-10. It then appears that the aluminum and carbon-coated silicon mainly exhibit fine particles
smaller than 500 nm. The bimodal distribution of the nanocellulose previously identified in the
vortex shaker appears one more time, centered on 900 nm and 5 µm. This shift with regard to
the vortex shaker experiments can be explained by different dispersion conditions as well as
different measuring devices, using different techniques and providing different size ranges.
Furthermore, the ELPI system measures the aerodynamic diameter whereas the laser sensor
gives access to optical diameters, which implies different physical principles. The carbon black
powder, which shows agglomerates around 3 µm, seems more agglomerated than the other
powders.
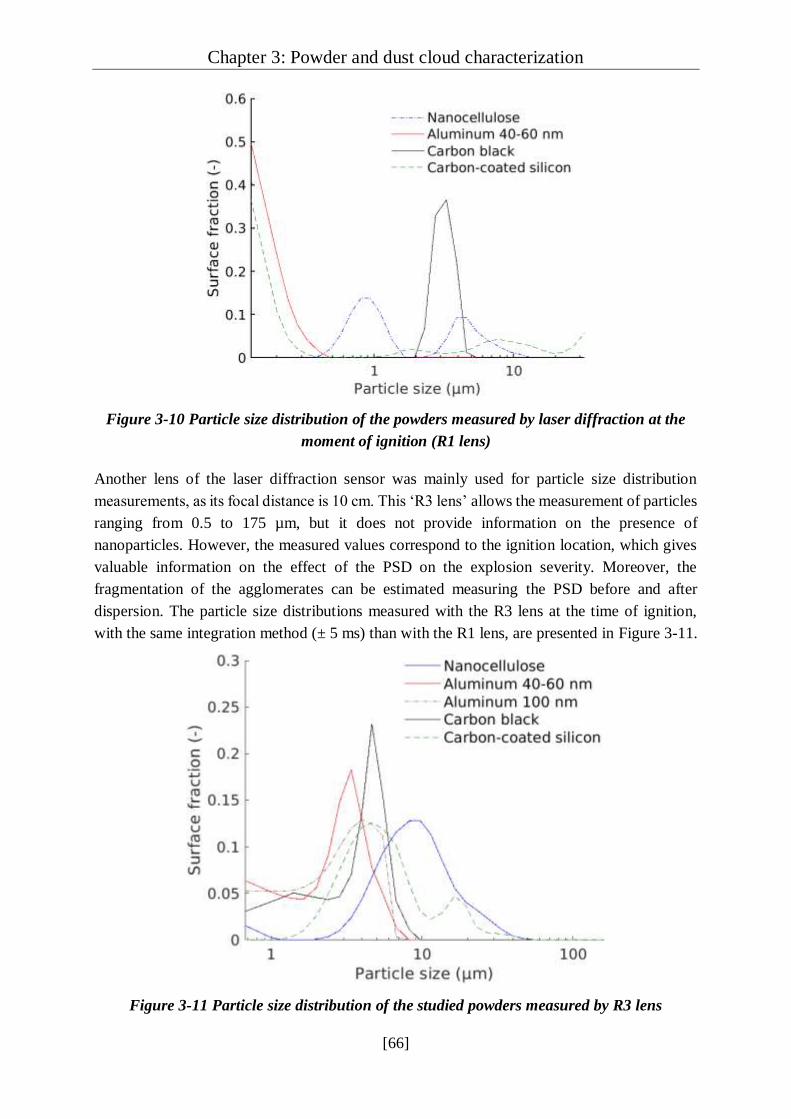
Chapter 3: Powder and dust cloud characterization
[66]
Figure 3-10 Particle size distribution of the powders measured by laser diffraction at the
moment of ignition (R1 lens)
Another lens of the laser diffraction sensor was mainly used for particle size distribution
measurements, as its focal distance is 10 cm. This ‘R3 lens’ allows the measurement of particles
ranging from 0.5 to 175 µm, but it does not provide information on the presence of
nanoparticles. However, the measured values correspond to the ignition location, which gives
valuable information on the effect of the PSD on the explosion severity. Moreover, the
fragmentation of the agglomerates can be estimated measuring the PSD before and after
dispersion. The particle size distributions measured with the R3 lens at the time of ignition,
with the same integration method (± 5 ms) than with the R1 lens, are presented in Figure 3-11.
Figure 3-11 Particle size distribution of the studied powders measured by R3 lens

Chapter 3: Powder and dust cloud characterization
[67]
The carbon black still presents the agglomerates around 4 µm as well as smaller agglomerates
not visible with the R1 lens. Both aluminum powders contain agglomerates ranging from 6 µm
to less than 1 µm, which tends to suggest that they are the less cohesive powders. Finally, the
carbon-coated silicon shows the bimodal distribution already slightly visible in Figure 3-10
centered around 4 and 11 µm. The second peak of nanocellulose now appears around 9 µm
instead of 5 µm, due to the variation of measurement location. Indeed, this value was estimated
at the center of the sphere whereas it was determined close to the window with the R1 lens.
Moreover, the inherent heterogeneities due to the dust dispersion within the sphere and the
initial turbulence also impact the PSD and the dust cloud behavior.
III.2.3. Initial turbulence
The initial turbulence, i.e. the turbulence level in the equipment before the ignition, was
evaluated by Particle Image Velocimetry (PIV) according to the method and setup described by
Vizcaya et al. (2018) and presented in Figure 3-12. A laser sheet (RayPower 2000 CW Dantex
Dynamics) that illuminates the region of interest was coupled with a high-speed video camera
(Phantom V91) that records the particle flow. The laser was set at 1.5W while the camera was
configured with a resolution of 480 x 480 pixels, 6400 fps and a time-lapse of 150 µs. Video
analyses were then realized with PIVLAB 1.35, an open source code working as a Matlab
toolbox.
Figure 3-12 Experimental arrangement for Particle Image Velocimetry analyses - from
Vizcaya et al. (2018)
Due to the high cost and multimodal particle size distribution of nanoparticles, starch particles
of diameter around 10 µm were used as they are big enough to be observed, and small enough
to not disturb the turbulent flow. Indeed, a relaxation time can be calculated from Stoke’s drag
law, as follows:
𝜏𝑠 = 𝑑𝑝2
(𝜌𝑝− 𝜌𝑎𝑖𝑟)
18 𝜇 3-3
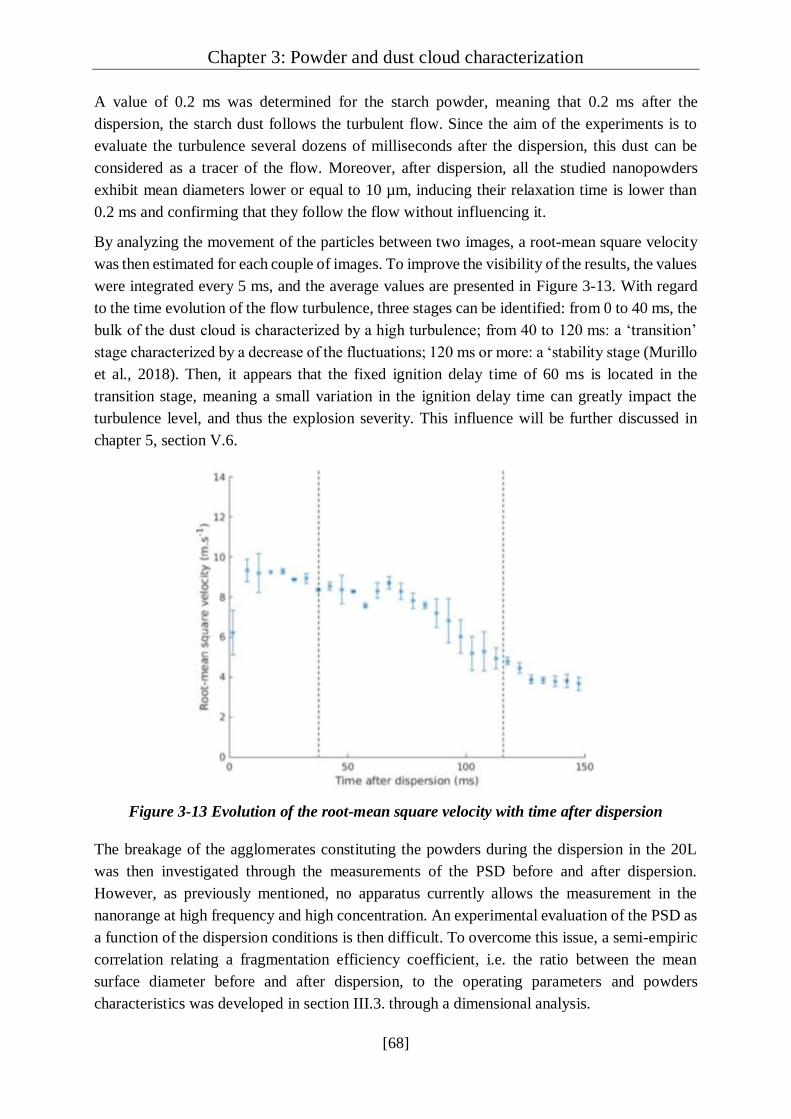
Chapter 3: Powder and dust cloud characterization
[68]
A value of 0.2 ms was determined for the starch powder, meaning that 0.2 ms after the
dispersion, the starch dust follows the turbulent flow. Since the aim of the experiments is to
evaluate the turbulence several dozens of milliseconds after the dispersion, this dust can be
considered as a tracer of the flow. Moreover, after dispersion, all the studied nanopowders
exhibit mean diameters lower or equal to 10 µm, inducing their relaxation time is lower than
0.2 ms and confirming that they follow the flow without influencing it.
By analyzing the movement of the particles between two images, a root-mean square velocity
was then estimated for each couple of images. To improve the visibility of the results, the values
were integrated every 5 ms, and the average values are presented in Figure 3-13. With regard
to the time evolution of the flow turbulence, three stages can be identified: from 0 to 40 ms, the
bulk of the dust cloud is characterized by a high turbulence; from 40 to 120 ms: a ‘transition’
stage characterized by a decrease of the fluctuations; 120 ms or more: a ‘stability stage (Murillo
et al., 2018). Then, it appears that the fixed ignition delay time of 60 ms is located in the
transition stage, meaning a small variation in the ignition delay time can greatly impact the
turbulence level, and thus the explosion severity. This influence will be further discussed in
chapter 5, section V.6.
Figure 3-13 Evolution of the root-mean square velocity with time after dispersion
The breakage of the agglomerates constituting the powders during the dispersion in the 20L
was then investigated through the measurements of the PSD before and after dispersion.
However, as previously mentioned, no apparatus currently allows the measurement in the
nanorange at high frequency and high concentration. An experimental evaluation of the PSD as
a function of the dispersion conditions is then difficult. To overcome this issue, a semi-empiric
correlation relating a fragmentation efficiency coefficient, i.e. the ratio between the mean
surface diameter before and after dispersion, to the operating parameters and powders
characteristics was developed in section III.3. through a dimensional analysis.

Chapter 3: Powder and dust cloud characterization
[69]
III.3. Dimensional analysis of dust dispersion
The dispersion in air (ρair, µair) of a powder whose characteristics are its density ρp, its initial
mean surface diameter dagg and the surface energy of its agglomerates 𝜙, in a vessel in specific
conditions (Lcar, Vej, urms) was considered, with the aim of estimating the mean surface diameter
of the dust cloud after dispersion in the vessel (d50). The parameters considered for the
dimensional analysis are indexed in Table 3-5. Thus, 9 parameters are identified, implying 3
different dimensions. According to Vaschy-Buckingham theorem (Buckingham, 1914), the
dust dispersion phenomenon can be described by 9 - 3 = 6 independent dimensionless numbers
that can be related through a single correlation.
Table 3-5 Parameters considered for the dimensional analysis of dust dispersion
Notation Definition SI units Dimension
Lcar Characteristic length of the dispersion vessel m L
Vej Ejection velocity of the powder m.s-1 L.T-1
µair Dynamic viscosity of air Pa.s M.L-1.T-1
ρair Air density kg.m-3 M.L-3
ρP Bulk density kg.m-3 M.L-3
urms Turbulence level in the vessel m.s-1 L.T-1
𝜙 Surface energy of agglomerates N.m-1 M.T-2
dagg Mean surface diameter of agglomerates before
dispersion m L
d50 Mean surface diameter of agglomerates after
dispersion m L
III.3.1. Determination of the dimensionless numbers
Three basic parameters which contain the three units, d50, Vej and µair, were chosen, and the
remaining six parameters were then coupled to these basic parameters to define the
dimensionless numbers, according to the following relation:
𝜋1 = 𝜌𝑎𝑖𝑟
𝑑50𝑎 𝑉𝑒𝑗
𝑏 𝜇𝑎𝑖𝑟
𝑐 3-4
To obtain a dimensionless number π1, conditions on the coefficients a, b and c must be verified:
For dimension M: 1 = c
For dimension L: -3 = a + b – c

Chapter 3: Powder and dust cloud characterization
[70]
For dimension T: 0 = - b – c
The dimensionless number π1 can then be expressed as follows:
𝜋1 = 𝜌𝑎𝑖𝑟 𝑑50 𝑉𝑒𝑗
𝜇𝑎𝑖𝑟 3-5
A similar analysis led to the determination of the following dimensionless numbers:
𝜋2 = 𝐿𝑐𝑎𝑟
𝑑50 3-6
𝜋3 = 𝜌𝑝 𝑑50 𝑉𝑒𝑗
𝜇𝑎𝑖𝑟 3-7
𝜋4 = 𝑢𝑟𝑚𝑠
𝑉𝑒𝑗 3-8
𝜋5 = 𝑑𝑎𝑔𝑔
𝑑50 3-9
𝜋6 = 𝜙
𝑉𝑒𝑗 𝜇𝑎𝑖𝑟 3-10
To evaluate the physical meaning of those numbers, a comparison with existing dimensionless
numbers was realized. The particle Reynolds number Rep, represented by the ratio of
agglomerate inertial forces and viscous forces, can then be recognized in π1:
𝑅𝑒𝑝 = 𝜌𝑎𝑖𝑟 𝑑50 𝑉𝑒𝑗
𝜇𝑎𝑖𝑟= 𝜋1 3-11
On a similar way, a combination between π1 and π2 leads to a Reynolds number of the flow:
𝑅𝑒 = 𝜌𝑎𝑖𝑟 𝐿𝑐𝑎𝑟 𝑉𝑒𝑗
𝜇𝑎𝑖𝑟= 𝜋1 𝜋2 3-12
The Stokes number, which compares the inertial forces to the fluid driving forces, can also be
identified through a combination between π2, π3 and π4, and represents:
𝑆𝑡 = 𝜌𝑝 𝑑50
2 𝑢𝑟𝑚𝑠
18 𝜇𝑎𝑖𝑟 𝐿𝑐=
𝜋3 𝜋4
𝜋2 3-13
Finally, the Weber number We is generally used to compare the inertial forces to the surface
tension of droplets. However, different definitions of this number for agglomerates can be found
in the literature (Bonakdar and Ghadiri, 2017; Calvert et al., 2013) based on the extension of
classic We number taking into account a surface energy of the agglomerates based on the
cohesive forces. In this work, the Weber number is defined as follows:
𝑊𝑒 = 𝜌𝑝 𝑑𝑎𝑔𝑔 𝑉𝑒𝑗²
𝜙=
𝜋3𝜋5
𝜋6 3-14
The surface energy of an agglomerate 𝜙 can be experimentally evaluated by Atomic Force
Microscopy (AFM). In this study, a virtual surface tension was considered and calculated
according to the following relation (Wengeler and Nirschl, 2007):
𝜙 = 𝜎𝑎𝑔𝑔 𝑑𝑎𝑔𝑔 3-15

Chapter 3: Powder and dust cloud characterization
[71]
The cohesion strength of the agglomerate was calculated based on the model established by
Weiler et al. (2010) previously explained in chapter 2, section II.3.3.3, and by considering that
the main cohesion forces can be represented by van der Waals interactions. The following
equation was then used to estimate the cohesion strength:
𝜎𝑎𝑔𝑔 = (1− )
2 𝑑𝑎𝑔𝑔 .
𝐴 𝑑𝑃
24 ℎ𝑝². (
𝑑𝑎𝑔𝑔 3
𝑑𝑃3 − 4
(
1−arccos(
𝑑𝑃𝑑𝑎𝑔𝑔 −𝑑𝑃
)
180°
)
𝑑𝑃𝑑𝑎𝑔𝑔 −𝑑𝑃
) 3-16
The final dimensionless numbers chosen to characterize the dust dispersion are presented in
Table 3-6. A correlation relating the different parameters using coefficients α0 to α5 to determine
can then be developed:
𝑅𝑒𝑝 = 𝛼0 𝑅𝑒𝛼1 𝑆𝑡𝛼2 𝑊𝑒𝛼3 𝜋4𝛼4 𝜋5
𝛼5 3-17
Table 3-6 Expression and physical meaning of the dimensionless number characterizing
the dust dispersion phenomenon
Dimensionless
number Expression Physical meaning
Re 𝜌𝑎𝑖𝑟 𝐿𝑐𝑎𝑟 𝑉𝑒𝑗
𝜇𝑎𝑖𝑟 Ratio of fluid inertial forces and viscous forces
Rep 𝜌𝑎𝑖𝑟 𝑑50 𝑉𝑒𝑗
𝜇𝑎𝑖𝑟
Ratio of agglomerate inertial forces and viscous
forces
St 𝜌𝑝 𝑑50
2 𝑢𝑟𝑚𝑠
18 𝜇𝑎𝑖𝑟 𝐿𝑐
Ratio of agglomerate inertial forces and fluid
driving forces
We 𝜌𝑝 𝑉𝑒𝑗² 𝑑𝑎𝑔𝑔
𝜙
Ratio of the dynamic forces and the surface
energy of the agglomerate
π4 𝑢𝑟𝑚𝑠
𝑉𝑒𝑗 Ejection shear stress coefficient
π5
𝑑𝑎𝑔𝑔
𝑑50 Agglomerate fragmentation efficiency
III.3.2. Proposal of a correlation describing the dispersion of an agglomerated
powder
To estimate the coefficient α0 to α5, each dimensionless number was evaluated through the
determination of each considered parameter for each powder. The mean surface diameter before
dispersion was estimated by sedimentation of the powder and the mean surface diameter after
dispersion was determined in the 20L sphere using the Sympatec laser diffraction sensor. All
the considered parameters for the determination of the dimensionless numbers are presented in
Table 3-7.
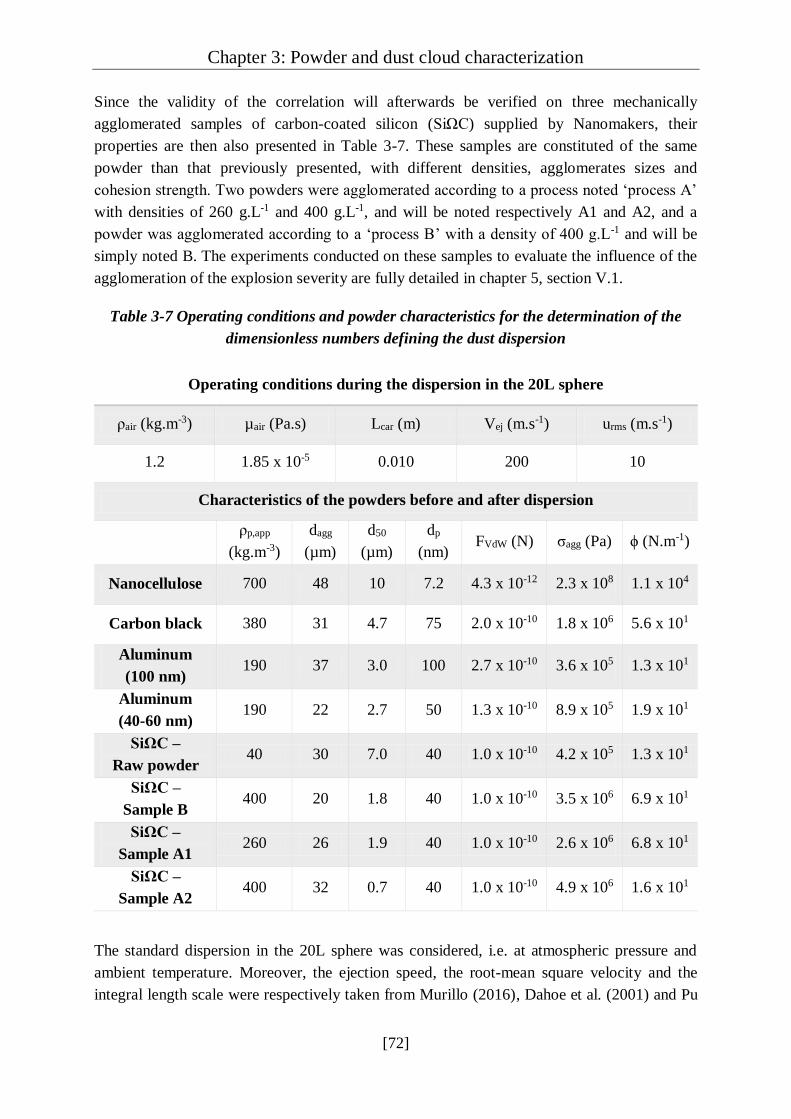
Chapter 3: Powder and dust cloud characterization
[72]
Since the validity of the correlation will afterwards be verified on three mechanically
agglomerated samples of carbon-coated silicon (SiΩC) supplied by Nanomakers, their
properties are then also presented in Table 3-7. These samples are constituted of the same
powder than that previously presented, with different densities, agglomerates sizes and
cohesion strength. Two powders were agglomerated according to a process noted ‘process A’
with densities of 260 g.L-1 and 400 g.L-1, and will be noted respectively A1 and A2, and a
powder was agglomerated according to a ‘process B’ with a density of 400 g.L-1 and will be
simply noted B. The experiments conducted on these samples to evaluate the influence of the
agglomeration of the explosion severity are fully detailed in chapter 5, section V.1.
Table 3-7 Operating conditions and powder characteristics for the determination of the
dimensionless numbers defining the dust dispersion
Operating conditions during the dispersion in the 20L sphere
ρair (kg.m-3) µair (Pa.s) Lcar (m) Vej (m.s-1) urms (m.s-1)
1.2 1.85 x 10⁻⁵ 0.010 200 10
Characteristics of the powders before and after dispersion
ρp,app
(kg.m-3)
dagg
(µm)
d50
(µm)
dp
(nm) FVdW (N) σagg (Pa) ϕ (N.m-1)
Nanocellulose 700 48 10 7.2 4.3 x 10⁻¹² 2.3 x 10⁸ 1.1 x 10⁴
Carbon black 380 31 4.7 75 2.0 x 10⁻¹⁰ 1.8 x 10⁶ 5.6 x 101
Aluminum
(100 nm) 190 37 3.0 100 2.7 x 10⁻¹⁰ 3.6 x 10⁵ 1.3 x 101
Aluminum
(40-60 nm) 190 22 2.7 50 1.3 x 10⁻¹⁰ 8.9 x 10⁵ 1.9 x 101
SiΩC –
Raw powder 40 30 7.0 40 1.0 x 10⁻¹⁰ 4.2 x 10⁵ 1.3 x 101
SiΩC –
Sample B 400 20 1.8 40 1.0 x 10⁻¹⁰ 3.5 x 10⁶ 6.9 x 101
SiΩC –
Sample A1 260 26 1.9 40 1.0 x 10⁻¹⁰ 2.6 x 10⁶ 6.8 x 101
SiΩC –
Sample A2 400 32 0.7 40 1.0 x 10⁻¹⁰ 4.9 x 10⁶ 1.6 x 101
The standard dispersion in the 20L sphere was considered, i.e. at atmospheric pressure and
ambient temperature. Moreover, the ejection speed, the root-mean square velocity and the
integral length scale were respectively taken from Murillo (2016), Dahoe et al. (2001) and Pu
Chapter 3: Powder and dust cloud characterization
[73]
et al. (1991). Similar mean surface diameters were measured, from 20 to 48 µm before
dispersion, and from 1 to 10 µm after dispersion in the 20L sphere. To calculate the van der
Waals forces acting on each powder, the Hamaker constant presented in chapter 2 (Table 2-4)
were used, and an interparticle distance of 2 nm was considered. Since nanocellulose is
constituted of fibers, an equivalent surface diameter was calculated. It then appears that the van
der Waals forces are of the same order of magnitude for all the samples except for
nanocellulose, due to its lower primary diameter. However, this was compensated by the high
mean surface diameter measured by sedimentation, leading to a strong cohesion of the
agglomerates, reaching 2.3x10⁸ Pa while the other powders exhibit cohesion strength between
3x10⁵ and 5x10⁶ Pa, which is consistent with the values mentioned by Weiler et al. (2010).
The values of the dimensionless numbers can be estimated from the operating conditions and
characteristics of the different powders (Table 3-8). Among the chosen numbers, two numbers
only depend on the operating conditions and are thus constant for each powder: Re and π4. The
Reynolds number, in particular, is equal to 105, which confirms the turbulent condition in the
20L sphere at the moment of dispersion. Since the mean volume diameters before dispersion
were rather similar, the particle Reynolds numbers are also similar, with a variation from 9 to
61, except for the nanocellulose and the raw carbon-coated silicon due to their higher means
surface diameter after dispersion.
More differences are observed when calculating the Stokes number, as it includes the powder
density in addition to the mean diameter after dispersion. Indeed, the highest value is obtained
for the nanocellulose, which is the densest powder, while the lowest value is observed for the
raw carbon-coated silicon, which exhibits a very low density with regard to the other powders.
However, it should be noted that all the values are lower than 1, implying that all the particles
follow the flow in the 20L sphere. The Weber numbers are generally ranging from 3 to 8, except
for the nanocellulose and the aluminum 100 nm. Indeed, the nanocellulose exhibits very high
surface energy compared to the other powder, which explains the low value of the Weber
number. On the contrary, the aluminum 100 nm presents a high mean surface diameter before
dispersion and the lowest value of surface energy, inducing an easiest fragmentation of
agglomerates.
The number π5, characterizing the agglomerates fragmentation, lies between 4 and 14. Such
values traduce a strong fragmentation during the dispersion in the 20L sphere, which can be
due to the shear stress occurring during the pressurization in the dust canister, to the passage
through the nozzle and to the wall impacts. However, the laser diffraction sensor only measures
particles ranging from 0.5 to 175 µm, implying that the fragmentation can be even stronger, as
highlighted by the sample A2 of carbon-coated silicon.

Chapter 3: Powder and dust cloud characterization
[74]
Table 3-8 Dimensionless number calculated for each powder during the dispersion in the
20L sphere
Re Rep St We π4 π5 ΔD
(%)
Nanocellulose 1.3 x 10⁵ 135 2.3 x 10⁻¹ 0.12 0.05 4.6 78
Carbon black 1.3 x 10⁵ 61 2.5 x 10⁻² 8.3 0.05 6.60 85
Aluminum (100
nm) 1.3 x 10⁵ 39 5.1 x 10⁻³ 21.0 0.05 12.3 92
Aluminum (40-60
nm) 1.3 x 10⁵ 17.5 4.2 x 10⁻³ 8.5 0.05 8.06 88
SiΩC – Raw
powder 1.3 x 10⁵ 91 5.9 x 10⁻³ 3.8 0.05 4.3 77
SiΩC – Sample B 1.3 x 10⁵ 23 3.9 x 10⁻³ 4.6 0.05 11.1 91
SiΩC – Sample A1 1.3 x 10⁵ 25 2.8 x 10⁻³ 4.0 0.05 13.7 93
SiΩC –Sample A2 1.3 x 10⁵ 9 5.9 x 10⁻⁴ 3.2 0.05 45.7 98
A mechanistic model of impact attrition notably highlighted the influence of the particle
density, the impact velocity and the particle size, but also of the agglomerate hardness and the
fracture toughness on the extent of breakage (Ghadiri and Zhang, 2002; Zhang and Ghadiri,
2002). Moreover, a mode diameter variation defined by ΔD = 100 (dagg - d50)/dagg was calculated
by Sanchirico et al. (2015), who classified the powders in two classes: class 1 containing the
hardest dusts (ΔD < 50%) and class 2 for the ones that undergo a higher breakage (ΔD > 50%).
Values between 77% and 98% were obtained in this work, implying that all the powders are in
class 2. Furthermore, those values are slightly higher than the ones presented by Sanchirico et
al. (2015). First, it should be noted that the diameter after dispersion was measured by
Sanchirico et al. (2015) by collecting the settled dust several minutes after the dispersion, which
allows the re-agglomeration of the powder, whereas the measurements in this work were
conducted directly within the sphere and correspond to the moment and place of ignition. Then,
these higher values can be attributed to weak bonding implied in the agglomeration
phenomenon which leads to the formation of relatively easily breakable agglomerates.
Using the calculated dimensionless numbers presented in Table 3-8, the coefficients α0 to α5 of
the relation 3-17 were estimated and are presented in Table 3-9. First, the coefficient α0 appears
to be close to unity, inducing a nearly proportional relation between the dimensionless numbers
elevated at the right power. Then, from the expression of the agglomerate fragmentation
efficiency π5, it can be deduced that positive coefficients imply that high values of the affected
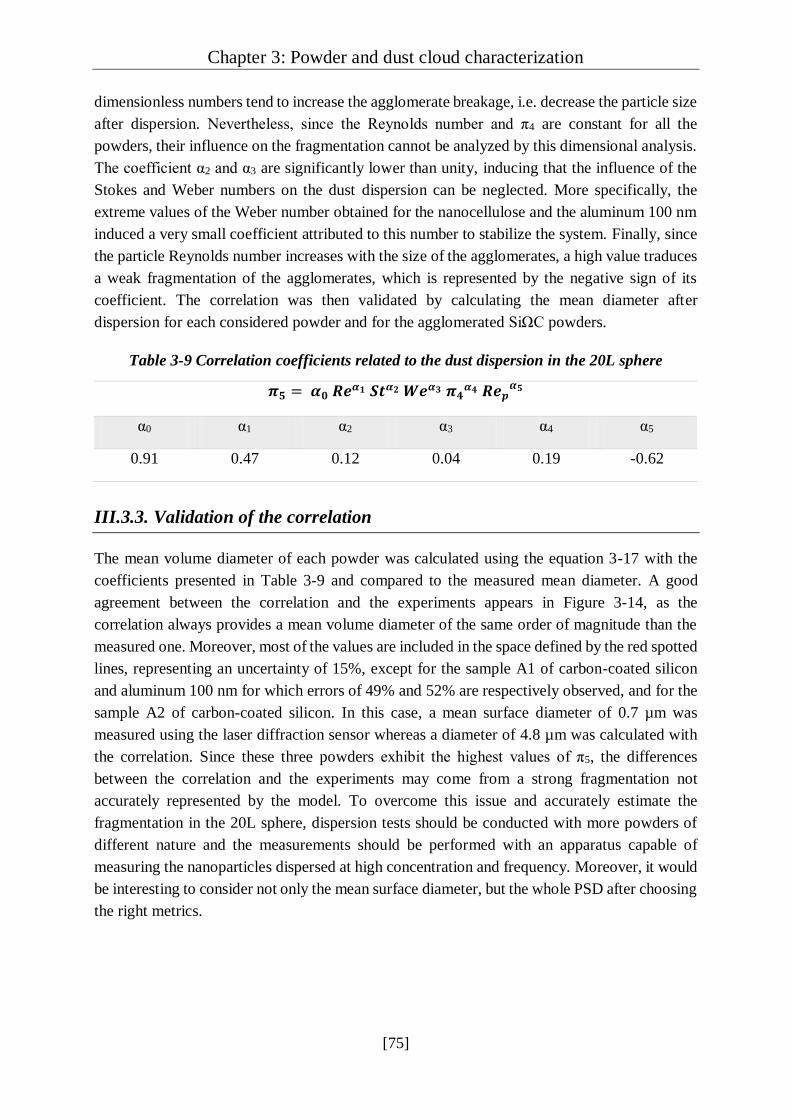
Chapter 3: Powder and dust cloud characterization
[75]
dimensionless numbers tend to increase the agglomerate breakage, i.e. decrease the particle size
after dispersion. Nevertheless, since the Reynolds number and π4 are constant for all the
powders, their influence on the fragmentation cannot be analyzed by this dimensional analysis.
The coefficient α2 and α3 are significantly lower than unity, inducing that the influence of the
Stokes and Weber numbers on the dust dispersion can be neglected. More specifically, the
extreme values of the Weber number obtained for the nanocellulose and the aluminum 100 nm
induced a very small coefficient attributed to this number to stabilize the system. Finally, since
the particle Reynolds number increases with the size of the agglomerates, a high value traduces
a weak fragmentation of the agglomerates, which is represented by the negative sign of its
coefficient. The correlation was then validated by calculating the mean diameter after
dispersion for each considered powder and for the agglomerated SiΩC powders.
Table 3-9 Correlation coefficients related to the dust dispersion in the 20L sphere
𝝅𝟓 = 𝜶𝟎 𝑹𝒆𝜶𝟏 𝑺𝒕𝜶𝟐 𝑾𝒆𝜶𝟑 𝝅𝟒𝜶𝟒 𝑹𝒆𝒑
𝜶𝟓
α0 α1 α2 α3 α4 α5
0.91 0.47 0.12 0.04 0.19 -0.62
III.3.3. Validation of the correlation
The mean volume diameter of each powder was calculated using the equation 3-17 with the
coefficients presented in Table 3-9 and compared to the measured mean diameter. A good
agreement between the correlation and the experiments appears in Figure 3-14, as the
correlation always provides a mean volume diameter of the same order of magnitude than the
measured one. Moreover, most of the values are included in the space defined by the red spotted
lines, representing an uncertainty of 15%, except for the sample A1 of carbon-coated silicon
and aluminum 100 nm for which errors of 49% and 52% are respectively observed, and for the
sample A2 of carbon-coated silicon. In this case, a mean surface diameter of 0.7 µm was
measured using the laser diffraction sensor whereas a diameter of 4.8 µm was calculated with
the correlation. Since these three powders exhibit the highest values of π5, the differences
between the correlation and the experiments may come from a strong fragmentation not
accurately represented by the model. To overcome this issue and accurately estimate the
fragmentation in the 20L sphere, dispersion tests should be conducted with more powders of
different nature and the measurements should be performed with an apparatus capable of
measuring the nanoparticles dispersed at high concentration and frequency. Moreover, it would
be interesting to consider not only the mean surface diameter, but the whole PSD after choosing
the right metrics.

Chapter 3: Powder and dust cloud characterization
[76]
Figure 3-14 Comparison between the measured and correlated mean surface diameters
after dispersion in the 20L sphere
Since this correlation is based on measurements conducted during the dispersion in the 20L
sphere using the R3 lens of the laser diffraction sensor, its application is limited to these
conditions. Thus, applying this correlation to the results obtained using the Scirocco would be
inaccurate, due to a different dispersion process and a different measuring range. Considering
the high values of fragmentation efficiency measured, it appears that the dispersion in the 20L
sphere leads to significant changes in the particle size distribution, notably due to the
agglomeration phenomenon.
Thus, care must be taken when analyzing the experiments conducted in the 20L sphere. Indeed,
if the aim is to consider the worst-case scenario, which probably corresponds to the strongest
fragmentation, the dispersion procedure of the 20L sphere is adapted. However, the process
safety engineer, when extrapolating the results to industrial conditions, must imperatively keep
the PSD difference in mind.
Chapter 3: Powder and dust cloud characterization
[77]
Summary
This chapter was dedicated to the characterization of powders and related dust clouds. It was
divided into three main parts.
First, a presentation of the powders considered in this work was realized: nanocellulose, carbon
black, carbon-coated silicon and two aluminum powders. A classification method based on the
calculation of the volume-specific surface area and on image analysis was applied to verify that
the powders can be considered as nanomaterials according to the European Commission
definition. Except for the nanocellulose, for which further tests were performed thereafter, all
powders are classified as nanomaterials. Particle size distribution (PSD) tests were performed
in wet dispersion, which is convenient but of limited interest when testing dust dispersed in air,
and by dry sedimentation, to estimate the PSD of agglomerates submitted to low shear stress.
The presence of micro-agglomerates constituted of the individual nanoparticles was then
evidenced.
Since dust explosions require the dispersion of the powder, PSD measurements were also
conducted after dispersion. First, the dustiness, i.e. the ability of a powder to release fine
particles, was measured for carbon black and nanocellulose, showing that both powders can
release nanoparticles. PSD measurements were conducted using a Fast Mobility Particle Sizer
(FMPS) and a Scanning Mobility Particle Sizer (SMPS) and highlighted the presence of
nanoparticles even two minutes after dispersion. Dispersion tests were also performed using a
Scirocco device, showing the partial breakage of the agglomerates after dispersion of the dust.
Finally, an in-situ laser diffraction sensor was coupled to a visualization 20L sphere to estimate
the PSD within the combustion chamber, at the moment and place of ignition. A clear difference
then appeared between the mean diameters measured by sedimentation and the diameters
measured after dispersion, due to the high shear stress occurring during the dispersion process.
The dust cloud is then constituted of micro- and nano-agglomerates. Therefore, the
consideration of the PSD not only before dispersion, but also after injection in the apparatus is
essential when testing nanoparticles explosion severity in order to know exactly what explodes.
In addition to these tests, the evolution turbulence level with time after the dispersion of the
dust in the 20L sphere was evaluated through Particle Image Velocimetry and highlighted that
the standard ignition delay time is located in a transient zone. This implies that a small variation
of ignition delay time can significantly modify the turbulence level, and thus the explosion
severity.
However, such measurements can hardly be conducted due to the opacity of the original 20L
sphere and to a technique limitation: currently, no apparatus allows the measurements of
nanoparticles at high frequency and high concentration. Thus, a semi-empiric correlation
relating the operating parameters and powders characteristics to a fragmentation efficiency
coefficient, defined as the ratio between the mean surface diameter before and after dispersion,
was proposed and showed encouraging results.

Chapter 3: Powder and dust cloud characterization
[78]
Résumé
Ce chapitre est dédié à la caractérisation des poudres et des nuages associés et divisé en trois
parties.
D’abord, une présentation des poudres considérées dans ce travail a été réalisée : nanocellulose,
noirs de carbone, silicium enrobé de carbone et deux poudres d’aluminium. Une méthode de
classification basée sur le calcul d’une surface spécifique volumique couplée à une analyse
d’image a été appliquée pour vérifier que les poudres peuvent être considérées comme des
nanomatériaux selon la définition de la Commission Européenne. A l’exception de la
nanocellulose, pour laquelle des tests complémentaires ont été réalisés par la suite, toutes les
poudres étudiées sont classifiées en tant que nanomatériaux. Des mesures de distribution de
tailles de particules (DTP) ont été réalisées en voie liquide, ce qui est pratique mais d’un intérêt
limité quand il s’agit de tester des poudres dispersées dans l’air, ainsi que par sédimentation en
voie sèche afin d’estimer la DTP des agglomérats soumis à un faible cisaillement. La présence
de micro-agglomérats constitués de nanoparticules a alors été mise en avant.
Puisqu’une explosion de poussière nécessite la dispersion de la poudre, des mesures de DTP
ont également été conduites après dispersion. D’abord, la pulvérulence du noir de carbone et de
la nanocellulose a été mesurée, démontrant la capacité des deux poudres à émettre des
nanoparticules. Des mesures de DTP ont été réalisées à l’aide d’un Fast Mobility Particle Sizer
(FMPS) et d’un Scanning Mobility Particle Sizer (SMPS) et ont démontré la présence de
nanoparticules jusqu’à deux minutes après dispersion. Des essais de dispersion ont aussi été
conduits à l’aide d’un disperseur Scirocco et ont montré la fragmentation des agglomérats lors
de la dispersion. Enfin, un granulomètre à diffraction laser couplé à une sphère de visualisation
de 20L ont permis une estimation in situ de la DTP dans la chambre de combustion, au moment
et à l’endroit de l’inflammation. Une différence nette est alors apparue entre les diamètres
moyens mesurés par sédimentation et les diamètres mesurés après dispersion, à cause du fort
cisaillement induit par le processus de dispersion. Le nuage est ainsi constitué de nano- et de
micro-agglomérats. Ainsi, la considération de la DTP avant dispersion, mais aussi après
injection dans l’enceinte est essentielle lors de l’évaluation de la sévérité d’explosion des
nanoparticules afin de savoir exactement ce qui explose. L’évolution du niveau de turbulence
avec le temps après dispersion de la poudre dans la sphère de 20L a également été évaluée par
Particle Image Velocimetry (PIV). Le délai d’inflammation préconisé par les standards
internationaux se situant dans une zone de transition, une faible variation dans ce délai peut
fortement modifier le niveau de turbulence, et ainsi la sévérité d’explosion de la poudre.
Cependant, la caractérisation visuelle du nuage de poussières ne peut être systématiquement
effectuée à cause de l’opacité de la sphère standard et d’une limitation technique : actuellement,
aucun appareil ne permet la mesure de nanoparticules à haute fréquence et forte concentration.
Ainsi, une corrélation semi-empirique reliant les conditions opératoires et les caractéristiques
de la poudre à un coefficient d’efficacité de fragmentation, défini par le ratio entre le diamètre
moyen en surface avant et après dispersion, a été proposée et a montré des résultats
encourageants.
[79]
Chapter 4:
Standard evaluation of flammability and
explosivity

Chapter 4: Standard evaluation of flammability and explosivity
[80]
Now that the particle size distribution of each powder was measured before and after dispersion,
the process safety engineer is interested in the evaluation of the standard safety parameters.
Thus, this chapter, dedicated to their determination, is divided into three parts. First, the
standard methods to measure the ignition sensitivity parameters, i.e. the minimum ignition
energy, the minimum ignition temperature and the lower explosion limit, are detailed, and the
values obtained for each powder are presented and discussed. This part also contains a
dimensional analysis describing the dust ignition phenomenon, which is useful to identify the
most influential parameters on ignition sensitivity. The second part focuses on the explosion
severity of the powders, through a presentation of the standard methods for the evaluation of
the maximum overpressure and the maximum rate of pressure rise and a discussion about the
values obtained for the chosen powders. The last part of this chapter is dedicated to the
observations realized during the tests and to a questioning of the validity of the international
standards, originally designed for micropowders, when it comes to the evaluation of the
flammability and explosivity of nanopowders.
IV.1. Ignition sensitivity
The ignition sensitivity of the powders was evaluated through the determination of the
minimum ignition energy, minimum ignition temperature and the lower explosion limit. Since
only dust clouds are considered in this thesis, the minimum ignition temperature of the layer
was not measured. Moreover, all the experiments being performed in atmospheric conditions,
the limiting oxygen concentration was not investigated in this work either. First, each
measurement method is detailed, and the standard values obtained for each powder are then
presented in section IV.1.4.
IV.1.1. Minimum Ignition Energy
As mentioned in chapter 2, the Minimum Ignition Energy (MIE) of a dust cloud is the lowest
energy that can ignite the dust-air mixture under specific test conditions. It is generally
measured in a modified Hartmann tube, also called Mike 3, according to international standards
(ASTM E2019-03, 2007; ISO/IEC 80079-20-2, 2016). This apparatus, produced by TÜV SÜD
Schweiz AG and Cesana-AG and presented in Figure 4-1, is constituted of a 1.2 liters vertical
tube coupled to an ignition system. The ignition source consists of two electrodes separated by
6 to 8 mm, connected to a discharge circuit constituted of an adaptable inductance from 1 to 2
mH and several capacitors able to provide different amounts of energy. Thus, the electrodes
can deliver energies from 1 mJ to 1000 mJ, with discrete values of 1, 3, 10, 30, 100, 300 and
1000 mJ.
The test procedure consists in placing a weighted dust sample at the bottom of the tube and to
disperse it within the tube using a pulse of compressed air at 7 barg. The ignition sources are
then activated after a delay, called ignition delay time, set before the beginning of the test. If a
flame propagation is observed within the dust cloud, the ignition test is considered positive.
Otherwise, tests must be performed 10 times in the same conditions to ensure that no ignition
was observed in those conditions.
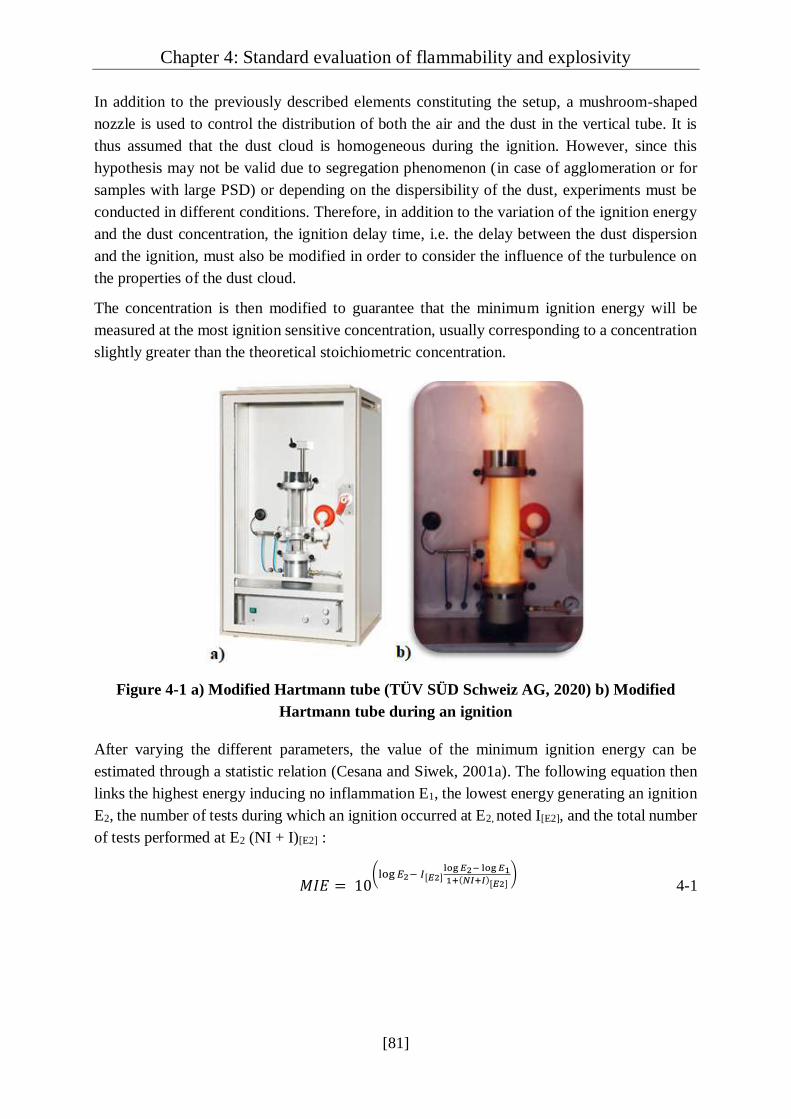
Chapter 4: Standard evaluation of flammability and explosivity
[81]
In addition to the previously described elements constituting the setup, a mushroom-shaped
nozzle is used to control the distribution of both the air and the dust in the vertical tube. It is
thus assumed that the dust cloud is homogeneous during the ignition. However, since this
hypothesis may not be valid due to segregation phenomenon (in case of agglomeration or for
samples with large PSD) or depending on the dispersibility of the dust, experiments must be
conducted in different conditions. Therefore, in addition to the variation of the ignition energy
and the dust concentration, the ignition delay time, i.e. the delay between the dust dispersion
and the ignition, must also be modified in order to consider the influence of the turbulence on
the properties of the dust cloud.
The concentration is then modified to guarantee that the minimum ignition energy will be
measured at the most ignition sensitive concentration, usually corresponding to a concentration
slightly greater than the theoretical stoichiometric concentration.
Figure 4-1 a) Modified Hartmann tube (TÜV SÜD Schweiz AG, 2020) b) Modified
Hartmann tube during an ignition
After varying the different parameters, the value of the minimum ignition energy can be
estimated through a statistic relation (Cesana and Siwek, 2001a). The following equation then
links the highest energy inducing no inflammation E1, the lowest energy generating an ignition
E2, the number of tests during which an ignition occurred at E2, noted I[E2], and the total number
of tests performed at E2 (NI + I)[E2] :
𝑀𝐼𝐸 = 10(log 𝐸2− 𝐼[𝐸2]
log 𝐸2− log 𝐸11+(𝑁𝐼+𝐼)[𝐸2]
) 4-1

Chapter 4: Standard evaluation of flammability and explosivity
[82]
Figure 4-2 Results of MIE test for nanocellulose at tv = 120 ms
For instance, results of minimum ignition energy tests performed on the nanocellulose are
presented in Figure 4-2. The lowest energy leading to an ignition was found at 30 mJ, and no
ignition was observed at 10 mJ, leading to a MIE of 16 mJ. Additional tests were performed at
90 and 150 ms and confirmed these results.
IV.1.2. Minimum Ignition Temperature
Similarly to the minimum ignition energy, the Minimum Ignition Temperature (MIT) is the
lowest temperature able to ignite a dust cloud under specific test conditions. According to
international standards (ASTM E1491-06, 2012; EN 50281-2-1, 2000; IEC 1241-2-1, 1994), it
can either be measured in a vertical Godbert-Greenwald furnace (Eckhoff, 2019) or in an
horizontal oven, called “BAM oven”, designed at the Bundesanstalt für Materialforschung und-
prüfung (BAM) in Berlin, Germany. Siwek (1996) highlighted that MIT measured in the
Godbert-Greenwald oven was generally higher than the one measured in the BAM oven and
proposed the following correlation to link both temperatures :
𝑀𝐼𝑇𝐺𝐺 = 1.1 𝑀𝐼𝑇𝐵𝐴𝑀 − 10°𝐶 4-2
In this work, the Godbert-Greenwald oven was used for MIT tests (Figure 4-3). This furnace is
constituted of a vertical silica tube electrically heated and open at its bottom. The upper part of
the tube is connected through a Pyrex tube to a dust container, itself related to a compressed air
reservoir. The temperature of the furnace is controlled using two thermocouples calibrated for
temperatures ranging from 20°C to 1000°C. An experiment consists in injecting a weighted
dust sample in the oven through an air pulse of variable pressure. For a given mass and injection
pressure, the oven temperature is raised from stages of 50°C until an ignition occurs, i.e. until
a flame is visible under the bottom of the tube. A temperature reduction is then realized by
stages of 10°C, until no ignition is observed for 10 consecutive trials. As for the determination
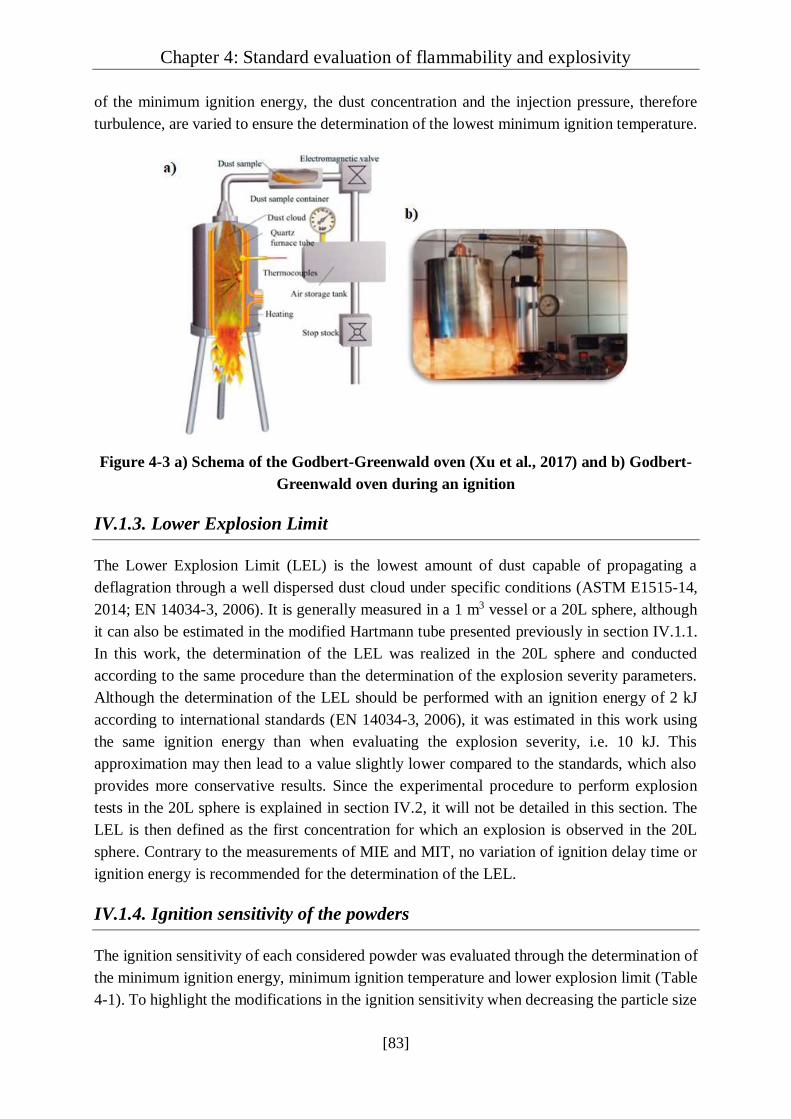
Chapter 4: Standard evaluation of flammability and explosivity
[83]
of the minimum ignition energy, the dust concentration and the injection pressure, therefore
turbulence, are varied to ensure the determination of the lowest minimum ignition temperature.
Figure 4-3 a) Schema of the Godbert-Greenwald oven (Xu et al., 2017) and b) Godbert-
Greenwald oven during an ignition
IV.1.3. Lower Explosion Limit
The Lower Explosion Limit (LEL) is the lowest amount of dust capable of propagating a
deflagration through a well dispersed dust cloud under specific conditions (ASTM E1515-14,
2014; EN 14034-3, 2006). It is generally measured in a 1 m3 vessel or a 20L sphere, although
it can also be estimated in the modified Hartmann tube presented previously in section IV.1.1.
In this work, the determination of the LEL was realized in the 20L sphere and conducted
according to the same procedure than the determination of the explosion severity parameters.
Although the determination of the LEL should be performed with an ignition energy of 2 kJ
according to international standards (EN 14034-3, 2006), it was estimated in this work using
the same ignition energy than when evaluating the explosion severity, i.e. 10 kJ. This
approximation may then lead to a value slightly lower compared to the standards, which also
provides more conservative results. Since the experimental procedure to perform explosion
tests in the 20L sphere is explained in section IV.2, it will not be detailed in this section. The
LEL is then defined as the first concentration for which an explosion is observed in the 20L
sphere. Contrary to the measurements of MIE and MIT, no variation of ignition delay time or
ignition energy is recommended for the determination of the LEL.
IV.1.4. Ignition sensitivity of the powders
The ignition sensitivity of each considered powder was evaluated through the determination of
the minimum ignition energy, minimum ignition temperature and lower explosion limit (Table
4-1). To highlight the modifications in the ignition sensitivity when decreasing the particle size

Chapter 4: Standard evaluation of flammability and explosivity
[84]
from the micro-range to the nano-range, the ignition parameters of micropowders of the same
nature available on the GESTIS-DUST-EX database are presented alongside.
It is generally admitted (Wu et al., 2010a) that metallic powders are easily ignited and are even
able to exhibit a pyrophoric behavior, i.e. ignite spontaneously in contact with oxygen, as
pointed out by Krietsch et al. (2015), Mohan et al. (2012) and Sundaram et al. (2013). This high
sensitivity is reflected in the results concerning both aluminum and carbon-coated silicon
powders, mainly regarding their minimum ignition energies lower than 1 mJ and 4 mJ
respectively. Dufaud et al. (2011), Sundaram et al. (2016) and Vignes et al. (2019) also
highlighted that aluminum nanoparticles are more easily ignited than microparticles, notably
due to higher reactive surface area and different oxidation mechanisms (reaction limitation
rather than diffusional limitation). This tendency was observed for other metallic powders, such
as magnesium (Mittal, 2014; Nifuku et al., 2007) and titanium (Boilard et al., 2013), but also
for organic powders. Indeed, the studied nanocellulose exhibits a MIE of 16 mJ whereas
microcrystalline cellulose presents a much higher MIE, reaching 590 mJ ( Santandrea et al.,
2019c).
Table 4-1 Ignition sensitivity parameters of the studied nanopowders compared to
micropowders of the same nature
Powder MIE (mJ) MIT (°C) LEL (g.m-3)
Nanocellulose 16 420 250
“Cellulose” (< 70 µm) > 100 500 60
Carbon black > 1000 > 900 60
“Carbon” (< 250 µm) N/A N/A 60
Carbon-coated silicon 4 560 125
“Silicon” (< 70 µm) > 100 > 850 125
Aluminum 40-60 nm < 1 550 60
Aluminum 100 nm < 1 1 550 1 125
“Aluminum” (< 70 µm) 440 2 590 60
1 (Vignes, 2008), 2 (Dufaud et al., 2011)
However, the ignition sensitivity of some powders does not seem to be affected by a transition
to the nanoscale. For instance, Turkevich et al. (2016, 2015) found that the ignition sensitivity
of carbonaceous nanoparticles is similar to the one of coals and usual carbon blacks. More
precisely, Bouillard et al. (2010) evidenced that the MIT of carbon blacks decreases when
decreasing the particle size, but increases when the primary diameter reaches the nano-size
range. This observation can be explained by strong cohesion forces causing the particles to
agglomerate (Eckhoff, 2012). The studied carbon black could not be ignited by an electrical
spark or a hot surface in the limitation of the equipment, although its LEL was easily reached.

Chapter 4: Standard evaluation of flammability and explosivity
[85]
From the knowledge of the ignition sensitivity parameters of the powders, some
recommendations can then be prescribed. The powders can notably be classified depending on
their MIE (Janes et al., 2008). It appears on Table 4-1 that both aluminum powders very low
MIE and are therefore considered as extremely sensitive to electrostatic ignition. Therefore,
their ignition by a brush, a cone or a propagating discharge, even a corona discharge in the case
of aluminum, is not negligible. The nanocellulose and carbon-coated silicon powders are also
very sensitive to electrostatic ignition, with MIE of respectively 16 mJ and 4 mJ, and can be
easily ignited by an electrical spark or a propagating brush or cone discharge (Lüttgens et al.,
2017). These ignitions sources must then be considered when applying the ATEX directives.
However, it has to be noticed that corona and brush discharge, capable of igniting gas clouds,
are unlikely to ignite dust clouds. Specific handling conditions depending on the MIE value are
recommended by the standard IEC TS 60079-32-1:2013+A1:2017, such as grounding plant or
personnel, to avoid electrostatic discharges to ignite the product. Low level of electrification
must also be maintained, and charges capable of igniting the clouds must be neutralized. The
carbon black powder could not be ignited by an electrical spark, meaning it is not ignition
sensitive for energies lower than 1 J, according to ISO/IEC 80079-20-2 (2016). Thus, in
accordance with the ATEX directives, the ignition probability of this powder by an electrical
discharge is considered as extremely low. However, this powder can be ignited by energies
higher than 1 J, as proven by tests in the 20L sphere with an energy of 10 kJ and must not be
considered as non-explosible.
Concerning the MIT of the dust clouds, the same conclusions than for the MIE can be drawn,
i.e. the presence of hot surfaces capable of igniting the dust clouds must be avoided or limited.
Table 4-1 also shows that the LEL of aluminum and carbon black is of 60 g.m-3, which can
easily be reached during an accidental dispersion. Specific prevention measures to suppress or
limit dust accumulation must then be applied to avoid an accident. Moreover, even though the
LEL of carbon-coated silicon and nanocellulose are higher, reaching 125 g.m-3 and 250 g.m-3
respectively, both compounds exhibit low MIE and MIT, which still makes their ignition very
likely.
Thus, although each parameter is generally considered independently from the others, a reliable
prevention of the dust ignition relies on a consideration of the three parameters simultaneously.
The dependence of the ignition sensitivity factors on the dust characteristics and operating
conditions was notably investigated in the next section through a dimensional analysis.
IV.1.5. Dimensional analysis: dust cloud ignition
A dimensional analysis similar to the one conducted in chapter 3 for the dust dispersion was
realized to characterize ignition of a dust cloud. The considered characteristics of the dust cloud
are its concentration C, minimum ignition energy MIE, thermal conductivity λ, enthalpies of
combustion and vaporization ΔHcomb and ΔHvap, critical ignition diameter dc, which is the
smallest flame volume allowing the flame propagation (van der Wel, 1993), and characteristic
reaction time τc. This dust cloud is dispersed in air (ρair, µair) with a velocity u, and the dust-air
mixture exhibits an average heat capacity Cp. The dust cloud is ignited by an ignition energy
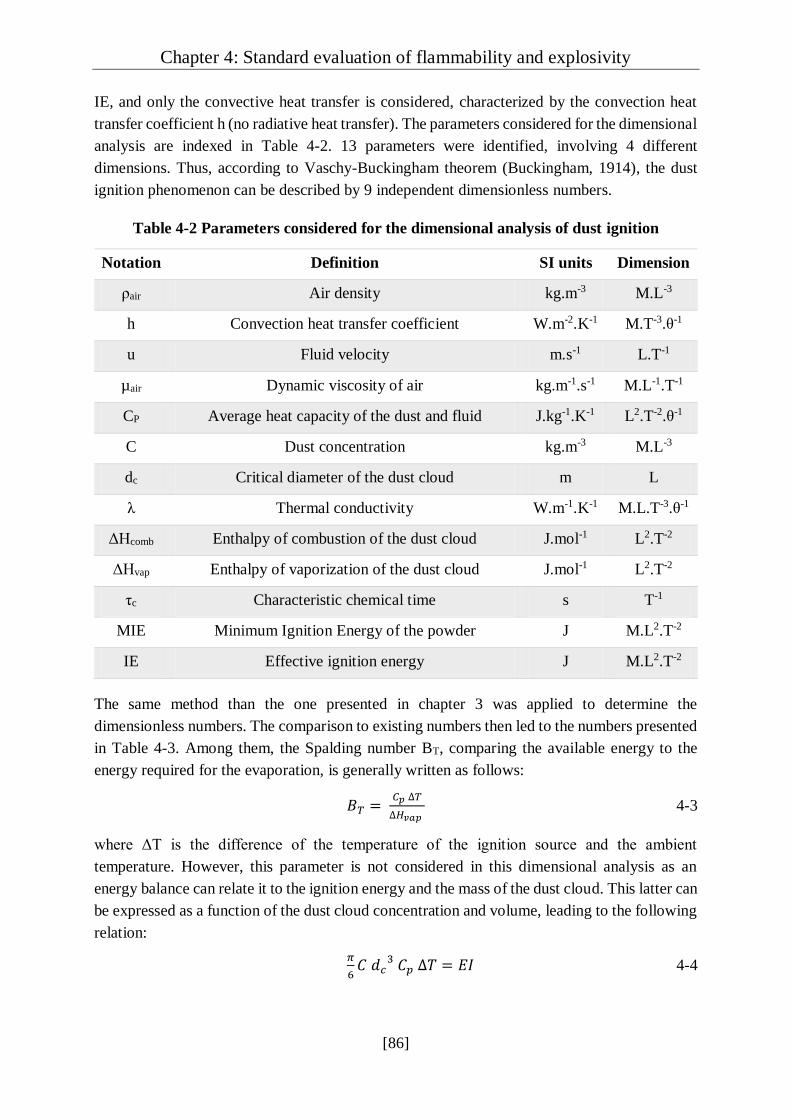
Chapter 4: Standard evaluation of flammability and explosivity
[86]
IE, and only the convective heat transfer is considered, characterized by the convection heat
transfer coefficient h (no radiative heat transfer). The parameters considered for the dimensional
analysis are indexed in Table 4-2. 13 parameters were identified, involving 4 different
dimensions. Thus, according to Vaschy-Buckingham theorem (Buckingham, 1914), the dust
ignition phenomenon can be described by 9 independent dimensionless numbers.
Table 4-2 Parameters considered for the dimensional analysis of dust ignition
Notation Definition SI units Dimension
ρair Air density kg.m-3 M.L-3
h Convection heat transfer coefficient W.m-2.K-1 M.T-3.θ-1
u Fluid velocity m.s-1 L.T-1
µair Dynamic viscosity of air kg.m-1.s-1 M.L-1.T-1
CP Average heat capacity of the dust and fluid J.kg-1.K-1 L2.T-2.θ-1
C Dust concentration kg.m-3 M.L-3
dc Critical diameter of the dust cloud m L
λ Thermal conductivity W.m-1.K-1 M.L.T-3.θ-1
ΔHcomb Enthalpy of combustion of the dust cloud J.mol-1 L2.T-2
ΔHvap Enthalpy of vaporization of the dust cloud J.mol-1 L2.T-2
τc Characteristic chemical time s T-1
MIE Minimum Ignition Energy of the powder J M.L2.T-2
IE Effective ignition energy J M.L2.T-2
The same method than the one presented in chapter 3 was applied to determine the
dimensionless numbers. The comparison to existing numbers then led to the numbers presented
in Table 4-3. Among them, the Spalding number BT, comparing the available energy to the
energy required for the evaporation, is generally written as follows:
𝐵𝑇 = 𝐶𝑝 ∆𝑇
∆𝐻𝑣𝑎𝑝 4-3
where ΔT is the difference of the temperature of the ignition source and the ambient
temperature. However, this parameter is not considered in this dimensional analysis as an
energy balance can relate it to the ignition energy and the mass of the dust cloud. This latter can
be expressed as a function of the dust cloud concentration and volume, leading to the following
relation:
𝜋
6𝐶 𝑑𝑐
3 𝐶𝑝 ∆𝑇 = 𝐸𝐼 4-4

Chapter 4: Standard evaluation of flammability and explosivity
[87]
It should be noted that the Biot number, defined by the same expression than the Nusselt
number, could be used to compare the heat transfer resistance inside and at the surface of a
body. However, since this analysis focuses on the dust cloud ignition, only the Nusselt number
was considered.
Table 4-3 Expression and physical meaning of the dimensionless numbers characterizing
the dust ignition phenomenon
Dimensionless
number Expression Physical meaning
Nusselt number Nu 𝑁𝑢 =ℎ 𝑑𝑐
𝜆
Characterization of the convective heat
transfer in a fluid
Stanton number
Sta 𝑆𝑡𝑎 =
ℎ
𝜌𝑎𝑖𝑟 𝑢 𝐶𝑝
Ratio of heat transferred into a fluid to the
thermal capacity of the fluid
Reynolds number
Re 𝑅𝑒 =
𝜌𝑎𝑖𝑟 𝑢 𝑑𝑐
𝜇𝑎𝑖𝑟
Ratio of fluid inertial forces and viscous
forces
Spalding number
BT 𝐵𝑇 =
𝐸𝐼
∆𝐻𝑣𝑎𝑝 𝐶 𝑑𝑐3
Ratio of available energy to energy required
for the evaporation
Damköhler number
DaII
𝐷𝑎𝐼𝐼 = 𝑑𝑐 𝜌𝑎𝑖𝑟 𝐶𝑝
ℎ 𝜏𝑐
Ratio of characteristic diffusion time to
characteristic chemical time
Lewis number Le 𝐿𝑒 = 𝜆
𝜌𝑎𝑖𝑟 𝐶𝑝 𝑑𝑐 𝑢
Ratio of mass diffusivity to thermal
diffusivity
π1 𝜋1 = 𝐸𝑀𝐼
𝐸𝐼 Overdriving coefficient
π2 𝜋2 = 𝐶
𝜌𝑎𝑖𝑟 Ratio of dust concentration to fluid density
π3 𝜋3 = ∆𝐻𝑐𝑜𝑚𝑏 𝐶 𝑑𝑐
3
𝐸𝐼
Ratio of energy generated by the reaction to
energy provided by the ignition source
A correlation relating the different dimensionless numbers can then be written. To be able to
determine the ignition energy to apply when performing explosion tests depending on the
minimum ignition energy of the dust, this correlation was written as a function of the number
π1:
𝜋1 = 𝑓(𝑁𝑢, 𝑆𝑡𝑎, 𝑅𝑒, 𝐵𝑇 , 𝐷𝑎𝐼𝐼 , 𝐿𝑒, 𝜋2, 𝜋3) 4-5
Since all the parameters involved in this dimensional analysis, such as the combustion and
vaporization enthalpies, the critical diameter or the characteristic reaction time, could not be
easily estimated for the considered powders, an analysis similar to the one realized in chapter 3
could not be conducted in this part. However, the main difference between the dust ignition of
microparticles and nanoparticles lies in the critical diameter, minimum ignition energy and
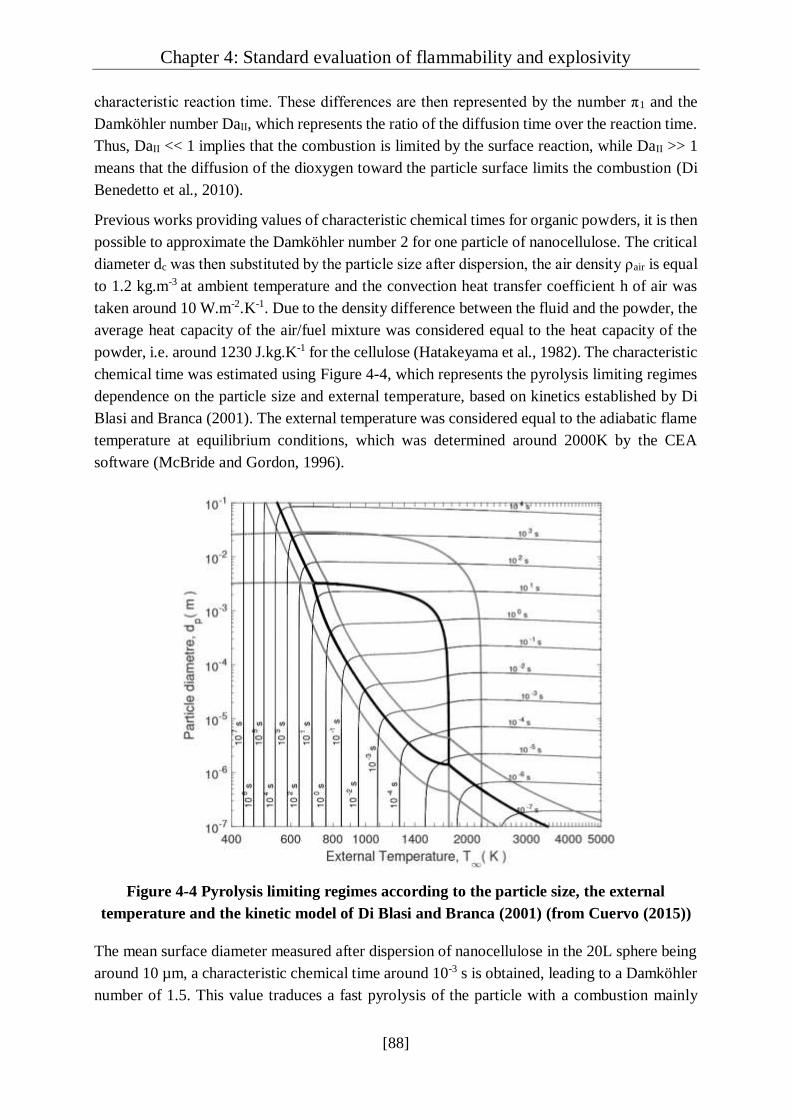
Chapter 4: Standard evaluation of flammability and explosivity
[88]
characteristic reaction time. These differences are then represented by the number π1 and the
Damköhler number DaII, which represents the ratio of the diffusion time over the reaction time.
Thus, DaII << 1 implies that the combustion is limited by the surface reaction, while DaII >> 1
means that the diffusion of the dioxygen toward the particle surface limits the combustion (Di
Benedetto et al., 2010).
Previous works providing values of characteristic chemical times for organic powders, it is then
possible to approximate the Damköhler number 2 for one particle of nanocellulose. The critical
diameter dc was then substituted by the particle size after dispersion, the air density ρair is equal
to 1.2 kg.m-3 at ambient temperature and the convection heat transfer coefficient h of air was
taken around 10 W.m-2.K-1. Due to the density difference between the fluid and the powder, the
average heat capacity of the air/fuel mixture was considered equal to the heat capacity of the
powder, i.e. around 1230 J.kg.K-1 for the cellulose (Hatakeyama et al., 1982). The characteristic
chemical time was estimated using Figure 4-4, which represents the pyrolysis limiting regimes
dependence on the particle size and external temperature, based on kinetics established by Di
Blasi and Branca (2001). The external temperature was considered equal to the adiabatic flame
temperature at equilibrium conditions, which was determined around 2000K by the CEA
software (McBride and Gordon, 1996).
Figure 4-4 Pyrolysis limiting regimes according to the particle size, the external
temperature and the kinetic model of Di Blasi and Branca (2001) (from Cuervo (2015))
The mean surface diameter measured after dispersion of nanocellulose in the 20L sphere being
around 10 µm, a characteristic chemical time around 10-3 s is obtained, leading to a Damköhler
number of 1.5. This value traduces a fast pyrolysis of the particle with a combustion mainly

Chapter 4: Standard evaluation of flammability and explosivity
[89]
occurring in gaseous phase. The transition from a reaction to a diffusion limitation was
estimated around 30 µm for organic powders (Dufaud et al., 2012), which is confirmed by a
Damköhler number of 0.9, implying a combustion limited by the dust pyrolysis. It should be
noted that, for individual nanoparticles of 100 nm diameter, a characteristic chemical time of
10-6 s is obtained at 2000K, inducing a Damköhler number of 14.8, characterizing a very fast
pyrolysis step.
However, these values are calculated for an individual particle. To reach the lower explosion
limit, the number of nanoparticles in the dust cloud is considerably higher than that of
microparticles. This number can be notably calculated as follows:
𝑛𝑝 = 𝐶 𝑑𝑐
3
𝜌𝑝 𝑑𝑝3 4-6
For instance, considering an organic dust cloud at a concentration of 60 g.m-3, a critical diameter
of 7 mm (Khalili et al., 2012) and a dust density of 700 kg.m-3 (e.g. nanocellulose), the number
of microparticles of 100 µm diameter is of the order of 103 while the number of nanoparticles
of 100 nm reaches 1010. This high number implies a very small distance between the particles,
which can induce a group combustion, i.e. the individual particle does not react independently
but is influenced by the combustion of the whole dust cloud. The characterization of such
combustion behavior would then require the knowledge of the distance between the particles
and the flame thickness, or, even better, a minimum distance allowing the heat transfer between
the particles to take the radiation into account.
Although the influence of the Damköhler number on the number π1 and, this way, on the
minimum ignition energy cannot be quantified, such modifications in the combustion behavior
can then explain the different ignition sensitivity when moving from the micro-scale to the
nano-scale. Such analysis could then be used as a base for future parametric analysis, such as
the development of a safety by design method for nanopowders.
IV.2. Explosion severity
After the determination of the ignition sensitivity of the powders, which allows to develop
prevention methods to reduce explosion likelihood, the explosion severity must be evaluated to
design protection equipment. The next section then defines the maximum overpressure and
maximum rate of pressure rise, characterizing the explosion severity, along with their
measurement method. The results obtained with each powder are also presented and discussed.
IV.2.1. Definition and measurement
The explosion severity is represented by the maximum overpressure (Pmax) and the maximum
rate of pressure rise (dP/dt)max. Those parameters can be evaluated in a 1m3 vessel or in a 20L
sphere, more generally used in laboratories because of its dimensions, according to EN 14034-
1 (2004), EN 14034-2 (2006) and ISO 6184/1 (1985). All the explosions tests performed in this
work were conducted in the 20L sphere, following the experimental procedure described in

Chapter 4: Standard evaluation of flammability and explosivity
[90]
detail by Cesana and Siwek (2001). The apparatus is constituted of a stainless-steel spherical
chamber of 20L capable of resisting static pressures up to 40 bars, equipped with a cooling
jacket that dissipates the heat generated during the explosion (Figure 4-5a). A dust canister of
0.6L is connected to the combustion chamber through a pneumatic electro-valve which opens
in less than 10 ms, and an injection nozzle is present at the bottom of the chamber (Figure 4-5b).
Figure 4-5 Siwek 20L sphere from a) TÜV SÜD Schweiz AG (2020) and b) EN 14034-1-2
(2004; 2006)
The experiment starts by evacuating the sphere at 0.4 bara in order to reach the atmospheric
pressure within the chamber after the dust dispersion. Then, the canister, filled with the
weighted dust sample, is pressurized at 20 barg, with compressed synthetic air (80% N2/20%
O2). It should be noted that its composition can be modified to evaluate the limiting oxygen
concentration. Afterwards, the electrovalve opens, inducing the dispersion of the dust by the
pressure gradient between the chamber and the dust container. When entering the 20L sphere,
the dust goes through a rebound nozzle to be distributed within the vessel (EN 14034-1-2, 2004;
2006). Chemical ignitors (Fr. Sobbe GmbH) are composed of 40%m. of zirconium, 30%m. of
barium nitrate and 30%m. of barium peroxide. This delay, called ignition delay time tv, can be
modified in the KSEP 7 software but remains set at 60 ms for standard tests. Two piezoelectric
sensors (Kistler Type 701A) connected to a data acquisition system then record the pressure-
time evolution during the explosion (Figure 4-6).
Right after the injection, the pressure increases from 0.4 bar to reach the atmospheric pressure.
The ignition delay time tv, i.e. the delay between the beginning of the injection and the activation
of the ignition source, is fixed to 60 ms in the 20L sphere (EN 14034-1, 2004; EN 14034-2,
2006). This delay controls the degree of turbulence of the dust cloud, but also the local
concentration of the dust (Dahoe, 2000; Murillo, 2016). After the ignition of the dust, the
pressure increases until it reaches a maximum value noted Pm, coupled with the maximum
value of the slope of the pressure profile, (dP/dt)m. Finally, the remaining suspended dust and
gas are evacuated using an outlet valve, and the combustion products are extracted from the

Chapter 4: Standard evaluation of flammability and explosivity
[91]
apparatus. The 20L sphere is then cleaned between each test and disassembled and washed after
each test series.
Figure 4-6 Pressure-time evolution during an explosion in the 20L sphere
Tests must be performed at different concentrations to find the maximum value of Pm and
(dP/dt)m. Those maximum values are then defined as the maximum overpressure Pmax and the
maximum rate of pressure rise (dP/dt)max, which are the parameters defining the explosion
severity of the dust. As explained in chapter 2, the value of (dP/dt)max, which depends on the
vessel volume, can be normalized using the deflagration index KSt calculated from the following
relation (Bartknecht, 1989):
𝐾𝑆𝑡 = (𝑑𝑃
𝑑𝑡)
𝑚𝑎𝑥 𝑉
1
3 4-7
Equation 4-7 aims at proposing a volume-independent parameter, the Kst, in order to extrapolate
the experimental results obtained in a 20L sphere to larger vessels. However, it should be noted
that only the dust concentration is varied during the tests, neglecting the influence of the ignition
energy and ignition delay time on the explosion severity parameters, contrary to MIE and MIT
tests. Moreover, although tests are conducted for several concentrations and reproduced around
the Pmax and (dP/dt)max values, only the most severe explosion is considered for the
determination of Pmax and KSt values.
IV.2.2. Explosion severity of the considered powders
In order to take advantage of all the experiments conducted on the powders, the evolution of
the explosion overpressure and rate of pressure rise with the concentration are presented
respectively in Figure 4-7 and Figure 4-8, and the explosion severity parameters are
summarized in Table 4-4. It should be noted that this part does not aim to better understand the
explosion mechanisms of nanopowders or to take a critical look at the tests performed under
standard conditions, but simply to follow the classic path imposed by compliance with
standards. Nevertheless, such investigations will be realized and detailed in chapter 5.
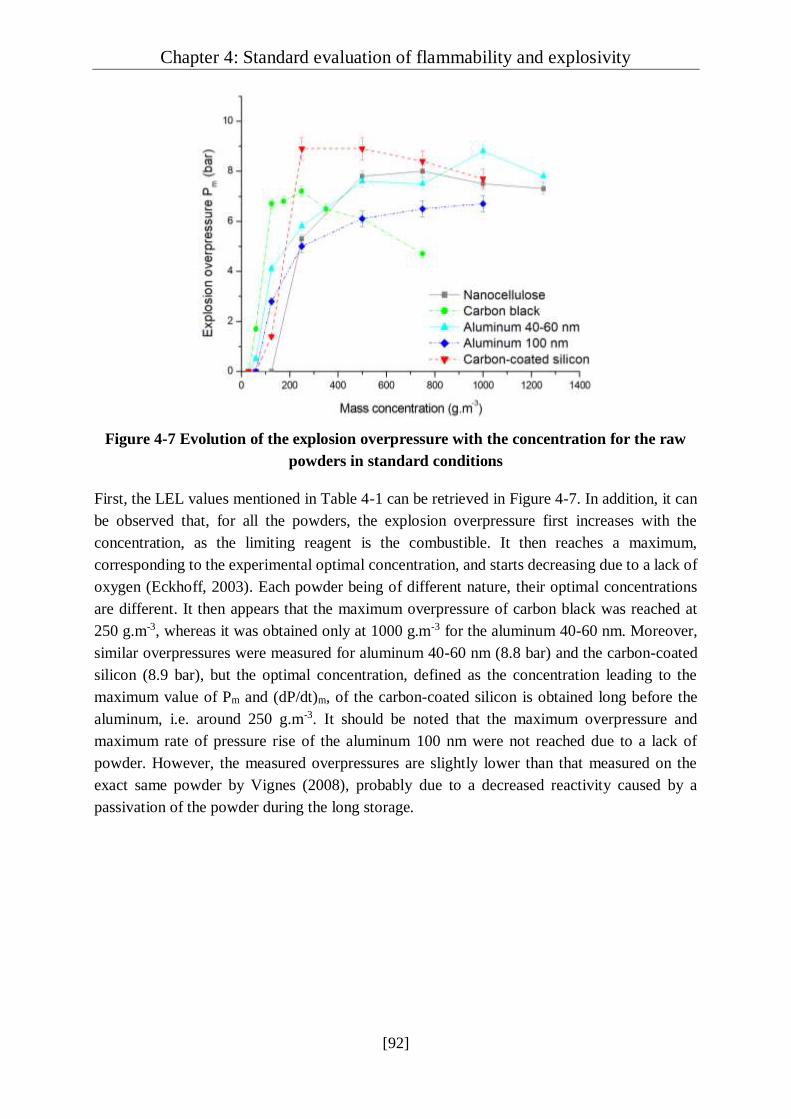
Chapter 4: Standard evaluation of flammability and explosivity
[92]
Figure 4-7 Evolution of the explosion overpressure with the concentration for the raw
powders in standard conditions
First, the LEL values mentioned in Table 4-1 can be retrieved in Figure 4-7. In addition, it can
be observed that, for all the powders, the explosion overpressure first increases with the
concentration, as the limiting reagent is the combustible. It then reaches a maximum,
corresponding to the experimental optimal concentration, and starts decreasing due to a lack of
oxygen (Eckhoff, 2003). Each powder being of different nature, their optimal concentrations
are different. It then appears that the maximum overpressure of carbon black was reached at
250 g.m-3, whereas it was obtained only at 1000 g.m-3 for the aluminum 40-60 nm. Moreover,
similar overpressures were measured for aluminum 40-60 nm (8.8 bar) and the carbon-coated
silicon (8.9 bar), but the optimal concentration, defined as the concentration leading to the
maximum value of Pm and (dP/dt)m, of the carbon-coated silicon is obtained long before the
aluminum, i.e. around 250 g.m-3. It should be noted that the maximum overpressure and
maximum rate of pressure rise of the aluminum 100 nm were not reached due to a lack of
powder. However, the measured overpressures are slightly lower than that measured on the
exact same powder by Vignes (2008), probably due to a decreased reactivity caused by a
passivation of the powder during the long storage.
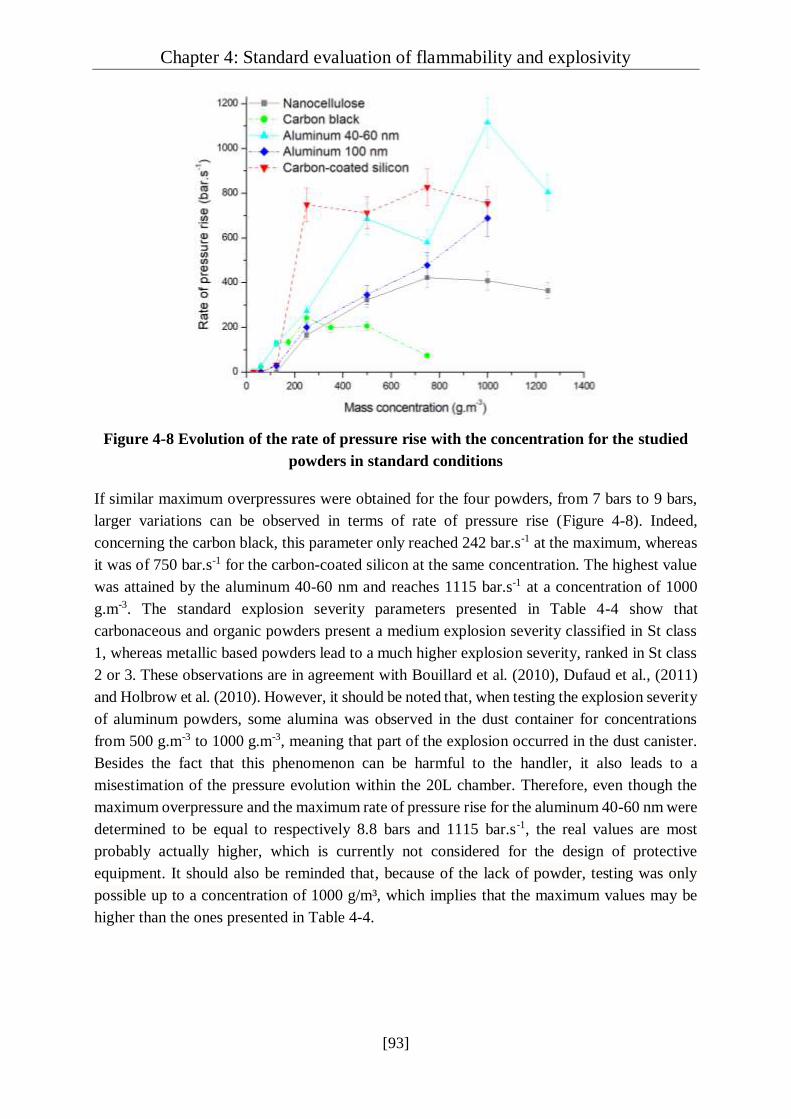
Chapter 4: Standard evaluation of flammability and explosivity
[93]
Figure 4-8 Evolution of the rate of pressure rise with the concentration for the studied
powders in standard conditions
If similar maximum overpressures were obtained for the four powders, from 7 bars to 9 bars,
larger variations can be observed in terms of rate of pressure rise (Figure 4-8). Indeed,
concerning the carbon black, this parameter only reached 242 bar.s-1 at the maximum, whereas
it was of 750 bar.s-1 for the carbon-coated silicon at the same concentration. The highest value
was attained by the aluminum 40-60 nm and reaches 1115 bar.s-1 at a concentration of 1000
g.m-3. The standard explosion severity parameters presented in Table 4-4 show that
carbonaceous and organic powders present a medium explosion severity classified in St class
1, whereas metallic based powders lead to a much higher explosion severity, ranked in St class
2 or 3. These observations are in agreement with Bouillard et al. (2010), Dufaud et al., (2011)
and Holbrow et al. (2010). However, it should be noted that, when testing the explosion severity
of aluminum powders, some alumina was observed in the dust container for concentrations
from 500 g.m-3 to 1000 g.m-3, meaning that part of the explosion occurred in the dust canister.
Besides the fact that this phenomenon can be harmful to the handler, it also leads to a
misestimation of the pressure evolution within the 20L chamber. Therefore, even though the
maximum overpressure and the maximum rate of pressure rise for the aluminum 40-60 nm were
determined to be equal to respectively 8.8 bars and 1115 bar.s-1, the real values are most
probably actually higher, which is currently not considered for the design of protective
equipment. It should also be reminded that, because of the lack of powder, testing was only
possible up to a concentration of 1000 g/m³, which implies that the maximum values may be
higher than the ones presented in Table 4-4.

Chapter 4: Standard evaluation of flammability and explosivity
[94]
Table 4-4 Explosion severity parameters for the studied powders compared to
micropowders of the same nature
Powder Pmax (bar) (dP/dt)max (bar.s-1) KSt (bar.m.s-1) St class
Nanocellulose 8.1 435 118 1
Microcrystalline cellulose 1 7.1 317 86 1
Carbon black 7.2 242 66 1
“Carbon” (< 250 µm) 8 556 151 1
Carbon-coated silicon 8.9 944 256 2
“Silicon” (< 70 µm) 10.8 497 135 1
Aluminum 40-60 nm 8.8 1115 303 3
Aluminum 100 nm 6.7* 688* 187* 1
Aluminum 3 µm 2 9.8 2090 567 3
Aluminum 42 µm 2 7.2 360 98 1
1 (Santandrea et al., 2020a), 2 (Dufaud et al., 2011), * Pm and (dP/dt)m
In a similar way to the analysis of the ignition sensitivity of the studied powders, the explosion
parameters of some micropowders, found on the GESTIS-DUST-EX database or mentioned by
Dufaud et al. (2011) and Santandrea et al. (2020a), are presented in Table 4-4. First, it appears
that the nanocellulose and carbon black leads to the less severe explosions and are classified as
St 1. Nevertheless, a decrease of 27% in the value of (dP/dt)max of the cellulose appears when
moving to the nanocrystals to microcrystals, along with a decrease of 12% in the value of Pmax,
traducing a higher explosion severity of nanoparticles. Although the values of Pmax and
(dP/dt)max reported for the carbon micropowder are slighty higher than the measured ones for
the carbon black, the class St remains unchanged. This observation can be explained by the
long storage (more than 10 years) of the powder, which will be discussed in section V.2.1.
In risk management, three different types of measures are applied: inherent, engineered and
procedural (Khan and Amyotte, 2003). In the first place, it is necessary to prevent the dust
ignition through the application of inherent safety measures, which must be given priority over
the other two prevention and protection means, and consists in four key principles (Bollinger
and Crowl, 1997; Yuan et al., 2013). First, the minimization principle relies on the use of small
quantities of combustible dust and on the low frequency of the performing of the hazardous
procedure. Then, the substitution consists in replacing the hazardous material or procedure by
a less hazardous one (Amyotte et al., 2003). Another way, called moderation, is to use the
material in a less dangerous form or to modify the process conditions to limit the probability of
dust dispersion or ignition. Finally, the simplification principle is applied by designing a process
in order to eliminate opportunities for errors by avoiding the excessive use of add-on safety
devices (Amyotte et al., 2009).
Chapter 4: Standard evaluation of flammability and explosivity
[95]
Without knowledge on the process involving the powder, only inherent safety measures, and
more specifically the moderation principle, can be discussed. In the case of dust explosion, this
method can be applied by passivating metallic particles or increasing the particle size. Indeed,
Sundaram et al. (2013) stated that aluminum nanoparticles presenting an oxide layer thicker
than 0.5 nm can be considered non-pyrophoric, thus limiting the probability of ignition, but also
the explosion severity. Although the oxide layer of the aluminum 100 nm was not estimated,
its long storage under ambient air probably induced the passivation of the powder, which is
illustrated by the low explosion severity compared to the values initially obtained by Vignes
(2008), which reached around 8 bars and 1000 bar.s-1. Moreover, as evidenced by the example
of aluminum 42 µm in Table 4-4 and highlighted by Boilard et al. (2013), Dufaud et al. (2011)
and Wu et al. (2009), increasing the particle size from the nano-range to the micro-range can
reduce the ignition sensitivity of metallic powders. However, as mentioned in chapter 2, they
also highlighted that particles between 150 nm and 3 µm lead to the most severe explosions. A
compromise must then be found to limit both ignition sensitivity and explosion severity. To
increase the ‘particle’ size and still conserve the properties of the dust, controlled agglomeration
may also be considered to reduce the explosion risk (Wu et al., 2010c), as it can also facilitate
the powder transport, handling and storage for instance.
IV.3. Questioning the standards…
This chapter, dealing with normative aspects, showed what a study of flammability and
explosivity of a powder conducted under the strict conditions of standards could bring as raw
results and conclusions. The powders considered in this work were then characterized in terms
of ignition sensitivity and explosion severity according to standards methods and some
recommendations were established to avoid ignition or explosion when handling these powders.
However, there are still significant issues concerning those tests.
Indeed, the high ignition sensitivity of certain nanopowders, highlighted in section IV.1.4
(carbon-coated silicon, nanocellulose, aluminum 40-60 nm), may result in an enhanced
overdriving phenomenon with regard to micropowders due to the use of an ignition energy of
10 kJ in the 20L sphere. This excessive amount of energy then impacts the flame propagation
in the combustion chamber and leads to an overestimation of the explosion overpressure (Going
et al., 2000; Zhen and Leuckel, 1997). In addition, it should be noticed that a so-called ‘under-
driving’ phenomenon can also be observed in the 20L sphere due to walls effects, which tends
to decrease the flame temperature, and thus the overpressure and rate of pressure rise values
(Dastidar, 2019; Kuai et al., 2012).
The high sensitivity of nanopowders can also induce a pre-ignition during the pressurization of
the dust container before the injection (Dufaud et al., 2011; Krietsch et al., 2015; Wu et al.,
2010). In a first instance, the observation of alumina in the dust container when testing the
aluminum nanopowders was attributed to this phenomenon. Nevertheless, further investigations
on this point are detailed in section V.4. Anyway, the presence of alumina in the dust container
traduces that at least a part of the explosion occurred in the canister, thus leading to a
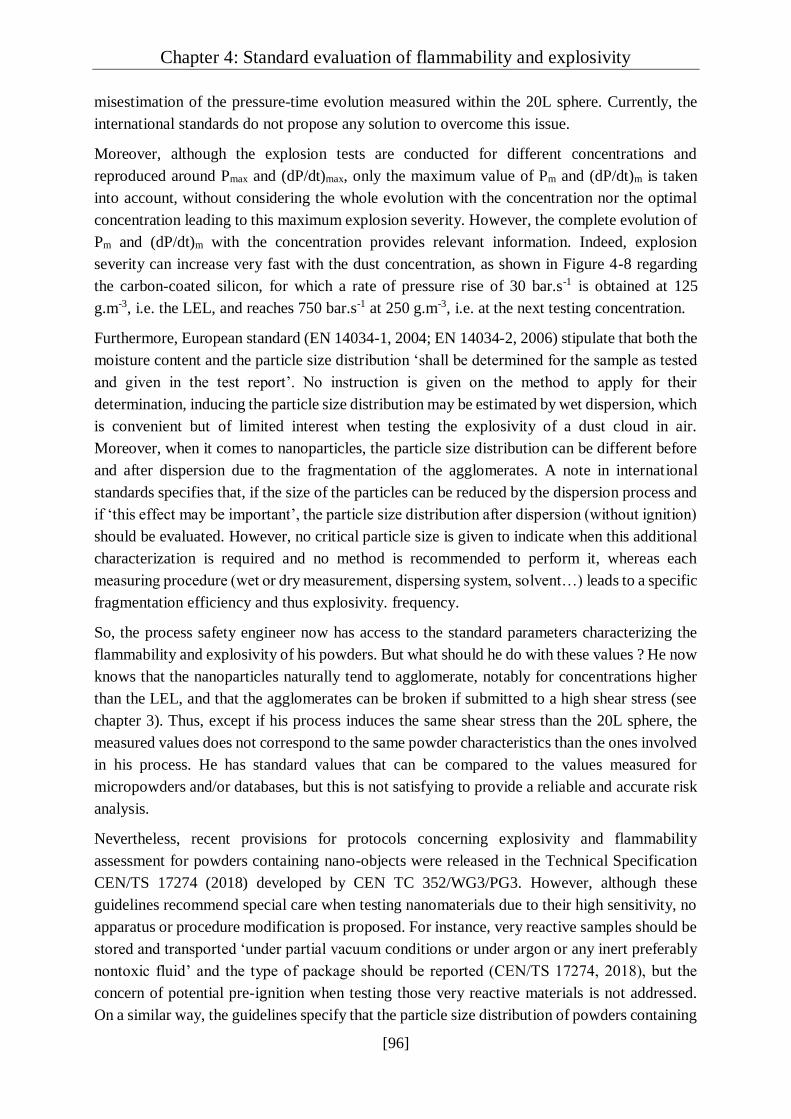
Chapter 4: Standard evaluation of flammability and explosivity
[96]
misestimation of the pressure-time evolution measured within the 20L sphere. Currently, the
international standards do not propose any solution to overcome this issue.
Moreover, although the explosion tests are conducted for different concentrations and
reproduced around Pmax and (dP/dt)max, only the maximum value of Pm and (dP/dt)m is taken
into account, without considering the whole evolution with the concentration nor the optimal
concentration leading to this maximum explosion severity. However, the complete evolution of
Pm and (dP/dt)m with the concentration provides relevant information. Indeed, explosion
severity can increase very fast with the dust concentration, as shown in Figure 4-8 regarding
the carbon-coated silicon, for which a rate of pressure rise of 30 bar.s-1 is obtained at 125
g.m-3, i.e. the LEL, and reaches 750 bar.s-1 at 250 g.m-3, i.e. at the next testing concentration.
Furthermore, European standard (EN 14034-1, 2004; EN 14034-2, 2006) stipulate that both the
moisture content and the particle size distribution ‘shall be determined for the sample as tested
and given in the test report’. No instruction is given on the method to apply for their
determination, inducing the particle size distribution may be estimated by wet dispersion, which
is convenient but of limited interest when testing the explosivity of a dust cloud in air.
Moreover, when it comes to nanoparticles, the particle size distribution can be different before
and after dispersion due to the fragmentation of the agglomerates. A note in international
standards specifies that, if the size of the particles can be reduced by the dispersion process and
if ‘this effect may be important’, the particle size distribution after dispersion (without ignition)
should be evaluated. However, no critical particle size is given to indicate when this additional
characterization is required and no method is recommended to perform it, whereas each
measuring procedure (wet or dry measurement, dispersing system, solvent…) leads to a specific
fragmentation efficiency and thus explosivity. frequency.
So, the process safety engineer now has access to the standard parameters characterizing the
flammability and explosivity of his powders. But what should he do with these values ? He now
knows that the nanoparticles naturally tend to agglomerate, notably for concentrations higher
than the LEL, and that the agglomerates can be broken if submitted to a high shear stress (see
chapter 3). Thus, except if his process induces the same shear stress than the 20L sphere, the
measured values does not correspond to the same powder characteristics than the ones involved
in his process. He has standard values that can be compared to the values measured for
micropowders and/or databases, but this is not satisfying to provide a reliable and accurate risk
analysis.
Nevertheless, recent provisions for protocols concerning explosivity and flammability
assessment for powders containing nano-objects were released in the Technical Specification
CEN/TS 17274 (2018) developed by CEN TC 352/WG3/PG3. However, although these
guidelines recommend special care when testing nanomaterials due to their high sensitivity, no
apparatus or procedure modification is proposed. For instance, very reactive samples should be
stored and transported ‘under partial vacuum conditions or under argon or any inert preferably
nontoxic fluid’ and the type of package should be reported (CEN/TS 17274, 2018), but the
concern of potential pre-ignition when testing those very reactive materials is not addressed.
On a similar way, the guidelines specify that the particle size distribution of powders containing
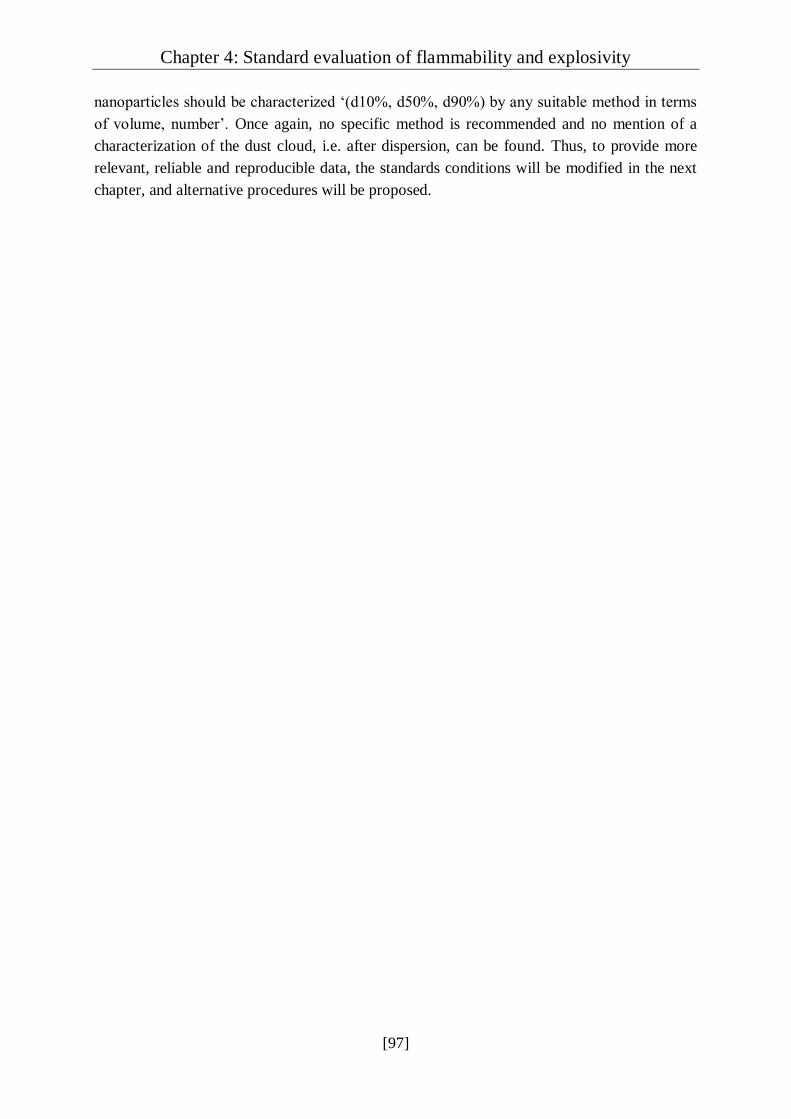
Chapter 4: Standard evaluation of flammability and explosivity
[97]
nanoparticles should be characterized ‘(d10%, d50%, d90%) by any suitable method in terms
of volume, number’. Once again, no specific method is recommended and no mention of a
characterization of the dust cloud, i.e. after dispersion, can be found. Thus, to provide more
relevant, reliable and reproducible data, the standards conditions will be modified in the next
chapter, and alternative procedures will be proposed.

Chapter 4: Standard evaluation of flammability and explosivity
[98]
Summary
This chapter is dedicated to the determination of the standard safety parameters of the powders
and to the establishment of recommendations related to these parameters.
First, the ignition sensitivity of the powders was investigated through the measurement of the
minimum ignition energy, the minimum ignition temperature and the lower explosion limit.
After a presentation of the standard methods and apparatus to measure these elements, the
values obtained for each powder were discussed. It then appears that the considered powders,
except for the carbon black, are particularly sensitive with regard to micropowders, especially
in terms of minimum ignition energy. Indeed, the nanocellulose and carbon-coated silicon
exhibit minimum ignition energies of 16 mJ and 4 mJ respectively, while both aluminum were
ignited by an electrical spark of 1 mJ. Specific measures to avoid electrostatic discharges, such
as grounding plant or personnel, must then be implemented when handling such nanopowders.
The parameters influencing the ignition sensitivity were discussed through a dimensional
analysis describing the ignition of a dust cloud, notably highlighting the different kinetic
limitations during the combustion of micro- and nanoparticles.
In a second part, the protocol for the measurement of the explosion severity characteristics, i.e.
the maximum overpressure and the maximum rate of pressure rise, was detailed for the 20L
sphere, and the determined values were presented. Organic and carbonaceous powders were
then classified as St 1, showing a medium explosivity, while the metal-based powders, i.e.
carbon-coated silicon and aluminum 40-60 nm, lead to much more severe explosions and were
respectively classified as St 2 and St 3.
The last part of this chapter focused on the observations related to the experiments conducted
and on a questioning of the validity of the international standards for the evaluation of the
ignition sensitivity and explosion severity of nanopowders. Indeed, due to their high ignition
sensitivity, the pressurization of the dust container before the injection of the powder in the 20L
sphere can be sufficient to ignite the powder before the activation of the chemical igniters. This
results in a misestimation of the pressure-time evolution measured in the combustion chamber
and can also damage the apparatus. Moreover, the amount of energy required to ignite such
powders is quite low (a few millijoules), while the standard ignition energy in the 20L is of 10
kJ, which can give rise to an overdriving phenomenon, disturbing the flame propagation and
leading once again to misestimated values. Finally, the high shear stress induced by the
dispersion in the 20L sphere can break the agglomerates, implying that the particle size
distribution can be different before and after dispersion, which is not specifically considered in
the international standards.

Chapter 4: Standard evaluation of flammability and explosivity
[99]
Résumé
Ce chapitre est dédié à la détermination des paramètres standard de sécurité des poudres et à
l’établissement de recommandations concernant ces paramètres.
D’abord, la sensibilité à l’inflammation des poudres a été évaluée par la mesure de l’énergie
minimale d’inflammation, la température minimale d’inflammation et la concentration
minimale explosible. Après une présentation des méthodes et appareils standards pour la
mesure de ces éléments, les valeurs obtenues pour chaque poudre ont été discutées. Il apparait
alors que les poudres considérées, à l’exception du noir de carbone, sont particulièrement
sensibles comparées aux microparticules, notamment au niveau de l’énergie minimale
d’inflammation. En effet, la nanocellulose et le silicium enrobé de carbone montrent des
énergies minimales d’inflammation de 16 mJ et 4 mJ respectivement, alors que les deux poudres
d’aluminium ont été enflammées par une étincelle de 1 mJ. Des mesures spécifiques pour éviter
les décharges électrostatiques, telles qu’une mise à la terre des installations ou du personnel,
doit alors être implémentée lors de la manipulation de ces nanopoudres. Les paramètres
influençant la sensibilité à l’inflammation d’une poudre ont été détaillés à travers une analyse
dimensionnelle décrivant la combustion d’un nuage de particules, mettant notamment en
lumière les différentes limitations cinétiques lors de la combustion de micro- et de
nanoparticules.
Dans une seconde partie, le protocole pour la mesure des caractéristiques de sévérité
d’explosion, i.e. la surpression maximale d’explosion et la vitesse maximale de montée en
pression, a été détaillé pour la sphère de 20L, et les valeurs déterminées ont été présentées. Les
poudres organiques et carbonées ont alors été classées St1, ce qui traduit une explosivité
modérée, tandis que les poudres métalliques, i.e. l’aluminium et le silicium enrobé de carbone,
ont mené à des explosions bien plus sévères et ont été classées respectivement St3 et St2.
La dernière partie de ce chapitre se focalise sur les observations liées aux essais expérimentaux
et à un questionnement concernant la validité des standards internationaux pour l’évaluation de
la sensibilité à l’inflammation et la sévérité d’explosion des nanopoudres. En effet, à cause de
leur forte sensibilité à l’inflammation, la pressurisation du réservoir avant l’injection de la
poudre dans la sphère de 20L peut être suffisante pour enflammer la poudre avant l’activation
des inflammateurs pyrotechniques. En résulte alors une mauvaise estimation de l’évolution de
la pression en fonction du temps mesurée dans la chambre de combustion, et peut également
endommager le matériel. De plus, la quantité d’énergie nécessaire pour enflammer ces
poussières est assez faible (quelques millijoules), tandis que l’énergie d’inflammation standard
dans la sphère de 20L est de 10 kJ, ce qui peut mener à un phénomène d’overdriving et influer
sur la propagation de la flamme, menant une fois encore à des résultats erronés. Enfin, le fort
cisaillement induit par la dispersion dans la sphère de 20L peut fragmenter les agglomérats,
impliquant que la distribution de tailles de particules peut être différente avant et après la
dispersion, ce qui n’est pas spécifiquement considéré dans les standards internationaux.

[100]
Chapter 5:
Standards versus reality
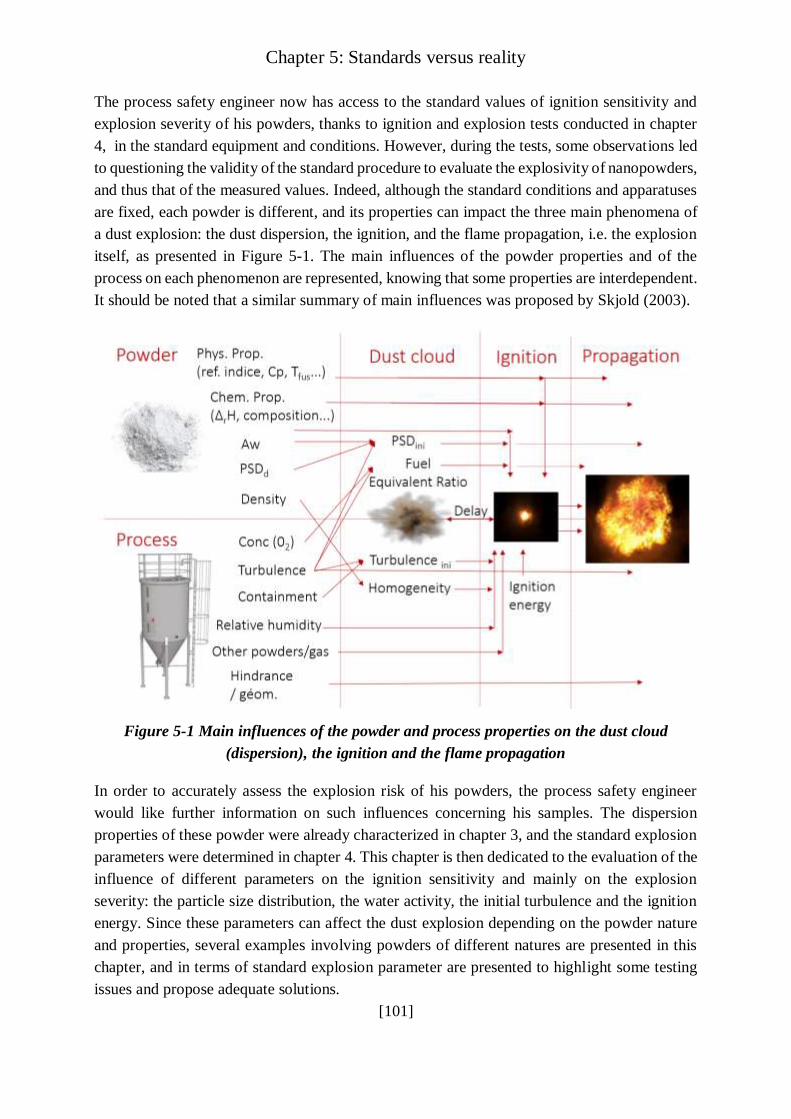
Chapter 5: Standards versus reality
[101]
The process safety engineer now has access to the standard values of ignition sensitivity and
explosion severity of his powders, thanks to ignition and explosion tests conducted in chapter
4, in the standard equipment and conditions. However, during the tests, some observations led
to questioning the validity of the standard procedure to evaluate the explosivity of nanopowders,
and thus that of the measured values. Indeed, although the standard conditions and apparatuses
are fixed, each powder is different, and its properties can impact the three main phenomena of
a dust explosion: the dust dispersion, the ignition, and the flame propagation, i.e. the explosion
itself, as presented in Figure 5-1. The main influences of the powder properties and of the
process on each phenomenon are represented, knowing that some properties are interdependent.
It should be noted that a similar summary of main influences was proposed by Skjold (2003).
Figure 5-1 Main influences of the powder and process properties on the dust cloud
(dispersion), the ignition and the flame propagation
In order to accurately assess the explosion risk of his powders, the process safety engineer
would like further information on such influences concerning his samples. The dispersion
properties of these powder were already characterized in chapter 3, and the standard explosion
parameters were determined in chapter 4. This chapter is then dedicated to the evaluation of the
influence of different parameters on the ignition sensitivity and mainly on the explosion
severity: the particle size distribution, the water activity, the initial turbulence and the ignition
energy. Since these parameters can affect the dust explosion depending on the powder nature
and properties, several examples involving powders of different natures are presented in this
chapter, and in terms of standard explosion parameter are presented to highlight some testing
issues and propose adequate solutions.

Chapter 5: Standards versus reality
[102]
In a first time, a focus will be realized on the sample preparation and formatting: how to modify
them to make the influence of the agglomeration more visible ? Does the presence of water
affect the ignition sensitivity and explosion severity ? In a second time, the influence of several
parameters, in addition to the dust sample, mentioned by the international standards EN 14034
will be investigated: ignition energy and source, dispersion procedure, nozzle, ignition delay
time. By systematically detailing, step by step, the standards, the existence of alternative
solutions can be envisaged for nanoparticles.
V.1. Stronger together? Influence of the agglomeration on
nanopowders explosion
‘The size of the dust particles can be reduced by the dispersion process. In cases where this
effect may be important, its magnitude can be evaluated by determining the particle size
distribution once more after dispersion (without ignition)
(EN 14034-1-2, 2004; 2006)
The small size of nanoparticles implies that they tend to agglomerate through weak bonding
such as van der Waals, electrostatic, capillary or magnetic forces (see chapter 2, section II.3.2).
Dispersion tests performed in the 20L sphere, presented in chapter 3, evidenced that the
agglomerates are partially broken by the injection procedure, thus modifying the particle size
distribution (PSD) of the cloud (Sanchirico et al., 2015). The impact of the agglomeration on
the explosion severity was estimated by a modification of the agglomerates size and cohesion
strength. Since the addition of a cohesion agent would modify the reactions involved in the
explosion, three ways can be envisaged: grinding, sieving, and mechanical agglomeration (e.g.
wet or dry granulation, compaction).
The dispersion procedure in the 20L sphere already inducing a high shear stress, it would be
difficult to further reduce the size of the agglomerates after dispersion. Indeed, the cohesion
strengths proposed by Rumpf (1962) and Weiler et al. (2010) evolve with the reverse of the
squared particle diameter (see section II.3.3). This implies that the smallest the particle (or
agglomerate), the harder it is to be broken (Deng et al., 2016). Moreover, dry powder grinding
would not allow the obtention of agglomerates smaller than around 1 µm, and the process would
produce heat and possibly electrostatic discharges that could be sufficient to ignite the most
sensitive powders. Therefore, powder grinding was not considered as a suitable solution. This
section is then divided in two parts, which respectively focus on nanocellulose sieving and
mechanical agglomeration of nanocellulose and carbon-coated silicon.
V.1.1. Effects of PSD selection
In an attempt to obtain different agglomerate sizes, the nanocellulose was dried under vacuum
at 90°C and sieved using a 40 µm mesh strainer submitted to low amplitude vibrations, to avoid
the breakage of the bigger agglomerates. Indeed, the mean surface diameter measured by

Chapter 5: Standards versus reality
[103]
sedimentation was around 48 µm. This procedure then allows the separation of the bigger
agglomerates to the finer particles. The particle size distribution of each fraction was measured
using the laser diffraction sensor by sedimentation. The upper fraction was constituted of
agglomerates of sizes between 40 and 100 µm, whereas the lower fraction exhibited a surface
diameter around 10 µm. The agglomerates sizes of each sample are summarized in Table 5-1.
It should be noted that the sieving process does not modify the size of the agglomerates and
only aims at separating the agglomerates according to their size. However, the biggest
agglomerates, i.e. the less cohesive, may be broken during the sieving process (Deng et al.,
2016).
Table 5-1 Characteristics of the raw and sieved nanocellulose
Powder Raw powder Fine fraction Large fraction
Sieving size (µm) N/A < 40 > 40
Mean surface diameter by
sedimentation (µm) 48 10 54
Mean surface diameter after
dispersion in the 20L sphere (µm) 10.4 8.2 12.3
The dust clouds emitted after dispersion in the 20L sphere were also characterized at the center
of the sphere and at the moment of ignition (Figure 5-2).
Figure 5-2 Particle size distribution of raw and sieved nanocellulose after injection in the
20L at the moment of ignition (at 60 ms)

Chapter 5: Standards versus reality
[104]
Despite the high shear stress induced by the dispersion system of the 20L sphere, a slight
difference in the particle size distributions of the samples can be observed. Indeed, the mean
surface diameter obtained by dispersion of the powder sieved below 40 µm is 8.2 µm whereas
the dispersion of the bigger agglomerates (> 40 µm) led to a mean surface diameter of 12.3 µm.
As a comparison, the mean surface diameter by dispersion of the raw powder is 10.4 µm. In
addition to these slight differences, the presence of particles smaller than 1 µm was evidenced
for the raw and sieved powder (< 40µm), whereas these particles are not observed for the sieved
powder (> 40µm), which confirms the efficiency of the sieving procedure.
However, probably due to the small differences in the PSD after dispersion, the explosion tests
performed on the different samples conduced to rather similar explosion severities (Figure 5-3).
Indeed, a maximum overpressure of 8.9 ± 0.4 bar and a maximum rate of pressure rise of
555 ± 66 bar.s-1 were obtained for the bigger agglomerates (> 40 µm), whereas these parameters
respectively reached 8.7 ± 0.4 bar and 473 ± 56 bar.s-1 for the finest powder. Nevertheless, the
lowest concentration inducing an explosion was obtained at 125 g.m-3 with the raw powder and
the smallest agglomerates and only at 250 g.m-3 with the sample of agglomerates bigger than
40 µm. Thus, despite the breakage of the majority of the agglomerates observed in Figure 5-2,
the sample constituted of agglomerates bigger than 40 µm, which contains fewer fine particles
or agglomerates than the initial powder, appears to be less ignition sensitive than the two other
samples. This observation tends to corroborate the theory stipulating that the ignition sensitivity
of a powder is mainly affected by the presence of fine particles (Saeed et al., 2019).
Figure 5-3 Effects of nanocellulose sieving on a) the maximum overpressure and b) the
maximum rate of pressure rise
To further investigate on the influence of fine particles on the ignition sensitivity, ignition
energy tests were conducted in the modified Hartmann tube. As previously mentioned, the
minimum ignition energy of the raw dried powder was evaluated at 5 mJ. After drying and
sieving at 40 µm, both obtained fractions also presented minimum ignition energies of 5 mJ.
However, when drying the nanocellulose and selecting only a PSD greater than 70 µm by the

Chapter 5: Standards versus reality
[105]
same previously described sieving protocol, the bigger fraction exhibited a minimum ignition
energy of 14 mJ. The effects of the presence of fine particles on the ignition sensitivity were
then also observed concerning the minimum ignition energy, despite the shift of the critical
agglomerate size. This latter may be explained by the different dispersion procedure (lifting by
an air pulse of 7 barg), and testing conditions, in terms of volume, concentration and
homogeneity, that directly impact the measurements. Moreover, sieving is not an accurate
separation method, as small agglomerates can also be physically coated to bigger ones and be
present in the samples of larger PSD. Furthermore, only one dimension smaller than the mesh
is sufficient for an agglomerate to be retrieved in the low fraction, independently from its
volume. It also has to be underlined that a hand sieving was performed to avoid the breakage
of the agglomerates, which decreases the reproducibility of the process.
V.1.2. Effects of mechanical agglomeration
Since the agglomerates that naturally exist in the raw powder are too easily breakable to
evaluate the influence of the particle size distribution on the explosion severity, artificial
agglomeration was realized. The effects of a mechanical agglomeration were investigated on
nanocellulose and starch, which were dried, compressed, ground and sieved, and on different
agglomerated samples of carbon-coated silicon directly supplied by Nanomakers (Rambouillet,
France).
V.1.2.1. Organic powders
Product characterization
To avoid the influence of humidity of the powder, the nanocellulose was dried under vacuum
at 90°C. It was then compressed without additive using a press (Instron 5569) to form tablets,
with a maximum force applied of 40 kN. The tablets were then ground and sieved between 32
and 180 µm. Indeed, this range is higher than the size range of the natural agglomerates (mean
surface diameter 48 µm), and the agglomerates are still small enough to lead to an explosion
when dispersed in adequate conditions (concentration, ignition source…). Scanning Electron
Microscopy was performed on the raw and agglomerated samples to visualize the difference of
structure of the two samples (Figure 5-4). It should be noted that all the SEM experiments were
conducted in dry conditions.
In Figure 5-4a, different agglomeration levels within the raw powder are visible, from small
agglomerates of less than 1 µm to big agglomerates of a few dozens of micrometers. Figure
5-4b then shows an agglomerate obtained after the compaction process, reaching around 100
µm diameter, which is consistent with the sieving range and confirms the efficiency of the
agglomeration process of the powder.
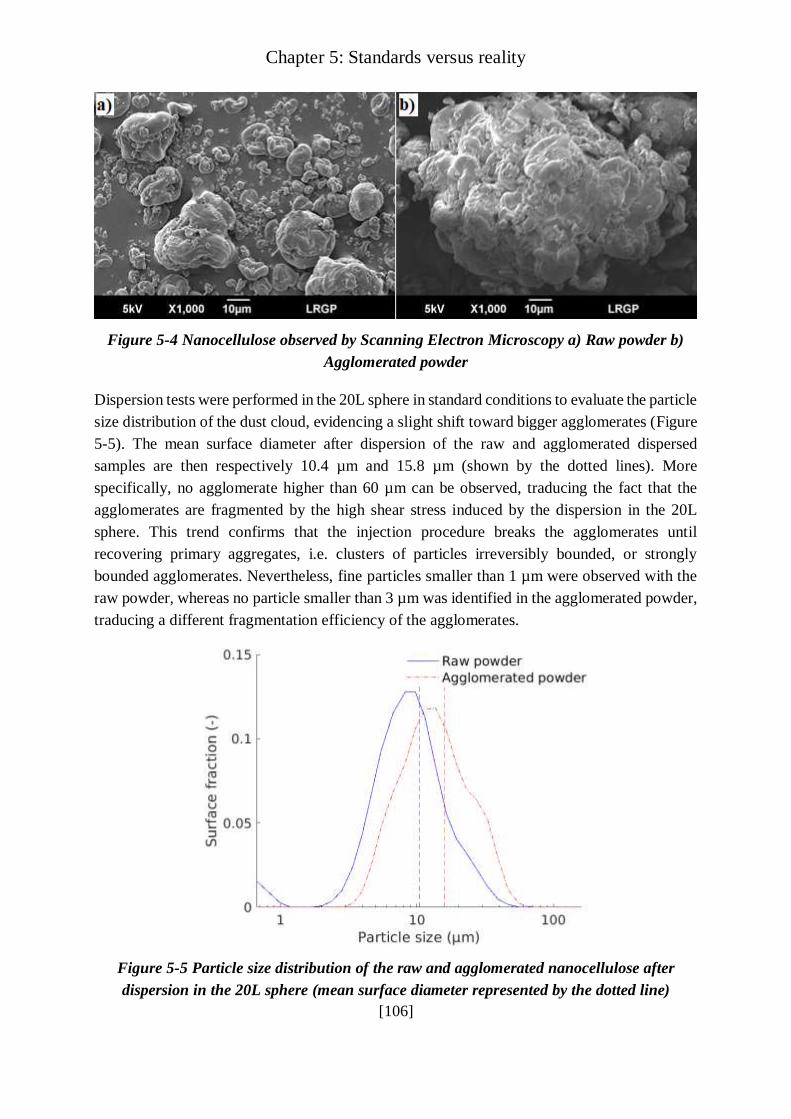
Chapter 5: Standards versus reality
[106]
Figure 5-4 Nanocellulose observed by Scanning Electron Microscopy a) Raw powder b)
Agglomerated powder
Dispersion tests were performed in the 20L sphere in standard conditions to evaluate the particle
size distribution of the dust cloud, evidencing a slight shift toward bigger agglomerates (Figure
5-5). The mean surface diameter after dispersion of the raw and agglomerated dispersed
samples are then respectively 10.4 µm and 15.8 µm (shown by the dotted lines). More
specifically, no agglomerate higher than 60 µm can be observed, traducing the fact that the
agglomerates are fragmented by the high shear stress induced by the dispersion in the 20L
sphere. This trend confirms that the injection procedure breaks the agglomerates until
recovering primary aggregates, i.e. clusters of particles irreversibly bounded, or strongly
bounded agglomerates. Nevertheless, fine particles smaller than 1 µm were observed with the
raw powder, whereas no particle smaller than 3 µm was identified in the agglomerated powder,
traducing a different fragmentation efficiency of the agglomerates.
Figure 5-5 Particle size distribution of the raw and agglomerated nanocellulose after
dispersion in the 20L sphere (mean surface diameter represented by the dotted line)
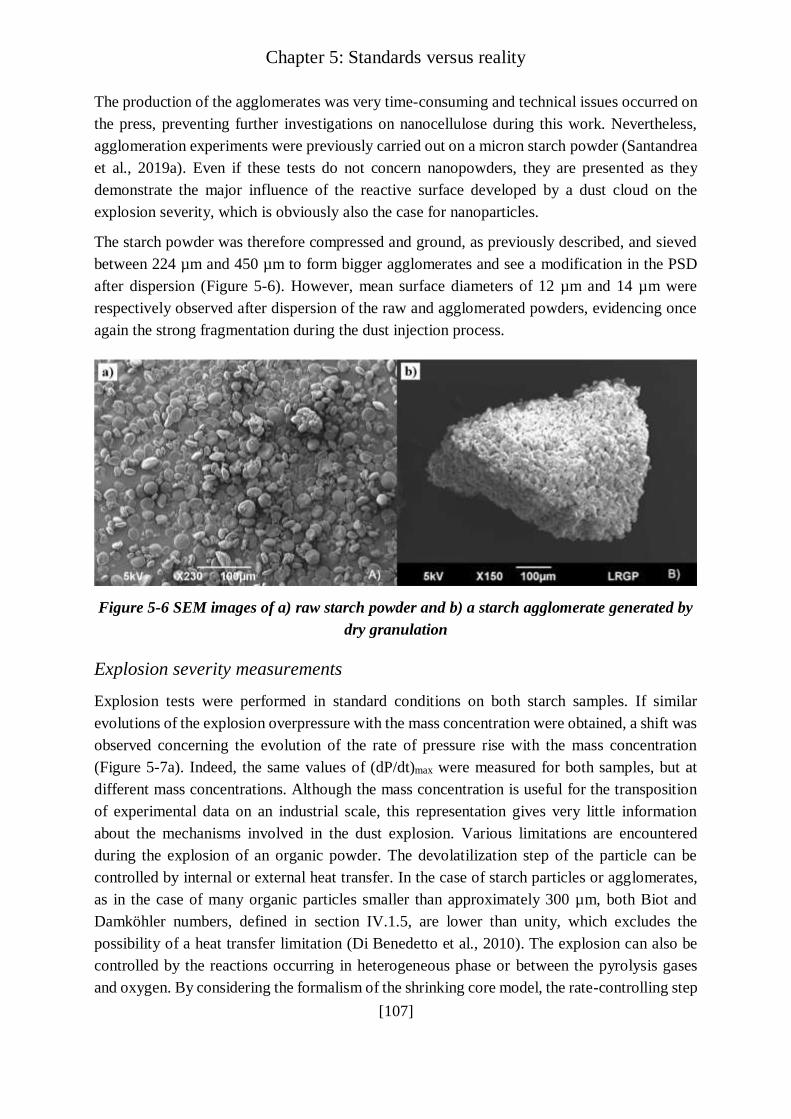
Chapter 5: Standards versus reality
[107]
The production of the agglomerates was very time-consuming and technical issues occurred on
the press, preventing further investigations on nanocellulose during this work. Nevertheless,
agglomeration experiments were previously carried out on a micron starch powder (Santandrea
et al., 2019a). Even if these tests do not concern nanopowders, they are presented as they
demonstrate the major influence of the reactive surface developed by a dust cloud on the
explosion severity, which is obviously also the case for nanoparticles.
The starch powder was therefore compressed and ground, as previously described, and sieved
between 224 µm and 450 µm to form bigger agglomerates and see a modification in the PSD
after dispersion (Figure 5-6). However, mean surface diameters of 12 µm and 14 µm were
respectively observed after dispersion of the raw and agglomerated powders, evidencing once
again the strong fragmentation during the dust injection process.
Figure 5-6 SEM images of a) raw starch powder and b) a starch agglomerate generated by
dry granulation
Explosion severity measurements
Explosion tests were performed in standard conditions on both starch samples. If similar
evolutions of the explosion overpressure with the mass concentration were obtained, a shift was
observed concerning the evolution of the rate of pressure rise with the mass concentration
(Figure 5-7a). Indeed, the same values of (dP/dt)max were measured for both samples, but at
different mass concentrations. Although the mass concentration is useful for the transposition
of experimental data on an industrial scale, this representation gives very little information
about the mechanisms involved in the dust explosion. Various limitations are encountered
during the explosion of an organic powder. The devolatilization step of the particle can be
controlled by internal or external heat transfer. In the case of starch particles or agglomerates,
as in the case of many organic particles smaller than approximately 300 µm, both Biot and
Damköhler numbers, defined in section IV.1.5, are lower than unity, which excludes the
possibility of a heat transfer limitation (Di Benedetto et al., 2010). The explosion can also be
controlled by the reactions occurring in heterogeneous phase or between the pyrolysis gases
and oxygen. By considering the formalism of the shrinking core model, the rate-controlling step
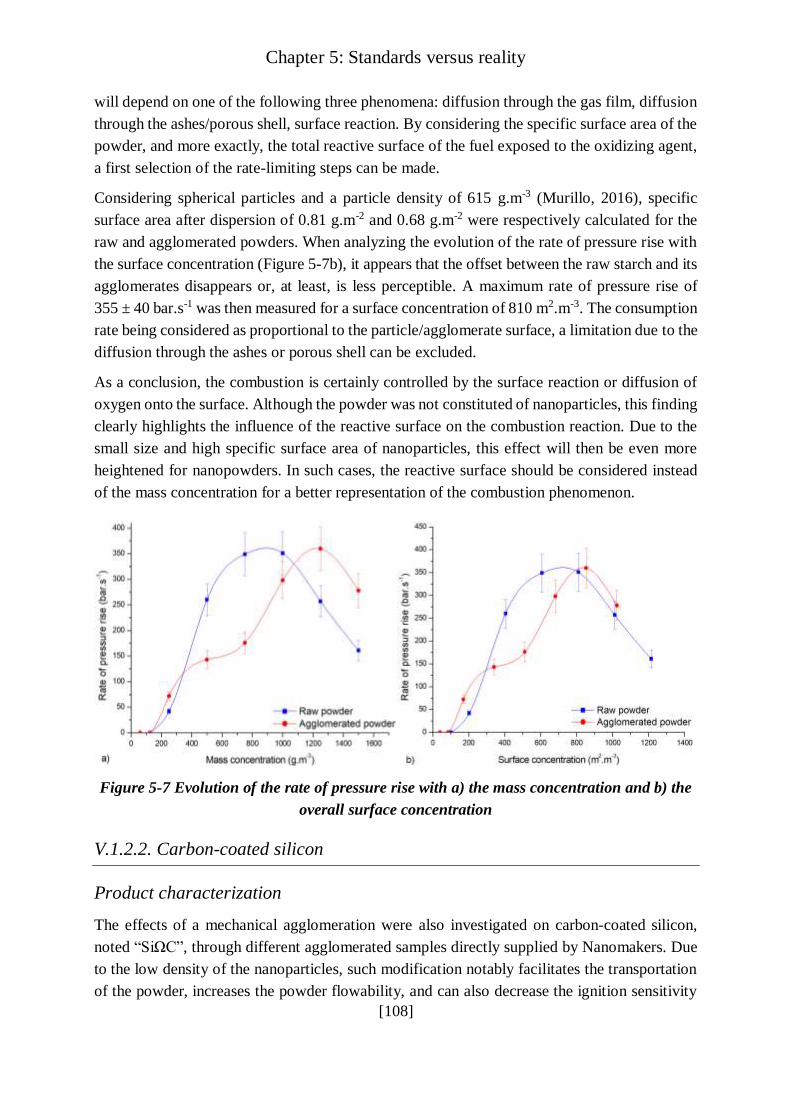
Chapter 5: Standards versus reality
[108]
will depend on one of the following three phenomena: diffusion through the gas film, diffusion
through the ashes/porous shell, surface reaction. By considering the specific surface area of the
powder, and more exactly, the total reactive surface of the fuel exposed to the oxidizing agent,
a first selection of the rate-limiting steps can be made.
Considering spherical particles and a particle density of 615 g.m-3 (Murillo, 2016), specific
surface area after dispersion of 0.81 g.m-2 and 0.68 g.m-2 were respectively calculated for the
raw and agglomerated powders. When analyzing the evolution of the rate of pressure rise with
the surface concentration (Figure 5-7b), it appears that the offset between the raw starch and its
agglomerates disappears or, at least, is less perceptible. A maximum rate of pressure rise of
355 ± 40 bar.s-1 was then measured for a surface concentration of 810 m2.m-3. The consumption
rate being considered as proportional to the particle/agglomerate surface, a limitation due to the
diffusion through the ashes or porous shell can be excluded.
As a conclusion, the combustion is certainly controlled by the surface reaction or diffusion of
oxygen onto the surface. Although the powder was not constituted of nanoparticles, this finding
clearly highlights the influence of the reactive surface on the combustion reaction. Due to the
small size and high specific surface area of nanoparticles, this effect will then be even more
heightened for nanopowders. In such cases, the reactive surface should be considered instead
of the mass concentration for a better representation of the combustion phenomenon.
Figure 5-7 Evolution of the rate of pressure rise with a) the mass concentration and b) the
overall surface concentration
V.1.2.2. Carbon-coated silicon
Product characterization
The effects of a mechanical agglomeration were also investigated on carbon-coated silicon,
noted “SiΩC”, through different agglomerated samples directly supplied by Nanomakers. Due
to the low density of the nanoparticles, such modification notably facilitates the transportation
of the powder, increases the powder flowability, and can also decrease the ignition sensitivity

Chapter 5: Standards versus reality
[109]
and explosion severity, which will be investigated in this section. In this sense, this type of
modification could be considered as a direct application of the moderation principle of inherent
safety (Amyotte et al., 2007; Dufaud, 2011).
Four samples constituted of the same powder with different densities, agglomerates sizes and
cohesion strengths were then studied in this work: the raw powder of primary diameter of 40 nm
and density of 40 g.L-1, two samples agglomerated according to a process noted ‘process A’
with densities of respectively 260 g.L-1 and 400 g.L-1, which will be noted powders A1 and A2,
and a sample agglomerated according to a ‘process B’ with a density of 400 g.L-1, noted sample
B. The specific processes of agglomeration are confidential and unfortunately cannot be
described here (Nanomakers). Experiments performed with a helium pycnometer led to skeletal
densities around 2.3 ± 0.05 g.cm-3 for all the powders, except for the powder A2 which exhibited
a skeletal density of 2.5 ± 0.05 g.cm-3 was obtained. Scanning Electron Microscopy analyses
were performed on each sample in dry conditions to visualize the shape modifications due to
the agglomeration (Figure 5-8).
Figure 5-8 Carbon-coated silicon observed by Scanning Electron Microscopy a) Raw
powder b) Sample A1 (260 g.L-1) c) Sample A2 (400 g.L-1) d) Sample B (400 g.L-1)
The raw powder appears to be constituted of small spherical agglomerates of apparent diameters
lower than 10 µm, as shown in Figure 5-8a. The modified powders also present the same kind
of agglomerated structures, but also bigger agglomerates. Indeed, the powder A1 seems
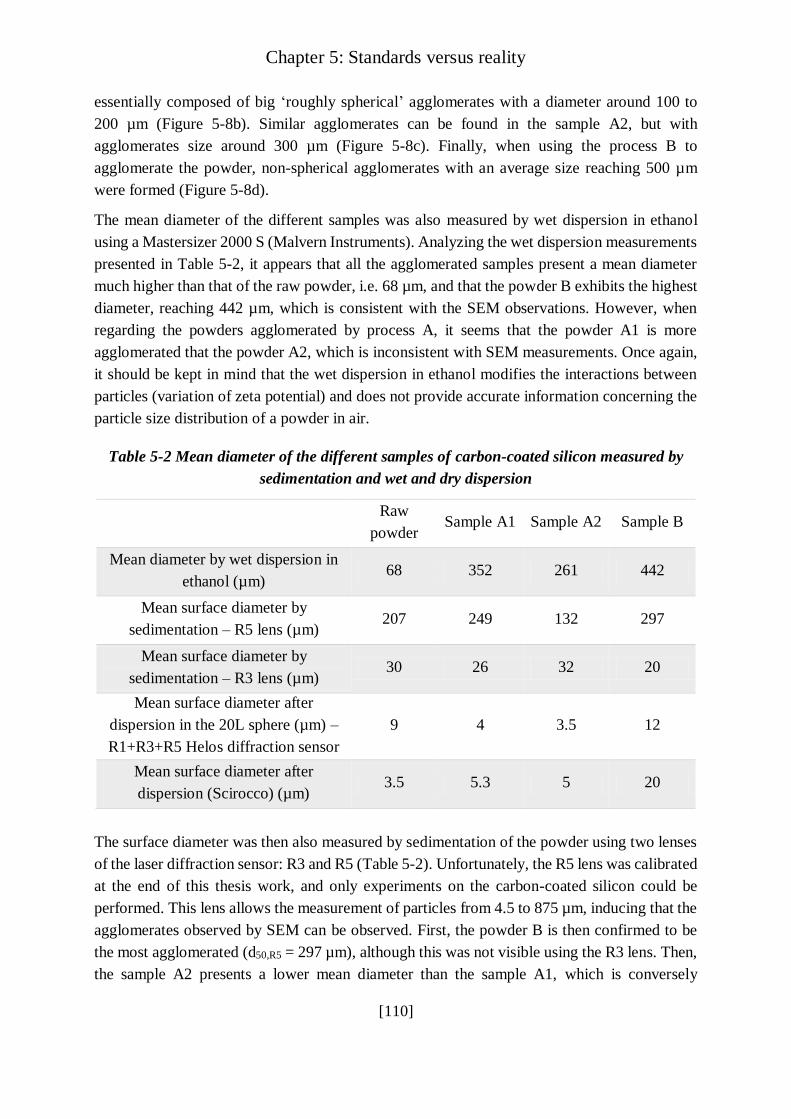
Chapter 5: Standards versus reality
[110]
essentially composed of big ‘roughly spherical’ agglomerates with a diameter around 100 to
200 µm (Figure 5-8b). Similar agglomerates can be found in the sample A2, but with
agglomerates size around 300 µm (Figure 5-8c). Finally, when using the process B to
agglomerate the powder, non-spherical agglomerates with an average size reaching 500 µm
were formed (Figure 5-8d).
The mean diameter of the different samples was also measured by wet dispersion in ethanol
using a Mastersizer 2000 S (Malvern Instruments). Analyzing the wet dispersion measurements
presented in Table 5-2, it appears that all the agglomerated samples present a mean diameter
much higher than that of the raw powder, i.e. 68 µm, and that the powder B exhibits the highest
diameter, reaching 442 µm, which is consistent with the SEM observations. However, when
regarding the powders agglomerated by process A, it seems that the powder A1 is more
agglomerated that the powder A2, which is inconsistent with SEM measurements. Once again,
it should be kept in mind that the wet dispersion in ethanol modifies the interactions between
particles (variation of zeta potential) and does not provide accurate information concerning the
particle size distribution of a powder in air.
Table 5-2 Mean diameter of the different samples of carbon-coated silicon measured by
sedimentation and wet and dry dispersion
Raw
powder Sample A1 Sample A2 Sample B
Mean diameter by wet dispersion in
ethanol (µm) 68 352 261 442
Mean surface diameter by
sedimentation – R5 lens (µm) 207 249 132 297
Mean surface diameter by
sedimentation – R3 lens (µm) 30 26 32 20
Mean surface diameter after
dispersion in the 20L sphere (µm) –
R1+R3+R5 Helos diffraction sensor
9 4 3.5 12
Mean surface diameter after
dispersion (Scirocco) (µm) 3.5 5.3 5 20
The surface diameter was then also measured by sedimentation of the powder using two lenses
of the laser diffraction sensor: R3 and R5 (Table 5-2). Unfortunately, the R5 lens was calibrated
at the end of this thesis work, and only experiments on the carbon-coated silicon could be
performed. This lens allows the measurement of particles from 4.5 to 875 µm, inducing that the
agglomerates observed by SEM can be observed. First, the powder B is then confirmed to be
the most agglomerated (d50,R5 = 297 µm), although this was not visible using the R3 lens. Then,
the sample A2 presents a lower mean diameter than the sample A1, which is conversely
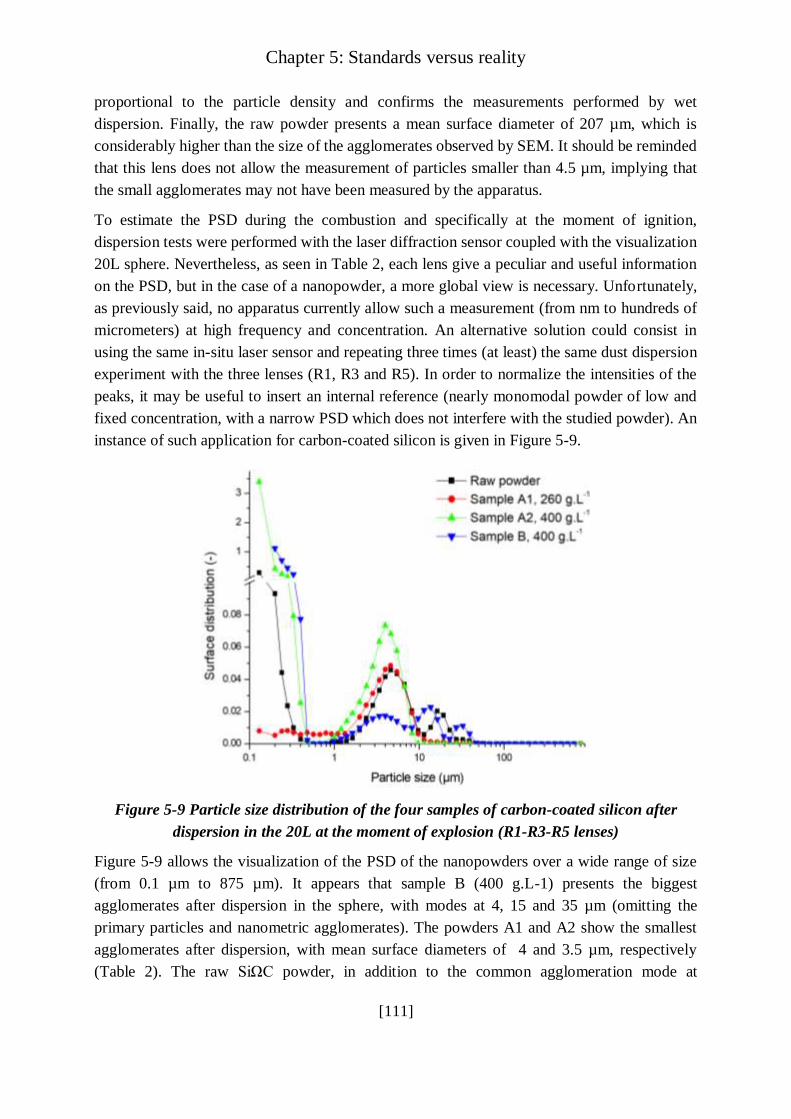
Chapter 5: Standards versus reality
[111]
proportional to the particle density and confirms the measurements performed by wet
dispersion. Finally, the raw powder presents a mean surface diameter of 207 µm, which is
considerably higher than the size of the agglomerates observed by SEM. It should be reminded
that this lens does not allow the measurement of particles smaller than 4.5 µm, implying that
the small agglomerates may not have been measured by the apparatus.
To estimate the PSD during the combustion and specifically at the moment of ignition,
dispersion tests were performed with the laser diffraction sensor coupled with the visualization
20L sphere. Nevertheless, as seen in Table 2, each lens give a peculiar and useful information
on the PSD, but in the case of a nanopowder, a more global view is necessary. Unfortunately,
as previously said, no apparatus currently allow such a measurement (from nm to hundreds of
micrometers) at high frequency and concentration. An alternative solution could consist in
using the same in-situ laser sensor and repeating three times (at least) the same dust dispersion
experiment with the three lenses (R1, R3 and R5). In order to normalize the intensities of the
peaks, it may be useful to insert an internal reference (nearly monomodal powder of low and
fixed concentration, with a narrow PSD which does not interfere with the studied powder). An
instance of such application for carbon-coated silicon is given in Figure 5-9.
Figure 5-9 Particle size distribution of the four samples of carbon-coated silicon after
dispersion in the 20L at the moment of explosion (R1-R3-R5 lenses)
Figure 5-9 allows the visualization of the PSD of the nanopowders over a wide range of size
(from 0.1 µm to 875 µm). It appears that sample B (400 g.L-1) presents the biggest
agglomerates after dispersion in the sphere, with modes at 4, 15 and 35 µm (omitting the
primary particles and nanometric agglomerates). The powders A1 and A2 show the smallest
agglomerates after dispersion, with mean surface diameters of 4 and 3.5 µm, respectively
(Table 2). The raw SiΩC powder, in addition to the common agglomeration mode at

Chapter 5: Standards versus reality
[112]
approximately 4 µm, also presents larger structures around 20 µm (Figure 5). It should be
noticed that, unlike the other samples, no significant peak is obtained for the powder A1 at
particle size lower than 0.5 µm which may seem surprising and requires additional tests with
R1 lens.
These observations can lead to several comments:
i) The measuring range being limited at 0.1/0.2 µm, the particle size distributions may
be different below this value, and the presence of individualized nanoparticles is
certainly more marked for the raw powder.
ii) During the agglomeration process, especially with process A, the structure of the
initial agglomerates could have been weakened, reducing the cohesion strength of
these initial agglomerates. During particle size measurements by wet dispersion or
by sedimentation in air, their structure is not significantly modified. On the contrary,
the very high shear rate induced by the dispersion in the 20L (pressurization at 20
bar) can break these agglomerates, demonstrating the existence of a threshold stress.
Finally, the PSD after dry dispersion using the Scirocco device, described in section III.2.2.2
was also measured with the Mastersizer 2000 particle size analyzer (Malvern Instruments). The
results, presented in Table 5-2, are consistent with the SEM images, as the powder B seems the
more agglomerated, with a mean surface diameter of 20 µm, and the raw powder presents the
smallest particles and a mean surface of 3.5 µm. It should be noted that the shear stress induced
by the dispersion in the Scirocco device is much lower than that induced during the injection in
the 20L sphere, notably due to a lower dispersion pressure (2 barg). Such values then tend to
show that the initial agglomerates are broken during the dispersion in the 20L sphere, but not
in the Scirocco device, which corroborates the assumption considering that the initial
agglomerates were weakened during the mechanical agglomeration of the powder. However, a
whole characterization of the particle size distribution, from the nanometer to several hundred
of micrometers, is necessary to conclude on this phenomenon. Unfortunately, as previously
said, no apparatus currently allow such a measurement at high frequency and concentration.
Explosion severity measurements
Explosion tests were then performed on each sample in the standard 20L sphere (Figure 5-10).
First, it should be noticed that the increase of overpressure and rate of pressure rise with the
dust concentration is very fast, which tends to decrease the accuracy at the ‘transition’
concentration, i.e. 125 g.m-3. Indeed, in this transition zone, a small variation in the dust
concentration can greatly impact the pressure-time evolution. The maximum overpressures
obtained are similar independently from the agglomeration state of the sample, reaching around
8.8 bar (Figure 5-10a), which implies that the same amount of powder seems to react according
to the same reaction mechanisms. From the observation of the overpressure evolution with the
concentration, agglomeration seems to have a limited effect on the thermodynamics
development of the explosion. On the other hand, significant differences appear when regarding

Chapter 5: Standards versus reality
[113]
the maximum rate of pressure rise obtained for each powder (Figure 5-10b). The raw powder
leads to the most severe explosion, with a maximum rate of pressure of 944 ± 118 bar.s-1. The
theoretically less agglomerated powder, i.e. powder A1, is slightly less severe and reaches 822
± 98 bar.s-1. Both powders are then classified in the St2 class, with explosivity index KSt of
respectively 256 ± 32 bar.m.s-1 and 223 ± 27 bar.m.s-1. The explosions induced by the powders
agglomerated with a density of 400 g.L-1 are less severe, reaching 713 ± 85 bar.s-1 for the sample
A2 and only 556 ± 60 bar.s-1 for the sample B, which ranks both powders as St1.
Figure 5-10 Evolution of the a) maximum overpressure and b) maximum rate of pressure
rise with the mass concentration of the four samples of carbon-coated silicon
The explosion severity results performed in standard conditions then showed that the same
maximum overpressure is obtained while the maximum rate of pressure is affected by the
agglomeration state of the powder. Since the mechanical agglomeration does not modify the
specific surface area (Nanomakers, 2019), such modification cannot be attributed to this
parameter. On a similar way than for the starch powder, a total reactive surface area developed
after dispersion was approximated considering spherical agglomerates, the density of each
powder and the mean surface diameter measured after dispersion in the 20L sphere. The
evolution of the overpressure and rate of pressure rise with the surface concentration are then
presented in Figure 5-11.
Contrary to the deviation observed for the starch powder, the correlation of the explosion
severity with the total surface of the agglomerates does not seem adequate for the carbon-coated
silicon. Indeed, the combustion of organic powder is limited by the pyrolysis step or by the
surface reaction of the particles (Di Benedetto et al., 2010), whereas the carbon-coated silicon
does not undergo the pyrolysis step. Since the combustion does not occur in gaseous phase, the
distance between the particles is of great importance. Indeed, increasing the concentration
reduces this distance, leading to a transition between the combustion of the individual particle
(small concentration) to a group combustion at higher concentrations. This can notably explain
the strong difference of explosion severity observed between 125 g.m-3 and 250 g.m-3 for the
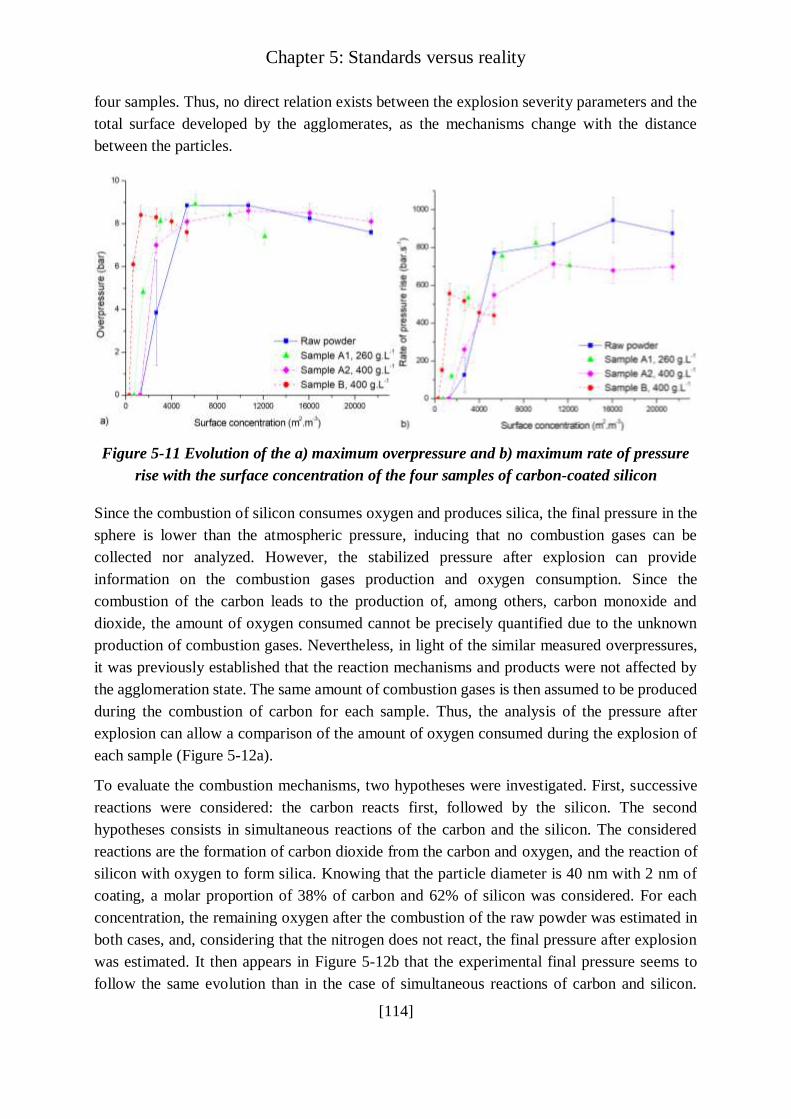
Chapter 5: Standards versus reality
[114]
four samples. Thus, no direct relation exists between the explosion severity parameters and the
total surface developed by the agglomerates, as the mechanisms change with the distance
between the particles.
Figure 5-11 Evolution of the a) maximum overpressure and b) maximum rate of pressure
rise with the surface concentration of the four samples of carbon-coated silicon
Since the combustion of silicon consumes oxygen and produces silica, the final pressure in the
sphere is lower than the atmospheric pressure, inducing that no combustion gases can be
collected nor analyzed. However, the stabilized pressure after explosion can provide
information on the combustion gases production and oxygen consumption. Since the
combustion of the carbon leads to the production of, among others, carbon monoxide and
dioxide, the amount of oxygen consumed cannot be precisely quantified due to the unknown
production of combustion gases. Nevertheless, in light of the similar measured overpressures,
it was previously established that the reaction mechanisms and products were not affected by
the agglomeration state. The same amount of combustion gases is then assumed to be produced
during the combustion of carbon for each sample. Thus, the analysis of the pressure after
explosion can allow a comparison of the amount of oxygen consumed during the explosion of
each sample (Figure 5-12a).
To evaluate the combustion mechanisms, two hypotheses were investigated. First, successive
reactions were considered: the carbon reacts first, followed by the silicon. The second
hypotheses consists in simultaneous reactions of the carbon and the silicon. The considered
reactions are the formation of carbon dioxide from the carbon and oxygen, and the reaction of
silicon with oxygen to form silica. Knowing that the particle diameter is 40 nm with 2 nm of
coating, a molar proportion of 38% of carbon and 62% of silicon was considered. For each
concentration, the remaining oxygen after the combustion of the raw powder was estimated in
both cases, and, considering that the nitrogen does not react, the final pressure after explosion
was estimated. It then appears in Figure 5-12b that the experimental final pressure seems to
follow the same evolution than in the case of simultaneous reactions of carbon and silicon.

Chapter 5: Standards versus reality
[115]
However, the value experimentally measured at 125 g.m-3, around 0.97 bara, corresponds to the
value calculated at 60 g.m-3. This shift may be due, as previously explained, to a variation from
an individual contribution of the particle to a group contribution of the agglomerates. The
powders agglomerated by the process A, i.e. powders A1 and A2, follows the same evolution
of the raw powder with a final pressure stabilized around 0.87 bara. On the contrary, the final
pressure obtained after combustion of powder B stabilized around 0.89 bara, which can traduce
a different combustion mechanism. This difference can come from the agglomeration process,
which may have induced a decrease in the specific surface area, or at least in the surface
available for the combustion after dispersion, which would explain the lowest explosion
severity.
However, when the combustion is limited by the diffusion of oxygen toward the particle
surface, the fractal dimension, i.e. the shape of the agglomerate, can impact the accessibility of
oxygen to this surface. A simulation based on Monte Carlo methods is presented in Appendix
2 to evaluate the influence of the fractal dimension of an agglomerate on the accessibility of
oxygen to its surface. It was notably shown that an accessibility difference of 20% can appear
between a linear agglomerate (fractal dimension equal to 1) and a spherical agglomerate (fractal
dimension equal to 3), which can also explain the differences in the explosion severity observed
between the sample B and the other samples.
Figure 5-12 Evolution of the stabilized pressure after explosion in the 20L sphere with the
mass concentration a) experimentally measured for the different samples of carbon-coated
silicon b) calculated for the raw powder
As a conclusion, the agglomeration of the carbon-coated silicon significantly decreased the
explosion severity, which can be due to a combination between the modification in the available
reactive surface area after dispersion and to a modification of the combustion behavior, from
an individual to a group contribution. Such effects will now be investigated on the ignition
sensitivity of the powder.
Chapter 5: Standards versus reality
[116]
Ignition sensitivity measurements
In addition to the experiments conducted in the 20L sphere, the minimum ignition energy of
the different powders was determined in the modified Hartmann tube. While the minimum
ignition energy of the raw powder was evaluated at 5 mJ, no ignition was observed at 1J for the
three other samples when varying the dust quantity from 0.6 to 1.8 g and the ignition delay time
from 90 ms to 150 ms. Although some glowing particles were observed when testing the sample
agglomerated at 260 g.L-1 by process A, no flame was obtained. The agglomeration then
appears to significantly reduce the ignition sensitivity of this dust concerning the energy to
provide to obtain an explosion. As shown in Figure 5-10, the lowest concentration for which an
explosion was obtained at 10 kJ is the same for all the samples, i.e. 125 g.m-3. Since these tests
were performed at 10 kJ, additional tests should be conducted with the standard ignition energy
to apply to determine the LEL, i.e. 2 kJ (EN 14034-3, 2006). Still, the LEL does not seem
modified with the agglomeration state of the powder, which can notably be explained by the
strong fragmentation of the agglomerates during the dispersion in the 20L sphere. Indeed, the
agglomerates submitted to the high shear stress of the injection device in the 20L sphere tend
to break more easily than the agglomerates lifted by the air pulse in the modified Hartmann
tube, which give them ignition properties similar than the raw powder.
V.2. To the last drop: influence of humidity
‘ The maximum explosion pressure increases with decreasing moisture content. Therefore the
moisture content shall be determined for the sample as tested and given in the test report.’
(EN 14034-1-2, 2004; 2006)
Humidity can greatly influence the explosion behavior of micropowders (Traoré et al., 2009;
Yuan et al., 2014). It should be reminded that, when dealing with metal powders, the explosion
severity can be increased by the dust moisture because of water reduction onto the particle
surface and hydrogen generation occurring at high temperatures. For organic nanoparticles,
such phenomenon will not take place, but other effects of the presence of water have to be
considered. In this part, a focus is realized on the sample preparation through an aging
phenomenon and the moisture content of the powder, and their influence on the explosion
severity was then highlighted.
V.2.1. Powder aging
Powder characterization
Two of the studied powders, the carbon black and the aluminum 100 nm were stored for 11
years under ambient air. The aging effects on the explosion severity were notably discussed by
Santandrea et al. (2019b). Since the aluminum 100 nm does not show significant size variation
on Scanning Electron Microscopy images, and that the effects of the probable passivation of

Chapter 5: Standards versus reality
[117]
the powder during the storage on the explosion severity were already discussed in section
IV.2.2., focus is realized on the carbon black powder. SEM images of carbon black reveal that
the size of the agglomerates varied along the time It can be outlined from Figure 5-13 that 11
years of storage promoted the enlargement of the agglomerates of carbon black (from 100 µm
to 1 mm), which is also visually perceptible. Such phenomenon leads to a modification of the
surface area-to-volume ratio of the agglomerates and then changes their properties (Yeap,
2018).
The water activity Aw, which is the partial vapor pressure of water divided by the standard state
partial vapor pressure of water, was measured on the raw carbon black powder, and after
vacuum drying at 90°C. When drying the powder, the Aw decreases from 0.4 to 0.03. However,
by waiting 1 or 15 minutes before measuring the water activity, the Aw increases and reaches
respectively 0.11 and 0.22. Because of the high specific surface area, nanoparticles are prone
to adsorb vapors and especially water, as a function of their chemical nature. SEM images also
showed that the drying step leads to a partial breakage of the agglomerates (Figure 5-13c),
which confirms that the aging is mainly due to humidity.
Figure 5-13 SEM image of carbon black agglomerates in
a) 2006, b) 2017 (raw powder) and c) 2017 (dry powder)
Explosion severity measurements
To evaluate the impact of aging on the explosion severity, explosion tests were conducted on
the carbon black under standard conditions on the raw and dried powders, and the results were

Chapter 5: Standards versus reality
[118]
compared to the ones obtained in 2006 (Figure 5-14). The maximum explosion overpressure of
carbon black is not significantly modified by aging (Figure 5-14a). However, the maximum rate
of pressure rise greatly decreases with the aging of the particles (Figure 5-14b): it drops from
503 bar.s-1 (Bouillard et al., 2010) to 242 bar.s-1, which is probably due to a change in the PSD
and to the water adsorbed. Despite the partial breakage of the agglomerates when drying the
powder, similar rates of pressure rise were measured for the raw and dried powders in 2017.
Unfortunately, no in situ measurements were performed in 2006, making impossible a
comparison of the PSD of the dust cloud at 60 ms, before and after aging. Nevertheless, as
demonstrated in chapter 3, the agglomerates do not fragment completely during their injection
(Yeap, 2018), and the presence of bigger agglomerates can impact the final PSD of the carbon
nanoparticles in the sphere, thus reducing the overall surface/volume ratio of the powder and
its reactivity. Indeed, since the evolution of the Pm with the concentration is similar in 2006 and
2017 (either dried or not) (Figure 5-14a), the same thermodynamics are applied during the
explosion, meaning that the same amount of powder reacted. On the contrary, the rate of
pressure rise, describing the kinetics, is greatly affected. Specific attention must therefore be
paid when storing nanoparticles before testing them, as the moisture content can greatly
influence both the particle size and the combustion reaction and can increase rapidly in the
powder when exposed to air.
Figure 5-14 Evolution of the explosion a) overpressure and b) rate of pressure rise with the
concentration for carbon black powder in 2006 and 2017 (raw and dry)
V.2.2. Influence of water activity on dust explosions
The tendency of nanoparticles to adsorb water, highlighted in section V.2.1, raises some
questions concerning the dust preparation before the tests. Indeed, as an example, the process
safety engineer uses nanopowders in a dry form in his processes. However, in the absence of
special precaution during the transport and storage before performing ignition and explosion
tests, the powders can absorb water from ambient atmosphere. The influence of water on dust
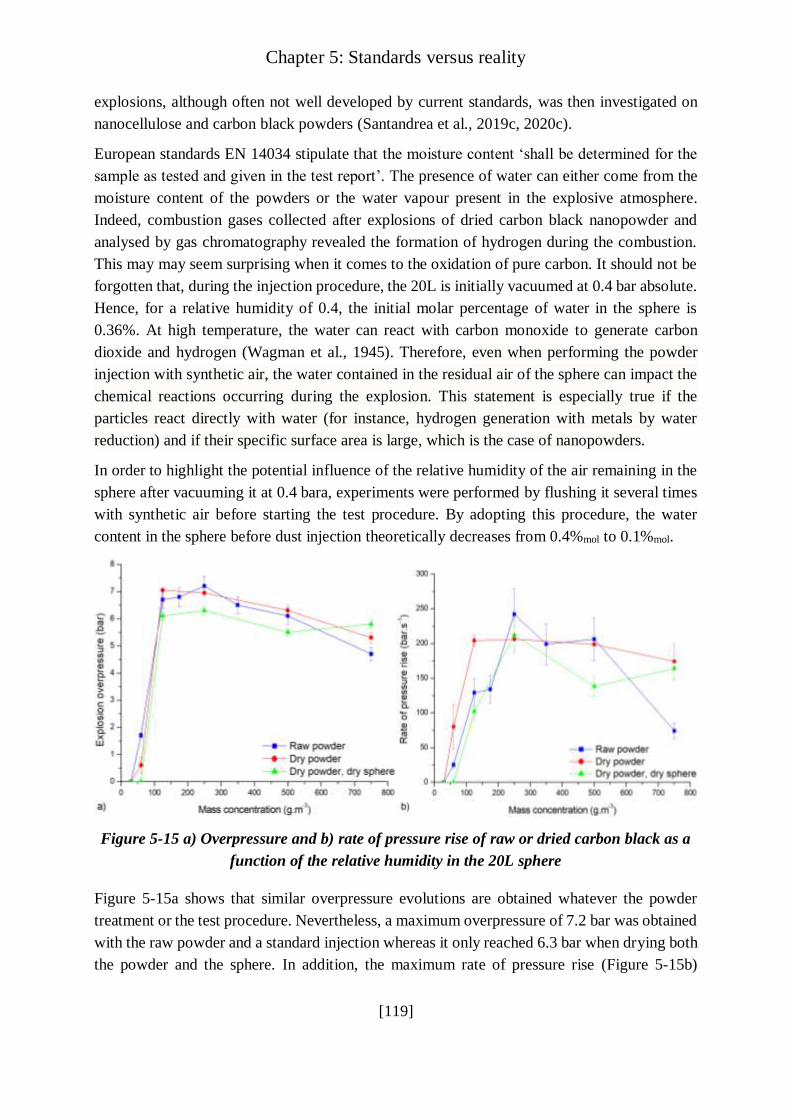
Chapter 5: Standards versus reality
[119]
explosions, although often not well developed by current standards, was then investigated on
nanocellulose and carbon black powders (Santandrea et al., 2019c, 2020c).
European standards EN 14034 stipulate that the moisture content ‘shall be determined for the
sample as tested and given in the test report’. The presence of water can either come from the
moisture content of the powders or the water vapour present in the explosive atmosphere.
Indeed, combustion gases collected after explosions of dried carbon black nanopowder and
analysed by gas chromatography revealed the formation of hydrogen during the combustion.
This may may seem surprising when it comes to the oxidation of pure carbon. It should not be
forgotten that, during the injection procedure, the 20L is initially vacuumed at 0.4 bar absolute.
Hence, for a relative humidity of 0.4, the initial molar percentage of water in the sphere is
0.36%. At high temperature, the water can react with carbon monoxide to generate carbon
dioxide and hydrogen (Wagman et al., 1945). Therefore, even when performing the powder
injection with synthetic air, the water contained in the residual air of the sphere can impact the
chemical reactions occurring during the explosion. This statement is especially true if the
particles react directly with water (for instance, hydrogen generation with metals by water
reduction) and if their specific surface area is large, which is the case of nanopowders.
In order to highlight the potential influence of the relative humidity of the air remaining in the
sphere after vacuuming it at 0.4 bara, experiments were performed by flushing it several times
with synthetic air before starting the test procedure. By adopting this procedure, the water
content in the sphere before dust injection theoretically decreases from 0.4%mol to 0.1%mol.
Figure 5-15 a) Overpressure and b) rate of pressure rise of raw or dried carbon black as a
function of the relative humidity in the 20L sphere
Figure 5-15a shows that similar overpressure evolutions are obtained whatever the powder
treatment or the test procedure. Nevertheless, a maximum overpressure of 7.2 bar was obtained
with the raw powder and a standard injection whereas it only reached 6.3 bar when drying both
the powder and the sphere. In addition, the maximum rate of pressure rise (Figure 5-15b)

Chapter 5: Standards versus reality
[120]
obtained with the raw powder is, as expected, significantly greater than with the dried powder.
These differences can be due to a contribution of the formed hydrogen to the explosion.
After the explosion of dried powder in the dried sphere, the combustion gases were once again
collected and analyzed (Figure 5-16).The hydrogen content appears always greater when using
the standard procedure, which highlights the influence of the relative humidity of the air on the
combustion mechanisms taking place during an explosion. These examples show that variations
(in storage time, relative humidity, water activity) that may seem insignificant have a significant
impact when it comes to the explosion severity of nanoparticles.
Figure 5-16 Hydrogen content in the burnt gases after dried carbon nanopowder explosion
in the 20L sphere using standard or modified injection procedure
Ignition and explosion tests were also carried out on raw (Aw = 0.23) and dried nanocellulose
(Aw = 0.03 after drying under vacuum at 90°C) (Santandrea et al., 2020c). The water activity,
the PSD obtained by sedimentation and after dispersion in the 20L sphere, the minimum
ignition energy as well as the explosion parameters are presented in Table 5-3. The PSD of the
raw and dry samples of nanocellulose was measured before and after dispersion and remains
unchanged, which shows that the agglomeration state of the powder was not affected by the
drying process. Thus, the influence of water activity can be specifically assessed for the ignition
and explosion severity.
Similar maximum overpressures were measured for the dried and raw nanocellulose, reaching
respectively 8.3 bar and 8.1 bar at 750 g.m-3, meaning that the thermodynamics are barely
affected by the humidity of the powder. The maximum rate of pressure rise increased from 435
bar.s-1 from the raw sample to 500 bar.s-1 for the dry sample, i.e. an increase of 14%. This value
is close to the experimental error related to the evaluation of the maximum rate of pressure rise
in the 20L sphere, which is around 10% (Proust et al., 2007). Although small variations in the
combustion kinetics of nanocellulose appears when drying the powder, such modifications can
be attributed to a modification of the exchanges due to the presence of water. The combustion
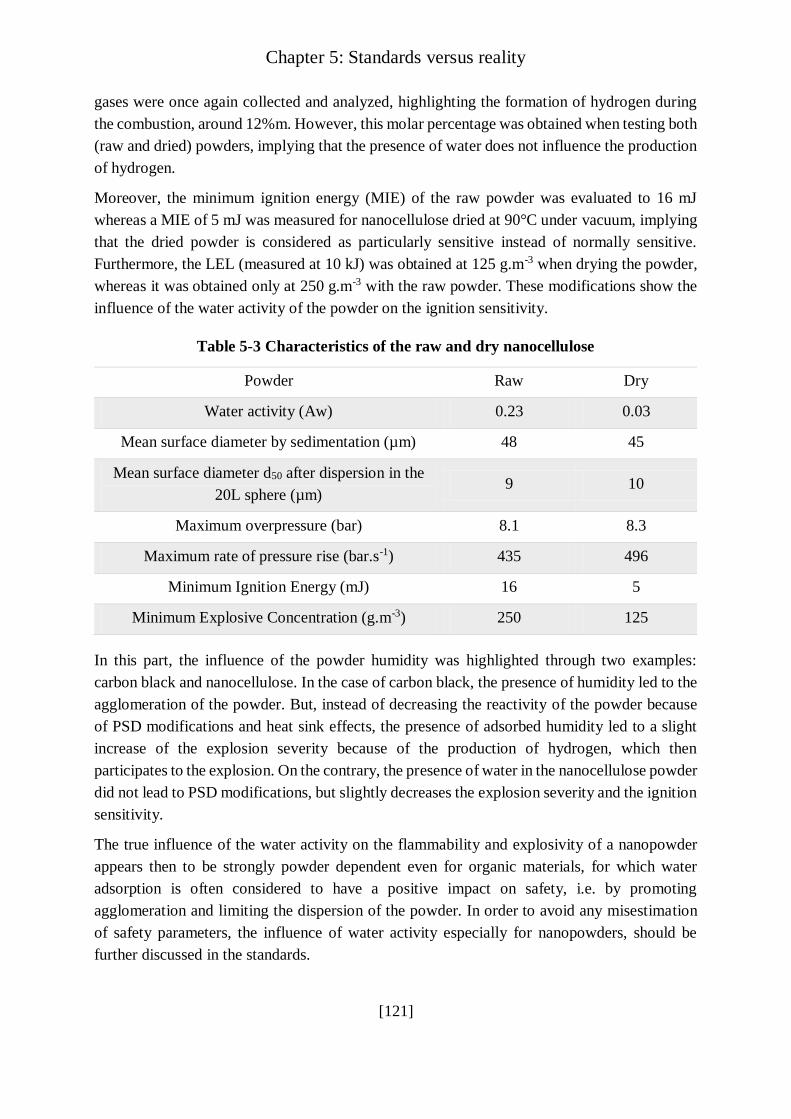
Chapter 5: Standards versus reality
[121]
gases were once again collected and analyzed, highlighting the formation of hydrogen during
the combustion, around 12%m. However, this molar percentage was obtained when testing both
(raw and dried) powders, implying that the presence of water does not influence the production
of hydrogen.
Moreover, the minimum ignition energy (MIE) of the raw powder was evaluated to 16 mJ
whereas a MIE of 5 mJ was measured for nanocellulose dried at 90°C under vacuum, implying
that the dried powder is considered as particularly sensitive instead of normally sensitive.
Furthermore, the LEL (measured at 10 kJ) was obtained at 125 g.m-3 when drying the powder,
whereas it was obtained only at 250 g.m-3 with the raw powder. These modifications show the
influence of the water activity of the powder on the ignition sensitivity.
Table 5-3 Characteristics of the raw and dry nanocellulose
Powder Raw Dry
Water activity (Aw) 0.23 0.03
Mean surface diameter by sedimentation (µm) 48 45
Mean surface diameter d50 after dispersion in the
20L sphere (µm) 9 10
Maximum overpressure (bar) 8.1 8.3
Maximum rate of pressure rise (bar.s-1) 435 496
Minimum Ignition Energy (mJ) 16 5
Minimum Explosive Concentration (g.m-3) 250 125
In this part, the influence of the powder humidity was highlighted through two examples:
carbon black and nanocellulose. In the case of carbon black, the presence of humidity led to the
agglomeration of the powder. But, instead of decreasing the reactivity of the powder because
of PSD modifications and heat sink effects, the presence of adsorbed humidity led to a slight
increase of the explosion severity because of the production of hydrogen, which then
participates to the explosion. On the contrary, the presence of water in the nanocellulose powder
did not lead to PSD modifications, but slightly decreases the explosion severity and the ignition
sensitivity.
The true influence of the water activity on the flammability and explosivity of a nanopowder
appears then to be strongly powder dependent even for organic materials, for which water
adsorption is often considered to have a positive impact on safety, i.e. by promoting
agglomeration and limiting the dispersion of the powder. In order to avoid any misestimation
of safety parameters, the influence of water activity especially for nanopowders, should be
further discussed in the standards.

Chapter 5: Standards versus reality
[122]
V.3. Too much is a waste: role of the ignition energy
‘The ignition source comprises two chemical igniters each having an energy of 5 kJ.’
(EN 14034-1-2, 2004; 2006)
As evidenced in chapter 4, section IV.1.4, some nanoparticles exhibit very low ignition energy,
sometimes even lower than 1 mJ (Wu et al., 2010b). However, even for such powders, the
standard ignition energy needed to perform explosion tests in the 20L sphere is 10 kJ (EN
14034-1, 2004; EN 14034-2, 2006). This large difference of energy can lead to an overdriving
phenomenon, which is already known to occur for microparticles and artificially increases the
explosion severity (Going et al., 2000; Zhen and Leuckel, 1997). Since nanoparticles are
generally more ignition sensitive than microparticles (Bouillard et al., 2010; Holbrow et al.,
2010), this phenomenon can be enhanced when evaluating nanoparticles explosion severity.
In order to estimate which ignition energy would be suitable to avoid overdriving, experiments
were conducted with nanocellulose using different ignition energies (Santandrea et al., 2020c).
Two pyrotechnical igniters of 5 kJ were selected, according to international standards, as well
as one igniter of 100J, which is the lowest energy proposed by Fr. Sobbe GmbH for chemical
igniters. The ignition energy was further reduced by using an ignition source composed of two
tungsten electrodes connected to a KSEP 320 system (Kühner AG - 15 kV / 15 mA, i.e. 225 W)
which generates a permanent spark whose energy can be varied through spark duration. An
alternative solution to Kühner software (KSEP7) has been developed in this work in order to
accurately control the ignition delay time when using the permanent spark. Since a huge amount
of powder on the electrodes would inhibit the spark, explosion tests were performed at 500
g.m-3, which is much greater than the minimum explosive concentration LEL (125 g.m-3) and
just below the optimal concentration (750 g.m-3).
Table 5-4 shows the maximum overpressure and rate of pressure rise obtained at this
concentration for each ignition energy. It should be noted that the KSEP software automatically
modifies the values in order to consider the overdriving. However, as shown in Table 5-4, this
correction is not sufficient. Indeed, it appears that, with regard to the experimental
reproducibility, similar values were reached when using an electrical spark delivering 10J and
chemical igniters of 100 J, meaning that no overdriving phenomenon occurred at these low
energies. However, when compared to the values obtained with lowest energies, the use of 10
kJ chemical igniters increases the overpressure of around 20% and the rate of pressure rise of
40%. The contribution of ignition energy to the explosion severity through the modification of
the flame propagation can thus lead to a misestimation of the explosion severity, since the flame
kernel growth is directly affected by the ignition source. A solution may be to set a maximum
difference between the minimum ignition energy of the powder and the actual ignition energy
used in explosion tests to limit this phenomenon. An alternative solution would be to better
assess the explosion severity increase, especially the maximum explosion pressure, due to
overdriving in order to withdraw it more accurately from the experimental results.
Chapter 5: Standards versus reality
[123]
Table 5-4 Explosion characteristics of 500 g.m-3 of nanocellulose as a function of ignition
energy (corrected values from KSEP 7.1)
Ignition energy 10 J (electrical
spark)
100 J (chemical
igniter)
10 kJ (chemical
igniters)
Overpressure Pm
(bar) 6.5 ± 0.3 6.1 ± 0.3 7.8 ± 0.4
Rate of pressure rise
(dP/dt)m (bar.s-1) 210 ± 25 200 ± 24 345 ± 41
V.4. Too sensitive or too violent: some considerations on pre-
ignition
‘If other dust dispersing systems than those described are used, a propagation of the
explosion from the explosion vessel into the dust container cannot be excluded’.
(EN 14034-1-2, 2004; 2006)
Metallic nanoparticles are generally recognized to be very ignition sensitive (Martin et al.,
2018; Wu et al., 2010b) and can spontaneously ignite when exposed to air (Krietsch et al., 2015;
Mohan et al., 2012; Wu et al., 2014) or when injected in an experimental setup. When a powder
ignites before the ignition source has been triggered, this phenomenon is called ‘pre-ignition’.
Various authors have already encountered it when testing titanium (Boilard et al., 2013) and
aluminum (Dufaud et al., 2011; Santandrea et al., 2019b). Thus, some modifications in the 20L
sphere were proposed in order to avoid this drawback (Krietsch et al., 2013; Santandrea et al.,
2019b; 2019c). However, such changes require an accurate understanding of the pre-ignition
phenomenon and further investigations were especially performed on the aluminum 40-60 nm
(Santandrea et al., 2020c). This powder was stored under argon and exposed to ambient air only
a few minutes before performing the experiments, during the sample preparation. Tests were
carried out according to EN 14034 standards, and led to the observation of alumina in the dust
container for concentrations of 500, 750 and 1000 g.m-3 (Figure 5-17), which, in a first sight,
seems to testify of the so-called famous pre-ignition phenomenon.

Chapter 5: Standards versus reality
[124]
Figure 5-17 Evolution of explosion characteristics of aluminum nanopowder in standard
conditions (10 kJ - 60 ms)
One possible adjustment of the operating conditions consists in removing the oxygen from the
dust container and injecting the powder with pure nitrogen. The sphere was then enriched with
oxygen after vacuuming to obtain atmospheric composition after powder injection, at the time
of the explosion. However, for concentrations greater than 250 g.m-3, explosion started long
before the activation of the igniters, about 15 ms after the beginning of the dust injection,
meaning the aluminum spontaneously ignited when in contact with the oxygen enriched
atmosphere. The final pressure, obtained after total cooling of the sphere using the double
jacket, was recorded when stabilized. It appears that the final pressure is always lower than the
atmospheric pressure (Figure 5-18). Indeed, the combustion of aluminum mainly consists in the
production of solid alumina generated from the reaction between solid aluminum and gaseous
oxygen, thus decreasing the global pressure in the vessel due to oxygen consumption.
Therefore, by assuming that nitrogen is inert and that all the oxygen from air was consumed, a
final pressure of around 0.8 bara should be obtained in the case of a total reaction. However,
when using nitrogen injection, it appears that the final pressure is below this value for
concentrations of 500 and 750 g.m-3, reaching respectively 0.73 and 0.74 bara. This observation
implies that a nitridation reaction, possible at high pressure and temperature (2800K) (Kwon et
al., 2003; Loryan and Borovinskaya, 2003), certainly occurred, possibly during the
pressurization, and generates aluminum nitrides. AlN cannot be oxidized due to the lack of
oxygen, already partially consumed, and to kinetic limitation caused by rapid condensation and
encapsulation of gaseous AlN (Kwon et al., 2003). Such phenomenon is certainly also
observable for Al microparticles, but is promoted for nanopowders due to their high specific
surface area and increased reactivity.

Chapter 5: Standards versus reality
[125]
Figure 5-18 Pressure after explosion and cooling of the sphere at different aluminum
nanopowder concentrations for standard injection and nitrogen injection.
So, for concentrations corresponding to the maximum explosion severity, for instance at
750 g.m-3, alumina was observed in the dust container both for air and pure nitrogen injection.
However, when analyzing the pressure-time evolution for both injection types, it appears that
different pressure profiles are observable (Figure 5-19). During a standard air injection, a
‘normal’ pressure-time graph was obtained (Figure 5-19a); whereas an early explosion clearly
occured a few milliseconds after the beginning of the dust injection when using nitrogen
injection. In the latter case, the explosion took place as soon as the aluminum was in contact
with the oxygen enriched atmosphere and long before the activation of the igniters (Figure
5-19b). A rather similar trace was obtained by Boilard et al. (2013) with nano-Ti injected under
air. It then appears that, in our case, the presence of alumina in the dust container during
standard injection cannot be explained by a ‘pre-ignition’ phenomenon since the explosion
occurred only after the activation of the igniters. To confirm this interpretation, standard
injections of 750 g.m-3 of aluminum nanopowders were performed without activating the
chemical igniters in the sphere and, as expected, no explosion occurred.
Figure 5-19 Pressure-time evolution of an aluminum explosion at 750 g.m-3 with a) air
injection b) nitrogen injection.
Chapter 5: Standards versus reality
[126]
To clarify what happened in the dust container and explain the presence of alumina with air
injection, measurements were performed using an oscilloscope to estimate the closing delay of
the electrovalve, for ignition delays of 60 ms and 120 ms. It appears in Figure 5-20a that, for
an ignition delay of 60 ms, the ignition starts before the electrovalve begins to close, enabling
the flame to possibly go back to the dust container. Figure 5-20b shows that the opening delay
of the electrovalve is independent of the ignition delay. At this point, it should be underlined
that EN 14034-2 (2006) standard specifies that the electrovalve should open in less than 10 ms
but no clear instructions on the closing time are provided. Nevertheless, this work notably
proposes an alternative to the fast-acting valve, provided that its opening time is lower than 100
ms, which is significantly greater than 60 ms.
Figure 5-20 Electrical signal of the electrovalve (blue lower curve) and of the ignition
(yellow upper curve) for ignition delay times of a) 60 ms and b) 120 ms
From this knowledge, since explosions involving metallic nanoparticles demonstrate a high
severity and a fast flame propagation, the assumption of an explosion occurring in the sphere
and reaching back the dust container seems more likely than that of a pre-ignition during the
powder injection. To confirm this hypothesis, standard experiments with an ignition delay time
of 70 ms instead of 60 ms were performed, which allows the electrovalve to close before the
flame reaches the bottom of the sphere. It should be added that such tv variation has only a
small influence on the turbulence and will not sensitively impacts the flame propagation speed.
After the tests, no alumina was observed in the dust container, consolidating the hypothesis of
the flame coming back to the dust container. Thus, to accurately evaluate the explosion severity
of very explosive powders, especially metal nanopowders, it appears essential that the
electrovalve closes well before the activation of the igniters, by modifying its actuation
parameters or by increasing the ignition delay time of several milliseconds. Nevertheless, a too
large increase of tv may change the dust cloud turbulence and may probably reduce the
explosion severity. Finally, it should be noted that the existence of this phenomenon does not
question the existence of a ‘real’ pre-ignition, i.e. ignition during the pressurization, which was
frequently reported (Wu et al., 2010b).
Chapter 5: Standards versus reality
[127]
V.5. Scattering little things: nanopowders dispersion in the 20L
sphere
‘For testing, the dust is dispersed into the sphere from a pressurized dust container via the
fast-acting valve and a rebound nozzle’
(EN 14034-1-2, 2004; 2006)
V.5.1. Nozzle modification
Symmetric nozzle
The influence of the dispersion system, including the outlet valve, on the PSD and homogeneity
of the dust cloud greatly depends on the nature of the powders (Bagaria et al., 2016; Sanchirico
et al., 2015). If this statement is true for microparticles, it is probably even more significant for
nanoparticles. Indeed, due to their strong Van der Waals interactions, nanopowders exhibit
agglomeration phenomenon and these structures tend to break during their dispersion, widening
the particle size distribution (Bagaria et al., 2016). The inertial effects are obviously weaker on
a nanoparticle than on a microparticle or an agglomerate which leads to a segregation
phenomenon and modifies the dispersion dynamics. Wengeler and Nirschl (2007) showed that
nanoparticles and microparticles exhibit different dispersion properties and that no complete
dispersion of primary particles can be achieved.
When performing explosion tests in the 20L sphere, EN 14034 standards recommend the use
of the rebound nozzle to disperse the powder (Figure 5-21a). Nevertheless, several alternatives
were proposed by other authors to disperse the powder adequately and reduce the heterogeneity
of the dust cloud (Dahoe, 2000; Krietsch et al., 2015). More recently, a new symmetric nozzle
was proposed to improve the experimental reproducibility by increasing the temporal stability
of the nominal dust concentration (Murillo et al., 2018). This new nozzle is based on the
geometry of the standard rebound nozzle for which an axial symmetry has been applied (Figure
5-21b).
Figure 5-21 Schemas of the a) rebound nozzle and b) symmetric nozzle – from Murillo et
al. (2018)
Chapter 5: Standards versus reality
[128]
Dispersion and explosion tests were carried out in the 20L using the rebound nozzle and the
symmetric nozzle with various nanopowders, notably on carbon black (Santandrea et al., 2019b,
2019c). In situ particle size distribution measurements using the laser diffraction sensor (Helos,
Sympatec) showed that similar breakage of the agglomerates occurred when performing tests
with the rebound or the symmetric nozzle. Indeed, mean surface diameters of 4.7µm and 3.5µm
were respectively measured. Since both nozzles led to similar PSD after dispersion of carbon
black, the potential differences in the explosion severity can be attributed to different turbulence
level and homogeneity in the 20L sphere.
Figure 5-22 shows that the maximum explosion pressure is not modified by changing the
dispersion nozzle, and thus is not affected by the dust cloud turbulence. However, the rate of
pressure rise of carbon nanoparticles greatly varies as a function of the nozzle. Indeed, the
maximum rate of pressure rise reaches 250 bar.s-1 with the rebound nozzle, which generates a
greater level of turbulence than the symmetric nozzle, for which a maximum rate of pressure
rise of 173 bar.s-1 was obtained. Consequently, the rebound nozzle seems to deliver most
conservative results though results can be quite poorly reproductible. Dispersing the powder
through a symmetric nozzle delivers lower values of explosion severity parameters and then
does not correspond to the worst-case scenario, but allows a better experimental reproducibility
(Murillo et al., 2018).
Figure 5-22 Evolution of the a) overpressure and b) rate of pressure rise with the
concentration of carbon black using the rebound and symmetric nozzles
Slotted and perforated cylindrical nozzles
Although the rebound nozzle provides the most critical values of explosion severity parameters,
the dispersion induced by this nozzle is not able to represent the diversity of the dispersion
scenarios during an accident. Several scenarios could then be considered, such as the dispersion
of powder layers by a turbulent flow or dust lifting in an enclosed conveyor, for instance. In
this case, the most representative procedure would be to place the powder directly in the
explosion chamber, which will be discussed in section V.5.2. Although dust lifting corresponds

Chapter 5: Standards versus reality
[129]
to representative conditions in industries, other dispersion ways can be considered. In particular,
a crack can appear on a pressurized pipe, thus inducing a very high shear stress which may
break agglomerates. To assess the PSD modification and the explosion severity under such
conditions, a new nozzle presented in Figure 5-23a was designed. It is constituted of a cylinder
of 40 mm high and 26.7 mm diameter, that ends by a half-sphered shape equipped with a linear
slot of 3 mm on 17 mm. Obviously, trying to get a homogeneous cloud in the sphere with this
type of nozzle is illusory. Subsequently, a second nozzle was designed to evaluate the
fragmentation of agglomerates passing through a similar nozzle with the same ejection surface
more uniformly distributed. This second nozzle, represented in Figure 5-23b, is equipped with
two series of eight circular holes of 2 mm diameter, can be compared to that developed by
Zhang and Zhang (2015), which leads to homogeneous dispersion in the explosion vessel.
Figure 5-23 Representation of the a) slotted cylindrical nozzle and b) perforated cylindrical
nozzle (dimensions in mm)
In situ PSD measurements were performed with the different nozzles and compared to the
measurements obtained with the rebound nozzle (Figure 5-24). Despite a different signal
intensity, the two new nozzles lead apparently to a similar particle size distribution, with a slight
shift toward small particles when compared to the standard rebound nozzle.
Figure 5-24 Effect of the nozzle on the particle size distribution of nanocellulose particles
60 ms after dispersion

Chapter 5: Standards versus reality
[130]
Even if it is difficult to fully investigate this aspect without knowing the whole PSD, the
fragmentation induced by the two new nozzles seems stronger than with the rebound nozzle,
although the dust cloud is less homogeneous due to the vertical shape of the new nozzles.
Indeed, whereas the mean diameter d50 obtained with the rebound nozzle is stable a few
milliseconds after dispersion, it stabilized only 80 ms after dispersion with the two other
nozzles. The high turbulent kinetic energy generated by such nozzles can also be responsible
of re-agglomeration after a few milliseconds as shown by the apparition of a second peak around
20 µm.
Explosions tests were also performed in standard conditions, apart from the nozzle variation.
The different turbulence conditions along with the different homogeneity and PSD impact the
explosion severity, as presented in Table 5-5. Although the number of tests performed is too
small to obtain a reliable margin of error for the new nozzles, it appears that similar maximum
overpressures were obtained in each case, implying that equivalent amounts of dust reacted
during the explosion. However, the maximum rate of pressure rise increases of about 37% when
using these new nozzles (perforated and slotted), which traduces an impact on the reaction
kinetics and flame propagation dynamics. As the impact of the new nozzles on the PSD of the
dust cloud exists, but does not apparently seem to be significant, such rise of explosion severity
may be attributed to an increase of the turbulence at 60 ms. Finally, the standardized procedure
applied for dispersing nanopowders in the 20L sphere does not automatically lead to the most
conservative results, notably in terms of maximum rate of pressure rise. Other injection methods
may then be considered for nanopowders. More specifically, a dispersion by dust lifting, i.e. by
placing the dust directly on the nozzle within the sphere, was investigated in the next section.
Table 5-5 Influence of the nozzle on the maximum overpressure and maximum rate of
pressure rise of nanocellulose (tv = 60 ms)
Ignition energy Rebound nozzle Perforated
cylindrical nozzle
Slotted cylindrical
nozzle
Maximum overpressure
Pmax (bar)
8.35 ± 0.05 8.0 7.9
Maximum rate of pressure
rise (dP/dt)max (bar.s-1)
496 ± 12 792 786
V.5.2. Injection procedure
First of all, dispersion tests were performed on carbon black to highlight the influence of both
the injection procedure and the outlet valve on the PSD. Measurements were then performed
under different conditions: a standard injection with the rebound nozzle, a standard injection
without nozzle, and a ‘dust lifting’ without nozzle. In this latter configuration, the dust is placed
directly at the bottom of the sphere and does not undergo the pressurization step in the 0.6L

Chapter 5: Standards versus reality
[131]
chamber nor the injection through the electrovalve. It appears in Figure 5-25 that the dispersion
by dust lifting without nozzle presents fewer fine particles (< 3 µm) than the dispersion by
standard injection through the electrovalve, with or without nozzle. Then, it seems that an
important part of the fragmentation of the agglomerates is not related to the presence of the
rebound nozzle but occurs during the injection within the sphere, which was already confirmed
by Kalejaiye et al. (2010) and to a lesser extent Bagaria et al. (2016). However, the latter authors
also stressed that the cloud turbulence and dispersion nozzle play a major role in particle
breakage, in particular in their 36-L explosion apparatus, which may be due to a weaker shear
stress during the dust injection. To sum up, it seems that the high shear stress induced by the
pressure difference between the combustion chamber and the pressurized dust container is the
main cause of the agglomerate breakage and that the ‘standard’ rebound nozzle does not appear
to play a main role in this phenomenon.
Figure 5-25 Effect of the injection procedure on the particle size distribution of carbon
black nanoparticles at the moment of ignition (tv = 60 ms)
Particle Image Velocimetry (PIV) measurements (see section III.2.3) were conducted in the
20L sphere to determine the evolution of the turbulence level with time within the apparatus in
four different configurations: standard injection with the rebound and symmetric nozzles, and
dust lifting also with both nozzles. It appears in Figure 5-26 that the four configurations led to
rather similar values of root-mean square velocities, decreasing from around 10 m.s-1, measured
10 ms after dust dispersion, to 3.5 m.s-1, obtained after 140 ms. Nevertheless, in the transition
zone, from 60 ms to 120 ms, the injection of the dust through the container and the rebound
nozzle seems to induce a higher turbulence than the other dispersion procedures, notably the
dust lifting on the symmetric nozzle. Moreover, in this last case, the root-mean square velocity
stabilizes 80 ms after the dust dispersion, which can be due to a better homogeneity within the
sphere.

Chapter 5: Standards versus reality
[132]
Figure 5-26 Evolution of the root-mean square velocity with time after dispersion for
different dispersion procedures
Explosion tests were performed on the aluminum powder with a primary diameter of 100 nm,
using the four different configurations of powder injection (Santandrea et al., 2019b). In Figure
5-27, it is clearly visible that, whatever the configuration tested and the concentration, the
standard procedure (rebound nozzle and standard injection) always leads to the most severe
explosion characteristics. It should be noted that dispersion tests on aluminium using the four
dispersion procedures led to similar mean surface diameter, around 3 µm.
The maximum overpressure of the aluminium nanoparticles varies as a function of the injection
mode (Figure 5-27a), which raises the question of the full conversion of the powder. Especially
in the case of dust lifting with the symmetric nozzle, Pm decreases at 5.4 bars whereas it reaches
6.5 bars at 750 g.m-3 when the standard procedure is applied. This assertion is confirmed by
collecting the dust after combustion at the bottom of the 20 L sphere, where grey crusts
composed of both alumina and aluminum can be observed after dispersion by dust lifting.
However, the same tests carried out on the carbon black nanopowder led to similar overpressure
values whatever the dispersion procedure. Indeed, the efficiency of the dust dispersion varies
with the dust density and agglomeration level, which limits the reliability of this lifting
procedure. It is worth noting that the LEL is not significantly modified by the various
procedures.
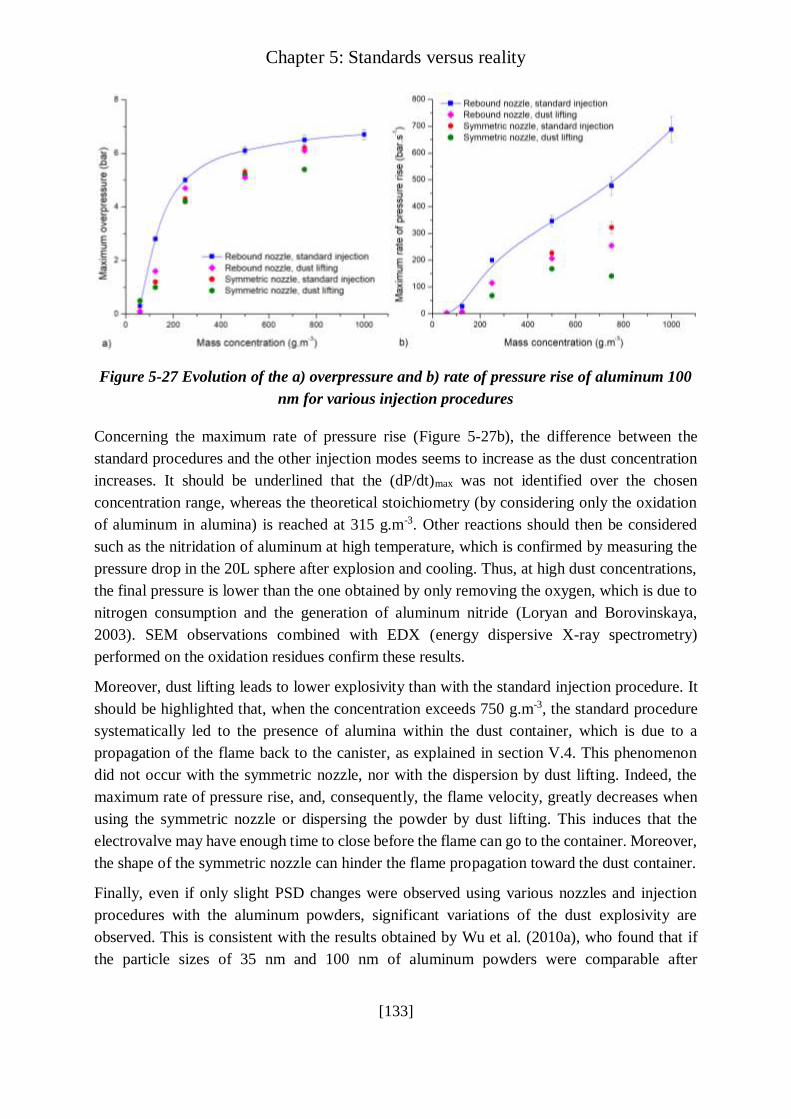
Chapter 5: Standards versus reality
[133]
Figure 5-27 Evolution of the a) overpressure and b) rate of pressure rise of aluminum 100
nm for various injection procedures
Concerning the maximum rate of pressure rise (Figure 5-27b), the difference between the
standard procedures and the other injection modes seems to increase as the dust concentration
increases. It should be underlined that the (dP/dt)max was not identified over the chosen
concentration range, whereas the theoretical stoichiometry (by considering only the oxidation
of aluminum in alumina) is reached at 315 g.m-3. Other reactions should then be considered
such as the nitridation of aluminum at high temperature, which is confirmed by measuring the
pressure drop in the 20L sphere after explosion and cooling. Thus, at high dust concentrations,
the final pressure is lower than the one obtained by only removing the oxygen, which is due to
nitrogen consumption and the generation of aluminum nitride (Loryan and Borovinskaya,
2003). SEM observations combined with EDX (energy dispersive X-ray spectrometry)
performed on the oxidation residues confirm these results.
Moreover, dust lifting leads to lower explosivity than with the standard injection procedure. It
should be highlighted that, when the concentration exceeds 750 g.m-3, the standard procedure
systematically led to the presence of alumina within the dust container, which is due to a
propagation of the flame back to the canister, as explained in section V.4. This phenomenon
did not occur with the symmetric nozzle, nor with the dispersion by dust lifting. Indeed, the
maximum rate of pressure rise, and, consequently, the flame velocity, greatly decreases when
using the symmetric nozzle or dispersing the powder by dust lifting. This induces that the
electrovalve may have enough time to close before the flame can go to the container. Moreover,
the shape of the symmetric nozzle can hinder the flame propagation toward the dust container.
Finally, even if only slight PSD changes were observed using various nozzles and injection
procedures with the aluminum powders, significant variations of the dust explosivity are
observed. This is consistent with the results obtained by Wu et al. (2010a), who found that if
the particle sizes of 35 nm and 100 nm of aluminum powders were comparable after
Chapter 5: Standards versus reality
[134]
agglomeration, yet their explosive parameters were different. The following assumptions can
be proposed:
i) The slight PSD modifications and notably the presence of fine particles with
diameters lower than 1 m, which cannot be seen by the laser diffraction sensor,
have a noticeable impact on the evolution of the reactive specific surface area,
ii) The same modification have also an effect on the particles optic emissivity, which
decreases as the size of the observed particles decreases towards nanosized particles
(Sundaram et al., 2013, 2016),
iii) The injection procedure changes the dust cloud homogeneity within the sphere,
which can influence the flame propagation and the radiative transfer (Cassel et al.,
1957),
iv) The use of different nozzles implies changes in the initial turbulence level (Figure
5-26), parameter impacting the flame kernel growth and flame front propagation
(Proust, 2006).
To sum up, dispersing the powder by dust lifting impacts both the PSD (Figure 5-25) and the
initial turbulence (Figure 5-26). Modifications on the overpressure and rate of pressure rise of
aluminum were also observed. Although not leading to the most conservative results, this
method seems more representative of an accidental dispersion than the injection through the
electrovalve and the rebound nozzle. Moreover, this dispersion method can be used to evaluate
the explosion severity of very sensitive metallic nanopowders in the most critical conditions,
i.e. minimizing the oxidation of the powder before the explosion tests, and to avoid pre-ignition
phenomenon (Krietsch et al., 2013). However, as shown on aluminum, this procedure does not
allow a complete dispersion of very dense powders, such as metallic ones. Therefore, a new
‘mushroom nozzle’ was designed by Krietsch et al. (2013) to adequately disperse the powder
within the sphere. This nozzle could then be considered as a potential alternative to the standard
rebound nozzle, which does not provide results representative of industrial conditions nor the
most conservative ones (see section V.5.1).
V.6. Punctuality is the politeness of kings: influence of the ignition
delay time
‘Ignition delay tv: time between the initiation of the dust dispersion and activation of the
ignition source. […] In the 20L sphere, ignition delay time tv = 60 ms’
(EN 14034-1-2, 2004; 2006)
It is common knowledge that the initial turbulence within the sphere varies as a function of time
(Amyotte et al., 1988; Dahoe et al., 2001; Zhen and Leuckel, 1997). Indeed, as explained in
chapter 3 (section III.2.3), right after the injection, the turbulence level is high and decreases
with time through three stages: high turbulence and heterogeneity of the cloud (from 0 to 40

Chapter 5: Standards versus reality
[135]
ms), transient stage (from 40 to 120 ms) and a stability stage from 120 ms (Murillo et al., 2018;
Santandrea et al., 2019b). This tendency is represented in Figure 5-28a by the red points.
According to ASTM E1226-19 (2019) and EN 14034-1-2 (2004; 2006), the standard ignition
delay time tv is 60 ms, which means that the igniters activation occurs 60 ms after the beginning
of the injection. This standard value is then located in the second phase, which is the transient
phase characterized by a significant decrease of the velocity fluctuations.
The parameter tv, set in the KSEP software, can be modified, but it also changes the injection
dynamic, as shown in Figure 5-28b, which presents the pressure increase in the 20L sphere
during the dust injection (from 0.4 bara to atmosphere pressure). If the ignition delay time is
below 60 ms, the injection is faster, which leads to greater heterogeneities within the cloud and
a lower stability. For tv above this value, the injection is still made in 60 ms. However, the red
points in Figure 5-28a were obtained by studying the evolution of the root-mean square velocity
with time after dust dispersion for an ignition delay time set to 60 ms. Particle Size Velocimetry
(PIV) measurements were then conducted by modifying this value and evaluating the
turbulence level of the cloud at the moment of the ignition for different tv (blue points in Figure
5-28a). Therefore, the blue point at 20 ms corresponds to the root-mean square velocity
measured 20 ms after dispersion with an ignition delay time set to 20 ms. It then appears that,
during the transition stage, for ignition delay times close to 60 ms, there is no significant
difference in the turbulence level compared to the standard (60, 90 and 120 ms). However, for
the two other stages, there is a slight difference both in the turbulence and heterogeneity of the
dust cloud.
Figure 5-28 a) Time evolution of the root-mean-square velocity within the 20L sphere
during a standard injection for various ignition delay times b) Modifications of the
injection dynamic for various ignition delay times
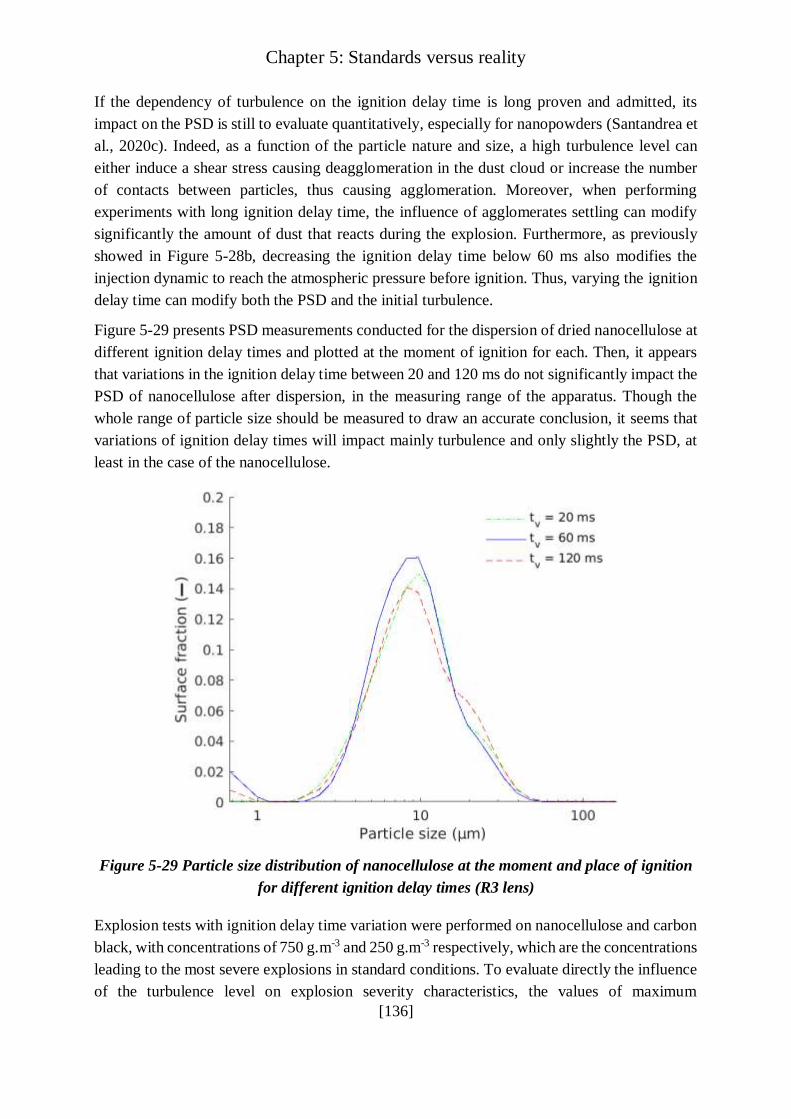
Chapter 5: Standards versus reality
[136]
If the dependency of turbulence on the ignition delay time is long proven and admitted, its
impact on the PSD is still to evaluate quantitatively, especially for nanopowders (Santandrea et
al., 2020c). Indeed, as a function of the particle nature and size, a high turbulence level can
either induce a shear stress causing deagglomeration in the dust cloud or increase the number
of contacts between particles, thus causing agglomeration. Moreover, when performing
experiments with long ignition delay time, the influence of agglomerates settling can modify
significantly the amount of dust that reacts during the explosion. Furthermore, as previously
showed in Figure 5-28b, decreasing the ignition delay time below 60 ms also modifies the
injection dynamic to reach the atmospheric pressure before ignition. Thus, varying the ignition
delay time can modify both the PSD and the initial turbulence.
Figure 5-29 presents PSD measurements conducted for the dispersion of dried nanocellulose at
different ignition delay times and plotted at the moment of ignition for each. Then, it appears
that variations in the ignition delay time between 20 and 120 ms do not significantly impact the
PSD of nanocellulose after dispersion, in the measuring range of the apparatus. Though the
whole range of particle size should be measured to draw an accurate conclusion, it seems that
variations of ignition delay times will impact mainly turbulence and only slightly the PSD, at
least in the case of the nanocellulose.
Figure 5-29 Particle size distribution of nanocellulose at the moment and place of ignition
for different ignition delay times (R3 lens)
Explosion tests with ignition delay time variation were performed on nanocellulose and carbon
black, with concentrations of 750 g.m-3 and 250 g.m-3 respectively, which are the concentrations
leading to the most severe explosions in standard conditions. To evaluate directly the influence
of the turbulence level on explosion severity characteristics, the values of maximum

Chapter 5: Standards versus reality
[137]
overpressure and maximum rate of pressure rise presented in Figure 5-30 are plotted against
the root-mean square velocity for ignition delay times from 20 ms to 200 ms. Since the PIV
measurements were only conducted until 150 ms, the relation between ignition delay time and
root-mean square velocity proposed by Dahoe et al. (2001) was used.
In Figure 5-30a, it appears that the maximum overpressure increases for both powders when
slightly increasing the initial turbulence level in the combustion chamber, until reaching
maximum values of 7.0 ± 0.2 bar at 3.5 m.s-1 i.e. 60 ms, for the carbon black and of 8.4 ± 0.3
bar at 1.5 m.s-1 i.e. 100 ms, for the nanocellulose. This increase is due to the promoting effect
of a moderate turbulence, which tends to improve the mass transfer by increasing the flame
stretching and thus enhancing the flame propagation. It should be added that, at very low
turbulence levels, the influence of the sedimentation of bigger particles or agglomerates should
be taken into account as it can induce a more heterogeneous distribution of powders in the
sphere. Conversely, at high turbulence (> 6 m.s-1), an intense flame stretching occurs. It
improves the mass transfer and has a positive impact on the combustion kinetics, which is
clearly visible in Figure 5-30b. Indeed, although diffusional limitation is unlikely to be observed
when testing nanoparticles, such limitation is expected for organic micro-agglomerates (Dufaud
et al., 2012). Finally, it should be kept in mind that a too high turbulence level can also lead to
micro-scale flame quenching.
Figure 5-30 Evolution of a) the maximum overpressure and b) the maximum rate of
pressure rise with the root-mean square velocity in the 20L sphere
Combustion gases were collected and analyzed by gas chromatography, studying specifically
the ratio CO/CO2 (Figure 5-31). This ratio is higher than unity for ignition delay times lower
than 100 ms, i.e. root-mean square velocities higher than 1.5 m.s-1, and decreases for higher
ignition delay times for both powders. Although this ratio does not significantly vary for
nanocellulose, a significant decrease is observed for carbon black, from 5.7 at 15 m.s-1 to 0.6 at
1 m.s-1. This evolution notably reflects the quenching occurring at high turbulence identified
when studying the maximum overpressure (Figure 5-30a). Furthermore, it shows that,
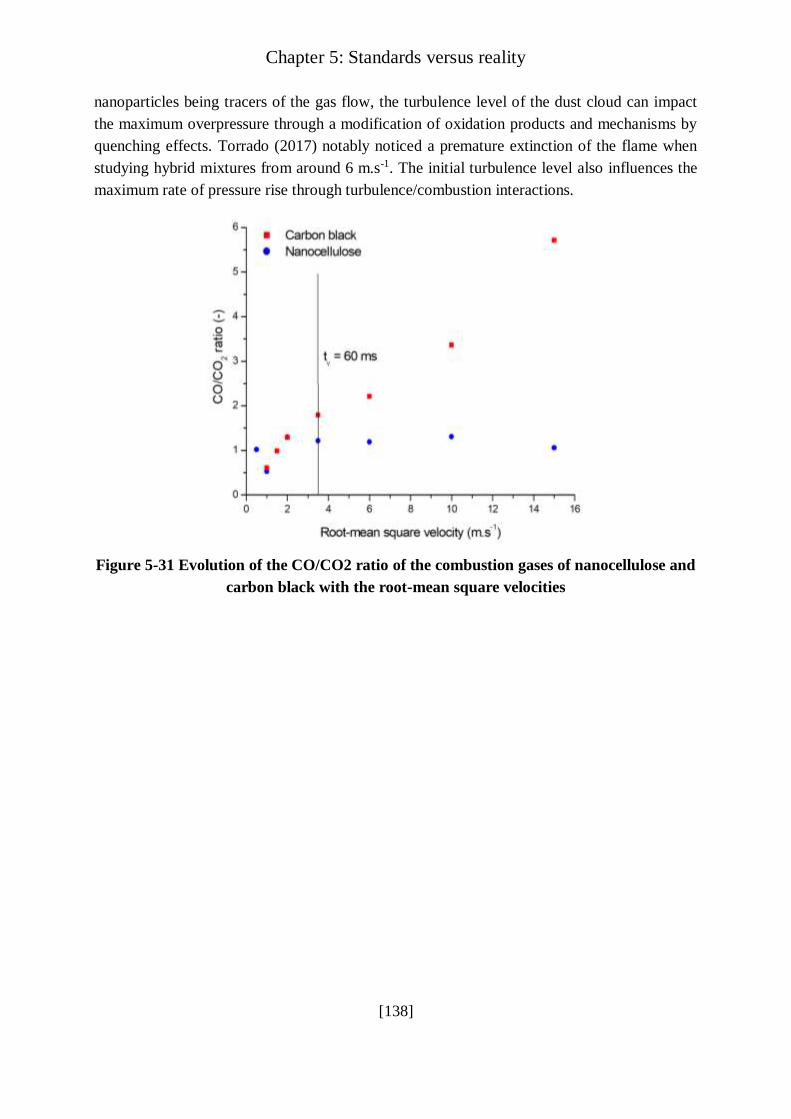
Chapter 5: Standards versus reality
[138]
nanoparticles being tracers of the gas flow, the turbulence level of the dust cloud can impact
the maximum overpressure through a modification of oxidation products and mechanisms by
quenching effects. Torrado (2017) notably noticed a premature extinction of the flame when
studying hybrid mixtures from around 6 m.s-1. The initial turbulence level also influences the
maximum rate of pressure rise through turbulence/combustion interactions.
Figure 5-31 Evolution of the CO/CO2 ratio of the combustion gases of nanocellulose and
carbon black with the root-mean square velocities

Chapter 5: Standards versus reality
[139]
Summary
Nanopowders specificities (e.g. low sedimentation rate, agglomeration, high surface area, etc.)
induce explosive behaviors that are sometimes different from that observed for micropowders
or, more generally, lead to exacerbated trends. As a consequence, in addition to safety issues
inherent in handling nanopowders, standards could be refined so that cautious approaches are
considered when performing the tests. For instance, the following improvements or advices can
be suggested:
i) It should be kept in mind that the PSD of nanopowders will be modified by
deagglomeration during their dispersion, even if existing PSD measurement
methods cannot identify such a shift. Surface PSD will be preferred to volume-based
distribution.
ii) Alternative nozzles allow to reach higher explosion severities. Since standards
objective is not to reproduce the exact industrial conditions, and that the standard
nozzle does not always lead to the most conservative results, priority should focus
on the reliability of the results by choosing nozzles providing a better cloud
homogeneity.
iii) The ignition source should be adapted to the low minimum ignition energy of the
nanopowders in order to avoid overdriving or, at least, this phenomenon should be
better considered by assessing the additional energy given to the dust cloud.
iv) Pre-ignition of very sensitive nanopowders in the dust container can be avoided by
injecting them under nitrogen (but spontaneous ignition still can occur in the sphere)
or by using dust lifting as for MIE determination. However, as a result of their high
flame speed propagation, the opening time of the electrovalve should be reduced to
avoid a ‘backfire’ in the container or the delay tv should be adapted.
v) Variations of the ignition delay time can be helpful to obtain the most conservative
results. However, a too low turbulence level (e.g. < 2 m.s-1) can lead to agglomerate
sedimentation, whereas a too high turbulence level (e.g. > 6 m.s-1) can induce
alternative combustion mechanisms.
vi) Special attention must be paid to the nanopowders storage conditions and to the
humidity of the ambient and injection air. Indeed, the presence of water can modify
the flammability and explosivity of the powder depending on its nature and its
ability either to react with the water.
Finally, the results obtained must be transposed on an industrial scale, with the same limitations
inherent to the cube-root law as those encountered for micropowders. An alternative approach
would be to use the advantages of nanopowders, in particular their low sedimentation rate, to
determine their laminar flame velocity, which is an intrinsic parameter that can be used as an
input for CFD simulations. The next chapter is then dedicated to the evaluation of this
parameter, notably on nanocellulose.

Chapter 5: Standards versus reality
[140]
Résumé
Les spécificités des nanopoudres (agglomération, propriétés d’adsorption, grande surface
spécifique, etc.) induisent un comportement explosif parfois différent de celui observé pour les
poudres micrométriques, ou, plus généralement, conduit à des tendances exacerbées. Ce
chapitre est donc dédié à mettre en lumière ce genre de tendances à travers six parties et
l’exemple de quatre poudres de différentes natures. Par exemple, les améliorations suivantes
peuvent être suggérées :
i) Il est important de garder en mémoire que la distribution de tailles de particules
(DTP) des poudres nanométriques est modifiée par désagglomération durant la
dispersion, même si les techniques de mesures de DTP actuelles ne permettent pas
de quantifier ce décalage. La DTP sera préférentiellement exprimée en surface à la
place de la distribution volumique.
ii) Des disperseurs alternatifs permettent d’atteindre des valeurs plus élevées de
sévérité d’explosion. Puisque l’objectif des standards n’est pas de reproduire les
conditions industrielles, et que le disperseur standard ne mène pas systématiquement
aux résultats les plus conservatifs, la priorité devrait être donnée à la fiabilité des
résultats, notamment en choisissant des disperseurs permettant une meilleure
homogénéité du nuage.
iii) La source d’inflammation devrait être adaptée à la faible énergie minimale
d’inflammation des poudres nanométriques afin d’éviter un phénomène dit
‘d’overdriving’, ou, tout du moins, ce phénomène devrait être mieux caractérisé afin
d’estimer l’énergie supplémentaire fournie au nuage pour la combustion.
iv) La pré-inflammation des nanopoudres particulièrement sensibles dans le réservoir à
poussière peut être évitée par une injection sous azote (mais une inflammation
spontanée peut se produire dans la sphère), ou par simple soulèvement de la poudre,
comme pour la détermination de l’énergie minimale d’inflammation. Cependant, du
fait de leur vitesse de propagation rapide, le temps d’ouverture de l’électrovanne
devrait être réduit afin d’éviter un retour de flamme dans le réservoir à poudres, ou
le délai d’inflammation devrait être adapté.
v) Des modifications dans le délai d’inflammation peuvent être utiles afin d’obtenir les
résultats les plus conservatifs possibles. Cependant, un niveau de turbulence trop
faible (e.g. < 2 m.s-1) peut conduire à la ségrégation des agglomérats, tandis qu’un
niveau de turbulence trop élevé (e.g. > 6 m.s-1) peut mener à des mécanismes de
combustion alternatifs.
vi) Une attention particulière doit être porté aux conditions de stockage des
nanopoudres et à l’humidité de l’air ambiant et de l’air d’injection. En effet, la
présence d’eau peut modifier l’inflammabilité et l’explosivité des poudres en
fonction de leur nature et de leur capacité à réagir avec l’eau.
Chapter 5: Standards versus reality
[141]
Finalement, les résultats obtenus doivent être extrapolés à l’échelle industrielle, avec les mêmes
limitations inhérentes à la loi cubique que celles rencontrées pour les poudres micrométriques.
Une approche alternative serait d’utiliser les avantages des nanopoudres, en particulier leur
faible vitesse de sédimentation, afin de déterminer leur vitesse laminaire de flamme, qui est un
paramètre intrinsèque au mélange poussière/air qui peut être utilisé comme donnée d’entrée
pour des codes CFD. Le chapitre suivant est ainsi dédié à l’évaluation de ce paramètre,
notamment pour la nanocellulose.

[142]
Chapter 6:
Flame propagation study

Chapter 6: Flame propagation study
[143]
In the previous chapter, the influence of the operating conditions on the explosion severity
parameters, i.e. the maximum overpressure and maximum rate of pressure rise, was highlighted,
evidencing that the international standards may not be fully adapted, or at least could be greatly
improved to assess the risk of nanoparticles explosion. However, since the process safety
engineer wants to extrapolate the results to his industry and processes, he needs to apply ‘scale-
up’ relationships such as the cube-root law – with all the limitations already described in chapter
2.
Another possibility is to directly determine a parameter depending only on the considered
dust/air mixture. For instance, the laminar burning velocity is an intrinsic property of the fuel-
air mixture, that can be used in advanced simulations (CFD or phenomenological approach) to
evaluate the consequences of an explosion scenario in specific conditions (Figure 6-1). If the
determination of this parameter is possible but difficult for gas/air mixtures (Halter, 2005), it is
far from being obvious for dust/air mixtures. Indeed, the compulsory dust dispersion step is, in
practice, in total contradiction with the term ‘laminar’. Moreover, such determination should
be done with conventional test apparatuses and ‘easy-to-perform’ procedures for
standardization purposes. However, this alternative wat of assessing the explosion risk is
promising, especially with nanopowders, whose specific behavior can be, in this case, a
strength.
Figure 6-1 Representation of the existing methods to assess the explosion risk in an
industrial situation
This chapter is dedicated to the determination of the laminar burning velocity of nanopowders
and is divided into three main parts. Due to the high minimum ignition energy (> 1 J) of the
carbon black (see section IV.1.4) and to the important radiative heat transfer and high explosion

Chapter 6: Flame propagation study
[144]
severity of aluminum (see section IV.2.2) that could respectively disturb the flame visualization
and damage the equipment, focus was realized on the estimation of the laminar burning velocity
of nanocellulose.
First, the burning velocity will be estimated by visualization of the flame propagation in two
apparatuses: a vertical 1 m long tube with a square cross-section and a 20L sphere equipped
with visualization windows and a vent (section VI.1.1). In the section VI.1.2, a semi-empiric
correlation based the pressure-time evolution recorded during standard explosion tests in the
20L vessel is detailed, and the values obtained by the three methods are discussed in section
VI.1.3. The section VI.2 presents a numerical one-dimensional model, initially developed for
hybrid mixtures and adapted to the flame propagation of nanocellulose. The influence of the
radiative heat transfer on the flame propagation will also be discussed. Finally, turbulent
velocity models estimating the burning velocity in specific conditions, as shown in Figure 6-1,
will be applied on the experimental values.
VI.1. Experimental determination
Not trivial for pure gases, the estimation of the laminar burning velocity of dust-air mixtures is
much more difficult to perform than for gases due to the inherent turbulence related to the
powder dispersion. Nevertheless, as mentioned in chapter 2, section II.2.3, experiments were
already conducted using the burner method (Dahoe et al., 2002; Julien et al., 2017; Lomba et
al., 2019; van der Wel, 1993), the contained explosions method (Silvestrini et al., 2008; Skjold,
2003; van der Wel, 1993) and the tube method (Andrews and Bradley, 1972; Cuervo et al.,
2017; Di Benedetto et al., 2011; Proust, 2006). Since those tests were conducted in turbulent
conditions, a numerical extrapolation to a zero degree of turbulence, or a least to a laminar flow,
was required (Bradley et al., 1989).
Despite the great accessibility of these methods, experimental issues remain and usually limit
the reproducibility and accuracy of the results. In addition to be related to the stochastic nature
of turbulence, issues can also come from particle agglomeration, instabilities of the biphasic
flow, set-up fouling or flame front visualization difficulties. However, for specific reactive
mixtures such inconveniences may be limited: for instance, testing gas-dust mixtures with a
low dust concentration, called gas-driven hybrid mixtures (Di Benedetto and Russo, 2007), in
a semi-open tube allowed the determination of their laminar flame velocity and highlighted the
influence of turbulence/combustion interactions on the flame propagation (Cuervo, 2015;
Torrado et al., 2017).
The low inertia of nanoparticles allows tests with very long ignition delay time. Consequently,
experiments can be performed at low turbulence with nanoparticles, while sedimentation would
occur for micropowders under the same experimental conditions. Decreasing the turbulence
level of the initial dust cloud can help approaching the laminar flame velocity of dust-air
mixtures, which is then expected to be independent from turbulence. This concept was
developed through the characterization of the burning velocity of the dried nanocellulose

Chapter 6: Flame propagation study
[145]
powder using three different procedures and set-up (Santandrea et al., 2020a). The first two
procedures consist in a flame propagation visualization in a semi-open tube and a vented vessel
and are presented in section VI.1.1. Then, the laminar burning velocity was calculated using a
correlation based on the pressure-time evolution during an explosion in the 20L sphere, which
is developed in section VI.1.2.
VI.1.1. Flame propagation visualization
The laminar burning velocity was evaluated through the visualization of the flame propagation
in a flame propagation tube and in the modified 20L sphere presented in section III.2.2.3. The
experimental method along with the video analysis and the calculation of the laminar burning
velocity are presented in this section. It should be noted that the term ‘laminar burning velocity’
is employed based on several assumptions, such as a laminar flow in the equipment and the
application of methods designed for gases, implying that the final value is mainly an estimation
of this parameter. This term will be further discussed in section VI.1.1.2.
VI.1.1.1. Experimental method
The first apparatus is a flame propagation tube of 7 x 7 x 100 cm3 open at its upper end and
implementing the ignition system of the modified Hartmann tube, presented in section IV.1.1,
which was coupled with a high-speed video camera at 4000 fps with 240 µs of exposure time
(Phantom V9.1). The equipment and procedure are fully described by Cuervo et al. (2017) and
Torrado et al. (2017) who validated the set-up and procedure with methane and obtained
encouraging results for hybrid mixtures of starch and methane and of carbon black and methane.
However, the small volume, especially around the ignition zone, implies that the flame is
influenced by the walls quite soon after the ignition, which impacts its propagation. Therefore,
the analysis is limited to the first moments of the flame kernel growth (from 5 to 20 ms),
between ignition and the flame spatial acceleration (or sometimes quenching) due to the
presence of the wall. Consequently, in order to increase the volume dedicated to the spherical
flame propagation, a second method was developed to study flame propagation within a
modified 20L sphere.
The 20L sphere developed by Murillo (2016) equipped with four visualization windows was
adapted by Torrado (2017) to perform hybrid mixtures explosion tests and to study the flame
propagation of such mixtures. Therefore, a lateral window was removed to integrate an ignition
source composed of two tungsten electrodes connected to a KSEP 320 system (Kühner AG -
15 kV / 15 mA, i.e. 225 W) generating a permanent spark whose duration, and thus energy, can
be varied. A modification of the Kühner software was necessary to control accurately the
ignition delay time, called ‘tv’, when using the permanent spark. A pressure relief valve,
opening at 1.15 atm, was added on the top of the sphere to protect the windows during the
explosion. This notably allows performing tests at constant and not too high pressure, and thus
to neglect the pressure evolution during the analysis. The flame front and shape are imaged
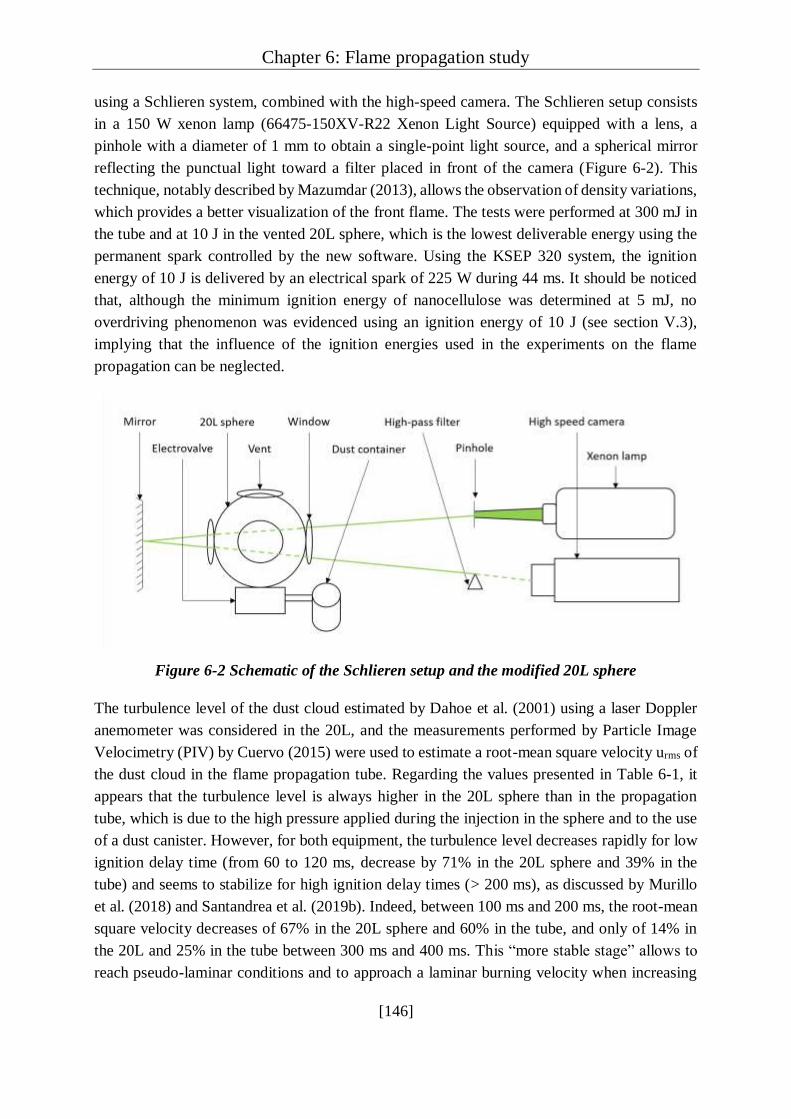
Chapter 6: Flame propagation study
[146]
using a Schlieren system, combined with the high-speed camera. The Schlieren setup consists
in a 150 W xenon lamp (66475-150XV-R22 Xenon Light Source) equipped with a lens, a
pinhole with a diameter of 1 mm to obtain a single-point light source, and a spherical mirror
reflecting the punctual light toward a filter placed in front of the camera (Figure 6-2). This
technique, notably described by Mazumdar (2013), allows the observation of density variations,
which provides a better visualization of the front flame. The tests were performed at 300 mJ in
the tube and at 10 J in the vented 20L sphere, which is the lowest deliverable energy using the
permanent spark controlled by the new software. Using the KSEP 320 system, the ignition
energy of 10 J is delivered by an electrical spark of 225 W during 44 ms. It should be noticed
that, although the minimum ignition energy of nanocellulose was determined at 5 mJ, no
overdriving phenomenon was evidenced using an ignition energy of 10 J (see section V.3),
implying that the influence of the ignition energies used in the experiments on the flame
propagation can be neglected.
Figure 6-2 Schematic of the Schlieren setup and the modified 20L sphere
The turbulence level of the dust cloud estimated by Dahoe et al. (2001) using a laser Doppler
anemometer was considered in the 20L, and the measurements performed by Particle Image
Velocimetry (PIV) by Cuervo (2015) were used to estimate a root-mean square velocity urms of
the dust cloud in the flame propagation tube. Regarding the values presented in Table 6-1, it
appears that the turbulence level is always higher in the 20L sphere than in the propagation
tube, which is due to the high pressure applied during the injection in the sphere and to the use
of a dust canister. However, for both equipment, the turbulence level decreases rapidly for low
ignition delay time (from 60 to 120 ms, decrease by 71% in the 20L sphere and 39% in the
tube) and seems to stabilize for high ignition delay times (> 200 ms), as discussed by Murillo
et al. (2018) and Santandrea et al. (2019b). Indeed, between 100 ms and 200 ms, the root-mean
square velocity decreases of 67% in the 20L sphere and 60% in the tube, and only of 14% in
the 20L and 25% in the tube between 300 ms and 400 ms. This “more stable stage” allows to
reach pseudo-laminar conditions and to approach a laminar burning velocity when increasing
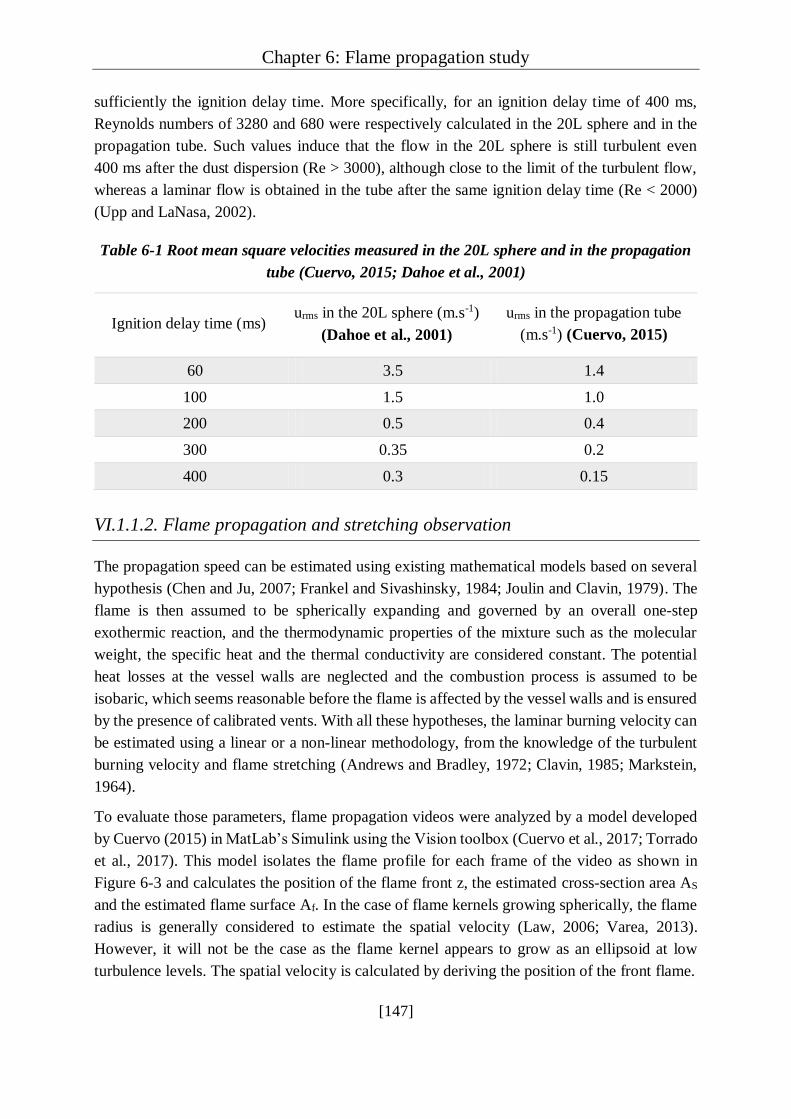
Chapter 6: Flame propagation study
[147]
sufficiently the ignition delay time. More specifically, for an ignition delay time of 400 ms,
Reynolds numbers of 3280 and 680 were respectively calculated in the 20L sphere and in the
propagation tube. Such values induce that the flow in the 20L sphere is still turbulent even
400 ms after the dust dispersion (Re > 3000), although close to the limit of the turbulent flow,
whereas a laminar flow is obtained in the tube after the same ignition delay time (Re < 2000)
(Upp and LaNasa, 2002).
Table 6-1 Root mean square velocities measured in the 20L sphere and in the propagation
tube (Cuervo, 2015; Dahoe et al., 2001)
Ignition delay time (ms) urms in the 20L sphere (m.s-1)
(Dahoe et al., 2001)
urms in the propagation tube
(m.s-1) (Cuervo, 2015)
60 3.5 1.4
100 1.5 1.0
200 0.5 0.4
300 0.35 0.2
400 0.3 0.15
VI.1.1.2. Flame propagation and stretching observation
The propagation speed can be estimated using existing mathematical models based on several
hypothesis (Chen and Ju, 2007; Frankel and Sivashinsky, 1984; Joulin and Clavin, 1979). The
flame is then assumed to be spherically expanding and governed by an overall one-step
exothermic reaction, and the thermodynamic properties of the mixture such as the molecular
weight, the specific heat and the thermal conductivity are considered constant. The potential
heat losses at the vessel walls are neglected and the combustion process is assumed to be
isobaric, which seems reasonable before the flame is affected by the vessel walls and is ensured
by the presence of calibrated vents. With all these hypotheses, the laminar burning velocity can
be estimated using a linear or a non-linear methodology, from the knowledge of the turbulent
burning velocity and flame stretching (Andrews and Bradley, 1972; Clavin, 1985; Markstein,
1964).
To evaluate those parameters, flame propagation videos were analyzed by a model developed
by Cuervo (2015) in MatLab’s Simulink using the Vision toolbox (Cuervo et al., 2017; Torrado
et al., 2017). This model isolates the flame profile for each frame of the video as shown in
Figure 6-3 and calculates the position of the flame front z, the estimated cross-section area AS
and the estimated flame surface Af. In the case of flame kernels growing spherically, the flame
radius is generally considered to estimate the spatial velocity (Law, 2006; Varea, 2013).
However, it will not be the case as the flame kernel appears to grow as an ellipsoid at low
turbulence levels. The spatial velocity is calculated by deriving the position of the front flame.

Chapter 6: Flame propagation study
[148]
Since the laminar flame velocity is independent of the vessel geometry and size, only the phase
of ‘free’ flame kernel propagation is considered, i.e. when the flame is not significantly affected
by the vessel walls, i.e. by the compression of the gases between the kernel and the walls or by
the gas-wall heat transfers. It should be noted that, due to the contribution of the ignition source
and the small size of the initial flame kernel, which can be located -with respect to the camera-
behind unburnt particles, the very first milliseconds of the videos are also often delicate to
analyze. The position of the flame z being known for different times, the spatial velocity of the
flame SS can be deduced.
Figure 6-3 Time evolution of the flame profile in the semi-open tube for a dispersion of 500
g.m-3 of nanocellulose at 340 ms ignition delay time
For a spherical flame propagating in a tube, a mass balance on the unburnt gases can be written:
𝜕𝑚𝑢
𝜕𝑡=
𝜕𝜌𝑢.𝑉𝑢
𝜕𝑡= − 𝜌𝑢 . 𝐴𝑓. 𝑆𝑢 6-1
with mu the mass of the unburnt gases, which decreases with time, ρu the density of the unburnt
gases, Vu the volume of the unburnt gases, Af the flame surface and Su the combustion speed,
i.e. the local flame speed, considered constant. Since the density of the unburnt gases is
constant, one can write:
𝜕𝑉𝑢
𝜕𝑡= −𝐴𝑓 . 𝑆𝑢 6-2
For a spherical flame, the spatial velocity Ss, considered uniform over the whole surface,
according to an axe x can be expressed:
𝜕𝑥
𝜕𝑡= 𝑆𝑠 6-3
Considering a flame kernel growth from the center, the flame section AS that grows on dx can
be introduced as:
𝜕𝑉𝑢
𝜕𝑥= −𝐴𝑠 6-4
The relation 6-3 then becomes:
𝜕𝑉𝑢
𝜕𝑡=
𝜕𝑉𝑢
𝜕𝑥.
𝜕𝑥
𝜕𝑡=
𝜕𝑉𝑢
𝜕𝑥. 𝑆𝑆 6-5
Injecting equation 6-5 into equation 6-2 then leads to equation 6-6:
𝑆𝑢 =𝐴𝑓
𝐴𝑠. 𝑆𝑠 6-6
Chapter 6: Flame propagation study
[149]
Andrews and Bradley (1972) notably determined this formula relying on similar hypotheses:
the flame burning velocity Su remains constant (which essentially means that the local fuel
equivalent ratio does not change during the flame propagation), the flame thickness is small in
comparison to the flame curvature and if the spatial velocity SS is uniform over the whole
surface of the flame. A thermal expansion factor χ, represented by the ratio between the
densities of the hot burnt gases and the initial cold gases, is generally added to this relation to
convert the ‘unstretched burning velocity’ into a ‘laminar burning velocity’ (Halter, 2005).
However, this factor represents the volume increase of the flame kernel, which is already
considered by the flame section, as just demonstrated. For this reason, this factor was not
considered in this work.
Moreover, as previously explained, only the ‘free’ flame kernel growth is considered, meaning
the analysis is stopped when the flame is close to the walls but is still unaffected by their
presence. This induces that, at this early stage, the flame kernel growth is unaffected by the
thrust of the gases against the bottom of the tube and by the associated pressure increase, which
has been verified by observing the negligible displacement of the flame kernel geometric center
during the analysis. It should be underlined that the burning velocity of a fuel-air mixture
depends on the initial dust concentration, the pressure and the temperature, but also the
turbulence. More than any other parameter, this point is very important and specific to dust
explosion due to the inherent turbulence developed when generating the dust cloud. This effect
can be estimated using the flame’s stretching factor K, called Karlovitz factor (Karlovitz et al.,
1951), defined as:
𝐾 = 1
𝐴𝑓
𝑑𝐴𝑓
𝑑𝑡 6-7
The sign of the Karlovitz factor indicates the expansion (K positive) or compression (K
negative) of the flame surface. Since the stretching can be due to the curvature of the flame or
to the strain rate of the flow, the stretching factor can be decoupled in two different variables
Kc and Ks (Bradley, 2000). However, in this work, the flame stretching will be considered as a
single phenomenon combining both effects.
In the literature, two relations to link the Karlovitz factor to the burning velocity are mainly
used by considering the assumptions previously mentioned: a linear relation and a non-linear
one. Although those relations were initially established for gases, Cuervo et al. (2017) and
Torrado et al. (2017) obtained encouraging results by applying them to starch/methane as well
as carbon nanoparticles/methane hybrid mixtures. In this work, the same relations are applied
to pure dust explosion. Indeed, the low inertia of nanocellulose nanoparticles allows
measurement at very low turbulence, leading to a spherical/ellipsoidal flame kernel growth.
Moreover, the organic nature of the chosen powder induces a fast devolatilization which implies
that, under usual concentration and turbulence conditions, the dust combustion would be
controlled by gas combustion (Di Benedetto and Russo, 2007).

Chapter 6: Flame propagation study
[150]
Linear relation
Most of the authors studying the flame propagation and laminar burning velocity of dusts using
the tube method (Cuervo et al., 2017; Dahoe et al., 2002; Di Benedetto et al., 2011) use a linear
relation established for pure gases and stating that, in a first approach, Karlovitz factor can be
linked to the flame burning velocity by the following relationship (Clavin, 1985; Markstein,
1964):
𝑆𝑢 = −𝛿𝑀𝐾 + 𝑆𝑢0 6-8
where Su° is the laminar burning velocity and δM, the Markstein length, whose sign provides an
indication on the stability of the flame (Clavin, 1985). This linear relation is valid if the flame
stretching is weak, i.e if the Karlovitz number is low, and if the ratio of thermal diffusivity to
mass diffusivity, called the Lewis number, is equal to unity.
Non-linear relation
Even if the linear relation has been extensively adopted in various studies concerning flame
propagation (Beeckmann et al., 2019; Bradley et al., 2019; Ichikawa et al., 2019; Torrado et al.,
2017), it has some limitations (Petersen and Emmons, 1961). Indeed, this relation is less
accurate for Lewis numbers different from unity (Tien and Matalon, 1991) and if the flame
stretching level is high, which corresponds to great values of Karlovitz factor (Vagelopoulos et
al., 1994). As a consequence, some authors developed and applied a nonlinear relation to link
the laminar flame velocity to the flame stretching of gaseous mixtures (Buckmaster, 1977;
Halter et al., 2010; Kelley and Law, 2009; Sivashinsky, 1975):
(𝑆𝑢
𝑆𝑢0)
2
. 𝑙𝑛 (𝑆𝑢
𝑆𝑢0)
2
= −2𝛿𝑀𝐾
𝑆𝑢0 6-9
The previous analysis was applied along with relations 6-4 and 6-5 to the experimental data
recorded during flame propagation in the semi-open tube and in the vented 20L sphere.
VI.1.1.3. Estimation of the laminar burning velocity
An illustration of the evolution of the burning velocity with the Karlovitz factor is presented in
Figure 6-4 for a concentration of 500 g.m-3 of nanocellulose. It appears that both relations seem
in satisfactory agreement with the experimental data. In this example, the unstretched flame
velocity obtained using the linear relation is of 20.5 ± 0.6 cm.s-1 and of 21.3 ± 0.6 cm.s-1 using
the nonlinear relation proving a good consistency between both methods.

Chapter 6: Flame propagation study
[151]
Figure 6-4 Illustration of the burning velocity – stretching factor relation for a 500 g.m-3
nanocellulose-air mixture for tv = 340 ms
Since the derivation process used to determine the Karlovitz factor and the spatial velocity can
induce some uncertainties, the time evolution of the position of the flame front, the flame area
and cross-section was systematically smoothed based on a second order polynomial as shown
in Figure 6-5 to obtain a general trend and avoid local discontinuities. The coefficient of
determination is systematically greater than 0.99, showing a good agreement with the
experimental results.
Figure 6-5 Evolution of the front flame position, flame area and cross-section with time for
a 500 g.m-3 nanocellulose-air mixture for tv = 340 ms
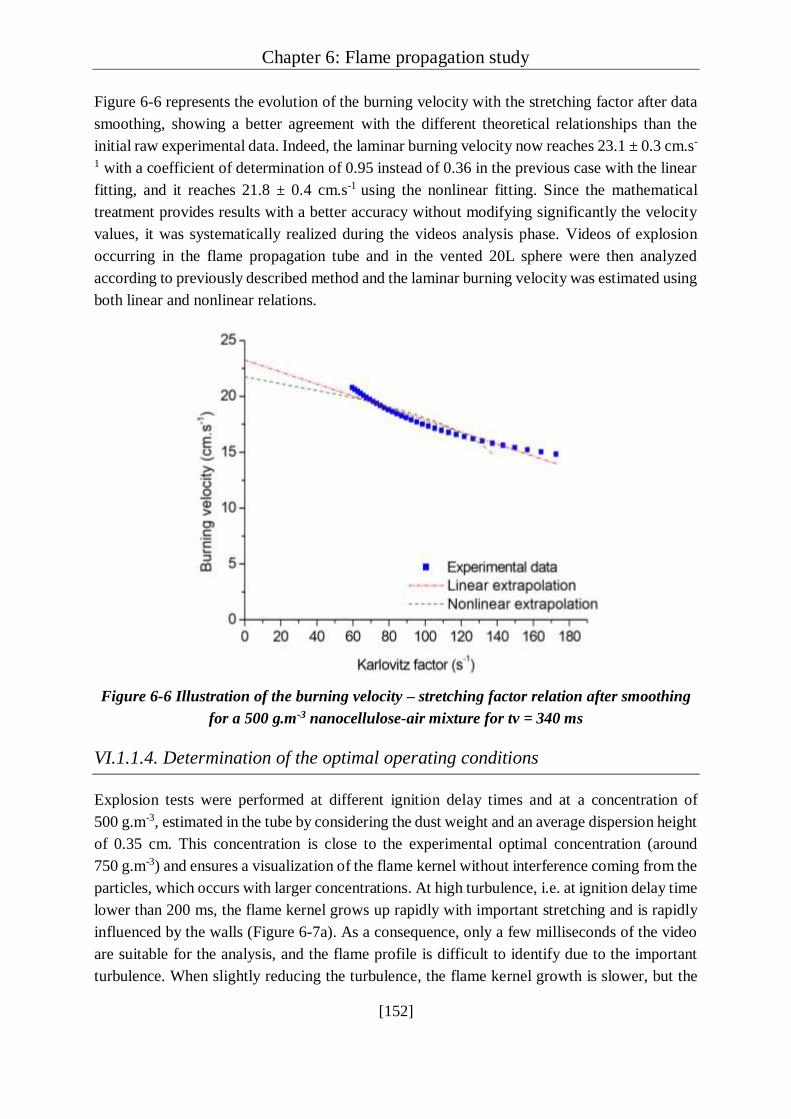
Chapter 6: Flame propagation study
[152]
Figure 6-6 represents the evolution of the burning velocity with the stretching factor after data
smoothing, showing a better agreement with the different theoretical relationships than the
initial raw experimental data. Indeed, the laminar burning velocity now reaches 23.1 ± 0.3 cm.s-
1 with a coefficient of determination of 0.95 instead of 0.36 in the previous case with the linear
fitting, and it reaches 21.8 ± 0.4 cm.s-1 using the nonlinear fitting. Since the mathematical
treatment provides results with a better accuracy without modifying significantly the velocity
values, it was systematically realized during the videos analysis phase. Videos of explosion
occurring in the flame propagation tube and in the vented 20L sphere were then analyzed
according to previously described method and the laminar burning velocity was estimated using
both linear and nonlinear relations.
Figure 6-6 Illustration of the burning velocity – stretching factor relation after smoothing
for a 500 g.m-3 nanocellulose-air mixture for tv = 340 ms
VI.1.1.4. Determination of the optimal operating conditions
Explosion tests were performed at different ignition delay times and at a concentration of
500 g.m-3, estimated in the tube by considering the dust weight and an average dispersion height
of 0.35 cm. This concentration is close to the experimental optimal concentration (around
750 g.m-3) and ensures a visualization of the flame kernel without interference coming from the
particles, which occurs with larger concentrations. At high turbulence, i.e. at ignition delay time
lower than 200 ms, the flame kernel grows up rapidly with important stretching and is rapidly
influenced by the walls (Figure 6-7a). As a consequence, only a few milliseconds of the video
are suitable for the analysis, and the flame profile is difficult to identify due to the important
turbulence. When slightly reducing the turbulence, the flame kernel growth is slower, but the
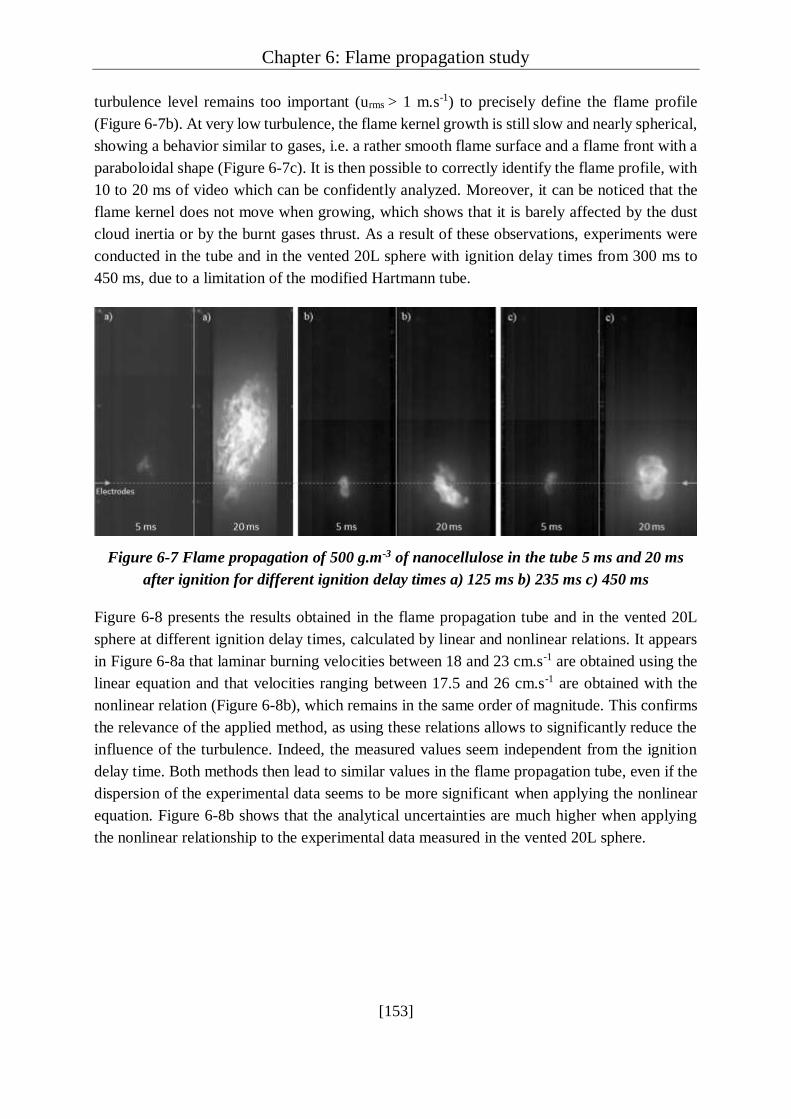
Chapter 6: Flame propagation study
[153]
turbulence level remains too important (urms > 1 m.s-1) to precisely define the flame profile
(Figure 6-7b). At very low turbulence, the flame kernel growth is still slow and nearly spherical,
showing a behavior similar to gases, i.e. a rather smooth flame surface and a flame front with a
paraboloidal shape (Figure 6-7c). It is then possible to correctly identify the flame profile, with
10 to 20 ms of video which can be confidently analyzed. Moreover, it can be noticed that the
flame kernel does not move when growing, which shows that it is barely affected by the dust
cloud inertia or by the burnt gases thrust. As a result of these observations, experiments were
conducted in the tube and in the vented 20L sphere with ignition delay times from 300 ms to
450 ms, due to a limitation of the modified Hartmann tube.
Figure 6-7 Flame propagation of 500 g.m-3 of nanocellulose in the tube 5 ms and 20 ms
after ignition for different ignition delay times a) 125 ms b) 235 ms c) 450 ms
Figure 6-8 presents the results obtained in the flame propagation tube and in the vented 20L
sphere at different ignition delay times, calculated by linear and nonlinear relations. It appears
in Figure 6-8a that laminar burning velocities between 18 and 23 cm.s-1 are obtained using the
linear equation and that velocities ranging between 17.5 and 26 cm.s-1 are obtained with the
nonlinear relation (Figure 6-8b), which remains in the same order of magnitude. This confirms
the relevance of the applied method, as using these relations allows to significantly reduce the
influence of the turbulence. Indeed, the measured values seem independent from the ignition
delay time. Both methods then lead to similar values in the flame propagation tube, even if the
dispersion of the experimental data seems to be more significant when applying the nonlinear
equation. Figure 6-8b shows that the analytical uncertainties are much higher when applying
the nonlinear relationship to the experimental data measured in the vented 20L sphere.

Chapter 6: Flame propagation study
[154]
Figure 6-8 Evolution of the laminar burning velocity of 500 g.m-3 of nanocellulose with
ignition delay time calculated by the linear and nonlinear relations in a) the propagation
tube b) the vented 20L sphere
Figure 6-9 shows that the application of the nonlinear relationship is more relevant for the
experimental data corresponding to a high-stretch region (Karlovitz factor from 270 to 400 s-1)
of the flame propagation in the tube. However, this zone corresponds to a period of time during
which the flame propagation may still be affected by the ignition (near 400 s-1). In most cases,
as for instance for the other experimental set of data presented in Figure 6-9 (380 ms in the
vented sphere), the linear fit will be preferred to the nonlinear model, especially at low
stretching rates. It can also be observed in Figure 6-9 that the number of experimental points
selected for the analysis is often reduced in the case of the vented sphere. Indeed, with regard
to the tube, the larger volume of the 20L vented sphere is both an advantage and a drawback:
an advantage because it reduces the wall effects and a drawback because, during the very first
moments of the flame kernel growth, the thickness of the unburnt cloud located between the
ignition zone and the window is great, which hinders the flame visualization and sometimes
reduces the ‘analyzable duration’ of the video down to 5 ms. This limitation can be partially
overcome by using a Schlieren system, as presented in section VI.1.1.1.
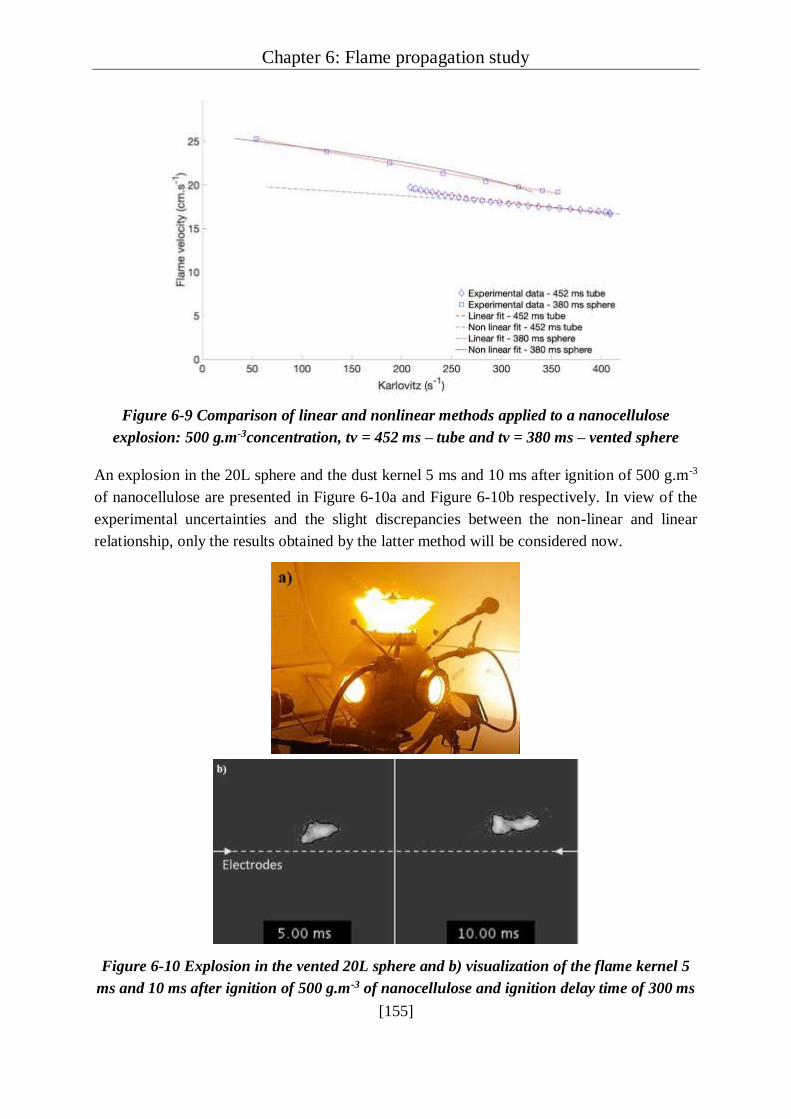
Chapter 6: Flame propagation study
[155]
Figure 6-9 Comparison of linear and nonlinear methods applied to a nanocellulose
explosion: 500 g.m-3concentration, tv = 452 ms – tube and tv = 380 ms – vented sphere
An explosion in the 20L sphere and the dust kernel 5 ms and 10 ms after ignition of 500 g.m-3
of nanocellulose are presented in Figure 6-10a and Figure 6-10b respectively. In view of the
experimental uncertainties and the slight discrepancies between the non-linear and linear
relationship, only the results obtained by the latter method will be considered now.
Figure 6-10 Explosion in the vented 20L sphere and b) visualization of the flame kernel 5
ms and 10 ms after ignition of 500 g.m-3 of nanocellulose and ignition delay time of 300 ms
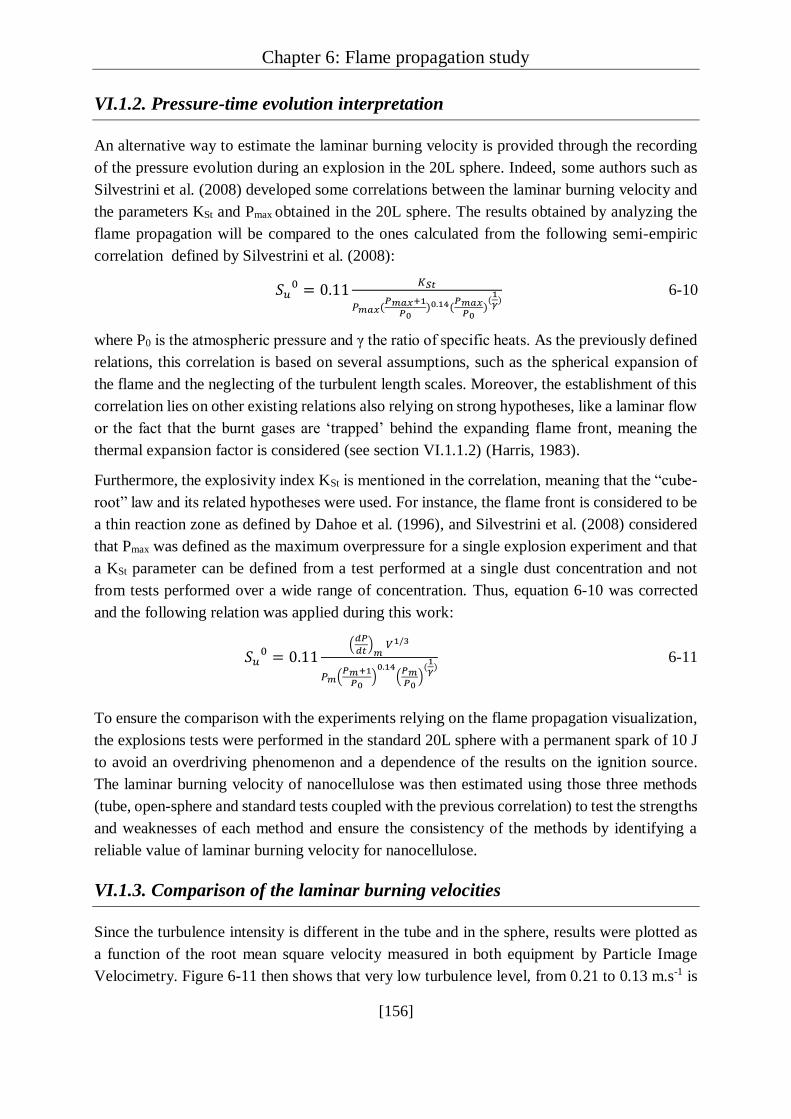
Chapter 6: Flame propagation study
[156]
VI.1.2. Pressure-time evolution interpretation
An alternative way to estimate the laminar burning velocity is provided through the recording
of the pressure evolution during an explosion in the 20L sphere. Indeed, some authors such as
Silvestrini et al. (2008) developed some correlations between the laminar burning velocity and
the parameters KSt and Pmax obtained in the 20L sphere. The results obtained by analyzing the
flame propagation will be compared to the ones calculated from the following semi-empiric
correlation defined by Silvestrini et al. (2008):
𝑆𝑢0 = 0.11
𝐾𝑆𝑡
𝑃𝑚𝑎𝑥(𝑃𝑚𝑎𝑥+1
𝑃0)0.14(
𝑃𝑚𝑎𝑥𝑃0
)(
1𝛾
) 6-10
where P0 is the atmospheric pressure and γ the ratio of specific heats. As the previously defined
relations, this correlation is based on several assumptions, such as the spherical expansion of
the flame and the neglecting of the turbulent length scales. Moreover, the establishment of this
correlation lies on other existing relations also relying on strong hypotheses, like a laminar flow
or the fact that the burnt gases are ‘trapped’ behind the expanding flame front, meaning the
thermal expansion factor is considered (see section VI.1.1.2) (Harris, 1983).
Furthermore, the explosivity index KSt is mentioned in the correlation, meaning that the “cube-
root” law and its related hypotheses were used. For instance, the flame front is considered to be
a thin reaction zone as defined by Dahoe et al. (1996), and Silvestrini et al. (2008) considered
that Pmax was defined as the maximum overpressure for a single explosion experiment and that
a KSt parameter can be defined from a test performed at a single dust concentration and not
from tests performed over a wide range of concentration. Thus, equation 6-10 was corrected
and the following relation was applied during this work:
𝑆𝑢0 = 0.11
(𝑑𝑃
𝑑𝑡)
𝑚 𝑉1/3
𝑃𝑚(𝑃𝑚+1
𝑃0)
0.14(
𝑃𝑚𝑃0
)(
1𝛾
) 6-11
To ensure the comparison with the experiments relying on the flame propagation visualization,
the explosions tests were performed in the standard 20L sphere with a permanent spark of 10 J
to avoid an overdriving phenomenon and a dependence of the results on the ignition source.
The laminar burning velocity of nanocellulose was then estimated using those three methods
(tube, open-sphere and standard tests coupled with the previous correlation) to test the strengths
and weaknesses of each method and ensure the consistency of the methods by identifying a
reliable value of laminar burning velocity for nanocellulose.
VI.1.3. Comparison of the laminar burning velocities
Since the turbulence intensity is different in the tube and in the sphere, results were plotted as
a function of the root mean square velocity measured in both equipment by Particle Image
Velocimetry. Figure 6-11 then shows that very low turbulence level, from 0.21 to 0.13 m.s-1 is

Chapter 6: Flame propagation study
[157]
reached using the tube, whereas urms reaches a minimum of 0.3 m.s-1 in the 20L sphere.
However, similar values of laminar burning velocity are obtained, from 19 to 23 cm.s-1 in the
tube and from 16 to 24 cm.s-1 in the sphere. This is due to the fact that, when increasing the
ignition delay time, the turbulence level decreases in both equipment until it reaches a plateau,
as mentioned in section VI.1.1.1. This latter is observed from 200 ms in both equipment,
corresponding to a root-mean square velocity of 0.4 m.s-1 in the propagation tube and 0.5 m.s-1
in the 20L sphere. The flame propagation tube seems to produce more clustered values, which
can be explained by the better visualization of the flame kernel providing a longer analyzable
video than in the vented 20L sphere, thus a more accurate analysis of the flame propagation,
and by a lower turbulence level. Indeed, the red spotted lines in Figure 6-11 evidences the great
repeatability of the measurements when approaching a zero turbulence.
Figure 6-11 Evolution of the laminar burning velocity with the root mean square velocity in
the flame propagation tube and in the vented 20L sphere
The values of the laminar burning velocities obtained through visualization of the flame
propagation were then compared to the value acquired by pressure-time recording in the
standard 20L apparatus (Figure 6-12).

Chapter 6: Flame propagation study
[158]
Figure 6-12 Evolution of the laminar burning velocity with the root-mean square velocity
in the flame propagation tube, the vented 20L sphere and the standard 20L sphere
Using the semi-empirical correlation previously detailed (Equation 3-7), an laminar burning
velocity of 19.9 cm.s-1 is obtained for an explosion of 500 g.m-3 of nanocellulose at a root mean
square velocity of 3.5 m.s-1 while the same value was reached in the flame propagation tube
and vented 20L sphere for root-mean square velocities of 0.2 m.s-1 and 0.3 m.s-1 respectively.
This is due to the fact that the empirical coefficient of the correlation was established by
considering explosion tests performed in standard conditions in the 20L sphere. The equation
was applied with a coefficient 0.11 as proposed by the authors, but it makes it valid only for
(dP/dt)m and Pm obtained with an ignition delay time of 60 ms, i.e. a root-mean square velocity
of 3.5 m.s-1, as previously presented in Table 6-2.
The laminar burning velocity was then calculated by application of the correlation 3-7 to the
parameters Pm and (dP/dt)m obtained with a standard explosion in the 20L sphere, with an
ignition energy of 10J and ignition delay time of 60 ms. Moreover, since Cuervo (2015) and
Dahoe et al. (2001) showed that the vertical velocity of the particles is close to zero for ignition
delay times greater than 300 ms in the propagation tube and in the 20L sphere, and since the
flame kernel stays put when growing (see section VI.1.1.4), the flame propagation visualized
in both equipment is considered to be independent of the turbulence level. However, in addition
to the difficulties to identify the flame kernel in the vented sphere, significant fluctuations in
the velocity in the sphere can explain the more important scattering of the values of the laminar
burning velocities obtained compared to the ones obtained in the tube. The values of laminar
burning velocity of the nanocellulose determined for each method are presented in Table 6-2.

Chapter 6: Flame propagation study
[159]
Table 6-2 Laminar burning velocity of the nanocellulose estimated by the three different
methods
Method Flame propagation tube
(flame visualization)
Vented 20L sphere
(flame visualization)
Standard 20L sphere
(pressure evolution)
Laminar burning
velocity (cm.s-1) 21.4 ± 1.4 20.5 ± 3.2 19.9 ± 3.0
It first appears that the three methods lead to similar results, around 21 cm.s-1. As a comparison,
Krause and Kasch (2000) reported laminar burning velocities presented in the literature for
different concentrations of two organic powders: lypocodium and cornstarch. Values from
17 cm.s-1 to 69 cm.s-1 were then obtained for lycopodium, and velocities between 13 cm.s-1 and
59 cm.s-1 were acquired for cornstarch. More specifically, van der Wel (1993) reported a
laminar flame velocity for cornstarch of 13 cm.s-1 at 400 g.m-3 using the 20L sphere coupled
with a correlation based on Mallard and Le Chatelier thermal theory, and 13 to 20 cm.s-1 using
the burner method for concentrations from 400 g.m-3 to 600 g.m-3. Haghiri and Bidabadi (2010)
also calculated laminar burning velocities for organic powders from 15 cm.s-1 to 45 cm.s-1 for
concentrations from 30 g.m-3 to 100 g.m-3 using a model considering the thermal radiation
effect. Moreover, Cuervo et al. (2017) also measured a laminar burning velocity for 915 g.m-3
of starch around 19.9 cm.s-1. Since starch and nanocellulose have similar structures and
composition, these values are in good agreement with the value of 21.4 cm.s-1 obtained in the
tube for the nanocellulose, despite the different concentrations.
The Markstein length was also calculated from video analysis of the flame propagations in the
tube and the vented sphere. Similar values were obtained in both equipment, with a mean value
of -0.25 mm in the propagation tube and of -0.19 mm in the vented sphere. A negative value of
the Markstein length means that the flame speed increases with the stretch rate, implying that
the flame is unstable. However, the obtained values are very low (absolute values usually lower
than 1 mm), and some positive values up to 0.3 mm were also obtained when analyzing the
flame propagation videos under certain conditions, which makes it difficult to draw an accurate
conclusion on the Markstein length of nanocellulose flames. Nevertheless, it should be stressed
that these values are much lower than that obtained by Dahoe et al. (2002) for cornstarch-air
mixtures, i.e. 11.0 mm, but are a bit higher than those encountered for methane-air mixtures,
i.e. from 0.1 to 0.2 mm. This can be related to the fact that nanocellulose is prone to
devolatilization when exposed to high temperatures. However, complementary tests with
different concentrations are necessary to conclude on this point.
VI.1.4. On the application of the correlation
Although the values obtained with the three methods are in good agreement, the propagation
tube provides the less scattered values of laminar burning velocity, notably due to a lowest
turbulence level. The calculation performed using Silvestrini et al. (2008) correlation also

Chapter 6: Flame propagation study
[160]
provides a value in good agreement with the values measured by flame propagation analysis,
but with a higher uncertainty than in the propagation tube. It is mainly due to the lack of
reproducibility of the experiments in the standard 20L sphere at 60 ms (Proust et al., 2007).
Indeed, at an ignition delay time of 60 ms, the turbulence level is in the “transition stage”
identified by Murillo et al. (2018), and turbulence variations have a strong impact on the
maximum rate of pressure rise. Adapting the correlation with a coefficient estimated from
experiments performed in pseudo-laminar conditions, i.e. higher ignition delay time, would
then improve the accuracy of the estimation of the laminar burning velocity. It would then be
interesting to use flame propagation analysis on different powders to determine such a
coefficient and to apply it to the correlation established by Silvestrini et al. (2008). However,
this adapted correlation would have to be used with Pm and (dP/dt)m measured in the same
turbulent conditions than the coefficient, which can limit the application of such a relation. To
apply this correlation (6-11) to different conditions and represent industrial situations, an
evaluation of the evolution of the correlation coefficient (here 0.11) with the initial turbulence
is then required.
Since the correlation has been validated for nanocellulose at 60 ms, an estimation of the
coefficient dependency with the turbulence was realized by analyzing the explosion tests
performed with 750 g.m-3 of nanocellulose and 250 g.m-3 of carbon black for ignition delay
times from 20 ms to 200 ms and 120 ms respectively. By applying the correlation 6-11 and
considering the value obtained at 60 ms as a reference, the corrected correlation coefficients
were estimated for different root-mean square velocities, as presented in Figure 6-13. It appears
that the coefficient value to consider in order to obtain the laminar burning velocities of 20.2
cm.s-1 and 23.4 cm.s-1 calculated for the carbon black and nanocellulose respectively increases
when decreasing the root-mean square velocity. Indeed, the correlation coefficient can be
correlated to the root-mean square velocity by a decay law similar to the one established by
Dahoe et al. (2001) relating the root-mean square velocity and the time. By combining the
values calculated from the tests performed on nanocellulose and carbon black, the relation 6-
12 was deduced:
𝐶 = 0.2213 𝑢𝑟𝑚𝑠−0.595 6-12
This relation, represented by the dotted line in Figure 6-13, shows a good agreement with the
experiments. Notably, a correlation coefficient of 0.105 is calculated for an ignition delay time
of 60 ms, i.e. a root-mean square velocity of 3.5 m.s-1, instead of the original coefficient of 0.11.
This relation can be directly injected in the correlation initially established by Silvestrini et al.
(2008), leading to equation 6-13.
𝑆𝑢0 = 0.2213 𝑢𝑟𝑚𝑠
−0.595(
𝑑𝑃
𝑑𝑡)
𝑚 𝑉1/3
𝑃𝑚(𝑃𝑚+1
𝑃0)
0.14(
𝑃𝑚𝑃0
)(
1𝛾
) 6-13

Chapter 6: Flame propagation study
[161]
Figure 6-13 Evolution of the correlation coefficient to calculate the laminar burning
velocity with the root-mean square velocity in the 20L sphere
This new relation was applied to the nanocellulose and carbon black powders for each ignition
delay time. Average values of 24.6 ± 3.1 cm.s-1 and 18.4 ± 2.5 cm.s-1 were then respectively
calculated for nanocellulose (750 g.m-3) and carbon black (250 g.m-3). Those values correspond
to differences of respectively 5% and 9% compared to the values calculated with the original
correlation, thus evidencing a good agreement. Although more tests performed on more
powders and more concentrations would be required to reinforce its accuracy, such equation
could then allow the assessment of the laminar burning velocity of a dust-air mixture in different
operating conditions.
Then, this correlation was applied to all the powders studied in this work on the optimal
concentration (see section IV.2.2, Table 4-4), and the maximum values are presented in Table
6-3. It appears that both aluminum powders exhibit laminar burning velocities around 58
cm.s-1, which is considerably higher than the values presented in the literature, which are
however quite scattered. One of the highest values was reported by Ballal (1983) who
performed micro-gravity measurements on aluminum particles of 10 µm, and obtained a
laminar burning velocity of 41 cm.s-1. It should be noted that the mean surface diameter of both
powders after dispersion was measured around 3 µm (see chapter 3, section III.2.2.3), which
corresponds to the strongest contribution of the radiative heat transfer on the flame propagation.
Such influence will notably be discussed in section VI.2.2 for the nanocellulose. However, this
may explain the high velocity of the flame propagation of aluminum nanopowders, and the
backfire to the dust container identified in section V.4 of chapter 5. The laminar burning
velocity of the carbon-coated silicon is also quite high, although no comparative value can be
found in the literature, notably due to the non-flammable nature of micro silicon carbide.
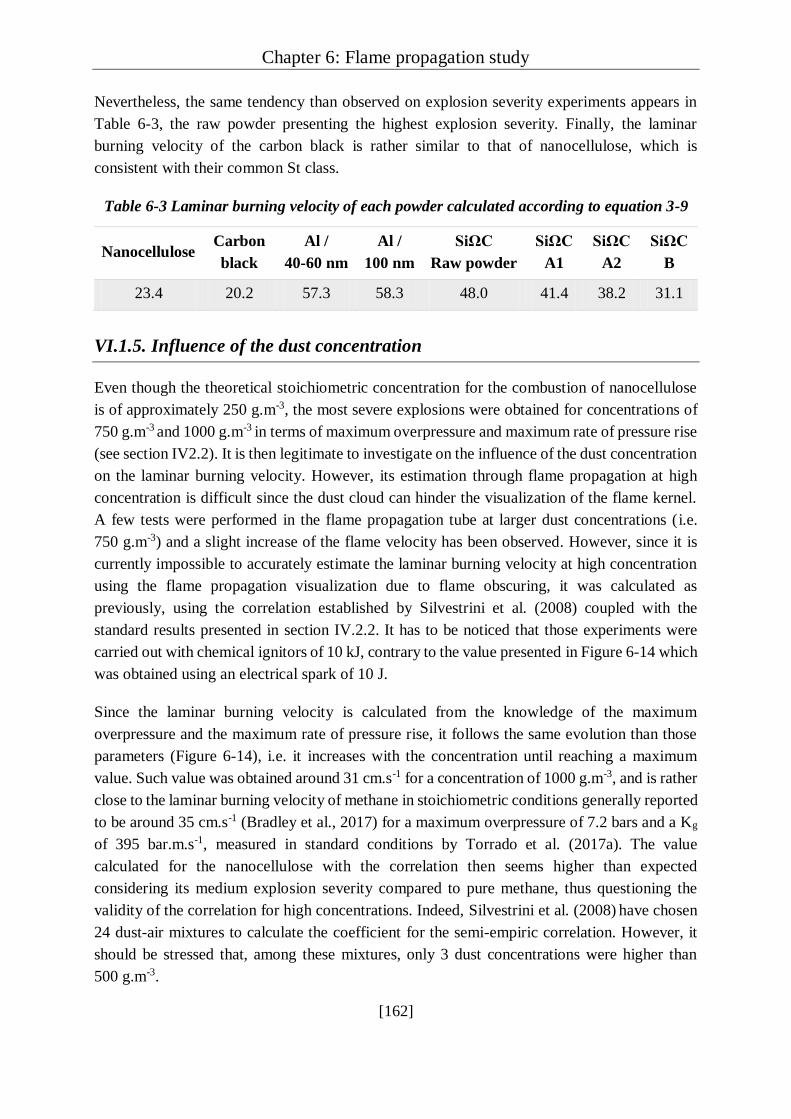
Chapter 6: Flame propagation study
[162]
Nevertheless, the same tendency than observed on explosion severity experiments appears in
Table 6-3, the raw powder presenting the highest explosion severity. Finally, the laminar
burning velocity of the carbon black is rather similar to that of nanocellulose, which is
consistent with their common St class.
Table 6-3 Laminar burning velocity of each powder calculated according to equation 3-9
Nanocellulose Carbon
black
Al /
40-60 nm
Al /
100 nm
SiΩC
Raw powder
SiΩC
A1
SiΩC
A2
SiΩC
B
23.4 20.2 57.3 58.3 48.0 41.4 38.2 31.1
VI.1.5. Influence of the dust concentration
Even though the theoretical stoichiometric concentration for the combustion of nanocellulose
is of approximately 250 g.m-3, the most severe explosions were obtained for concentrations of
750 g.m-3 and 1000 g.m-3
in terms of maximum overpressure and maximum rate of pressure rise
(see section IV2.2). It is then legitimate to investigate on the influence of the dust concentration
on the laminar burning velocity. However, its estimation through flame propagation at high
concentration is difficult since the dust cloud can hinder the visualization of the flame kernel.
A few tests were performed in the flame propagation tube at larger dust concentrations (i.e.
750 g.m-3) and a slight increase of the flame velocity has been observed. However, since it is
currently impossible to accurately estimate the laminar burning velocity at high concentration
using the flame propagation visualization due to flame obscuring, it was calculated as
previously, using the correlation established by Silvestrini et al. (2008) coupled with the
standard results presented in section IV.2.2. It has to be noticed that those experiments were
carried out with chemical ignitors of 10 kJ, contrary to the value presented in Figure 6-14 which
was obtained using an electrical spark of 10 J.
Since the laminar burning velocity is calculated from the knowledge of the maximum
overpressure and the maximum rate of pressure rise, it follows the same evolution than those
parameters (Figure 6-14), i.e. it increases with the concentration until reaching a maximum
value. Such value was obtained around 31 cm.s-1 for a concentration of 1000 g.m-3, and is rather
close to the laminar burning velocity of methane in stoichiometric conditions generally reported
to be around 35 cm.s-1 (Bradley et al., 2017) for a maximum overpressure of 7.2 bars and a Kg
of 395 bar.m.s-1, measured in standard conditions by Torrado et al. (2017a). The value
calculated for the nanocellulose with the correlation then seems higher than expected
considering its medium explosion severity compared to pure methane, thus questioning the
validity of the correlation for high concentrations. Indeed, Silvestrini et al. (2008) have chosen
24 dust-air mixtures to calculate the coefficient for the semi-empiric correlation. However, it
should be stressed that, among these mixtures, only 3 dust concentrations were higher than
500 g.m-3.

Chapter 6: Flame propagation study
[163]
Figure 6-14 Evolution of the laminar burning velocity calculated by a semi-empiric
correlation with the mass concentration
The same method considering mixtures with a larger range of concentrations may then extend
the validity of the correlation to higher concentrations. Indeed, in order to realize an accurate
evaluation of the explosion consequences, the influence of the dust concentration on the laminar
burning velocity must be considered. Since flame propagation visualization is often more
difficult at high concentrations, laminar burning velocity numerically obtained could be
considered. Numerical models can also highlight the contribution of a phenomenon: in the next
section, the influence of the radiative heat transfer on the flame propagation of nanocellulose
will notably be discussed.
VI.2. One dimensional modelling of flame propagation
Complementary to experiments relying on the flame visualization and the pressure-time
evolution, the laminar flame velocity was approached by adapting a one-dimension flame
propagation model developed by Torrado et al. (2018) and initially designed to describe gas
and hybrid mixtures explosions (Santandrea et al., 2020b). In a first approach, a comparison
was realized between the laminar burning velocities obtained by considering, on the one hand,
the combustion of the pyrolysis gases, and on the other hand, considering directly the
combustion of the dust. Thus, the validity of the hypothesis of a dust combustion controlled by
the gas combustion can be verified. In a second approach, the influence of the radiative heat
transfer on the flame propagation is investigated.
VI.2.1. Model principle

Chapter 6: Flame propagation study
[164]
The model developed by Torrado et al. (2018) was adapted to nanocellulose using the same
initial hypotheses, i.e. considering a flame propagating without stretching and gravity, in
quiescent conditions. Thus, the propagation was considered in a horizontal tube with a
numerical length of 5 cm involving two parallels walls divided into three distinct zones: preheat,
reaction and post-flame, knowing that the flame propagates from the post-flame zone to the
preheat zone. In addition, the tube was split into 160 volumes in which the reactive mixture is
considered homogeneous. Mass, species and energy balances, notably based on the properties
of the considered chemical species, were expressed in the simulation domain.
The transitory flame properties are determined solving the mass and energy conservation
equations, taking into account the mixture density, the mass fraction and reaction rate of the i
component, the mass diffusion flux and velocity (Poinsot and Veynante, 2005). In particular,
the mass reaction rate of a component depends on its molecular weight and the rate of the
reactions in which it is involved. The rate of each reaction rj is then expressed as:
𝑟𝑗 = 𝑘 ∏ 𝜑𝑛𝑖 6-14
where φ is the mole concentration and ni the reaction order of the component i in the reaction j.
The reaction constant is assumed to follow the Arrhenius law and is defined as:
𝑘𝑗 = 𝐴𝑖𝑇𝛽 exp (−𝐸𝑖
𝑅𝑇) 6-15
Two methods were considered: first, as for the flame visualization experiments, a fast
devolatilization of the dust and a flame propagation kinetically limited by the combustion of
the pyrolysis gases. Indeed, a Damköhler number for the nanocellulose combustion was
calculated in section IV.1.5 and reached 1.5, which traduces that the dust combustion is limited
by the gas combustion. Since cellulose and starch are both polymers formed of glucose chains,
both compounds are assumed to produce the same pyrolysis gases when tested in the same
conditions. Thus, pyrolysis experiments were conducted on wheat starch in a Godbert-
Greenwald oven modified according to Dufaud et al. (2012) to collect the post-pyrolysis gases,
which were then analysed by gas chromatography. The composition obtained for a
concentration of approximately 500 g.m-3 and a temperature of 973K obtained by Pietraccini et
al. (2020) was then used as the initial composition of the fuel in the model for a numerical
determination of the laminar flame velocity of nanocellulose (Figure 6-15).

Chapter 6: Flame propagation study
[165]
Figure 6-15 Initial composition of the nanocellulose pyrolysis gases/air mixture considered
in the flame propagation model
The second method consists in considering simultaneously the pyrolysis of the dust and the
combustion of the pyrolysis gases. The reactions mechanisms and kinetics estimated by
Pietraccini et al. (2020) from the knowledge of the composition of the pyrolysis gases (Figure
6-15) was used, considering the following reactions:
𝐶6𝐻10𝑂5 𝑘1→ 1.17 𝐻2 + 3.4 𝐶𝑂 + 0.02 𝐶𝑂2 + 0.45 𝐶𝐻4 + 0.32 𝐶2𝐻4 + 0.83 𝐻2𝑂 + 0.72 𝐶2𝐻4𝑂
𝐶6𝐻10𝑂5 𝑘2→ 0.8 𝐻2 + 1.7 𝐶𝑂 + 0.55 𝐶𝑂2 + 0.04 𝐶𝐻4 + 0.05 𝐶2𝐻4 + 0.4 𝐻2𝑂 + 1.83 𝐶2𝐻4𝑂
𝐶6𝐻10𝑂5 𝑘3→ 5 𝐻2𝑂 + 6 𝐶
The activation energies Ei and pre-exponential factors Ai of the three reaction rate constants ki
are presented in Table 6-4.
Table 6-4 Parameters of the reaction rate constants considered for the pyrolysis of
nanocellulose
Reaction rate constants Pre-exponential factor (s-1) Activation energy (kJ.mol-1)
k1 1.2 x 10¹⁷ 318.6
k2 8.8 x 10¹⁷ 41
k3 2.8 x 10⁵ 72.6
During the pyrolysis of organic powders, permanent gases, tar and char are generated
(Nowakowska et al., 2018). The acetaldehyde C2H4O was not considered as a reactant for the
combustion, nor the ethylene, due to the small amount generated during the pyrolysis.

Chapter 6: Flame propagation study
[166]
For both methods, the combustion of the pyrolysis gases is then considered. In this work, it is
assumed to follow a semi-global kinetic mechanism in order to describe the temperature and
final fraction of the components in the burnt gases. A detailed combustion mechanism is not
implemented due to the numerical complexity demand to solve the differential equations for all
the involved species.
Table 6-5 Reaction mechanisms considered for the combustion of the pyrolysis gases
(Units cal, mol, m, s)
# Reaction Ai β Ei Reaction order Reference
1 CH4 + 0.5O2
CO + 2H2 2.45 x 10⁹ 0 3 x 10⁴
[CH4]0.5
[O2]1.25
(Jones and
Lindstedt, 1988)
2 CH4 + H2O
CO + 3H2 3 x 10⁵ 0 3 x 10⁴ [CH4] [H2O]
(Jones and
Lindstedt, 1988)
3 CO + H2O
CO2 + H2 2.75 x 10⁶ 0 2 x 10⁴ [CO] [H2O]
(Jones and
Lindstedt, 1988)
-3 CO2 + H2 CO
+ H2O 9 x 10⁷ 0 2.8 x 10⁴ [CO2] [H2]
(Torrado et al.,
2018)
4 H2 + 0.5O2
H2O 3.85 x 10¹³ -1 4 x 10⁴ [H2]
0.25 [O2]1.50
(Jones and
Lindstedt, 1988)
-4 H2O H2 +
0.5O2 9.27 x 10¹⁸ 0.88 9.8 x 10⁴
[H2O] [H2]-0.75
[O2]
(Andersen et al.,
2009)
5 O2 2O∙ 1.5 x 10⁹ 0 1.13 x 10⁵ [O2] (Frassoldati et
al., 2009)
6 H2O H∙ +
OH∙ 2.3 x 10²² -3 1.2 x 10⁵ [H2O]
(Frassoldati et
al., 2009)
7 CO + 0.5O2
CO2
1.26 x 10⁴ 0 10 x 103 [CO] [O2]
0.25
[H2O]0.5
(Andersen et al.,
2009)
-7 CO2 CO +
0.5O2 1.95 x 10¹²
-
0.97 78.4 x 10³
[CO2] [H2O]0.5
[O2]-0.25
(Andersen et al.,
2009)
8 C(s) + 0.5 O2
CO 1.1 x 10⁴ 0 42.8 x 10³ [O2]
0.5 (Bews et al.,
2001)
Since the main chemical species constituting the pyrolysis gases of nanocellulose are the same
than the species initially taken into account in the model for the flame propagation of a
methane/air flame (Torrado et al., 2018), the same reaction mechanisms were used. Reactions
involving radicals H, OH and O are also considered to improve the prediction of the flame
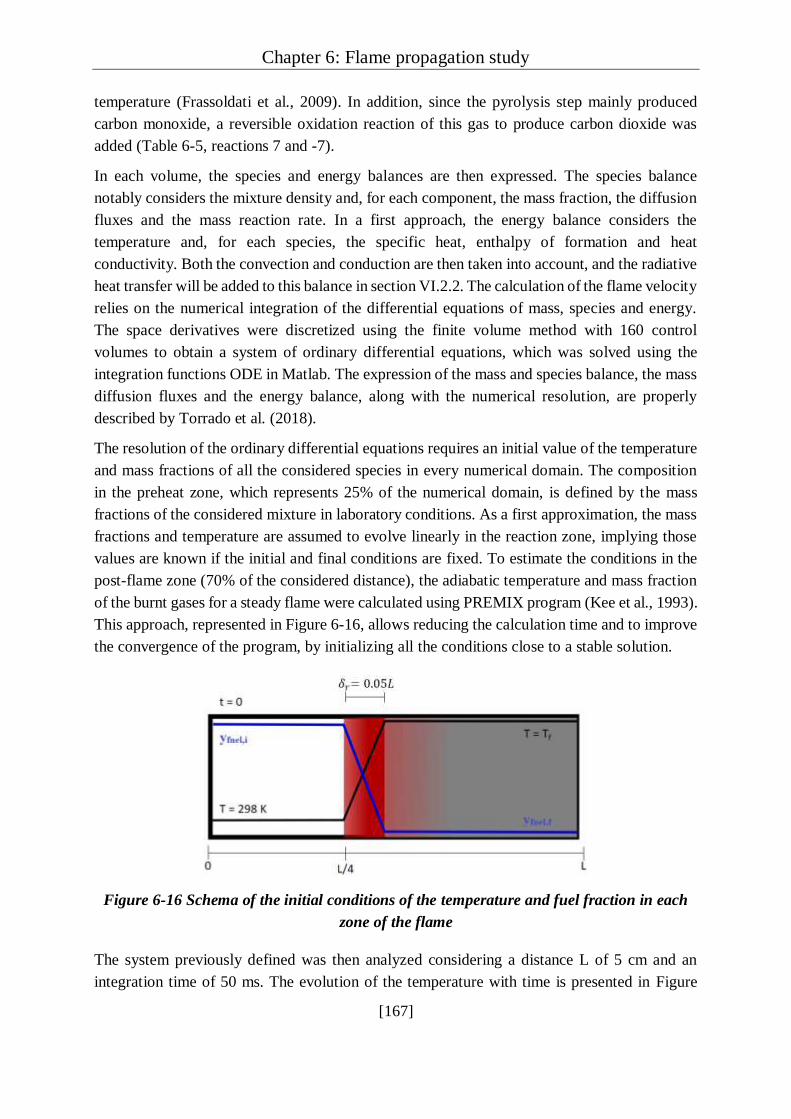
Chapter 6: Flame propagation study
[167]
temperature (Frassoldati et al., 2009). In addition, since the pyrolysis step mainly produced
carbon monoxide, a reversible oxidation reaction of this gas to produce carbon dioxide was
added (Table 6-5, reactions 7 and -7).
In each volume, the species and energy balances are then expressed. The species balance
notably considers the mixture density and, for each component, the mass fraction, the diffusion
fluxes and the mass reaction rate. In a first approach, the energy balance considers the
temperature and, for each species, the specific heat, enthalpy of formation and heat
conductivity. Both the convection and conduction are then taken into account, and the radiative
heat transfer will be added to this balance in section VI.2.2. The calculation of the flame velocity
relies on the numerical integration of the differential equations of mass, species and energy.
The space derivatives were discretized using the finite volume method with 160 control
volumes to obtain a system of ordinary differential equations, which was solved using the
integration functions ODE in Matlab. The expression of the mass and species balance, the mass
diffusion fluxes and the energy balance, along with the numerical resolution, are properly
described by Torrado et al. (2018).
The resolution of the ordinary differential equations requires an initial value of the temperature
and mass fractions of all the considered species in every numerical domain. The composition
in the preheat zone, which represents 25% of the numerical domain, is defined by the mass
fractions of the considered mixture in laboratory conditions. As a first approximation, the mass
fractions and temperature are assumed to evolve linearly in the reaction zone, implying those
values are known if the initial and final conditions are fixed. To estimate the conditions in the
post-flame zone (70% of the considered distance), the adiabatic temperature and mass fraction
of the burnt gases for a steady flame were calculated using PREMIX program (Kee et al., 1993).
This approach, represented in Figure 6-16, allows reducing the calculation time and to improve
the convergence of the program, by initializing all the conditions close to a stable solution.
Figure 6-16 Schema of the initial conditions of the temperature and fuel fraction in each
zone of the flame
The system previously defined was then analyzed considering a distance L of 5 cm and an
integration time of 50 ms. The evolution of the temperature with time is presented in Figure

Chapter 6: Flame propagation study
[168]
6-17 for 500 g.m-3 of nanocellulose considering only the combustion of the pyrolysis gases, at
different positions to describe each zone, knowing that the preheat zone spreads up to 1.25 cm
and that the post-flame zone starts at 1.5 cm. It appears that, in the post-flame zone (2.5 and 5
cm), the temperature is constant with time, since the reaction already occurred. Then, a fast
increase of the temperature after a few milliseconds is visible in the reaction zone, and
progressively shifts toward the preheat zone with time, describing the propagation of the flame.
Figure 6-17 Evolution of the temperature with time for different control volumes when
modelling the flame propagation of nanocellulose (quiescent conditions, 500 g.m-3)
VI.2.2. Influence of the pyrolysis step
The position of the flame front, assimilated to the highest temperature, was recorded for each
integration time and is presented in Figure 6-18. It should be reminded that the reaction zone
was initially located between 1.25 cm and 1.5 cm. However, before 1 ms, a very fast
displacement of the flame is observed, preventing a clear determination of the flame front
position between 1.4 and 1.5 cm. Nevertheless, a linear time-evolution of the flame position
can be observed from 1 ms to 50 ms. A laminar flame velocity of 17.5 cm.s-1, represented by
the slope of the linear regression, was then obtained for the combustion of the pyrolysis gases
of nanocellulose.

Chapter 6: Flame propagation study
[169]
Figure 6-18 Evolution of the flame front position with time during the combustion of
nanocellulose pyrolysis gases
The numerical and experimental values of laminar flame velocity obtained for 500 g.m-3 of
nanocellulose are summarized in Table 6-6. First, since the assumption of a fast devolatilization
was realized in both cases, the value obtained by considering the combustion of the pyrolysis
gases in the model is compared to the experimental values obtained by flame visualization. The
value determined numerically appears to be of the same order of magnitude than the
experimental ones, with a maximum difference of 22% with regard to the laminar flame
velocity measured in the flame propagation tube. This value is also consistent with laminar
flame velocity of “wood gas” at the stoichiometry mentioned in the literature by Mollenhauer
and Tschöke (2010) and Przybyla et al. (2008), reaching around 14 cm.s-1 and 20 cm.s-1
respectively. Then, a decrease of 12% appears when considering the dust pyrolysis reactions in
the model in addition to the combustion of these gases, thus validating the assumption of a fast
pyrolysis.
Table 6-6 Numerical and experimental values of laminar flame velocity of nanocellulose
Determination method Laminar flame velocity (cm.s-1)
Propagation model (dust combustion) 15.3
Propagation model (combustion of pyrolysis gases) 17.5
Flame visualization: propagation tube 21.4
Flame visualization: vented sphere 20.5
Pressure-time evolution: application of Silvestrini et al.
(2008) correlation 19.9

Chapter 6: Flame propagation study
[170]
VI.2.3. Influence of the radiative heat transfer
Although the pyrolysis step is fast, the particles that did not react can also impact the flame
propagation through a thermal energy transfer, which tends to increase the propagation velocity.
To evaluate this influence, the radiative heat transfer, added to the flame propagation model by
Torrado et al. (2018) and based on the work of Haghiri and Bidabadi (2010), is now considered
during the combustion of the pyrolysis gases of nanocellulose. The radiation then occurs
between the propagating flame and a gray-two-phase environment, including the absorption,
emission and scattering of thermal radiation intensity (Torrado, 2017). However, since the
model considers homogeneous zones, which is not the case in practice, all the dust reacts when
considering the pyrolysis reactions, which prevents from evaluating the influence of some
remaining particles. Only the combustion of the pyrolysis gases was then considered, and some
nanoparticles of cellulose were added to the numerical system, without reaction.
Since it is difficult to evaluate the amount of remaining particles that did not react, several dust
concentrations, assumed constant with time, were tested, and a cloud constituted of spherical
particles of the same diameter homogeneously dispersed over the simulation domain was
considered. Moreover, due to the agglomeration of the nanoparticles, the particle size after
dispersion must be considered. Since particle size distribution measurements after dispersion
of nanocellulose in the 20L sphere led to a mean value of 10 µm (see section III.2.2.3), this
value was chosen as a reference for the calculation, along with 100 nm, to represent the primary
particles, and 60 µm, to represent the agglomerates which are not broken by the dispersion
process In this model, Mie scattering, valid for micron particles, was then considered to define
the radiative heat transfer. It should be noted that Rayleigh scattering, encountered for particles
smaller than 100 nm, do not contribute significantly to the flame expansion due to the emission
in every direction (Dufaud et al., 2011; Hong and Winter, 2006). Thus, decreasing the particle
size below this size would only decrease the radiative heat transfer contributing to the flame
propagation, and so the flame velocity. The concentration of dust that did not react during the
combustion of the 500 g.m-3 of nanocellulose was varied from 2.5 g.m-3 to 100 g.m-3, to
represent the radiative heat transfer at the beginning and at the end of the reaction. The radiative
heat transfer was then added to the energy balance and the heat capacity of the dust was then
taken into account during the calculation of the mean heat capacity of the mixture.

Chapter 6: Flame propagation study
[171]
Figure 6-19 Influence of the a) primary diameter and b) dust concentration considered for
the radiative heat transfer during the combustion of the pyrolysis gases of 500 g.m-3 of
nanocellulose
In Figure 6-19a, it appears that small particles contribute more to the radiative heat transfer than
bigger particles in the micro-range. Indeed, particles of 60 µm bring similar contribution to the
flame acceleration, i.e. an increase of around 0.5 cm.s-1, at 2.5 g.m-3 and 100 g.m-3, which
corresponds to an increase of 2% to 3% with regard to the value calculated without considering
the radiation. In contrast, 100 g.m-3 of particles of 5 µm lead to a flame velocity of 20 cm.s-1,
i.e. 14% higher than the flame velocity of the pyrolysis gases. It should be underlined that the
contribution of particles of 100 nm to the radiative heat transfer may be overestimated since
Mie scattering was considered for the calculation whereas Rayleigh scattering is more
representative of the heat transfer of nanoparticles. In Figure 6-19b, it appears that a dust
concentration of 2.5 g.m-3 leads to a mean flame velocity of around 17.8 cm.s-1 for particles
between 5 and 60 µm. As a consequence, increasing the dust concentration also increases the
contribution of the radiative heat transfer to the flame propagation, leading to a burning velocity
of 20.0 cm.s-1 when considering 100 g.m-3 of 5 µm particles.
Therefore, as expected, both the dust concentration and the particle size are of great importance
when considering the radiative heat transfer. Indeed, the absorption coefficient Ka and the
scattering coefficient Ks directly depend on the dust concentration, the dust density and the
particle size, as follows (Haghiri and Bidabadi, 2010):
𝐾𝑎 = 3
2
𝐶
𝜌𝑝 𝑑𝑝 𝑄𝑎𝑏𝑠 6-16
𝐾𝑠 = 3
2
𝐶
𝜌𝑝 𝑑𝑝 𝑄𝑠𝑐𝑎 6-17
where C is the dust concentration, ρp the particle density, dp the particle diameter and Qabs and
Qsca respectively the absorption and scattering efficiency.

Chapter 6: Flame propagation study
[172]
The absorption and scattering coefficients are then directly proportional to the total reactive
surface area (TSA) developed by the particles in the cloud, which can be expressed as follows
for spherical particles:
𝑇𝑆𝐴 = 6 𝐶
𝜌𝑝 𝑑𝑝 6-18
A linear evolution of the calculated flame velocity with the total surface area developed by the
particles considered in the radiative heat transfer appears in Figure 6-20. Then, it can be
observed that the radiative heat transfer generated by particles developing a total surface area
lower than 10 m2.m-3 does not lead to a significant increase of the flame velocity, with values
between 17.5 and 18 cm.s-1. However, when considering a total surface area of 100 m2.m-3, a
flame velocity of 20.8 cm.s-1 is reached, which corresponds to an increase of 19% compared to
the initial value of 17.5 cm.s-1 (without radiation), thus proving again the importance of
considering the surface area when analysing dust explosions, instead of focusing only on mass
concentration. It should also be noted that increasing the concentration too much would lead to
an important increase of absorption, which would limit the heat radiation in the preheat zone.
It can be related to the inter-particle distance, which is also of great interest when dealing with
the group combustion, discussed in chapters 4 and 5.
Figure 6-20 Influence of the total surface area of the particles implied in the radiative heat
transfer on the flame velocity
The values experimentally and numerically determined could then be used as inputs in
simulation and by adding the contribution of the turbulence of the dust cloud, the consequences
of an explosion in specific conditions can be estimated. It implies that the turbulent burning
velocity has to be deduced from the knowledge of the laminar burning velocity and the
turbulence level.

Chapter 6: Flame propagation study
[173]
VI.3. Application of turbulent velocity models
Several correlations relating the turbulent burning velocity to the laminar burning velocity and
the turbulence intensity exist in the literature, and were notably summarized by Andrews et al.
(1975), Dahoe et al. (2013) and Gülder (1991). Although these models were established for
premixed flames, some of the correlations presented by Dahoe et al. (2013) were tested in this
study to be compared, in a reverse approach, to the values of turbulent burning velocities
obtained by analyzing the flame propagation in the tube (Table 6-7). In addition to those
correlations, the relation (g) established by Popat et al. (1996) used in the FLACS-DustEx CFD
code, i.e. the most commonly used to estimate burning velocities and other model parameters
from experimental data, was applied to the experimental data produced in this work (Ghaffari
et al., 2019; Skjold, 2007).
Table 6-7 Some turbulent burning velocity models for premixed flame propagation
Notation Formula Reference
(a) 𝑆𝑢𝑇
𝑆𝑢𝐿= 1 +
𝑢𝑟𝑚𝑠
𝑆𝑢𝐿 (Damkoehler, 1947)
(b) 𝑆𝑢𝑇
𝑆𝑢𝐿
= √1 + (𝑢𝑟𝑚𝑠
𝑆𝑢𝐿)
2
(Shelkin, 1947)
(c) 𝑆𝑢𝑇
𝑆𝑢𝐿= 1 + √
5
12
𝑢𝑟𝑚𝑠
𝑆𝑢𝐿 (Taylor, 1922)
(d) 𝑆𝑢𝑇
𝑆𝑢𝐿= 1 + √2 (
𝑢𝑟𝑚𝑠
𝑆𝑢𝐿)
1/2
(Taylor, 1922)
(e) 𝑆𝑢𝑇
𝑆𝑢𝐿
= √1 + (2 𝑢𝑟𝑚𝑠
𝑆𝑢𝐿)
2
(Leason, 1951)
(f) 𝑆𝑢𝑇
𝑆𝑢𝐿
= 1 + (𝑢𝑟𝑚𝑠
𝑆𝑢𝐿)
2
(Clavin and Williams,
1979)
(g) 𝑆𝑢𝑇 = 15.1 𝑆𝑢𝐿0.784 𝑢𝑟𝑚𝑠
0.412 𝑙𝑖0.196
(Popat et al., 1996)
Concerning the models mentioned by Dahoe et al. (2013), it appears in Figure 6-21 that an
average difference of 55% is observed between the model providing the best fitting, i.e. model
(d) from Taylor (1922), and experimental data, meaning none of the models actually fits the
experimental data. Since the same statement was underlined for premixed flames of methane-
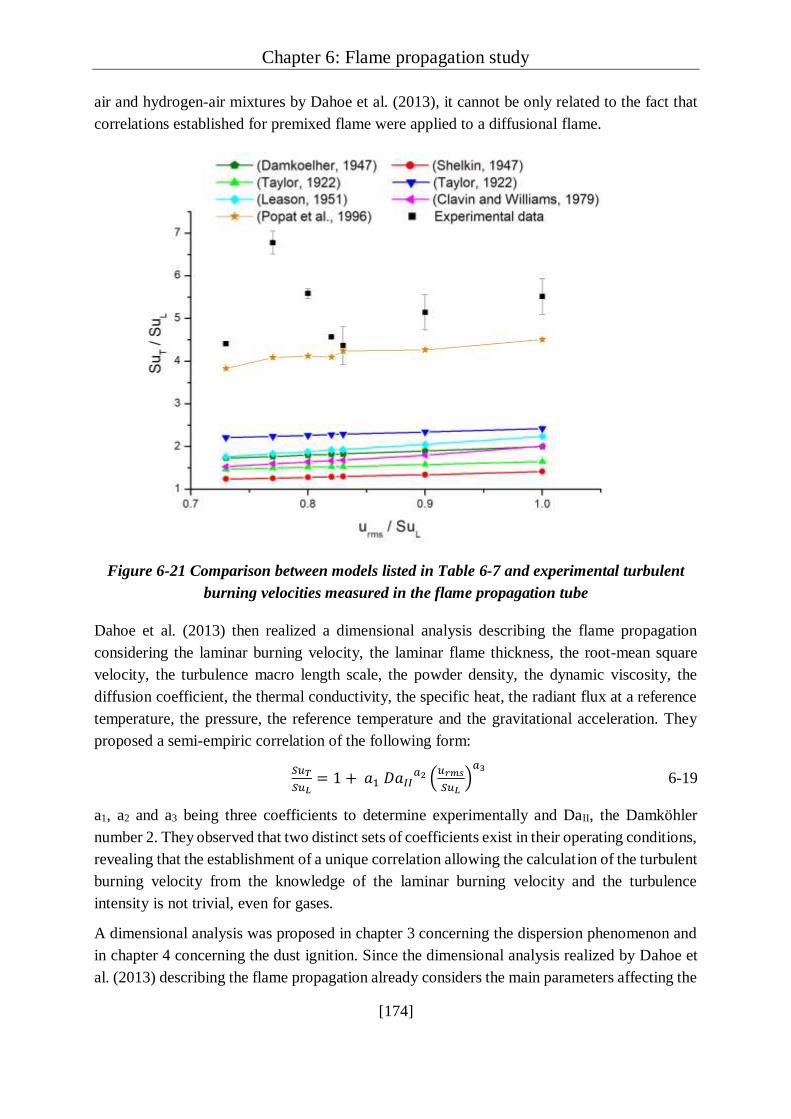
Chapter 6: Flame propagation study
[174]
air and hydrogen-air mixtures by Dahoe et al. (2013), it cannot be only related to the fact that
correlations established for premixed flame were applied to a diffusional flame.
Figure 6-21 Comparison between models listed in Table 6-7 and experimental turbulent
burning velocities measured in the flame propagation tube
Dahoe et al. (2013) then realized a dimensional analysis describing the flame propagation
considering the laminar burning velocity, the laminar flame thickness, the root-mean square
velocity, the turbulence macro length scale, the powder density, the dynamic viscosity, the
diffusion coefficient, the thermal conductivity, the specific heat, the radiant flux at a reference
temperature, the pressure, the reference temperature and the gravitational acceleration. They
proposed a semi-empiric correlation of the following form:
𝑆𝑢𝑇
𝑆𝑢𝐿= 1 + 𝑎1 𝐷𝑎𝐼𝐼
𝑎2 (𝑢𝑟𝑚𝑠
𝑆𝑢𝐿)
𝑎3
6-19
a1, a2 and a3 being three coefficients to determine experimentally and DaII, the Damköhler
number 2. They observed that two distinct sets of coefficients exist in their operating conditions,
revealing that the establishment of a unique correlation allowing the calculation of the turbulent
burning velocity from the knowledge of the laminar burning velocity and the turbulence
intensity is not trivial, even for gases.
A dimensional analysis was proposed in chapter 3 concerning the dispersion phenomenon and
in chapter 4 concerning the dust ignition. Since the dimensional analysis realized by Dahoe et
al. (2013) describing the flame propagation already considers the main parameters affecting the
Chapter 6: Flame propagation study
[175]
dust propagation, it will not be conducted in this work. However, as highlighted in chapter 4,
the Damköhler number is affected by the size decrease from the micro-range to the nano-range,
notably through the characteristic chemical time. Moreover, as a function of the concentration
and interparticle distance, a group contribution can occur instead of an individual contribution
of each particle. Thus, the coefficients a1, a2 and a3 should be evaluated separately for
microparticles and nanoparticles in order to consider such modifications.
The model established by Popat et al. (1996) and considered in the CFD code used by Skjold
(2007) clearly provides the best fitting with the experimental data from this work, with an
average difference of 20%. The difference can be due to experimental uncertainties, notably
concerning the point at SuT/SuL = 6.8, but also to the different assumptions concerning the
correlation, such as a constant kinematic viscosity and the integral length scale li equal to 1 cm
(Skjold, 2003). A proper estimation of the turbulent velocity being essential to provide an
accurate risk assessment concerning the consequences of an explosion, further investigations
on such models are required.

Chapter 6: Flame propagation study
[176]
Summary
To overcome the influence of the operating conditions on the explosion severity parameters,
efforts focused on the determination of the laminar burning velocity, an intrinsic property of
the fuel-air mixture. This chapter was divided into three parts, respectively dedicated to an
experimental and numerical determination of the laminar burning velocity of nanocellulose,
and to the application of turbulent flame velocity models.
In the first part, the laminar burning velocity of nanocellulose has been assessed by three
different methods. The first two methods consists in the direct visualization of the flame
propagation at low turbulence in a vertical 1 m long tube or in a vented 20L sphere coupled
with the application of relationships relating the flame speed and its stretching, while the third
relies on the use of correlations based on the pressure time evolution during a standard
explosion test. All three methods lead to similar values of nanocellulose-air laminar burning
velocity, i.e. approximately 21 cm.s-1. It was notably underlined that using such flame
propagation analyses at low turbulence can support the development of interesting semi-empiric
correlations allowing the estimation of the laminar burning velocity from the knowledge of the
pressure-time evolution in the standard 20L sphere.
The laminar burning velocity of nanocellulose was also determined using a one-dimensional
flame propagation model already validated for hybrid mixtures. The numerical system,
composed of mass and energy balances equations and of mass reaction rates adapted to the
combustion reactions, was solved by the finite volume method, considering in a first approach
a propagation by conduction and convection. Two cases were compared: the simultaneous
pyrolysis of the dust and combustion of the pyrosis gases on the one hand, and only the
combustion of the pyrolysis gases, considering a fast devolatilization of organic powders
(notably highlighted in chapter 4) on the other hand. Both methods led to similar values, with
a decrease of only 12% in the laminar flame velocity when considering the pyrolysis reaction,
which validates the hypothesis of a fast pyrolysis step not limiting the combustion. Since, in
practice, the devolatilization is not instantaneous, the particles that did not react yet can
contribute to the radiative heat transfer, which was then added to the energy balance. The
existence of a linear relation between the laminar flame velocity and the total surface area
developed by the particles implied in the radiative heat transfer was highlighted, proving once
again the importance of the reactive surface area. An increase up to 19% in the laminar burning
velocity was observed when considering the contribution of the radiative heat transfer to the
flame propagation. Indeed, although the heat transfer of nanoparticles tends to be neglected due
to Rayleigh scattering, which does not contribute to the flame propagation, the contribution of
the remaining micro-agglomerates (Mie scattering) after dispersion must be considered.
In the last part, the laminar burning velocity was converted in a turbulent burning velocity using
existing models. However, the calculations did not show a good consistency with the values
obtained experimentally, showing that the conversion from the laminar burning velocity to a
turbulent burning velocity knowing the turbulent conditions is far from being trivial for dusts.
Chapter 6: Flame propagation study
[177]
Résumé
Afin de maîtriser l’influence des conditions opératoires sur les paramètres de sévérité
d’explosion, les efforts se sont focalisés sur la détermination de la vitesse laminaire de flamme,
un paramètre intrinsèque au mélange poussière-air. Ce chapitre est divisé en trois parties,
respectivement dédiées à la détermination expérimentale et numérique de la vitesse laminaire
de flamme de la nanocellulose, et à l’application des modèles de vitesses de flamme turbulentes.
Dans la première partie, la vitesse laminaire de flamme de la nanocellulose a été estimée par
trois différentes méthodes. Les deux premières consistent en une visualisation directe de la
propagation de flamme à faible turbulence dans un tube vertical de 1 m de long et dans une
sphère de 20L éventée, couplée à l’application de relations liant la vitesse de la flamme et son
étirement, tandis que la troisième méthode repose sur l’utilisation d’une corrélation basée sur
l’évolution de la pression en fonction du temps durant un essai standard d’explosion. Ces trois
méthodes ont mené à des valeurs similaires de vitesses laminaires de flamme pour la
nanocellulose, d’environ 21 cm.s-1. Il a notamment été souligné que ces analyses de propagation
de flamme à faible turbulence peuvent aider au développement de corrélations semi-empiriques
permettant une estimation de la vitesse laminaire de flamme à partir de la connaissance de
l’évolution de la pression avec le temps dans la sphère de 20L.
La vitesse laminaire de flamme de la nanocellulose a également été déterminée à l’aide d’un
modèle numérique de propagation de flamme en une dimension, déjà validé pour des mélanges
hybrides. Le système numérique, composé d’équations de bilans de masse et d’énergie et de
vitesses de réactions massiques adaptées aux réactions de combustion, a été résolu par la
méthode des volumes finis, en considérant dans un premier temps une propagation par
convection et conduction. Deux approches ont été comparées : une réaction simultanée de
pyrolyse de la poudre et de combustion des gaz de pyrolyses d’un côté, et la combustion des
gaz de pyrolyse, considérant une dévolatilisation rapide des poudres organiques (notamment
discuté dans le chapitre 4) de l’autre. Les deux méthodes ont conduit à des valeurs similaires,
avec une diminution de 19% dans la valeur de vitesse laminaire de flamme en considérant la
réaction de pyrolyse, ce qui valide l’hypothèse d’une pyrolyse rapide ne limitant pas la
combustion. Puisqu’en pratique, la dévolatilisation n’est pas instantanée, les particules qui
n’ont pas encore réagi peuvent contribuer au transfert radiatif, qui a donc été ajouté au bilan
d’énergie. L’existence d’une relation linéaire entre la vitesse laminaire de flamme et la surface
totale développée par les particules impliquées dans le transfert radiatif a été démontrée,
prouvant une nouvelle fois l’importance de la surface reactive. Une augmentation de vitesse
laminaire de flamme atteignant 19% a notamment été observée en considérant la contribution
des particules au transfert de chaleur par rayonnement. En effet, bien que l’influence du transfert
thermique radiatif des nanoparticules a tendance à être négligée à cause d’une diffusion de
Rayleigh, la contribution des micro-agglomérats subsistant après la dispersion doit être prise en
compte.
Chapter 6: Flame propagation study
[178]
Dans la dernière partie, la vitesse laminaire de flamme a été reconvertie en une vitesse de
flamme turbulente à l’aide de modèles existants. Cependant, les valeurs calculées n’ont pas
démontré une bonne cohérence avec les valeurs mesurées expérimentalement, montrant que la
conversion de la vitesse laminaire de flamme vers une vitesse spatiale ou turbulence à partir des
conditions de turbulence est loin d’être trivial pour les poussières.
[179]
Chapter 7: Conclusion

Chapter 7: Conclusion
[180]
Conclusion (English)
This research work focuses on the adequacy of the standard methods to measure the ignition
sensitivity and explosion severity of a dust. The impact of the chemical nature, primary particle
size, agglomeration state, moisture content, ignition energy, dispersion procedure and ignition
delay time on the explosion severity was notably analyzed through the example of four types
of powders: nanocellulose, aluminum, carbon-coated silicon and carbon black. The aim of this
work was to bring new insights on the influence of nanoparticles specificities on their
explosivity in order to propose potential improvements and suggest alternative methods taking
their specificities into account.
In the following sections, the main results obtained in this study are summarized, improved
standard protocols are suggested, and some perspectives are discussed. In addition, some
industrial cases are analyzed with regard to these results in Appendix 3.
7.1. Main results
The dust explosion phenomenon can be decomposed into three different parts: the dust
dispersion, the ignition, and the explosion itself. This part presents the main results concerning
each of these phenomena, and a fourth part is dedicated to the results obtained on the flame
propagation study.
7.1.1. Dust dispersion
Due to their small size and high specific surface area, nanoparticles are prone to a reversible
agglomeration through weak bonding (van der Waals, electrostatic and capillary forces). This
agglomeration was notably highlighted through Scanning Electron Microscopy (SEM) analysis
and particle size distribution (PSD) measurements by wet dispersion and dry sedimentation. In
situ PSD analysis conducted in the 20L sphere, i.e. the standard apparatus to measure the
explosion severity of a dust, evidenced that the high shear stress induced by the dust injection
procedure leads to a fragmentation of these agglomerates, thus modifying the PSD of the dust
cloud. Such fragmentation depends on the cohesion strength of the agglomerates and is thus
different for each powder. Moreover, a preliminary preparation of the samples, such as sieving
or mechanical agglomeration, can impact the PSD before and after the dispersion, and thus the
explosion severity.
Therefore, the explosion severity measured using the standardized procedure is not related to
the PSD measured before dispersion, but to the PSD of the dust cloud. The latter contains micro-
agglomerates still subsisting after dispersion as well as small agglomerates in the nano-range,
which can greatly affect the reactivity of the dust cloud. In order to accurately analyze the
obtained values, this fragmentation must be kept in mind, especially for the development of
models on the dust dispersion and dust cloud behavior. It should also be noted that the
dispersion procedures in the 20L sphere is different from that of the apparatuses for ignition
Chapter 7: Conclusion
[181]
sensitivity measurements (modified Hartmann tube, Godbert-Greenwald oven), which implies
a different fragmentation of the agglomerates.
7.1.2. Dust ignition
Standards tests were performed to measure the ignition sensitivity of the chosen powders.
Except for the carbon black, the considered powders are particularly sensitive and can be ignited
by electrical sparks of several millijoules. However, according to EN 14034 standards, the
ignition energy to apply when evaluating the explosion severity of a dust in the 20L sphere is
10 kJ, which can lead to an overdriving phenomenon, i.e. a perturbation of the flame
propagation due to the excessive amount of energy provided. This phenomenon, already
identified for micropowders, can be enhanced when testing dusts with a very low minimum
ignition energy (MIE), such as aluminum that can be ignited by an electrical spark of 1 mJ, or
even nanocellulose with an MIE of 5 mJ. Thus, the ignition energy should be adapted for the
evaluation of the explosion severity of nanopowders, or this phenomenon should at least be
better considered by assessing the additional energy.
Moreover, when testing very sensitive powders, generally metal-based powders (e.g.
aluminum), a pre-ignition can occur during the pressurization of the dust container before the
activation of the igniters. To avoid such phenomenon that leads to a misestimation of the
pressure-time evolution in the 20L sphere and damages the apparatus, the dust could be placed
directly in the combustion chamber and lifted by the air injection. It should be noted that, for
such ignition sensitive powders, the injection using an inert gas in an oxygen enriched vessel to
avoid the ignition during the pressurization should be avoided, due to a possible spontaneous
ignition of the dust when in contact with the oxygen enriched atmosphere.
The effects of the moisture content of the powder and atmosphere on the ignition sensitivity of
the powders were also investigated. Minimum ignition energy measurements on the raw and
dried nanocellulose notably showed that the drying step increases the ignition sensitivity of the
powder. The MIE of carbon black is higher than 1 J (Turkevitch et al., 2015), and the low MIE
of metal-based powders does not allow a clear observation of variations when drying the
powder. Nevertheless, organic powders should be dried under vacuum before the tests, at the
temperature that does not degrade the product, in order to obtain the most conservative results.
Finally, it was shown through the examples of nanocellulose and carbon-coated silicon that the
agglomeration tends to decrease the ignition sensitivity of the powders, even increasing the
MIE from 5 mJ for the raw powder to higher than 1 J for the agglomerated samples. A
mechanical agglomeration of the powders, for powder transport, for instance, could then be
considered as an application of inherent safety principles. However, it should be kept in mind
that during an industrial accident, several phenomena can lead to a fragmentation of the
agglomerates, which may then exhibit an ignition sensitivity similar to the raw powder, i.e. the
powder which was not mechanically agglomerated.

Chapter 7: Conclusion
[182]
7.1.3. Dust explosion
Explosion severity tests were also performed in the standard 20L sphere in standard conditions
and highlighted that nanopowders exhibits rather similar maximum overpressures with regard
to microparticles. Indeed, this parameter is mainly affected by the thermodynamics and thus by
amount of powder that reacts. For the same mass concentration, two powders of the same nature
but different particle sizes should then lead to similar maximum overpressures. The same effect
was notably evidenced when agglomerating the powder through the examples of nanocellulose
and carbon-coated silicon.
On the contrary, the maximum rate of pressure rise is a parameter mainly affected by the
kinetics. This contrast between the two explosion severity parameters was notably evidenced
by assessing the influence of the moisture on the explosion severity. While the moisture content
of the carbon black and nanocellulose did not affect the maximum overpressure, significant
variations appeared in the maximum rate of pressure rise. Indeed, in the presence of humidity,
water can play the role of a heat sink (in the case of nanocellulose) or react either with the
powder or the pyrolysis gases to form hydrogen, thus modifying the reaction kinetics (notably
in the case of aluminum and carbon black).
In a general way, for the same powder nature, higher maximum rates of pressure rise were
obtained with nanoparticles with regard to microparticles. This can be explained by a
modification in the kinetic limitation when decreasing the particle size to the nano-range. This
kinetic variation was also observed when performing mechanical agglomeration, notably on
carbon-coated silicon. Thus, a characterization of the dust cloud after dispersion is necessary in
order to know exactly what explodes and be able to model the reaction kinetics. Moreover,
since the combustion of organic powders is limited by the diffusion of the oxygen toward the
particle, the surface concentration should be considered instead of the mass concentration.
The influence of the initial turbulence on the explosion severity was also investigated through
modifications in the ignition delay time. It appeared that increasing the turbulence increases the
mass transfer through flame stretching, which favorizes the propagation of the flame. However,
a too high turbulence may lead to micro-scale flame quenching whereas a too low turbulence
can lead to the segregation of the agglomerates.
7.1.4. Flame propagation
To overcome the influence of the operating conditions on the explosion severity parameters,
the laminar burning velocity, an intrinsic property of the fuel-air mixture, was both
experimentally and numerically investigated on nanocellulose. The experimental estimation
was performed by flame visualization in two apparatuses, a flame propagation tube and a new
vented 20L sphere. Considering a fast devolatilization of organic dusts, the relations between
the spatial velocity, flame surface and flame stretching developed for gases were applied to the
nanocellulose. In addition, a semi-empiric correlation based on the standard parameters
Chapter 7: Conclusion
[183]
measured in the 20L was used. All three methods led to similar values of laminar burning
velocity of nanocellulose, around 21 cm.s-1.
This value was confirmed by a one-dimensional flame propagation model considering a
propagation in quiescent conditions. The numerical system, composed of mass and energy
balances equations and of mass reaction rates adapted to the combustion reactions, was resolved
by the finite volume methods. Two approaches were compared: the dust combustion,
considering the pyrolysis of the dust and the combustion of the emitted gases, and the
combustion of the pyrolysis gases only. Similar values were obtained, validating the hypothesis
of a fast devolatilization of the powder. In a second time, the radiative heat transfer was added
to the energy balance, increasing the laminar burning velocity up to 19% depending on the
particle size and concentration. These two parameters were combined to calculate a total
reactive surface area. A linear relation between the laminar burning velocity and the total
reactive surface area of the particles contributing to the radiation heat transfer was then
evidenced. Depending on this contribution, laminar burning velocities from 17.5 to 20.8 cm.s-1
were obtained, showing a good consistency between the experimental and numerical methods.
7.2. Come up to standard !
All along this work, some issues concerning the standard procedure for testing the explosion
severity of nanopowders were evidenced through the example of powders of different natures.
To overcome such issues, some refined procedures related to different points discussed by the
standards EN 14034 are proposed in this section: sample preparation, dust dispersion system,
test procedure, ignition source and test report. In addition, further considerations are discussed,
notably concerning the ignition sensitivity measurements and the flame propagation.
7.2.1. Sample preparation
Due to the agglomeration phenomenon inherent to nanoparticles, the particle size distribution
(PSD) is greatly modified before and after dispersion. Thus, the explosion severity measured in
the 20L sphere may not correspond to the powder PSD measured before dispersion. When
possible, the PSD of the dust cloud should then be measured after dispersion in similar
conditions to that of the 20L sphere (high shear stress).
Since such estimation is difficult in practice due to the opacity of the standard 20L sphere, a
correlation between the powder properties and the mean diameter after dispersion could be
used. For instance, the relation established by dimensional analysis of the dispersion
phenomenon in chapter 3 could be reinforced by complementary dispersion tests on different
powders. Moreover, the PSD measurements should systematically be conducted in dry
conditions to limit the influence of the solvent on the agglomeration state and improve the
accuracy of the measured values.
Chapter 7: Conclusion
[184]
Concerning the effects of humidity, it should be reminded that the presence of water does not
necessarily decrease the explosion severity, notably due to the possible generation of hydrogen
(e.g. with aluminum, silicon carbide). At least one test should then be conducted at the optimal
concentration, i.e. the concentration leading to the most severe explosion, by modifying
(decreasing or, if impossible, increasing) the moisture content of the powder to consider this
possibility.
7.2.2. Test procedure
The standard test procedure consists in vacuuming the combustion chamber to 0.4 bara, and
placing the required amount of dust in the dust container, which is then pressurized to an
overpressure of 20 bar. The electrovalve then opens, starting the dispersion and reaching
atmospheric pressure in the 20L sphere. The standard ignition delay time between the beginning
of the dispersion and the activation of the two igniters of 5 kJ is of 60 ms. After the explosion,
the pressure-time evolution is recorded, and, after cleaning, the procedure is repeated at
different concentrations.
However, it was evidenced in this work that the low minimum ignition energy (MIE) of
nanoparticles can have a strong impact on the explosion severity measured depending on the
ignition energy, due to an overdriving phenomenon. Thus, the ignition energy should be chosen
as a function of the MIE instead of being fixed to the highest value allowing the explosion.
Moreover, the agglomeration state of the powder can greatly affect the dust cloud
characteristics: for instance, the presence of big agglomerates after the dispersion can, in
addition to combustion mechanisms modifications, influence the initial turbulence level if the
agglomerates do not follow the flow. Since this phenomenon is represented by the
dimensionless Stokes number (St), it could be used to determine the injection procedure to
apply during the tests. Coupling the Stokes number to the dustiness index (DI), characterizing
the ability of a powder to release fine particles, would then provide information on the dust
cloud behavior: if the powder easily releases nanoparticles, these particles will be present in the
dust cloud, thus increasing its reactivity. Indeed, a relatively low Stokes number and high
dustiness index characterize a weak agglomerate cohesion.
A proposal of standard procedure modifications is then presented in Figure 7-1. The critical
values of MIE were fixed to 1 J and 3 mJ. Indeed, a MIE higher than 1 J traduces that the
powder is almost insensitive to electrostatic ignition, implying that a high ignition energy, of
several kilojoules for instance, may be required to ignite the powder. In contrast, a MIE lower
than 3 mJ implies that the sample is extremely sensitive to electrostatic ignition (Janes et al.,
2008). In such cases, to avoid a pre-ignition during the pressurization, a dispersion by dust
lifting, i.e. by placing the dust directly in the 20L sphere, is preferred.
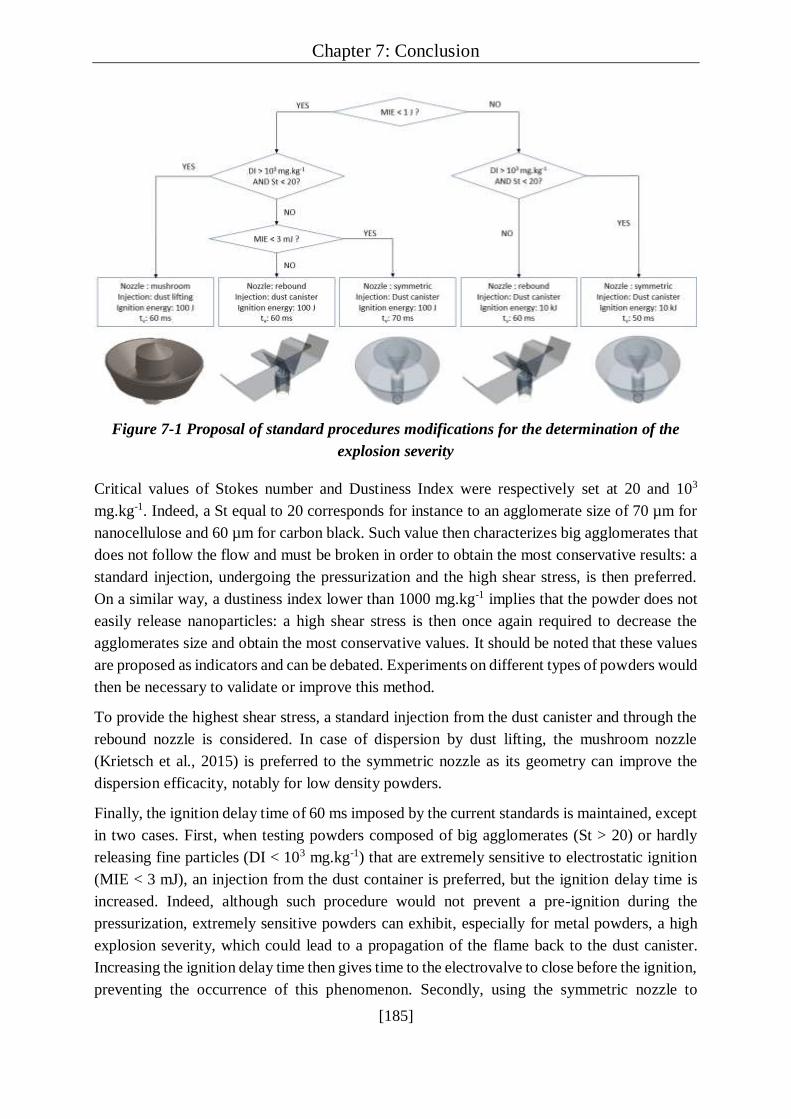
Chapter 7: Conclusion
[185]
Figure 7-1 Proposal of standard procedures modifications for the determination of the
explosion severity
Critical values of Stokes number and Dustiness Index were respectively set at 20 and 103
mg.kg-1. Indeed, a St equal to 20 corresponds for instance to an agglomerate size of 70 µm for
nanocellulose and 60 µm for carbon black. Such value then characterizes big agglomerates that
does not follow the flow and must be broken in order to obtain the most conservative results: a
standard injection, undergoing the pressurization and the high shear stress, is then preferred.
On a similar way, a dustiness index lower than 1000 mg.kg-1 implies that the powder does not
easily release nanoparticles: a high shear stress is then once again required to decrease the
agglomerates size and obtain the most conservative values. It should be noted that these values
are proposed as indicators and can be debated. Experiments on different types of powders would
then be necessary to validate or improve this method.
To provide the highest shear stress, a standard injection from the dust canister and through the
rebound nozzle is considered. In case of dispersion by dust lifting, the mushroom nozzle
(Krietsch et al., 2015) is preferred to the symmetric nozzle as its geometry can improve the
dispersion efficacity, notably for low density powders.
Finally, the ignition delay time of 60 ms imposed by the current standards is maintained, except
in two cases. First, when testing powders composed of big agglomerates (St > 20) or hardly
releasing fine particles (DI < 103 mg.kg-1) that are extremely sensitive to electrostatic ignition
(MIE < 3 mJ), an injection from the dust container is preferred, but the ignition delay time is
increased. Indeed, although such procedure would not prevent a pre-ignition during the
pressurization, extremely sensitive powders can exhibit, especially for metal powders, a high
explosion severity, which could lead to a propagation of the flame back to the dust canister.
Increasing the ignition delay time then gives time to the electrovalve to close before the ignition,
preventing the occurrence of this phenomenon. Secondly, using the symmetric nozzle to
Chapter 7: Conclusion
[186]
improve the dust cloud homogeneity, the turbulence level is lower than with the rebound nozzle.
The ignition delay time is then reduced to approach the turbulence level obtained with the
rebound nozzle.
7.2.3. Test report
Complementary to the information already included in the test report according to EN 14034
standards, some elements should be added. Indeed, the report recipient should be alerted of the
influence of the turbulence conditions and dust concentration on the explosion severity. Thus,
instead of only providing the values of Pmax and KSt, accent should be made on the evolution of
Pm and (dP/dt)m with the dust concentration, highlighting the fact that the maximum values are
not absolute values necessary attained during a dust explosion.
Moreover, as specified in the standard, two additional tests must be conducted at the
concentrations around the optimal concentration. Instead of performing these tests at the same
ignition delay time, it could be modified (e.g. ± 20 ms) in order to highlight the impact of the
operating conditions on the explosion severity parameters.
7.2.4. Flame propagation
As discussed in chapter 6, the laminar burning velocity of the dust could be considered as a
standard parameter describing the explosion severity of nanopowders, as it does not depend on
the operating conditions. However, its experimental determination is not trivial, and the
definition of a determination protocol is required. Measurements at low turbulence, allowed by
the low sedimentation rate, tube could be conducted in a flame propagation and the flame
propagation could be recorded using a high-speed video camera. To simplify the video analysis,
the evolution of the flame front position could be considered instead of the flame surface to
calculate the spatial velocity. A standard software should then be developed in order to estimate
the laminar burning velocity from such experiments. Another solution relies on the use of a
correlation relating the explosion severity parameters (Pmax, dP/dtmax) to the laminar burning
velocity, such as that developed by Silvestrini et al. (2008). However, this relation does not
seem applicable for high concentrations. Experiments in a flame propagation tube could then
be realized at different concentrations in order to reinforce the correlation.
7.2.5. Further considerations
The cube-root law, used to extrapolate the results from laboratory to industrial conditions, relies
on different hypotheses. Among them, the flame thickness must be negligible with regard to
the vessel radius but can be increased by the radiative heat transfer. Theoretically, the
contribution of the radiative heat transfer for nanoparticles to the flame propagation is
negligible due to a Rayleigh scattering. However, due to the agglomeration inherent to
nanoparticles, agglomerates of a few micrometers are still present after dispersion, and can
contribute to the flame propagation through Mie scattering. Such contribution would then
Chapter 7: Conclusion
[187]
increase the flame thickness, and then invalidate the cube-root law. The influence of the
radiative heat transfer on the flame propagation should then be further investigated, as discussed
in section 7.4.
Finally, it should be noted that the ignition sensitivity measurements are conducted in different
apparatuses than the explosion severity, implying a different dispersion procedure and thus, a
different fragmentation efficiency. To obtain the most conservative values, a higher shear stress,
improving the agglomerates breakage, should be considered. This point is further discussed in
section 7.4. Concerning the determination of the LEL, the ignition energy to apply during the
tests should be adapted on a similar way than for explosion severity experiments, i.e. depending
on the MIE.
7.3. Perspectives for further works
The results of this work evidenced variations in the ignition sensitivity and explosion severity
of powders when decreasing the particle size from the microscale to the nanoscale and led to
some proposal concerning the standard procedure to follow when evaluating these parameters
for nanopowders. However, further research is still necessary to define a standard procedure
leading to reliable values in accordance with nanoparticles specificities.
Due to the influence of the powder characteristics on the properties of the dust cloud, notably
highlighted in chapter 3, developing a single standard procedure to apply to every powder
would not allow an accurate representation of their specificities. The determination of the
‘optimal’ dispersion conditions could be realized by the use of a Computational Fluid Dynamics
(CFD), preferably at low concentration to reduce the calculation time. In a similar way than the
laminar burning velocity, each powder would then exhibit its own optimal dispersion conditions
as an intrinsic property, that could lead either to the values the most representative of an
industrial accident or to the most conservative could be estimated.
The influence of the agglomeration on the ignition sensitivity and explosion severity was
investigated on nanocellulose through powder sieving and mechanical agglomeration.
However, the agglomerates generated by these methods were not strong enough to resist to the
shear stress induced by the injection procedure in the 20L sphere, thus preventing from
accurately evaluating the influence of the agglomeration level in the dust cloud on its explosion
severity. Since the experiments conducted on the agglomerated carbon-coated silicon led to
encouraging results on this subject, a similar agglomeration process than that used for such
agglomeration could be applied to nanopowders of different nature to evaluate the effects of
the agglomeration on each type of combustible powder.
Such experiments could be conducted in standard conditions, but also by modifying the
injection procedure and the nozzle to represent different accidental conditions. More
specifically, the slotted and perforated cylindrical nozzles, designed at the end of the
experimental work, could be used to model a crack in a pipeline. An evaluation of the evolution
of the turbulence with time within the 20L sphere would then be required to characterize the

Chapter 7: Conclusion
[188]
related dust cloud, for instance through Particle Image Velocimetry (PIV) measurements.
Moreover, since each nozzle induce a different fragmentation of the agglomerates, experiments
could be performed at different ignition delay times to obtain the same initial turbulence in the
20L sphere. The influence of the turbulence being removed, the influence of the particle size
distribution on the explosion severity could be isolated. Such consideration was unfortunately
impossible by comparing the symmetric nozzle to the rebound nozzle due to a too similar
fragmentation of the agglomerates.
The shear stress related to the dust dispersion in the 20L sphere was much discussed in this
work, and it was attributed to the pressurization of the dust canister followed by the passage in
the duct and electrovalve. However, such procedure is not applied to the modified Hartmann
tube for the measurement of the minimum ignition energy. In addition to performing tests on a
mechanically agglomerated powder as previously described to evaluate the influence of the
agglomeration on the MIE, modifications could be realized in the dispersion procedure in the
modified Hartmann tube. Thus, a dust container equipped with an electrovalve could be
implemented to this apparatus to reproduce the turbulence and shear stress induced by the
dispersion procedure in the 20L sphere. Nevertheless, it should be noticed that, since a
pressurization of the container at 20 barg would probably damage the tube, this pressure should
be adapted to the geometry of the apparatus. In addition, the ‘mushroom’ nozzle could be
substituted by another nozzle, which could be a rebound nozzle to induce the same dispersion
than in the 20L sphere.
The same procedure could also be applied to the flame propagation tube. Moreover, flame
propagation experiments conducted on agglomerated powders could highlight the influence of
the agglomeration on the laminar burning velocity. In addition, such tests could be conducted
on powders of different nature, to investigate on the applicability of the models established for
gases to powders. If not, new relations for the evaluation of the laminar burning velocity of
dusts could be determined, notably relying on numerical models and requiring an estimation of
the combustion reactions. Although the contribution of the radiative heat transfer was
evidenced, an experimental determination would be interesting. Such estimation would notably
be possible using an infrared camera coupled to a sapphire window.
Let us be clear: standards are essential. But when they face a grain of sand, they sometimes take
a long time to adapt to a changing context. By being inherently more adaptive to different
materials and industrial contexts, they would gain in reactivity. It’s time to gear up!
Chapter 7: Conclusion
[189]
Conclusion (French)
Ce travail de thèse s’est focalisé sur l’évaluation des risques liés aux explosions de
nanoparticules, et plus spécifiquement sur l’adéquation des méthodes standards pour la mesure
de la sensibilité à l’inflammation et la sévérité d’explosion. L’impact de la nature chimique, du
diamètre primaire de particule, de l’état d’agglomération, de la teneur en eau, de l’énergie
d’inflammation, de la procédure de dispersion et du délai d’inflammation sur la sévérité
d’explosion a notamment été analysé à travers l’exemple de quatre types de poudres :
nanocellulose, aluminium, silicium enrobé de carbone et noir de carbone. L’objectif de ce
travail était d’apporter de nouvelles connaissances concernant l’influence des spécificités des
nanoparticules sur leur explosivité de manière à proposer des améliorations et méthodes
alternatives adaptées à ces spécificités.
Dans les sections suivantes, les résultats principaux obtenus dans cette étude sont résumés, et
quelques perspectives sont discutées.
Principaux résultats
Une explosion de poussière peut être décomposée en trois phénomènes différents : la dispersion
de la poudre, l’inflammation, et l’explosion elle-même. Cette partie présente les principaux
résultats concernant chacun de ces phénomènes, et une quatrième section est dédiée aux
résultats obtenus lors de l’étude de propagation de flamme.
Dispersion de la poudre
Du fait de leur petite taille et grande surface spécifique, les nanoparticules ont tendance à
s’agglomérer de manière réversible, par des liaisons faibles (forces de van der Waals,
électrostatiques et capillaires). Cette agglomération a notamment été mise en évidence par des
analyses par microscopie électronique à balayage (MEB) et mesures de distribution de tailles
de particules (DTP) en voie liquide et par sédimentation en voie sèche. Des mesures in situ
conduites dans la sphère de 20L, i.e. l’appareil standard de mesure de la sévérité d’explosion
d’une poussière, ont démontré que le fort cisaillement induit par la procédure d’injection de la
poudre conduit à la fragmentation partielle de ces agglomérats, modifiant ainsi la DTP du
nuage. Cette fragmentation dépend de la contrainte de cohésion des agglomérats et est ainsi
différente pour chaque poudre. De plus, une analyse préliminaire des échantillons, tels que du
tamisage ou une agglomération mécanique, peut impacter la DTP avant et après dispersion, et
par là même la sévérité d’explosion.
Il en résulte que la sévérité d’explosion mesurée en utilisant la procédure standard n’est pas liée
à la DTP mesurée avant dispersion, mais à celle du nuage. Ce dernier contient des agglomérats
micrométriques subsistant après la dispersion ainsi que des petits agglomérats nanométriques,
ce qui peut fortement affecter la réactivité du nuage. Afin d’analyser de manière précise les
valeurs obtenues, cette fragmentation devrait être gardée en mémoire, notamment lors du
Chapter 7: Conclusion
[190]
développement de modèles concernant le phénomène de dispersion de poudre et les
caractéristiques du nuage généré. Il est également à noter que la procédure de dispersion dans
la sphère de 20L est différente de celle des appareils de mesure de sensibilité à l’inflammation
(tube de Hartmann modifié, four de Godbert-Greenwald), ce qui implique une différente
fragmentation des agglomérats.
Inflammation du nuage
Des essais standards ont été réalisés pour mesurer la sensibilité à l’inflammation des poudres
considérées. A l’exception du noir de carbone, les poudres considérées sont particulièrement
sensibles et peuvent être enflammées par des étincelles de quelques millijoules. Cependant,
selon les standards EN 14034, l’énergie d’inflammation à appliquer lors de l’évaluation de la
sévérité d’explosion d’une poudre dans la sphère de 20L est de 10 kJ, ce qui peut conduire à un
phénomène dit « d’overdriving », i.e. une perturbation de la propagation de flamme à cause de
la quantité excessive d’énergie fournie au nuage. Ce phénomène, déjà identifié pour les poudres
micrométriques, peut être renforcé en testant des poudres présentant une énergie minimale
d’inflammation (EMI) faible, telles que l’aluminium qui peut être enflammé par une étincelle
de 1 mJ, ou même la nanocellulose qui présente une MIE de 5 mJ. Ainsi, l’énergie
d’inflammation devrait être adaptée à l’évaluation de la sévérité d’explosion des nanopoudres,
ou ce phénomène devrait au moins être mieux considéré en estimant l’énergie supplémentaire
apportée.
De plus, en testant des poudres très sensibles, généralement des poudres à base métallique (e.g.
aluminium), une pré-inflammation peut se produire durant la pressurisation du réservoir à
poussière avant l’activation des inflammateurs. Afin d’éviter ce phénomène qui conduit à une
mauvaise estimation de l’évolution de la pression avec le temps dans la sphère de 20L et peut
endommager l’appareil, la poudre peut être placée directement dans la chambre de combustion
et soulevée par l’injection d’air. Il est à noter que, pour ces poudres sensibles, l’injection par un
gaz inerte dans une enceinte enrichie en oxygène afin d’éviter la pré-inflammation pendant la
pressurisation est à proscrire, à cause d’une possible inflammation spontanée de la poudre lors
du contact avec l’atmosphère enrichie en oxygène.
Les effets de la teneur en eau de la poudre et de l’atmosphère sur la sensibilité à l’inflammation
des poudres ont aussi été investigués. Des mesures d’EMI sur la nanocellulose non modifiée et
séchée ont notamment montré que le séchage accroit la sensibilité à l’inflammation de la
poudre. En revanche, l’EMI du noir de carbone est supérieure à 1 J (Vignes, 2008) et la faible
EMI des poudres à base métallique ne permet pas d’observer une variation claire en séchant la
poudre. Cependant, les poudres organiques devraient être séchées avant les essais afin d’obtenir
les valeurs les plus conservatives.
Enfin, il a été montré à travers des exemples de la nanocellulose et du silicium enrobé de
carbone que l’agglomération tend à décroître la sensibilité à l’inflammation des poudres,
augmentant même l’EMI de 5 mJ pour la poudre libre de silicium enrobé de carbone jusqu’à
Chapter 7: Conclusion
[191]
plus d’un joule pour les échantillons agglomérés. L’agglomération mécanique des poudres, par
exemple pour faciliter leur transport, peut ainsi être considérée comme une application des
principes de sécurité intrinsèque. Cependant, il doit être gardé en mémoire que durant un
accident industriel, différents phénomènes sont susceptibles de conduire à la fragmentation des
agglomérats, qui présenteraient alors une sensibilité à l’inflammation similaire à la poudre libre,
i.e. la poudre non agglomérée.
Explosion
Des essais de sévérité d’explosion ont aussi été réalisés dans la sphère de 20L dans les
conditions définies par les standards internationaux EN 14034, et ont démontré que les
nanopoudres présentent des surpressions maximales d’explosion similaires à celles des
microparticles. En effet, ce paramètre est essentiellement affecté par la thermodynamique mise
en jeu, et ainsi par la quantité de poudre qui réagit. Pour une même concentration massique,
deux poudres de la même nature, mais présentant des tailles de particules différentes, devraient
ainsi logiquement conduire à des surpressions maximales similaires. Le même effet a
notamment été mis en lumière lors de l’agglomération de la poudre à travers les exemples de la
nanocellulose et du silicium enrobé de carbone.
Au contraire, la vitesse maximale de montée en pression est un paramètre principalement
affecté par la cinétique. Ce contraste entre les deux paramètres de sévérité d’explosion a
notamment été mis en avant lors de l’étude de l’influence de la teneur en eau sur la sévérité
d’explosion. Tandis que la teneur en eau du noir de carbone et de la nanocellulose n’a pas eu
d’effet sur la surpression d’explosion, des variations significatives sont apparues dans les
valeurs de vitesses de montée en pression. En effet, en présence d’eau, une partie de l’énergie
peut être utilisée pour la vaporisation de l’eau (dans le cas de la nanocellulose) ou l’eau peut
réagir pour former de l’hydrogène, modifiant ainsi la cinétique de réaction (notamment dans le
cas de l’aluminium et du noir de carbone).
De manière générale, pour une même nature de poudre, des vitesses maximales de montée en
pression plus élevées ont été obtenues pour des nanoparticules en comparaison avec les
microparticules. Cela peut s’expliquer par une modification de limitation cinétique en
diminuant la taille de particules jusqu’à l’échelle nanométrique. Cette variation cinétique a
également été observée en réalisant une agglomération mécanique, notamment sur le silicium
enrobé de carbone. Ainsi, une caractérisation du nuage après dispersion est nécessaire afin de
savoir exactement ce qui explose et être à même de modéliser la cinétique de réaction. De plus,
puisque la combustion des poudres organiques est limitée par la diffusion de l’oxygène vers la
particule, la concentration surfacique devrait être considérée pour l’analyse à la place de la
concentration massique.
L’influence de la turbulence initiale sur la sévérité d’explosion a également été investiguée à
travers des modifications de délai d’inflammation. Il est apparu qu’augmenter la turbulence
augmente le transfert de matière grâce à l’étirement de la flamme, ce qui favorise la propagation
Chapter 7: Conclusion
[192]
de la flamme. Cependant, un niveau de turbulence trop élevé peut mener à une extinction de
flamme tandis qu’un niveau de turbulence trop faible peut conduire à la sédimentation des
agglomérats.
Propagation de flamme
Afin de s’affranchir de l’influence des conditions opératoires sur les paramètres de sévérité
d’explosion, la vitesse laminaire de flamme, une propriété intrinsèque au mélange poussière-
air, a été évalué à la fois de manière expérimentale et numérique pour la nanocellulose. La
détermination expérimentale a été réalisée par visualisation de la propagation de la flamme dans
deux appareils, un tube de propagation de flamme et une sphère éventée. En considérant une
dévolatilisation rapide des poudres organiques, les relations entre la vitesse spatiale, la surface
de flamme et l’étirement de la flamme développées pour les gaz ont été appliquées pour la
nanocellulose. En complément, une corrélation semi-empirique basée sur les paramètres
standards mesurés dans la sphère de 20L a été appliquée. Ces trois méthodes ont conduit à des
valeurs similaires de vitesses laminaires de flamme pour la nanocellulose, aux environs de 21
cm.s-1.
Cette valeur a été confirmée par un modèle de propagation de flamme en une dimension
considérant un milieu non turbulent. Le système numérique, composé de bilans de masse et
d’énergie et de vitesses de réactions adaptées aux réactions de combustion, a été résolu par la
méthode des volumes finis. Deux approches ont été comparées : la combustion de la poudre
d’une part, considérant à la fois la pyrolyse de la poudre et la combustion des gaz de pyrolyse,
et la combustion directe des gaz de pyrolyse d’autre part. Des valeurs similaires ont été
calculées, validant ainsi l’hypothèse d’une dévolatilisation rapide de la poudre. Dans un second
temps, the transfert radiative a été ajouté au bilan d’énergie, augmentant alors la vitesse
laminaire de flamme de la nanocellulose jusqu’à 19% en fonction de la concentration et de la
taille des particules contribuant au rayonnement. Ces deux paramètres ont été combinés pour
calculer une surface spécifique volumique, et l’existence d’une relation linéaire liant la vitesse
laminaire de flamme à la surface spécifique volumique des particules contribuant au transfert
radiatif a été soulignée. Selon cette contribution, des vitesses luminaires de flame de 17.5 à 20.8
cm.s-1 ont été obtenues, démontrant ainsi une bonne cohérence entre les méthodes
expérimentales et numériques.
Perspectives
Les résultats de ce travail ont montré des variations dans la sensibilité d’inflammation et la
sévérité d’explosion des poudres lors de la diminution de la taille des particules de l’échelle
micrométrique vers l’échelle nanométrique et ont mené à des propositions concernant les
procédures standard à suivre lors de l’évaluation de ces paramètres pour des nanopoudres.
Cependant, des recherches plus poussées sont toujours nécessaires afin de définir une procédure
standard menant à des résultats fiables en accord avec les spécificités des nanoparticules.

Chapter 7: Conclusion
[193]
Du fait de l’influence des caractéristiques des poudres sur les propriétés du nuage, notamment
démontrée dans le chapitre 3, développer une unique procédure standard à appliquer à chaque
poudre ne permettrait pas une représentation fidèle de leurs spécificités. La détermination de
conditions « optimales » de dispersion pourrait être réalisée à l’aide de codes CFD,
préférentiellement à faible concentration pour réduire le temps de calcul. D’une manière
similaire à la vitesse laminaire de flamme, chaque poudre pourrait alors être associée à ses
propres conditions optimales de dispersion, telle une propriété intrinsèque, qui pourraient mener
soit aux valeurs les plus représentatives d’un accident industriel ou aux valeurs les plus
conservatives.
L’influence de l’agglomération sur la sensibilité à l’inflammation et la sévérité d’explosion a
été investiguée à travers la nanocellulose en tamisant la poudre et par agglomération mécanique.
Cependant, les agglomérats générés par ces méthodes n’étaient pas assez solides pour résister
au cisaillement induit par la procédure d’injection dans la sphère de 20L, empêchant ainsi
d’évaluer précisément l’influence de l’état d’agglomération du nuage sur sa sévérité
d’explosion. En revanche, puisque les essais conduits sur les agglomérats de silicium enrobé de
carbone ont mené à des résultats encourageants, un procédé d’agglomération similaire à celu i
utilisé dans ce cas pourrait être appliqué à des nanopoudres de différentes natures afin d’évaluer
les effets de l’agglomération sur chaque type de poudre combustible.
Ces essais pourraient être réalisés dans des conditions standard, mais aussi en modifiant la
procédure d’injection et le disperseur afin de représenter différentes conditions industrielles.
Plus précisément, les disperseurs fendus et perforés, fabriqués à la fin de la partie expérimentale
de ce travail, pourraient être utilisés pour modéliser la rupture d’une canalisation. Une
évaluation de l’évolution de la turbulence en fonction du temps dans la sphère de 20L serait
alors requise pour caractériser le nuage généré, par exemple par des mesures par PIV. De plus,
puisque chaque disperseur induit une fragmentation des agglomérats différente, des essais
pourraient être réalisés pour différents délais d’inflammation afin d’obtenir la même turbulence
initiale dans la sphère de 20L. L’influence de la turbulence étant supprimée, l’influence de la
DTP sur la sévérité d’explosion pourrait être isolée. Une telle considération était
malheureusement impossible en comparant le disperseur symétrique au disperseur standard à
cause d’une fragmentation des agglomérats similaire.
Le cisaillement induit par la dispersion de la poudre dans la sphère de 20L a été beaucoup
mentionné dans ce travail, et a été attribué à la pressurisation du réservoir à poudre suivi du
passage par la conduite et l’électrovalve. Cependant, cette procédure n’est pas appliquée au
tube de Hartmann modifié pour la mesure de l’énergie minimale d’inflammation. En
complément de mesures d’EMI sur des poudres mécaniquement agglomérées selon le principe
précédemment décrit afin d’évaluer l’influence de l’agglomération sur l’EMI, des modifications
dans la procédure d’injection pourraient être réalisées sur le tube de Hartmann modifié. Ainsi,
un réservoir à poudre équipé d’une électrovanne pourrait être implémenté à cet appareil afin de
reproduire la turbulence et le cisaillement induits par la procédure de dispersion dans la sphère
de 20L. Néanmoins, il est à noter que, puisque la pressurisation du réservoir à 20 bar
Chapter 7: Conclusion
[194]
endommagerait probablement le tube, cette pression devrait être adaptée à la géométrie de
l’appareil. De plus, le disperseur « champignon » pourrait être substitué par un autre disperseur,
e.g. le disperseur standard de la sphère de 20L redimensionné afin d’introduire la même
dispersion que dans la sphère de 20L.
La même procédure pourrait également être appliquée au tube de propagation de flamme. De
plus, des essais expérimentaux de propagation de flame conduits sur des poudres agglomérées
pourraient mettre en lumière l’influence de l’agglomération sur la vitesse laminaire de flamme.
En complément, de tels tests pourraient être réalisés sur des poudres de différentes natures, afin
d’investiguer sur l’applicabilité des modèles établis pour les gaz aux poudres. Si cela est
impossible, de nouvelles relations pour l’évaluation de la vitesse laminaire de flamme des
poussières pourraient être déterminées, notamment à l’aide de modèles numériques requérant
une estimation des réactions de combustion. Bien que la contribution du transfert radiatif à la
propagation de flamme a été numériquement estimée, une détermination expérimentale serait
intéressante. Une telle évaluation serait notamment possible à l’aide d’une caméra infra-rouge
couplée à une vitre en saphir, laissant traverser le rayonnement IR.
Une chose est sûre : les standards sont essentiels. Mais quand ils sont face à un grain de sable,
ils prennent parfois un long moment à s’adapter à un contexte changeant. En étant, de manière
inhérente, plus adaptables à différents matériaux et contextes industriels, ils gagneraient en
réactivité. Il est temps de s’adapter !

[195]
Appendix 1: SEM images
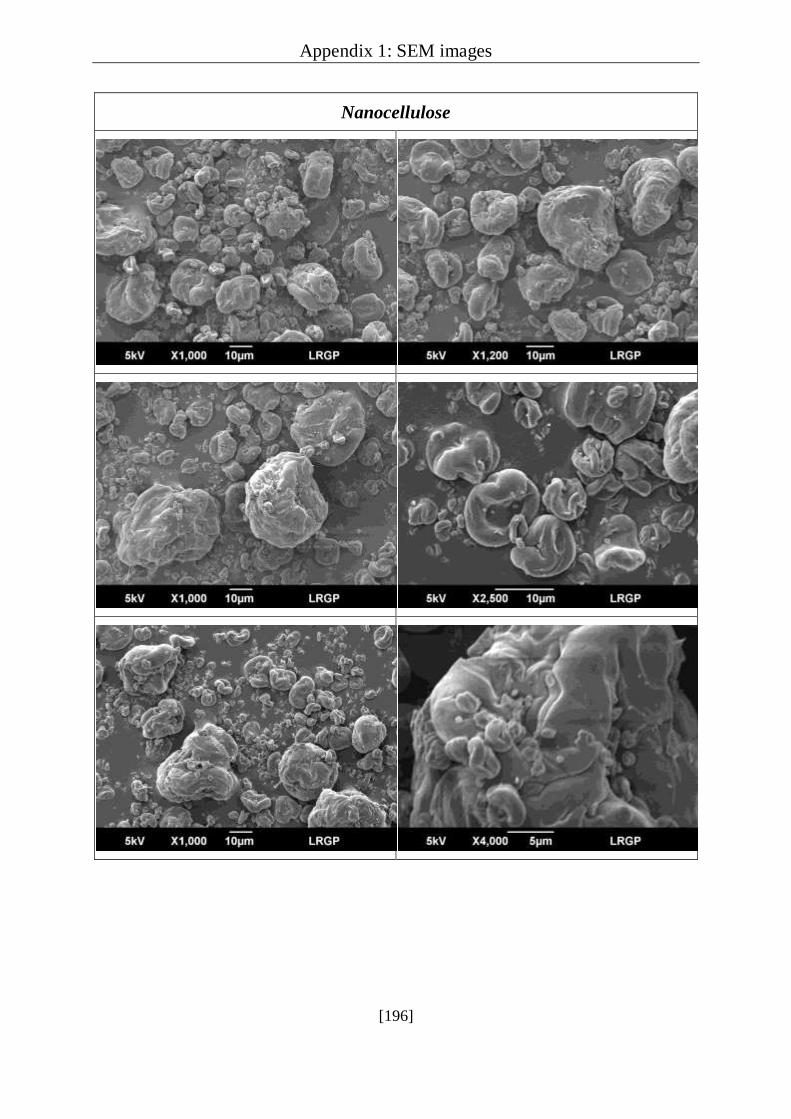
Appendix 1: SEM images
[196]
Nanocellulose
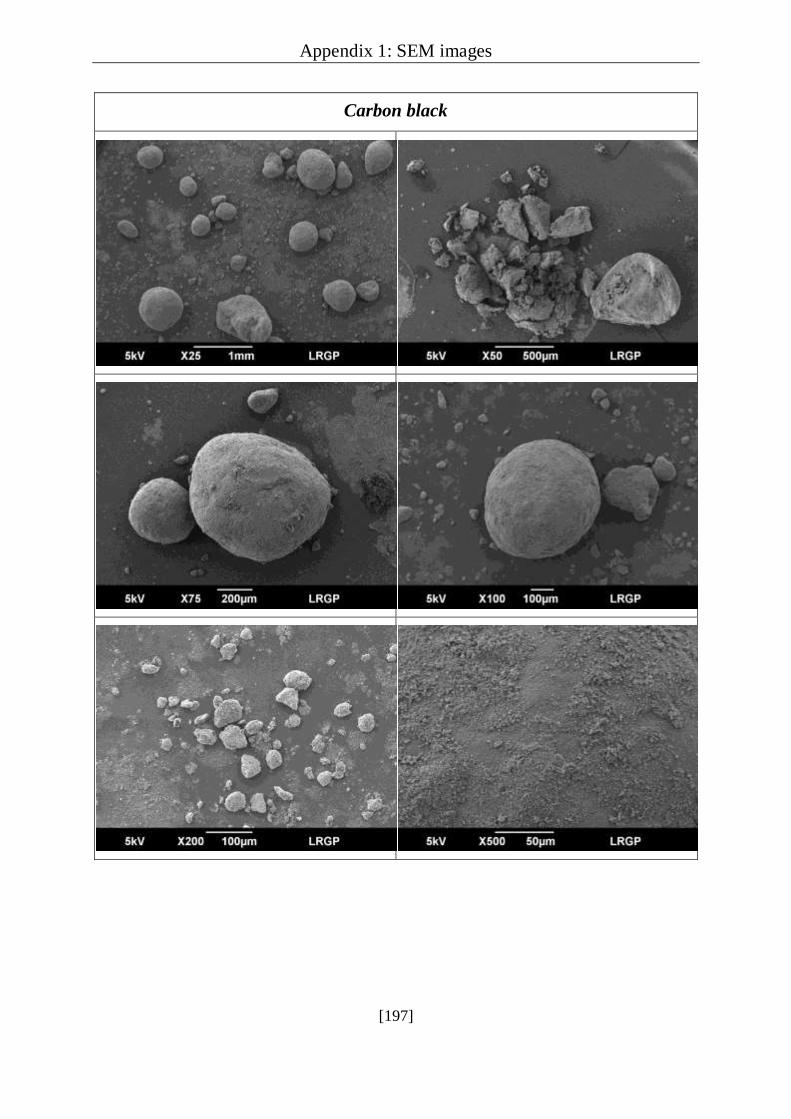
Appendix 1: SEM images
[197]
Carbon black
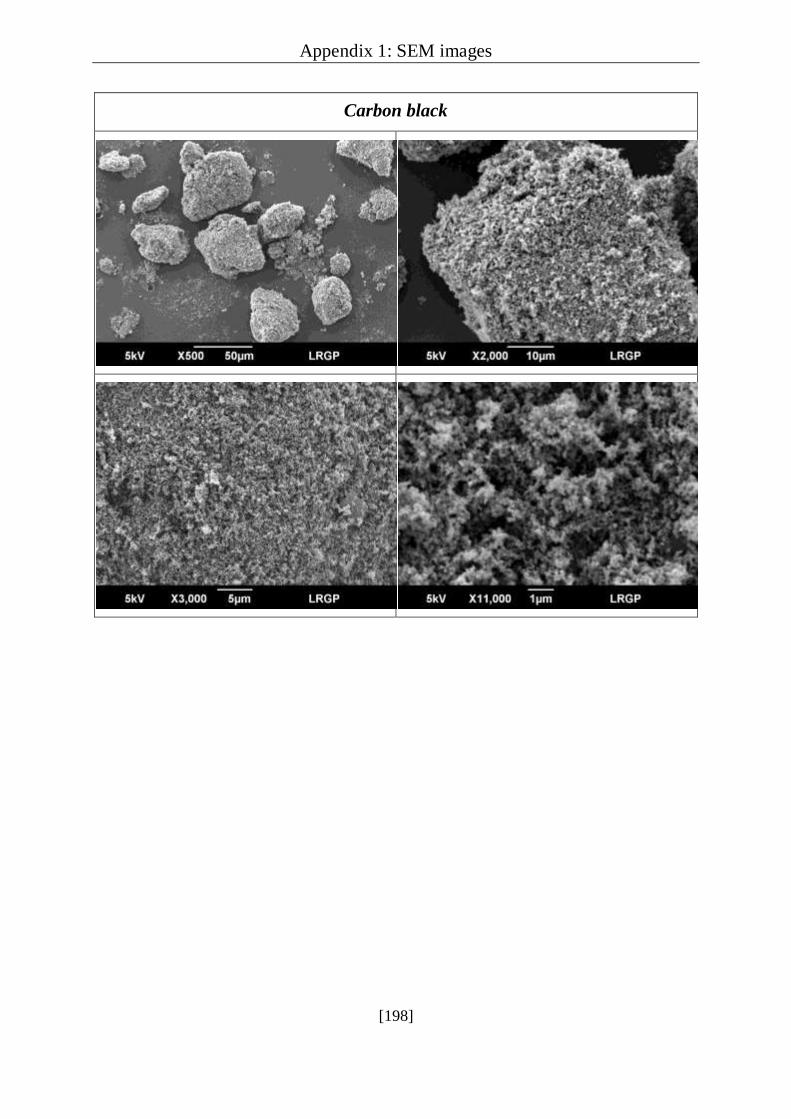
Appendix 1: SEM images
[198]
Carbon black

Appendix 1: SEM images
[199]
Dried carbon black (90°C under vacuum – Aw = 0.03)
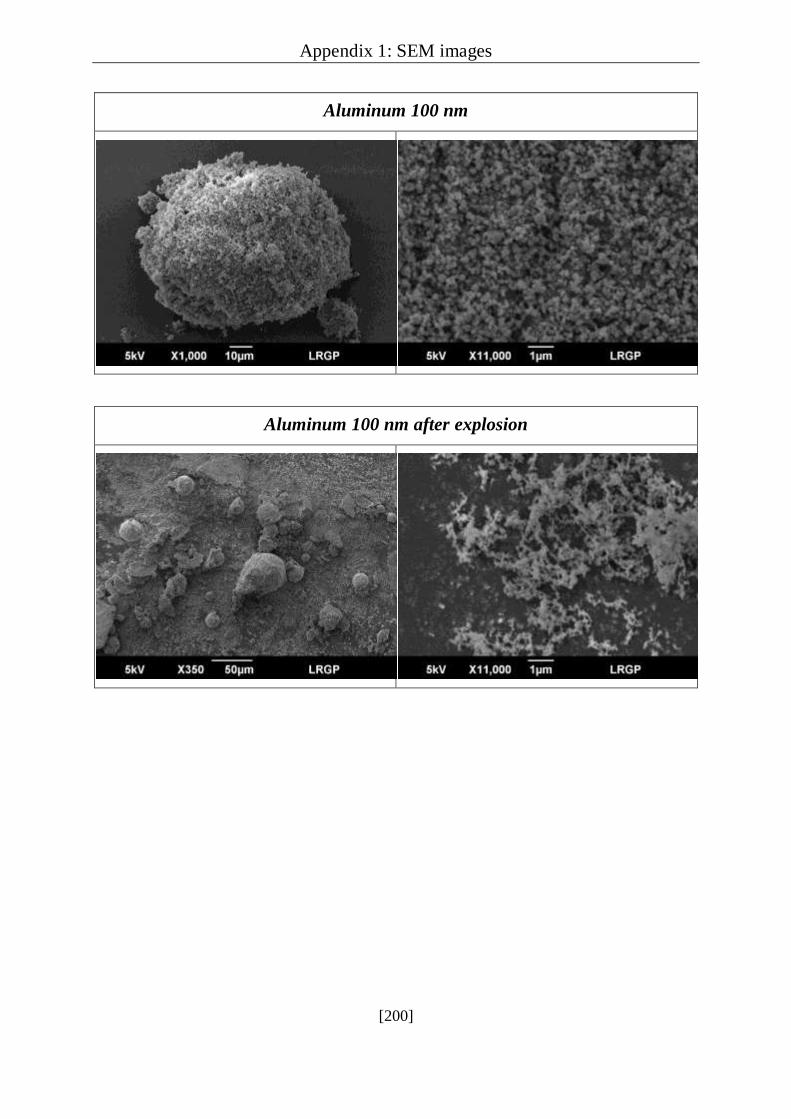
Appendix 1: SEM images
[200]
Aluminum 100 nm
Aluminum 100 nm after explosion

Appendix 1: SEM images
[201]
Aluminum 40-60 nm

Appendix 1: SEM images
[202]
Carbon-coated silicon (raw powder)

Appendix 1: SEM images
[203]
Carbon-coated silicon (agglomerated process A, 260 g.L-1)
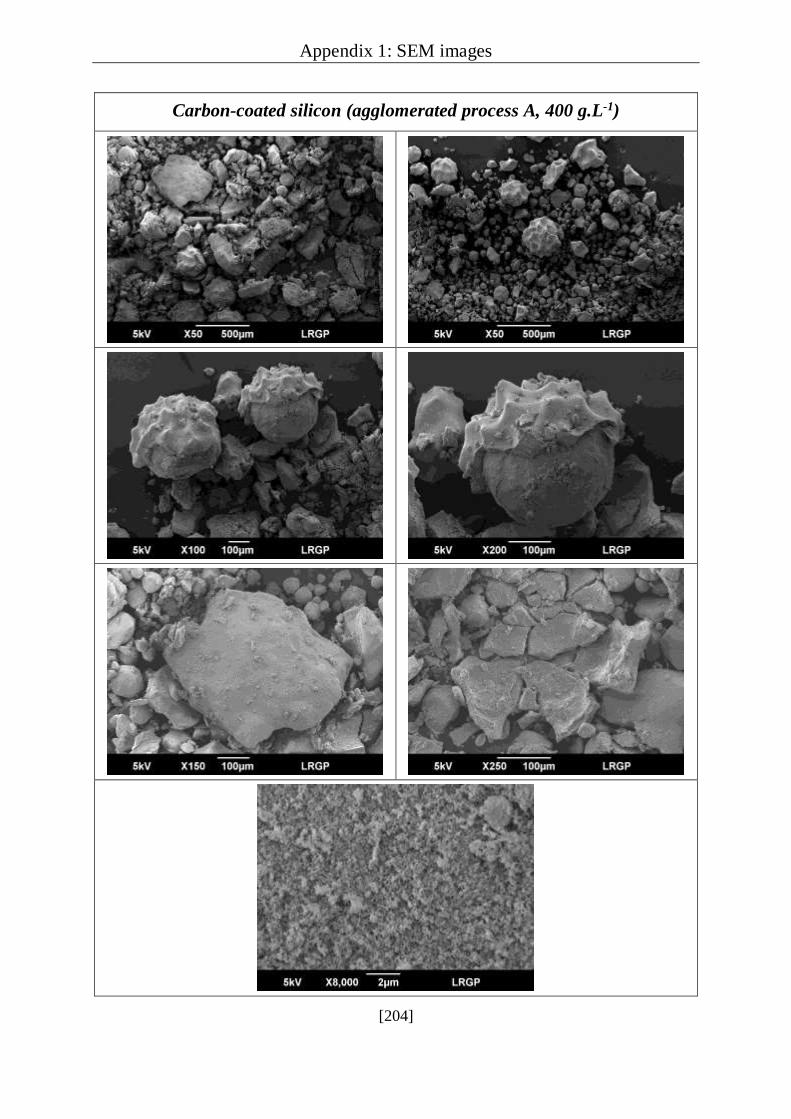
Appendix 1: SEM images
[204]
Carbon-coated silicon (agglomerated process A, 400 g.L-1)

Appendix 1: SEM images
[205]
Carbon-coated silicon (agglomerated process B, 400 g.L-1)

[206]
Appendix 2: A Monte Carlo Simulation
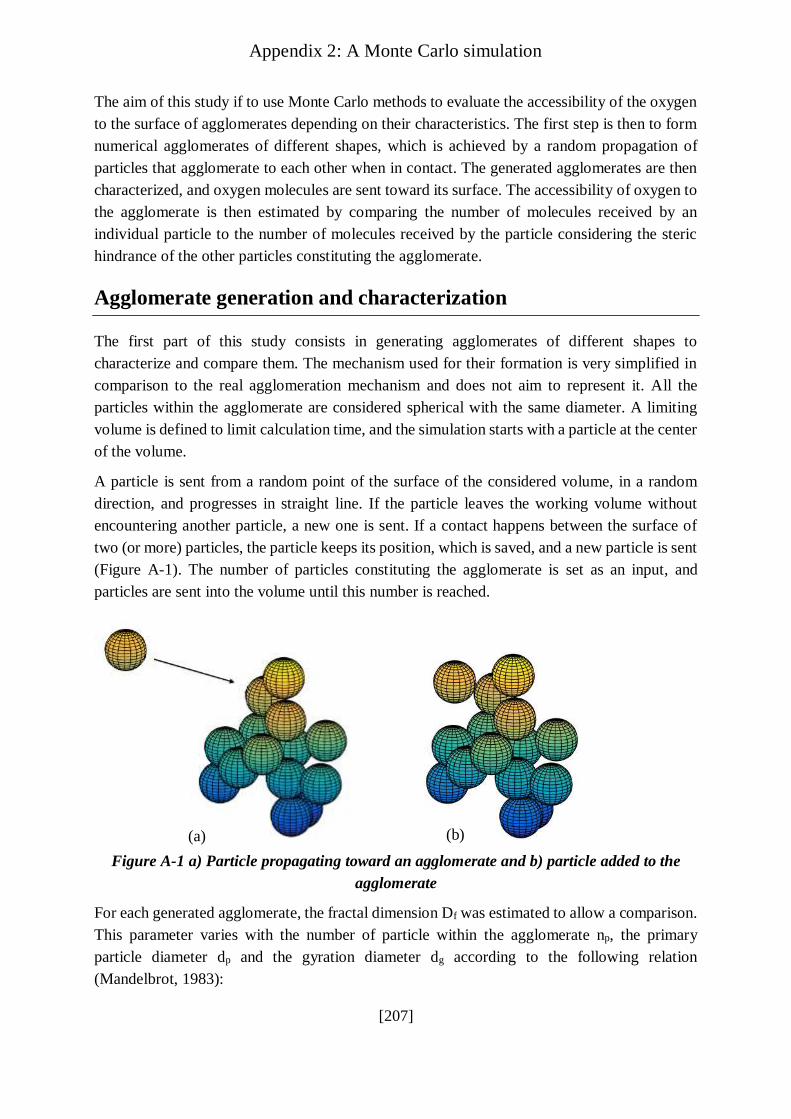
Appendix 2: A Monte Carlo simulation
[207]
The aim of this study if to use Monte Carlo methods to evaluate the accessibility of the oxygen
to the surface of agglomerates depending on their characteristics. The first step is then to form
numerical agglomerates of different shapes, which is achieved by a random propagation of
particles that agglomerate to each other when in contact. The generated agglomerates are then
characterized, and oxygen molecules are sent toward its surface. The accessibility of oxygen to
the agglomerate is then estimated by comparing the number of molecules received by an
individual particle to the number of molecules received by the particle considering the steric
hindrance of the other particles constituting the agglomerate.
Agglomerate generation and characterization
The first part of this study consists in generating agglomerates of different shapes to
characterize and compare them. The mechanism used for their formation is very simplified in
comparison to the real agglomeration mechanism and does not aim to represent it. All the
particles within the agglomerate are considered spherical with the same diameter. A limiting
volume is defined to limit calculation time, and the simulation starts with a particle at the center
of the volume.
A particle is sent from a random point of the surface of the considered volume, in a random
direction, and progresses in straight line. If the particle leaves the working volume without
encountering another particle, a new one is sent. If a contact happens between the surface of
two (or more) particles, the particle keeps its position, which is saved, and a new particle is sent
(Figure A-1). The number of particles constituting the agglomerate is set as an input, and
particles are sent into the volume until this number is reached.
Figure A-1 a) Particle propagating toward an agglomerate and b) particle added to the
agglomerate
For each generated agglomerate, the fractal dimension Df was estimated to allow a comparison.
This parameter varies with the number of particle within the agglomerate np, the primary
particle diameter dp and the gyration diameter dg according to the following relation
(Mandelbrot, 1983):
(a) (b)
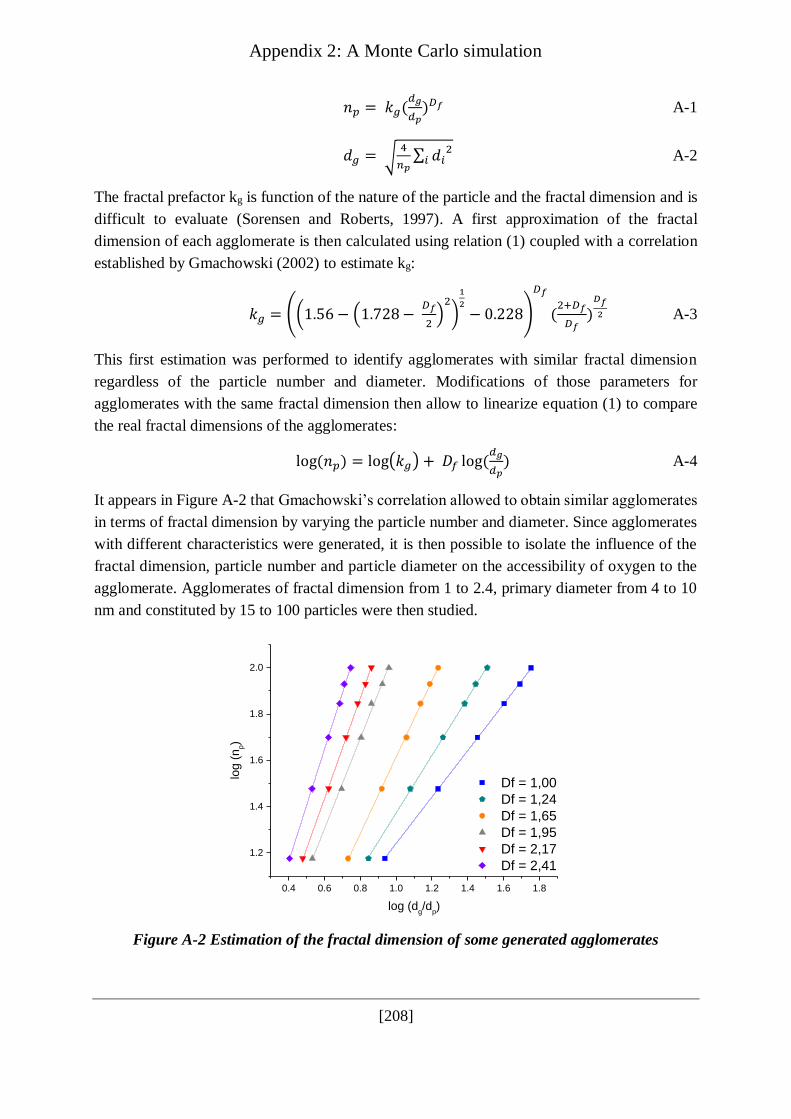
Appendix 2: A Monte Carlo simulation
[208]
𝑛𝑝 = 𝑘𝑔(𝑑𝑔
𝑑𝑝)𝐷𝑓 A-1
𝑑𝑔 = √4
𝑛𝑝∑ 𝑑𝑖
2𝑖 A-2
The fractal prefactor kg is function of the nature of the particle and the fractal dimension and is
difficult to evaluate (Sorensen and Roberts, 1997). A first approximation of the fractal
dimension of each agglomerate is then calculated using relation (1) coupled with a correlation
established by Gmachowski (2002) to estimate kg:
𝑘𝑔 = ((1.56 − (1.728 − 𝐷𝑓
2)
2
)
1
2
− 0.228)
𝐷𝑓
(2+𝐷𝑓
𝐷𝑓)
𝐷𝑓
2 A-3
This first estimation was performed to identify agglomerates with similar fractal dimension
regardless of the particle number and diameter. Modifications of those parameters for
agglomerates with the same fractal dimension then allow to linearize equation (1) to compare
the real fractal dimensions of the agglomerates:
log(𝑛𝑝) = log(𝑘𝑔) + 𝐷𝑓 log (𝑑𝑔
𝑑𝑝) A-4
It appears in Figure A-2 that Gmachowski’s correlation allowed to obtain similar agglomerates
in terms of fractal dimension by varying the particle number and diameter. Since agglomerates
with different characteristics were generated, it is then possible to isolate the influence of the
fractal dimension, particle number and particle diameter on the accessibility of oxygen to the
agglomerate. Agglomerates of fractal dimension from 1 to 2.4, primary diameter from 4 to 10
nm and constituted by 15 to 100 particles were then studied.
0.4 0.6 0.8 1.0 1.2 1.4 1.6 1.8
1.2
1.4
1.6
1.8
2.0
log
(n
p)
log (dg/d
p)
Df = 1,00
Df = 1,24
Df = 1,65
Df = 1,95
Df = 2,17
Df = 2,41
Figure A-2 Estimation of the fractal dimension of some generated agglomerates

Appendix 2: A Monte Carlo simulation
[209]
Oxygen propagation
Once the agglomerate is generated, dioxygen molecules are sent toward it. Since the molecule
propagates by turning on itself, to take the steric hindrance into account, it is considered to be
a sphere with a diameter of 0.292 nm, which is the molecular diameter of the dioxygen molecule
(Mukhopadhyay and Das, 1994). As previously, the molecule is sent from a random position
of a defined volume around the agglomerate and propagates in a random direction. Since this
simulation does not aim to represent the real adsorption phenomenon or molecule propagation,
but only the accessibility of the molecule to the agglomerate, the random initial position and
direction are considered sufficient to describe the Brownian motion of the molecules, which
propagate in straight line.
During the molecule propagation, three situations can be encountered. First, if the molecule
leaves the working volume, a new particle is sent with a new initial position and direction. Then,
the molecule can get in contact with another molecule already adsorbed at the particle surface.
Since the aim of the simulation is to evaluate the accessibility of the oxygen toward the
agglomerate, it is considered that only one molecule can be adsorbed at the same spot. The
propagating molecule is then reflected with the same plane and angle of incidence and keeps
stepping forward in its new direction. In the final case, the molecule gets in contact with a
particle of the agglomerate and is adsorbed at the particle surface. Its position is then saved and
a new molecule is sent. The number of dioxygen molecules to receive on the whole agglomerate
is fixed, and the generation stops when this number is reached. For each particle, the number
of molecules on its surface is saved. Figure A-4 shows the agglomerate covered by molecules,
represented by blue points.
Figure A-3 Particles of an agglomerate (Df = 2) covered by dioxygen molecules

Appendix 2: A Monte Carlo simulation
[210]
A second part consists in removing all particles from the agglomerate, except one, located at
the same place in the working volume, and sending the exact same molecules than previously,
in the same direction with the same initial position and angle. The number of molecules received
by the individual particle is saved and compared to the number of molecules that the same
particle received when being part of the agglomerate, i.e. when considering the hindrance of
the agglomerate. This operation is carried out for each particle constituting the agglomerate and
allows an estimation of the accessibility of the oxygen to each particle of the agglomerate. The
algorithm flow chart of the oxygen propagation and adsorption is presented in Figure A-4.
Figure A-4 Algorithm flow chart of the molecule propagation and adsorption to the
agglomerate

Appendix 2: A Monte Carlo simulation
[211]
Estimation of the accessibility of the oxygen to the agglomerate
The accessibility of oxygen to a particle is considered to be maximum when no other particle
is present in the working volume to stop the propagation of oxygen. The number of oxygen
molecules adsorbed at the surface of a particle in those conditions then represents an
accessibility of 100% toward this particle. The ratio between the number of molecules adsorbed
by a particle when considering the hindrance of the agglomerate to the number of molecules
adsorbed by the same independent particle then leads to an estimation of the accessibility of the
oxygen to the particle. The oxygen accessibility to the whole agglomerate is then calculated by
meaning the accessibilities to the particles.
Oxygen accessibility to one particle = nads by the particle in the agglomerate
nads by the particle alone A-5
Determination of the number of molecules to receive on the agglomerate
The arrangement of the particles being different for each agglomerate, fixing the total number
of molecules to send would lead to significant discrepancies in the operating conditions, as
different quantities of molecules would leave the working volume. Moreover, due to the
calculation method to estimate the oxygen accessibility to the agglomerate, sending molecules
until reaching a fixed value of accessibility is not suitable, as the condition could be reached by
only sending a few molecules, which would lead to inaccurate results. Thus, as previously
mentioned, the number of molecules to receive on the whole agglomerate was fixed to ensure
the same conditions were set up for the different agglomerates and to eliminate the influence of
the working volume on the results.
To determine the final value to set, simulations were performed on different agglomerates by
varying the number of molecules to receive. Figure A-5 represents the results obtained for
agglomerates of 15 particles with a primary diameter of 10 nm. It appears that the accessibility
of oxygen to the agglomerate increases slowly with the number of molecules received by the
agglomerate. Indeed, after being adsorbed on the easily accessible sites, molecules inevitably
reach locations more difficult to access, ending up covering all the agglomerate if a sufficient
number of molecules is sent. The aim of the simulation being to estimate how easily molecules
can have access to the agglomerate’s surface, the simulation was systematically stopped before
this value was reached. Moreover, it appears in Figure A-5 that the difference of accessibility
between agglomerates of different fractal dimensions is independent of the number of
molecules received, inducing that fixing this number allows a reliable comparison of the
accessibilities to the agglomerates. However, when less than 100 molecules are received on the
agglomerate, the simulation does not converge to a reliable value, with an uncertainty up to
10%. From 500 molecules received, an uncertainty of less than 1% is observed, implying a
sufficient number of molecules was received on the agglomerate. A compromise between
accuracy and simulation time was realized by systematically setting the number of molecules
to receive on the agglomerate to 5000, which provides an uncertainty always lower than 0.5%.

Appendix 2: A Monte Carlo simulation
[212]
Figure A-5 Evolution of oxygen accessibility with the number of molecules received on the
agglomerates of 15 particles with a primary diameter of 10 nm
Influence of the fractal dimension
Simulations were initially conducted by considering agglomerates constituted of 15 spherical
particles with a primary diameter of 10 nm. The evolution of the oxygen accessibility to such
agglomerates is presented in Figure A-6, and shows a decreasing tendency, from 84.1 ± 0.2%
of accessibility to an agglomerate with a fractal dimension of 1 to 66.1 ± 0.4% for agglomerates
presenting a fractal dimension of 2.41. An accessibility loss of 18% then appears when forming
compact agglomerates with regard to rather linear ones. Although the accuracy of each obtained
value is around 0.5%, agglomerates of fractal dimension around 2.1 exhibits accessibilities from
71.5 ± 0.3% to 76.1 ± 0.1%. This difference can be explained by the shape of such agglomerates.
Indeed, agglomerates with a fractal dimension of 1 tend to be linear whereas agglomerates of
fractal dimension equal to 3 tend be present a spherical shape. Between those extreme cases,
different arrangement possibilities between the particles can lead to agglomerates with a fractal
dimension equal to 2, which is not considered when calculating the fractal dimension,
suggesting that an additional parameter may be necessary to fully characterize the agglomerates
shape.
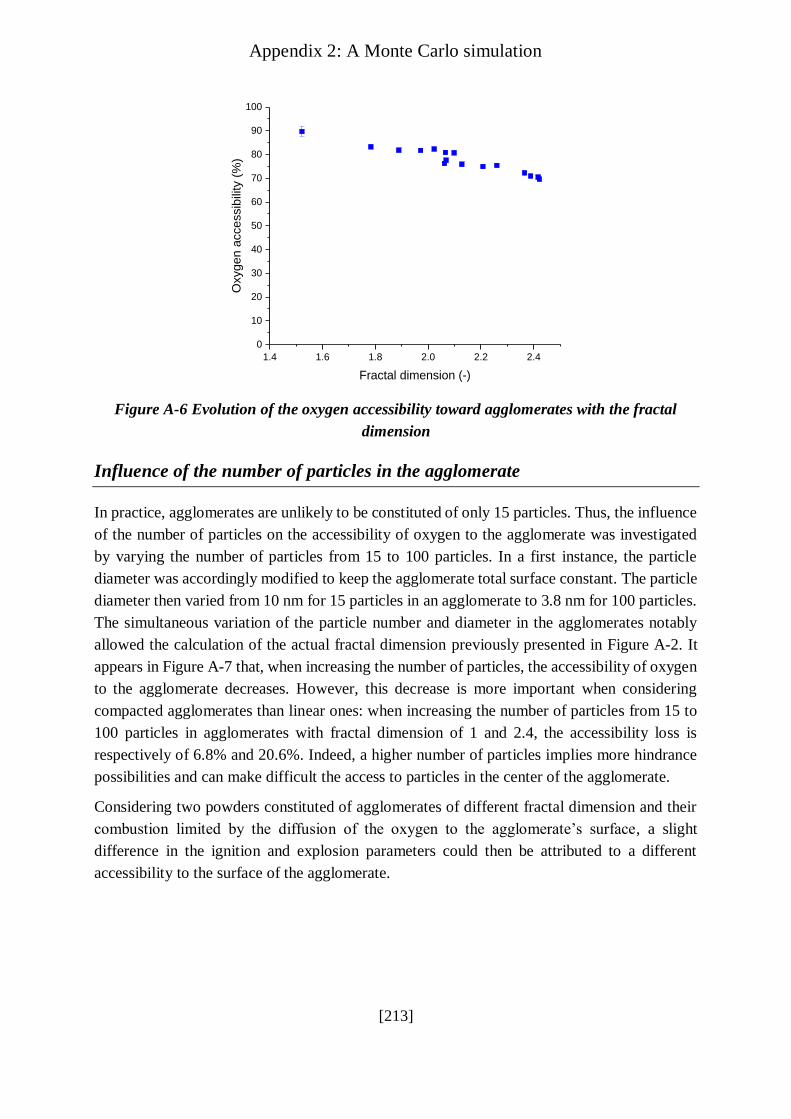
Appendix 2: A Monte Carlo simulation
[213]
1.4 1.6 1.8 2.0 2.2 2.4
0
10
20
30
40
50
60
70
80
90
100
Oxygen a
ccessib
ility
(%
)
Fractal dimension (-)
Figure A-6 Evolution of the oxygen accessibility toward agglomerates with the fractal
dimension
Influence of the number of particles in the agglomerate
In practice, agglomerates are unlikely to be constituted of only 15 particles. Thus, the influence
of the number of particles on the accessibility of oxygen to the agglomerate was investigated
by varying the number of particles from 15 to 100 particles. In a first instance, the particle
diameter was accordingly modified to keep the agglomerate total surface constant. The particle
diameter then varied from 10 nm for 15 particles in an agglomerate to 3.8 nm for 100 particles.
The simultaneous variation of the particle number and diameter in the agglomerates notably
allowed the calculation of the actual fractal dimension previously presented in Figure A-2. It
appears in Figure A-7 that, when increasing the number of particles, the accessibility of oxygen
to the agglomerate decreases. However, this decrease is more important when considering
compacted agglomerates than linear ones: when increasing the number of particles from 15 to
100 particles in agglomerates with fractal dimension of 1 and 2.4, the accessibility loss is
respectively of 6.8% and 20.6%. Indeed, a higher number of particles implies more hindrance
possibilities and can make difficult the access to particles in the center of the agglomerate.
Considering two powders constituted of agglomerates of different fractal dimension and their
combustion limited by the diffusion of the oxygen to the agglomerate’s surface, a slight
difference in the ignition and explosion parameters could then be attributed to a different
accessibility to the surface of the agglomerate.
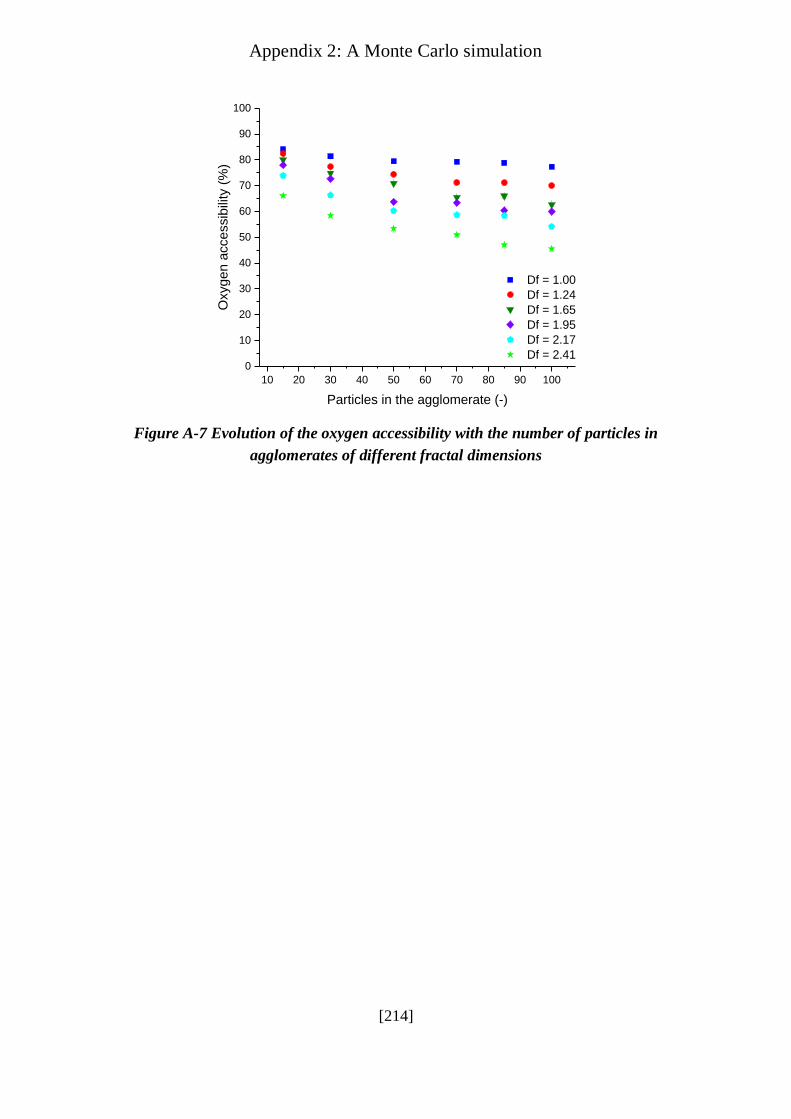
Appendix 2: A Monte Carlo simulation
[214]
10 20 30 40 50 60 70 80 90 100
0
10
20
30
40
50
60
70
80
90
100
Df = 1.00
Df = 1.24
Df = 1.65
Df = 1.95
Df = 2.17
Df = 2.41
Oxygen a
ccessib
ility
(%
)
Particles in the agglomerate (-)
Figure A-7 Evolution of the oxygen accessibility with the number of particles in
agglomerates of different fractal dimensions
[215]
Appendix 3: Case studies
Appendix 3: Case studies
[216]
The industrial situations in which nanoparticles could lead to an explosion are numerous and
varied, and trying to report all of them would be illusory. Nevertheless, the four powders
considered all along this manuscript will be placed in different industrial contexts based on the
information presented by Chaineaux (2004).
Aluminum
Different types of dust collectors exist in industries in order to collect the particles from the air,
for hygiene and safety reasons. These processes can be divided into two categories, depending
on whether it operates in dry or humid atmosphere, and will be examined through the example
of aluminum.
Among the dry dust collectors, a bag filter is constituted of a chamber in which sleeves are
vertically placed, and of an aspiration. This aspiration leads to dust collection on the sleeves
and allows air/dust separation. However, this aspiration can lead to the electrostatic charging
of the particles and possibly to an ignition. Indeed, it should be noted that this type of
electrostatic discharge generally releases an energy around 10 mJ, which is considerably higher
than the minimum ignition energy (MIE) of aluminum nanopowders (< 1 mJ), and, to a further
extent, of nanocellulose (5 mJ). To avoid an ignition, some measures must then be taken: for
instance, anti-electrostatic dust bag filter cloths should be used, and electrical grounding of
employees and plant should be considered. Moreover, if caking occurs on the sleeves, the
agglomeration state of the powder is modified. When unclogging the filters, the PSD is then
probably modified again, leading a different ignition sensitivity and explosion severity of the
powder. These parameters should then be determined for different PSD to accurately assess the
explosion risk.
Nanocellulose
As mentioned in chapter 2, cellulose nanocrystals are generally obtained by acid hydrolysis of
different cellulose sources, implying that a drying step is necessary to retrieve a dry powder.
The example of a spray drying is then considered in this part. This process is notably constituted
of a spray tower supplied in hot air, a vibrating bed, and cyclones connected to a dust collector
(Figure A-8).
Depending on the dustiness of the powder, the vibrating bed can release an important quantity
of fine particles and generate an explosive atmosphere (ATEX). Due to the high ignition
sensitivity of nanoparticles, such fine particles could be easily ignited, e.g. by a hot surface or
the hot air, or an electrostatic discharge, provided that energy input is sufficient. Indeed, the
minimum ignition temperature in cloud and energy of the nanocellulose respectively reached
420°C and 5 mJ for the dry powder. Thus, the dust deposit in the tower should be minimized,
notably due to the high dustiness of nanopowders.

Appendix 3: Case studies
[217]
Figure A-8 Scheme of a co-current spray tower equipped with a vibrating bed (from
Chaineaux (2004))
Moreover, the characteristics of the spray can affect the turbulence level in the tower, which
can directly impact the explosion severity in case of explosion. In addition, right after going
through the nozzle, the nanoparticles are not agglomerated yet, and will be very easy to ignite.
However, the air is the hottest at this point, which considerably increases the explosion risk.
The temperature of the air should then be lower than the MIT of the non-agglomerated
nanoparticles, whereas the MIT measured by the standard method corresponds to the MIT of
the agglomerates after dispersion in the Godbert-Greenwald oven. On the contrary, at the
bottom of the tower, the powder is agglomerated, which will tend to decrease the ignition
sensitivity and explosion severity of the powders. It should also be noted that the environment
is very humid, which can, in case of explosion, lead to reactions between the water and the
powder and increase the explosion severity, or, on the contrary, decrease it due to heat sink
effects.
Concerning the vibrating bed, the risk generally considered is a fire, but it could evolve into an
explosion when it comes to nanopowders, or micropowders releasing nanocrystals. Moreover,
the use of cyclones is not recommended for the filtration of nanoparticles. Indeed, a cyclone
separates the air from the particles by gravity, implying that the finest particles are not retained
in the cyclone.
Carbon-coated silicon
The effectiveness of the mechanical agglomeration of the powder to decrease both its ignition
sensitivity and explosion severity was evidenced through the example of the carbon-coated
silicon. Moreover, the agglomeration of powders can reduce particle emissions in the air during
handling facilitate the flowing of the product within industrial equipment and reduce cost of
Appendix 3: Case studies
[218]
transportation by increasing the bulk density of the powder. The agglomeration then limits the
formation of the ATEX and decreases the ignition sensitivity of the powder, and thus the
probability of ignition. Since such phenomenon does not modify the specific surface area,
agglomeration can then be seen as an inherent safety solution. However, the conditions of
handling and transporting must be carefully assessed as it may impact the level of fragmentation
of the powder and reduce consequently the level of agglomeration of the powder. The influence
of these conditions could be further assessed for instance by adjusting experimental conditions
to better reproduce industrial conditions of interest.
Carbon black
An aging phenomenon of the carbon black due to a long storage of more than ten years was
evidenced in chapter 5, and was notably attributed to the adsorption of water during this period.
At a first sight, the storage of carbon black is not likely to generate an ATEX or, if so, this
ATEX is not likely to be ignited without external intervention. However, the accident that
recently occurred in New Mexico, United States in 2018, mentioned in chapter 2, indicates just
the opposite with the collapsing of a silo holding more than 600 tons of coal that caused an
explosion and a fire.
Moreover, when discharging the silo, the height between the hopper and the collect system
should be as small as possible, since the turbulence level increases with the height. In a similar
way, the explosion risk is increased when charging a silo from the top due to the high turbulence
generated by the process.
Vent sizing is generally realized to protect from explosion scenarios. However, in such case,
the turbulence may be higher or, at least, different than that of the experiments, whereas the
cube-root law can be applied only if the turbulence temporal and spatial variations are similar
in both enclosures. The extrapolation from the laboratory conditions to industrial may then be
inaccurate, which could lead to an inadequate vent sizing.
[219]
References
References
[220]
2011/696/EU, 2011. Commission Recommendation of 18 October 2011 on the definition of
nanomaterial (Text with EEA relevance). Off. J. Eur. Union 3.
Abbasi, T., Abbasi, S.A., 2007. Dust explosions–Cases, causes, consequences, and control. J. Hazard. Mater. 140, 7–44.
Abitbol, T., Rivkin, A., Cao, Y., Nevo, Y., Abraham, E., Ben-Shalom, T., Lapidot, S.,
Shoseyov, O., 2016. Nanocellulose, a tiny fiber with huge applications. Curr. Opin. Biotechnol., Systems biology - Nanobiotechnology 39, 76–88.
Abuswer, M., Amyotte, P., Khan, F., 2013. A quantitative risk management framework for dust
and hybrid mixture explosions. J. Loss Prev. Process Ind. 26, 283–289.
Ali, M., Bonakdar, T., Ghadiri, M., Tinke, A., 2015. Particle Breakage in a Scirocco Disperser. Powder Technol., Pharmaceutical Particle Technology 285, 138–145.
Ali, M., Lin, L., Faisal, S., Ali, S.R., Ali, S.I., 2019. Let-down stability and screen printability
of inks prepared using non-printing ink grades of carbon black pigment. Pigment Resin Technol. 48, 523–532.
American Institute of Chemical Engineers (Ed.), 2017. Guidelines for combustible dust hazard
analysis, CCPS AIChE guidelines. CCPS, Center for Chemical Process Safety, New York, NY.
Amyotte, P.R., 2014. Some myths and realities about dust explosions. Process Saf. Environ.
Prot. 92, 292–299.
Amyotte, P.R., Basu, A., Khan, F.I., 2003. Reduction of Dust Explosion Hazard by Fuel Substitution in Power Plants. Process Saf. Environ. Prot. 81, 457–462.
Amyotte, P.R., Chippett, S., Pegg, M.J., 1988. Effects of turbulence on dust explosions. Prog.
Energy Combust. Sci. 14, 293–310.
Amyotte, P.R., Eckhoff, R.K., 2010. Dust explosion causation, prevention and mitigation: An overview. J. Chem. Health Saf. 17, 15–28.
Amyotte, P.R., Pegg, M.J., Khan, F.I., 2009. Application of inherent safety principles to dust
explosion prevention and mitigation. Process Saf. Environ. Prot., 12th International
Symposium of Loss Prevention and Safety Promotion in the Process Industries 87, 35–
39.
Amyotte, P.R., Pegg, M.J., Khan, F.I., Nifuku, M., Yingxin, T., 2007. Moderation of dust explosions. J. Loss Prev. Process Ind. 20, 675–687.
Andersen, J., Rasmussen, C.L., Giselsson, T., Glarborg, P., 2009. Global Combustion
Mechanisms for Use in CFD Modeling under Oxy-Fuel Conditions. Energy Fuels 23, 1379–1389.
Andrews, G.E., Bradley, D., 1972. Determination of burning velocities: A critical review.
Combust. Flame 18, 133–153.
Andrews, G.E., Bradley, D., Lwakabamba, S.B., 1975. Turbulence and turbulent flame propagation—A critical appraisal. Combust. Flame 24, 285–304.
ASTM E1226-19, 2019. Standard Test Method for Explosibility of Dust Clouds. In: Annual
Book of ASTM Standards. pp. 1–13.
ASTM E1491-06, 2012. Standard Test Method for Minimum Autoignition Temperature of Dust Clouds. In: Annual Book of ASTM Standards. pp. 1–11.
ASTM E1515-14, 2014. Standard Test Method for Minimum Explosible Concentration of Combustible Dusts. In: Annual Book of ASTM Standards. pp. 1–9.
References
[221]
ASTM E2019-03, 2007. Standard Test Method for Minimum Ignition Energy of a Dust Cloud
in Air. In: Annual Book of ASTM Standards. pp. 1–8.
Babrauskas, V., Britton, L.G., 2018. Errors in the Compilations of Minimum Explosion Concentration Values for Dust Clouds. Fire Technol. 54, 37–55.
Bagaria, P., Zhang, J., Yang, E., Dastidar, A., Mashuga, C., 2016. Effect of dust dispersion on
particle integrity and explosion hazards. J. Loss Prev. Process Ind. 44, 424–432.
Ballal, D.R., 1983. Flame Propagation Through Dust Clouds of Carbon, Coal, Aluminium and
Magnesium in an Environment of Zero Gravity. Proc. R. Soc. Lond. Math. Phys. Sci.
385, 21–51.
Bartknecht, W., 1989. Dust-explosions: course, prevention, protection. Springer-Verlag.
Baudry, G., 2007. Etude de l’inflammabilité d’un nuage de particules d’aluminium partiellement oxydées.
Bazyn, T., Krier, H., Glumac, N., 2007. Evidence for the transition from the diffusion-limit in
aluminum particle combustion. Proc. Combust. Inst. 31, 2021–2028.
Beeckmann, J., Hesse, R., Schaback, J., Pitsch, H., Varea, E., Chaumeix, N., 2019. Flame
propagation speed and Markstein length of spherically expanding flames: Assessment
of extrapolation and measurement techniques. Proc. Combust. Inst. 37, 1521–1528.
Belerrajoul, M., 2019. Modélisation multi-échelle de la combustion d’un nuage de particules (PhD Thesis). National Polytechnic Institute of Toulouse.
Ben Moussa, R., 2017. Contribution to thermal radiation to dust flame propagation : application
to aluminium dust explosions (PhD Thesis). Université de Technologie de Compiègne.
Bergstroem, L., Meurk, A., Rowcliffe, D.J., Arwin, H., 1996. Estimation of Hamaker constants of ceramic materials from optical data using Lifshitz theory. J. Am. Ceram. Soc. 79.
Bews, I.M., Hayhurst, A.N., Richardson, S.M., Taylor, S.G., 2001. The order, Arrhenius
parameters, and mechanism of the reaction between gaseous oxygen and solid carbon. Combust. Flame 124, 231–245.
Bidabadi, M., Azad, A.V., 2015. Effects of radiation on propagating spherical flames of dust–
air mixtures. Powder Technol. 276, 45–59.
Bideau, D., 2010. Développement d’un modèle instationnaire pour l’étude de l’instabilité
thermique de mélanges de solides pulvérulents - Application aux dépôts de poussières
métalliques.
Boilard, S.P., Amyotte, P.R., Khan, F.I., Dastidar, A.G., Eckhoff, R.K., 2013. Explosibility of micron- and nano-size titanium powders. J. Loss Prev. Process Ind. 26, 1646–1654.
Bollinger, R.E., Crowl, D.A., 1997. Inherently safer chemical processes: a life cycle approach.
Center for Chemical Process Safety of the American Institute of Chemical Engineers.
Bonakdar, T., Ali, M., Dogbe, S., Ghadiri, M., Tinke, A., 2016. A method for grindability testing using the Scirocco disperser. Int. J. Pharm. 501, 65–74.
Bonakdar, T., Ghadiri, M., 2017. Effect of Structure on Strength of Agglomerates using Distinct
Element Method [WWW Document]. EPJ Web Conf. URL http://eprints.whiterose.ac.uk/119912/ (accessed 11.28.19).
Börjesson, M., Westman, G., 2015. Crystalline Nanocellulose — Preparation, Modification,
and Properties. In: Poletto, M., Ornaghi, H.L. (Eds.), Cellulose - Fundamental Aspects and Current Trends. InTech.
Bouillard, J., Vignes, A., Dufaud, O., Perrin, L., Thomas, D., 2010. Ignition and explosion risks of nanopowders. J. Hazard. Mater. 181, 873–880.

References
[222]
Boutonnet Kizling, M., Gallas, J.P., Binet, C., Lavalley, J.C., 1992. Surface oxidation of silicon
carbide: quantitative measurement and Rh effect. Mater. Chem. Phys. 30, 273–277.
Bradley, D., 2000. Flame Propagation in a Tube: The Legacy of Henri Guenoche. Combust. Sci. Technol. 158, 15–33.
Bradley, D., Chen, Z., Swithenbank, J.R., 1989. Burning rates in turbulent fine dust-air
explosions. Symp. Int. Combust. 22, 1767–1775.
Bradley, D., Lawes, M., Mumby, R., 2017. Burning velocity and Markstein length blending laws for methane/air and hydrogen/air blends. Fuel 187, 268–275.
Bradley, D., Lee, J.H.S., 1984. . Proc. First Int. Colloq. Explos. Ind. Dusts 220–223.
Brequigny, P., Halter, F., Mounaïm-Rousselle, C., 2016. Lewis number and Markstein length
effects on turbulent expanding flames in a spherical vessel. Exp. Therm. Fluid Sci., Special issue on Ninth Mediterranean Combustion Symposium 73, 33–41.
Brunauer, S., Emmett, P.H., Teller, E., 1938. Adsorption of Gases in Multimolecular Layers. J.
Am. Chem. Soc. 60, 309–319.
BS EN 60529, 1992. Degrees of Protection Provided by Enclosures (IP Code).
Buckingham, E., 1914. On Physically Similar Systems; Illustrations of the Use of Dimensional Equations. Phys. Rev. 4, 345–376.
Calvert, G., Hassanpour, A., Ghadiri, M., 2013. Analysis of aerodynamic dispersion of cohesive
clusters. Chem. Eng. Sci. 86, 146–150.
Cashdollar, K.L., Hertzberg, M., Zlochower, I.A., 1989. Effect of volatility on dust
flammability limits for coals, gilsonite, and polyethylene. Symp. Int. Combust. 22,
1757–1765.
Cassel, H.M., Liebman, I., Mock, W.K., 1957. Radiative transfer in dust flames. Symp. Int. Combust., Sixth Symposium (International) on Combustion 6, 602–605.
CelluForce, 2016. Product Specification of CelluForce NCV100.
Center for Chemical Process Safety, 2004. Guidelines for Safe Handling of Powders and Bulk
Solids: CCPS/Guidelines. John Wiley & Sons, Inc., Hoboken, NJ, USA.
Cesana, C., Siwek, R., 2001a. MIKE 3-Minimum Ignition Energy.
Cesana, C., Siwek, R., 2001b. Operating instructions 20L apparatus.
Chaineaux, J., 2004. Sécurité des procédés mettant en œuvre des pulvérulents combustibles. INERIS report Ω-14, 76p.
Chan, M., Chong, S.J., 2016. Dust explosion from coloured powder causing severe burns. ANZ
J. Surg. 86, 103–104.
Chanut, C., 2018. Etude expérimentale de la propagation du front de flamme et de la vitesse de combustion d’une explosion de poussières d’aluminium (PhD Thesis). IMT Mines Alès.
Chen, Z., Ju, Y., 2007. Theoretical analysis of the evolution from ignition kernel to flame ball
and planar flame. Combust. Theory Model. 11, 427–453.
Clavin, P., 1985. Dynamic behavior of premixed flame fronts in laminar and turbulent flows. Prog. Energy Combust. Sci. 11, 1–59.
Clavin, P., Williams, F.A., 1979. Theory of premixed-flame propagation in large-scale
turbulence. J. Fluid Mech. 90, 589–604.
Cloney, C., 2018. 2018 Mid-Year Combustible Dust Incident Report - Version #1. DustEx Research Ltd.
References
[223]
Cloney, C., Snoeys, J., 2019. Chapter Three - Dust explosions: A serious concern. In: Amyotte,
P.R., Khan, F.I. (Eds.), Methods in Chemical Process Safety, Dust Explosions. Elsevier, pp. 33–69.
Clouthier, M.P., Cormier, L., Hodapp, M., Ogungbemide, D., 2019. Dust explosions: Safety
measures. In: Methods in Chemical Process Safety. Elsevier, pp. 193–228.
Condotta, R., 2005. Coulabilité des poudres cohésives : mesures aux faibles contraintes, granulaires humides et application à une poudre industrielle.
Cuervo, N., 2015. Influences of turbulence and combustion regimes on explosions of gas-dust
hydrid mixtures (PhD Thesis). The University of Lorraine, France.
Cuervo, N., Dufaud, O., Perrin, L., 2017. Determination of the burning velocity of gas/dust hybrid mixtures. Process Saf. Environ. Prot. 109, 704–715.
Dagastine, R.R., Prieve, D.C., White, L.R., 2002. Calculations of van der Waals Forces in 2-
Dimensionally Anisotropic Materials and Its Application to Carbon Black. J. Colloid Interface Sci. 249, 78–83.
Dahoe, A.E., 2000. Dust explosions: a Study of Flame Propagation (PhD Thesis). Delft
University, Delft.
Dahoe, A. E., Cant, R.S., Pegg, M.J., Scarlett, B., 2001. On the transient flow in the 20-liter explosion sphere. J. Loss Prev. Process Ind. 14, 475–487.
Dahoe, A.E., Cant, R.S., Scarlett, B., 2001. On the Decay of Turbulence in the 20-Liter
Explosion Sphere. Flow Turbul. Combust. 67, 159–184.
Dahoe, A.E., Hanjalic, K., Scarlett, B., 2002. Determination of the laminar burning velocity
and the Markstein length of powder–air flames. Powder Technol., Special issue i in
Honour of Prof Jimbo 122, 222–238.
Dahoe, A.E., Skjold, T., Roekaerts, D.J.E.M., Pasman, H.J., Eckhoff, R.K., Hanjalic, K.,
Donze, M., 2013. On the Application of the Levenberg–Marquardt Method in
Conjunction with an Explicit Runge–Kutta and an Implicit Rosenbrock Method to
Assess Burning Velocities from Confined Deflagrations. Flow Turbul. Combust. 91,
281–317.
Dahoe, A.E., Zevenbergen, J.F., Lemkowitz, S.M., Scarlett, B., 1996. Dust explosions in
spherical vessels: The role of flame thickness in the validity of the ‘cube-root law.’ J.
Loss Prev. Process Ind. 9, 33–44.
D’Amico, M., 2016. Étude expérimentale et modélisation des explosions hybrides
solides/solides : application au cas des mélanges de poussières graphite/métaux (PhD
Thesis). Université de Lorraine.
Damkoehler, G., 1947. The Effect of Turbulence on the Flame Velocity in Gas Mixtures.
Dastidar, A., 2019. Dust explosions: Test methods. In: Methods in Chemical Process Safety. Elsevier, pp. 71–122.
Dastidar, A., Amyotte, P., Going, J., Chatrathi, K., 2001. Inerting of coal dust explosions in
laboratory- and intermediate-scale chambers. Fuel 80, 1593–1602.
Daubech, J., Leprette, E., Duclos, A., Proust, C., 2018. Accounting for turbulence in gas explosion venting design.
Dazon, C., Witschger, O., Bau, S., Payet, R., Beugnon, K., Petit, G., Garin, T., Martinon, L.,
2017. Dustiness of 14 carbon nanotubes using the vortex shaker method. J. Phys. Conf. Ser. 838, 012005.
References
[224]
Debrincat, D.P., Solnordal, C.B., Van Deventer, J.S.J., 2008. Characterisation of inter-particle
forces within agglomerated metallurgical powders. Powder Technol. 182, 388–397.
Deng, X., Huang, Z., Wang, W., Davé, R.N., 2016. Investigation of nanoparticle agglomerates properties using Monte Carlo simulations. Adv. Powder Technol. 27, 1971–1979.
Di Benedetto, A., Di Sarli, V., Russo, P., 2010. On the determination of the minimum ignition
temperature for dust/air mixtures. Chem. Eng. Trans. 19, 189–194.
Di Benedetto, A., Garcia-Agreda, A., Dufaud, O., Khalili, I., Sanchirico, R., Perrin, L., Russo,
P., 2011. Flame propagation of dust and gas-air mixtures in a tube. Proc. 7th Mediterr.
Combust. Symp. 12.
Di Benedetto, A., Russo, P., 2007. Thermo-kinetic modelling of dust explosions. J. Loss Prev.
Process Ind., Selected Papers Presented at the Sixth International Symposium on
Hazards, Prevention and Mitigation of Industrial Explosions 20, 303–309.
Di Benedetto, A., Russo, P., Amyotte, P., Marchand, N., 2010. Modelling the effect of particle size on dust explosions. Chem. Eng. Sci. 65, 772–779.
Di Benedetto, A., Sanchirico, R., Di Sarli, V., 2019. Dust explosions: Emerging/unique
scenarios. In: Methods in Chemical Process Safety. Elsevier, pp. 283–316.
Di Benedetto A., Russo, P., Sanchirico, R., Sarli, V.D., 2013. CFD simulations of turbulent fluid flow and dust dispersion in the 20 liter explosion vessel. AIChE J. 59, 2485–2496.
Di Blasi, C., Branca, C., 2001. Kinetics of Primary Product Formation from Wood Pyrolysis.
Ind. Eng. Chem. Res. 40, 5547–5556.
Dufaud, O., 2011. Application des principes de la sécurité intrinsèque aux explosions de
poussières : de la modération en toutes choses. (Habilitation à diriger des recherches
Génie des Procédés et des Produits). INPL, Vandoeuvre-lès-Nancy.
Dufaud, O., Khalili, I., Cuervo-Rodriguez, N., Olcese, R.N., Dufour, A., Perrin, L., Laurent, A., 2012a. Highlighting the Importance of the Pyrolysis Step on Dusts Explosions.
Dufaud, O., Perrin, L., Traore, M., Chazelet, S., Thomas, D., 2009. Explosions of vapour/dust
hybrid mixtures: A particular class. Powder Technol., Selection of Papers from the
Symposium Powder Science and Technology - Powders and Sintered Material STP-
PMF 2007 190, 269–273.
Dufaud, O., Poupeau, M., Khalili, I., Cuervo, N., Christodoulou, M., Olcese, R., Dufour, A.,
Perrin, L., 2012c. Comparing Pyrolysis Gases and Dusts Explosivities: A Clue to
Understanding Hybrid Mixtures Explosions? Ind. Eng. Chem. Res. 51, 7656–7662.
Dufaud, O., Vignes, A., Henry, F., Perrin, L., Bouillard, J., 2011a. Ignition and explosion of nanopowders: something new under the dust. J. Phys. Conf. Ser. 304, 012076.
Eckhoff, R.K., 2002. Minimum ignition energy (MIE) — a basic ignition sensitivity parameter
in design of intrinsically safe electrical apparatus for explosive dust clouds. J. Loss Prev. Process Ind. 15, 305–310.
Eckhoff, R.K., 2003. Dust Explosions in the Process Industries - 3rd Edition
Eckhoff, R.K., 2012. Does the dust explosion risk increase when moving from μm-particle
powders to powders of nm-particles? J. Loss Prev. Process Ind. 25, 448–459.
Eckhoff, R.K., 2016. Dust Explosions. In: Explosion Hazards in the Process Industries. Elsevier, pp. 253–383.
Eckhoff, R.K., 2019a. Measuring hot-surface minimum ignition temperatures of dust clouds – History, present, future. J. Loss Prev. Process Ind. 59, 63–76.

References
[225]
Eckhoff, R.K., 2019b. Origin and development of the Godbert-Greenwald furnace for
measuring minimum ignition temperatures of dust clouds. Process Saf. Environ. Prot. 129, 17–24.
Eckhoff, R.K., 2019c. Measurement of minimum ignition energies (MIEs) of dust clouds –
History, present, future. J. Loss Prev. Process Ind. 61, 147–159.
Eckhoff, R.K., Randeberg, E., 2007. Electrostatic spark ignition of sensitive dust clouds of
MIE<1mJ. J. Loss Prev. Process Ind., Selected Papers Presented at the Sixth
International Symposium on Hazards, Prevention and Mitigation of Industrial Explosions 20, 396–401.
EN 1127-1, 2019. Explosive atmospheres. Explosion prevention and protection. Basic concepts
and methodology.
EN 14034-1, 2004a. Determination of explosion characteristics of dust clouds — Part 1: Determination of the maximum explosion pressure Pmax of dust clouds.
EN 14034-2, 2006. Determination of explosion characteristics of dust clouds — Part 2:
Determination of the maximum rate of explosion pressure rise (dp/dt)max of dust clouds.
EN 14034-3, 2006. Determination of explosion characteristics of dust clouds — Part 3:
Determination of the lower explosion limit LEL of dust clouds.
EN 15051, 2006. Workplace Atmospheres: Measurement of the Dustiness of Bulk Materials - Requirements and Reference Test Methods.
EN 17199-5, 2019. Workplace exposure - Measurement of dustiness of bulk materials that
contain or release respirabe NOAA or other respirable particles - Part 5: Vortex shaker method. p. 37.
EN 50281-2-1, 2000. Electrical apparatus for use in the presence of combustible dust. Test
methods. Methods of determining minimum ignition temperatures.
Fan, Y., Fowler, G.D., Zhao, M., 2020. The past, present and future of carbon black as a rubber reinforcing filler – A review. J. Clean. Prod. 247, 119115.
Fayet, G., Rotureau, P., 2019. New QSPR Models to Predict the Flammability of Binary Liquid
Mixtures. Mol. Inform. 38, 1800122.
Frankel, M.L., Sivashinsky, G.I., 1984. On Quenching of Curved Flames. Combust. Sci. Technol. 40, 257–268.
Frassoldati, A., Cuoci, A., Faravelli, T., Ranzi, E., Candusso, C., Tolazzi, D., 2009. Simplified
kinetic schemes for oxy-fuel combustion. 1 St Int. Conf. Sustain. Foss. Fuels Future Energy – S4FE 2009.
Ghadiri, M., Zhang, Z., 2002. Impact attrition of particulate solids. Part 1: A theoretical model
of chipping. Chem. Eng. Sci. 57, 3659–3669.
Ghaffari, M., Hoffmann, A.C., Skjold, T., Eckhoff, R.K., van Wingerden, K., 2019. A brief
review on the effect of particle size on the laminar burning velocity of flammable dust:
Application in a CFD tool for industrial applications. J. Loss Prev. Process Ind. 62, 103929.
Glorian, J., Gallier, S., Catoire, L., 2016. On the role of heterogeneous reactions in aluminum
combustion. Combust. Flame 168, 378–392.
Gmachowski, L., 2002. Calculation of the fractal dimension of aggregates. Colloids Surf. Physicochem. Eng. Asp. 211, 197–203.
References
[226]
Going, J.E., Chatrathi, K., Cashdollar, K.L., 2000. Flammability limit measurements for dusts
in 20-L and 1-m3 vessels. J. Loss Prev. Process Ind. 13, 209–219.
Goroshin, S., Tang, F.-D., Higgins, A.J., Lee, J.H.S., 2011. Laminar dust flames in a reduced-gravity environment. Acta Astronaut. 68, 656–666.
Grewer, T., 1991. The influence of chemical structure on exothermic decomposition.
Thermochim. Acta 187, 133–149.
Griffith, A.A., 1921. The phenomena of rupture and flow in solids. Phil Trans R Soc Lond A 221, 163–198.
Gülder, Ö.L., 1991. Turbulent premixed flame propagation models for different combustion
regimes. Symp. Int. Combust., Twenty-Third Symposium (International) on Combustion 23, 743–750.
Gustin, J.-L., 2004. Risques d’explosion de poussières - Caractérisation. Tech. Ing. Risques
Explos. base documentaire : TIB157DUO.
Haghiri, A., Bidabadi, M., 2010. Modeling of laminar flame propagation through organic dust cloud with thermal radiation effect. Int. J. Therm. Sci. 49, 1446–1456.
Halter, F., 2005. Caractérisation des effets de l’ajout d’hydrogène et de la haute pression dans
les flammes turbulentes de prémélange méthane/air (PhD Thesis). Université d’Orléans.
Harris, M.L., Sapko, M.J., Zlochower, I.A., Perera, I.E., Weiss, E.S., 2015. Particle size and
surface area effects on explosibility using a 20-L chamber. J. Loss Prev. Process Ind.
37, 33–38.
Harris, R.J., 1983. The investigation and control of gas explosions in buildings and heating plant. E. & F.N. Spon in association with the British Gas Corp.
Hartley, P.A., Parfitt, G.D., Pollack, L.B., 1985. The role of the van der Waals force in the
agglomeration of powders containing submicron particles. Powder Technol. 42, 35–46.
Hatakeyama, T., Nakamura, K., Hatakeyama, H., 1982. Studies on heat capacity of cellulose and lignin by differential scanning calorimetry. Polymer 23, 1801–1804.
Henry, F., 2013. Dynamique des systèmes nanodispersés: Application au cas de
l’agglomération de nanoparticules (PhD Thesis). Université de Lorraine.
Hertzberg, M., Zlochower, A., Conti, R.S., Cashdollar, K.L., 1988. Thermokinetic transport
control and structural microscopic realities in coal and polymer pyrolysis and
devolatilization: their dominant role in dust explosions. Prepr Pap Am Chem Soc Div Fuel Chem U. S. 32:3.
Holbrow, P., Wall, M., Sanderson, E., Bennett, D., Rattigan, W., Bettis, R., Gregory, D., 2010.
Fire and explosion properties of nanopowders.
Hong, S.-H., Winter, J., 2006. Size dependence of optical properties and internal structure of
plasma grown carbonaceous nanoparticles studied by in situ Rayleigh-Mie scattering
ellipsometry. J. Appl. Phys. 100, 064303.
Huang, Y., Risha, G.A., Yang, V., Yetter, R.A., 2007. Combustion of bimodal nano/micron-sized aluminum particle dust in air. Proc. Combust. Inst. 31, 2001–2009.
IEC 1241-2-1, 1994. Electrical apparatus for use in the presence of combustible dust - Part 2:
Test methods - Section 1: Methods for determining the minimum ignition temperatures of dust.
IEC 60529, 2001. Degrés de protection procurés par les enveloppes (Code IP) = Degrees of
protection provided by enclosures (IP Code). International Electrotechnical
Commission, Geneva, Switzerland.

References
[227]
IEC TS 60079-32-1:2013+A1:2017, n.d. Explosive atmospheres - Part 32-1: Electrostatic
hazards, guidance.
Iqbal, P., Preece, J.A., Mendes, P.M., 2012. Nanotechnology: The “Top-Down” and “Bottom-Up” Approaches. In: Supramolecular Chemistry. American Cancer Society.
ISO 6184/1, 1985. Explosion protection systems — part 1: Determination of explosion indices
of combustible dusts in air. In: International Standards Organization. pp. 1–5.
ISO/IEC 80079-20-2, 2016. Explosive atmospheres — Part 20-2: Material characteristics — Combustible dusts test methods.
ISO/TS 80004-2, 2015. Nanotechnologies - Vocabulary - Part 2: Nano-objects.
Israelachvili, J.N., 2011. Chapter 13 - Van der Waals Forces between Particles and Surfaces.
In: Intermolecular and Surface Forces (Third Edition). Academic Press, San Diego, pp. 253–289.
Ivanov, M.F., Kiverin, A.D., Liberman, M.A., 2015. Influence of radiation absorption by
microparticles on the flame velocity and combustion regimes. J. Exp. Theor. Phys. 121, 166–178.
Jacobson, M., Cooper, A.R., Nagy, J., 1964. Explosibility of metal powders. DTIC Document.
Janes, A., Chaineaux, J., Carson, D., Le Lore, P.A., 2008. MIKE 3 versus HARTMANN
apparatus: Comparison of measured minimum ignition energy (MIE). J. Hazard. Mater. 152, 32–39.
Janes, A., Lesné, P., Mauguen, G., Petit, J.M., Sallé, B., Marc, F., 2011. Mise en oeuvre de la
réglementation relative aux atmosphères explosives (ATEX) - Brochure INRS, ED 945.
Jespen, T., 2016. ATEX—Explosive Atmospheres, Springer Series in Reliability Engineering. Springer International Publishing, Cham.
Jiang, K., Pinchuk, P., 2016. Temperature and size-dependent Hamaker constants for metal
nanoparticles. Nanotechnology 27, 345710.
Jones, W.P., Lindstedt, R.P., 1988. Global reaction schemes for hydrocarbon combustion. Combust. Flame 73, 233–249.
Joulin, G., Clavin, P., 1979. Linear stability analysis of nonadiabatic flames: Diffusional-
thermal model. Combust. Flame 35, 139–153.
Julien, P., Whiteley, S., Soo, M., Goroshin, S., Frost, D.L., Bergthorson, J.M., 2017. Flame
speed measurements in aluminum suspensions using a counterflow burner. Proc.
Combust. Inst. 36, 2291–2298.
Kalejaiye, O., Amyotte, P.R., Pegg, M.J., Cashdollar, K.L., 2010. Effectiveness of dust dispersion in the 20-L Siwek chamber. J. Loss Prev. Process Ind. 23, 46–59.
Karlovitz, B., Denniston, D.W., Wells, F.E., 1951. Investigation of Turbulent Flames. J. Chem.
Phys. 19, 541–547.
Kee, R.J., Grcar, J.F., Smooke, M.D., Miller, J.A., Meeks, E., 1993. PREMIX: A FORTRAN Program for Modeling Steady Laminar One-Dimensional Premixed Flames.
Kendall, K., 1988. Agglomerate Strength. Powder Metall. 31, 28–31.
Keng, E.Y.H., 1969. Air and belium pycnometer. Powder Technol. 3, 179–180.
Khalili, I., Dufaud, O., Poupeau, M., Cuervo-Rodriguez, N., Perrin, L., 2012. Ignition
sensitivity of gas–vapor/dust hybrid mixtures. Powder Technol. 217, 199–206.
Khan, F.I., Amyotte, P.R., 2003. How to Make Inherent Safety Practice a Reality. Can. J. Chem. Eng. 81, 2–16.
References
[228]
Klippel, A., Scheid, M., Krause, U., 2013. Investigations into the influence of dustiness on dust
explosions. J. Loss Prev. Process Ind. 26, 1616–1626.
Klippel, A., Schmidt, M., Krause, U., 2015. Dustiness in workplace safety and explosion protection – Review and outlook. J. Loss Prev. Process Ind. 34, 22–29.
Krause, U., Kasch, T., 2000. The influence of flow and turbulence on flame propagation
through dust-air mixtures. J. Loss Prev. Process Ind. 13, 291–298.
Krietsch, A., Romahn, T.-M., Scheid, M., Krause, U., 2013. Modified setup of 20-l-sphere for
the determination of safety characteristics of nano powders. Chem. Eng. Trans. 805–
810.
Krietsch, A., Scheid, M., Schmidt, M., Krause, U., 2015. Explosion behaviour of metallic nano powders. J. Loss Prev. Process Ind. 36, 237–243.
Kuai, N., Huang, W., Du, B., Yuan, J., Li, Z., Gan, Y., Tan, J., 2012. Effect of ignition energy
on dust explosion behavior: Phenomena of under-driving and over-driving. AIChE Annu. Meet. Conf. Proc. 8 p.
Kwon, Y.-S., Gromov, A.A., Ilyin, A.P., Popenko, E.M., Rim, G.-H., 2003. The mechanism of
combustion of superfine aluminum powders. Combust. Flame 133, 385–391.
Law, C.K., 2006. Combustion Physics by Chung K. Law. Camb. Core.
Le, H.D., 2018. Modelling of nanoparticles-laden jet from a conveying pipe leakage (PhD Thesis). Université de Toulouse, France.
Leason, D.B., 1951. Turbulence and flame propagation in premixed gases. Fuel 30, 233–239.
Lee, J., Peraldi, O., Knystautas, R., 1993. Microgravity combustion of dust suspension. In: 31st
Aerospace Sciences Meeting. Presented at the 31st Aerospace Sciences Meeting, American Institute of Aeronautics and Astronautics, Reno,NV,U.S.A.
Lemkowitz, S.M., Pasman, H.J., 2014. A Review of the Fire and Explosion Hazards of
Particulates. KONA Powder Part. J. 31, 53–81.
Levitas, V.I., 2013. Mechanochemical mechanism for reaction of aluminium nano- and micrometre-scale particles. Phil Trans R Soc A 371, 20120215.
Lewis, B., von Elbe, G., 1987. Combustion, Flames and Explosions of Gases. Elsevier.
Li, D., Sun, G., 2007. Coloration of textiles with self-dispersible carbon black nanoparticles.
Dyes Pigments 72, 144–149.
Li, G., Yang, H.-X., Yuan, C.-M., Eckhoff, R.K., 2016. A catastrophic aluminium-alloy dust explosion in China. J. Loss Prev. Process Ind. 39, 121–130.
Liden, G., 2006. Dustiness Testing of Materials Handled at Workplaces. Ann. Occup. Hyg.
Lin, N., Dufresne, A., 2014. Nanocellulose in biomedicine: Current status and future prospect.
Eur. Polym. J. 59, 302–325.
Lomba, R., 2016. Utilisation de la combustion métallique dans les machines thermiques (thesis). Orléans.
Lomba, R., Laboureur, P., Dumand, C., Chauveau, C., Halter, F., 2019. Determination of
aluminum-air burning velocities using PIV and Laser sheet tomography. Proc. Combust. Inst. 37, 3143–3150.
Loryan, V.É., Borovinskaya, I.P., 2003. Aluminum Combustion in Nitrogen. Combust. Explos.
Shock Waves 39, 525–533.
Lüttgens, G., Lüttgens, S., Schubert, W., 2017. Static Electricity: Understanding, Controlling, Applying | Wiley. Wiley-VCH.
References
[229]
Mallard, E., Chatelier, H.L., 1883. Recherches expérimentales et théoriques sur la combustion
des mélanges gazeux explosives. H.Dunod et E. Pinat.
Markstein, G.H., 1964. Non-steady flame Propagation. P22 Pergarmon N. Y.
Mandelbrot, B., 1983. The Fractal Geometry of Nature. In: American Journal of Physics. p. 468
Marmo, L., Ferri, A., Danzi, E., 2019. Dust explosion hazard in the textile industry. J. Loss Prev. Process Ind. 62, 103935.
Martin, C., Comet, M., Schnell, F., Berthe, J.-E., Spitzer, D., 2018. Aluminum nanopowder: A
substance to be handled with care. J. Hazard. Mater. 342, 347–352.
Mazumdar, A., 2013. Principles and Techniques of Schlieren Imaging Systems.
McBride, B.J., Gordon, S., 1996. Computer Program for Calculation of Complex Chemical
Equilibrium Compositions and Applications II. Users Manual and Program Description.
NASA. RP 1311.
Médout-Marère, V., 2000. A Simple Experimental Way of Measuring the Hamaker Constant
A11 of Divided Solids by Immersion Calorimetry in Apolar Liquids. J. Colloid Interface
Sci. 228, 434–437.
Miao, J., Leung, C.W., Huang, Z., Cheung, C.S., Yu, H., Xie, Y., 2014. Laminar burning
velocities, Markstein lengths, and flame thickness of liquefied petroleum gas with
hydrogen enrichment. Int. J. Hydrog. Energy 39, 13020–13030.
Mittal, M., 2014. Explosion characteristics of micron- and nano-size magnesium powders. J. Loss Prev. Process Ind. 27, 55–64.
Mohan, S., Ermoline, A., Dreizin, E.L., 2012. Pyrophoricity of nano-sized aluminum particles.
J. Nanoparticle Res. 14, 723.
Mohan, S., Trunov, M.A., Dreizin, E.L., 2009. On possibility of vapor-phase combustion for fine aluminum particles. Combust. Flame 156, 2213–2216.
Mollenhauer, K., Tschöke, H., 2010. Handbook of Diesel Engines. Springer Science &
Business Media.
Moosmüller, H., Arnott, W.P., 2009. Particle Optics in the Rayleigh Regime. J. Air Waste Manag. Assoc. 59, 1028–1031.
Moser, G., 2019. Combustion de particules métalliques pour la production d’énergie à faible
impact environnemental.
Moussa, R.B., Guessasma, M., Proust, C., Saleh, K., Fortin, J., 2015. Thermal Radiation
Contribution to Metal Dust Explosions. Procedia Eng., New Paradigm of Particle
Science and Technology Proceedings of The 7th World Congress on Particle Technology 102, 714–721.
Mukhopadhyay, S.N., Das, D.K., 1994. Oxygen Responses, Reactivities, and Measurements in
Biosystems. CRC Press.
Murillo, C., 2016. Experimental and numerical approaches to particles dispersion in a turbulent flow : application to dust explosions (PhD Thesis). Université de Lorraine, France.
Murillo, C., Amín, M., Bardin-Monnier, N., Muñoz, F., Pinilla, A., Ratkovich, N., Torrado, D.,
Vizcaya, D., Dufaud, O., 2018. Proposal of a new injection nozzle to improve the experimental reproducibility of dust explosion tests. Powder Technol. 328, 54–74.
Nagy, J., Verakis, H.C., 1983. Development and control of dust explosions.
Nanomakers, 2019. Nanomakers | Producer of Silicon and Silicon Carbide nanopowders
[WWW Document]. Nanomakers Prod. Silicon Silicon Carbide Nanopowders. URL
https://www.nanomakers.co (accessed 1.7.20).

References
[230]
Nazneen, N., Wang, Q., 2019. Evaluation of fire and explosion hazard of nanoparticles (NFPA
report No. FPRF-2019-10). The Fire Protection Research Foundation.
Nichols, G., Byard, S., Bloxham, M.J., Botterill, J., Dawson, N.J., Dennis, A., Diart, V., North,
N.C., Sherwood, J.D., 2002. A Review of the Terms Agglomerate and Aggregate with
a Recommendation for Nomenclature Used in Powder and Particle Characterization. J. Pharm. Sci. 91, 2103–2109.
Nifuku, M., Koyanaka, S., Ohya, H., Barre, C., Hatori, M., Fujiwara, S., Horiguchi, S., Sochet,
I., 2007. Ignitability characteristics of aluminium and magnesium dusts that are
generated during the shredding of post-consumer wastes. J. Loss Prev. Process Ind. 20,
322–329.
Nowakowska, M., Herbinet, O., Dufour, A., Glaude, P.A., 2018. Kinetic Study of the Pyrolysis and Oxidation of Guaiacol. J. Phys. Chem. A 122, 7894–7909.
Oberdörster, G., Oberdörster, E., Oberdörster, J., 2005. Nanotoxicology: an emerging discipline
evolving from studies of ultrafine particles. Environ. Health Perspect. 113, 823–839.
Palmer, K.N., 1973. Dust explosions and fires, Powder technology series. Chapman & Hall, London.
Pietraccini, M., Delon, E., Santandrea, A., Pacault, S., Glaude, P.-A., Dufour, A., Dufaud, O.,
2020. Determination of reaction mechanisms for the gasification and explosion of organic powders. Submitt. 13th Int. Symp. Hazards Prev. Mitig. Ind. Explos. ISHPMIE.
Poinsot, T., Veynante, D., 2005. Theoretical and numerical combustion, 2nd ed. ed. Edwards,
Philadelphia.
Popat, N.R., Catlin, C.A., Arntzen, B.J., Lindstedt, R.P., Hjertager, B.H., Solberg, T., Saeter,
O., Van den Berg, A.C., 1996. Investigations to improve and assess the accuracy of
computational fluid dynamic based explosion models. J. Hazard. Mater. 45, 1–25.
Proust, C., 2005. The usefulness of phenomenological tools to simulate the consequences of
dust explosions. The experience of EFFEX (International ESMG Symposium “Process
safety and industrial explosion protection”). Nuremberg, Germany.
Proust, C., 2006. Flame propagation and combustion in some dust-air mixtures. J. Loss Prev. Process Ind. 19, 89–100.
Proust, C., Ben Moussa, R., Guessasma, M., Saleh, K., Fortin, J., 2017. Thermal radiation in
dust flame propagation. J. Loss Prev. Process Ind. 49, 896–904.
Proust, Ch., Accorsi, A., Dupont, L., 2007. Measuring the violence of dust explosions with the
“20l sphere” and with the standard “ISO 1m3 vessel”: Systematic comparison and
analysis of the discrepancies. J. Loss Prev. Process Ind., Selected Papers Presented at
the Sixth International Symposium on Hazards, Prevention and Mitigation of Industrial
Explosions 20, 599–606.
Przybyla, G., Ziolkowski, L., Szlęk, A., 2008. Performance of SI engine fuelled with LCV gas. Pol. Inst. Therm. Technol.
Pu, Y., Podfilipski, J., Jarosiński, J., 1998. Constant Volume Combustion of Aluminum and
Cornstarch Dust in Microgravity. Combust. Sci. Technol. 135, 255–267.
Pu, Y.K., Jarosinski, J., Johnson, V.G., Kauffman, C.W., 1991. Turbulence effects on dust
explosions in the 20-liter spherical vessel. Symp. Int. Combust., Twenty-Third
Symposium (International) on Combustion 23, 843–849.
Rai, A., Park, K., Zhou, L., Zachariah, M.R., 2006. Understanding the mechanism of aluminium
nanoparticle oxidation. Combust. Theory Model. 10, 843–859.
References
[231]
Rauscher, H., Mech, A., Gaillard, C., Stintz, M., Wohlleben, W., Weiler, S., Ghanem, A.,
Hodoroaba, D., Babick, F., Mielke, J., 2015. Recommendations on a Revision of the EC
Definition of Nanomaterial Based on Analytical Possibilities ( No. NanoDefine
Technical Report D7.10), The EU FP7 NanoDefine Project. The NanoDefine Consortium.
Rauscher, H., Mech, A., Gibson, N., Gilliland, D., Held, A., Kestens, V., Koeber, R., Linsinger,
T.P.J., Stefaniak, E.A., European Commission, Joint Research Centre, 2019a.
Identification of nanomaterials through measurements: points to consider in the
assessment of particulate materials according to the European Commission’s Recommendation on a definition of nanomaterial.
Reynolds, G.K., Fu, J.S., Cheong, Y.S., Hounslow, M.J., Salman, A.D., 2005. Breakage in
granulation: A review. Chem. Eng. Sci., Granulation across the length scales - 2nd International Workshop on Granulation 60, 3969–3992.
Roebben, G., Rauscher, H., Amenta, V., Aschberger, K., Boix Sanfeliu, A., Calzolai, L.,
Emons, H., Gaillard, C., Gibson, N., Holzwarth, U., Koeber, R., Linsinger, T.,
Rasmussen, K., Sokull-Klüttgen, B., Stamm, H., 2014. Towards a review of the EC
Recommendation for a definition of the term “nanomaterial”. JRC Science and policy reports, Report EUR 26744 EN.
Rotureau, P., Fayet, G., Marlair, G., Michot, C., Joubert, L., Adamo, C., 2010. Evaluation of
chemicals explosive properties: from classical experimental methods to predictive
methods combining statistical QSPR methodology and quantum chemistry. Actual.
Chim. 51–58.
Rumpf, H., 1962. The strength of granules and agglomerates. In: Agglomeration. pp. 379–413.
Saeed, M.A., Farooq, M., Andrews, G.E., Phylaktou, H.N., Gibbs, B.M., 2019. Ignition
sensitivity of different compositional wood pellets and particle size dependence. J.
Environ. Manage. 232, 789–795.
Sanchirico, R., Di Sarli, V., Russo, P., Di Benedetto, A., 2015. Effect of the nozzle type on the integrity of dust particles in standard explosion tests. Powder Technol. 279, 203–208.
Santandrea, A., Bonamis, F., Pacault, S., Vignes, A., Perrin, L., Dufaud, O., 2019a. Influence
of the Particle Size Distribution on Dust Explosion: How to Choose the Right Metrics? Chem. Eng. Trans. 77, 667–672.
Santandrea, A., Pacault, S., Perrin, L., Vignes, A., Dufaud, O., 2019b. Nanopowders explosion:
Influence of the dispersion characteristics. J. Loss Prev. Process Ind.
Santandrea, A., Vignes, A., Krietsch, A., Perrin, L., Laurent, A., Dufaud, O., 2019c. Some Key
Considerations when Evaluating Explosion Severity of Nanopowders. Chem. Eng.
Trans. 77, 235–240.
Santandrea, A., Gavard, M., Pacault, S., Vignes, A., Perrin, L., Dufaud, O., 2020a. ‘Knock on
nanocellulose’: Approaching the laminar burning velocity of powder-air flames.
Process Saf. Environ. Prot. 134, 247–259.
Santandrea, A., Torrado, D., Pietraccini, M., Vignes, A., Perrin, L., Dufaud, O., 2020b. A flame
propagation model for nanopowders. Submitt. 13th Int. Symp. Hazards Prev. Mitig. Ind.
Explos. ISHPMIE.
Santandrea, A., Vignes, A., Krietsch, A., Brunello, D., Perrin, L., Laurent, A., Dufaud, O.,
2020c. Evaluating the explosion severity of nanopowders: international standards versus reality. Process Saf. Environ. Prot. To be published.
References
[232]
Seville, J.P.K., Willett, C.D., Knight, P.C., 2000. Interparticle forces in fluidisation: a review.
Powder Technol., Neptis Symposium on Fluidization- Present and Future 113, 261–268.
Shelkin, K.I., 1947. On Combustion in a Turbulent Flow [WWW Document]. J. Tech. Phys.
Vol. 13 No 9-10. URL https://digital.library.unt.edu/ark:/67531/metadc64298/ (accessed 10.16.19).
Shi, Z., Phillips, G.O., Yang, G., 2013. Nanocellulose electroconductive composites. Nanoscale
5, 3194–3201.
Shkolnikov, E.I., Zhuk, A.Z., Vlaskin, M.S., 2011. Aluminum as energy carrier: Feasibility
analysis and current technologies overview. Renew. Sustain. Energy Rev. 15, 4611–
4623.
Silvestrini, M., Genova, B., Leon Trujillo, F.J., 2008. Correlations for flame speed and
explosion overpressure of dust clouds inside industrial enclosures. J. Loss Prev. Process
Ind. 21, 374–392.
Siwek, R., 1977. 20-l Laborapparatur für die Bestimmung der Explosionskenngrößen
brennbarer Stäube (PhD Thesis). Technical University of Winterthur, Winterthur,
Switzerland.
Siwek, R., 1995. Siwek 1995 Ignition behavior of dusts : meaning and interpretation.
Siwek, R., 1996. Determination of technical safety indices and factors influencing hazard evaluation of dusts. J. Loss Prev. Process Ind. 9, 21–31.
Skjold, T., 2003. Selected aspects of turbulence and combustion in 20-Litre explosion vessel
(Master thesis). University of Bergen, Norway.
Skjold, T., 2007. Review of the DESC project. J. Loss Prev. Process Ind., Selected Papers
Presented at the Sixth International Symposium on Hazards, Prevention and Mitigation
of Industrial Explosions 20, 291–302.
Skjold, T., Hisken, H., Lakshmipathy, S., Atanga, G., Carcassi, M., Schiavetti, M., Stewart,
J.R., Newton, A., Hoyes, J.R., Tolias, I.C., Venetsanos, A.G., Hansen, O.R., Geng, J.,
Huser, A., Helland, S., Jambut, R., Ren, K., Kotchourko, A., Jordan, T., Daubech, J.,
Lecocq, G., Hanssen, A.G., Kumar, C., Krumenacker, L., Jallais, S., Miller, D.,
Bauwens, C.R., 2018. Blind-prediction: Estimating the consequences of vented
hydrogen deflagrations for homogeneous mixtures in 20-foot ISO containers. Int. J.
Hydrog. Energy.
Smith, W.O., Foote, P.D., Busang, P.F., 1929. Packing of Homogeneous Spheres. Phys. Rev. 34, 1271–1274.
Soares, M.C.F., Viana, M.M., Schaefer, Z.L., Gangoli, V.S., Cheng, Y., Caliman, V., Wong,
M.S., Silva, G.G., 2014. Surface modification of carbon black nanoparticles by
dodecylamine: Thermal stability and phase transfer in brine medium. Carbon 72, 287–
295.
Sokolov, S.V., Tschulik, K., Batchelor-McAuley, C., Jurkschat, K., Compton, R.G., 2015.
Reversible or not? Distinguishing agglomeration and aggregation at the nanoscale.
Anal. Chem. 87, 10033–10039.
Sorensen, C.M., Roberts, G.C., 1997. The Prefactor of Fractal Aggregates. J. Colloid Interface Sci. 186, 447–452.
Soundararajan, R., Amyotte, P.R., Pegg, M.J., 1996. Explosibility hazard of iron sulphide dusts as a function of particle size. J. Hazard. Mater. 51, 225–239.
References
[233]
Stark, W.J., Stoessel, P.R., Wohlleben, W., Hafner, A., 2015. Industrial applications of
nanoparticles. Chem. Soc. Rev. 44, 5793–5805.
Sundaram, D.S., Puri, P., Yang, V., 2013. Pyrophoricity of nascent and passivated aluminum particles at nano-scales. Combust. Flame 160, 1870–1875.
Sundaram, D.S., Puri, P., Yang, V., 2016. A general theory of ignition and combustion of nano-
and micron-sized aluminum particles. Combust. Flame 169, 94–109.
Tamanini, F., 1990. Turbulence effects on dust explosion venting. PlantOperations Prog. 9, 52–60.
Tanford, C., Pease, R.N., 1947. Theory of Burning Velocity. II. The Square Root Law for
Burning Velocity. J. Chem. Phys. 15, 861–865.
Tang, F.-D., Goroshin, S., Higgins, A., Lee, J., 2009. Flame propagation and quenching in iron dust clouds. Proc. Combust. Inst. 32, 1905–1912.
Tascón, A., 2018. Influence of particle size distribution skewness on dust explosibility. Powder
Technol. 338, 438–445.
Taylor, G.I., 1922. Diffusion by Continuous Movements. Proc. Lond. Math. Soc. s2-20, 196–212.
Theimer, O.F., 1973. Cause and prevention of dust explosions in grain elevators and flour mills.
Powder Technol. 8, 137–147.
Thomas, A., Vignes, A., Le-Bihan, O., Santandrea, A., 2019. Quelques considérations sur la
pulvérulence d’une poudre et les risques d’explosion associés. Presented at the SFGP
2019, Nantes.
Thompson, D.T., 2007. Using gold nanoparticles for catalysis. Nano Today 2, 40–43.
Tolias, I.C., Venetsanos, A.G., 2018. An improved CFD model for vented deflagration
simulations – Analysis of a medium-scale hydrogen experiment. Int. J. Hydrog. Energy
43, 23568–23584.
Torrado, D., 2017. Effect of carbon black nanoparticles on the explosion severity of gas mixtures (PhD Thesis). Université de Lorraine, France.
Torrado, D., Buitrago, V., Glaude, P.-A., Dufaud, O., 2017a. Explosions of
methane/air/nanoparticles mixtures: Comparison between carbon black and inert particles. Process Saf. Environ. Prot. 110, 77–88.
Torrado, D., Cuervo, N., Pacault, S., Glaude, P.-A., Dufaud, O., 2017b. Influence of carbon
black nanoparticles on the front flame velocity of methane/air explosions. J. Loss Prev. Process Ind. 49, 919–928.
Torrado, D., Pinilla, A., Amin, M., Murillo, C., Munoz, F., Glaude, P.-A., Dufaud, O., 2018.
Numerical study of the influence of particle reaction and radiative heat transfer on the
flame velocity of gas/nanoparticles hybrid mixtures. Process Saf. Environ. Prot. 118,
211–226.
Traoré, M., Dufaud, O., Perrin, L., Chazelet, S., Thomas, D., 2009a. Dust explosions: How
should the influence of humidity be taken into account? Process Saf. Environ. Prot.,
12th International Symposium of Loss Prevention and Safety Promotion in the Process Industries 87, 14–20.
Turkevich, L.A., Dastidar, A.G., Hachmeister, Z., Lim, M., 2015. Potential explosion hazard
of carbonaceous nanoparticles: Explosion parameters of selected materials. J. Hazard. Mater. 295, 97–103.
References
[234]
Turkevich, L.A., Fernback, J., Dastidar, A.G., Osterberg, P., 2016. Potential explosion hazard
of carbonaceous nanoparticles: screening of allotropes. Combust. Flame 167, 218–227.
TÜV SÜD Schweiz AG, 2020. 20l Siwek sphere / Mike 3 [WWW Document]. URL
https://www.tuev-sued.ch/ch-en/activity/testing-equipment/20l-siwek-sphere-mike-3
(accessed 3.9.20).
Upp, E.L., LaNasa, P.J., 2002. Fluid flow measurement: a practical guide to accurate flow measurement, 2nd ed. ed. Gulf Professional Pub, Boston.
U.S. Chemical Safety and Hazard Investigation Boart, 2009. Investigation report: sugar dust
explosion and fire (14 killed, 36 injured), Imperial Sugar Company, Port Wentworth, Georgia, February 7, 2008 ( No. 2008-05-I-GA). Washington, DC.
van der Wel, P.G.J., 1993. Ignition and propagation of dust explosions (PhD Thesis). Delft
University, The Netherlands.
van der Wel, P.G.J., van Veen, J.P.W., Lemkowitz, S.M., Scarlett, B., van Wingerden, C.J.M.,
1992. An interpretation of dust explosion phenomena on the basis of time scales.
Powder Technol. 71, 207–215.
Varea, E., 2013. Experimental analysis of laminar spherically expanding flames (thesis). Rouen, INSA.
Vignes, A., 2008. Évaluation de l’inflammabilité et de l’explosivité des nanopoudres : une
démarche essentielle pour la maîtrise des risques (PhD Thesis). Institut National Polytechnique de Lorraine, France.
Vignes, A., Muñoz, F., Bouillard, J., Dufaud, O., Perrin, L., Laurent, A., Thomas, D., 2012.
Risk assessment of the ignitability and explosivity of aluminum nanopowders. Process Saf. Environ. Prot. 90, 304–310.
Vignes, A., Krietsch, A., Dufaud, O., Santandréa, A., Perrin, L., Bouillard, J., 2019. Course of
explosion behaviour of metallic powders – From micron to nanosize. J. Hazard. Mater. 379, 120767.
Vijayaraghavan, G., 2004. Impact assessment, modelling, and control of dust explosions in
chemical process industries (MTech Thesis). Department of Chemical Engineering, Coimbatore Institute of Technology.
Vizcaya, D., Pinilla, A., Amín, M., Ratkovich, N., Munoz, F., Murillo, C., Bardin-Monnier, N.,
Dufaud, O., 2018. CFD as an approach to understand flammable dust 20 L standard test: Effect of the ignition time on the fluid flow. AIChE J. 64, 42–54.
Wagman, D.D., Kilpatrick, J.E., Taylor, W.J., Pitzer, K.S., Rossini, F.D., 1945. Heats, free
energies, and equilibrium constants of some reactions involving O2, H2, H2O, C, CO, CO2, and CH4. J. Res. Natl. Bur. Stand. 34, 143.
Walter, D., 2013. Primary Particles - Agglomerates - Aggregates. In: Deutsche
Forschungsgemeinschaft DFG (Ed.), Nanomaterials. Wiley-VCH Verlag GmbH & Co. KGaA, Weinheim, Germany, pp. 9–24.
Weiler, C., Wolkenhauer, M., Trunk, M., Langguth, P., 2010. New model describing the total
dispersion of dry powder agglomerates. Powder Technol. 203, 248–253.
Wengeler, R., Nirschl, H., 2007. Turbulent hydrodynamic stress induced dispersion and fragmentation of nanoscale agglomerates. J. Colloid Interface Sci. 306, 262–273.
Wohlleben, W., Mielke, J., Bianchin, A., Ghanem, A., Freiberger, H., Rauscher, H., Gemeinert,
M., Hodoroaba, V.-D., 2017. Reliable nanomaterial classification of powders using the
volume-specific surface area method. J. Nanoparticle Res. 19.

References
[235]
Wu, H.-C., Chang, R.-C., Hsiao, H.-C., 2009. Research of minimum ignition energy for nano
Titanium powder and nano Iron powder. J. Loss Prev. Process Ind. 22, 21–24.
Wu, H.-C., Kuo, Y.-C., Wang, Y., Wu, C.-W., Hsiao, H.-C., 2010a. Study on safe air
transporting velocity of nanograde aluminum, iron, and titanium. J. Loss Prev. Process
Ind. 23, 308–311.
Wu, H.-C., Ou, H.-J., Hsiao, H.-C., Shih, T.-S., 2010b. Explosion Characteristics of Aluminum Nanopowders. Aerosol Air Qual. Res. 10, 38–42.
Wu, H.-C., Ou, H.-J., Peng, D.-J., Hsiao, H.-C., Gau, C.-Y., Shih, T.-S., 2010c. Dust Explosion
Characteristics of Agglomerated 35 nm and 100 nm Aluminum Particles. Int. J. Chem. Eng. 2010, 1–6.
Xu, S., Liu, J., Cao, Wei, Li, Y., Cao, Weiguo, 2017. Experimental study on the minimum
ignition temperature and combustion kinetics of coal dust/air mixtures. Powder Technol. 317, 154–161.
Yeap, S.P., 2018. Permanent agglomerates in powdered nanoparticles: Formation and future
prospects. Powder Technol. 323, 51–59.
Yuan, J., Wei, W., Huang, W., Du, B., Liu, L., Zhu, J., 2014a. Experimental investigations on the roles of moisture in coal dust explosion. J. Taiwan Inst. Chem. Eng. 45, 2325–2333.
Yuan, Z., Khakzad, N., Khan, F., Amyotte, P., 2015. Dust explosions: A threat to the process
industries. Process Saf. Environ. Prot. 98, 57–71.
Yuan, Z., Khakzad, N., Khan, F., Amyotte, P., Reniers, G., 2013. Risk-Based Design of Safety
Measures To Prevent and Mitigate Dust Explosion Hazards. Ind. Eng. Chem. Res. 52,
18095–18108.
Zalosh, R., 2019. Dust explosions: Regulations, standards, and guidelines. In: Methods in Chemical Process Safety. Elsevier, pp. 229–282.
Zeldovich, Y.B., Barenblatt, G.I., 1959. Theorv of flame propagation. Combust. Flame 3, 61–
74.
Zhang, Q., Zhang, B., 2015. Effect of ignition delay on explosion parameters of corn dust/air in confined chamber. J. Loss Prev. Process Ind. 33, 23–28.
Zhang, Z., Ghadiri, M., 2002. Impact attrition of particulate solids. Part 2: Experimental work.
Chem. Eng. Sci. 57, 3671–3686.
Zhen, G., Leuckel, W., 1997. Effects of ignitors and turbulence on dust explosions. J. Loss Prev. Process Ind. 10, 317–324.
Zheng, Y.-P., Feng, C.-G., Jing, G.-X., Qian, X.-M., Li, X.-J., Liu, Z.-Yi., Huang, P., 2009. A
statistical analysis of coal mine accidents caused by coal dust explosions in China. J. Loss Prev. Process Ind. 22, 528–532.

Résumé élargi
[236]
Par définition, les nanoparticules possèdent au moins une dimension inférieure à 100 nm. Cette
petite taille induit une grande surface spécifique, qui procure des propriétés inédites, notamment
chimiques, mécaniques, optiques ou biologiques, comparées aux particules micrométriques.
Parmi ces nouvelles spécificités, les nanoparticules sont soumises à des forces de cohésion plus
intenses, telles que des forces de van der Waals, électrostatiques ou capillaires, ce qui les amène
à s’agglomérer de manière réversible. Cependant, une explosion de poussières nécessite une
dispersion de la poudre dans l’air, ce qui peut mener à une fragmentation de ces agglomérats.
L’objectif de ce travail est ainsi d’étudier l’influence des spécificités des nanoparticules,
notamment de l’agglomération, sur leur sensibilité à l’inflammation et leur sévérité d’explosion,
et d’évaluer l’adéquation des méthodes définies par les standards internationaux pour la
détermination de ces paramètres concernant les nanoparticules.
Chapitre 2 : Généralités sur les explosions de poussières
Ce chapitre présente les premières étapes de l’évaluation des risques d’explosion liés à la
production, au transport et à la manipulation de poudres nanométriques, et repose sur une revue
bibliographique divisée en quatre parties.
Dans un premier temps, une analyse d’accidents impliquant différents types de poudres a
souligné la réalité et la gravité du risque représenté par les explosions de poussières. Les deux
directives européennes ATEX ont été introduites : la première, la directive 1999/99/CE classe
les espaces de travail en zones selon la probabilité de formation d’une atmosphère explosive.
Les équipements autorisés dans ces zones sont alors définis par la seconde directive, la directive
2014/34/UE. L’implémentation de mesures de sécurité pour prévenir et protéger contre les
explosions de poussières est alors possible à partir de la connaissance des caractéristiques
d’explosivité des poussières impliquées dans les procédés.
Dans une deuxième partie, la phénoménologie des explosions de poussières a été détaillée.
D’abord, la distinction entre la sensibilité à l’inflammation, i.e. la probabilité qu’une poussière
s’enflamme, et la sévérité d’explosion, qui concerne les effets de l’explosion, a été réalisée. Les
paramètres décrivant l’inflammation (énergie minimale d’inflammation, température minimale
d’inflammation, concentration minimale explosible) et l’explosion (surpression maximale
d’explosion, vitesse maximale de montée en pression, vitesse de flamme) ont ensuite été
détaillés, ainsi que les principaux facteurs influents, tels que la concentration en poussière, le
taux d’humidité, l’énergie d’inflammation, la turbulence initiale et la taille de particules.
Ce travail se focalisant sur les nanoparticules, la troisième partie de ce chapitre a été dédiée à
leurs spécificités. Plus précisément, le phénomène d’agglomération inhérent aux nanomatériaux
a été analysé. En effet, les principales forces de cohésion, telles que les forces de van der Waals,
électrostatiques et capillaires ont été détaillées, ainsi que les trois principaux modèles décrivant
la fragmentation d’un agglomérat.
Enfin, l’influence des spécificités des nanoparticules sur le déroulement de leur combustion a
été discutée. Certains auteurs ont observé que la sensibilité à l’inflammation tend à croître en
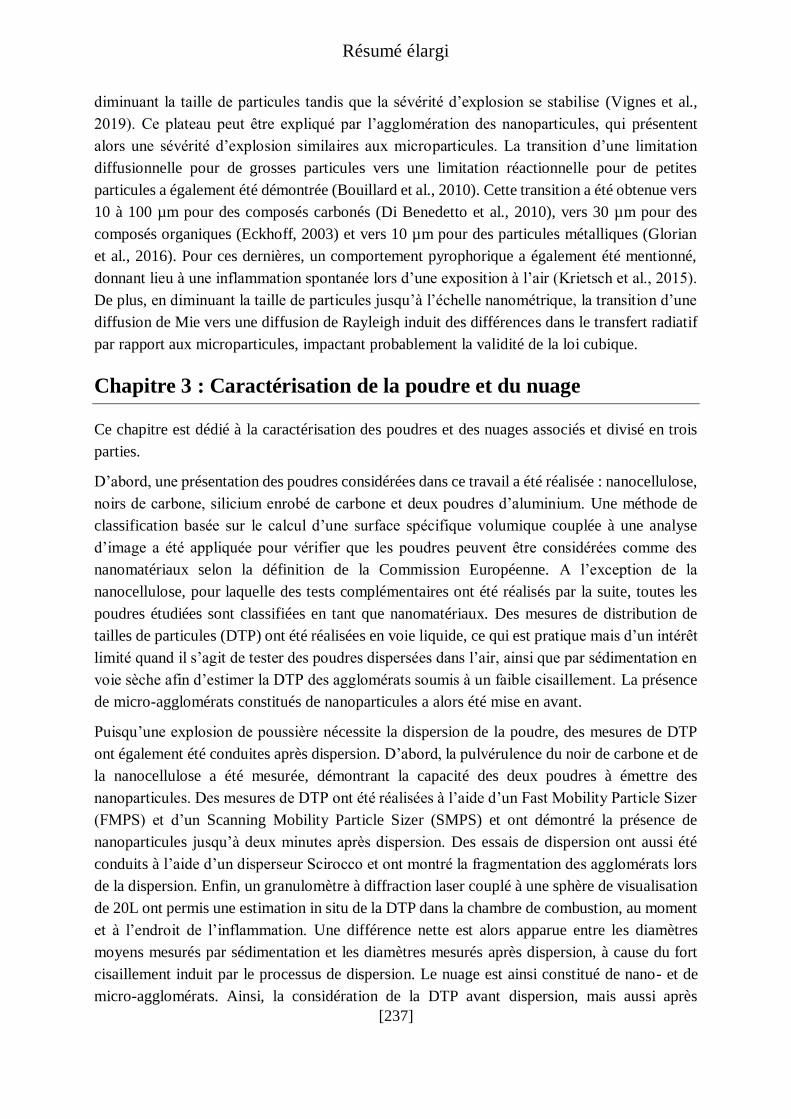
Résumé élargi
[237]
diminuant la taille de particules tandis que la sévérité d’explosion se stabilise (Vignes et al.,
2019). Ce plateau peut être expliqué par l’agglomération des nanoparticules, qui présentent
alors une sévérité d’explosion similaires aux microparticules. La transition d’une limitation
diffusionnelle pour de grosses particules vers une limitation réactionnelle pour de petites
particules a également été démontrée (Bouillard et al., 2010). Cette transition a été obtenue vers
10 à 100 µm pour des composés carbonés (Di Benedetto et al., 2010), vers 30 µm pour des
composés organiques (Eckhoff, 2003) et vers 10 µm pour des particules métalliques (Glorian
et al., 2016). Pour ces dernières, un comportement pyrophorique a également été mentionné,
donnant lieu à une inflammation spontanée lors d’une exposition à l’air (Krietsch et al., 2015).
De plus, en diminuant la taille de particules jusqu’à l’échelle nanométrique, la transition d’une
diffusion de Mie vers une diffusion de Rayleigh induit des différences dans le transfert radiatif
par rapport aux microparticules, impactant probablement la validité de la loi cubique.
Chapitre 3 : Caractérisation de la poudre et du nuage
Ce chapitre est dédié à la caractérisation des poudres et des nuages associés et divisé en trois
parties.
D’abord, une présentation des poudres considérées dans ce travail a été réalisée : nanocellulose,
noirs de carbone, silicium enrobé de carbone et deux poudres d’aluminium. Une méthode de
classification basée sur le calcul d’une surface spécifique volumique couplée à une analyse
d’image a été appliquée pour vérifier que les poudres peuvent être considérées comme des
nanomatériaux selon la définition de la Commission Européenne. A l’exception de la
nanocellulose, pour laquelle des tests complémentaires ont été réalisés par la suite, toutes les
poudres étudiées sont classifiées en tant que nanomatériaux. Des mesures de distribution de
tailles de particules (DTP) ont été réalisées en voie liquide, ce qui est pratique mais d’un intérêt
limité quand il s’agit de tester des poudres dispersées dans l’air, ainsi que par sédimentation en
voie sèche afin d’estimer la DTP des agglomérats soumis à un faible cisaillement. La présence
de micro-agglomérats constitués de nanoparticules a alors été mise en avant.
Puisqu’une explosion de poussière nécessite la dispersion de la poudre, des mesures de DTP
ont également été conduites après dispersion. D’abord, la pulvérulence du noir de carbone et de
la nanocellulose a été mesurée, démontrant la capacité des deux poudres à émettre des
nanoparticules. Des mesures de DTP ont été réalisées à l’aide d’un Fast Mobility Particle Sizer
(FMPS) et d’un Scanning Mobility Particle Sizer (SMPS) et ont démontré la présence de
nanoparticules jusqu’à deux minutes après dispersion. Des essais de dispersion ont aussi été
conduits à l’aide d’un disperseur Scirocco et ont montré la fragmentation des agglomérats lors
de la dispersion. Enfin, un granulomètre à diffraction laser couplé à une sphère de visualisation
de 20L ont permis une estimation in situ de la DTP dans la chambre de combustion, au moment
et à l’endroit de l’inflammation. Une différence nette est alors apparue entre les diamètres
moyens mesurés par sédimentation et les diamètres mesurés après dispersion, à cause du fort
cisaillement induit par le processus de dispersion. Le nuage est ainsi constitué de nano- et de
micro-agglomérats. Ainsi, la considération de la DTP avant dispersion, mais aussi après

Résumé élargi
[238]
injection dans l’enceinte est essentielle lors de l’évaluation de la sévérité d’explosion des
nanoparticules afin de savoir exactement ce qui explose. L’évolution du niveau de turbulence
avec le temps après dispersion de la poudre dans la sphère de 20L a également été évaluée par
Particle Image Velocimetry (PIV). Le délai d’inflammation préconisé par les standards
internationaux se situant dans une zone de transition, une faible variation dans ce délai peut
fortement modifier le niveau de turbulence, et ainsi la sévérité d’explosion de la poudre.
Cependant, la caractérisation visuelle du nuage de poussières ne peut être systématiquement
effectuée à cause de l’opacité de la sphère standard et d’une limitation technique : actuellement,
aucun appareil ne permet la mesure de nanoparticules à haute fréquence et forte concentration.
Ainsi, une corrélation semi-empirique reliant les conditions opératoires et les caractéristiques
de la poudre à un coefficient d’efficacité de fragmentation, défini par le ratio entre le diamètre
moyen en surface avant et après dispersion, a été proposée et a montré des résultats
encourageants.
Chapitre 4 : Evaluation standard de l’inflammabilité et explosivité
Ce chapitre est dédié à la détermination des paramètres standard de sécurité des poudres et à
l’établissement de recommandations concernant ces paramètres.
D’abord, la sensibilité à l’inflammation des poudres a été évaluée par la mesure de l’énergie
minimale d’inflammation, la température minimale d’inflammation et la concentration
minimale explosible. Après une présentation des méthodes et appareils standards pour la
mesure de ces éléments, les valeurs obtenues pour chaque poudre ont été discutées. Il apparait
alors que les poudres considérées, à l’exception du noir de carbone, sont particulièrement
sensibles comparées aux microparticules, notamment au niveau de l’énergie minimale
d’inflammation. En effet, la nanocellulose et le silicium enrobé de carbone montrent des
énergies minimales d’inflammation de 16 mJ et 4 mJ respectivement, alors que les deux poudres
d’aluminium ont été enflammées par une étincelle de 1 mJ. Des mesures spécifiques pour éviter
les décharges électrostatiques, telles qu’une mise à la terre des installations ou du personnel,
doit alors être implémentée lors de la manipulation de ces nanopoudres. Les paramètres
influençant la sensibilité à l’inflammation d’une poudre ont été détaillés à travers une analyse
dimensionnelle décrivant la combustion d’un nuage de particules, mettant notamment en
lumière les différentes limitations cinétiques lors de la combustion de micro- et de
nanoparticules.
Dans une seconde partie, le protocole pour la mesure des caractéristiques de sévérité
d’explosion, i.e. la surpression maximale d’explosion et la vitesse maximale de montée en
pression, a été détaillé pour la sphère de 20L, et les valeurs déterminées ont été présentées. Les
poudres organiques et carbonées ont alors été classées St1, ce qui traduit une explosivité
modérée, tandis que les poudres métalliques, i.e. l’aluminium et le silicium enrobé de carbone,
ont mené à des explosions bien plus sévères et ont été classées respectivement St3 et St2.

Résumé élargi
[239]
La dernière partie de ce chapitre se focalise sur les observations liées aux essais expérimentaux
et à un questionnement concernant la validité des standards internationaux pour l’évaluation de
la sensibilité à l’inflammation et la sévérité d’explosion des nanopoudres. En effet, à cause de
leur forte sensibilité à l’inflammation, la pressurisation du réservoir avant l’injection de la
poudre dans la sphère de 20L peut être suffisante pour enflammer la poudre avant l’activation
des inflammateurs pyrotechniques. En résulte alors une mauvaise estimation de l’évolution de
la pression en fonction du temps mesurée dans la chambre de combustion, et peut également
endommager le matériel. De plus, la quantité d’énergie nécessaire pour enflammer ces
poussières est assez faible (quelques millijoules), tandis que l’énergie d’inflammation standard
dans la sphère de 20L est de 10 kJ, ce qui peut mener à un phénomène d’overdriving et influer
sur la propagation de la flamme, menant une fois encore à des résultats erronés. Enfin, le fort
cisaillement induit par la dispersion dans la sphère de 20L peut fragmenter les agglomérats,
impliquant que la distribution de tailles de particules peut être différente avant et après la
dispersion, ce qui n’est pas spécifiquement considéré dans les standards internationaux.
Chapitre 5 : Les standards versus la réalité
Les spécificités des nanopoudres (agglomération, propriétés d’adsorption, grande surface
spécifique, etc.) induisent un comportement explosif parfois différent de celui observé pour les
poudres micrométriques, ou, plus généralement, conduit à des tendances exacerbées. Ce
chapitre est donc dédié à mettre en lumière ce genre de tendances à travers six parties et
l’exemple de quatre poudres de différentes natures. Par exemple, les améliorations suivantes
peuvent être suggérées :
i) Il est important de garder en mémoire que la distribution de tailles de particules
(DTP) des poudres nanométriques est modifiée par désagglomération durant la
dispersion, même si les techniques de mesures de DTP actuelles ne permettent pas
de quantifier ce décalage. La DTP sera préférentiellement exprimée en surface à la
place de la distribution volumique.
ii) Des disperseurs alternatifs permettent d’atteindre des valeurs plus élevées de
sévérité d’explosion. Puisque l’objectif des standards n’est pas de reproduire les
conditions industrielles, et que le disperseur standard ne mène pas systématiquement
aux résultats les plus conservatifs, la priorité devrait être donnée à la fiabilité des
résultats, notamment en choisissant des disperseurs permettant une meilleure
homogénéité du nuage.
iii) La source d’inflammation devrait être adaptée à la faible énergie minimale
d’inflammation des poudres nanométriques afin d’éviter un phénomène dit
‘d’overdriving’, ou, tout du moins, ce phénomène devrait être mieux caractérisé afin
d’estimer l’énergie supplémentaire fournie au nuage pour la combustion.
iv) La pré-inflammation des nanopoudres particulièrement sensibles dans le réservoir à
poussière peut être évitée par une injection sous azote (mais une inflammation

Résumé élargi
[240]
spontanée peut se produire dans la sphère), ou par simple soulèvement de la poudre,
comme pour la détermination de l’énergie minimale d’inflammation. Cependant, du
fait de leur vitesse de propagation rapide, le temps d’ouverture de l’électrovanne
devrait être réduit afin d’éviter un retour de flamme dans le réservoir à poudres, ou
le délai d’inflammation devrait être adapté.
v) Des modifications dans le délai d’inflammation peuvent être utiles afin d’obtenir les
résultats les plus conservatifs possibles. Cependant, un niveau de turbulence trop
faible (e.g. < 2 m.s-1) peut conduire à la ségrégation des agglomérats, tandis qu’un
niveau de turbulence trop élevé (e.g. > 6 m.s-1) peut mener à des mécanismes de
combustion alternatifs.
vi) Une attention particulière doit être porté aux conditions de stockage des
nanopoudres et à l’humidité de l’air ambiant et de l’air d’injection. En effet, la
présence d’eau peut modifier l’inflammabilité et l’explosivité des poudres en
fonction de leur nature et de leur capacité à réagir avec l’eau.
Finalement, les résultats obtenus doivent être extrapolés à l’échelle industrielle, avec les mêmes
limitations inhérentes à la loi cubique que celles rencontrées pour les poudres micrométriques.
Une approche alternative serait d’utiliser les avantages des nanopoudres, en particulier leur
faible vitesse de sédimentation, afin de déterminer leur vitesse laminaire de flamme, qui est un
paramètre intrinsèque au mélange poussière/air qui peut être utilisé comme donnée d’entrée
pour des codes CFD. Le chapitre suivant est ainsi dédié à l’évaluation de ce paramètre,
notamment pour la nanocellulose.
Chapitre 6 : Etude de propagation de flamme
Afin de maîtriser l’influence des conditions opératoires sur les paramètres de sévérité
d’explosion, les efforts se sont focalisés sur la détermination de la vitesse laminaire de flamme,
un paramètre intrinsèque au mélange poussière-air. Ce chapitre est divisé en trois parties,
respectivement dédiées à la détermination expérimentale et numérique de la vitesse laminaire
de flamme de la nanocellulose, et à l’application des modèles de vitesses de flamme turbulentes.
Dans la première partie, la vitesse laminaire de flamme de la nanocellulose a été estimée par
trois différentes méthodes. Les deux premières consistent en une visualisation directe de la
propagation de flamme à faible turbulence dans un tube vertical de 1 m de long et dans une
sphère de 20L éventée, couplée à l’application de relations liant la vitesse de la flamme et son
étirement, tandis que la troisième méthode repose sur l’utilisation d’une corrélation basée sur
l’évolution de la pression en fonction du temps durant un essai standard d’explosion. Ces trois
méthodes ont mené à des valeurs similaires de vitesses laminaires de flamme pour la
nanocellulose, d’environ 21 cm.s-1. Il a notamment été souligné que ces analyses de propagation
de flamme à faible turbulence peuvent aider au développement de corrélations semi-empiriques
permettant une estimation de la vitesse laminaire de flamme à partir de la connaissance de
l’évolution de la pression avec le temps dans la sphère de 20L.

Résumé élargi
[241]
La vitesse laminaire de flamme de la nanocellulose a également été déterminée à l’aide d’un
modèle numérique de propagation de flamme en une dimension, déjà validé pour des mélanges
hybrides. Le système numérique, composé d’équations de bilans de masse et d’énergie et de
vitesses de réactions massiques adaptées aux réactions de combustion, a été résolu par la
méthode des volumes finis, en considérant dans un premier temps une propagation par
convection et conduction. Deux approches ont été comparées : une réaction simultanée de
pyrolyse de la poudre et de combustion des gaz de pyrolyses d’un côté, et la combustion des
gaz de pyrolyse, considérant une dévolatilisation rapide des poudres organiques (notamment
discuté dans le chapitre 4) de l’autre. Les deux méthodes ont conduit à des valeurs similaires,
avec une diminution de 19% dans la valeur de vitesse laminaire de flamme en considérant la
réaction de pyrolyse, ce qui valide l’hypothèse d’une pyrolyse rapide ne limitant pas la
combustion. Puisqu’en pratique, la dévolatilisation n’est pas instantanée, les particules qui
n’ont pas encore réagi peuvent contribuer au transfert radiatif, qui a donc été ajouté au bilan
d’énergie. L’existence d’une relation linéaire entre la vitesse laminaire de flamme et la surface
totale développée par les particules impliquées dans le transfert radiatif a été démontrée,
prouvant une nouvelle fois l’importance de la surface reactive. Une augmentation de vitesse
laminaire de flamme atteignant 19% a notamment été observée en considérant la contribution
des particules au transfert de chaleur par rayonnement. En effet, bien que l’influence du transfert
thermique radiatif des nanoparticules a tendance à être négligée à cause d’une diffusion de
Rayleigh, la contribution des micro-agglomérats subsistant après la dispersion doit être prise en
compte.
Ce travail de thèse s’est focalisé sur l’évaluation des risques liés aux explosions de
nanoparticules, et plus spécifiquement sur l’adéquation des méthodes standards pour la mesure
de la sensibilité à l’inflammation et la sévérité d’explosion. L’impact de la nature chimique, du
diamètre primaire de particule, de l’état d’agglomération, de la teneur en eau, de l’énergie
d’inflammation, de la procédure de dispersion et du délai d’inflammation sur la sévérité
d’explosion a notamment été analysé à travers l’exemple de quatre types de poudres :
nanocellulose, aluminium, silicium enrobé de carbone et noir de carbone. L’objectif de ce
travail était d’apporter de nouvelles connaissances concernant l’influence des spécificités des
nanoparticules sur leur explosivité de manière à proposer des améliorations et méthodes
alternatives adaptées à ces spécificités.
Une chose est sûre : les standards sont essentiels. Mais quand ils sont face à un grain de sable,
ils prennent parfois un long moment à s’adapter à un contexte changeant. En étant, de manière
inhérente, plus adaptables à différents matériaux et contextes industriels, ils gagneraient en
réactivité. Il est temps de s’adapter !
[242]
Nouvelles considérations sur l'explosivité des nanopoudres: un nano-grain
de sable dans les rouages des standards
Lorsqu’il s’agit de poudres combustibles, les analyses de risques et le zonage ATEX requièrent
la connaissance de paramètres de sécurité obtenus à l’aide de procédures standards, initialement
créées pour des poudres micrométriques et appliquées telles quelles aux nanopoudres.
Cependant, leurs propriétés spécifiques (faible énergie minimale d’inflammation, distribution
de tailles de particules allant des nanoparticules aux agglomérats micrométriques…) peuvent
induire des déviations ou des erreurs de mesures en utilisant ces essais standards. Des tests ont
été réalisés sur quatre nanopoudres en conditions standards et non-standards, démontrant que
les normes ne mènent pas systématiquement aux paramètres de sécurité les plus conservatifs ni
les plus représentatifs. Dès lors, une adaptation des standards est requise. Des propositions ont
été faites concernant la préparation des échantillons, les procédures et équipements de mesure,
ainsi que les paramètres de sécurité à considérer.
New insights on the explosion severity of nanopowders: a nano-grain of
sand in the gears of the standards
When considering combustible dusts, hazard assessment studies and classification of ATEX
zones require the knowledge of safety parameters obtained through standard procedures
initially designed for micropowders. Currently, the same standards are applied, unchanged, for
testing nanopowders. However, their specific properties (low minimum ignition energy, wide
particle size distribution ranging from nanometric particles to micro-agglomerates…) can lead
to deviations, or even measurement errors, when using these standardized tests. Therefore, tests
were performed on four nanopowders under standard and non-standard conditions,
demonstrating that standard conditions do not automatically lead to the most representative or
conservative safety parameters. An adjustment of the international standards is then needed.
Proposals are made concerning the samples preparation, the test procedure and equipment used
for such characterization, and the more relevant safety parameters to be determined.
Copyright © 2022 FDOKUMEN