inhibition of human aldose reductase by high phenolic and
108
INHIBITION OF HUMAN ALDOSE REDUCTASE BY HIGH PHENOLIC AND HIGH ANTI-OXIDATIVE EXTRACTS OF MUSCADINE GRAPE FRACTIONS by LAUREN SNIPES (Under the Direction of Diane K. Hartle) ABSTRACT Muscadines are berries of Vitis rotundifolia, a grape native to SE USA. Muscadine skins and seeds are sold as nutraceutical products because of their high antioxidant activity, anti-inflammatory and anti-cancer phytochemical profiles. Hyperglycemia leads to both induction and activation of aldose reductase (AR), the initial rate-limiting enzyme of the polyol pathway (conversion of glucose to sorbitol to fructose). Activation of the polyol pathway contributes to Advanced Glycation Endproduct (AGE) formation in organs with AR activity including lens of the eye, kidney, heart, nerves and liver. This pathway is implicated in diabetic cataract formation and neuropathies. Because the pharmacognosy of muscadine skins revealed many compounds with anti-AR activity, we tested the ability of muscadine skin and seed extracts to inhibit human recombinant AR (HRAR) in vitro. The results indicated that extracts of muscadine skins and seeds inhibited AR activity at low concentrations. Nutraceutical products made from muscadine skins and seeds may prove useful in inhibiting AGE formation via inhibition of the polyol pathway.
-
Upload
khangminh22 -
Category
Documents
-
view
0 -
download
0
Transcript of inhibition of human aldose reductase by high phenolic and

INHIBITION OF HUMAN ALDOSE REDUCTASE BY HIGH PHENOLIC AND
HIGH ANTI-OXIDATIVE EXTRACTS OF MUSCADINE GRAPE FRACTIONS
by
LAUREN SNIPES
(Under the Direction of Diane K. Hartle)
ABSTRACT
Muscadines are berries of Vitis rotundifolia, a grape native to SE USA.
Muscadine skins and seeds are sold as nutraceutical products because of their
high antioxidant activity, anti-inflammatory and anti-cancer phytochemical
profiles. Hyperglycemia leads to both induction and activation of aldose
reductase (AR), the initial rate-limiting enzyme of the polyol pathway (conversion
of glucose to sorbitol to fructose). Activation of the polyol pathway contributes to
Advanced Glycation Endproduct (AGE) formation in organs with AR activity
including lens of the eye, kidney, heart, nerves and liver. This pathway is
implicated in diabetic cataract formation and neuropathies. Because the
pharmacognosy of muscadine skins revealed many compounds with anti-AR
activity, we tested the ability of muscadine skin and seed extracts to inhibit
human recombinant AR (HRAR) in vitro. The results indicated that extracts of
muscadine skins and seeds inhibited AR activity at low concentrations.
Nutraceutical products made from muscadine skins and seeds may prove useful
in inhibiting AGE formation via inhibition of the polyol pathway.

INDEX WORDS: Diabetes, diabetic complications, polyol pathway, aldose
reductase, aldose reductase (AR) inhibitors, muscadine grape, antioxidant, total phenolic content, ferric reducing antioxidant power (FRAP)

INHIBITION OF HUMAN ALDOSE REDUCTASE BY HIGH PHENOLIC AND
HIGH ANTI-OXIDATIVE EXTRACTS OF MUSCADINE GRAPE FRACTIONS
by
LAUREN SNIPES
B.S. Chemistry, University of Tennessee at Chattanooga, 2004
A Thesis Submitted to the Graduate Faculty of The University of Georgia in
Partial Fulfillment of the Requirements for the Degree
MASTER OF SCIENCE
ATHENS, GEORGIA
2006

© 2006
LAUREN SNIPES
All Rights Reserved

INHIBITION OF HUMAN ALDOSE REDUCTASE BY HIGH PHENOLIC AND
HIGH ANTI-OXIDATIVE EXTRACTS OF MUSCADINE GRAPE FRACTIONS
by
LAUREN SNIPES
Major Professor: Diane K. Hartle
Committee: Phillip Greenspan James L. Hargrove
Electronic Version Approved: Maureen Grasso Dean of the Graduate School The University of Georgia August 2006

ACKNOWLEDGEMENTS
I would like to thank Dr. Diane K. Hartle, my major professor, for sharing all of her
knowledge and wisdom. Without her encouragement, support, and patient guidance
this would not have been possible. She was always available for help and her insightful
advice helped me develop the skills that I needed to obtain this goal.
I would also like to thank my graduate committee members, Dr. Phillip Greenspan
and Dr. James L. Hargrove, for their constructive advice and support during my entire
course of studies and research.
iv

TABLE OF CONTENTS
Page
ACKNOWLEDGEMENTS ...........................................................................................................iv
LIST OF TABLES...........................................................................................................vii
LIST OF FIGURES........................................................................................................ viii
CHAPTER
1 INTRODUCTION AND LITERATURE REVIEW ................................................... 1
ALDOSE REDUCTASE AND THE POLYOL PATHWAY ............................... 1
DIABETES MELLITUS.......................................................................................... 6
STRUCTURE OF ALDOSE REDUCTASE........................................................ 8
ALDOSE REDUCTASE INHIBITORS .............................................................. 10
CHEMISTRY OF THE MUSCADINE................................................................ 19
DETERMINATION OF TOTAL PHENOLICS .................................................. 21
DETERMINATION OF TOTAL ANTIOXIDANT POWER .............................. 23
REFERENCES..................................................................................................... 27
2 INHIBITION OF HUMAN RECOMBINANT ALDOSE REDUCTASE BY
MUSCADINE GRAPE EXTRACTS .................................................................. 33
ABSTRACT........................................................................................................... 34
2.1 INTRODUCTION........................................................................................... 35
2.2 MATERIALS AND METHODS .................................................................... 37
2.3 RESULTS ........................................................................................................40
v

2.4 DISCUSSION ................................................................................................ 41
2.5 REFERENCES .............................................................................................. 45
3 TECHNICAL MANUAL FOR ANTIOXIDANT AND TOTAL PHENOL
CONTENT IN QUALITY CONTROL OF NATURAL PRODUCT
PROCESSING ..................................................................................................... 47
INTRODUCTION ................................................................................................. 47
TOTAL PHENOLIC CONTENT ASSAY........................................................... 49
ANTIOXIDANT POWER ASSAY ...................................................................... 49
METHODS FOR TOTAL PHENOLIC CONTENT ASSAY ............................ 50
METHOD FOR FRAP ASSAY ........................................................................... 57
REFERENCES..................................................................................................... 66
4 THE CORRELATION OF TOTAL PHENOLIC CONTENT AND
ANTIOXIDANT POTENTIAL IN MUSCADINE PRODUCTS AND
SPECIALTY VINEGARS .................................................................................... 67
ABSTRACT........................................................................................................... 68
4.1 INTRODUCTION........................................................................................... 69
4.2 MATERIALS AND METHODS .................................................................... 73
4.3 RESULTS ....................................................................................................... 74
4.4 DISCUSSION ................................................................................................ 92
4.5 REFERENCES.................................................................................... 94
5 CONCLUSION .............................................................................................. 96
vi

LIST OF TABLES
Page
Table 2.1: Phenolic content and FRAP values of the muscadine extracts .................... 40
Table 3.1: Experimental ranges for dilutions of muscadine products for total phenolic
content assay ................................................................................................. 54
Table 3.2: Example of concentrations and absorbance’s for a standard curve of a total
phenolics assay .............................................................................................. 55
Table 3.3: Preparation of standards in the FRAP assay from a 1 mM stock solution of
Fe2SO4 ........................................................................................................... 60
Table 3.4: Experimental ranges for dilutions of muscadine products for FRAP assay .. 62
Table 3.5: Example of concentrations and absorbance’s for the standard curve of a
FRAP assay.................................................................................................... 63
Table 4.1: Sources for Figure 4.2, total phenolic content and FRAP values of muscadine
seed products ................................................................................................. 78
Table 4.2: Total phenolic content and FRAP values of various grape juices................. 84
Table 4.3: Total phenolic content and FRAP values of the muscadine wines ............... 86
Table 4.4: Sources for Figure 4.10, total phenolic and FRAP values of the vinegars.... 90
vii

LIST OF FIGURES
Page
Figure 1.1: Polyol Pathway.............................................................................................. 2
Figure 1.2: Oxidative stress in the polyol pathway .......................................................... 6
Figure 1.3: Structures of selected synthetic aldose reductase inhibitors, Tolrestat and
Epalrestat ....................................................................................................... 12
Figure 1.4: Structures of selected synthetic aldose reductase inhibitors, Zenarestat and
Sorbinil ........................................................................................................... 13
Figure 1.5: Structures of selected subgroups of flavonoids, the flavonols and
anthocyanins .................................................................................................. 17
Figure 2.1: Inhibition of HRAR by purified quercetin ..................................................... 42
Figure 2.2: Inhibition of HRAR by muscadine skin extracts........................................... 42
Figure 2.3: Inhibition of HRAR by muscadine seed extract ........................................... 43
Figure 2.4: IC50 concentrations of extracts according to the total phenolics................. 43
Figure 3.1: Example of a standard curve for the total phenolics assay ......................... 55
Figure 3.2: Example of a standard curve for a FRAP assay.......................................... 64
Figure 4.1: Total phenolic content and FRAP values of Noble and Carlos muscadine
seed samples ................................................................................................. 75
Figure 4.2: Total phenolic content and FRAP values of muscadine seed products....... 77
Figure 4.3: Correlation between the total phenolic content and antioxidant (FRAP)
values of the total muscadine seed samples .................................................. 79
viii

Figure 4.4: The total phenolic content and FRAP values for muscadine grape skin
samples .......................................................................................................... 81
Figure 4.5: Correlation between the total phenolic content and antioxidant (FRAP)
values of the muscadine skin samples ........................................................... 82
Figure 4.6: Total phenolic content and FRAP values of various grape juices................ 84
Figure 4.7: Correlation between the total phenolic content and antioxidant (FRAP)
values of various grape juices ........................................................................ 85
Figure 4.8: Total phenolic content and FRAP values of muscadine wines .................... 86
Figure 4.9: Correlation between the total phenolic content and antioxidant (FRAP)
values of muscadine wines............................................................................. 87
Figure 4.10: Total phenolic content and FRAP values of specialty vinegars ................. 89
Figure 4.11: Correlation between the total phenolic content and antioxidant (FRAP)
values of specialty vinegars............................................................................ 91
ix

CHAPTER 1
INTRODUCTION
ALDOSE REDUCTASE AND THE POLYOL PATHWAY
Aldose reductase (AR) is a small monomeric protein that is a member of
the aldo-keto reductase superfamily. It is composed of 315 amino acid residues
and has many similarities to another NADPH-dependent oxidoreductase,
aldehyde reductase. Aldose reductase is a widely expressed aldehyde-
metabolizing enzyme present in most mammalian cells. The enzyme is located in
the cytoplasm of most cells, but is often located in different cell types of a specific
organ. For example, AR is highly expressed in the lens as compared to other
tissues in the body [1, 2]. In the lens, aldose reductase is located only in the
epithelium, while in the kidney it is contained in Henle’s loop, collecting tubules,
outer and inner medulla, but not in the cortex [3]. The distribution of aldose
reductase from tissue to tissue also varies considerably. Aldose reductase
exhibits broad substrate specificity, in that it reduces glucose as well as aromatic
and aliphatic aldehydes. The sugar galactose actually serves as a better
substrate for aldose reductase than glucose. Due to aldose reductase’s greater
affinity for galactose than glucose, increased levels of galactose are more rapidly
reduced to galactitol (dulcitol) than glucose to sorbitol. Galactitol is not oxidized
by sorbitol dehydrogenase; therefore intracellular levels of galactitol remain high
and cause a greater hyperosmotic effect than glucose. The tissues in which
1

galactitol accumulates have a similar cellular pathology to those in diabetic
tissues and galactosemic animal studies are important in studying the
relationship between aldose reductase and diabetic complications [4, 5].
The polyol pathway was first discovered in the seminal vesicle by Hers in
1956. Hers was able to demonstrate the conversion of blood glucose to fructose
as an energy source of sperm cells [2]. In 1959, Van Heyningen reported that
sorbitol could be found in the diabetic rat lens [6]. Van Heyningen’s research
lead to recognition of the importance of the polyol pathway in the development of
diabetic complications [2]. The polyol pathway is an alternate pathway for
glucose metabolism and converts glucose to fructose using two enzymes, aldose
reductase and sorbitol dehydrogenase, Figure 1.1. Aldose reductase is the rate-
limiting enzyme in this pathway and it catalyzes the conversion of glucose to
sorbitol using NADPH as its cofactor [2, 3]. Sorbitol is then oxidized to fructose
by sorbitol dehydrogenase which utilizes NAD+ as its cofactor [5].
Polyol Pathway NADPH NADP+ NAD+ NADH
Glucose Sorbitol Fructose AAllddoossee RReedduuccttaassee SSoorrbbiittooll
DDeehhyyddrrooggeennaassee
Figure 1.1 Polyol Pathway
Diabetes involves a high oxidative stress state with increased production of
toxic aldehyde compounds and elevated blood glucose levels. Aldose reductase
2

is an important factor of hyperglycemic induced metabolic changes that lead to
the development of secondary diabetic complications [7]. Although much
research has been done in the past few years, the mechanism by which aldose
reductase contributes to the development of diabetic complications remains
uncertain.
There is an increased expression of aldose reductase under hyperosmotic
stress. The increased flux of glucose through the polyol pathway directly
increases the activity of aldose reductase, but reactive oxygen species indirectly
activate aldose reductase as well [8]. Aldose reductase competes with
hexokinase for the utilization of glucose in many tissues. Under normal
physiological conditions hexokinase has a greater affinity for glucose than aldose
reductase. In this circumstance glucose is phosphorylated into glucose-6-
phosphate by hexokinase, which then is subject to glycolysis [2, 4]. Only 3% of
glucose enters the polyol pathway under normal physiological conditions.
However, under hyperglycemic conditions, hexokinase becomes saturated by
elevated levels of glucose and it is forced into the polyol pathway.
Hyperglycemia causes more than 30% of glucose to go into the polyol pathway.
When glucose is forced into the polyol pathway there is an increase in the
production of sorbitol. However, under hyperglycemic conditions sorbitol is
produced more rapidly than it can be converted to fructose resulting in an
accumulation of sorbitol [2, 3]. The intracellular accumulation of sorbitol is
enhanced due to its polarity and cannot penetrate through the cell membranes.
The accumulation of sorbitol in the cell produces a hyperosmotic effect which
3

results in an influx of fluids [4, 5]. This accumulation of sorbitol has been thought
to cause osmotic vascular damage and lead to diabetic complications. Another
obstacle resulting from the utilization of glucose through the polyol pathway is the
rapid depletion of NADPH and NAD+, which causes a change in redox state and
metabolic imbalances [2, 7].
In the lens, the upsurge of sorbitol causes osmotic swelling which results in
redox imbalance and protein insolubilization leading to cataract formation. The
accumulation of sorbitol in the lens initiates hyperosmotic swelling which triggers
the loss of membrane permeability and leakage of amino acids, glutathione, and
myoinositol [3]. Water is drawn into the lens fibers due to the accumulation of
sorbitol which then causes the lens to swell. The swelling increases the
permeability to substances that are at a higher concentration in the lens than in
the surrounding intraocular fluids. Therefore, concentrations of potassium, amino
acids, glutathione, inositol, and ATP decrease, and sodium and chloride ion
concentrations start to increase. This results in the lens membranes becoming
permeable to all substances except the larger proteins. Under normal
physiological conditions there is a continual growth of the lens within the eye.
This normal lens growth is stunted as observed in cases of sugar cataracts due
to a decrease in protein synthesis. Generally a high potassium/sodium
environment is suitable for protein synthesis in the lens, however, in sugar
cataracts the intracellular concentration of potassium is lowered and sodium is
increased. This slows the process of protein synthesis in the lens accounting for
the diminished new growth. Aldose reductase inhibitors can prevent or moderate
4

the complications of diabetic cataracts. Aldose reductase inhibitors can be
administered orally, by injection, or as eye drops to diabetic patients. Efficacy of
the aldose reductase inhibitors depends on the administration at the early stages
of cataract formation and the strength of the inhibitor [3, 5].
In other target organs of diabetic complications, the depletion of cofactors
NADPH and NAD+ is thought to cause metabolic imbalances. The increased flux
of glucose through this pathway under hyperglycemic conditions imposes a
significant strain on the NADPH supply [2, 7]. NADPH is utilized for many
reductive metabolic steps such as the detoxification of reactive oxygen species
(ROS) and hyperoxides as seen in Figure 1.2 [9]. A large depletion of NADPH
could affect the ability of the cell to protect itself from oxidative stress.
Glutathione reductase also needs NADPH for glutathione to remain in the
reduced form and with the increased use of the polyol pathway during
hyperglycemia it is unable to do so. Glutathione reductase is an antioxidative
enzyme; therefore the lack of NADPH may produce oxidative stress by inhibiting
the reduction of oxidized glutathione [7, 9]. The depletion of NADPH and
glutathione results in indirect formation of advanced glycation endproducts
(AGEs) through the increased formation of oxidative stress [10]. The depletion of
NADPH and NAD+ would also decrease the generation of nitric oxide in
endothelial cells leading to redox imbalances. The depletion of NADPH slows
the production of nitric oxide from L-arginine by nitric oxide synthase. This
causes the release of nitric oxide to be reduced and leads to the slowing of nerve
conduction [2, 8].
5

Figure 1.2: Oxidative stress in the polyol pathway
DIABETES MELLITUS
Diabetes mellitus has become a growing epidemic that affects nearly 21
million Americans today. There are two major types of diabetes that affect most
people. Insulin-dependent diabetes mellitus (IDDM) is known as type 1 diabetes
and is an autoimmune disease that results in the destruction of pancreatic beta-
cells and insulin deficiency in the patient. Insulin is the storage and anabolic
hormone of the body that is responsible for allowing target tissues to take up
glucose [11]. Type 1 diabetes usually develops during childhood and only
accounts for 5-10% of all diagnosed cases of diabetes [12]. The cause of type 1
diabetes is not completely understood however, environmental factors which
could trigger the initiation of pancreatic beta-cell destruction are thought to play a
role as well as some genetic factors. Type 2 diabetes, also known as noninsulin-
6

dependent diabetes, is the most common form of the two types of diabetes. It
accounts for 90-95% of all cases of diagnosed diabetes [12]. Type 2 diabetes is
a progressive disease in which a person gradually develops a resistance to
insulin [13]. In type 2 diabetes, insulin is produced by the beta-cells, but there
are not enough functional insulin receptors to take up glucose for use by the
cells. The actual cause of type 2 diabetes is unknown, but diet, lifestyle, and
genetic factors are thought to play a role. Type 2 diabetes can develop at any
age and obesity is common in patients with this type of diabetes. While the direct
cause of diabetes is still unknown, there are many symptoms that can indicate
one is developing diabetes. These symptoms include frequent urination,
excessive thirst, extreme hunger, unusual weight loss, increased fatigue,
irritability, and vision problems [11, 14].
Diabetes mellitus is a widespread disease and is one of the leading causes of
blindness, kidney failure, heart attack, and amputation [15]. If left untreated,
diabetes can cause many complications such as cardiovascular disease,
hypertension, dental disease, retinopathy, cataracts, renal disease, neuropathies,
diabetic ketoacidosis and amputations [16]. Because of their insulin-insensitivity,
organs such as the lens, retina, nerves and kidney are target organs for these
diabetic complications [17]. These complications arise from chronic
hyperglycemia which causes oxidative stress in tissues and results in damage to
blood vessels and peripheral nerves [7]. There are several well-researched
theories addressing how hyperglycemia actually initiates the complications of
diabetes. However, for this study we have chosen to focus on the aldose
7

reductase (polyol pathway) theory. This theory proposes that under
hyperglycemic conditions, there is an elevated level of intracellular glucose which
causes an increased flux of glucose through the polyol pathway. This results in
an intracellular accumulation of sorbitol and fructose that causes hyperosmotic
stress [1, 7, 18]. The excess glucose and fructose binds to –NH2 groups on
proteins to produce fructosamines and advanced glycation end products (AGEs).
AGEs accumulate during the normal aging process, however, they build up to a
greater extent during diabetes [19]. The formation of AGEs is in both intracellular
and extracellular compartments in multiple organs. AGEs accelerate the aging of
blood vessels and cells within organs which leads to major diabetic problems
such as retinopathy, nephropathy, and neuropathy [20].
STRUCTURE OF ALDOSE REDUCTASE
The intracellular accumulation of sorbitol is thought to cause the hyperosmotic
stress and cellular damage that leads to diabetic complications [5]. Therefore,
aldose reductase inhibitors have been developed to help prevent and treat these
diabetic complications. However, to date a successful aldose reductase inhibitor
has not been developed. Aldose reductase inhibitors are developed so that they
are able to prevent the reduction of glucose to sorbitol therefore reducing diabetic
complications [15]. Over the years much research has been done to create an
ideal aldose reductase inhibitor; however this has been extremely difficult due to
the lack of knowledge about the enzyme itself. Most of the compounds
developed as aldose reductase inhibitors are non-specific and tend to inhibit
aldehyde reductase as well as aldose reductase. Developers want to avoid
8

inhibiting aldehyde reductase because it is an important enzyme that reduces
aldehydes which my react with proteins and damage cells. Aldehyde reductase
also plays a role in the excretion of drugs and the detoxification of 3-
deoxyglucose [1]. Designing an aldose reductase inhibitor specific to aldose
reductase remains difficult due to the structural and functional similarity of aldose
reductase and aldehyde reductase [3, 15].
Research continues on the enzyme aldose reductase and crystallographic
structures for human aldose reductases have even been determined. These
images show that aldose reductase has a tertiary structure very similar to that of
aldehyde reductase. These structures also show that aldose reductase has a
(β/α)8 barrel structural motif with a large hydrophobic active site. The active site
of the enzyme is located at the center of the barrel and is where the cofactor
NADPH binds. The inhibitor binds to the active site on top of the nicotinamide
ring of NADPH. Previous research with inhibitors show that compounds with
different chemical structures can interact with aldose reductase in different
conformations. This flexibility of the enzyme structure makes it hard for
researchers to use a theoretical approach in predicting how inhibitors will bind to
aldose reductase. Researchers have also found a ‘specificity pocket’ on the
enzyme in which inhibitors that are more effective against aldose reductase than
aldehyde reductase bind [2]. However, a specific aldose reductase inhibitor that
does not interfere with other compounds in the target organs has not been
discovered.
9

ALDOSE REDUCTASE INHIBITORS
Aldose reductase inhibitors may be useful agents to prevent and reduce the
effects of diabetic complications. Due to their potential benefits many aldose
reductase inhibitors have been developed by pharmaceutical companies.
Compounds such as flavonoids, benzopyrans, spirohydantoins, alkanoic acids,
alkaloids, nonsteroidal anti-inflammatory agents, quinines, and oxamines of
aromatic aldehydes have all been proven to show some aldose reductase
inhibition [3]. Therefore aldose reductase inhibitors can be categorized into six
main classes:
1. Compounds containing five-membered cyclic imides
2. Carboxylic acid derivatives
3. Phenolic compounds
4. Aryl sulfonyl nitromethanes
5. Amino acid derivatives
6. Other compounds
Sorbinil was one of the first promising ARIs to be developed by the
pharmaceutical company Pfizer. Sorbinil is a cyclic imide (spirohydantoin)
compound that was thought to improve nerve conduction velocity in diabetic
patients. Research done on diabetic rats proved that sorbinil could lower
glomerular polyol accumulation and normalize the concentration of sorbitol in the
lens through oral administration [21, 22]. However, when tested in humans
sorbinil only produced modest results with no significant improvements. Sorbinil
also had an adverse effect of a hypersensitivity reaction in the early weeks of
10

therapy [2, 15]. Fidarestat and minalrestat were two ARIs that were derived from
sorbinil. While these compounds were more potent than sorbinil they were
ineffective and their adverse effects outweighed their benefits. Imirestat was
another cyclic imide used for aldose reductase inhibition and was able to
normalize sorbitol levels in the nerve, retina and lens tissues. Despite its
effectiveness, imirestat was discontinued due to its toxicity [15].
The carboxylic acid derivatives are another class of ARIs that have been
studied extensively. Compounds in this group have a flexible carboxylic acid
moiety which is an important factor in the interaction with aldose reductase in
physiological conditions. Alrestatin is one of the more well known inhibitors of
this group and proved to be stable when given orally. In initial studies alrestatin
proved to be somewhat effective in diabetic patients suffering from neuropathy.
However in later trials alrestatin was not as effective as previously determined [3,
15].
Epalrestat was another carboxylic acid derivative that showed initial positive
results. Epalrestat was tested in patients with diabetic neuropathy and was able
to normalize the symptoms of peripheral neuropathy while showing few adverse
effects. Epalrestat also showed positive effects on vascular smooth muscle cells
under hyperglycemic conditions. Epalrestat is the only ARI on the market today,
although it is only marketed in Japan by Ono Pharmaceutical [15]. Ponalrestat
was developed as an ARI and while it showed promising effects in vitro, it failed
to show enough effectiveness in clinical trials. The clinical trials showed that
ponalrestat could not penetrate the nerve at the appropriate doses
11

CH3
NS COOH
O
S
Epalrestat
H3CO
CF3
S N
CH3
COOH
Tolrestat
Figure 1.3: Structures of selected synthetic aldose reductase inhibitors,
Tolrestat and Epalrestat
12

Br
F
N
N
COOH
Cl O
O
Zenarestat
F
O
NH
HNO
O
Sorbinil
Figure 1.4: Structures of selected synthetic aldose reductase inhibitors,
Zenarestat and Sorbinil
13

and was found to have no significant effect in double-blind placebo-controlled
studies [8]. Tolrestat was an ARI developed by Wyeth Ayerst to help treat and
prevent diabetic neuropathy. Tolrestat was an orally administered drug that was
6 times more potent than alrestatin. However it showed only modest
improvements in human diabetic neuropathy and had numerous side effects
such as hepatic necrosis, dizziness and rash. Therefore Tolrestat was removed
from the market in 1996 [2, 15].
Zenarestat is an ARI in the carboxylic acid derivative group that again showed
promise but its clinical trials were halted due to the toxic effects it produced in
patients. Zenarestat was an ARI that was developed by Pfizer to treat diabetic
neuropathy. Zenarestat showed therapeutic effects at high doses of 1200
mg/day, however treatment at these doses also caused renal toxicity in patients
[15]. Zopolrestat was another ARI that was developed by Pfizer to treat
nephropathy, neuropathy, and cardiomyopathy. Zopolrestats clinical trials were
terminated after producing little change in nerve fiber density of diabetic patients.
While this seems to be the most extensively studied group of ARIs, there have
not been any marketable ARIs in the United States to come out of this group.
There is great theoretical potential for ARIs having a flexible carboxylic acid
moiety; however in clinical trials they proved to be less active than the cyclic
imides [15].
Flavonoids are the most widely studied natural products group of ARIs.
Flavonoids are derived from natural substances such as plants and show great
promise as ARIs [23]. They have proven to be effective ARIs and are thought to
14

be less toxic than the synthetic compounds developed as ARIs. There are
several sub-groups of flavonoids that are studied for their aldose reductase
inhibitory potential such as flavonols, flavanones, ellagic acids, flavanonols,
isoflavones, and chlacones. Flavonoids are polyphenolic compounds which
consist of fifteen carbon atoms and a chromane ring that is connected to a
second benzene ring [15].
Flavonoids are known for their potent antioxidant activity. They were initially
discovered as ARIs in 1975, when they were found to show AR activity against
rat lens aldose reductase [24]. Quercetin is one of the most studied flavonoid
inhibitors of aldose reductase. Quercetin has been shown to decrease the
accumulation of sorbitol in the lens. Previous studies with rat lens aldose
reductase and human lens aldose reductase proved that quercetin had IC50
values of 5 x 10⁻⁶ M [24, 25]. However quercetin is poorly absorbed when
administered orally [15]. The glycosides of quercetin also showed good aldose
reductase inhibitory activity in rat lens. Isoquercitrin (quercetin 3-O-glucoside)
had 45 percent inhibition at 1 x 10⁻⁶ M and hyperoside (quercetin 3-O-
galactoside) had an IC50 of 1 x 10⁻⁶ M [24, 25]. Quercitrin is a flavonol which
appears to be more potent than quercetin. While quercitrin is not considered a
selective ARI, it did show much higher inhibition against aldose reductase than
aldehyde reductase [1]. In vitro studies using rat lens aldose reductase showed
quercitrin as a potent inhibitor having an IC50 of 1 x 10⁻⁷ M [24]. Flavonols
guaijaverin and desmanthin-1 also have aldose reductase inhibition similar to
that of quercitrin. Desmanthin-1 studies showed that it had aldose reductase
15

inhibition equivalent to that of the synthetic ARI, epalrestat [26]. Myricetin also
showed good aldose reductase inhibition, having 55 percent inhibition at 1 x 10⁻⁵
M [24]. Isoflavones, flavan-3-ols and stilbenes were tested for inhibition against
aldose reductase, however they were not as potent as the flavones, flavonols
and flavanone compounds tested [15, 26]. Chalcones are another type of
flavonoids that have been examined as potential ARIs. Different chalcone
compounds have been proven to decrease the accumulation of sorbitol in red
blood cell, sciatic nerves and the lens. 3, 4, 2’, 4’-tetrahydroxychalcone was
found to be the most effective ARI of the chalcones [1]. Ellagic acid is another
well known ARI that has shown high inhibitory activity against aldose reductase
[23]. The aldose reductase inhibitory effects of ellagic acid were tested in vitro
using isolated erythrocytes, lens and sciatic nerve. This study showed that
ellagic acid had an IC50 of 2.4 x 10⁻⁶ M, while epalrestat, a known synthetic
aldose reductase inhibitor, had an IC50 of 4.2 x 10⁻⁶ M. There was also an in vivo
study done on ellagic acids ability to inhibit aldose reductase in the lens and
sciatic nerve. This study proved that ellagic acid had significant inhibitory activity
similar to that of epalrestat [17]. Due to the extensive research done on
flavonoids as ARIs, it has been shown that factors such as structural features,
electronic environment and the position of the hydroxyl and other substituents
can affect the potency of the flavonoids as ARIs. Therefore others have been
able to determine structural requirements for ARIs. In previous studies it has
been determined that flavones and flavonols having hydroxyl groups at the meta
or para positions of the phenyl ring show greater aldose reductase inhibitory
16

HO
OH
O
OH
OH
O
Flavonol
OHO
OH
OH
OH
O
Anthocyanins
Figure 1.5: Structure of selected subgroups of flavonoids, the flavonols and
anthocyanins
17

activity. Flavonoids have great potential to be effective ARIs, however, they do
have one drawback in that they are poorly absorbed through oral administration.
Since many flavonoids are highly water soluble they cannot diffuse through
cellular membranes under physiological conditions. However, some compounds
such as phenolic aglycones can passively diffuse through cellular membranes
with ease due to their hydrophobic properties [15, 26].
The aryl sulfonyl nitromethanes and the amino acids are two groups of ARIs
that have not been researched as extensively as the first three groups of ARIs.
An aryl sulfonyl nitromethane that has been investigated for aldose reductase
inhibition is IC 222155. This compound has been shown to prevent hyperalgesia
in diabetic rats. N-substituted amino acids are another group of ARIs that have
been recently studied as a type of aldose reductase inhibition. N-[4-
(Benzoylamino)phenylsulfonyl]glycine is a selective ARI that has been
investigated as a potential ARI. This compound is believed to be able to prevent
diabetic complications of the eye such as cataracts and retinopathy. Studies of
this compound have shown that it has unique aldose reductase binding sites and
it selectively inhibits aldose reductase. However, research has shown that this
compound does not exhibit the free carboxylate anion and therefore reduces its
permeability and uptake in physiological conditions [15]. These two groups of
ARIs show potential in being useful ARIs, but they lack the research regarding
their potency and toxicity in humans.
18

CHEMISTRY OF THE MUSCADINE
The muscadine grape (Vitis rotundifolia) is a grape that is native to the
southeastern United States and is known for thriving in the warm, humid climate
which kills other species of grapes. The muscadines have a unique, thick skin
that most other species of grape do not have; this thick skin allows the
muscadine to grow under the harsh conditions [20, 27]. The muscadine is also
different from other species of grapes in that it has 20 pairs of chromosomes,
while the American and European species have only 19 pairs of chromosomes.
This extra genetic information is responsible for the muscadine’s unique
spectrum of phytochemicals [20]. The muscadine contains many powerful
phytochemicals that are capable of fighting diseases such as diabetes, cancer,
heart disease, and arthritis. Many recent studies have shown that free radicals
are the main cause of degenerative and neurological diseases [28]. Research
has shown that flavonoids are capable of donating hydrogen-atoms to peroxyl
radicals [29]. The plant antioxidants act as oxygen quenchers, free radical
scavengers, peroxide decomposers, and enzyme inhibitors [28]. Diabetes is a
disease which causes the increased production of free radicals. The muscadines
antioxidant effects help protect the tissues against free-radical damage [20]. Due
to the muscadines wide spectrum of phytochemicals it is thought to be a potential
ARI.
The muscadine contains high levels of anthocyanins, flavanols, flavonols, and
ellagic acid [20]. The most abundant of the flavonoids in the muscadine are the
anthocyanins. The polyphenolics, anthocyanins, flavonols, and phenolic acids
19

are the greatest contributors to the total antioxidant capacity [30]. The
muscadine skin and seeds contain most of the phytochemicals that are important
to the muscadine, however the pulp has a high concentration of vitamin C [20,
31]. The chemical constituents observed in the skin and seed are very different.
Ellagic acid was the most abundant phenolic found in the skins followed by
myricetin, quercetin, kaempferol, and trans-resveratrol [28]. Ellagic acid is a
phenolic compound that is unique to the muscadine and is a potent ARI [20, 27].
The phenolics found in the seed were epicatechin, catechin, and gallic acid, with
epicatechin being the most plentiful phenolic. Research shows that muscadine
seeds have a higher antioxidant capacity than other parts of the fruit. This is
thought to be due to the high levels of epicatechin and catechins found in the
seeds [28]. Ultimately the muscadine was the chosen fruit for this project due to
its numerous phytochemicals which are good ARIs. The muscadine contains
ellagic acid, kaempferol, myricetin, myricetin glycosides, quercetin, quercetin
glycosides, chlorogenic acid, and epicatechin, all of which inhibit aldose
reductase [20].
As the antioxidant properties of the muscadine are being discovered many
commercial vineyards have taken interest in developing muscadine food
supplementation and nutraceutical products. The skins and seeds are not used
in the juicing process; therefore many vineyards have leftover skins and seeds
that could be used for nutraceutical products. Dried, powdered muscadine skin,
seed and pomace can be encapsulated and taken as a food supplement. Since
most of the antioxidants are found in the skins and seeds these capsules would
20

have a high nutraceutical value. These products would be beneficial in that they
have a long shelf life and they are highly concentrated in phytochemicals. The
muscadine products are being processed today to extract the highly
concentrated antioxidants of the seed. This product can then be encapsulated
and sold as a nutraceutical product. However these pills need to be
standardized so that the consumer is assured the quality of the product. A good
way to standardize these products would be to test them for their total phenolic
and antioxidant contents. This would require two simple, inexpensive assays,
the Folin-Ciocalteu total phenolic assay and the ferric reducing antioxidant power
(FRAP) assay. However, many commercialized vineyards which are producing
these products do not have a standardization method [20].
DETERMINATION OF TOTAL PHENOLICS
Phenolics are a group of secondary plant metabolites that are ubiquitous
among the plant kingdom [32]. Phenolics are compounds that contain a phenol
ring and there are more than 8,000 structures known [33]. Phenolics can be
separated into two categories, flavonoids and non-flavonoids. Flavonoids are the
most widely distributed group of phenolics and consist of flavanols (flavan-3-ols),
flavonols, and anthocyanins. Flavanols include compounds such as simple
monomeric catechins and proanthocyanidins. Flavonols are usually found in the
skin and include compounds such as quercetin, myricetin and kaempferol.
Anthocyanins are the most abundant flavonoids found in the muscadine and
consist of cyanidins with a sugar molecule attached [20, 27]. Anthocyanins
consist of compounds such as cyanidin 3-O-glucoside [20, 34]. The
21

nonflavonoids include hydroxycinnamic acids (e.g. caffeic acid), benzoic acids
(e.g. gallic acid), hydrolysable tannins (e.g. ellagitannins), and stilbenes (e.g.
reseveratrol) [34]. Recent studies have shown that polyphenols have antioxidant
and free-radical scavenging properties [35]. Many of the antioxidants found in
food are phenols [36]. Due to their antioxidant activity phenolics are capable of
ultraviolet protection, pigmentation, disease resistance and nodule production
[32]. The daily intake for phenolics ranges from 20 mg to 1 g [33]. Since
phenolics have many antioxidant functions it is important to find a reliable method
that can measure them accurately.
The Folin-Ciocalteu Micro Method for Total Phenolics was used to determine
the total phenolic content of the samples tested in this project. This method is
based on the Slinkard and Singleton total phenol method [37], however the
volumes have been reduced. The Folin-Ciocalteu method is the most commonly
used method for measuring total phenolics [38]. Other methods for total phenolic
determination include high-performance liquid chromatography (HPLC),
permanganate titration, colorimetry with iron salts and ultraviolet (UV)
absorbance. Due to the numerous phenolic compounds the isolative method of
HPLC is difficult to apply and results are difficult to interpret [36]. The
permanganate titration method is not ideal because it is difficult to standardize
and subject to interferences from sugars. The method of colorimetry with iron
salts is not as accurate because monophenols usually do not react, and vicinal
diphenols and vicinal triphenols turn different colors. The UV method also has
problems such as interference from other compounds that absorb at similar
22

wavelengths. The Folin-Ciocalteu method is a much more simpler method that
produces comparable and reproducible results [36]. The Folin-Ciocalteu assay is
a colorimetric method that uses conventional spectrophotometric detection at a
wavelength of 765 nm. The method is based on the oxidation of polyphenolic
compounds with phosphomolybdic and phosphotungstic acids in a basic
medium. This results in a color change and the resulting color intensity is
proportional to the concentration of polyphenols. The total phenolic values are
derived from a calibration curve that is made using a series of standard solutions
[38]. Many compounds can be used to create the standard solutions including
tannic acid, gallic acid, catechins, tyrosine and others. Gallic acid is the most
commonly used standard because it is inexpensive, soluble in water and stable
in dry form [36]. The Folin-Ciocalteu assay is reproducible and reliable, which
makes it an ideal method to standardize nutraceutical products in the muscadine
industry.
DETERMINATION OF TOTAL ANTIOXIDANT POWER
There is an increasing interest in antioxidant activity in foods. Antioxidants
play an important biological role in the body in that they defend against reactive
oxygen species (ROS). ROS are harmful byproducts made during cell aerobic
respiration that cause oxidative damage to lipids, proteins and nucleic acids [39,
40]. ROS have been known to play a role in diseases such as coronary artery
disease, diabetes and cancer. Antioxidants are capable of preventing the
formation of radicals, scavenging them, or promoting their decomposition [41].
Therefore antioxidants in the diet may help maintain an adequate antioxidant
23

status to prevent or stop the destructive nature of ROS [39]. Due to the number
of different antioxidants and their chemical diversity, it is difficult to measure
individual antioxidants [39, 41].
There have been several methods developed for the measurement of total
antioxidant capacity such as the oxygen radical absorbance capacity (ORAC),
total radical-trapping antioxidant parameter (TRAP), ferric reducing antioxidant
power (FRAP), 2,2-diphenyl-1-picrlhydrazyl (DPPH), and trolox equivalent
antioxidant capacity (TEAC) [42]. These major antioxidant capacity assays can
be divided into two categories, hydrogen atom transfer (HAT) based assays and
single electron transfer (SET) based assays. [43]. The HAT-based assays
measure an antioxidant’s ability to quench free radicals by hydrogen atoms [42].
This occurs when a peroxyl radical is generated and then a hydrogen atom is
taken from an antioxidant [39]. HAT reactions are usually solvent and pH
dependent, however some are temperature dependent. The SET-based assays
involve a potential antioxidant that transfers one electron to reduce a compound
[42]. While many assays have been developed to test antioxidant capacity, the
ORAC and FRAP methods are two of the most commonly used methods.
The ORAC is a HAT-based assay that measures the antioxidant inhibition of
peroxyl radical induced oxidations. The assay consists of a peroxyl radical that
reacts with a fluorescent probe to form a nonfluorescent product. The antioxidant
capacity is then calculated using the decreased rate and the amount of product
formed over time [42]. A major drawback of this assay is that it is temperature
sensitive and temperature control must be monitored throughout the assay plate.
24

This is important because even small temperature differences can decrease the
reproducibility of the assay. Another drawback is that this assay requires
specialized equipment for fluorescence that may not be available in many
analytical labs [42].
The FRAP is a SET-based assay that uses antioxidants as reductants in a
redox-linked assay. It involves the reduction of a ferric tripyridyltriazine
(Fe3+TPTZ) complex to ferrous tripyridyltriazine (Fe2+) by a reductant at a low pH
[40]. The ferrous form has an intense blue color which can be monitored at 593
nm [40]. The FRAP assay is a nonspecific reaction in that any half reaction with
a lower redox potential than the ferric/ferrous half-reaction will force Fe3+ to Fe2+.
The absorbance then is directly related to the reducing power of the antioxidants.
The FRAP can be used to measure the total antioxidant capacity on a variety of
samples such as biological fluids, aqueous as well as ethanolic extracts of drugs,
food and plants [44].
The FRAP assay was the chosen method for the determination of total
antioxidant capacity for this project. The FRAP assay was chosen because it is
an inexpensive, simple, speedy and reproducible assay that does not require
specialized equipment. Many other tests used today measure the ability of
antioxidants in a sample to inhibit the oxidative effects generated in the reaction
mixture. However many of these methods have a lag phase, which requires
specialized equipment, and are extremely time-consuming. These methods also
may not be as sensitive as the FRAP assay. The FRAP assay does not require
pretreatment of samples or use a lag phase [44]. The FRAP assay can be
25

performed with automated, semi automated, or manual methods and does not
require any specialized equipment [41, 42]. All of these aspects make the FRAP
method ideal for commercialized vineyards to use as a standardization test for
their nutraceutical products. Results have proven that the FRAP values correlate
well with the total phenolic values measured by the Folin-Ciocalteu assay [45].
The FRAP assay is a sensitive, reproducible method for measuring the total
antioxidant capacity.
There were three main objectives of this project that were studied and
analyzed. The first objective was to test the hypothesis that based upon the
known chemistry of the muscadine, muscadine extracts will have significant
aldose reductase inhibition. The second objective was to create a training
manual that could be used to train a non-scientist technician in the muscadine
industry to do muscadine total phenolic and FRAP assays for quality control.
The third objective was to determine if a direct correlation exists between the
phenolic content and antioxidant values in processed muscadine fractions and
products.
26

References
1. Kawanishi, K., H. Ueda, and M. Moriyasu, Aldose reductase inhibitors
from the nature. Curr Med Chem, 2003. 10(15): p. 1353-74.
2. Yabe-Nishimura, C., Aldose reductase in glucose toxicity: a potential
target for the prevention of diabetic complications. Pharmacol Rev, 1998.
50(1): p. 21-33.
3. Bhatnagar, A. and S.K. Srivastava, Aldose reductase: congenial and
injurious profiles of an enigmatic enzyme. Biochem Med Metab Biol, 1992.
48(2): p. 91-121.
4. Kador, P.F., J.H. Kinoshita, and N.E. Sharpless, Aldose reductase
inhibitors: a potential new class of agents for the pharmacological control
of certain diabetic complications. J Med Chem, 1985. 28(7): p. 841-9.
5. Kador, P.F., W.G. Robison, Jr., and J.H. Kinoshita, The pharmacology of
aldose reductase inhibitors. Annu Rev Pharmacol Toxicol, 1985. 25: p.
691-714.
6. van Heyningen, R., Formation of polyols by the lens of the rat with 'sugar'
cataract. Nature, 1959. 468: p. 194-195.
7. Sheetz, M.J. and G.L. King, Molecular understanding of hyperglycemia's
adverse effects for diabetic complications. Jama, 2002. 288(20): p. 2579-
88.
8. El-Kabbani, O., et al., Aldose reductase structures: implications for
mechanism and inhibition. Cell Mol Life Sci, 2004. 61(7-8): p. 750-62.
27

9. Srivastava, S.K., K.V. Ramana, and A. Bhatnagar, Role of aldose
reductase and oxidative damage in diabetes and the consequent potential
for therapeutic options. Endocr Rev, 2005. 26(3): p. 380-92.
10. Huebschmann, A.G., et al., Diabetes and advanced glycoxidation end
products. Diabetes Care, 2006. 29(6): p. 1420-32.
11. Seely, R.R., T.D. Stephens, and P. Tate, Anatomy and Physiology. 6th ed.
2003, Boston: McGraw-Hill.
12. Basics About Diabetes. 2005 [cited; Available from:
http://www.cdc.gov/diabetes.
13. Trevor, A.J., B.G. Katzung, and S.B. Masters, Katzung & Trevor's
Pharmacology Examination & Board Review. 7th ed. 2005, New York:
McGraw Hill. 645.
14. Katzung, B.G., Basic & Clinical Pharmacology. 9th ed. 2004, New York:
McGraw-Hill.
15. Suzen, S. and E. Buyukbingol, Recent studies of aldose reductase
enzyme inhibition for diabetic complications. Curr Med Chem, 2003.
10(15): p. 1329-52.
16. Leslie, R.D. and P. Pozzilli, Diabetic Complications. 2004, London: Martin
Dunitz Taylor & Francis Group. 128.
17. Ueda, H., K. Kawanishi, and M. Moriyasu, Effects of ellagic acid and 2-
(2,3,6-trihydroxy-4-carboxyphenyl)ellagic acid on sorbitol accumulation in
vitro and in vivo. Biol Pharm Bull, 2004. 27(10): p. 1584-7.
28

18. Lee, H.S., Cuminaldehyde: Aldose Reductase and alpha-Glucosidase
Inhibitor Derived from Cuminum cyminum L. Seeds. J Agric Food Chem,
2005. 53(7): p. 2446-50.
19. Dunitz, M., Diabetes Annual 2002. 2002, London: The Livery House.
20. Hartle, D.K., P. Greenspan, and J.L. Hargrove, Muscadine Medicine.
2005, Saint George Island, FL: Lulu Press. 128.
21. Beyer-Mears, A. and E. Cruz, Reversal of diabetic cataract by sorbinil, an
aldose reductase inhibitor. Diabetes, 1985. 34(1): p. 15-21.
22. Beyer-Mears, A., L. Ku, and M.P. Cohen, Glomerular polyol accumulation
in diabetes and its prevention by oral sorbinil. Diabetes, 1984. 33(6): p.
604-7.
23. de la Fuente, J.A. and S. Manzanaro, Aldose reductase inhibitors from
natural sources. Nat Prod Rep, 2003. 20(2): p. 243-51.
24. Varma, S.D. and J.H. Kinoshita, Inhibition of lens aldose reductase by
flavonoids--their possible role in the prevention of diabetic cataracts.
Biochem Pharmacol, 1976. 25(22): p. 2505-13.
25. Chaudhry, P.S., et al., Inhibition of human lens aldose reductase by
flavonoids, sulindac and indomethacin. Biochem Pharmacol, 1983. 32(13):
p. 1995-8.
26. Matsuda, H., et al., Structural requirements of flavonoids and related
compounds for aldose reductase inhibitory activity. Chem Pharm Bull
(Tokyo), 2002. 50(6): p. 788-95.
29

27. Greenspan, P., et al., Antiinflammatory properties of the muscadine grape
(Vitis rotundifolia). J Agric Food Chem, 2005. 53(22): p. 8481-4.
28. Pastrana-Bonilla, E., et al., Phenolic content and antioxidant capacity of
muscadine grapes. J Agric Food Chem, 2003. 51(18): p. 5497-503.
29. Yilmaz, Y. and R.T. Toledo, Major flavonoids in grape seeds and skins:
antioxidant capacity of catechin, epicatechin, and gallic acid. J Agric Food
Chem, 2004. 52(2): p. 255-60.
30. Talcott, S.T. and J.H. Lee, Ellagic acid and flavonoid antioxidant content of
muscadine wine and juice. J Agric Food Chem, 2002. 50(11): p. 3186-92.
31. Yi, W., J. Fischer, and C.C. Akoh, Study of anticancer activities of
muscadine grape phenolics in vitro. J Agric Food Chem, 2005. 53(22): p.
8804-12.
32. Burns, J., et al., Extraction of phenolics and changes in antioxidant activity
of red wines during vinification. J Agric Food Chem, 2001. 49(12): p. 5797-
808.
33. Soobrattee, M.A., et al., Phenolics as potential theraputic agents:
mechanism and actions. Mutation Research, 2005. 579: p. 200-213.
34. Waterhouse, A.L., Wine phenolics. Ann N Y Acad Sci, 2002. 957: p. 21-
36.
35. Lopez-Velez, M., F. Martinez-Martinez, and C. Del Valle-Ribes, The study
of phenolic compounds as natural antioxidants in wine. Critical Review in
Food Sciences and Nutrition, 2003. 43(3): p. 233-244.
30

36. Singleton, V.L., R. Orthofer, and R.M. Lamuela-Reventos, Analysis of total
phenols and other oxidation substrates and antioxidants by means of
Folin-Ciocalteu reagent. Methods in Enzymology, 1999. 299: p. 152-178.
37. Slinkard, K. and V.L. Singleton, Total phenolic analysis: automation and
comparison with manual methods. Am. J. Enol. Vitic., 1977. 28: p. 49-55.
38. Doka, O. and D. Bicanic, Determination of total polyphenolic content in red
wines by means of the combined He-Ne laser optothermal window and
Folin-Ciocalteu colorimetry assay. Anal Chem, 2002. 74(9): p. 2157-61.
39. Ou, B., et al., Analysis of antioxidant activities of common vegetables
employing oxygen radical absorbance capacity (ORAC) and ferric
reducing antioxidant power (FRAP) assays: a comparative study. J Agric
Food Chem, 2002. 50(11): p. 3122-8.
40. Prior, R.L. and G. Cao, In vivo total antioxidant capacity: comparison of
different analytical methods. Free Radic Biol Med, 1999. 27(11-12): p.
1173-81.
41. Vassalle, C., et al., In vivo total antioxidant capacity: comparison of two
different analytical methods. Clin Chem Lab Med, 2004. 42(1): p. 84-9.
42. Prior, R.L., X. Wu, and K. Schaich, Standardized methods for the
determination of antioxidant capacity and phenolics in foods and dietary
supplements. J Agric Food Chem, 2005. 53(10): p. 4290-302.
43. Huang, D., B. Ou, and R.L. Prior, The chemistry behind antioxidant
capacity assays. J Agric Food Chem, 2005. 53(6): p. 1841-56.
31

44. Benzie, I. and J. Strain, The ferric reducing ability of plasma (FRAP) as a
measure of "antioxidant power": the FRAP assay. Anal Biochem, 1996.
239: p. 70-6.
45. Hukkanen, A.T., et al., Antioxidant capacity and phenolic content of sweet
rowanberries. J Agric Food Chem, 2006. 54(1): p. 112-9.
32

CHAPTER 2
INHIBITION OF HUMAN RECOMBINANT ALDOSE REDUCTASE BY
MUSCADINE GRAPE EXTRACTS1
1 Snipes, Lauren, Phillip Greenspan, James L. Hargrove, Diane K. Hartle, to be submitted to the Journal of Agricultural and Food Chemistry
33

Abstract
Muscadines are berries of Vitis rotundifolia, a grape native to SE USA.
Muscadine skins and seeds are sold as nutraceutical products because of their
high antioxidant activity, anti-inflammatory and anti-cancer phytochemical
profiles. Hyperglycemia leads to both induction and activation of aldose
reductase (AR), the initial rate-limiting enzyme of the polyol pathway (conversion
of glucose to sorbitol to fructose). Activation of the polyol pathway contributes to
Advanced Glycation Endproduct (AGE) formation in organs with AR activity
including lens of the eye, kidney, heart, nerves and liver. This pathway is
implicated in diabetic cataract formation and neuropathies. Because the
pharmacognosy of muscadine skins revealed many compounds with anti-AR
activity, we tested the ability of muscadine skin and seed extracts to inhibit
human recombinant AR in vitro. Ethanol was removed from a 1:2 (wt/v) 50%
ethanolic extract of muscadine skins. Water was then removed by freeze-drying.
A dose/response relationship for inhibition of AR was established using various
dilutions of the dried muscadine skin and seed extracts. Complete AR inhibition
for the muscadine skin extracts occurred at 625 and 1250 µg/mL with the IC50 at
approximately 35.3 and 66.9 µg/mL. Complete AR inhibition for the muscadine
seed extract occurred at 625 µg/mL and the IC50 at 105 µg/mL. Conclusion:
Extracts of muscadine skins and seeds showed AR inhibition activity at low
concentrations. Nutraceutical products made from muscadine skins and seeds
may prove useful in inhibiting AGE formation via inhibition of the polyol pathway
as well as by direct inhibition of glycation.
34

2.1 Introduction
Diabetes is a disease that affects over 250 million people worldwide and
occurs when the body does not produce enough insulin or the cells are not able
to take up glucose because of insulin resistance. Chronic hyperglycemia
accelerates aging in many organs. Insulin-insensitive organs such as the lens,
retina, nerves and kidney are particularly vulnerable target organs during chronic
hyperglycermia. Complications include cataracts, retinopathy, neuropathy and
nephropathy. Even with pharmacotherapeutic regimens, chronic hyperglycemia
is difficult to control [1, 2]. In addition a far greater number of people are
classified as pre-diabetic or metabolic syndrome patients. While not overtly
diabetic these conditions also involve hyperglycemia. Therefore, dietary and
drug strategies that can decrease the aging effects of hyperglycemia may be
clinically useful.
One major target for controlling complications of hyperglycemic states is to
decrease the ability of excess glucose to enter the polyol pathway. Aldose
reductase (AR) is the key enzyme in the polyol pathway that catalyzes
conversion of intracellular glucose to sorbitol, which is then oxidized to fructose
by sorbitol dehydrogenase [3] . This net conversion of glucose into fructose
constitutes the polyol pathway of glucose metabolism [4]. Under hyperglycemic
conditions the polyol pathway accelerates the formation of sorbitol in insulin-
insensitive tissues. In many tissues aldose reductase directly competes with
hexokinase for the utilization of glucose [3]. Under normal physiological
conditions most of the cellular glucose is phosphorylated into glucose-6-
35

phosphate by hexokinase and only 3% of glucose enters the polyol pathway.
However, under hyperglycemic conditions, hexokinase is saturated by high levels
of glucose which causes 30% of total glucose to enter the polyol pathway [5, 6].
This causes sorbitol to be formed more rapidly than it is converted to fructose,
resulting in an overflow of polyol pathway products and a rapid depletion of
NADPH [5, 7]. The intracellular accumulation of sorbitol occurs due to its poor
penetration through cellular membranes and slow metabolism by sorbitol
dehydrogenase. The accumulation of sorbitol and its metabolites result in
osmotic swelling, loss of membrane integrity and eventual cataract formation [8,
9]. Furthermore, when the cell converts sorbitol to fructose for disposition, this
leads to formation of Advanced Glycation Endproducts (AGEs). Aldose
reductase inhibition may therefore decrease the rate of diabetic complications in
organs that express aldose reductase.
Studies over the past several years have proved that AR plays a significant
role in the development of the diabetic cataract, retinopathy, neuropathy and
nephropathy. It is now well known that AR is the key enzyme in the polyol
pathway and is responsible for catalyzing the conversion of glucose to sorbitol
[10]. Hyperglycemic conditions lead to hyperosmotic stress in the cell. The
accumulation of sorbitol leads to hydration of the cell, loss of membrane
permeability and leakage of amino acids, glutathione and myoinositol [6]. While
AR has been identified as a principal cause of these complications, an effective,
non-toxic aldose reductase inhibitor (ARI) has not been developed. Many
synthetic ARIs have been developed, however, they have been ineffective or
36

possess toxic effects. Therefore many researchers have now turned toward
generally recognized as safe natural products such as flavonoids for ARIs [11].
Flavonoids are phytochemicals that have been widely studied and proven to
have aldose reductase inhibition [1]. In recent studies, we test the ability of
muscadine grape skin and seed extracts to inhibit aldose reductase. Muscadine
grapes (Vitis rotundifolia) are grown commercially in the SE USA. Muscadines
are a separate species of grapes and are distinguished by 20 pairs of
chromosomes, instead of 19 pairs by Vitis vinifera (wine and table) grapes. The
muscadine contains high levels of flavonoids, flavan-3-ols, flavonols,
anthocyanins, anthocyanidins, oligomeric procyanidins, proanthocyanidins,
ellagic acid and ellagitannins which contribute to its high phenolic and antioxidant
values. This extra genetic information is probably responsible for the unique
spectrum of phytochemicals in muscadines. Many muscadine phytochemicals
are individually known aldose reductase inhibitors, e.g., ellagic acid, kaempferol,
myricetin, myricetin glycosides, quercetin, quercetin glycosides, chlorogenic acid
and epicatechin [12]. These compounds exist in relatively high concentrations.
Muscadine seeds and skins are currently being used for nutraceutical product
manufacturing. The purpose of this study was to test the collective aldose
reductase inhibition activity of extracts of muscadine skins and seeds.
2.2 Materials and Methods
Chemicals and Reagents. DL-glyceraldehyde, lithium sulfate, β-NADPH,
quercetin, Folin-Ciocalteu reagent, gallic acid, sodium carbonate, sodium
acetate, glacial acetic acid, TPTZ (2,4,6-tri[2-pyridyl]-s-triazine), ferric chloride,
37

and ferrous sulfate were purchased from Sigma Chemical Co. (St. Louis, MO).
Human Recombinant aldose reductase (HRAR) was purchased from VWR
International (West Chester, PA).
Preparation of Muscadine Extracts. The muscadine skin extract was a
generous gift of R. Dixon Phillips (University of Georgia) and the muscadine seed
powder was obtained from Muscadine Product Corporation, LLC (Wray, GA).
Extract 1 (Muscadine skin extract with 50% EtOH). Ethanol was removed
from a 1:2 (wt/vol) 50% ethanolic extract of powdered muscadine skins. Water
was then removed by freeze-drying. The dried muscadine skin was then
prepared in a 10% (wt/vol) 50% ethanol extract which was then stirred for 2 h.
The extract was then centrifuged to remove the precipitate.
Extract 2 (Muscadine skin extract with H2O). Ethanol was removed from a 1:2
(wt/vol) 50% ethanolic extract of muscadine skins. Water was then removed by
freeze-drying. A 10% (wt/vol) muscadine skin extract was prepared with the
addition of water. The extract was then stirred for 2 h and then centrifuged to
remove the precipitate.
Extract 3 (Muscadine seed extract with 50% EtOH). A sample of 1g of dried
muscadine seeds was made into a powder using a commercial coffee grinder.
Then a 1:5 dry wt/vol 50% EtOH extract was made and stirred for 2 h. The
extract was then centrifuged to remove the precipitate.
Determination of Total Phenolics. The total phenolic content of the muscadine
extracts were determined using the Folin-Ciocalteu assay described by Slinkard
and Singleton [13], using gallic acid as a reference phenolic standard.
38

Absorbance was measured at 765 nm in a Beckman DU 600 series
spectrophotometer. Results were expressed as milligrams of gallic acid
equivalents per gram of dry weight.
Ferric Reducing Antioxidant Power (FRAP) Assay. FRAP values were
determined using a modified version of the Benzie and Strain method[14], using
purchased ferrous sulfate as the reference standards. Absorption was measured
at 593 nm on a Beckman DU 600 series spectrophotometer. The FRAP assay is
used for the direct testing of antioxidant capacity and is based on the reduction of
a ferric 2,4,6-tripyridyl-s-triazine complex to the ferrous form. The “antioxidant
power” was determined at the absorbance of 593 nm after six minutes of
incubation. The results were then expressed as mmol of ferrous sulfate
formed/gram of dry wt. of grape skin or seed using a standard curve constructed
with known ferrous sulfate. Results were expressed as millimoles of Fe2+
equivalents per gram of dry weight.
Enzyme Inhibitory Assay. Aldose reductase activity was assayed using a
Beckman DU 600 Series spectrophotometer by determining the decrease in the
concentration of NADPH at 340 nm. The reaction mixture contained 0.1 M
sodium phosphate buffer (pH 6.2), 0.4 M lithium sulfate, 0.15 mM β-NADPH, 10
mM DL-glyceraldehyde, and 5 µL of human recombinant aldose reductase
(HRAR) (VWR) in a total volume of 1.0 mL. The reaction was started by addition
of the enzyme, and the initial reaction rate was measured for 5 minutes [15]. The
reference blank contained all of the above except the substrate DL-
glyceraldehyde. The effects of inhibitors were determined by adding them to the
39

reaction mixture. A dose-response curve was then constructed and the
concentration of muscadine fraction necessary for 50% inhibition of HRAR
activity (IC50) was estimated.
2.3 Results
Total Phenolic Content and FRAP Values of Muscadine Skin and Seed
Extracts. The phenolic content of the muscadine extracts is shown in Table 1.
Extracts 1-3 each contained high total phenolic concentrations (58.3, 24.8 and
37.9 mg/g, respectively). This study reveals a strong correlation between FRAP
activity and total phenolics, found in Table 1. Extract 1 had the highest FRAP
value of 26.3 mmol/g as well as the highest phenolic value. Extract 2 had the
lowest FRAP value of 12.7 mmol/g as well as the lowest phenolic value. Extract
3 had a FRAP value of 18.4 mmol/g.
Table 2.1: Phenolic content and FRAP values of the muscadine extracts
Total Phenolic Content (mg/g)
FRAP Value (mmol/g)
IC50 (µg of dry wt/ml)
Extract 1 (Muscadine skin extract w/ 50% EtOH)
58.3 26.3 35.3
Extract 2 (Muscadine skin extract w/ H2O)
24.8 12.7 66.9
Extract 3 (Muscadine seed extract w/ 50% EtOH)
37.9 18.4 105
Inhibitory Activity of Muscadine Skin and Seed Extracts. The inhibitory
activities of muscadine skins and seed extracts were evaluated and compared to
an inhibition produced by purified quercetin, a standard polyphenolic that is a
40

known aldose reductase inhibitor. A dose/response relationship for inhibition of
aldose reductase was established for extracts of both dried muscadine skins and
seeds. Extract 1 proved to be the most potent inhibitor with an IC50 of 35.3 µg/ml
followed by Extract 2 and Extract 3 with IC50 values of 66.9 µg/ml and 105 µg/ml,
respectively, Figures 2.1, 2.2, 2.3. Extract 1 was prepared in 50% EtOH which
for our purposes draws out the most phenolics. This preparation was then
compared to the water extract (Extract 2), while this also was a skin preparation
the water did not yield as many phenolics as the 50% EtOH extract. Lastly we
tested a seed extract (Extract 3) to compare to the skin extracts. While this
showed some inhibition it was not as effective as the skin extracts. Our results
indicate that muscadine skin and seed extracts are effective AR inhibitors at low
food supplement concentrations and can therefore be useful in hyperglycemic
states to inhibit the polyol pathway.
2.4 Discussion
In this study, muscadine grape skin and seed extracts were studied as
sources of aldose reductase inhibition activity. The muscadine has many AR
inhibiting phytochemicals in its seeds and skins, therefore these parts of the
muscadine were chosen to extract and test. While there is some overlap in the
chemical composition of skin and seed fractions, there are also differences in the
species of phenolics within each fraction. The skins have high levels of ellagic
acid, reseveratrol complex and the aglycons of myricetin, quercetin, and
kaempferol. The muscadine seed has high levels of catechins, epicatechin,
41

Inhibition of Aldose Reductase by Quercetin
0
20
40
60
80
100
120
0 20 40 60 80 100
micrograms of dry quercetin/mL of reaction mixture
% A
R In
hibi
tion
QuercetinIC50 = 3.68 µg/mL
Figure 2.1: Inhibition of HRAR by purified quercetin
Inhibition of Aldose Reductase by Muscadine Skin Extracts
0
20
40
60
80
100
120
0 200 400 600 800 1000 1200 1400
micrograms of dry skin/mL of reaction mixture
% A
R In
hibi
tion
Muscadineskinextract50% EtOH
MuscadineskinextractH2O
IC50 = 35.3 µg/mLIC50 = 66.9 µg/mL
Figure 2.2: Inhibition of HRAR by muscadine skin extracts
42

Inhibition of Aldose Reductase by Muscadine Seed Extract
0
20
40
60
80
100
120
0 500 1000 1500 2000 2500 3000
micrograms of dry seed/mL reaction mixture
% A
R In
hibi
tion
Muscadineseedextract50% EtOH
IC50 = 105 µg/mL
Figure 2.3: Inhibition of HRAR by muscadine seed extract
IC50 Concentrations of Muscadine Products on Aldose Reductase
3.89
2.081.66
3.68
00.5
11.5
22.5
33.5
44.5
Quercetin MuscadineSkin H2O
Extract
MuscadineSkin 50%
EtOHExtract
MuscadineSeed 50%
EtOHExtract
IC50
mic
rogr
am p
heno
l/mL
reac
tion
mix
ture
Figure 2.4: IC50 concentrations of extracts according to the total phenolics
43

ellagic acid, gallic acid and oligomeric proanthocyanidins (OPCs) [16].
All of the muscadine extracts showed potent AR inhibition with the
muscadine skin with 50% EtOH (Extract 1) being the most potent inhibitor. The
muscadine skin with H2O extract (Extract 2) was the next most potent inhibitor
followed by the muscadine seed with 50% EtOH extract (Extract 3). The IC50
values of extracts 1, 2, and 3 were 35.3, 66.9, and 105 µg/mL respectively. After
calculating their inhibition according to their total phenolic content the muscadine
extracts proved to be slightly more powerful than quercetin, a known ARI, Figure
2.4.
Our results show that both muscadine grape skins and seeds have potent AR
inhibitory activity. Since both are fractions of a GRAS (Generally Recognized as
Safe) fruit that is without toxicity, the fractions may prove useful for nutraceutical
and functional food/beverage products to help hyperglycemic patients. These
nutraceutical products can then be used to prevent or delay the onset of diabetic
complications. Unlike the history of synthetic ARIs, muscadine nutraceutical
products are effective while being non-toxic to humans and can be easily
obtained all year round.
44

2.5 References
1. Kawanishi, K., H. Ueda, and M. Moriyasu, Aldose reductase inhibitors
from the nature. Curr Med Chem, 2003. 10(15): p. 1353-74.
2. Suzen, S. and E. Buyukbingol, Recent studies of aldose reductase
enzyme inhibition for diabetic complications. Curr Med Chem, 2003.
10(15): p. 1329-52.
3. Kador, P.F., J.H. Kinoshita, and N.E. Sharpless, Aldose reductase
inhibitors: a potential new class of agents for the pharmacological control
of certain diabetic complications. J Med Chem, 1985. 28(7): p. 841-9.
4. Kador, P.F., W.G. Robison, Jr., and J.H. Kinoshita, The pharmacology of
aldose reductase inhibitors. Annu Rev Pharmacol Toxicol, 1985. 25: p.
691-714.
5. Yabe-Nishimura, C., Aldose reductase in glucose toxicity: a potential
target for the prevention of diabetic complications. Pharmacol Rev, 1998.
50(1): p. 21-33.
6. Bhatnagar, A. and S.K. Srivastava, Aldose reductase: congenial and
injurious profiles of an enigmatic enzyme. Biochem Med Metab Biol, 1992.
48(2): p. 91-121.
7. Kinoshita, J.H., et al., Aldose reductase in diabetic complications of the
eye. Metabolism, 1979. 28(4 Suppl 1): p. 462-9.
8. Srivastava, S.K., K.V. Ramana, and A. Bhatnagar, Role of aldose
reductase and oxidative damage in diabetes and the consequent potential
for therapeutic options. Endocr Rev, 2005. 26(3): p. 380-92.
45

9. Tiwari, A.K. and J. Madhusudana Rao, Diabetes mellitus and multiple
therapeutic approaches of phytochemicals: Present status and future
prospects. Curr Sci, 2002. 83(1): p. 30-38.
10. Halder, N., S. Joshi, and S.K. Gupta, Lens aldose reductase inhibiting
potential of some indigenous plants. J Ethnopharmacol, 2003. 86(1): p.
113-6.
11. Chaudhry, P.S., et al., Inhibition of human lens aldose reductase by
flavonoids, sulindac and indomethacin. Biochem Pharmacol, 1983. 32(13):
p. 1995-8.
12. Hartle, D.K., P. Greenspan, and J.L. Hargrove, Muscadine Medicine.
2005, Saint George Island, FL: Lulu Press. 128.
13. Slinkard, K. and V.L. Singleton, Total phenolic analysis: automation and
comparison with manual methods. Am. J. Enol. Vitic., 1977. 28: p. 49-55.
14. Benzie, I. and J. Strain, The ferric reducing ability of plasma (FRAP) as a
measure of "antioxidant power": the FRAP assay. Anal Biochem, 1996.
239: p. 70-6.
15. Nishimura, C., et al., Purification and characterization of the recombinant
human aldose reductase expressed in baculovirus system. Biochim
Biophys Acta, 1991. 1078(2): p. 171-8.
16. Pastrana-Bonilla, E., et al., Phenolic content and antioxidant capacity of
muscadine grapes. J Agric Food Chem, 2003. 51(18): p. 5497-503.
46

CHAPTER 3
TECHNICAL MANUAL FOR ANTIOXIDANT AND TOTAL PHENOL CONTENT
IN QUALITY CONTROL OF NATURAL PRODUCT PROCESSING
Introduction
The purpose of this project was to identify easy and economical assays that
could be used by muscadine processors for onsite quality control of products.
Many commercialized muscadine vineyards have started developing many new
muscadine nutraceutical products. Many commercialized muscadine vineyards
are processing grapes for juice and wine production and the seeds and skins for
nutraceutical products. In developing and running these processing lines, there
is a need for quality control assays to follow total phenolic and antioxidant
capacity to insure a high quality product.
The seeds and skins of the muscadine possess most of the medicinal value
and can be processed into food supplements. The skins and seeds can be dried,
powdered and encapsulated. These products provide the consumer with a much
more phytochemically concentrated product than a whole fruit. As vineyards
produce these nutraceutical supplements from waste pomace, it is important that
these products be monitored for quality control to optimize processing, storage
conditions and shelf life.
47

The criteria for these assays were (1) economical, (2) simple, (3) fast. Two
assays that meet these criteria are the Folin-Ciocalteu Micro Method for Total
Phenolics and the Ferric Reducing Antioxidant Power (FRAP) assay.
The Folin-Ciocalteau phenolic assay is used to determine the total phenolics
of samples such as muscadine skin or seed extract. The FRAP assay is an
effective method to assess the total antioxidant power of a sample. The
nutraceutical grade endproducts need to be standardized to total phenolic
content and need to be high in antioxidant power. Dried muscadine skins, seeds
and pomace powders and extracts of these fractions need to be tested for total
phenolics and antioxidant power during processing and storage. These assays
take relatively little time and are ideal for the multiple sampling necessary from
batch to batch, fraction to fraction and for various dilutions of extracts.
The cost to start up a lab and run these assays is affordable by most
commercial vineyards or product manufacturers. It is especially economical
considering the high cost of commercial analytical laboratory analysis. Also the
cost for necessary chemicals and equipment is relatively low making the
maintenance cost of the lab fairly low. The cost for the equipment and chemicals
needed to start up a lab can range between $2,000-10,000, depending on the
equipment purchased. The spectrophotometer is the main piece of equipment
that is needed and these can be ordered from VWR International from $4,000-
8,000, however even more inexpensive spectrophotometers can be purchased
either new or used in the $1,000-1,500 range. These simple machines may be
fully adequate for small sample volume needs. The equipment needed to start
48

up a lab can be ordered from VWR International (www.vwr.com). Most of the
equipment can be ordered online, however, the customer must fill out some
company identification forms prior to ordering and this may take a couple of days
before being approved. The chemicals for these assays can be ordered from
Sigma-Aldrich (www.sigmaaldrich.com). Again, some forms must be completed
by the company before ordering and this may take a couple of days for them to
be approved.
Total Phenolic Content Assay
The Folin-Ciocalteu Micro Method for Total Phenolics is based on the Slinkard
and Singleton method [1], but the volumes have been scaled down for this
application. The Folin-Ciocalteu method is the most common method used for
measuring total phenolics. The Folin-Ciocalteu method is a colorimetric method
that uses conventional spectrophotometric detection at a wavelength of 765 nm.
The method is based on the oxidation of polyphenolic compounds with
phosphomolybdic and phosphotungstic acids in a basic medium. The oxidation
results in a color change and the resulting color intensity is proportional to the
concentration of polyphenols [2]. The Folin-Ciocalteu method is a reliable and
reproducible method to use for quality control of muscadine nutraceutical
products.
Antioxidant Power Assay
The FRAP method chosen for this manual is a modified version of the
methods by Benzie and Strain [3]. The FRAP assay is used for the direct testing
of antioxidant capacity and is based on the reduction of a ferric 2,4,6-tripyridy-s-
49

triazine complex to the ferrous form. The ferrous form creates an intense blue
color which can be monitored at 593nm. The absorbance then is directly related
to the reducing power of antioxidants [3]. The FRAP assay was the chosen
method for the determination of total antioxidant capacity for this project because
it is an inexpensive, simple, speedy and reproducible assay that does not require
specialized equipment. The FRAP assay can be performed with automated,
semi-automated, or manual methods.
Methods for Total Phenolic Content Assay
The equipment and materials for this assay can be ordered online or by
telephone from VWR International and Sigma-Aldrich. However, ordering online
is very simple and it allows the customer to choose from a variety of products
and gives a detailed description of each item.
Supply Companies
VWR Sigma-Aldrich
VWR International Sigma-Aldrich Co.
1310 Goshen Parkway 3050 Spruce Street
West Chester, PA 19380 St. Louis, MO 63103
www.vwr.com www.sigmaaldrich.com
1-800-932-5000 1-800-521-8956
Equipment and Supplies (suggested supplies, VWR catalog number)
UV/VIS spectrophotometer
Set of plastic cuvettes (appropriate for the spectrophotometer chose)
6 – 100 mL volumetric flasks
50

1 – 10 mL graduated cylinder
1 – 100 mL graduated cylinder
1 – 1000 mL graduated cylinder
1 – 1000 mL beaker or volumetric flask
1 – 2-20 µL pipet (VWR digital pipettors, variable volume, 40000-250)
1– 20-200 µL pipet (VWR digital pipettors, variable volume, 40000-254)
1 – 1000 µL pipet (VWR digital pipettors, variable volume, 40000-256)
Filtering funnel (VWR analytical funnels, 30252-913)
Filter paper (VWR filter paper,18.5cm, 28310-140)
Parafilm (Parafilm M, 52858-000)
Chemicals (Sigma-Aldrich catalog number)
Gallic Acid (G-7384)
Ethanol, molecular biology 190 proof (E7148)
Sodium Carbonate (S1641)
Folin-Ciocalteu reagent, 2N (F9252)
Distilled water
Methods
Gallic Acid Stock Solution
Weigh 0.500 g of gallic acid and measure 10 mL of ethanol, and then dissolve
the 0.500 g of gallic acid in the 10 mL of ethanol. Dilute this solution to 100 mL
with distilled water, using a graduated cylinder. This solution will keep up to two
weeks if refrigerated.
51
Sodium Carbonate (Na2CO3) Solution
Weigh 200 g of Na2CO3 and completely dissolve in 800 mL of distilled water.
Bring this solution to a boil, then let cool and add a few crystals of Na2CO3. Let
this solution sit for 24 hours then filter and dilute to 1L with distilled water. This
solution can also be kept at room temperature to keep it from precipitating out of
solution.
Preparation of Standards (in concentrations of 0, 50, 100, 150, 250, and 500
mg/L)
0 mg/L standard stock solution – distilled water, this will be used as the blank
50 mg/L standard stock solution – measure 1 mL of the gallic acid solution and
put into a 100 mL volumetric flask. Then dilute to volume (100 mL) with distilled
water.
100 mg/L standard stock solution – measure 2 mL of the gallic acid stock
solution and put into a 100 mL volumetric flask. Then dilute to volume with
distilled water.
150 mg/L standard stock solution– measure 3 mL of the gallic acid stock
solution and put into a 100 mL volumetric flask. Then dilute to volume with
distilled water.
250 mg/L standard stock solution– measure 5 mL of the gallic acid stock
solution and put into a 100 mL volumetric flask. Then dilute to volume with
distilled water.
52

500 mg/L standard stock solution– measure 10 mL of the gallic acid stock
solution and put into a 100 mL volumetric flask. Then dilute to volume with
distilled water.
1. After making these solutions, pipet 20 µL of each standard stock solution
into separate cuvettes. Be sure to change pipet tips after transfer of each
solution to avoid contaminating one solution with a more concentrated
solution.
2. Next pipet 1.58 mL of water into each cuvette. This can be done using the
1000 µL pipet by transferring 1000 µL and 580 µL to each cuvette.
3. Next add 100 µL of the Folin-Ciocalteu reagent (Sigma), and mix well.
4. Then wait between 30 sec and 8 min, and then add 300 µL of the sodium
carbonate solution, and cover with a parafilm square and invert to mix.
5. Leave the solutions at 20ºC (68ºF) for 2 hours or 40ºC (104º F) for 30 min
and then determine the absorbance. It is also acceptable to leave the
solutions at room temperature for 2 hours.
6. The absorbance is to be read at 765 nm subtracting the absorbance of the
blank (the 0 mg/L solution). Before reading the absorbances of the
solutions the instrument should be zeroed out by reading the blank first.
Extracts and Dilutions
Extraction methods for muscadine products may vary, however, two simple
extraction procedures for extracting muscadine products involve using 50%
ethanol (EtOH) and distilled water. Previous work has proved that a 1:10 dilution
53

using 50% EtOH is an effective method for extracting dried muscadine products.
Another efficient extraction method is using a 1:10 distilled water dilution to
extract muscadine products. After making these extracts, they should then be
diluted to put into the reaction mixture. Usually a series of dilutions is made to
determine what dilution will fit best on the standard curve. Here are some
experimental ranges for the dilution factors of muscadine products.
Table 3.1: Experimental ranges for dilutions of muscadine products for total
phenolic content assay
Muscadine Products Dilution range for purple muscadine products
Dilution range for white muscadine products
Skins 1/8-1/16 1/4-1/8 Seeds 1/16-1/32 1/32-1/64 Wines 1/8-1/16 0-1/2 Juices 1/2-1/4 0-1/2
Due to the fact that the total phenolic assay is a colorimetric method, the
standard curve cuvettes should appear clear to dark blue. Therefore, one can
visually tell if the sample will land within the range of the standard curve before
reading them in the spectrophotometer. Triplicates should be done for each
sample.
To create the standard curve, plot the absorbance at 765 nm vs.
concentration. This curve will be used to determine the concentrations of the
samples. Microsoft Excel® is an excellent program to use when plotting the
data. After plotting the data, a trend line (linear) should be added. One should
also select “display equation on chart” and “display R-squared value on chart.”
54

The R-squared value is not required, but the closer this value is to 1.0, the more
accurate is your standard curve.
Table 3.2: Example of concentrations and absorbance’s for a standard curve for
the total phenolics assay
X (concentration) Y (absorbance at 765 nm) 0 0
0.001 0.0247 0.002 0.1131 0.003 0.1506 0.005 0.2510 0.010 0.5484 0.015 0.8013
Standard Curve for Total Phenols
y = 54.489x - 0.0104R2 = 0.998
-0.1
0
0.1
0.2
0.3
0.4
0.5
0.6
0.7
0.8
0.9
0 0.002 0.004 0.006 0.008 0.01 0.012 0.014 0.016
Concentration (mg/ 20 microliters)
Abs
orba
nce
at 7
65 n
m
Figure 3.1: Example of a standard curve for total phenolics assay
When testing samples follow steps 1-7, substituting the 20 µL of the gallic acid
solution with your sample. Most samples must to be diluted in order for them to
55

fall in the range of the curve. After obtaining this value, it needs to be multiplied
by the dilution factors in order to determine the amount of total phenols per unit
sample.
Calculations
To determine the total phenolic content in your sample follow steps 1-7 and
get the absorbance of your sample. Then make sure the absorbance of the
sample falls within the range of your standard curve (if not, then the sample
needs to be diluted until the absorbance falls within the range of the curve).
Usually you can see if your sample is within the range of the standard curve.
After doing this take the absorbance of your sample and enter it into the equation
found on your standard curve.
Ex. Equation of standard curve y= 54.489x – 0.0104
Absorbance of sample= 0.1791
Plug in the absorbance for y
0.1791 = 54.489x – 0.0104
Then solve for x
x = 0.0035
If you have to dilute the sample, then multiply x by the dilution factor to get the
total phenolic content of your sample.
Ex. 1/16 dilution factor x = 0.0035 mg of phenol in assay
0.0035 x 1000 µl x 10 mL x 16 =28 mg/g 20 µl 1 mL 1g
mg of phenol in assay x 1000 µL x extract dilution x total dilution = mg/g vol of sample in assay 1 mL of sample
56

The 10 mL/1 g in the above equation represents the dilution of the extract. In this
example a 1:10 dilution was used, however if a different dilution is used the
numbers need to be adjusted accordingly.
If you are testing liquids, then the calculation would be done slightly different, e.g.
Ex. 1/8 dilution factor absorbance of sample = 0.2517
0.2517 = 54.489x – 0.0104 x = 0.0048 mg of phenol in assay
0.0048 x 1000 µl x 8 = 1.92 mg/mL = 1920 mg/L 20 µl 1 mL
mg of phenol in assay x 1000 µL x total dilution of sample = mg of phenol vol of sample in assay 1 mL in assay/g
Methods for FRAP Assay
Equipment and Supplies (suggested supplies, VWR catalog number)
UV/VIS spectrophotometer
Disposable plastic cuvettes (appropriate for the chosen
spectrophotometer)
Water Bath (37ºC)
pH meter
pH standards
50mL beakers (3)
Glass stirring rod
Distilled water
Timer
Eppendorf tubes (1.5mL)
10mL Test tubes (47729-576)
57

25 or 50mL Graduated cylinder
10mL Graduated cylinder
1000mL Volumetric flask
2-20µL pipet (VWR digital pipettors, variable volume, 40000-250)
20-200µL pipet (VWR digital pipettors, variable volume, 40000-254)
100-1000µL pipet (VWR digital pipettors, variable volume, 40000-256)
Chemicals (Sigma-Aldrich catalog number)
Sodium acetate 3H2O (S-2889)
Glacial acetic acid (A6283)
HCl (hydrochloric acid) (920-1)
TPTZ (2,4,6-tri[2-pyridyl]-s-triazine) (T1253)
Ferric chloride (F7134)
Ferrous sulfate (215422)
Methods for Solutions
Acetate Buffer, 300 mM, pH 3.6
The acetate buffer is one of the main ingredients in the FRAP reagent. A 300
mM, pH 3.6 solution of acetate buffer is required for this assay and can be made
up very simply. First 3.1 g of sodium acetate is weighed out and then dissolved
in an adequate amount of distilled water. Next this solution is mixed with 16 mL
of glacial acetic acid and diluted with distilled water to 1 L. After diluting the
solution to 1 L the solution’s pH must be checked. If the solution is not already at
pH 3.6 then a few drops of HCl can be added to make the solution more acidic or
58

a few drops of NaOH (sodium hydroxide) can be added to make it more basic.
After a correct pH is obtained the solution can be stored at 4ºC (39ºF).
Dilute HCl
A 40 mM HCl solution needs to be made so that it can be used to dissolve the
TPTZ. To make this solution take 1.46 mL of concentrated HCL (11 M) and
dilute with distilled water to 1 L. This solution can be stored at room temperature.
The next two solutions need to be made fresh each time a FRAP assay is
run.
TPTZ, 10 mM
To make a 10 mM TPTZ solution, dissolve 0.031 g of TPTZ into 10 mL of 40 mM
HCL. This solution dissolves better in a water bath at 50ºC (122ºF), however if
there are problems dissolving the TPTZ a few drops of concentrated HCl will
help.
Ferric Chloride, 20 mM
To make a 20 mM ferric chloride solution, dissolve 0.054 g of FeCl3 in 10 mL of
distilled water. The FeCl3 dissolves easily in the water and does not need to be
mixed in the water bath.
Preparation of Standards
First a stock 1 mM ferrous sulfate (FeSO47H2O) solution must be prepared. This
is done by weighing out 0.278 g of FeSO47H2O and dissolving it in an adequate
amount of distilled water (less than 1 L). Then this mixture must be diluted up to
equal exactly 1 L using distilled water. Next a series of standards are made
using this final stock ferrous sulfate solution and distilled water.
59

Table 3.3: Preparation of standards in the FRAP assay from a 1 mM stock
solution of FeSO4
Standard Concentration in Assay
(mM)
FeSO47H2O Stock Solution
(mL)
Distilled Water (mL)
0.1 1 9 0.2 2 8 0.4 4 6 0.6 6 4 0.8 8 2 1.0 10 0
After making these solutions 0.2 mL aliquots of each standard can be taken and
stored in eppendorf tubes in the freezer at -20ºC (-4ºF). These standards can be
stored for approximately 2 weeks before they need to be made up again. This
will save time if running tests daily.
FRAP Methods
1. Turn on the water bath and set to 37ºC (99ºF) and set the standards out to
defrost at room temperature.
2. Prepare the FRAP reagent by mixing 25 mL of acetate buffer with 2.5 mL
of the TPTZ solution and 2.5 mL of the FeCl3 solution. This solution
should be kept covered (use aluminum foil around the bottle to block out
light) in an appropriate container and put in the water bath at 37ºC.
3. Set the spectrophotometer to read at 593 nm wavelength.
4. After making the FRAP reagent and letting the standards thaw, set up
three rows, each containing 7 cuvettes. In the first cuvette put 10 µL of
60

distilled water, this will be the blank for each the standards. Then pipet 10
µL of each standard into the other 6 cuvettes. Be sure to change pipet
tips after transfer of each solution. This creates triplicate standard curves.
5. Next put 30 µL of distilled water into each cuvette.
6. Set the timer for 6 minutes and then pipet 300 µL of the FRAP reagent into
each cuvette. After each cuvette has received 300 µL of the FRAP
reagent start the timer.
7. While waiting, the blank should be read and then the 6 other cuvettes can
be put into the spectrophotometer after allowing at least 6 minutes for the
colorimetric reaction to come to completion.
8. At 6 minutes 340 µL of distilled water should be put into each cuvette then
run immediately after. The absorbance of each standard should then be
written down.
9. Repeat steps 4-8 with 3 sets of standards.
10. Then repeat steps 4-8 using the unknown product samples instead of the
standards. Each sample should also be run in triplicate.
Extractions and Dilutions
Extraction methods for muscadine products may vary, however, two simple
extraction procedures for extracting muscadine products involve using 50%
ethanol (EtOH) and distilled water. Previous work has proved that a 1:10 dilution
61

using 50% EtOH is an effective method for extracting dried muscadine products.
Another efficient extraction method is using a 1:10 distilled water dilution to
extract muscadine products. After making these extracts, they should then be
diluted to put into the reaction mixture. Usually a series of dilutions is made to
determine what dilution will fit best on the standard curve. Here are some
experimental ranges for the dilution factors of muscadine products.
Table 3.4: Experimental ranges for dilutions of muscadine products for FRAP
assay
Muscadine Products Dilution for purple muscadine products
Dilution for white muscadine products
Skins 1/32-1/64 1/16-1/32
Seeds 1/64-1/128 1/128-1/256
Wines 1/16-1/32 1/4-1/8
Juices 1/4-1/8 1/2-1/4
Due to the fact that the total phenolic assay is a colorimetric method, the
standard curve cuvettes should appear clear to dark blue. Therefore, one can
visually tell if the sample will land within the range of the standard curve before
reading them in the spectrophotometer. Triplicates should be done for each
sample.
Analysis
To determine the FRAP value of the unknown sample follow steps 1-10 and
find the absorbance of each sample. Then make sure the absorbance of each
sample falls within the absorbance range of the standard curve. If not, the
62

sample needs to be diluted and rerun through steps 1-10 until the final sample
absorbance falls within the range of the curve. After obtaining absorbance
readings take the absorbance of each sample and plug it into the equation found
on the standard curve.
To draw the standard curve, plot the absorbance at 593 nm vs. concentration in
mmol/L. Since all standards and unknown samples are run in triplicate, these
triplicates are averaged. This curve will be used to determine the concentrations
of the samples. Microsoft Excel® is an excellent program to use when plotting
the data. One can also use linear graph paper to draw the standard curve. After
plotting the data, a linear trend line should then be drawn through the best fit of
the points. One should also select “display equation on chart” and “display R-
squared value on chart.” The R-squared value is not required, but the closer this
value is to 1.0, the more accurate the curve will be. The curve should be totally
linear within the range of the standards suggested above.
Table 3.5: Example of concentrations and absorbances for the standard curve of
a FRAP assay
X (concentration mmol/L) Y (absorbance at 593 nm) 0 0
0.1 0.0247 0.2 0.0542 0.4 0.1137 0.6 0.1742 0.8 0.2387 1.0 0.3012
63

Standard Curve for the FRAP Assay
y = 0.3033x - 0.0048R2 = 0.9993
-0.05
0
0.05
0.1
0.15
0.2
0.25
0.3
0.35
0 0.2 0.4 0.6 0.8 1 1.2
Concentration mmol/L
Abs
orba
nce
at 5
93 n
m
Figure 3.2: Example of a standard curve for a FRAP assay
Ex. Equation of standard curve y= 0.3039x - 0.0053
Absorbance of unknown sample= 0.1971
Since the absorbance for y is 0.1971, the equation to be solved to get the
unknown concentration of x is:
0.1971 = 0.3039x – 0.0053
Then solve for x
x = 0.67
If the concentration of the unknown sample is 0.67 mmol in assay one
must multiply by dilution factors to get the concentration in initial product.
If the initial product was extracted from a dry product, the extraction
64

dilution factor must also be used to multiply back to original concentration
in dry product,
Ex. 1/32 dilution factor, and x = 0.67
0.67 x 32 x 0.34 = 7.29 mmol/g
The 0.34 is calculated based on the dilution of the extract, again this is based on
a 1:10 dilution and the fact that the total volume of the cuvette was diluted 1:2.
For a liquid sample (like a juice or wine requiring no extraction factor) the
calculation would be done in the following way.
Ex. 1/32 dilution factor x = 0.67
0.67 x 32 = 10.72 mmol/L 2
65

References
1. Slinkard, K. and V.L. Singleton, Total phenolic analysis: automation and
comparison with manual methods. Am. J. Enol. Vitic., 1977. 28: p. 49-55.
2. Doka, O. and D. Bicanic, Determination of total polyphenolic content in red
wines by means of the combined He-Ne laser optothermal window and
Folin-Ciocalteu colorimetry assay. Anal Chem, 2002. 74(9): p. 2157-61.
3. Benzie, I. and J. Strain, The ferric reducing ability of plasma (FRAP) as a
measure of "antioxidant power": the FRAP assay. Anal Biochem, 1996.
239: p. 70-6.
66

CHAPTER 4
CORRELATION OF TOTAL PHENOLIC CONTENT AND ANTIOXIDANT
POTENTIAL IN MUSCADINE PRODUCTS AND SPECIALTY
VINEGARS 2
2 Snipes, Lauren, Phillip Greenspan, James L. Hargrove, Diane K. Hartle, to be submitted to the Journal of Agricultural and Food Chemistry
67

Abstract
The muscadine grape (Vitis rotundifolia) is a berry enriched with
phytochemicals that are capable of fighting diseases such as diabetes, cancer,
arthritis and heart disease. Due to this knowledge muscadine skins and seeds
are sold as nutraceutical supplements. The muscadine skins and seeds have
high levels of anthocyanins, flavanols, flavonols, and ellagic acid. Thus it is
important to be able to measure these phytochemicals in the muscadine for
quality control in the muscadine industry. Due to the high phenolic content and
antioxidant capacity of the muscadine we used the Folin-Ciocalteu assay and the
ferric reducing antioxidant power (FRAP) assay to determine the levels of
phytochemicals in the muscadine. The muscadine seeds proved to have the
highest total phenolic content and FRAP values ranging from 44.3-74.4 mg/g and
27.4-41.4 mmol/g respectively. The skins which are rich in anthocyanins and
ellagic acid also proved to have relatively high total phenolic and antioxidant
values. The skins total phenolic content ranged from 11.2-28.8 mg/g and the
FRAP values ranged from 6.9-12.8 mmol/g. Various muscadine and commercial
juices, wines and vinegars were also tested for their total phenolic content and
antioxidant capacity. We also wanted to prove that there was a significant
correlation between these two assays that could be used in quality control. The
FRAP value had a positive correlation with the total phenolic contents for all the
muscadine products. Therefore one could potentially determine the FRAP value
of a product based on its total phenolic content.
68

4.1 Introduction
The muscadine contains many powerful phytochemicals that are capable of
fighting diseases such as diabetes, cancer, heart disease and arthritis. The
muscadine contains high levels of anthocyanins, flavanols, flavonols and ellagic
acid [1]. The most abundant of the flavonoids in the muscadine are the
anthocyanins. The polyphenolics, anthocyanins, flavonols and phenolic acids
are the greatest contributors to the total antioxidant capacity [2]. The muscadine
skin and seed contain most of the phytochemicals that are important to the
muscadine [1, 3]. The chemical constituents observed in the skin and seed are
very different. Ellagic acid is the most abundant phenolic found in the skins
followed by myricetin, quercetin, kaempferol and trans-resveratrol [4, 5]. The
phenolics found in the seed are epicatechin, catechin and gallic acid, with
epicatechin being the most plentiful phenolic. Research shows that muscadine
seeds have a higher antioxidant capacity than other parts of the fruit, which is
due to the high levels of epicatechin and catechins found in the seeds [4]. As the
antioxidant properties of the muscadine are being discovered many commercial
vineyards have taken interest in developing muscadine food supplementation
and nutraceutical products. Dried, powdered muscadine skin, seed and pomace
can be encapsulated and taken as a food supplement. Since most of the
antioxidants are found in the skins and seeds these capsules would have a high
nutraceutical value. These products would be beneficial in that they have a long
shelf life and they are highly concentrated in phytochemicals. The muscadine
extracts that are being processed today are made to extract the highly
69

concentrated antioxidants of the seed. This product can then be encapsulated
and sold as a nutraceutical product. However these capsules need to be
standardized so that the consumer is assured the quality of the product. A good
way to standardize these products would be to test them for their total phenolic
and antioxidant contents. This would require two simple, inexpensive assays,
the Folin-Ciocalteu total phenolic assay and the ferric reducing antioxidant power
(FRAP) assay. However, many commercialized vineyards which are producing
these products do not have a standardization method [1].
The ferric reducing antioxidant power (FRAP) assay and the Folin-Ciocalteu
total phenolics assay are two single electron transfer (SET) based assays that
are used to measure the total phenolics and the total antioxidant capacity,
respectively. The Folin-Ciocalteu assay is a commonly accepted and validated
method for measuring the total phenolics of a sample. This assay has proven to
be accurate and reproducible and has a basic standardized method [6].
However, there are several methods that are used to determine the total
antioxidant capacity of a sample.
The FRAP assay and the oxygen radical absorbance capacity (ORAC) assay
are two of the more common assays used to determine the total antioxidant
capacity. The FRAP assay is one of the more commonly used methods for
measuring total antioxidant capacity and has proven in previous studies to have
a strong correlation with the total phenolics in fruit and vegetable samples [7].
However, the ORAC became known as the industry standard, but it has its
limitations. The ORAC assay is a hydrogen atom transfer (HAT) based reaction
70

that is composed of a synthetic free radical generator, an oxidizable molecular
probe, and an antioxidant [6]. The ORAC assay uses a fluorescent probe and
the changes in its intensity to determine free radical damage [8]. One of the
problems of the ORAC assay is the high equipment expense and the lengthy
preparation and assay time. Fluorescent markers that are required for this assay
are expensive and not available in many analytical laboratories [9]. A second
problem of the ORAC is that it only tests one species of free radicals, the oxygen
free radicals. There are many other free radicals that cause damage such as
nitrogen free radicals and sulfur free radicals. Temperature also plays a critical
role in the new ORAC assay. The polypropylene plate has poor thermal
conductivity which can cause temperature differences in the external well of the
microplate and result in decreased reproducibility of the assay [8, 9].
The FRAP is a single electron transfer (SET) based assay that uses
antioxidants as reductants in a redox-linked assay. The FRAP assay measures
the ability of a compound to reduce Fe3+ to Fe2+. Fe2+ is a pro-oxidant that can
react with H2O2 to produce OH•, a harmful free radical. The theory of the FRAP
assay is that antioxidants such as ascorbic acid and uric acid reduce both
reactive species and Fe3+, so their ability to reduce Fe3+ will reflect their ability to
reduce reactive species [10, 11]. The FRAP assay involves the reduction of a
ferric tripyridyltriazine (Fe3+TPTZ) complex to ferrous tripyridyltriazine (Fe2+) by a
reductant at a low pH [10]. The ferrous form has an intense blue color which can
be monitored at 593 nm [10, 12]. The FRAP assay is a nonspecific reaction in
that any half reaction with a lower redox potential than the ferric/ferrous half-
71

reaction will force Fe3+ to Fe2+. The absorbance is then directly related to the
reducing power of the antioxidants. The FRAP assay can be used to measure
the total antioxidant capacity on a variety of samples such as biological fluids,
aqueous as well as ethanolic extracts of drugs, food, and plants [13]. The FRAP
assay was chosen to determine the total antioxidant capacity because it is an
inexpensive, simple, speedy and reproducible assay that does not require
specialized equipment. Also research has been done that proves there is a
correlation between the FRAP and ORAC assays that is extrapolatable to the
phenolic fractions [14]. Therefore by using the Folin-Ciocalteu assay to
determine the total phenolic content and the FRAP assay to determine the total
antioxidant capacity it is possible to estimate the ORAC values from these
results.
In the present study, the FRAP and total phenolic values were determined for
various muscadine seeds, skins, wines and juices. Both assays were chosen
because of utility in muscadine fractions, simplicity of the assays, and economy
of the assays for small scale field processors. The hypothesis was to prove a
positive correlation between the total phenolic content and FRAP assays in
muscadine products and demonstrate a quality control mechanism transferable
to processing plants at muscadine vineyards.
72

4.2 Materials and Methods
Chemicals and Reagents
Ferrous sulfate, 2,4,6-tri[2-pyridyl]-s-triazine (TPTZ), ferric chloride, sodium
acetate, glacial acetic acid, Folin-Ciocalteu reagent, gallic acid, and sodium
carbonate were purchased from Sigma Chemical Co. (St. Louis, Mo)
Sample Preparation
Muscadine Seed Extracts
The muscadine seeds were handpicked out of fresh Noble and Carlos
muscadine grapes of two different varieties of commercial muscadine grapes.
The muscadine seed products were from Duplin Winery (Rose Hill, NC) and
Muscadine Products Corporation (Wray, GA). The seeds were then made into
powder using a commercial coffee grinder. A 1:10 dry wt/vol 50% EtOH extract
was made and stirred for 2 h. The extract was then centrifuged to remove the
precipitate.
Muscadine Seed Product Extracts
The muscadine seed products were obtained from Muscadine Products
Corporation (Wray, GA), Duplin Winery (Rose Hill, NC), and Post Familie Winery
(Altus, AR). A 1:10 dry wt/vol 50% EtOH extract was made and stirred for 2 h.
The extract was then centrifuged to remove the precipitate.
Muscadine Skin Extracts
The muscadine skins peeled from fresh Noble and Carlos muscadine grapes.
The skins were crushed into a powder using a mortar and pestle. A 1:10 dry
73

wt/vol 50% EtOH extract was then made using the skin powder and stirred for 2h.
The extract was then centrifuged to remove the precipitate.
Determination of Total Phenolics. The total phenolic content of the muscadine
extracts was determined using the Folin-Ciocalteu assay described by Slinkard
and Singleton [15], using gallic acid as a reference phenolic standard.
Absorbance was measured at 765 nm in a Beckman DU 600 series
spectrophotometer. Results were expressed as milligrams of gallic acid
equivalents per gram of dry weight.
Ferric Reducing Antioxidant Power (FRAP) Assay. FRAP values were
determined using a modified version of the Benzie and Strain method [13], using
purchased ferrous sulfate as the reference standard. Absorbance was measured
at 593 nm on a Beckman DU 600 series spectrophotometer. The FRAP assay is
used for the direct testing of antioxidant capacity and is based on the reduction of
a ferric 2,4,6-tripyridyl-s-triazine complex to the ferrous form. The “antioxidant
power” was determined at the absorbance of 593 nm after six minutes of
incubation. The results were then expressed as mmol of ferrous sulfate
formed/gram of dry wt. of grape skin or seed using a standard curve constructed
with known ferrous sulfate. Results were expressed as millimoles of Fe2+
equivalents per gram of dry weight.
4.3 Results
Various muscadine seeds were analyzed for total phenolics and antioxidant
capacity [4]. Figures 4.1 represents the total phenolic values and FRAP values
of individual muscadine seed samples that were handpicked out of fresh Noble
74

Total Phenolics and FRAP Values of Noble and Carlos Muscadine Seeds
8074.4
67.269.87 66.970
66.13
60.859.258.13 60 57.0752.8
49.075044.27
37.29 41.35 41.3 38.8439.054034.57
32.0731.6 30.1427.92 27.4228.64 30
20
10
02 3 4 5 6 7 8 9 10 11 121
FRAP Values (mmol/g) Total Phenolics (GAE mg/g)
Figure 4.1: Total phenolic content and FRAP values of Noble and Carlos
muscadine seed samples
75

(red) and Carlos (white) muscadine grapes of two different varieties of
commercial importance to wine juice and nutraceutical product processors. The
phenolic value of the seeds ranged from 44.3-74.4 mg/g with a mean of 60.5 ±
8.9 mg/g. The seeds of the Carlos muscadine grapes tended to have a higher
phenolic value than those of the Noble muscadine grapes. The Carlos
muscadine grape seeds had a mean phenolic value of 66.4 ± 5.2 mg/g, while the
Noble muscadine grape seeds had a mean phenolic value of 52.3 ± 5.7 mg/g.
The FRAP values also followed this trend in that the Carlos muscadine grape
seeds had higher FRAP values than the Noble muscadine grape seeds. The
Carlos muscadine grape seeds had a mean FRAP value of 37.1 ± 4.9 mmol/g
and the Noble muscadine grape seeds had a mean FRAP value of 30.1 ± 1.8
mmol/g. The total FRAP value of the muscadine seeds had a mean of 34.2 ± 5.2
mmol/g.
Figure 4.2 represents various dried powdered muscadine seed and seed
capsules from various vineyards. There were three different samples of freeze
dried seeds which all had high phenolic and FRAP values. The freeze-dried
seeds had a mean phenolic value of 54.2 ± 4.8 mg/g and a mean FRAP value of
25.5 ± 0.1 mmol/g. There were also five different kinds of muscadine grape seed
capsules, however their values had a wide range. Grape seed capsule 2 had the
highest phenolic and FRAP value of 78.4 mg/g and 41.1 mmol/g respectively.
Grape seed capsule 1 had the lowest phenolic and FRAP values of 29.1 mg/g
and 13.7 mmol/g. There were also several samples of dried powdered seed that
were obtained from vineyards in the Southeast, however their phenolic and
76

Total Phenolic and FRAP Values of Muscadine Seed Products
90
78.480
70
61.660.859.760
51.651.250
41.11 40.439.240 35.6
33.0730.8 29.0725.67 27.9130
25.4825.39 21.76
18.7120 15.17 13.7114.71 13.6713.4 11.886.7
10
01 2 3 4 5 6 7 8 9 10 11 12 13
FRAP Values (mmol/g) Total Phenolics (GAE mg/g)
Figure 4.2: Total phenolic content and FRAP values of muscadine seed
products
77

Table 4.1: Sources for Figure 4.2, total phenolic content and FRAP values of
muscadine seed products
Muscadine Seed Products
FRAP Values (mmol/g) Phenolic Content (mg/g)
1- Freeze Dried Carlos Seeds, Duplin Winery
25.4 51.2
2- Freeze Dried Carlos Seeds, Duplin Winery
25.7 59.7
3- Air Dried Carlos Seeds, Duplin Winery
6.7 13.4
4- Freeze Dried Carlos Seeds, Duplin Winery
25.5 51.6
5- Seed Powder dried at 120ºF, Muscadine Products Corporation
14.7 35.6
6- Seed Powder dried at 100ºF, Muscadine Products Corporation
11.9 30.8
7- Wet Carlos Seed, Duplin Winery
15.2 33.1
8- Seed Powder, Muscadine Products Corporation
18.7 39.2
9- Grape seed capsule, Nature’s Pearl, Inc
13.7 29.1
10-Grape seed capsule, Post Familie
41.1 78.4
11-Grape seed capsule, Nutra-Grape
27.9 60.8
12- Grape seed capsule, Duplin Winery
21.8 61.6
13- Grape seed capsule, Muscadine Products Corporation
13.7 40.4
78

Correlation of Total Phenolic Content with Antioxidant (FRAP) Values of Muscadine Seeds
90
80
R2 = 0.8103
Tota
l Phe
nolic
s (G
AE
mg/
g) 70
60
50
40
30
20
10
0 0 5 10 15 20 25 30 35 40 45
FRAP Values (mmol/g)
Figure 4.3: Correlation between the total phenolic content and antioxidant
(FRAP) values of the total muscadine seed data
79

FRAP values were not as high as the freeze dried seeds. The phenolic value of
the powdered seeds was 35.2 ± 4.2 mg/g, while the FRAP value was 15.1 ± 3.4
mmol/g. The muscadine seed products with the highest phenolic and FRAP
values were grape seed capsules 2, 3, and 4, however the freeze dried seeds
also had a high phenolic and FRAP content.
We hypothesized that the total phenolic content of muscadine fractions would
correlate positively with the FRAP values. To test this hypothesis, all of the
phenolic muscadine seed data obtained over a period of months was plotted
against the muscadine seed FRAP data as shown in Figure 4.3. There was a
significant correlation between the muscadine seed phenolic data and the
muscadine seed FRAP data. The phenol versus FRAP graph had an R2-value of
0.8103 which proved the correlation between the two assays.
The data in Figure 4.4 represents the data from muscadine grape seed skins
which have been peeled off of individual muscadine grapes as well as a sample
of dried powdered muscadine grape skin. The grape skin data was quite
different from the seed data in that the Noble muscadine skins had the higher
phenol and FRAP values than the Carlos muscadine skins. The mean phenolic
value for the muscadine red skins was 25.7 ± 3.4 mg/g, and the mean phenolic
value for the muscadine Carlos skins was 13.6 ± 1.4 mg/g. There was not as
much of a difference between the FRAP values of the Noble and Carlos
muscadine skins as there was in the seeds, yet there was a slightly higher value
for the Noble skins than the Carlos skins. The Noble muscadine skins had a
FRAP mean of 12.0 ± 1.1 mmol/g, and the Carlos muscadine grape skins had a
80

Total Phenolic and FRAP Values of Muscadine Skins
35
30 28.8 28.53
25.3325.0725
21.8720.53
20
15.614 13.614.415 13.7
12.812.7812.8312.6911.210.94 10.69
9.18 9.08108.257.97.76 7.48 7.026.91
5
02 12 3 4 5 6 7 8 9 10 11 131
FRAP Values (mmol/g) Total Phenolics (mg/g)
Figure 4.4: Total phenolic content and FRAP values for muscadine grape skin
samples
81

Correlation of Total Phenolic Content with Antioxidant (FRAP) Values of Muscadine Skins
35
30
Tota
l Phe
nolic
s (G
AE
mg/
g)
R2 = 0.719
25
20
15
10
5
0
Figure 4.5: Correlation between the total phenolic content and antioxidant
(FRAP) values of the muscadine skin samples
0 2 4 6 8 10 12 14
FRAP Values (mmol/g)
82

mean FRAP value of 8.0 ± 0.9 mmol/g. The dried powdered muscadine skin
sample had a phenolic value of 21.9 mg/g and a FRAP value of 7.8 mmol/g.
There was also a relationship between the total phenolic values of the skins and
the FRAP values of the skins as seen in Figure 4.5. This correlation was not as
strong as with the seeds, but it still had a good correlation with a R2-value of
0.719.
Muscadine wines and juices were also tested in this project for their total
phenolic content and FRAP values. Commercial Concord and Niagara grape
juices were tested to compare to the muscadine juices, Figure 4.6. The
commercial grape juices had higher phenolic and FRAP values, but the
muscadine juices had acceptable values as well. The higher phenolic and FRAP
values of the commercial grape juices is most likely due to the addition of vitamin
C in these varieties. The commercial red grape juices had total phenolics of
2120 and 1380 mg/L with FRAP values of 11.2 and 7.6 mmol/L, respectively.
The muscadine red grape juices had total phenolics of 1000 and 430 mg/L with
FRAP values of 6.9 and 5.3 mmol/L. The commercial white grape juices also
had higher phenolic and FRAP values than the muscadine white juices. Despite
the lower values of the muscadine grape juice, the muscadine red wine had high
levels of phenols and antioxidants. The muscadine red wine has levels of
phenolics in the range of 1320-1140 mg/L with FRAP values in the range of 11.7-
8.0 mmol/L. The white muscadine wines did not have high phenolic or FRAP
values. There was also a relationship of phenolic content to antioxidant capacity
83

Total Phenolic and FRAP Values for Grape Juices
1211.2
10
7.68
6.9
5.76
5.3
3.94
2.42.12
21.38
1 0.887 0.90.54 0.3330.43 0.233
01 2 3 4 5 6 7 8
FRAP Values (mmol/L) Total Phenolic Content (mg/L)
Figure 4.6: Total phenolic content and FRAP values of various grape juices
Table 4.2: Total phenolic and FRAP values of various grape juices
Grape Juice FRAP Value (mmol/L) Phenolic Content (mg/L) Welch’s Purple Grape Juice
11.2 2120
Sam’s Purple Grape Juice
7.6 1380
Muscadine Red Grape Juice, Muscadine Products Corporation
6.9 1000
Welch’s White Grape Juice
5.7 887
Muscadine Red Grape Juice, Nature’s Pearl, Inc
5.3 430
Sam’s White Grape Juice 3.9 540 Muscadine White Grape Juice, Nature’s Pearl Inc
2.4 333
Muscadine White Grape Juice, Muscadine Products Corporation
0.9 233
84

Correlation of Total Phenolic Content and FRAP Values of Juices
y = 0.1881x - 0.1667R2 = 0.9013
0
0.5
1
1.5
2
2.5
0 2 4 6 8 10
FRAP Values (mmol/L)
Tota
l Phe
nolic
s (G
AE
mg/
L)
12
Figure 4.7: Correlation between the total phenolic content and antioxidant
(FRAP) values of various grape juices
85
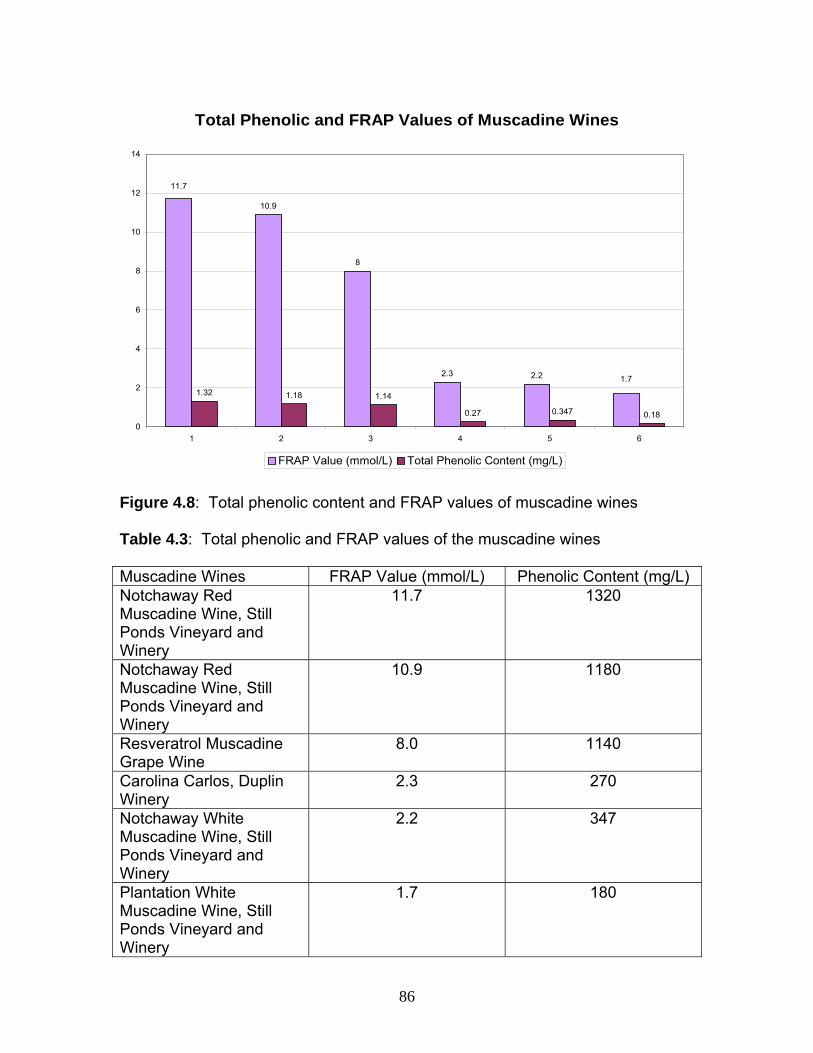
Total Phenolic and FRAP Values of Muscadine Wines
10.9
8
2.3 2.2
1.32 1.18 1.14
0.27 0.347 0.18
1.7
11.7
0
2
4
6
8
10
12
14
1 2 3 4 5 6
FRAP Value (mmol/L) Total Phenolic Content (mg/L)
Figure 4.8: Total phenolic content and FRAP values of muscadine wines
Table 4.3: Total phenolic and FRAP values of the muscadine wines
Muscadine Wines FRAP Value (mmol/L) Phenolic Content (mg/L) Notchaway Red Muscadine Wine, Still Ponds Vineyard and Winery
11.7 1320
Notchaway Red Muscadine Wine, Still Ponds Vineyard and Winery
10.9 1180
Resveratrol Muscadine Grape Wine
8.0 1140
Carolina Carlos, Duplin Winery
2.3 270
Notchaway White Muscadine Wine, Still Ponds Vineyard and Winery
2.2 347
Plantation White Muscadine Wine, Still Ponds Vineyard and Winery
1.7 180
86

Correlation of Total Phenolic Content and FRAP Values of Muscadine Wines
y = 0.1112x + 0.0573R2 = 0.9601
0
0.2
0.4
0.6
0.8
1
1.2
1.4
1.6
0 2 4 6 8 10 12
FRAP Values (mmol/L)
Tota
l Phe
nolic
s (G
AE
mg/
L)
14
Figure 4.9: Correlation between the total phenolic content and antioxidant
(FRAP) values of muscadine wines
87

among the juices and wines, Figure 4.7. The correlation between the total
phenolic and FRAP values of the juices proved to be stronger than that of the
skins and the seeds with and R2-value of 0.9013. The correlation between the
phenolic content and FRAP values of the muscadine wines was more significant
having an R2-value of 0.9601.
The final samples that were tested in this project were a variety of vinegars.
There was a wide variety of vinegars tested ranging from various wine vinegars
to the commonly used distilled white vinegars. The balsamic vinegars had the
highest overall phenolic and antioxidant content as seen in Figure 4.10. The
balsamic vinegars had total phenolic values ranging from 860- 2590 mg/L and
FRAP values ranging from 4.1-12.0 mmol/L, Table 4.4. The two muscadine red
wine vinegars also had high phenolic values of 1250 and 993 mg/L and FRAP
values of 10.1 and 5.1 mmol/L. As in other products, the muscadine white wine
vinegars had much lower phenolic and antioxidant contents than the muscadine
red wine vinegars. The persimmon, sherry, red wine and blueberry vinegars had
respectable phenolic and FRAP values, but they were not as potent as the
balsamic and muscadine red wine vinegars. The malt vinegar had a high
phenolic content of 847 mg/L, but a lower FRAP value of 1.7 mmol/L. The
distilled white vinegars were the only vinegars to show no phenolic or antioxidant
content. There was a noticeable relationship between the phenolic and
antioxidant values of the vinegars, Figure 4.11. This set of data had the a high
correlation between the total phenolics and antioxidant values having a R2-value
of 0.8994.
88

Phenolic and FRAP Values of Specialty Vinegars 14
12
10
8
6
4
2
01 2 3 4 5 6 7 8 9 10 11 12 13 14 15 16 17 18 19 20 21
FRAP Values (mmol/L) Total Phenolics (GAE mg/ml)
Figure 4.10: Total phenolic content and FRAP values of specialty vinegars
89

Table 4.4: Sources for Figure 4.10, total phenolic and FRAP values of the
vinegars
Vinegars FRAP Value (mmol/L) Phenolic Content (mg/L) 1- Balsamic Vinegar, Bella Famiglia
12.0 2590
2- Monan Federzon Balsamic Vinegar of Modena
11.9 2550
3- Noble Muscadine Wine Vinegar (stock), Casa Perdido
10.1 1250
4- Noble Muscadine Wine Vinegar, Casa Perdido
5.1 993
5- Red Wine Vinegar, Bellino 4.8 791 6- White Balsamic Vinegar, Bella Famiglia
4.5 860
7- Balsamic Vinegar of Modena, Newman’s Own
4.1 1120
8- Persimmon Vinegar 3.4 460 9- Sherry Vinegar, Columela 2.8 547 10- Blueberry Wine Vinegar, Casa Perdido
2.1 547
11- Apple Wine Vinegar, Casa Perdido
1.8 363
12- Malt Vinegar, Casa Perdido
1.7 847
13- White Muscadine Wine Vinegar, Casa Perdido
0.9 172
14- Magnolia Muscadine Wine Vinegar, Casa Perdido
0.8 160
15- Apple Cider Vinegar, Harris Teeter
0.7 222
16- Cucumber Wine Vinegar, Casa Perdido
0.5 350
17- Garlic Wine Vinegar, Progresso
0.4 142
18- Lemon Vinegar 0.3 75 19- Distilled White Vinegar, Avondale
0 0
20- Organic Distilled White Vinegar, Spectrum Naturals
0 0
Organic Rice Vinegar, Marukan
0 110
90

Correlation of Total Phenolic Content with Antioxidant (FRAP) Values of Vinegars
3000
2500
Phen
olic
Con
tent
(GA
E m
g/L)
R2 = 0.8994
2000
1500
1000
500
00 2 4 6 8 10 12 14
FRAP Values (mmol/L)
Figure 4.11: Correlation between the total phenolic content and antioxidant
(FRAP) values of specialty vinegars
91

4.4 Discussion
After analyzing several sets of data for total phenolic and antioxidant content,
the results showed a positive correlation between the two assays in products that
are known to be high in natural phenolics without added ingredients. The
correlation between the total phenolic content and the antioxidant capacity of
fruits and vegetables has also been proven in previous studies. Studies have
also shown a positive correlation between the total phenolic content and ORAC
values [14]. Since many commercial vineyards do not have analytical labs set up
in their corporation, this information could prove valuable to them. A muscadine
vineyard could set up a lab to produce the total phenolic assay, since it is
technically less demanding than the ORAC and FRAP assays. The muscadine
vineyard could then use the values they get for their total phenolic values to
estimate the FRAP and ORAC values. The phenolic values could be produced
for each batch and therefore the FRAP and ORAC values could be predicted for
each batch. The cheaper total phenolic content assay and FRAP assay will allow
producers to obtain batch to batch and lot to lot data. Currently many producers
only have one-time ORAC values from one batch. Setting up a quality control lab
will allow producers to keep current total phenolic and antioxidant capacity data
on hand instead of older data from a previous batch.
The total phenolic content and FRAP assay are two assays that would be
excellent methods for muscadine grape vineyards to use for standardizing their
nutraceutical and food supplementation products. The Folin-Ciocalteu assay and
the FRAP assay would be excellent assays to use for quality control in the
92

muscadine industry. The products produced by the vineyards today need to be
monitored for quality control and these are simple, reproducible methods that
would provide valuable information for the muscadine vineyards. The assays
use inexpensive equipment and chemicals, and can be easily set up and run. It
is also apparent that these are large ranges of total phenolic and antioxidant
potential values within a product sample range. This further supports the need
for producers, manufacturers and consumers to have data concerning lot
numbers of product. Reasons for ranges are a combination of natural influences
on the grape as well as processing and storage conditions. Therefore it is
important to the vineyards to keep current batch to batch records on hand.
93

4.5 References
1. Hartle, D.K., P. Greenspan, and J.L. Hargrove, Muscadine Medicine.
2005, Saint George Island, FL: Lulu Press. 128.
2. Talcott, S.T. and J.H. Lee, Ellagic acid and flavonoid antioxidant content of
muscadine wine and juice. J Agric Food Chem, 2002. 50(11): p. 3186-92.
3. Yi, W., J. Fischer, and C.C. Akoh, Study of anticancer activities of
muscadine grape phenolics in vitro. J Agric Food Chem, 2005. 53(22): p.
8804-12.
4. Pastrana-Bonilla, E., et al., Phenolic content and antioxidant capacity of
muscadine grapes. J Agric Food Chem, 2003. 51(18): p. 5497-503.
5. Greenspan, P., et al., Antiinflammatory properties of the muscadine grape
(Vitis rotundifolia). J Agric Food Chem, 2005. 53(22): p. 8481-4.
6. Huang, D., B. Ou, and R.L. Prior, The chemistry behind antioxidant
capacity assays. J Agric Food Chem, 2005. 53(6): p. 1841-56.
7. Hukkanen, A.T., et al., Antioxidant capacity and phenolic content of sweet
rowanberries. J Agric Food Chem, 2006. 54(1): p. 112-9.
8. Huang, D., et al., High-throughput assay of oxygen radical absorbance
capacity (ORAC) using a multichannel liquid handling system coupled with
a microplate fluorescence reader in 96-well format. J Agric Food Chem,
2002. 50(16): p. 4437-44.
9. Prior, R.L., X. Wu, and K. Schaich, Standardized methods for the
determination of antioxidant capacity and phenolics in foods and dietary
supplements. J Agric Food Chem, 2005. 53(10): p. 4290-302.
94

10. Prior, R.L. and G. Cao, In vivo total antioxidant capacity: comparison of
different analytical methods. Free Radic Biol Med, 1999. 27(11-12): p.
1173-81.
11. Stratil, P., B. Klejdus, and V. Kuban, Determination of total content of
phenolic compounds and their antioxidant activity in vegetables-evaluation
of spectrophotometric methods. Journal of Agricultural and Food
Chemistry, 2006. 54(3): p. 607-616.
12. Argbor, G.A., et al., Antioxidant capacity of some herbs/spices from
Cameroon: a comparative study of two methods. Journal of Agricultural
and Food Chemistry, 2005. 53(17): p. 6819-6824.
13. Benzie, I. and J. Strain, The ferric reducing ability of plasma (FRAP) as a
measure of "antioxidant power": the FRAP assay. Anal Biochem, 1996.
239: p. 70-6.
14. Proteggente, A.R., et al., The antioxidant activity of regularly consumed
fruit and vegetables reflects their phenolic and vitamin C composition.
Free Radic Res, 2002. 36(2): p. 217-33.
15. Slinkard, K. and V.L. Singleton, Total phenolic analysis: automation and
comparison with manual methods. Am. J. Enol. Vitic., 1977. 28: p. 49-55.
95

CHAPTER 5
CONCLUSION
The first contribution to this thesis involved finding that muscadine skin and
seed extracts possess considerable aldose reductase inhibition activity. The
muscadine skin extracts proved to be more potent than quercetin, a bioflavonoid
with known aldose reductase inhibitor activity. The seed extract was almost
equally as effective as quercetin. This is an important new observation due to
the fact that the pharmaceutical industry has not been able to find an effective,
non-toxic aldose reductase inhibitor. The muscadine skins and seeds are non-
toxic and could be used to produce food supplement products to help pre-
diabetics and diabetics prevent the complications of diabetes, assuming
bioavailability is appropriate.
The second contribution made to this thesis was the creation of a training
manual for non-scientist technicians to use in quality control labs in the
muscadine industry. A vineyard can set up a small lab at a low cost and analyze
their products onsite, rather than sending them off to a professional laboratory to
be analyzed at a high cost. Hundreds of samples obtained during handling and
processing can be run for a very low cost. This would create useful marketing
data, and can be obtained at considerable economy. The Folin-Ciocalteu assay
is a simple, reproducible assay for the determination of total phenolics which can
be done by a trained employee. The FRAP assay is a quick, reproducible
96
method for determination of total antioxidant capacity. While the FRAP is a bit
more technically demanding than the total phenolics assay, it is a reliable assay
that can be done by a trained employee.
The third contribution made to this thesis was determining a correlation
between the total phenolic content and the antioxidant capacity of muscadine
products. The phenolic fraction of muscadine skins and seed is of interest for
nutraceutical development. The antioxidant value, measured by the FRAP
assay, correlates positively with total phenolic content. The correlation could be
useful to standardize products based on the phenol and FRAP results. The
vineyards need immediate results during the processing of tons of pomace and
working out extraction procedures. The FRAP and total phenolic assays are
desirable assays for the vineyards to set up, however, the FRAP method is more
labor-consuming than the total phenolic content assay. Due to the nature of the
bulk material and the content of the extracts, the phenol assay results correlate
linearly with the FRAP assay results. Therefore, knowing this relationship for
muscadine products, the vineyard can extrapolate the predictable range of the
FRAP value from the total phenolic content values. While this may not be
appropriate for the analytical laboratory, this may prove to be a suitable “field”
method in the muscadine industry. Samples can then be saved and both total
phenolic content and FRAP assays can be rerun under laboratory conditions
when time permits. The total phenolic assay proves to be the easiest possible
method for the vineyard to use in scaling up processing of muscadine fractions
for nutraceutical product manufacturing.
97