Inhibition of Epithelial to Mesenchymal Transition by E-cadherin Up-regulation via Repression of...
23
Das Chattopadhyay, Gaurisankar Sa and Tanya Shruti Joshi, Abhijit De, Samit Suchismita Mohanty, Kiran Kumar Nakka, Shravanti Mukherjee, Argha Manna, Minakshi Mazumdar, Swatilekha Ghosh, Arghya Adhikary, Samik Chakraborty, role of SMAR1 in breast cancer cells inhibition of E-cadherin degradation: Dual repression of Slug transcription and transition by E-cadherin up-regulation via Inhibition of Epithelial to Mesenchymal Molecular Bases of Disease: published online August 1, 2014 J. Biol. Chem. 10.1074/jbc.M113.527267 Access the most updated version of this article at doi: . JBC Affinity Sites Find articles, minireviews, Reflections and Classics on similar topics on the Alerts: When a correction for this article is posted • When this article is cited • to choose from all of JBC's e-mail alerts Click here http://www.jbc.org/content/early/2014/08/01/jbc.M113.527267.full.html#ref-list-1 This article cites 0 references, 0 of which can be accessed free at at BOSE INSTITUTE LIBRARY on August 4, 2014 http://www.jbc.org/ Downloaded from at BOSE INSTITUTE LIBRARY on August 4, 2014 http://www.jbc.org/ Downloaded from
Transcript of Inhibition of Epithelial to Mesenchymal Transition by E-cadherin Up-regulation via Repression of...
DasChattopadhyay, Gaurisankar Sa and Tanya Shruti Joshi, Abhijit De, SamitSuchismita Mohanty, Kiran Kumar Nakka, Shravanti Mukherjee, Argha Manna,Minakshi Mazumdar, Swatilekha Ghosh, Arghya Adhikary, Samik Chakraborty, role of SMAR1 in breast cancer cellsinhibition of E-cadherin degradation: Dual repression of Slug transcription andtransition by E-cadherin up-regulation via Inhibition of Epithelial to MesenchymalMolecular Bases of Disease:
published online August 1, 2014J. Biol. Chem.
10.1074/jbc.M113.527267Access the most updated version of this article at doi:
.JBC Affinity SitesFind articles, minireviews, Reflections and Classics on similar topics on the
Alerts:
When a correction for this article is posted•
When this article is cited•
to choose from all of JBC's e-mail alertsClick here
http://www.jbc.org/content/early/2014/08/01/jbc.M113.527267.full.html#ref-list-1
This article cites 0 references, 0 of which can be accessed free at
at BO
SE IN
STIT
UT
E L
IBR
AR
Y on A
ugust 4, 2014http://w
ww
.jbc.org/D
ownloaded from
at B
OSE
INST
ITU
TE
LIB
RA
RY
on August 4, 2014
http://ww
w.jbc.org/
Dow
nloaded from

| 1
Inhibition of Epithelial to Mesenchymal transition by E-cadherin up-regulation via repression of Slug transcription and inhibition of E-cadherin degradation: Dual role of SMAR1 in breast cancer cells
Arghya Adhikary1, Samik Chakraborty1, Minakshi Mazumdar1, Swatilekha Ghosh1, Shravanti Mukherjee1, Argha Manna1, Suchismita Mohanty1, Kiran Kumar Nakka2, Shruti Joshi2,Abhijit De3, Samit Chattopadhyay2, Gaurisankar Sa1 and Tanya Das1*
From the 1Division of Molecular Medicine, Bose Institute, P-1/12, Calcutta Improvement Trust Scheme VII M, Kolkata 700 054, India;
2National Centre for Cell Science (NCCS), Pune University Campus, Ganeshkhind, Pune, India.
3Molecular Functional Imaging Laboratory, Tata Memorial Centre, ACTREC, Navi, Mumbai, Maharastra 410210, India.
Running title: SMAR1 up-regulates E-cadherin to inhibit EMT
Keywords: SMAR1, E-cadherin, EMT, MDM2, Slug, Metastasis.
Abbreviations: cDNA, complementary DNA; CsA, cyclosporin A; MDM2, Murine double minute 2; PCR, Polymerase chain reaction; siRNA, short-interfering RNA.
*To whom correspondence should be addressed : Professor Tanya Das, Division of Molecular Medicine, Bose Institute, P-1/12 Calcutta Improvement Trust Scheme VIIM, Kolkata, West Bengal 700 054, India. Tel: +91 (33) 2569-3257; Fax: +91 (33) 2355-3886; E-mail: [email protected]
Background: Epithelial-mesenchymal transition (EMT) is an important program in tumor metastasis.
Results: SMAR1 inhibits EMT by up-regulating E-cadherin in a dual manner via repression of Slug transcription and inhibition of E-cadherin degradation.
Conclusion: SMAR1 functions as a critical protein in regulating EMT.
Significance: This study provides a potential mechanism for the contribution of SMAR1 in inhibiting breast cancer metastasis.
The evolution of the cancer cell into a metastatic entity is the major cause of death in patients with cancer. It has been acknowledged that aberrant activation of a latent embryonic program - known as the epithelial-mesenchymal transition (EMT) - can endow cancer cells with the migratory and invasive capabilities associated with metastatic competence for which E-cadherin switch is a well-established hallmark. Discerning the molecular mechanisms that regulate E-cadherin expression is therefore critical for understanding tumor invasiveness and metastasis. Here we report that
SMAR1 over-expression inhibits EMT and decelerates the migratory potential of breast cancer cells by up-regulating E-cadherin in a bidirectional manner. While SMAR1-dependent transcriptional repression of Slug by direct recruitment of SMAR1/HDAC1 complex to the matrix attachment region site present in the Slug promoter restores E-cadherin expression, SMAR1 also hinders E-cadherin-MDM2 interaction thereby reducing ubiquitination and degradation of E-cadherin protein. Consistently, siRNA knockdown of SMAR1 expression in these breast cancer cells results in a coordinative action of Slug-mediated repression of E-cadherin transcription, as well as degradation of E-cadherin protein through MDM2, upregulating breast cancer cell migration. These results indicate a crucial role for SMAR1 in restraining breast cancer cell migration and suggest the candidature of this scaffold matrix-associated region-binding protein as a tumor suppressor.
Cancer metastasis is considered to be one of the most common causes of treatment failure and death in cancer patients (1). Although metastasis is an
http://www.jbc.org/cgi/doi/10.1074/jbc.M113.527267The latest version is at JBC Papers in Press. Published on August 1, 2014 as Manuscript M113.527267
Copyright 2014 by The American Society for Biochemistry and Molecular Biology, Inc.
at BO
SE IN
STIT
UT
E L
IBR
AR
Y on A
ugust 4, 2014http://w
ww
.jbc.org/D
ownloaded from
SMAR1 up-regulates E-cadherin to inhibit EMT | 2
intricate process involving multiple growth factors and genetic events, increased migratory and invasive capabilities are critical to the initiation of the metastatic process. In order to metastasize, cancer cells must break many major fundamental rules of normal cellular behaviour (2). Epithelial cells, which line body surfaces and cavities, are tightly zipped together and largely immobile. However, these cells, by long-lasting morphological and molecular changes get trans-differentiated towards a mesenchymal type by a process commonly known as epithelial to mesenchymal transition (EMT) (3,4). Although essential for embryonic development, EMT is nevertheless potentially destructive if deregulated. Inappropriate utilization of EMT mechanisms is thus an integral component of the progression of many tumors of epithelial tissues.
An important hallmark of EMT is the loss of expression of the cell to cell adhesion molecule, E-cadherin. E-cadherin is a central component of cell-cell adhesion junctions and is required for the formation of epithelia in the embryo and to maintain epithelial homeostasis in the adult. Loss of E-cadherin is consistently observed at sites of EMT during development and cancer. This loss has been found to increase tumor cell invasiveness in vitro and contributes to the transition of adenoma to carcinoma in animal models (5). E-cadherin is thus a suppressor of invasion and metastasis and its down-regulation provokes the development of malignant epithelial cancers (6-8). Several developmentally important genes that induce EMT have been shown to act as E-cadherin repressors. Slug (also known as SNAI2), a member of the Snail family of transcriptional repressors, is capable of repressing E-cadherin expression and thereby triggering EMT (9-11), suggesting that it may act as an invasion promoter. It has been acknowledged that both SNAIL and its family member SLUG are capable of repressing E-cadherin in epithelial cells via the E-box elements in the proximal E-cadherin promoter (11). However, SLUG expression has been shown to have a much stronger correlation with loss of E-cadherin in breast cancer cell lines rather than SNAIL expression (11), suggesting SLUG to be a likely in vivo repressor of E-cadherin expression in breast carcinoma.
Furthermore, in primary tumor cells from breast cancer patients, it was found that an inverse co-relationship also exists between E-cadherin and
MDM2 (12). MDM2 is a RING finger-containing E3 enzyme involved in eukaryotic protein degradation via the ubiquitin proteasome system. Overexpression of the human homologue of MDM2, referred to as HDM2, occurs in diverse human malignancies (13, 14). Thus, MDM2 expression appears to correlate with an increased risk of distant metastases, which may contribute to an overall poorer prognosis for patients with tumors that overexpress MDM2 (15). E-cadherin acts as a substrate to MDM2 which binds to E-cadherin and degrades it by ubiquitination (12). Thus MDM2 plays a critical role in modulating cell-cell adhesions by a mechanism that involves the down-regulation of E-cadherin via an early endosomal pathway.
Since SMAR1 (Scaffold/Matrix attachment region-binding protein 1) has been documented to play key role in tumor regression (16) and interact with the tumor suppressor p53 and MDM2 independently, the motto of the present study is to investigate the possible role of SMAR1 in regulating the metastatic potential of different breast cancer cell lines and its correlation with the EMT marker, E-cadherin (17). Matrix attachment region (MAR)-binding proteins organize chromatin in loop domain structure thereby partitioning chromatin from actively transcribing regions to poorly transcribing regions (18, 19). This is brought about by their interactions with a plethora of chromatin-modifying proteins that dictate signature histone patterns governing gene transcription. It has been acknowledged that SMAR1 (Scaffold/ Matrix attachment region-binding protein 1) is a tumor suppressor MAR-binding protein that downregulates Cyclin D1 expression by recruiting HDAC1-mSin3A co-repressor complex at Cyclin D1 promoter locus (20). Moreover, SMAR1-derived p44 peptide has been shown to actively inhibit tumor growth in vivo. Further, a significant down-regulation of SMAR1 in higher grades of breast cancer and cancer derived cell lines like MCF-7, HBL-100, ZR 75.3 and ZR 75.1 have also been observed (21). However, although the role of SMAR1 in reducing tumorogenic potential has been documented, its involvement in regulating EMT and metastasis in human cancer cell lines is yet to be elucidated.
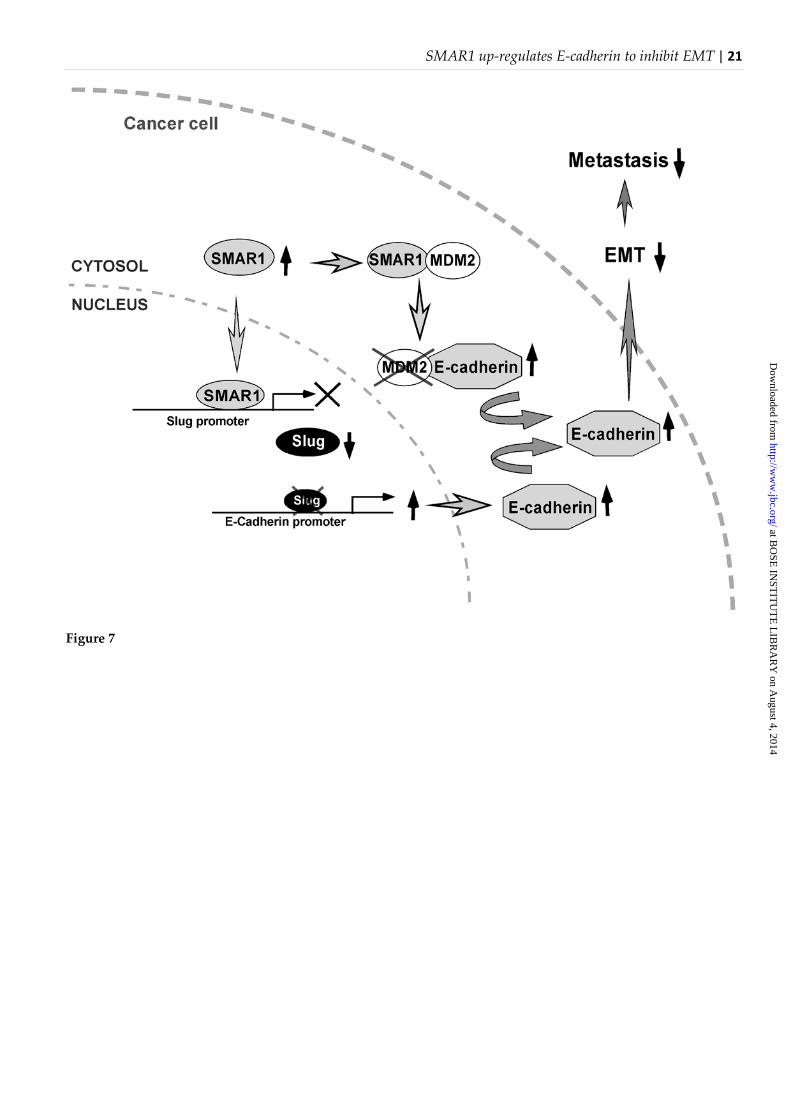
This study elaborates on the dual role of nuclear matrix associated protein, SMAR1, in up-regulating E-cadherin that inhibits EMT. In gist, SMAR1 regulates E-cadherin level in cancer cells by two mechanisms: (i) directly, by blocking the
at BO
SE IN
STIT
UT
E L
IBR
AR
Y on A
ugust 4, 2014http://w
ww
.jbc.org/D
ownloaded from

SMAR1 up-regulates E-cadherin to inhibit EMT | 3
degradation of the E-cadherin protein by rescuing it from the clutch of MDM2, and (ii) indirectly, by repressing the expression of Slug, a known negative regulator of E-cadherin gene expression, thereby diminishing the metastatic potential of cancer cells. We, therefore, establish SMAR1 as a novel negative regulator of epithelial-mesenchymal transition thereby signifying that therapies designed to globally maneuver SMAR1 can be promising for deterring cancer metastasis.
Experimental Procedures:
Cell lines and cell culture- The human mammary carcinoma cell lines (MCF-7, HBL-100, MDAMB-231, MDAMB-468) were obtained from NCCS, Pune. The cells and also SMAR1 stable MCF-7, HBL-100, MDAMB-231, MDAMB-468 B16F1 cells were routinely maintained in complete Dulbecco's modified Eagle's medium or RPMI 1640 mediumcontaining 10% fetal bovine serum, 100 unit/ml penicillin, and 100 μg /ml streptomycin (Invitrogen) at 37 °C in a humidified incubator containing 5%CO2. Cells were allowed to reach confluence before use. Viable cell numbers were determined by Trypan blue exclusion test.
Treatment of cells- Transfected as well as untransfected cells were grown in the cell culture plates and maintained in complete Dulbecco's modified Eagle's medium. After 24 hours, cells were treated with MG132 (10 μM) for 4 h, after which the cells were collected for lysis and protein extraction to perform immunoprecipitation followed by immune-blotting. For induction of EMT by EGF, cells were treated with 50 ng/ml EGF for required duration as mentioned in the Figure Legends. After treatment, cells were used for phase contrast imaging or for immunoblotting.
Wound healing assay- Cell migration was determined by means of unidirectional wound healing assay. Briefly, cells were grown to confluency in 12 well plates after which a sterile blade was used to scratch the monolayer of cells to form a unidirectional wound. Migration was quantitated by a semi-automated, computer-assisted procedure by a person blinded with respect to the experimental treatment. The data from triplicate wells were calculated as the means ± S.E.M., the migration rate of control cells was taken as 100% and healing rate of other plates were compared with control cells. Distance migrated was calculated by ImageJ software where the average distance
migrated by motile cells from each field was calculated and represented as percentage of distance migration. For the same, the data from triplicate wells was calculated as the means ± S.E.M. and the average distance migrated by MCF-7 cells after 24 hours of creating the wound was taken as 100%.
Cycloheximide assay- Cells were grown in cell culture plates and maintained in complete Dulbecco's modified Eagle's medium or RPMI 1640 mediumcontaining 10% fetal bovine serum, 100 unit/ml penicillin, and 100 μg /ml streptomycin (Invitrogen) at 37 °C in a humidified incubator containing 5%CO2. After 24 hours of incubation 50μg/ml of cycloheximide (Sigma, St Louis, MO, USA) was added to the medium and the decay in the steady-state level of a target protein was monitored by immunoblotting at indicated time points.
Western blotting and co-immunoprecipitation- For whole cell lysates, cells were homogenized in buffer (20 mM Hepes, pH 7.5, 10 mM KCl, 1.5 mM MgCl2, 1 mM Na-EDTA, 1 mM Na-EGTA, and 1 mM DTT). All buffers were supplemented with protease and phosphatase inhibitor mixtures (15, 16). Protein concentrations were estimated using micro Lowry method. An equal amount of protein was loaded for immunoblotting. For direct Western blot analysis, the cell lysates or the particular fractions were separated by SDS-PAGE, transferred to polyvinylidene difluoride membrane (Millipore), probed with specific antibodies like, anti-SMAR1, MDM2, E-cadherin, vimentin, Slug, cytokeratin 18, EGFR1, TGFβR1, p-Tyr and p-Ser antibodies, purchased from Santa Cruz Biotechnologies, USA, and visualized by chemiluminescence. For the determination of direct interaction between E-cadherin and MDM2 or SMAR1 and MDM2, E-cadherin and SMAR1 immunocomplexes from whole cell lysate were purified using E-cadherin and SMAR1 antibody respectively and protein A-Sepharose beads (Sigma, USA). The immunopurified proteins were immunoblotted with MDM2 antibody. The protein of interest was visualized by chemi-luminescence. Equivalent protein loading was verified using anti-α-actin antibodies (Santa Cruz), respectively.
Fluorescence imaging- For the identification of subcellular localization of E-cadherin under different conditions, the MCF-7 and MDAMB-231 cells were fixed with 4% p-formaldehyde and
at BO
SE IN
STIT
UT
E L
IBR
AR
Y on A
ugust 4, 2014http://w
ww
.jbc.org/D
ownloaded from
SMAR1 up-regulates E-cadherin to inhibit EMT | 4
permeabilized with Triton X-100. Cells were then stained with anti-E-cadherin antibody followed by FITC-conjugated secondary antibody and visualized with confocal microscope (Carl Zeis, Jena, Germany).
RT–PCR assay- Two μg of the total RNA, extracted from cells with TRIzol reagent (Invitrogen, Carlsbad, Carlsbard, CA, USA) was reverse transcribed and then subjected to PCR with enzymes and reagents of the RTplusPCR system (Eppendorf, Hamburg, Germany) using GeneAmpPCR 2720 (Applied Biosystems; Foster City, CA, USA). The cDNAs were amplified with primers specific SMAR1 For-AGACAAACACCACGAGAAT Rev-CGG-AGTTCAGGGTGATGAGTGTGAC, E-cadhe-rin For-CACCTGGAGAGAGGCCATGT Rev-TGGGAAACATGAGCAGCTCT, Slug For-CTCACCTCGGGAGCATACAG Rev-GACTT-ACACGCCCCAAGGATG, GAPDH For-CGT-ATTGGGCGCCTGGTCAC Rev-ATGATGAC-CCTTTTGGCTCC. HDAC1 For- ACCGGG-CAACGTTACGAAT Rev- CTATCAAAGGA-CACGCCAAGTG
Plasmid construct, siRNA and transfection- SMAR1 expression plasmid pBK-CMVSMAR1 were used for overexpression studies.The SMAR1 cDNA clones were introduced separately in all the cell lines using Lipofectamine 2000 (Invitrogen, USA). Stably expressing clones were isolated by limiting dilution and selection with G418 sulphate (Cellgro, USA) at a concentration of 400μg/ml and cells surviving this treatment were cloned and screened by Western blot analysis with specific antibodies. MCF- 7 cells were transfected separately with 300pmol of SMAR1 shRNA and MDM2/ Slug siRNA (Santa Cruz, USA) using LipofectAmine. The levels of respective proteins were estimated by Western blotting.
Adenovirus and Lentivirus-SMAR1 adenovirus was used as described in Sinha et al., 2010. For SMAR1 lentivirus, HEK 293T cells were co-transfected with pSPAX, pMD2.G and SMAR1 ShRNA in pGIPZ (Clone ID: V2LHS_174233; V3LHS_374011; V3LHS_374008; RHS4346 for non-silencing) (Open 23Biosystems). Indicated cell lines were transduced with a 1:1 mix of viral supernatant and growth media. Stable cell lines were selected with 1.5 μg/ml of Puromycin (Sigma).
Flow cytometry- For the determination of E-cadherin expression on cell surface, cells were labelled with E-cadherin primary antibody and then
labeled for FITC tagged secondary antibody (Santa cruz, USA) and analyzed on flow cytometer for FITC fluorescence. (FACS Calibur, Beckton Dickinson, Mount View, CA, USA). Electronic compensation of the instrument was done to exclude overlapping of the emission spectra. Total 10,000 events were acquired for analysis using CellQuest software (Beckton Dickinson).
Slug Promoter Cloning—The 600-bp fragment of Slug gene promoter was PCR-amplified by specific primers designed according to the infusion cloning kit (Clontech) and ligated to the pMetLuc2-Reporter vector, (Clontech) using BamH1 and HindIII sites following manufacturer’s instructions of Infusion Cloning kit (Clontech).
Luciferase Reporter Assay—MCF-7 and MDAMB-2431 cells were transiently transfected with 1 μg of pMetLuc2-Slug (600-bp) constructs along with 0.5 μg of pMetLuc-Control vector for internal controls. 50μl of culture medium from each sample were collected 24 h post-transfection, onto 96 well plate, substrate added and plate transferred to luminometer. Luciferase counts were measured using a TopCount luminometer (PerkinElmer Life Sciences). Transfection efficiency was normalized to GFP counts measured using a Fluoroskan Ascent Luminometer (Lab Systems). All assays were done in triplicates.
Chromatin Immunoprecipitation assay- Chromatin Immuno-precipitation (CHIP) assay was performed using CHIP assay kit (Millipore) following manufacturer’s instructions. Isolated chromatin was precipitated with SMAR1/HDAC antibodies. Input DNA, rabbit IgG-pulled DNA served as controls for all the experiments. Immunoprecipitated DNA was then subjected to 40 cycles of PCR using primers for respective promoter regions as mentioned in the figures. Glyceraldehyde-3-phosphate dehydro-genase promoter was used as a nonspecific control for all the CHIP experiment. Primer used for SMAR1 is For: CTGGTTCAAAATGGGCTG Rev: CCTCTCA-GCTGTGATTGGATC, for GAPDH is For-CGTATTGGGCGCCTGGTCAC Rev-ATGAT-GACCCTTTTGGCTCC for HDAC1 is For- AC-CGGGCAACGTTACGAAT Rev- CTATCAAAGGA-CACGCCAAGTG. Sequences of other primers that are used for detection of different SMAR1 binding site at Slug promoter are Set 1 (-623 TO -479) For-CCGTGTTAGCTAT-GGTGGC Rev-GCCAGAGTC-CCAGGAGAGCG, Set 2(-529 TO -428) For-GCGGG-
at BO
SE IN
STIT
UT
E L
IBR
AR
Y on A
ugust 4, 2014http://w
ww
.jbc.org/D
ownloaded from

SMAR1 up-regulates E-cadherin to inhibit EMT | 5
ACTGCAGCCTTGCG Rev-GCAAGGCAAACCT-CTCCAG, Set 3(-456 TO -302) For-GGTTTGCCTT-GCACAAAGACC Rev-GCACCACATCTGGAA-GCC, Set 4(-350 TO -218) For- GCGGGGACA-CAGTGTCCGCC Rev-CGGGGCTCACCGAGCG-AG, Set 5 (-261 TO -159) For-CGATCCACGCTCTCTG-GGAGC Rev-CAGCC-CATTTTGAACCAG, Set 6(-159 TO -50) For- CTGGTTCAAA-ATGGGCTG Rev-CCTCTCAGC-TGTGATTGGATC, Set 7(-80 TO 37) For-CAGCTCCTCCCTCTGGGAC Rev-GACTTCAGA-GGCGCCGGC, Set 8 (23 TO 138) For-GTCACCC-GGCTCCTTTACG Rev- CGGACCGTTATCCGCG-CCG, Set 9(112 TO 242) For-GACACGGCGGTC-CCTACAGC Rev-GCGAACTGGACACACATAC-AG.
Treatment of animals- All experiments were performed strictly adhering to the ethical guidelines of the Institute. MCF-7 luciferase cells were transduced with non-silencing lentivirus and SMAR1-shRNA lentivirus. Subsequent to transduction, cells were subjected to selection with puromycin (1μg/μl). After 72hrs of selection, cells were cultured under a selection pressure of 0.5μg/μl. 1x10⁶ stable MCF-7-Luc cells and MCF-7-Luc SMAR1-shRNA were introduced into SCID mice via tail vein.
Bioluminiscence Imaging with IVIS- For detection of metastasis, SCID mice were anaesthetized using combination of Xylazine (10mg/kg) and Ketamine (100- 200mg/kg) and were subsequently injected intraperitoneally with 100μl of 3mg/ml of D-luciferin (Xenogen). Images were captured with a CCD camera (IVIS, Xenogen) using IVS Spectrum with an exposure time of 1 min and analysed.
Statistical analyses- Values are shown as s.e.m. Data were analyzed and when appropriate, significance of the differences between mean values was determined by a Student’s t-test. Results were considered significant at P<0.05.
Results
Altered migratory potential of different breast cancer cell lines are associated with SMAR1 expression−As SMAR1 has been reported to play an important role in cell migration (21), we first monitored SMAR1 expression status in a battery of human breast cancer cell lines. Our results of Fig. 1A clearly indicate higher expression levels of SMAR1 in MCF-7 and HBL-100 cells than MDAMB-231 and
MDAMB-468 cells. Next, these human mammary cancer cell lines with different SMAR1 status were screened for their metastatic potential using unidirectional wound-healing assay and further reconfirmed by transwell cell-migration assay. The possibility of cell proliferation was out-ruled using 10μg/ml dose of mitomycin C. Results of both these assays illustrated that MDAMB-231 and MDAMB-468 cells with comparatively lower expression levels of SMAR1, furnished a relatively higher rate of migration when compared to MCF-7 and HBL-100 cells with a higher SMAR1 expression (Fig. 1B, left and right panel). Further analysis revealed that the average distance migrated by low SMAR1-expressing (MDAMB-231 and MDAMB-468) cells was ~1.8 fold higher than that of high SMAR1-expressing (MCF-7 and HBL-100) cells (Fig. 1C). The correlation graph as shown in Figure 1D also validated the above finding that the rate of breast carcinoma cell migration is inversely correlated with SMAR1 expression (Fig. 1D). These results indicate that SMAR1 expression status might play an important role in regulating the in vitro motility of breast cancer cells.
Next, to confirm the above findings, we genetically manipulated SMAR1 in an array of breast cancer cell lines and verified their migration efficiency. Our results showed that the over expression of SMAR1 declined the migratory potential of the transfectants, though the effect was more pronounced in MDAMB-231 and MDAMB-468 cells (Fig. 1E, lower two panels & 1F lower panel) than in MCF-7 and HBL-100 cells (Fig. 1E upper two panels). In contrast, down-regulating SMAR1 by SMAR1 shRNA enhanced the migration efficiency, both by unidirectional wound-healing assay as well as transwell migration assay techniques, of MCF-7 and HBL-100 cells (Fig. 1F, upper panel) but not of MDAMB-231 and MDAMB-468 cells (data not shown) since the basal expression of SMAR1 was very low in these cell lines. These findings elucidating that SMAR1 plays a major role in inhibiting breast cancer cell migration, further tempted us to delineate the complete mechanism underlying such anti-migration effect of this tumor suppressor protein.
Retardation of breast cancer cell migration by SMAR1 is associated with an up-regulation of E-cadherin expression−It is well acknowledged that expression of E-cadherin protein is a typical characteristic feature of epithelial cells; consequently, E-cadherin status is normally
at BO
SE IN
STIT
UT
E L
IBR
AR
Y on A
ugust 4, 2014http://w
ww
.jbc.org/D
ownloaded from

SMAR1 up-regulates E-cadherin to inhibit EMT | 6
decreased during EMT (5). As Singh et al. (21) have previously shown that SMAR1 decreases the migratory potential of breast cancer cells; we next attempted to verify whether SMAR1 expression has any effect on EMT phenotype of breast cancer cells. Phase contrast images revealed that SMAR1-depleted MCF-7 cells gained the mesenchymal phenotype (Fig. 2A) Next we attempted to find out the correlation between the expression status of SMAR1 and E-cadherin as well as other EMT markers. Our findings revealed that in comparison to MDAMB-231 and MDAMB-468 cells, in MCF-7 and HBL-100 cells expression levels of epithelial markers, E-cadherin and cytokeratin 18, were significantly high, while the expression level of the mesenchymal marker, vimentin, was significantly low (Fig. 2B, left panel). Interestingly, over-expression of SMAR1 in both MCF-7 and MDAMB-231 cells up-regulated E-cadherin at both protein and mRNA levels (Fig. 2B right panel, & 2E left and right panels). In line with these findings, expression of another epithelial marker cytokeratin 18 was increased and mesenchymal marker, vimentin, was decreased in SMAR1-overexpresed MCF-7 and MDAMB-231 cells (Fig. 2B, right panel). Enhancement in E-cadherin expression in these transfectants was re-confirmed by confocal microscopy (Fig. 2D) as well as flow cytometry (Fig. 2F). Conversely, silencing SMAR1 by SMAR1 shRNA down-regulated E-cadherin expression at both mRNA and protein levels in MCF-7 cells although MDAMB-231 cells with low basal levels of both these proteins failed to furnish much significant change (Fig. 2E). All these findings together strongly reiterated the specificity of SMAR1 in regulating the expression of E-cadherin thereby controlling the migration of breast carcinoma cells. At this juncture, since E-cadherin protein was increased in SMAR1 over-expressed transfectants, the question arises as to how SMAR1regulates E-cadherin. To get to the answer, two possibilities were considered: (i) SMAR1 may hinder E-cadherin degradation, and/or (ii) may up-regulate E-cadherin expression.
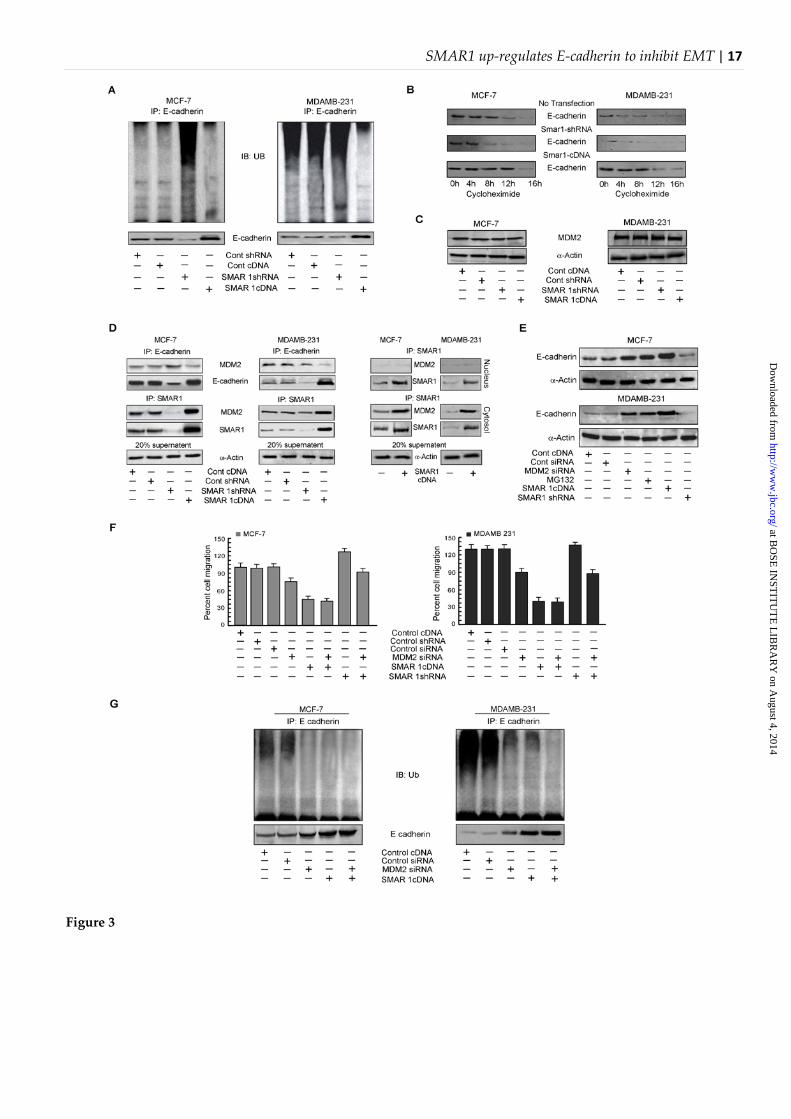
Interaction of SMAR1 with MDM2 regulates the degradation of E-cadherin−It is known that MDM2, the E3 ligase, regulates the degradation of E-cadherin through ubiquitination (12). We, therefore, next investigated whether E-cadherin ubiquitination and subsequent degradation were altered by SMAR1 in order to regulate the E-cadherin expression levels. Our co-immunoprecipitation
experiment in the presence of proteosome inhibitor, MG132, revealed significant upregulation in ubiquitination of E-cadherin in SMAR1-silenced MCF-7 cells compared to non-transfected-/control vector-transfected cells (Fig. 3A). However, SMAR1-silenced MDAMB-231 cells failed to manifest such significant changes in E-cadherin degradation when compared to non-transfected-/control vector-transfected cells (Fig. 3A). On the other hand, SMAR1 over-expression resulted in reduced E-cadherin ubiquitination as compared to non-transfected-/control vector-transfected cells and the total protein levels were also increased significantly in both the cell lines (Fig. 3A). In accordance with the above-mentioned findings we also checked the turnover of E-cadherin protein up on SMAR1 modulation in the presence of cycloheximide. Our results revealed more rapid turnover of E-cadherin protein in MDAMB-231 cells in comparison to that of the MCF-7 cells (Fig. 3B). Further findings showed that while knocking down of SMAR1 by SMAR1 shRNA enhanced E-cadherin turnover in MCF-7 cells (Fig. 3B), over-expression of SMAR1 cDNA reduced the turnover in MDAMB-231 cells (Fig. 3B). These results signify the importance of SMAR1 in stabilization of E-cadherin protein. It may not be out of context to mention here that the basal MDM2 expression level was higher in MDAMB-231 cells than MCF-7 cells (Fig. 3C) which is in accordance with previous reports that mutated p53 stabilizes MDM2 protein (22). As it is well established that MDM2 interacts with E-cadherin endogenously leading to its degradation (12), in MDAMB-231 cells, E-cadherin degradation was also found to be more than MCF-7 cells (Fig. 3C). Interestingly, MDM2 expression level was not affected by gene manipulation of SMAR1 in both the cell lines (Fig. 3C). We, therefore, next examined whether SMAR1 has any effect in this E-cadherin-MDM2 interaction. Decreased interaction of MDM2 with E-cadherin was observed by co-immunoprecipitation followed by Western blotting in both MCF-7 and MDAMB-231 cells transfected with SMAR1 cDNA (Fig. 3D, left panel), whereas increased E-cadherin-MDM2 interaction was found in SMAR1-knockout cells (Fig. 3D, left panel). These results thereby indicate that SMAR1 possibly interferes with the interaction between endogenous E-cadherin with MDM2.
Our attempt to explore the mechanism through which SMAR1 interferes with MDM2-mediated degradation of E-cadherin revealed significant elevation in the interaction between
at BO
SE IN
STIT
UT
E L
IBR
AR
Y on A
ugust 4, 2014http://w
ww
.jbc.org/D
ownloaded from
SMAR1 up-regulates E-cadherin to inhibit EMT | 7
SMAR1 and MDM2 in SMAR1 over-expressed cells (Fig. 3D, left panel) in comparison with that of control cells. Further studies showed that although SMAR1 was distributed both in the cytosol and nucleus, its interaction with MDM2 was found mainly in the cytosol of control MCF-7 as well as SMAR1 over-expressed MCF-7 and MDAMB-231 cells (Fig. 3D, right panel). These results tempted us to hypothesise that enhanced interaction between SMAR1 and MDM2 might allow E-cadherin stabilization by decreasing E-cadherin-MDM2 interaction. Consecutively, in another set of experiment, transfection of both the cell lines with MDM2-siRNA or application of MG132, a potent proteosomal inhibitor, resulted in upregulation of E-cadherin protein (Fig. 3E). Interestingly, SMAR1 cDNA transfectants also manifested much higher expression of E-cadherin than MDM2-siRNA transfectants or cells treated with MG132 in both the cell lines (Fig. 3E). In accordance with the above findings the percentage of cell migration as assessed from the transwell migration assay was also found to be significantly lower in the SMAR1 cDNA transfectants than those transfected with MDM2 siRNA (Fig. 3F). Further studies were performed to understand the effect of MDM2 on E-cadherin ubiquitination. Results of Figure 3G depict significant decrease in E-cadherin ubiquitination in MDM2-depeted or SMAR1-cDNA-transfected MCF-7 and MDAMB-231 cells with simultaneous increase in E-cadherin protein level. However, SMAR1 over-expressed cells were more efficient in increasing E-cadherin protein level than MDM2-ablated ones (Fig. 3G). Therefore, these results point towards an additional role of SMAR1 in regulating E-cadherin expression apart from blocking its degradation by binding with MDM2.
SMAR1 regulates E-cadherin transcription by modulating the expression of its transcriptional repressor, Slug−Accumulating evidence suggests that both Snail and its family member Slug repress E-cadherin in epithelial cells via E-box elements in the proximal E-cadherin promoter (10). However, expression of Slug, a zinc finger transcription factor, furnished much stronger correlation with E-cadherin repression in breast cancer cell lines than Snail, thereby suggesting the dominance of Slug as an in vivo repressor of E-cadherin in breast carcinoma. We, therefore, next aimed at exploring whether SMAR1 regulates Slug expression in order to modulate the expression of E-cadherin in the breast carcinoma cell lines. Interestingly, in both
MCF-7 and MDAMB 231 cell lines, expression of Slug both at mRNA and protein levels was significantly reduced with increasing dose of SMAR1-cDNA transfection following a concomitant rise in E-cadherin expression (Fig. 4A). These results indicate that SMAR1 is critically involved in controlling the transcription of the Slug gene. However, when Slug cDNA was transfected in SMAR1 over-expressed MCF-7 and MDAMB-231 cells, SMAR1 over-expression could not alter Slug expression both at transcription as well as translational level (Fig. 4B) thereby resulting in down-regulation of E-cadherin expression in these double transfectants (Fig. 4B). These apparently ‘opposing’ results in fact tempted us to hypothesize that SMAR1, being a well known transcriptional repressor of different genes (23), might inhibit Slug expression in wild type cells by binding to the MARs at Slug promoter locus thereby repressing its transcription, while in synthetic Slug cDNA-transfected cells, SMAR1 is failing to bind to Slug promoter locus due to the change in their promoter sequences. Over-expression of Slug in the SMAR1-silenced cells also resulted in Slug up-regulation with low E-cadherin expression both at mRNA and protein levels (Fig. 4B). Interestingly, the percent migration of both MCF-7 and MDAMB-231 cells increased prominently on Slug over-expression in even the stable SMAR1cDNA-transfected cells (Fig. 4C). Consistently, the change in the migration of MCF-7 cells with respect to the control cells was considerably higher than that of MDAMB-231 cells up on SMAR1 knock down (Fig. 4C). All these findings described so far clearly highlight the importance of SMAR1 in regulating Slug gene transcription and thereby E-cadherin expression in breast carcinoma cells.
At this juncture, we explored the role of p53 in SMAR1-induced regulation of E-cadherin expression and cell migration. Our results depicted that p53-silencing significantly down-regulated SMAR1 expression with up-regulation of Slug and decline in E-cadherin (Fig. 4D, left panel). In line with this, cell migration was also elevated in these transfectants (Fig. 4D, right panel). Interestingly, when SMAR1 was over-expressed in these p53-depleted cells, repression in Slug expression with a rise in E-cadherin expression levels (Fig. 4D, left panel) and a significant decline in the migratory status of the cells (Fig. 4D, right panel) were observed. Results of all these experiments together indicate that although the expression of SMAR1 is
at BO
SE IN
STIT
UT
E L
IBR
AR
Y on A
ugust 4, 2014http://w
ww
.jbc.org/D
ownloaded from
SMAR1 up-regulates E-cadherin to inhibit EMT | 8
p53-dependent, the anti-migratory function of SMAR1 is independent of p53.
Furthermore, when Slug siRNA-transfected cells were co-transfected with MDM2-siRNA, the experimental conditions totally mimicked the situation of SMAR1 over-expression, i.e., high E-cadherin expression and low migratory ability (Fig. 4E & F). These observations further strengthened our hypothesis that SMAR1 plays a dual role in regulating E-cadherin expression both at protein and at transcription levels.
SMAR1 in association with HDAC1 binds to MAR on Slug promoter locus and regulates its transcriptional activity−Recent reports on negative regulation of different gene transcription revealed recruitment of HDAC1 on the specific gene promoter (20). Therefore, we examined if down-regulation of the slug expression by SMAR1 occurs by recruitment of corepressor molecules like HDACs to its promoter. To get insights into SMAR1-mediated repression, firstly we studied the association of SMAR1 with specific HDACs. To analyze whether SMAR1 directly interacts with HDAC1, co-immunoprecipitation studies were performed using lysates of endogenous as well as SMAR1 over-expressed or silenced MCF7, MDAMB-231 cell lines. As shown in Fig. 5A, SMAR1-immunoprecipitated control samples showed the presence of HDAC1 in MCF7 cell lysate whereas in MDAMB231 lysate association between the two proteins were negligible as SMAR1 expression was not significantly detected in the immunoprecipitated sample. As expected, immunoprecipitates from SMAR1-over-expressed samples of both the cell lines revealed significantly higher association of HDAC1 with SMAR1 whereas the association between the two proteins was found to be decreased on depleting SMAR1 by shRNA in the immunoprecipitate of MCF7 lysate (Fig. 5A). These results firmly signify that SMAR1 is associated with the HDAC1 in breast cancer cells.
To resolve whether the Slug gene is the direct transcriptional target for SMAR1, we scrutinized the binding of SMAR1 on the human Slug promoter in vitro. SMAR1 has been shown to regulate transcription through binding to MARs (23) that are AT-rich cis-acting regulatory elements flanking various promoters and enhancers. Software analysis predicted more than one potential 100-200bp MAR binding sites on Slug promoter (Fig. 5B). To validate the importance of MAR in the Slug promoter for
SMAR1-mediated repression, luciferase reporter assay was performed in MCF-7 cells using full length Slug promoter. Reporter assays showed that upon SMAR1 over-expression in both MCF-7 and MDAMB-231 cells, there was a 3 to 4 fold decrease in relative luciferase activity of the Slug promoter in MCF-7 cells whereas 4 to 5 fold decrease in MDAMB-231 cells (Fig. 5B). On the other hand, knocking-down of SMAR1 increased the relative activity up to 2 fold, specifically in MCF-7 cells (Fig. 5B). Further, SMAR1-downregulated MDAMB-231 cells did not result in any significant change in the relative luciferase activity compared to control cDNA- or shRNA-transfected cells (Fig. 5B).
Earlier Rampalli et al. (20) have demonstrated that SMAR1 mediates cyclin D1 repression by recruitment of the SIN3/histone deacetylase 1 complex. Therefore, to understand whether such interactions are prevailing in case of Slug repression, Chromatin Immuno-precipitation (CHIP) assay was performed with both MCF-7 and MDAMB-231 cells using SMAR1 and HDAC1 antibodies. Different sets of overlapping primers of the predicted mar binding sites were designed and CHIP assays were performed with each set of primers to locate the binding site of SMAR1 on Slug promoter (data not shown). As depicted in Fig. 5C, recruitment of both SMAR1 and HDAC1 was observed in the -50 to -160 bp region upstream of the Slug gene in both the cell lines under normal and SMAR1-over-expressed conditions, suggesting the occupancy of the Slug promoter by SMAR1. In parallel set of CHIP assay, no amplification of the specific region from immunoprecipitated DNA was obtained in SMAR1-silenced cells while significant SMAR1 occupancy along with HDAC1 was detected in SMAR1-over-expressed MCF-7 and MDAMB-231 cells (Fig. 5C). These results validated the direct recruitment of SMAR1/HDAC1 complex on Slug promoter sequence for executing the repressive effects.
SMAR1 also inhibits EGF mediated Slug up-regulation to restore E-cadherin expression and regulate cell migration−Activation of epidermal growth factor receptor (EGFR)-induced signaling pathway has been correlated with cancer metastasis in various tumors, including breast carcinoma (24). According to the previous reports, exposure of different mammary epithelial cells to epidermal growth factor (EGF) resulted in morphological alterations characteristic of epithelial-to-mesenchymal transition (EMT) (25). EGF treatment has also been shown to result in increased motility
at BO
SE IN
STIT
UT
E L
IBR
AR
Y on A
ugust 4, 2014http://w
ww
.jbc.org/D
ownloaded from
SMAR1 up-regulates E-cadherin to inhibit EMT | 9
along with an up-regulation of transcription factor Slug, which thereby decreases the expression of E-cadherin (26). We therefore, used EGF as a metastatic inducer to explore whether SMAR1 also interferes with the EGF-induced up-regulation of Slug to restore the E-cadherin expression in breast carcinoma cells. Interestingly, our findings revealed that SMAR1 over-expression blocked even EGF-dependent up-regulation of Slug in both the MCF-7 and MDAMB-231 cells (Fig. 6A) thereby increasing E-cadherin in both the cells (Fig. 6A). In fact, in the presence of recombinant EGF or TGFβ, two important mediators of EMT, tyrosine phosphorylation of EGFR1 and serine phosphorylation of TGFβR1 were significantly increased keeping SMAR1 expression significantly low in both the cells that underwent EMT under these conditions (Fig 6B left & right panels). Our findings were further reinstated from the confocal microscopic analysis which revealed elevated surface expression of E-cadherin in SMAR1-over-expressed MCF-7 and MDAMB-231 cells even in the presence of EGF (Fig. 6C). Such elevation of E-cadherin levels turned down the migratory efficiency of both these cell lines significantly even in the presence of EGF (Fig. 6D).
Validation of role of SMAR1 in Breast Cancer Cell Metastasis in SCID mice model− In an attempt to validate the role of SMAR1 in regulating breast cancer metastasis, we next assessed the metastatic propensity of MCF-7-Luc cells that were transduced with either non-silencing lentivirus or SMAR1-shRNA lentivirus in SCID mice model. Our results revealed prominent bioluminescence at time zero, i.e., immediately after inoculation of the Lenti-NS-shRNA- (Fig. 6E, upper left panel) and Lenti-SMAR1-shRNA-transfected (Fig. 6E, upper right panel) MCF-7 cells, in the lungs of the animals. However, at day 21, the signal disappeared from the lungs of both the sets of mice with appearance of prominent luminescence in the bones of the mice injected with SMAR1-ablated MCF-7-Luc cells thereby confirming bone metastasis (Fig. 6E, lower right panel). Interestingly, no significant luminescence was detected in the mice injected with non-silencing counterpart (Fig. 6E, lower left panel). Average radiance of regions of interest at time zero and day 21 of the mice injected with Lenti-NS-shRNA- and Lenti-SMAR1-shRNA-transfected MCF-7 cells was graphically represented (Fig. 6F). These in vivo results validate the role of SMAR1 in regulating the metastatic potential of breast cancer cells.
All the above-described results cumulatively signify that SMAR1 plays a dual role in regulating E-cadherin, the gate-keeper of EMT, thereby altering the migratory potential of breast carcinoma cells.
Discussion
Tumors are often viewed as corrupt forms of normal developmental process. Indeed genes that are important for the normal developmental process are often found to be major culprits in cancer. Thus genes implicated in EMT during embryogenesis are turning up one after the other in tumorigenesis (27). EMT therefore provides a new basis for understanding the progression of carcinoma towards de-differentiated and more malignant stages. During the execution of the EMT program many genes involved in cell adhesion, migration and invasion are transcriptionally altered. One of the most important one is E-cadherin. Since E-cadherin functions as a key gatekeeper of the epithelial state, the partial loss of E-cadherin has been associated with carcinoma progression and poor prognosis in various human and mouse tumors (12). Thus evaluation of the molecular mechanisms involved in regulation of E-cadherin expression might be a critical step in controlling EMT.
Our present study has been mainly focused on the regulation of the expression of E-cadherin by the tumor suppressor SMAR1 in order to control EMT. Since SMAR1 has been previously reported to regress tumor growth (21), we were interested in investigating its role, if any, in regulation of EMT by altering E-cadherin expression in breast carcinoma cells. Our results implicate that over-expression of SMAR1 in both MCF-7 and MDAMB-231 cell lines enhanced their E-cadherin expression, which was also conjointly associated with a loss in the migratory potential of these cells. Furthermore, it was also found that knock-down of SMAR1 enhanced their invasive potential substantially. Thus we presumed that a complex mechanism is exhibited by SMAR1 in regulating E-cadherin expression in breast carcinoma cells.
It is well acknowledged that p53 is a potent transcription factor of SMAR1 (20, 34) and during drug-induced DNA damage, acetylated p53 is recruited on SMAR1 promoter that allows activation of its transcription (21). However, report of Singh et al, 2007 (21) also demonstrated p53-independent anti-migratory and anti-invasive effects of SMAR1 through down-regulation of TGFβ signalling (21).
at BO
SE IN
STIT
UT
E L
IBR
AR
Y on A
ugust 4, 2014http://w
ww
.jbc.org/D
ownloaded from
SMAR1 up-regulates E-cadherin to inhibit EMT | 10
Our results also depicted that although the expression of SMAR1 is p53-dependent, the anti-migratory function of SMAR1 is independent of p53. These findings have relation to our results indicating that in mutant p53-expressing MDA-MB-231 cells, SMAR1 over-expression significantly down-regulated Slug thereby up-regulating E-cadherin and inhibiting cell migration.
Expression of E-cadherin is regulated at several levels including transcriptional and posttranscriptional modulation (28). It has also been acknowledged that the E3 ligase MDM2 is involved in the degradation of E-cadherin (12). MDM2 is an oncogene that is amplified or over-expressed in most human cancers (29). MDM2 triggers the ubiquitination of E-cadherin in vivo, leading to the down-regulation of E-cadherin mediated cell-to-cell contacts (12). Our results suggest that SMAR1 over-expression in MCF-7 and MDAMB-231 cells declined the MDM2 mediated ubiqutination and degradation of E-cadherin. In coalesce with previous reports we found that SMAR1 acts as a mediator which directly interacts with MDM2 thereby stabilizing E-cadherin protein levels in the cell. Interestingly, the role of SMAR1 in regulating E-cadherin expression is not only limited to blocking E-cadherin degradation, but also extended in controlling the transcription of E-cadherin. It is known that transcription of E-cadherin is directly regulated by methylation and repression of promoter activity. During carcinogenesis, methylation of the E-cadherin promoter is associated with reduced E-cadherin expression, disease progression, and metastasis (30). Transcription of E-cadherin is also regulated by zinc finger proteins of the Slug/Snail family and Smad-Interacting Protein (31-33). SMAR1 was found to suppress cancer cell invasion by regulating the transcription of Slug. Slug expression remained potentially down-regulated in SMAR1 over-expressed cells with simultaneous elevation in E-cadherin levels and decrease in migratory potential of the cells. Furthermore, it has been clearly demonstrated from our luciferase and CHIP analysis data that SMAR1 actually binds to the Slug promoter at a potent 110bp region between -50 to -160bp upstream of the gene to bring about its transcriptional repression. It is acknowledged that
MAR-binding proteins act as transcriptional switches because of their intrinsic ability to interact with both classes of chromatin-modifying enzymes, histone acetyltransferases and HDACs. SMAR1 is a DNA-binding protein, and the major mechanism by which it exhibits its repressor function is by recruitment of HDAC1 (34-36). In agreement with this, we found SMAR1 directly regulated Slug transcription through recruitment of HDAC1 repressor complex.
EGF is an important pro-inflammatory cytokine that promotes tumor cell migration and invasion (37, 38) in the tumor microenvironment through activation of different target genes like Slug, matrix metalloproteinases, and vascular endothelial growth factor (26). Reports indicate that in breast cancer cells EMT can be induced by EGF (39). Hindering the action of EGF is, therefore, an obvious strategy to regulate cancer progression. In this study we have also shown that breast carcinoma cells can be induced to undergo EMT by EGF and that SMAR1 over-expression could interfere with such pro-migratory program of EGF. In fact, SMAR1 not only restored a complete epithelial phenotype in mesenchymal cells but also completely blocked EGF-induced EMT. A detail insight into this effect of SMAR1 disclosed that SMAR1 interferes with EGF-induced Slug up-regulation to restore back E-cadherin expression in breast carcinoma cells to control EMT process. SMAR1 therefore, plays a dual role in rescuing E-cadherin from the claws of both MDM2 and Slug thereby substantially regressing breast carcinoma cell migration. In addition, bone metastasis of SMAR1-ablated MCF-7 cells further validated the contribution of SMAR1 in regulating breast cancer metastasis.
In conclusion, our data provide direct evidence that the tumor suppressor SMAR1 acts as a double-edged sword by increasing E-cadherin transcription in one hand and decreasing its degradation on the other. This concerted action of SMAR1 plays a vital role in maintaining the E-cadherin status of cells which in turn regulates the metastatic potential of these carcinoma cells. Our findings provide novel insight into the molecular mechanisms of SMAR1-induced activation of E-cadherin leading to repression of breast carcinoma cell metastasis.
Acknowledgements:
at BO
SE IN
STIT
UT
E L
IBR
AR
Y on A
ugust 4, 2014http://w
ww
.jbc.org/D
ownloaded from

SMAR1 up-regulates E-cadherin to inhibit EMT | 10
Thanks are due to U Ghosh and R Dutta for technical help. This work was supported by the grants from DST, CSIR and UGC, Govt of India. Authors acknowledge the Center for Research in Nanoscience and Nanotechnology, University of Calcutta for providing instrumental facilities as required.
Abbreviations: cDNA, complementary DNA; CsA, cyclosporin A; MDM2, Murine double minute 2; PCR, Polymerase chain reaction; siRNA, short-interfering RNA.
References:
1. Adhikary, A., Mohanty, S., Lahiry, L., Hossain, D.M.S., Chakraborty, S., and Das, T. (2010). Theaflavins retard human breast cancer cell migration by inhibiting NF-κB via p53-ROS cross-talk. Febbs Lett. 584, 7-14
2. Steeg, P.S. (2006). Tumor metastasis: mechanistic insights and clinical challenges. Nature Med. 12, 895–904
3. Savagner, P. (2001). Leaving the neighbourhood: molecular mechanisms involved during epithelial-mesenchymal transition. BioEssays 23, 912-923
4. Huber, M.A., Kraut, N., and Beug, H. (2005). Molecular requirements for epithelial–mesenchymal transition during tumor progression. Curr. Op. Cell Biol. 17, 548-558
5. Thiery, J.P. (2002). Epithelial-mesenchymal transition in tumor progression. Nat. Rev. Cancer 2, 442–454
6. Mareel, M., and Leroy, A. (2003). Clinical, cellular and molecular aspects of cancer invasion. Physiol. Rev. 83, 337-376
7. Bremnes, R.M. (2002). High-throughput microarray analysis used to evaluate biology and prognostic significance of the E-cadherin pathway in small cell lung cancer. J.Clin.Oncol. 20, 2417-2428
8. Frixen, U.H. (1991). E-cadherin-mediated cell-cell adhesion prevents invasiveness of human carcinoma cells. J.Cell.Biol. 113, 173-185
9. Neito, M.A. (2002). The snail superfamily of zinc-finger transcription factors. Nat.Rev.Mol.Cell Biol. 3, 155-166
10. Bolós, V., Peinado, H., Pérez-Moreno, M.A., Fraga, M.F., Esteller, M., and Cano, A. (2003). The transcription factor Slug represses E-cadherin expression and induces epithelial to mesenchymal transitions: a comparison with Snail and E47 repressors. J. Cell Sci. 116, 499-511
11. Hajra, K.M., Chen, D.Y., and Fearon, E.R. (2002). The SLUG zinc-finger protein represses E-cadherin in breast cancer. Cancer Res. 62, 1613-1618
12. Yang, J.Y., Zong, C.S., Xia, W., Wei, Y., Ali-Seyed, M., Li, Z., Broglio, K., Berry, D.A., and Hung, M.C. (2006). MDM2 promotes cell motility and invasiveness by regulating E-cadherin degradation. Mol. Cell Biol. 26, 7269-7282
13. Iwakuma, T., and Lozano, G. (2003). MDM2, an introduction. Mol. Cancer Res. 1, 993–1000
14. Mathew, R., Arora, S., Khanna, R., Mathur, M., Shukla, N.K., and Ralhan, R. (2002). Alterations in p53 and pRb pathways and their prognostic significance in oesophageal cancer. Eur. J. Cancer 38, 832–841
15. Lukas, J., Gao, D.Q., Keshmeshian, M., Wen, W.H., Tsao-Wei, D., Rosenberg, S., and Press, M.F. (2001). Alternative and aberrant messenger RNA splicing of the mdm2 oncogene in invasive breast cancer. Cancer Res. 61, 3212–3219
16. Sen, GS., Mohanty, S., Hossain, DMS., Bhattacharya, S., Banerjee, S., Chakraborty, J. et al.( 2011) Curcumin enhances the efficacy of chemotherapy by tailoring p65NFκB-p300 cross-talk in favour of p53-p300 in breast cancer. J Biol Chem. 286, 42232–42247
17. Pavithra, L., Mukherjee, S., Sreenath, K., Kar, S., Sakaguchi, K., Roy, S., and Chattopadhyay, S. (2009). SMAR1 forms a ternary complex with p53-MDM2 and negatively regulates p53-mediated transcription. J. Mol.Biol. 388, 691-702
at BO
SE IN
STIT
UT
E L
IBR
AR
Y on A
ugust 4, 2014http://w
ww
.jbc.org/D
ownloaded from

SMAR1 up-regulates E-cadherin to inhibit EMT | 11
18. Heng, H.H., Goetze, S., Ye, C.J., Liu, G., Stevens, J.B., Bremer, S.W., Bode, J., Wykes, S.M. and Krawetz, S.M. (2004). Chromatin loops are selectively anchored using Scaffold/Matrix attachment regions. J. Cell Sci. 117 999–1008
19. Jenuwein, T., Forrester, W.C., Fernandez-Herrero, L.A., Laible, G., Dull, M., and Grosschedl, R. (1997). Extension of chromatin accessibility by nuclear matrix attachment regions. Nature 385, 269–272
20. Rampalli, S., Pavithra, L., Bhatt, A., Kundu, T.K., and Chattopadhyay, S. (2005). Tumor suppressor SMAR1 mediates Cyclin D1 repression by recruitment of the SIN3/Histone Deacetylase 1 complex. Mol. Cell Biol. 25(19), 8415-8429
21. Singh, K., Mogare, D., Giridharagopalan, R.O., Gogiraju, R., Pande, G., and Chattopadhyay, S. (2007). p53 Target Gene SMAR1 is dysregulated in breast cancer: its role in cancer cell migration and invasion. PLoS ONE 2, e660.
22. Moll, U.M., and Petrenko, O. (2003). The MDM2-p53 interaction. Mol.Cancer Res. 1, 1001-1008
23. Chattopadhyay, S., Kaul, R., Charest, A., Housman, D., and Chen, J. (2000). SMAR1, a novel, alternatively spliced gene product, binds the Scaffold/Matrix-associated region at the T cell receptor beta locus. Genomics 68, 93–96
24. Hsieh, C.Y., Tsai, P.C., Tseng, C.H., Chen, Y.L., Chang, L.S., and Lin, S.R. (2012). Inhibition of EGF/EGFR activation with naphtho[1,2-b]furan-4,5-dione blocks migration and invasion of MDA-MB-231 cells. Toxicol. In Vitro 27, 1-10
25. Vegara, D., Valente, C.M., Tinelli, A., Siciliano, C., Lorusso, V., Acierno, R. Giovinazzo, G., Santino, A., Storelli, C., and Maffia, M. (2011). Resveratrol inhibits the epidermal growth factor-induced epithelial mesenchymal transition in MCF-7 cells. Cancer Lett. 310, 1-8
26. Cheng, J.C., Chang, H.M., and Leung, P.C. (2013). Egr-1 mediates epidermal growth factor-induced downregulation of E-cadherin expression via Slug in human ovarian cancer cells. Oncogene. 32, 1042-1049
27. Kang, Y., and Massagúe, J. (2004). Epithelial-Mesenchymal Transitions: Twist in Development and Metastasis. Cell. 118, 277-279
28. Halbleib, J.M., and Nelson, W.J. (2006). Cadherins in development: cell adhesion, sorting,and tissue morphogenesis. Genes Dev. 20, 3199–3214
29. Momand, J., Jung, D., Wilczynski, S., and Niland, J. (1998). The MDM2 gene amplification database. Nucleic Acids Res. 26, 3453–3459
30. Strathdee, G. (2002). Epigenetic versus genetic alterations in the inactivation of E-cadherin. Semin. Cancer Biol. 12, 373–379
31. Batlle, E., Sancho, E., Franci, C., Dominquez, D., Monfar, M., Baulida, J., and Gracia De Herreros, A. (2000). The transcription factor snail is a repressor of E-cadherin gene expression in epithelial tumour cells. Nat. Cell Biol. 2, 84–89
32. Comijn, J., Berx, G., Vermassen, P., Verschueren, K., Grunsven, L.V., Bruyneel, E., Mareel, M., Huylebroeck, D., and Roy, F.V. (2001). The two-handed E box binding zinc finger protein SIP1 downregulates E-cadherin and induces invasion. Mol. Cell 7, 1267–1278
33. Bryant, D.M., and Stow, J.L. (2004). The ins and outs of E-cadherin trafficking. Trends Cell Biol. 14, 427–434
34. Singh, K., Sinha, S., Malonia, S.K., Bist, P., Tergaonkar, V., and Chattopadhayay, S. (2009). Tumor suppressor SMAR1 represses IκBα expression and inhibits p65 transactivation through matrix attachment regions. J.Biol.Chem. 284 1267-1278
35. Bode, J., Benham, C., Knopp, A., and Mielke, C. (2000). Transcriptional augmentation: modulation of gene expression by scaffold/matrix-attached regions (S/MAR elements). Crit. Rev. Eukaryot. Gene Expr. 10, 73-90
36. Blasquez, V.C., Sperry, A.O., Cockerill, P.N., and Garrard, W.T. (1989). Protein: DNA interactions at chromosomal loop attachment sites. Genome. 31(2), 503–509
at BO
SE IN
STIT
UT
E L
IBR
AR
Y on A
ugust 4, 2014http://w
ww
.jbc.org/D
ownloaded from

SMAR1 up-regulates E-cadherin to inhibit EMT | 12
37. Lu, Z., Jiang, G., Blume-Jensen, P., and Hunter, T. (2001). Epidermal Growth Factor-Induced Tumor Cell Invasion and Metastasis Initiated by Dephosphorylation and Downregulation of Focal Adhesion Kinase. Mol.Cell.Biol. 21(12), 4016-4031
38. Rosen, E.M., and Goldberg, I.D. (1989). Protein factors which regulate cell motility. In vitro Cell Dev. Biol. 25(12), 1079-1087
39. Wendt, M. K., Smith, J. A., and Schiemann, W. P. (2010). Transforming growth factor beta- induced epithelial-mesenchymal transition facilitates epidermal growth factor dependent breast cancer progression. Oncogene 29, 6485-6498
Figure Legends
Figure 1: Altered migratory potential of different breast cancer cell lines are associated with SMAR1 expression. A. Western blot analysis depicting the changes in SMAR1 expression pattern in MCF-7, HBL-100, MDAMB-231, MDAMB-468 cells. B. The rate of migration of breast carcinoma cells like MCF-7, HBL-100, MDAMB-231, MDAMB-468 with differential SMAR1 expressions were assessed for different time periods using the unidirectional wound healing assay (left panel); Graphical representation of the percentage of cell migration of MCF-7, HBL-100, MDAMB-231, MDAMB-468 cells as determined from wound healing assay (right upper panel) and trans-well migration assay (right lower panel). Columns show mean number of motile cells per 23μm field from six independent experiments; bars, SD. Each experiment was conducted in duplicate where ten 23μm fields (five per duplicate) were counted and the means calculated. A paired Student's t test (*, P < 0.005) was done on the means from six experiments. The percentage of migration for control MCF-7 cells has been denoted as 100% and the comparison with the other cell lines have been made accordingly. C. Graphical representation of the average distance migrated by MCF-7, HBL-100, MDAMB-231, MDAMB-468 cells as determined by ImageJ software from wound healing assay. Columns show average distance migrated by 100 motile cells per 23μm field from three independent experiments. The value for MCF-7 was considered as 100%. D. Comparative analysis between the fold changes in SMAR1 expression and percentage of cell migration in MCF-7, HBL-100, MDAMB-231 and MDAMB-468 cells. E. Control/SMAR1 cDNA-transfected MCF-7, HBL-100, MDAMB-231 and MDAMB-468 cells were assessed for percentage of cell migration using unidirectional wound healing assay for 0 and 24hours; F. Graphical representation of the percentage of cell migration in control/SMAR1 shRNA-transfected MCF-7 and HBL-100 cells respectively (upper two panels; expression levels of SMAR1 in control/SMAR1 shRNA-transfected MCF-7 and HBL-100 cells in inset) and in control and SMAR1 over-expressed MDAMB-231 and MDAMB-468 cells (lower two panels; expression levels of SMAR1 in control/SMAR1 cDNA-transfected MDAMB-231 and MDAMB-468 cells in inset) using wound healing assay and transwell migration assay, respectively; **P<0.01, and ***P<0.001 compared to no transfection. α-actin was used as internal control. Values are mean ± SEM of three independent experiments in each case.
Figure 2: SMAR1 mediated retardation in breast cancer cell migration is associated with up-regulation in E-cadherin expression. A. Phase contrast images taken by light microscope of control/SMAR1 shRNA transfected MCF-7 cells depicting changes in EMT phenotype. Arrows indicate induction of EMT phenotype. B. Western blot analysis furnishing the changes in E-cadherin, cytokeratin 18 and vimentin expression patterns in MCF-7, HBL-100, MDAMB-231 and MDAMB-468 cells (left panel), and in MCF-7 and MDAMB-231 cells transfected with different concentrations of SMAR1 cDNA (right panel). C. Percentage of cell migration was determined respectively by transwell migration assay. D. Cellular surface localization of E-cadherin was determined with specific anti–E-cadherin antibody using fluorescence microscopy in MCF-7 and MDAMB-231 cells transfected with increasing concentration of SMAR1 cDNA. E. MCF-7 and MDAMB-231 cells were transfected with SMAR1 cDNA/SMAR1 shRNA and E-cadherin/SMAR1 was determined at protein level by western blotting (left panel) and mRNA level by RT-PCR analysis (right panel). F. the expression of E-cadherin was evaluated by flow cytometry with specific anti–E-cadherin antibody in both MCF-7 and MDAMB-231 cells transfected with SMAR1 cDNA/SMAR1 shRNA compared with non transfected cells. These results are representative of three independent experiments.
Figure 3: Interaction of SMAR1 with MDM2 regulates the degradation of E-cadherin. A. Western blot analysis depicting the changes in the pattern of ubiquitination of immune-precipitated E-cadherin in MCF-7 and MDAMB-231 cells on over-expression and knock-down of SMAR1 with anti-E-cadherin antibody and immunoblotting with
at BO
SE IN
STIT
UT
E L
IBR
AR
Y on A
ugust 4, 2014http://w
ww
.jbc.org/D
ownloaded from
SMAR1 up-regulates E-cadherin to inhibit EMT | 13
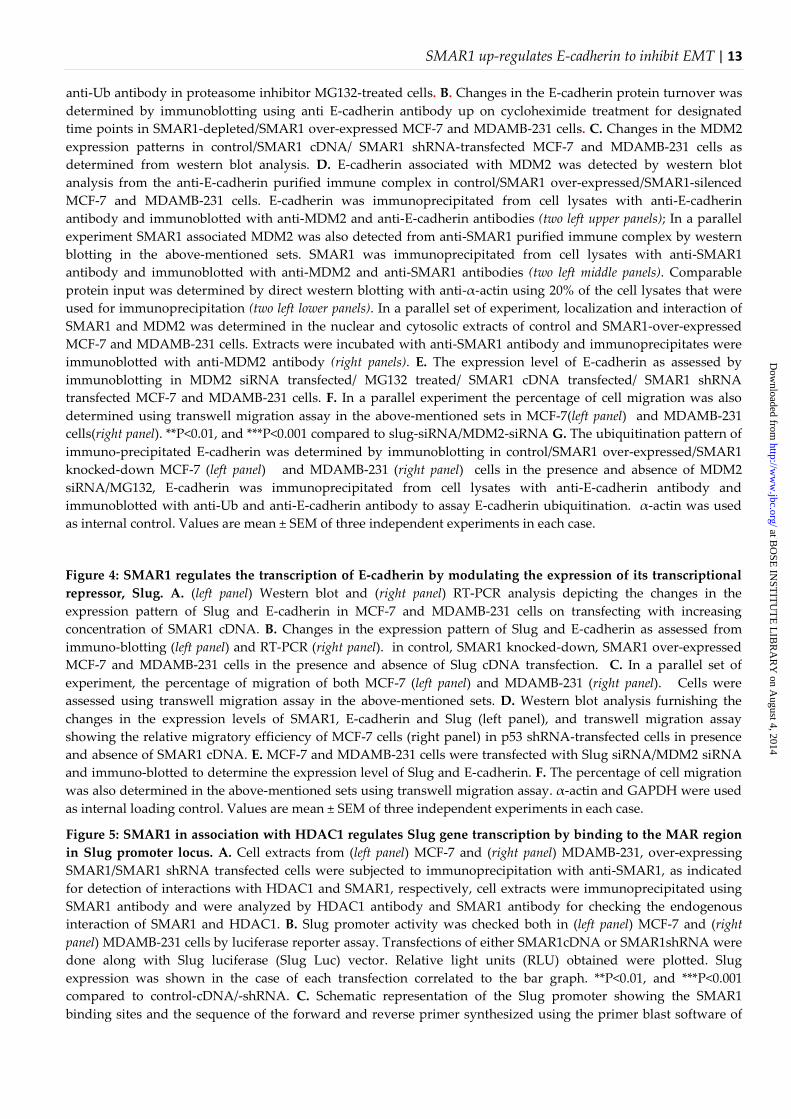
anti-Ub antibody in proteasome inhibitor MG132-treated cells. B. Changes in the E-cadherin protein turnover was determined by immunoblotting using anti E-cadherin antibody up on cycloheximide treatment for designated time points in SMAR1-depleted/SMAR1 over-expressed MCF-7 and MDAMB-231 cells. C. Changes in the MDM2 expression patterns in control/SMAR1 cDNA/ SMAR1 shRNA-transfected MCF-7 and MDAMB-231 cells as determined from western blot analysis. D. E-cadherin associated with MDM2 was detected by western blot analysis from the anti-E-cadherin purified immune complex in control/SMAR1 over-expressed/SMAR1-silenced MCF-7 and MDAMB-231 cells. E-cadherin was immunoprecipitated from cell lysates with anti-E-cadherin antibody and immunoblotted with anti-MDM2 and anti-E-cadherin antibodies (two left upper panels); In a parallel experiment SMAR1 associated MDM2 was also detected from anti-SMAR1 purified immune complex by western blotting in the above-mentioned sets. SMAR1 was immunoprecipitated from cell lysates with anti-SMAR1 antibody and immunoblotted with anti-MDM2 and anti-SMAR1 antibodies (two left middle panels). Comparable protein input was determined by direct western blotting with anti-α-actin using 20% of the cell lysates that were used for immunoprecipitation (two left lower panels). In a parallel set of experiment, localization and interaction of SMAR1 and MDM2 was determined in the nuclear and cytosolic extracts of control and SMAR1-over-expressed MCF-7 and MDAMB-231 cells. Extracts were incubated with anti-SMAR1 antibody and immunoprecipitates were immunoblotted with anti-MDM2 antibody (right panels). E. The expression level of E-cadherin as assessed by immunoblotting in MDM2 siRNA transfected/ MG132 treated/ SMAR1 cDNA transfected/ SMAR1 shRNA transfected MCF-7 and MDAMB-231 cells. F. In a parallel experiment the percentage of cell migration was also determined using transwell migration assay in the above-mentioned sets in MCF-7(left panel) and MDAMB-231 cells(right panel). **P<0.01, and ***P<0.001 compared to slug-siRNA/MDM2-siRNA G. The ubiquitination pattern of immuno-precipitated E-cadherin was determined by immunoblotting in control/SMAR1 over-expressed/SMAR1 knocked-down MCF-7 (left panel) and MDAMB-231 (right panel) cells in the presence and absence of MDM2 siRNA/MG132, E-cadherin was immunoprecipitated from cell lysates with anti-E-cadherin antibody and immunoblotted with anti-Ub and anti-E-cadherin antibody to assay E-cadherin ubiquitination. α-actin was used as internal control. Values are mean ± SEM of three independent experiments in each case.
Figure 4: SMAR1 regulates the transcription of E-cadherin by modulating the expression of its transcriptional repressor, Slug. A. (left panel) Western blot and (right panel) RT-PCR analysis depicting the changes in the expression pattern of Slug and E-cadherin in MCF-7 and MDAMB-231 cells on transfecting with increasing concentration of SMAR1 cDNA. B. Changes in the expression pattern of Slug and E-cadherin as assessed from immuno-blotting (left panel) and RT-PCR (right panel). in control, SMAR1 knocked-down, SMAR1 over-expressed MCF-7 and MDAMB-231 cells in the presence and absence of Slug cDNA transfection. C. In a parallel set of experiment, the percentage of migration of both MCF-7 (left panel) and MDAMB-231 (right panel). Cells were assessed using transwell migration assay in the above-mentioned sets. D. Western blot analysis furnishing the changes in the expression levels of SMAR1, E-cadherin and Slug (left panel), and transwell migration assay showing the relative migratory efficiency of MCF-7 cells (right panel) in p53 shRNA-transfected cells in presence and absence of SMAR1 cDNA. E. MCF-7 and MDAMB-231 cells were transfected with Slug siRNA/MDM2 siRNA and immuno-blotted to determine the expression level of Slug and E-cadherin. F. The percentage of cell migration was also determined in the above-mentioned sets using transwell migration assay. α-actin and GAPDH were used as internal loading control. Values are mean ± SEM of three independent experiments in each case.
Figure 5: SMAR1 in association with HDAC1 regulates Slug gene transcription by binding to the MAR region in Slug promoter locus. A. Cell extracts from (left panel) MCF-7 and (right panel) MDAMB-231, over-expressing SMAR1/SMAR1 shRNA transfected cells were subjected to immunoprecipitation with anti-SMAR1, as indicated for detection of interactions with HDAC1 and SMAR1, respectively, cell extracts were immunoprecipitated using SMAR1 antibody and were analyzed by HDAC1 antibody and SMAR1 antibody for checking the endogenous interaction of SMAR1 and HDAC1. B. Slug promoter activity was checked both in (left panel) MCF-7 and (right panel) MDAMB-231 cells by luciferase reporter assay. Transfections of either SMAR1cDNA or SMAR1shRNA were done along with Slug luciferase (Slug Luc) vector. Relative light units (RLU) obtained were plotted. Slug expression was shown in the case of each transfection correlated to the bar graph. **P<0.01, and ***P<0.001 compared to control-cDNA/-shRNA. C. Schematic representation of the Slug promoter showing the SMAR1 binding sites and the sequence of the forward and reverse primer synthesized using the primer blast software of
at BO
SE IN
STIT
UT
E L
IBR
AR
Y on A
ugust 4, 2014http://w
ww
.jbc.org/D
ownloaded from

SMAR1 up-regulates E-cadherin to inhibit EMT | 14
NCBI against the region -50 to -160bp of the Slug promoter used for CHIP analysis. Chromatin from control, SMAR1 over-expressed and SMAR1 knocked-down MCF-7 and MDAMB-231 cells was immunoprecipitated with SMAR1 and HDAC1 antibodies. PCR amplification was performed on MAR regions of Slug. Parallel immunoprecipitation with control IgG antibody has been shown in the middle panel. The first panel denotes input control.
Figure 6: SMAR1 also inhibits EGF mediated Slug up-regulation to restore E-cadherin expression and regulate cell migration. A. Changes in the E-cadherin, Slug and SMAR1 expression level were assessed by immunoblotting (left panel) MCF-7 and (right panel) MDAMB-231 cell lysates from control and SMAR1 cDNA transfected sets in the presence and absence of EGF treatment. B. Changes in the phospho-tyrosine/-serine pattern of EGFR1/TGFβR1 in EGF-/TGFβ-treated MCF-7 and MDAMB-231 cells within 1h (left panels). SMAR1, E-cadherin and vimentin expression status of EGF-/TGFβ-treated MCF-7 and MDAMB-231 cells at 24h (right panels). C. Fluorescence images depicting the changes in the E-cadherin expression levels in control and SMAR1 over-expressed (left panel)MCF-7 and MDAMB-231 cells with or without EGF treatment; Graphical representation of the fold changes in surface E-cadherin expression in control and SMAR1 over-expressed(right panel) MCF-7 and MDAMB-231 cells with or without EGF treatment. ***P<0.001 compared to control. D. In a parallel experiment the changes in the rate of cell migration was also determined in control and SMAR1 over-expressed (left panel) MCF-7 and (right panel) MDAMB-231 cells with or without EGF treatment using transwell migration assay. α-actin was used as internal loading control. Values are mean ± SEM of three independent experiments in each case. E. MCF-7-Luciferase cells were transduced with either non-silencing lentivirus (Lenti-NS-shRNA) or SMAR1-shRNA lentivirus (Lenti-SMAR1-shRNA ) and injected in to the tail vein of SCID mice. At time zero and at day 21after injection, luciferase substrate D-luciferin was injected intraperitoneally and the metastatic propensity of the cells was determined by imaging the mice using IVS spectrum. BM indicates bone metastasis. F. Graphical representation of the average photon flux (x106p/cm2/s/sr) at time zero and day 21 of Lenti-NS-shRNA- & Lenti-SMAR1-shRNA-transfected MCF-7-Luc cells as injected in to the tail vein of SCID mice. ***P<0.001 compared to control.
Figure 7: Schematic illustration depicting the molecular mechanisms of SMAR1-mediated up-regulation of E cadherin to inhibit EMT.
at BO
SE IN
STIT
UT
E L
IBR
AR
Y on A
ugust 4, 2014http://w
ww
.jbc.org/D
ownloaded from

SMAR1 up-regulates E-cadherin to inhibit EMT | 15
Figure 1
at BO
SE IN
STIT
UT
E L
IBR
AR
Y on A
ugust 4, 2014http://w
ww
.jbc.org/D
ownloaded from

SMAR1 up-regulates E-cadherin to inhibit EMT | 16
Figure 2
at BO
SE IN
STIT
UT
E L
IBR
AR
Y on A
ugust 4, 2014http://w
ww
.jbc.org/D
ownloaded from
SMAR1 up-regulates E-cadherin to inhibit EMT | 17
Figure 3
at BO
SE IN
STIT
UT
E L
IBR
AR
Y on A
ugust 4, 2014http://w
ww
.jbc.org/D
ownloaded from

SMAR1 up-regulates E-cadherin to inhibit EMT | 18
Figure 4
at BO
SE IN
STIT
UT
E L
IBR
AR
Y on A
ugust 4, 2014http://w
ww
.jbc.org/D
ownloaded from

SMAR1 up-regulates E-cadherin to inhibit EMT | 19
Figure 5
at BO
SE IN
STIT
UT
E L
IBR
AR
Y on A
ugust 4, 2014http://w
ww
.jbc.org/D
ownloaded from

SMAR1 up-regulates E-cadherin to inhibit EMT | 20
Figure 6
at BO
SE IN
STIT
UT
E L
IBR
AR
Y on A
ugust 4, 2014http://w
ww
.jbc.org/D
ownloaded from
SMAR1 up-regulates E-cadherin to inhibit EMT | 21
Figure 7
at BO
SE IN
STIT
UT
E L
IBR
AR
Y on A
ugust 4, 2014http://w
ww
.jbc.org/D
ownloaded from