Production and Characterization of Rice Husk Biochar and ...
1
Inherent organic compounds in biochar – their content,
composition and potential toxic effects
Wolfram Bussa, Ondřej Mašeka*, Margaret Grahamb, Dominik Wüstc
a UK Biochar Research Centre, School of Geosciences, University of Edinburgh, Crew Building, Alexander
Crum Brown Road, Edinburgh, EH9 3FF, UK
b School of Geosciences, University of Edinburgh, Crew Building, Alexander Crum Brown Road,
Edinburgh, EH9 3FF, UK
C Institute of Agricultural Engineering, Conversion Technology and Life Cycle Assessment of Renewable
Resources, University of Hohenheim, Garbenstrasse 9, 70599 Stuttgart, Germany
*Correspondence: Ondřej Mašek, tel. 0131 6505095, fax +44 131 662 0478, e-mail:
Abstract
Pyrolysis liquids consist of thermal degradation products of biomass in various
stages of its decomposition. Therefore, if biochar gets affected by re-condensed
pyrolysis liquids it is likely to contain a huge variety of organic compounds. In
this study the chemical composition of such compounds associated with two
contaminated, high-volatile organic compound (VOC) biochars were
investigated and compared with those for a low-VOC biochar. The water-soluble
organic compounds with the highest concentrations in the two high-VOC
biochars were acetic, formic, butyric and propionic acids; methanol, phenol, o-,
m- and p-cresol, and 2,4-dimethylphenol, all with concentrations over 100 µg g-
1. The concentrations of 16 US EPA PAHs determined by 36 h toluene
extractions were 6.09 µg g-1 for the low-VOC biochar. For high-VOC biochar the
total concentrations were 53.42 µg g-1 and 27.89 µg g-1, while concentrations of
water-soluble PAHs ranged from 1.5 - 2 µg g-1. Despite the concentrations of
PAHs exceeding biochar guideline values, it was concluded that, for these
particular biochars, the biggest concern for application to soil would be the co-
occurrence of VOCs such as low molecular weight (LMW) organic acids and
phenols, as these can be highly mobile and have a high potential to cause
phytotoxic effects. Therefore, based on results of this study we strongly suggest
for VOCs to be included among criteria for assessment of biochar quality.
2
Keywords
contaminant; VOC; PAH; re-condensation; pyrolysis; biochar
Abbreviations GC biochar = gas contaminated biochar LC biochar = liquid contaminated biochar NC biochar = non-contaminated biochar VOC = volatile organic compound LMW = low molecular weight HMW = high molecular weight PAH = polycyclic aromatic hydrocarbon BTEX = benzene, toluene, ethylbenzene, and xylenes TEF = toxicity equivalency factors TEQ = toxic equivalents PTE = potentially toxic elements log Koc = logarithm of soil organic carbon-water partitioning coefficient
1 Introduction
It is well known that char from natural forest fires and organic compounds
released from such processes can promote seed germination and plant growth
(Brown and Staden, 1997; Keeley and Pizzorno, 1986). However, negative
effects of compounds generated during forest fires have also been observed
and various organic compounds like phenolics and naphthalene can be
responsible (Nelson et al., 2012). Recent work has shown that biochar, a
carbon-rich material formed from biomass by pyrolysis (a thermochemical
conversion process carried out in the absence of oxygen) can be used to
improve soil properties, to remediate soil contamination and for long-term
carbon storage (Buss et al., 2012; Lehmann and Joseph, 2009). Similar to
natural char, besides positive effects of biochar, negative effects have also
been reported (Bernardo et al., 2010; Buss and Mašek, 2014; Gell et al., 2011;
Kloss et al., 2014; Oleszczuk et al., 2013; Quilliam et al., 2012; Rogovska et al.,
2012; Smith et al., 2013), however, detailed understanding of causes of such
negative effects is yet lacking. The authors have previously shown that pyrolysis
liquids condensed on biochar can have toxic effects on plants (Buss and
3
Mašek, 2014); and this study further investigated the causes of this toxicity
resulting from this contamination pathway.
Contaminants within biochar may present a risk following application to soil,
thus, several studies have determined the total and bioavailable concentrations
of potentially toxic elements (PTE) (e. g. Cd, Cu, Pb, Zn) and polycyclic
aromatic hydrocarbons (PAHs) in biochars from various feedstocks and
produced under various pyrolysis conditions. As low total levels and much lower
levels of bioavailable PAHs and PTEs have generally been detected in
biochars, these are not usually considered as a threat to plants and the
environment (Hale et al., 2012; Singh et al., 2010). Nevertheless, in some
studies, PAHs in biochar were suspected to have been responsible for acute
toxicity to various organisms (Oleszczuk et al., 2013; Rogovska et al., 2012).
During pyrolysis, organic matter is broken down and new compounds are
formed that are either transformed and incorporated into char or are volatilised
and end up in the pyrolysis liquid/gas phases (Antal and Grønli, 2003; Spokas
et al., 2011). Small amounts of compounds with a boiling point lower than the
pyrolysis temperature naturally end up in the solid pyrolysis fraction, depending
on the extent and nature of interaction between pyrolysis gases and solids.
However, re-condensation and trapping in biochar pores are among the
mechanisms responsible for enhancing biochar’s concentration of compounds
that are normally associated with the pyrolysis liquid fraction (Fagernäs et al.,
2012; Spokas et al., 2011). The amount of re-condensation is highly variable
and is related to the design of different pyrolysis units, where influences such
as cold spots can cause vapour re-condensation and a contamination by liquids
(Buss and Mašek, 2014; Gundale and DeLuca, 2006; Spokas et al., 2011). A
huge variety of organic thermal degradation intermediates of various chemical
classes have been found in pyrolysis liquids (Cordella et al., 2012; Sánchez et
al., 2009). Among these are volatile organic compounds (VOCs), e.g. low
molecular weight (LMW) organic acids, alcohols, ketones and phenols (Cordella
et al., 2012). In addition, PAHs have also been reported in pyrolysis liquids and
biochar, in much higher levels in the former than the latter (less than 1% of the
total PAHs produced are present in pyrolysis solids) (Fagernäs et al., 2012).
Although levels of VOCs in biochar show a decrease with a rise in pyrolysis
4
temperature (more volatilization from solid product), the picture for PAHs is
more complex (Fabbri et al., 2013; Hale et al., 2012).
Since there are only a limited number of reported studies on the topic of VOCs
and biochars and to our knowledge no quantitative studies, there is a need to
investigate the composition and concentration of organics sorbed to biochar.
This is especially important since highly varied responses have been reported
for biochar application to soil (Jeffery et al., 2011) and VOCs within the biochar
may be responsible for some of the positive and negative effects that cannot be
explained by factors like nutrients, pH or soil structure improvements (Elad et
al., 2011; Nelson et al., 2012; Spokas et al., 2011).
In the current study, biochars contaminated by a high dose of re-condensed
pyrolysis liquids and gases (high-VOC biochars) were analysed for low
molecular weight (LMW) organics and priority PAHs as potentially toxic
compounds and compared to a low-VOC biochar. These samples represent the
worst-case scenario of uncontrolled pyrolysis and production in poorly designed
or operated pyrolysis units. In a previous study, phytotoxicity of these high-VOC
biochars on cress seeds was already demonstrated and the mechanisms
investigated (Buss and Mašek, 2014). The objectives of this study were to
assess the nature of condensed compounds on biochar, to identify classes of
compounds with the highest potential for adverse impact after soil application
and to explain the toxic effects of this specific set of biochars. The two working
hypotheses behind this research were as follows: a) Re-condensation of
pyrolysis liquids on biochar simultaneously increases concentration of two
classes of organic contaminants, PAHs and VOCs; b) VOCs, not PAHs are
responsible for the main negative effects of biochar affected by pyrolysis liquid
re-condensation.
2 Materials and Methods
2.1 Biochars
All biochar samples were produced from the same feedstock, softwood pellets,
pyrolysed at the same nominal highest treatment temperature of 550°C, with the
5
same mean residence time of 20 min in the same pyrolysis unit. Re-
condensation of pyrolysis liquids and gases on biochar during production led to
two differently contaminated high-VOC biochars, a liquid contaminated (LC)
biochar and a gas contaminated (GC) biochar. Furthermore, one low-VOC, non-
contaminated (NC) biochar was investigated that originated from a production
run with minimal re-condensation. More details about the pyrolysis unit, how the
contamination occurred and the properties of all three biochars can be found in
Buss and Mašek (2014).
2.2 Extractions and analyses
The concentrations stated in this study are not reported on a dry weight basis
due to the high-VOC content of two of the samples. It was not possible to either
remove the biochar moisture content without releasing VOCs or to determine
the moisture content of the samples. The following extractions and analyses
were performed for the NC (low-VOC) biochar and the two high-VOC biochars.
If not stated otherwise the analysis were performed by Northumbrian Water
Scientific Services (Newcastle, United Kingdom), laboratories accredited by
United Kingdom Accreditation Service (UKAS). Validation / quality control of the
analyses are stated in Table S1 as percentage standard deviation of the
concentration of (low, high) standards analysed in replicates.
2.2.1 Total PAH extraction and analysis
The total concentrations of the 16 US EPA PAHs were determined according to
Hilber et al. (2012) by 6 h and 36 h soxhlet extractions using toluene, followed
by a GC-MS analysis (6890 GC plus autosampler and Agilent 5975c MS). Both
extractions were performed to compare the extractability of different PAHs with
time and to compare total PAH levels with literature values based on the same
extraction duration. The limit of detection for PAHs was 0.10 µg g-1.
2.2.2 Water extractable phenols
According to the method of Hildebrand (1979), 5 g solid material was extracted
with 500 mL deionised water (solid-to-liquid ratio of 1:100) for 12 h in a closed
bottle to prevent the loss of volatiles. Instead of using a soxhlet apparatus, a
magnetic stirrer was used since it resulted in higher phenol recoveries and gave
results with lower standard deviations. The mixtures were filtered under vacuum
6
and the LCK 345 phenol index test (Hach, Loveland, Colorado, USA) was used
for analysis of the phenol index in the extracts using a DR5000
Spectrophotometer UV-VIS (Hach, Loveland, Colorado, USA). Furthermore, the
samples were analysed for methylated and chlorinated phenols according to BS
EN 12673:1999 / BS 6068-2.65:1999 (2008) using a Restek Rxi – XLB column
in an Agilent 7890 GC - 5975 C MS. Analyses were performed by EUROFINS
Umwelt West (Wesseling, Germany), accredited laboratory by Germany's
National Accreditation Body (DakkS). Compounds below the detection limit and
phenol index results from a different solid-to-liquid ratio than 1:100 are stated in
Tables S2 and S3.
2.2.3 Water extractable PAHs, organic acids, alcohols and ketones
10 g of biochar was extracted with 100 mL of deionised water (solid-to-liquid
ratio of 1:10) for 24 h on a reciprocal shaker at 150 rpm. Samples were then
vacuum filtered using Whatman No. 1 filter paper.
Water extractable PAHs
Aqueous samples were extracted with dichloromethane and the extracts
analysed for the 16 US EPA PAHs by GC-MS (6890 GC plus autosampler and
Agilent 5975c MS). The detection limit was 0.1 µg L-1 for the extracts, therefore
0.001 µg g-1 for the biochar samples.
Water extractable organic acids
Aqueous samples were analysed by ion-exchange chromatography (KOH
mobile phase, Dionex IonPac® AS15 column) and a conductivity detector
(Dionex DX-320). Acetic, formic, propionic and butyric acid were analysed. The
detection limits for the different compounds are stated in Table S4.
Water extractable alcohols and ketones
Head-space GC-FID (Varian 450-GC-FID with Varian PAL headspace
autosampler) analysis was used for alcohols and ketones (listed in Table 1).
Again the respective detection limits are stated in Table S4.
2.2.4 VOC scan
To identify additional mobile organic compounds, a semi-quantitative scan for a
large series of organic compounds in organic solvent extracts was undertaken.
7
1 g of biochar was extracted with 10 mL of toluene-d8 spiked carbon disulphide
for 1 h and occasionally agitated before injection onto a capillary GC column
(Varian 3900 GC fitted with a Restek RTX-VMS, 20 m, 0.18 mm ID, 1 μm film
column). The extract was analysed by a Varian Saturn 2100 ion trap MS run in
full scan mode.
Compounds were identified from a suit of around 60 VOCs according to NIST
library of mass spectra and the concentrations are approximated from the
response factor of toluene as an internal standard. The detection limit of these
tentatively identified compounds was 20 µg g-1. Compounds below this limit are
not listed in Table 1.
2.3 Data analysis
As described in section above (2.2.2, 2.2.3), the water extractions were
performed using a biochar solid-to-liquid ratio of 1:10 and 1:100. In Buss and
Mašek (2014) the high- and low-VOC biochars were mixed at varying ratios in
sand (Table S5), a fixed amount of water was added and the resulting leachates
were tested on their effect on seed germination. An overview of the theoretical
concentrations of the compounds present in the leachates according to the
solid-to-liquid ratios used can be found in Table S5. For this study it is assumed
that all compounds extracted in both 1:10 and 1:100 ratios were also present in
the leachates. However, since the biochars were not actually extracted in the
germination tests, where the water percolated through the mixture instead, the
levels stated represent a worst-case scenario.
3 Results and Discussion
Three biochars were investigated in this study, one biochar from a regular
pyrolysis run (NC biochar) and two biochars that were contaminated by re-
condensation during pyrolysis (GC and LC biochar). These biochars were
previously characterised by proximate analysis, pH measurements and
phytotoxicity tests (Buss and Mašek, 2014). It was revealed that the NC biochar
was non-toxic while the GC and LC biochars contained a high content of VOCs
and caused adverse effects on seed germination.
8
3.1 Origin, levels and mobility of organic compounds
3.1.1 VOCs
GC and LC biochar were extracted with an organic solvent (carbon disulphide)
followed by a GC-MS analysis which indicated high concentrations of
methylated and ethylated phenols; phenol, 2-methylphenol, 3/4-methylphenol,
3,4-dimethylphenol, 4-ethylphenol and 4-ethyl-3-methylphenol were most
abundant (Table 1). Additionally, for the water extracts of two biochars, the
compounds present at the highest concentrations were acetic acid, methanol,
formic acid, butyric acid, propionic acid, phenol, o-, m-, p- cresol and 2,4-
dimethylphenol, all detected at levels higher than 100 µg g-1 (Table 1). The low-
VOC biochar, on the contrary, didn’t show any of these compounds in
concentrations above 100 µg g-1. Very few studies have dealt with quantitative
determination of the mentioned compounds in biochar. However, a study by
Gundale and DeLuca (2006) detected lower water extractable concentrations of
phenols for wood charcoal (30-40 µg g-1) than observed here. The heavier,
organic fraction of pyrolysis liquids mainly consists of phenol, methylated
phenols and longer chain organic acids (Ogunjobi and Lajide, 2013; Sánchez et
al., 2009) while the lighter aqueous fraction has been shown to contain
compounds such as acetic acid and methanol (Elliott, 1986). All of these
compounds have been identified in this study, indicating that the high VOC-
biochars have been contaminated by both, the organic and aqueous pyrolysis
liquid fractions. In the previous study we have shown that the pHs of the high-
VOC biochars were low (pH 3.64, respectively) (Buss and Mašek, 2014). In the
study of Ogunjobi and Lajide (2013) the organic pyrolysis liquid fraction had a
pH of around 5.3 while the aqueous fraction had a pH of around 3, the latter
explained by high concentrations of LMW organic acids which could be the
same reason for the low pH of our biochars.
Position Table 1
3.1.2 PAHs
As shown in Figure 1, LMW PAHs were most abundant in the high-VOC
biochars investigated in this study. Naphthalene was identified in the highest
concentrations, followed by phenanthrene. These findings are in agreement
9
with other studies on various biochars (Fabbri et al., 2013; Hale et al., 2012;
Hilber et al., 2012). Reported concentrations for total 16 USEPA PAHs
associated with slow pyrolysis biochars vary greatly (<0.1-361 µg g-1) (Fabbri et
al., 2013; Hale et al., 2012; Hilber et al., 2012; Singh et al., 2010), however, the
extraction method has been identified as having a large influence on measured
PAH levels in biochar (Fabbri et al., 2013; Hilber et al., 2012). For this reason,
in this study 6 h and 36 h toluene extractions were performed to assess the
effect of extraction length on the concentration of PAHs extracted. Hale et al.
(2012) investigated over 50 biochars using 6 h soxhlet extraction with toluene,
reporting concentrations between 0.07 and 3.27 µg g-1. These levels are much
lower than the ones for high-VOC biochars contaminated by re-condensation in
this study (29.20 µg g-1 for GC biochar; 16.56 µg g-1 for LC biochar; Table 1) but
in the same range as the low-VOC, NC biochar (0.34 µg g-1). Concentrations of
PAHs for 36 h extraction were 6.09 µg g-1 for NC, 53.42 µg g-1 for GC and 27.89
µg g-1 for LC biochar (Table 1). Again the concentrations of PAHs for GC and
LC biochar in our study revealed to be higher than for most other biochars
extracted for 36 h (1.2-19 µg g-1) (Fabbri et al., 2013) but equivalent to a
miscanthus biochar produced at 750°C (Hilber et al., 2012). Guideline values for
PAHs from the International Biochar Initiative (6-20 µg g-1) are exceeded by
both contaminated biochars, especially the GC biochar, and the NC biochar
levels are just at the lower threshold (International Biochar Initiative, 2013).
The concentrations of PAHs after 6 h extraction then were compared in more
detail with those obtained after 36 h (SI Table 5). The ratio of extractability of 6
h to 36 h varied for the different PAHs between 30-85% (GC biochar) and 50-
95% (LC biochar). This means that some PAHs showed only 30% of the levels
when biochar was extracted for 6 h compared to the levels they showed after 36
h extraction. This not only shows, in agreement with Hilber et al. (2012), a 36 h
extraction is a much more suitable method for extracting the total PAHs content
of biochar, but it also shows the dissimilarity in PAH extractability in the two
high-VOC biochars. No relationship was identified between extractability and
molecular weight of the PAHs, with some high molecular weight (HMW) PAHs
having similar levels with 6 h and 36 h extraction (Table S6).
10
Although the concentration of water extractable PAHs for NC biochar was below
the analytical detection limit, the values were 1.62 and 2.04 µg g-1 for the GC
and LC biochars, respectively (Table 1). Although not directly comparable,
these concentrations are around 1000 times higher than the levels of PAHs
sorbed to passive samplers in a study by Hale et al. (2012) (~2 ng g-1). Also,
while the proportion of PAHs determined by passive samplers relative to total
PAHs (6 h toluene extraction) was around 0.05% in that study (Hale et al.,
2012), in this work the ratio of water extractable to 6 h toluene extraction was as
much as 5.5% and 12.3% for the GC and LC biochars, respectively (data not
shown). This shows that contamination with re-condensing liquids results in
higher availability of the PAHs deposited onto the biochar surfaces (Table S5).
In addition, contamination by re-condensation also resulted in unexpected
patterns in extractability of different PAHs. As HMW PAHs have a higher soil
organic carbon-water partitioning coefficient (log Koc), they are less soluble in
water and more extensively attach to organic surfaces than LMW PAHs (Table
S6). Despite this, the percentage of water extractable fraction of total
concentration of individual PAHs in this study did not simply decrease with
increasing molecular weight. For example, several 5- and 6-ring PAHs showed
similar or slightly greater water extractability than naphthalene. This may be an
artefact of the analysis as the results for water and solvent extraction both
turned out to be very close to the detection limit of the measurement equipment.
But as the varying extractability of 6 h compared to 36 h for the individual PAHs
described above, it could also signal a different distribution and therefore
availability of different PAHs in the porous biochar structure. Due to the external
nature of contamination (from gas phase surrounding biochar particles), the
distribution of PAHs within biochar would be determined by their ability to
diffuse into the porous structure, and therefore the HMW PAHs could potentially
be closer to the particle surface and therefore be more readily available. To
understand these results further, additional investigations such as surface and
pore analysis of biochar to physically locate PAH sorption sites and to link this
to PAH properties are needed. However this was beyond the scope of this study
and will be considered in future work. The log Koc does, however, explain the
very high water extractability of acenaphthylene (24% GC biochar, 61% LC
biochar) (Table S6). This shows that acenaphthylene in biochar should be
11
monitored more closely due to its high mobility as this makes it a potential
compound to leach into groundwater.
Position Figure 1
3.2 Phytotoxic potential of analysed contaminants
In our previous study (Buss and Mašek, 2014) we showed that cress seeds
were strongly inhibited by a 5% high-VOC biochar/sand-composite, exposed to
a leachate from this mixture and by vapours of pure biochar. We concluded that
the inhibition was caused by toxic compounds but we couldn’t pin-point
specifically which compounds were responsible for the effects. However, the
analyses in this study enables us to link the detected concentrations in water
extracts (Table 1) to the biochar-sand leachates in the germination test in the
previous study (Buss and Mašek, 2014) (Table S5) (further explanation section
2.3). This was done to discuss the toxicity of the individual compounds in the
investigated leachates and to be able to relate the levels to literature values and
generally identify which compound class in the concentrations detected here
has the highest potential to cause adverse effects as observed in Buss and
Mašek (2014). Thus, in the following, levels for 5% biochar treatment refers to
the calculated concentrations in the 5% biochar/sand leachate that showed
toxic effects in the previous study.
3.2.1 Phytotoxic potential of VOCs: phenols, organic acids and alcohols
Related to the 5% biochar treatment (explanation beginning 3.2), the
concentrations of phenol were 13.6 mg L-1 (GC biochar) and 22.4 mg L-1 (LC
biochar) and the concentrations for o-cresol 17.1 mg L-1 (GC biochar) and 27.1
mg L-1 (LC biochar) as two typical compounds of the class of ‘phenols’ (Table
S5). In a study by Feng et al. (1996) the inhibition of root elongation by phenols
was tested in Chinese cabbage. Effective concentration for 50% reduction
(EC50) of roots for phenol was 125.6 mg L-1 and for o-cresol 54.9 mg L-1. In
Bargmann et al. (2013) Lepidium sativum was used as the test organism and
only 60 mg L-1 phenol was applied, which did not negatively affect germination
and root elongation. However, the data above show that individual phenols
present in concentrations slightly higher than those calculated for the highly
toxic leachate in Buss and Mašek (2014) caused inhibitory effects on seed
12
germination and plant growth in other studies. Taking into account that the
extracts from the biochars in this study contain a mixture of various phenols, it is
very likely that they pose a serious threat to plant growth and were at least
partly responsible for the phytotoxic effects observed in our previous study
(Buss and Mašek, 2014). An aqueous leachate from a char produced by
pyrolysis of waste performed in a closed container, allowing direct contact of
pyrolysis solids with liquids and gases, showed a complex mixture of benzene,
toluene, ethylbenzene, and xylenes (BTEX), and methylated phenols in similar
concentrations to those detected in this study (Bernardo et al., 2010). The
eluate was toxic to bioluminescent bacteria (Vibrio fischeri) which suggests the
detrimental effects of compounds emanating from the char probably originated
from the pyrolysis liquids. However, after washing with an organic solvent
(dichloromethane), to remove aromatics like phenols and BTEX, a water extract
from this char still demonstrated toxic effects. This indicates that compounds
insoluble in organic solvents, such as LMW organic acids and alcohols, were
responsible for a significant part of the observed growth inhibition (Bernardo et
al., 2010).
The concentrations of formic-, acetic-, propionic- and butyric acid in the 5% LC
biochar treatment were 35.7, 52.2, 18.6 and 10.7 mg L-1, respectively (Table
S5). These levels are only slightly lower than the individual concentrations
reported to have caused toxic effects to plants in various other studies (Lynch,
1980; Rao and Mikkelsen, 1977). Acetic acid, for example, inhibited growth as
follows; 25% inhibition of root extension at 300 mg L-1 (Lynch, 1980) and 60 mg
L-1 significant reduction of root growth in rice seedlings (Rao and Mikkelsen,
1977). 1600 mg L-1 acetic acid caused impediment of root length of Lepidium
sativum but had no effect on germination (Bargmann et al., 2013). However, as
discussed for phenols above, besides acetic acid, various other potentially toxic
organic acids were present in the water extracts and thus, in the leachates in
our previous study (Buss and Mašek, 2014) and as such, the phytotoxic
influences of the different compounds are expected to accumulate. Generally,
the adverse effects of LMW organic acids have been reported to increase with
increasing number of carbon atoms (Lynch, 1980). But more importantly, the pH
of the solution/soil influences the toxicity of the acids investigated (Lynch, 1980;
13
Rao and Mikkelsen, 1977). Stronger effects were seen at lower pH as a larger
fraction of the acids were present in their undissociated form, which is more
toxic (Rao and Mikkelsen, 1977). This is important to note as the pH of the high-
VOC biochars (determined in the previous study) was 3.64 (Buss and Mašek,
2014) and as indicated in Table 1 all of the acetate in the water extracts was
indeed present as acetic acid, thus, undissociated. Furthermore, not only might
the organic acids be directly responsible for toxicity but the low pH itself, caused
by the above mentioned LMW organic acids and other acids, could have at
least partly contributed to the inhibition.
The concentrations of alcohols and ketones identified in water extracts were
mostly below detection limits, with the exceptions of ethanol and methanol,
which related to the 5% biochar treatment were present in concentrations of
less than 30 mg L-1 (SI Table 4). Toxic concentrations of these compounds
reported in the literature are much higher; around 2000 mg L-1 for ethanol and
8000 mg L-1 for methanol resulted in delayed germination of Euphorbia
heterophylla after 24 h (Kern et al., 2009). Even these effects proved to be
short-term only. There are many other compounds, especially aromatic
compounds, that are also typical products of thermal degradation of biomass
that show partially toxic effects in similar concentrations as the phenols reported
above (Lynch, 1980). Yet, due to the vast quantities of compounds present, not
all could be analysed in detail in this study.
To summarize, individual VOCs have been shown to cause phytotoxic effects at
concentrations not much greater than the concentrations detected in this study.
Furthermore, the boiling points of the above discussed compounds are below
200°C and they can be considered as volatile (Dreisbach and Shrader, 1949).
Taken their mobility into account, all in all, this suggests that the complex
mixture of LMW organic acids and phenols detected are very likely to cause
phytotoxic effects and have caused the acute toxic effects of biochar, biochar
leachate and vapours from biochar revealed in our previous study (Buss and
Mašek, 2014). Although the effects of VOCs are likely to be short-lived due to
their degradability and natural volatility it is important to measure their
concentration in biochar. In order to analyse and monitor concentrations the BS
EN ISO 16703:2011 (2011) method could be used, but strong odour and a low

14
pH of the biochars after production can also be used as a likely indicator of high
concentrations of condensed pyrolysis vapours.
3.2.2 Phytotoxic potential of PAHs
PAHs effects in solution
As done for VOCs, the water extractable amounts of PAHs in the biochars were
compared with the treatments in Buss and Mašek (2014). In the 5% LC biochar
treatment (explanation beginning 3.2) naphthalene (2 rings) was found at levels
of 32.9 µg L-1, phenanthrene (3 rings) at 20.7 µg L-1, chrysene (4 rings) at 2.0 µg
L-1 and benzo(a)pyrene (5 rings) at 2.4 µg L-1 (Table S5). The concentrations of
naphthalene and phenanthrene are around 900 times and 60 times lower than
the maximum possible, based on their water solubilities, respectively, whereas
the concentrations of chrysene and benzo(a)pyrene are in the same range
(maximum water soluble concentrations: naphthalene 30,000 µg L-1,
phenanthrene 1,200 µg L-1, chrysene 2.8 µg L-1, benzo(a)pyrene 2.3 µg L-1,
Table S6). In the work of Loibner et al. (2004) the effects of saturated aqueous
solutions of each of the 16 US EPA PAHs were tested on bioluminescence of
Vibrio fischeri individually. It was discovered that only 2 and 3 aromatic ring
PAHs inhibited bioluminescence, whereas HMW PAHs did not show any toxicity
(Loibner et al., 2004). Henner et al. (1999) also studied the influence of
maximum water soluble amounts of each individual PAH on germination of
several plant species in petri dishes. They found that naphthalene and
phenanthrene delayed germination by 24 h but after 5 days the germination rate
of the affected seeds was the same as the control. For chrysene and
benzo(a)pyrene no toxicity was reported for concentration very similar as
detected in this study (maximum water soluble concentrations).
Overall, it becomes clear that only LMW PAHs, when present in levels close to
their maximum soluble levels, cause negative effects on seed germination due
to their higher solubility in water. The concentrations of PAHs in water extracts
in the high-VOC biochars were exceptionally high for biochar (the NC biochar
taken as a reference for a typical concentration of PAHs) but still far below the
reported toxic concentrations of each individual PAH (Table S5 and Figure 1).
Additionally, in another study it has been shown that the effect of PAH mixtures
15
proved to be cumulative and not synergistic (or antagonistic) (Loibner et al.,
2004). All in all, this shows that phytotoxic influences of high-VOC biochar
leachates (as shown in Buss and Mašek (2014) on seed germination) are very
unlikely to be related to PAHs.
PAHs effects in soil
Total concentrations of PAHs as depicted in Figure 1 and Table 1 were 53.42
µg g-1 for GC biochar and 27.89 µg g-1 for LC biochar. These levels are above
concentrations that are reported to have caused toxic effects in soil.
Somtrakoon and Chouychai (2013) identified negative impacts on sweet corn
seed germination in soil that had been freshly contaminated with 2 µg g-1 of
anthracene, fluorene or fluoranthene (Somtrakoon and Chouychai, 2013).
These concentrations are mostly exceeded by the high-VOC biochars in this
study (Figure 1). It seems that solid material contaminated with PAHs exhibits a
higher potential to cause adverse effects in plants than PAH-containing
solutions. PAHs are mostly hydrophobic and have high Koc’s (Marchal et al.,
2014; US Department of Health and Human Services, 1995); this means high
levels of PAHs can accumulate on/in organic material. However, to cause
negative effects in plants, PAHs must be able to interact with the plant, which is
not possible when they are strongly attached to soil organic matter. Uptake of
dissolved compounds via soil solution and gaseous uptake via leaves and
shoots are the two mechanisms by which toxic compound can affect plants (US
Department of Health and Human Services, 1995), thus, solubility in water and
volatility are the main factors that determine plant uptake. Consequently, LMW
PAHs are more likely to gain access to plants to cause adverse effects
(Somtrakoon and Chouychai, 2013). Yet, besides these two mechanisms PAHs
can be adsorbed onto root surfaces as plant tissue is organic matter (Marchal et
al., 2014). It has been shown that after washing of roots, the overall PAH
concentration of the root tissue decreased, indicating an association of PAHs
with root surfaces (Vácha et al., 2010). Due to their low water solubility, HMW
PAHs do not cause toxic effects in solution (Loibner et al., 2004), still, an
accumulation in soil and adsorption to roots (high log Koc) poses a risk.
On the other hand, in Lors et al. (2010), coal-tar contaminated soil after 6 month
of biotreatment still showing concentrations of 345 mg kg-1 (mainly 4-ring) PAHs
16
didn’t cause phytotoxic effects (on Lactuca sativa). This could indicate that
PAHs ready to interact with living organisms had been degraded and only
PAHs, that associated with soil particles very strongly, remained which didn’t
affect the plants. However, it could also have been the case that the PAH
concentration was too low to cause toxic effects in this plant species as the
negative effects of PAHs reported in soil vary strongly depending on the plant
tested. One species (waxy corn) didn’t even show germination inhibition when
exposed to concentrations of individual PAHs as high as 400 µg g-1
(Somtrakoon and Chouychai, 2013). Oleszczuk et al. (2014) showed root
growth of Lepidium sativum was inhibited by different soils contaminated with
varying PAH concentrations of up to 100 µg g-1. However, in the same study a
soil sample with less than 0.5 µg g-1 PAHs showed even higher toxicity than the
100 µg g-1 sample, indicating that contaminants other than PAHs in the soil were
responsible for the observed effects. All this shows how complex the topic of
PAH toxicity in soil is and gives an indication of the magnitude of complexity of
PAH effects in (even less well investigated) biochar.
PAHs effects in biochar
As a result of the cause of contamination by re-condensation, PAH
concentrations in the high-VOC biochars are high and PAHs are rather loosely
sorbed to biochar surfaces which makes them more readily available (high
concentrations in water extracts). Despite this, naphthalene is the only PAH that
has been detected in the head-space above PAH contaminated sites (Henner et
al., 1999) and thus, is the only one that can be considered volatile, under
environmental conditions. Taking into account the low toxicity of naphthalene
(Henner et al., 1999; Loibner et al., 2004), it seems highly unlikely that PAHs
are causing toxic effects in the vapour phase. Furthermore, maximum soluble
amounts of PAHs in water are not considered to be a concern to plants. Since
the total and available PAH concentrations in these high-VOC samples are
already worst-case scenarios, leachates from biochars from a pyrolysis run
without re-condensation are even much less likely to pose any threat to plants.
However, the acute, short-term toxic effects caused by direct contact with the
contaminated biochars described in Buss and Mašek (2014) may have been
caused in part by PAHs when the high concentrations observed and the fact
17
that mixtures of PAHs already influence plants negatively in µg g-1 levels in soil
are taken into account. But generally, it is difficult to transfer the conclusions of
PAH toxicity in artificially contaminated soils to PAHs in biochar. One reason for
this is that biochars sorb PAHs much stronger than soil, and this is why biochar
can be used for remediation of PAH contaminated soils (Chen and Yuan, 2011).
Secondly, the reason for the observed low availability and strong attachment of
PAHs in biochar after pyrolysis (Hale et al., 2012) is probably not only the high
sorption capacity of biochar, but also attributed to the fact that weaker attached
PAHs vaporise during the pyrolysis process (at least if they are not
contaminated by re-condensed pyrolysis liquids). As discussed for soil above
this removal of available PAHs might only leave very inactive PAHs behind that
even if present in high concentrations don’t pose a threat to plants (Lors et al.,
2010). Furthermore, the largest component of total levels of PAHs in biochar
has been shown to be allocated to naphthalene which is mobile but little toxic
(Fabbri et al., 2013; Hilber et al., 2012). This shows that total levels of PAHs are
not necessarily a good indicator for potential adverse effects but rather the
individual PAH concentrations need to be taken into account. Koltowski and
Oleszczuk (2015) demonstrated toxic effects of biochars but they weren’t able
to correlate PAH concentrations in (heat-treated) biochars to shoot and root
inhibition of Lepidium sativum. In Busch et al. (2013) it was shown that a
biochar with similar PAH concentration as in this study (62.7 µg g-1 (Hilber et al.,
2012)) did not result in any negative influences on germination or biomass
weight of Brassica rapa and Zea mays even in levels of 10% in soil, supporting
the hypothesis of little concern of high PAH concentration in biochar regarding
short-term, acute plant effects.
Long-term PAH effects
However, since PAHs also have mutagenic properties, thus, could be a long-
term risk, to conclude the potential negative influences of PAHs in the high-VOC
biochars this topic is shortly discussed here. In the study of Busch et al. (2013),
despite no visible influences on plant growth, biochar increased DNA damage in
pollen cells. Nevertheless, it could not be proven that these effects were due to
the presence of PAHs. Anjum et al. (2014) conducted a study using hemp and
wood biochar (batch unit, 500°C, 30 min residence time) both with similar
18
concentrations of PAHs, but hemp biochar contained higher concentrations of
LMW PAHs. Significant higher mutagenic effects were observed in the hemp
biochar treatments compared to the wood biochar and it was concluded that this
was due to the higher concentration of LMW PAHs. However, LMW PAHs have
been reported to have lower mutagenic potential (Nisbet and LaGoy, 1992),
thus, using the toxicity equivalency factors (TEF) to calculate the toxic
equivalents (TEQ) of the PAH levels compared to benzo(a)pyrene, hemp
biochar turns out to have 0.22 benzo(a)pyrene-TEQ and wood biochar a 2.5
fold higher value of 0.55 benzo(a)pyrene-TEQ. But it needs to be mentioned
that the TEFs were derived from toxicological and not plant studies, and might
differ for plants. Still, this shows that no correlation of TEQ and mutagenic effect
exists and it seems very unlikely that PAHs were responsible for the effects in
that study. Interestingly, the phenol concentrations in the more mutagenic hemp
biochar were much higher (55 µg g-1) than phenols in the wood biochar (8.3 µg
g-1), indicating that phenols and other VOCs might have caused these effects
instead.
3.3 VOCs vs. PAHs – Relevance in environmental samples
In the above discussion it was concluded that due to the concentrations, toxicity
and mobility of individual organics, in these specific biochars, VOCs pose a
greater concern for plant growth than PAHs. The concentrations of both
compound classes are likely to be exaggerated by the nature of these specific
biochars, however, it clearly demonstrates that even in biochar with lower
concentrations of organic contaminants, VOCs are likely to play a significant
role, and that these compounds can help to explain previous observations
reported in literature.
In their work, Eom et al. (2007), Manzo et al. (2008) and Oleszczuk et al. (2014)
all investigated soils contaminated with PAHs and in all of these studies the
authors concluded that observed toxicity (mostly) could not be correlated with
PAH concentrations and the adverse effects were rather caused by non-PAH
compounds. Loibner et al. (2004) showed that in leachates from soil
contaminated with PAHs by gasification and incineration processes
contaminants other than PAHs, were responsible for inhibition of Vibrio fischeri.
19
It shows that in soils compounds co-occurring with PAHs can be a greater risk
than PAHs themselves. We have now shown that this can be the case for
biochar as well.
Among the products of pyrolysis, PAHs tend to concentrate in pyrolysis liquids.
Therefore, if as a result of the design or operation of a pyrolysis unit, biochar is
extensively exposed to pyrolysis vapours, or condensing liquids, it is likely to be
heavily contaminated with PAHs, as well as VOCs. Therefore, our hypothesis is
that if biochar contains high amounts of PAHs, it often is a result of
contamination by re-condensed pyrolysis vapours and consequently, such
biochars if fresh would contain high amounts of VOCs in addition to the PAHs
originating from pyrolysis liquids. This hypothesis holds true for the biochars in
the current study, but needs to be proven for other biochars. Furthermore, if this
can be confirmed, it means that not only high concentrations of VOCs but
potentially also high concentrations of PAHs can originate from contamination
that is easily preventable (e.g. cold spots in the pyrolysis unit). Overall, VOCs in
biochar are much more likely to be responsible for phytotoxic effects observed
in other biochar studies than PAHs. This is supported by the fact that in longer-
term studies observed negative influence of fresh biochar showed to be short-
lived only, which could be a result of VOCs in biochar naturally dispersing with
time (Gell et al., 2011; Kloss et al., 2014; Quilliam et al., 2012). Similarly, it has
been reported that many of the biochars showing adverse influences had a low
pH value (Bernardo et al., 2010; Gell et al., 2011; Oleszczuk et al., 2013; Smith
et al., 2013) which could be related to LMW organic acids and other acids from
pyrolysis liquids.
4 Conclusion
Results of this research showed that certain VOCs co-occurring with PAHs
have been identified as a bigger threat to plants than PAHs. Water extractable
organic compounds (especially LMW organic acids and phenols) have been
found in biochars contaminated by re-condensed pyrolysis vapours in
concentrations that can cause phytotoxic effects. On the other hand,
concentrations in biochar with minimum if any pyrolysis liquid contamination
were mostly below detection limits. In general, the concentration of VOCs in
20
biochar could be a good indicator for potential phytotoxic effects. This is an
important finding providing strong evidence based on which VOCs content in
biochar should be included among criteria for quality assessment of biochar,
and in biochar guidelines.
5 Acknowledgments
This research was supported by the Scottish Funding Council (SFC) (SRDG
Ref: HR08004 Carbon Capture from Power Plant and Atmosphere). In addition,
Wolfram Buss would like to acknowledge the financial support for his PhD
provided by Derek and Maureen Moss and thank Jessica Shepherd, Oliver
Buss, Kyle Crombie and Aditya Parmar for their help on this manuscript.
6 References
Anjum, R., Krakat, N., Toufiq Reza, M., Klocke, M., 2014. Assessment of mutagenic potential of pyrolysis biochars by Ames Salmonella/mammalian-microsomal mutagenicity test. Ecotoxicol. Environ. Saf. 107, 306–312. doi:10.1016/j.ecoenv.2014.06.005
Antal, M.J., Grønli, M., 2003. The art, science, and technology of charcoal production. Ind. Eng. Chem. Res. 42, 1619–1640. doi:10.1021/ie0207919
Bargmann, I., Rillig, M.C., Buss, W., Kruse, A., Kuecke, M., 2013. Hydrochar and biochar effects on germination of spring barley. J. Agron. Crop Sci. 199, 360–373. doi:10.1111/jac.12024
Bernardo, M., Lapa, N., Gonçalves, M., Barbosa, R., Mendes, B., Pinto, F., Gulyurtlu, I., 2010. Toxicity of char residues produced in the co-pyrolysis of different wastes. Waste Manage. 30, 628–635. doi:10.1016/j.wasman.2009.10.015
Brown, N.A.C., Staden, J. Van, 1997. Smoke as a germination cue: a review. Plant Growth Regul. 22, 115–124.
BS EN 12673:1999 / BS 6068-2.65:1999, 2008. Water quality - Gas chromatographic determination of some selected chlorophenols in water.
BS EN ISO 16703:2011, 2011. Soil quality — Determination of content of hydrocarbon in the range C 10 to C 40 by gas chromatography.
21
Busch, D., Stark, A., Kammann, C.I., Glaser, B., 2013. Genotoxic and phytotoxic risk assessment of fresh and treated hydrochar from hydrothermal carbonization compared to biochar from pyrolysis. Ecotoxicol. Environ. Saf. 97, 59–66. doi:10.1016/j.ecoenv.2013.07.003
Buss, W., Kammann, C., Koyro, H.-W., 2012. Biochar reduces copper toxicity in Chenopodium quinoa Willd. in a sandy soil. J. Environ. Qual. 41, 1157–1165. doi:10.2134/jeq2011.0022
Buss, W., Mašek, O., 2014. Mobile organic compounds in biochar - a potential source of contamination - phytotoxic effects on cress seed (Lepidium sativum) germination. J. Environ. Manage. 137, 111–9. doi:10.1016/j.jenvman.2014.01.045
Chen, B., Yuan, M., 2011. Enhanced sorption of polycyclic aromatic hydrocarbons by soil amended with biochar. J. Soils Sediments 11, 62–71. doi:10.1007/s11368-010-0266-7
Cordella, M., Torri, C., Adamiano, A., Fabbri, D., Barontini, F., Cozzani, V., 2012. Bio-oils from biomass slow pyrolysis: a chemical and toxicological screening. J. Hazard. Mater. 231-232, 26–35. doi:10.1016/j.jhazmat.2012.06.030
Dreisbach, R.R., Shrader, S.A., 1949. Vapor pressure–temperature data on some organic compounds. Ind. Eng. Chem. 41, 2879–2880. doi:10.1021/ie50480a054
Elad, Y., Cytryn, E., Harel, Y.M., Lew, B., Graber, E.R., 2011. The Biochar Effect: plant resistance to biotic stresses. Phytopathol. Mediterr. 50, 335–349.
Elliott, D.C., 1986. Analysis and comparison of biomass pyrolysis/gasification condensates - final report. Richland, Washington.
Eom, I.C., Rast, C., Veber, a M., Vasseur, P., 2007. Ecotoxicity of a polycyclic aromatic hydrocarbon (PAH)-contaminated soil. Ecotoxicol. Environ. Saf. 67, 190–205. doi:10.1016/j.ecoenv.2006.12.020
Fabbri, D., Rombolà, A.G., Torri, C., Spokas, K.A., 2013. Determination of polycyclic aromatic hydrocarbons in biochar and biochar amended soil. J. Anal. Appl. Pyrolysis 103, 60–67. doi:10.1016/j.jaap.2012.10.003
Fagernäs, L., Kuoppala, E., Simell, P., 2012. Polycyclic aromatic hydrocarbons in birch wood slow pyrolysis products. Energy Fuels 26, 6960–6970. doi:10.1021/ef2018836
Feng, L., Wang, L., Zhao, Y., Song, B., 1996. Effects of substituted anilines and phenols on root elongation of cabbage seed. Chemosphere 32, 1575–1583. doi:10.1016/0045-6535(96)00067-7
22
Gell, K., van Groenigen, J., Cayuela, M.L., 2011. Residues of bioenergy production chains as soil amendments: immediate and temporal phytotoxicity. J. Hazard. Mater. 186, 2017–2025. doi:10.1016/j.jhazmat.2010.12.105
Gundale, M.J., DeLuca, T.H., 2006. Charcoal effects on soil solution chemistry and growth of Koeleria macrantha in the ponderosa pine/Douglas-fir ecosystem. Biol. Fertil. Soils 43, 303–311. doi:10.1007/s00374-006-0106-5
Hale, S.E., Lehmann, J., Rutherford, D., Zimmerman, A.R., Bachmann, R.T., Shitumbanuma, V., O’Toole, A., Sundqvist, K.L., Arp, H.P.H., Cornelissen, G., 2012. Quantifying the total and bioavailable polycyclic aromatic hydrocarbons and dioxins in biochars. Environ. Sci. Technol. 46, 2830–2838. doi:10.1021/es203984k
Henner, P., Schiavon, M., Druelle, V., Lichtfouse, E., 1999. Phytotoxicity of ancient gaswork soils. Effect of polycyclic aromatic hydrocarbons (PAHs) on plant germination. Org. Geochem. 30, 963–969. doi:10.1016/S0146-6380(99)00080-7
Hilber, I., Blum, F., Leifeld, J., Schmidt, H.-P., Bucheli, T.D., 2012. Quantitative determination of PAHs in biochar: a prerequisite to ensure its quality and safe application. J. Agric. Food Chem. 60, 3042–3050. doi:10.1021/jf205278v
Hildebrand, E.E., 1979. Erfassung und Charakterisierung von Polyphenolen als potentiellen Wuchshemmstoffen in kompostierten Siedlungsabfällen. Mitteilung der Dtsch. Bodenkundlichen Gesellschaft 29, 609–622.
International Biochar Initiative, 2013. Standardized product definition and product testing guidelines for biochar that is used in soil, v. 1.1.
Jeffery, S., Verheijen, F.G.A., van der Velde, M., Bastos, A.C., 2011. A quantitative review of the effects of biochar application to soils on crop productivity using meta-analysis. Agric., Ecosyst. Environ. 144, 175–187. doi:10.1016/j.agee.2011.08.015
Keeley, S.C., Pizzorno, M., 1986. Charred Wood Stimulated Germination of Two Fire-Following Herbs of the California Chaparral and the Role of Hemicellulose. Am. J. Bot. 73, 1289–1297.
Kern, K.A., Pergo, E.M., Kagami, F.L., Arraes, L.S., Sert, M.A., Ishii-Iwamoto, E.L., 2009. The phytotoxic effect of exogenous ethanol on Euphorbia heterophylla L. Plant Physiol. Biochem. 47, 1095–1101. doi:10.1016/j.plaphy.2009.07.002
Kloss, S., Zehetner, F., Wimmer, B., Buecker, J., Rempt, F., Soja, G., 2014. Biochar application to temperate soils: Effects on soil fertility and crop growth under greenhouse conditions. J. Plant Nutr. Soil Sci. 177, 3–15. doi:10.1002/jpln.201200282
23
Kołtowski, M., Oleszczuk, P., 2015. Toxicity of biochars after polycyclic aromatic hydrocarbons removal by thermal treatment. Ecol. Eng. 75, 79–85. doi:10.1016/j.ecoleng.2014.11.004
Lehmann, J., Joseph, S., 2009. Biochar for Environmental Management: Science and Technology, Biochar for Environmental Management: Science and Technology. Earthscan Ltd., London.
Loibner, A.P., Szolar, O.H.J., Braun, R., Hirmann, D., 2004. Toxicity testing of 16 priority polycyclic aromatic hydrocarbons using Lumistox. Environ. Toxicol. Chem. 23, 557–564. doi:10.1897/03-59
Lors, C., Ponge, J.-F., Martínez Aldaya, M., Damidot, D., 2010. Comparison of solid-phase bioassays and ecoscores to evaluate the toxicity of contaminated soils. Environ. Pollut. 158, 2640–7. doi:10.1016/j.envpol.2010.05.005
Lynch, J.M., 1980. Effects of organic acids on the germination of seeds and growth of seedlings. Plant, Cell Environ. 3, 255–259. doi:10.1111/1365-3040.ep11581824
Manzo, S., De Nicola, F., De Luca Picione, F., Maisto, G., Alfani, A., 2008. Assessment of the effects of soil PAH accumulation by a battery of ecotoxicological tests. Chemosphere 71, 1937–1944. doi:10.1016/j.chemosphere.2007.12.026
Marchal, G., Smith, K.E.C., Mayer, P., Wollesen de Jonge, L., Karlson, U.G., 2014. Impact of soil amendments and the plant rhizosphere on PAH behaviour in soil. Environ. Pollut. 188, 124–31. doi:10.1016/j.envpol.2014.02.008
Nelson, D.C., Flematti, G.R., Ghisalberti, E.L., Dixon, K.W., Smith, S.M., 2012. Regulation of seed germination and seedling growth by chemical signals from burning vegetation. Annu. Rev. Plant Biol. 63, 107–30. doi:10.1146/annurev-arplant-042811-105545
Nisbet, I.C., LaGoy, P.K., 1992. Toxic equivalency factors (TEFs) for polycyclic aromatic hydrocarbons (PAHs). Regul. Toxicol. Pharmacol. 16, 290–300. doi:10.1016/0273-2300(92)90009-X
Ogunjobi, J.K., Lajide, L., 2013. Characterisation of bio-oil and bio-char from slow-pyrolysed Nigerian yellow and white corn cobs. J. Sustain. Energy Environ. 4, 77–84.
Oleszczuk, P., Jośko, I., Kuśmierz, M., 2013. Biochar properties regarding to contaminants content and ecotoxicological assessment. J. Hazard. Mater. 260, 375–382. doi:10.1016/j.jhazmat.2013.05.044
Oleszczuk, P., Jośko, I., Kuśmierz, M., Futa, B., Wielgosz, E., Ligęza, S., Pranagal, J., 2014. Microbiological, biochemical and ecotoxicological
24
evaluation of soils in the area of biochar production in relation to polycyclic aromatic hydrocarbon content. Geoderma 213, 502–511. doi:10.1016/j.geoderma.2013.08.027
Quilliam, R.S., Marsden, K.A., Gertler, C., Rousk, J., DeLuca, T.H., Jones, D.L., 2012. Nutrient dynamics, microbial growth and weed emergence in biochar amended soil are influenced by time since application and reapplication rate. Agric., Ecosyst. Environ. 158, 192–199. doi:10.1016/j.agee.2012.06.011
Rao, D.N., Mikkelsen, D.S., 1977. Effects of acetic, propionic, and butyric acids on rice seedling growth and nutrition. Plant Soil 47, 323–334. doi:10.1007/BF00011491
Rogovska, N., Laird, D., Cruse, R.M., Trabue, S., Heaton, E., 2012. Germination tests for assessing biochar quality. J. Environ. Qual. 41, 1014–1022. doi:10.2134/jeq2011.0103
Sánchez, M.E., Menéndez, J. a., Domínguez, A., Pis, J.J., Martínez, O., Calvo, L.F., Bernad, P.L., 2009. Effect of pyrolysis temperature on the composition of the oils obtained from sewage sludge. Biomass and Bioenergy 33, 933–940. doi:10.1016/j.biombioe.2009.02.002
Singh, B., Singh, B.P., Cowie, A.L., 2010. Characterisation and evaluation of biochars for their application as a soil amendment. Aust. J. Soil Res. 48, 516–525. doi:10.1071/SR10058
Smith, C.R., Buzan, E.M., Lee, J.W., 2013. Potential impact of biochar water-extractable substances on environmental sustainability. ACS Sustain. Chem. Eng. 1, 118–126. doi:10.1021/sc300063f
Somtrakoon, K., Chouychai, W., 2013. Phytotoxicity of single and combined polycyclic aromatic hydrocarbons toward economic crops. Russ. J. Plant Physiol. 60, 139–148. doi:10.1134/S1021443712060155
Spokas, K.A., Novak, J.M., Stewart, C.E., Cantrell, K.B., Uchimiya, M., Dusaire, M.G., Ro, K.S., 2011. Qualitative analysis of volatile organic compounds on biochar. Chemosphere 85, 869–882. doi:10.1016/j.chemosphere.2011.06.108
US Department of Health and Human Services, 1995. Toxicological profile for Polycyclic Aromatic Hydrocarbons.
Vácha, R., Čechmánková, J., Skála, J., 2010. Polycyclic aromatic hydrocarbons in soil and selected plants. Plant Soil Environ. 56, 434–443.
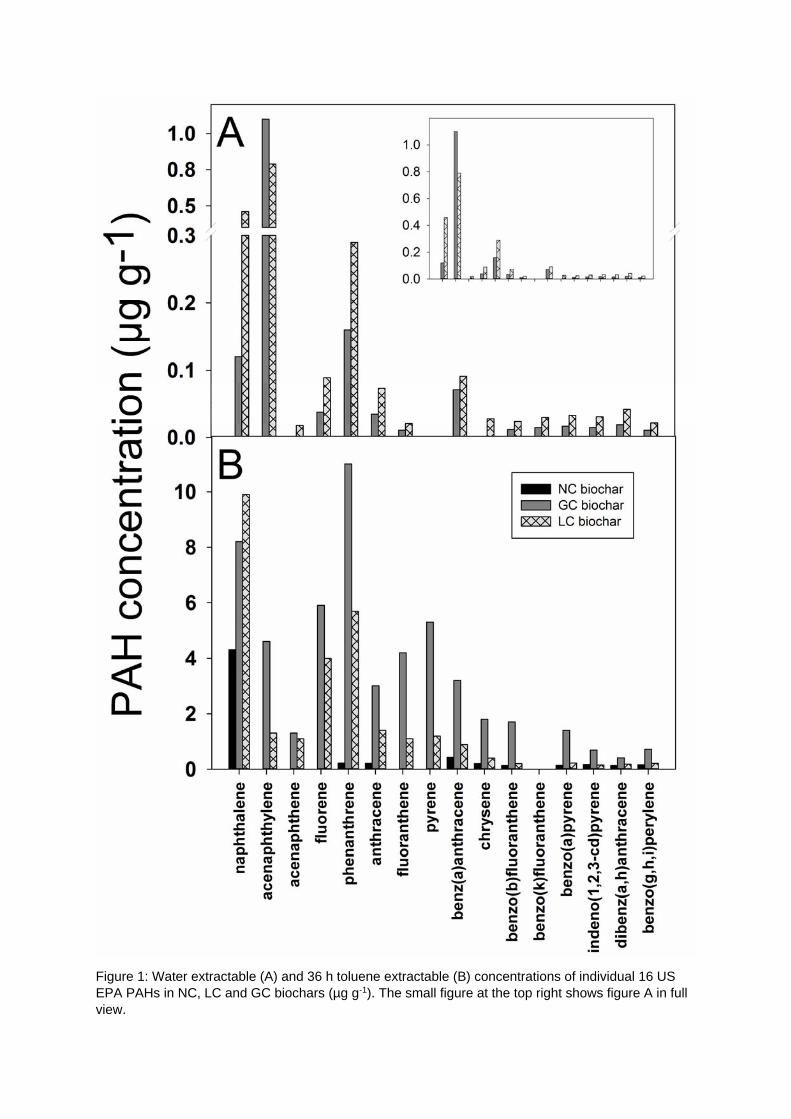
Figure 1: Water extractable (A) and 36 h toluene extractable (B) concentrations of individual 16 US EPA PAHs in NC, LC and GC biochars (µg g-1). The small figure at the top right shows figure A in full view.
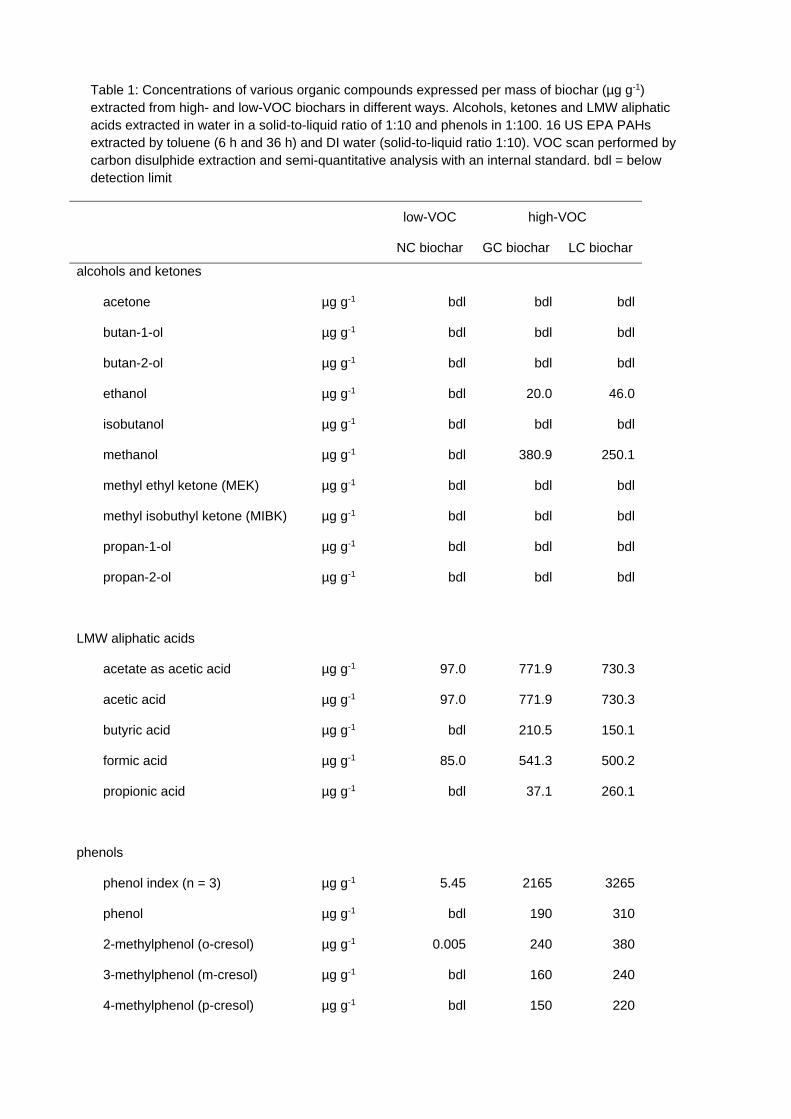
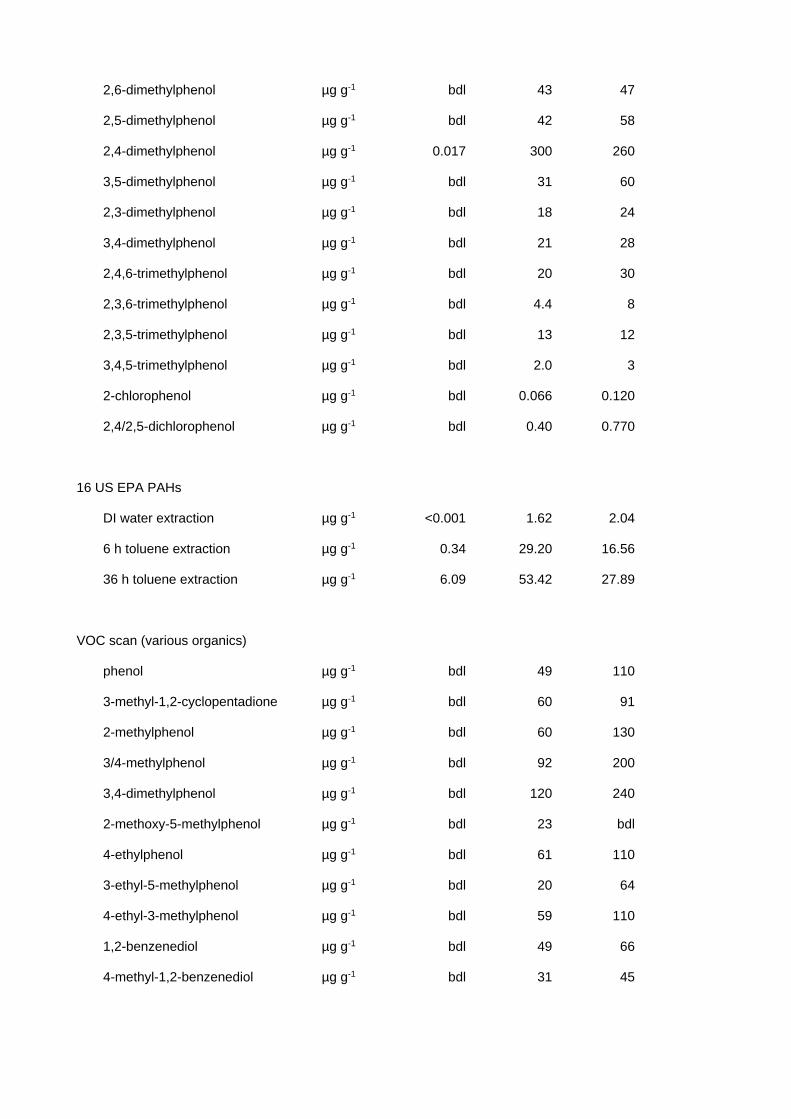
Table 1: Concentrations of various organic compounds expressed per mass of biochar (µg g-1) extracted from high- and low-VOC biochars in different ways. Alcohols, ketones and LMW aliphatic acids extracted in water in a solid-to-liquid ratio of 1:10 and phenols in 1:100. 16 US EPA PAHs extracted by toluene (6 h and 36 h) and DI water (solid-to-liquid ratio 1:10). VOC scan performed by carbon disulphide extraction and semi-quantitative analysis with an internal standard. bdl = below detection limit
low-VOC high-VOC
NC biochar GC biochar LC biochar
alcohols and ketones
acetone µg g-1 bdl bdl bdl
butan-1-ol µg g-1 bdl bdl bdl
butan-2-ol µg g-1 bdl bdl bdl
ethanol µg g-1 bdl 20.0 46.0
isobutanol µg g-1 bdl bdl bdl
methanol µg g-1 bdl 380.9 250.1
methyl ethyl ketone (MEK) µg g-1 bdl bdl bdl
methyl isobuthyl ketone (MIBK) µg g-1 bdl bdl bdl
propan-1-ol µg g-1 bdl bdl bdl
propan-2-ol µg g-1 bdl bdl bdl
LMW aliphatic acids
acetate as acetic acid µg g-1 97.0 771.9 730.3
acetic acid µg g-1 97.0 771.9 730.3
butyric acid µg g-1 bdl 210.5 150.1
formic acid µg g-1 85.0 541.3 500.2
propionic acid µg g-1 bdl 37.1 260.1
phenols
phenol index (n = 3) µg g-1 5.45 2165 3265
phenol µg g-1 bdl 190 310
2-methylphenol (o-cresol) µg g-1 0.005 240 380
3-methylphenol (m-cresol) µg g-1 bdl 160 240
4-methylphenol (p-cresol) µg g-1 bdl 150 220
2,6-dimethylphenol µg g-1 bdl 43 47
2,5-dimethylphenol µg g-1 bdl 42 58
2,4-dimethylphenol µg g-1 0.017 300 260
3,5-dimethylphenol µg g-1 bdl 31 60
2,3-dimethylphenol µg g-1 bdl 18 24
3,4-dimethylphenol µg g-1 bdl 21 28
2,4,6-trimethylphenol µg g-1 bdl 20 30
2,3,6-trimethylphenol µg g-1 bdl 4.4 8
2,3,5-trimethylphenol µg g-1 bdl 13 12
3,4,5-trimethylphenol µg g-1 bdl 2.0 3
2-chlorophenol µg g-1 bdl 0.066 0.120
2,4/2,5-dichlorophenol µg g-1 bdl 0.40 0.770
16 US EPA PAHs
DI water extraction µg g-1 <0.001 1.62 2.04
6 h toluene extraction µg g-1 0.34 29.20 16.56
36 h toluene extraction µg g-1 6.09 53.42 27.89
VOC scan (various organics)
phenol µg g-1 bdl 49 110
3-methyl-1,2-cyclopentadione µg g-1 bdl 60 91
2-methylphenol µg g-1 bdl 60 130
3/4-methylphenol µg g-1 bdl 92 200
3,4-dimethylphenol µg g-1 bdl 120 240
2-methoxy-5-methylphenol µg g-1 bdl 23 bdl
4-ethylphenol µg g-1 bdl 61 110
3-ethyl-5-methylphenol µg g-1 bdl 20 64
4-ethyl-3-methylphenol µg g-1 bdl 59 110
1,2-benzenediol µg g-1 bdl 49 66
4-methyl-1,2-benzenediol µg g-1 bdl 31 45
Copyright © 2022 FDOKUMEN