Infrequent occurrence of new particle formation at a semi-rural location, Gadanki, in tropical...
10
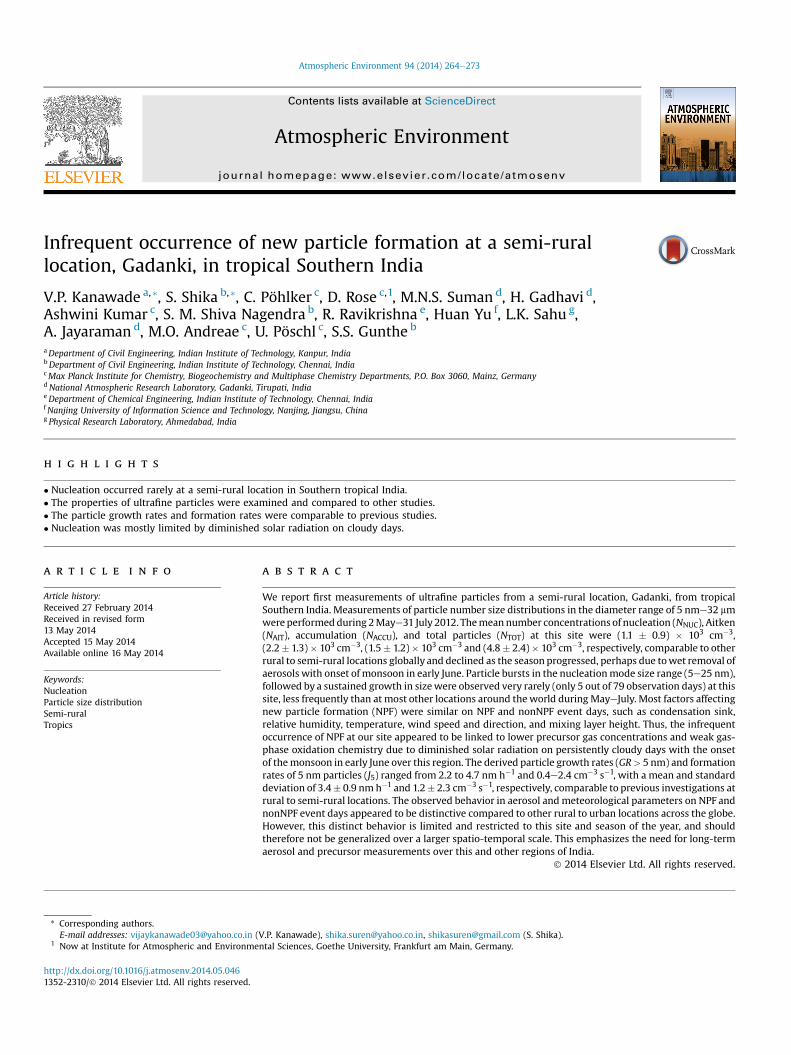
Infrequent occurrence of new particle formation at a semi-rural location, Gadanki, in tropical Southern India V.P. Kanawade a, * , S. Shika b, * , C. Pöhlker c , D. Rose c, 1 , M.N.S. Suman d , H. Gadhavi d , Ashwini Kumar c , S. M. Shiva Nagendra b , R. Ravikrishna e , Huan Yu f , L.K. Sahu g , A. Jayaraman d , M.O. Andreae c , U. Pöschl c , S.S. Gunthe b a Department of Civil Engineering, Indian Institute of Technology, Kanpur, India b Department of Civil Engineering, Indian Institute of Technology, Chennai, India c Max Planck Institute for Chemistry, Biogeochemistry and Multiphase Chemistry Departments, P.O. Box 3060, Mainz, Germany d National Atmospheric Research Laboratory, Gadanki, Tirupati, India e Department of Chemical Engineering, Indian Institute of Technology, Chennai, India f Nanjing University of Information Science and Technology, Nanjing, Jiangsu, China g Physical Research Laboratory, Ahmedabad, India highlights Nucleation occurred rarely at a semi-rural location in Southern tropical India. The properties of ultrafine particles were examined and compared to other studies. The particle growth rates and formation rates were comparable to previous studies. Nucleation was mostly limited by diminished solar radiation on cloudy days. article info Article history: Received 27 February 2014 Received in revised form 13 May 2014 Accepted 15 May 2014 Available online 16 May 2014 Keywords: Nucleation Particle size distribution Semi-rural Tropics abstract We report first measurements of ultrafine particles from a semi-rural location, Gadanki, from tropical Southern India. Measurements of particle number size distributions in the diameter range of 5 nme32 mm were performed during 2 Maye31 July 2012. The mean number concentrations of nucleation (N NUC ), Aitken (N AIT ), accumulation (N ACCU ), and total particles (N TOT ) at this site were (1.1 0.9) 10 3 cm 3 , (2.2 1.3) 10 3 cm 3 , (1.5 1.2) 10 3 cm 3 and (4.8 2.4) 10 3 cm 3 , respectively, comparable to other rural to semi-rural locations globally and declined as the season progressed, perhaps due to wet removal of aerosols with onset of monsoon in early June. Particle bursts in the nucleation mode size range (5e25 nm), followed by a sustained growth in size were observed very rarely (only 5 out of 79 observation days) at this site, less frequently than at most other locations around the world during MayeJuly. Most factors affecting new particle formation (NPF) were similar on NPF and nonNPF event days, such as condensation sink, relative humidity, temperature, wind speed and direction, and mixing layer height. Thus, the infrequent occurrence of NPF at our site appeared to be linked to lower precursor gas concentrations and weak gas- phase oxidation chemistry due to diminished solar radiation on persistently cloudy days with the onset of the monsoon in early June over this region. The derived particle growth rates (GR > 5 nm) and formation rates of 5 nm particles (J 5 ) ranged from 2.2 to 4.7 nm h 1 and 0.4e2.4 cm 3 s 1 , with a mean and standard deviation of 3.4 0.9 nm h 1 and 1.2 2.3 cm 3 s 1 , respectively, comparable to previous investigations at rural to semi-rural locations. The observed behavior in aerosol and meteorological parameters on NPF and nonNPF event days appeared to be distinctive compared to other rural to urban locations across the globe. However, this distinct behavior is limited and restricted to this site and season of the year, and should therefore not be generalized over a larger spatio-temporal scale. This emphasizes the need for long-term aerosol and precursor measurements over this and other regions of India. Ó 2014 Elsevier Ltd. All rights reserved. * Corresponding authors. E-mail addresses: [email protected] (V.P. Kanawade), [email protected], [email protected] (S. Shika). 1 Now at Institute for Atmospheric and Environmental Sciences, Goethe University, Frankfurt am Main, Germany. Contents lists available at ScienceDirect Atmospheric Environment journal homepage: www.elsevier.com/locate/atmosenv http://dx.doi.org/10.1016/j.atmosenv.2014.05.046 1352-2310/Ó 2014 Elsevier Ltd. All rights reserved. Atmospheric Environment 94 (2014) 264e273
-
Upload
independent -
Category
Documents
-
view
5 -
download
0
Transcript of Infrequent occurrence of new particle formation at a semi-rural location, Gadanki, in tropical...
lable at ScienceDirect
Atmospheric Environment 94 (2014) 264e273
Contents lists avai
Atmospheric Environment
journal homepage: www.elsevier .com/locate/atmosenv
Infrequent occurrence of new particle formation at a semi-rurallocation, Gadanki, in tropical Southern India
V.P. Kanawade a,*, S. Shika b,*, C. Pöhlker c, D. Rose c,1, M.N.S. Suman d, H. Gadhavi d,Ashwini Kumar c, S. M. Shiva Nagendra b, R. Ravikrishna e, Huan Yu f, L.K. Sahu g,A. Jayaraman d, M.O. Andreae c, U. Pöschl c, S.S. Gunthe b
aDepartment of Civil Engineering, Indian Institute of Technology, Kanpur, IndiabDepartment of Civil Engineering, Indian Institute of Technology, Chennai, IndiacMax Planck Institute for Chemistry, Biogeochemistry and Multiphase Chemistry Departments, P.O. Box 3060, Mainz, GermanydNational Atmospheric Research Laboratory, Gadanki, Tirupati, IndiaeDepartment of Chemical Engineering, Indian Institute of Technology, Chennai, IndiafNanjing University of Information Science and Technology, Nanjing, Jiangsu, Chinag Physical Research Laboratory, Ahmedabad, India
h i g h l i g h t s
� Nucleation occurred rarely at a semi-rural location in Southern tropical India.� The properties of ultrafine particles were examined and compared to other studies.� The particle growth rates and formation rates were comparable to previous studies.� Nucleation was mostly limited by diminished solar radiation on cloudy days.
a r t i c l e i n f o
Article history:Received 27 February 2014Received in revised form13 May 2014Accepted 15 May 2014Available online 16 May 2014
Keywords:NucleationParticle size distributionSemi-ruralTropics
* Corresponding authors.E-mail addresses: [email protected] (
1 Now at Institute for Atmospheric and Environme
http://dx.doi.org/10.1016/j.atmosenv.2014.05.0461352-2310/� 2014 Elsevier Ltd. All rights reserved.
a b s t r a c t
We report first measurements of ultrafine particles from a semi-rural location, Gadanki, from tropicalSouthern India. Measurements of particle number size distributions in the diameter range of 5 nme32 mmwere performed during 2Maye31 July 2012. Themeannumber concentrations of nucleation (NNUC), Aitken(NAIT), accumulation (NACCU), and total particles (NTOT) at this site were (1.1 � 0.9) � 103 cm�3,(2.2� 1.3)� 103 cm�3, (1.5� 1.2)� 103 cm�3 and (4.8� 2.4)� 103 cm�3, respectively, comparable to otherrural to semi-rural locations globally and declined as the season progressed, perhaps due towet removal ofaerosols with onset of monsoon in early June. Particle bursts in the nucleationmode size range (5e25 nm),followed by a sustained growth in sizewere observed very rarely (only 5 out of 79 observation days) at thissite, less frequently than at most other locations around theworld during MayeJuly. Most factors affectingnew particle formation (NPF) were similar on NPF and nonNPF event days, such as condensation sink,relative humidity, temperature, wind speed and direction, and mixing layer height. Thus, the infrequentoccurrence of NPF at our site appeared to be linked to lower precursor gas concentrations and weak gas-phase oxidation chemistry due to diminished solar radiation on persistently cloudy days with the onsetof themonsoon in early June over this region. The derived particle growth rates (GR> 5 nm) and formationrates of 5 nm particles (J5) ranged from 2.2 to 4.7 nm h�1 and 0.4e2.4 cm�3 s�1, with a mean and standarddeviation of 3.4� 0.9 nm h�1 and 1.2� 2.3 cm�3 s�1, respectively, comparable to previous investigations atrural to semi-rural locations. The observed behavior in aerosol and meteorological parameters on NPF andnonNPF event days appeared to be distinctive compared to other rural to urban locations across the globe.However, this distinct behavior is limited and restricted to this site and season of the year, and shouldtherefore not be generalized over a larger spatio-temporal scale. This emphasizes the need for long-termaerosol and precursor measurements over this and other regions of India.
� 2014 Elsevier Ltd. All rights reserved.
V.P. Kanawade), [email protected], [email protected] (S. Shika).ntal Sciences, Goethe University, Frankfurt am Main, Germany.
V.P. Kanawade et al. / Atmospheric Environment 94 (2014) 264e273 265
1. Introduction Here, PNSD in the size range of 5 nme32 mm measured at asemi-rural location, Gadanki, in tropical Southern India are pre-
Aerosol particles are ubiquitous in the atmosphere and influ-ence the radiative balance of the Earth’s climate through direct andindirect effects, by scattering and absorbing solar radiation(Schwartz, 1996) and by acting as cloud condensation nuclei (CCN)and thereby modifying cloud microphysical properties (Andreaeand Rosenfeld, 2008; Twomey, 1991).
Atmospheric new particle formation (NPF) is one of the domi-nant sources of aerosol particles in the atmosphere and an impor-tant process controlling aerosol and CCN number concentrations, aswell as cloud properties. These newly formed particles account forabout 3e70% of CCN production in the troposphere (Merikantoet al., 2009; Pierce and Adams, 2009; Spracklen et al., 2008), andcan further participate and perturb cloud droplet formation(Kerminen et al., 2005). Thus, NPF has the potential to influencecloud microphysical properties and global radiative forcing (Wangand Penner, 2009).
Only recently, the first direct size-segregated observations ofnanoparticles down to 1 nm size confirmed that NPF indeed occursin two distinct stages; formation of a critical cluster, followed bysubsequent growth to larger sizes (Kulmala et al., 2013). Sulfuricacid (H2SO4) has been identified as a key component in NPFbecause of its low vapor pressure (e.g. Sipila et al., 2010 and ref-erences therein). However, the observed nucleation rates cannot beexplained by the binary homogeneous nucleation of H2SO4eH2Oalone in the boundary layer, because additional species are requiredto stabilize these H2SO4 clusters, such as ammonia (NH3) (Kirkbyet al., 2011) and amines (Almeida et al., 2013), and to facilitatetheir growth. Earlier investigations have also shown that NH3 (Ballet al., 1999), amines (Almeida et al., 2013) organic acids and theirlow-volatility oxidation products (Hoffmann et al., 1998; Metzgeret al., 2010; O’Dowd et al., 2002; Zhang et al., 2004), and chargedion clusters (Lee et al., 2003; Yu and Turco, 2008) play importantroles in NPF and particle growth processes at given atmosphericconditions. While NPF appears to take place throughout the Earth’stroposphere (Kulmala et al., 2004), the primary mechanism forparticle formation, which controls aerosol number concentration, isstill mysterious despite decades of intensive studies, particularly inthe boundary layer (Andreae, 2013).
Numerous researchers have carried out sub-micron particlenumber size distribution (PNSD) measurements at diverse loca-tions across the globe to investigate NPF and growth processes,including rural site (Kristensson et al., 2008), semi-rural sites(Kanawade et al., 2012; Wang et al., 2013), and urban areas(McMurry et al., 2005; Stanier et al., 2004b). In contrast, in thepristine Amazonian rainforest, where NPF events are almost neverobserved, a recent study by Pöhlker et al. (2012) suggested thatsecondary organic compounds emitted by the rainforest condenseonto pre-existing primary particles that are also emitted from therainforest. In Indian context, the systematic observations of PNSD toexamine NPF are also extremely scarce and/or limited to only a fewlocations (Hyvärinen et al., 2010; Mönkkönen et al., 2005; Moorthyet al., 2011; Siingh et al., 2013). To the best of our knowledge, this isthe first study reporting systematic analysis of PNSDs to investigateNPF from a semi-rural location in India. The Indian subcontinent, adeveloping country with a population of 1.4 billion and the largestmonsoon circulation in the world, has attracted many atmosphericand climatic scientists, due to increased aerosol loading that isexerting the greatest impact on the climate, and also causing solardimming over India (Padma Kumari et al., 2007). Thus, observationof ultrafine particles may be crucial not only to improve theprocess-level understanding of atmospheric NPF and their trans-formation but also their adverse effect on human health.
sented. Measurements of PNSD along with various meteorologicalparameters were performed during 2 Maye31 July 2012. The NPFand growth processes were analyzed using different theoreticalapproaches. The influence of meteorological variables on NPF wasalso investigated.
2. Experimental methods
2.1. Sampling site
PNSD measurements were performed at a semi-rural location, asmall village Gadanki (Chittoor district, Andhra Pradesh State), witha total population of 2586 inhabitants, in Southern tropical India(Fig. 1). The measurements were performed on the National At-mospheric Research Laboratory (NARL) campus (13.46�N, 79.17�E,375 m amsl), a research facility specializes in basic atmosphericresearch, indigenous technology development for atmosphericprobing, and weather and climate modeling. The instrument wasplaced in an open area near the main instrumentation facility,making sure that there were no obstructions for the sampling.NARL is surrounded by hills reaching as high as 1000 m on thenorthern and southern sides within 1e10 km distance. A nationalhighway (NH 18) with moderate traffic (less than 500 heavy dutyvehicles per day) runs in a northeast-southwest direction about1.5 km from the measurement site. Short-lived NPF events withelevated particle number concentrations during traffic hours maybe important in urban areas (Stanier et al., 2004b), but such eventsof elevated particle number concentrations due to traffic were notobserved at our semi-rural site, because of the distance from theroad and the topography. There is nomajor industrial facility withina radius of about 50 km except a medium scale iron ore processingunit about 13 km away in a westerly direction from the site. Due tothe mountainous terrain, direct pollution plumes do not reach tothe measurement site from neighboring cities and towns. Thenearest city is Tirupati (population 0.2e0.3 million) about 35 kmaway in a north-eastern direction. Other closest metropolitan citiesare Bangalore and Chennai, about 260 km and 180 km to thesouthwest and southeast of Gadanki, respectively. Gadanki may beidentified as a semi-rural environment, based on the OMI retrievedtropospheric NO2 total column (w1�1015 molecules cm�2) (Fig. 1).Hereafter, we refer to the sampling site as NARL. The generalmeteorology of the site is given in the supplementary.
2.2. Instrumentation, methodology and data used
PNSD were measured using a GRIMM (Ainring, Germany) widerange aerosol spectrometer (WRAS 665) during 2 Maye31 July2012. The WRAS system consists of a GRIMM scanning mobilityparticle sizer with a condensation particle counter (SMPS þ C; CPCmodel 5.400) and an optical particle counter (OPC; GRIMM EDM180), providing measurements in the full size range (5 nme32 mm)of atmospheric particles in 72 channels at 5 min intervals. TheSMPSþ Cmeasures the PNSD in the electrical mobility size range of5e350 nm in 45 channels by stepwise changing the differentialmobility analyzer (DMA) voltage. The SMPS was operated at a flowrate of 1.2 lpm, where the sample air flow rate of 0.3 lpmwas fixedfor the SMPS þ C with a sheath air flow of 3.0 lpm. In order tomaintain the relative humidity suitable for robust measurements(generally less than 30%), the sample flow was passed through aNafion membrane tube and the inlet was heated to 30 �C. The OPCworks on the principle of light-scattering for single particles, andthen the signals are amplified and classified into 31 size channels to
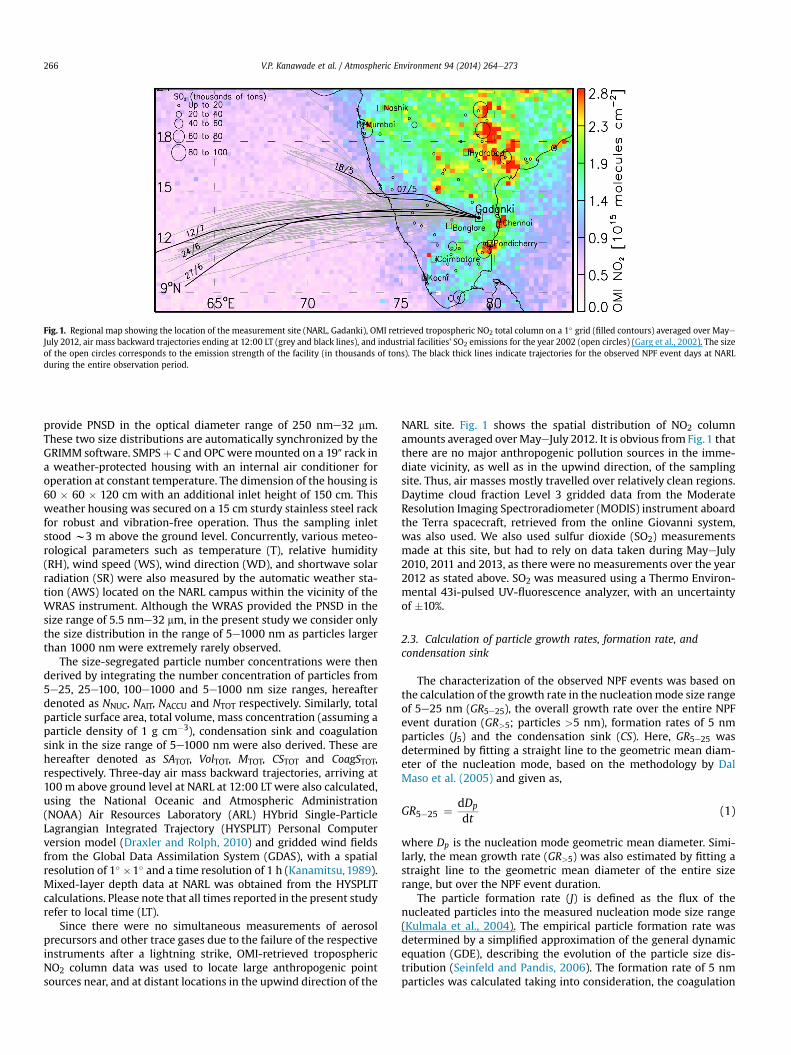
Fig. 1. Regional map showing the location of the measurement site (NARL, Gadanki), OMI retrieved tropospheric NO2 total column on a 1� grid (filled contours) averaged over MayeJuly 2012, air mass backward trajectories ending at 12:00 LT (grey and black lines), and industrial facilities’ SO2 emissions for the year 2002 (open circles) (Garg et al., 2002). The sizeof the open circles corresponds to the emission strength of the facility (in thousands of tons). The black thick lines indicate trajectories for the observed NPF event days at NARLduring the entire observation period.
V.P. Kanawade et al. / Atmospheric Environment 94 (2014) 264e273266
provide PNSD in the optical diameter range of 250 nme32 mm.These two size distributions are automatically synchronized by theGRIMM software. SMPSþ C and OPC weremounted on a 19ʺ rack ina weather-protected housing with an internal air conditioner foroperation at constant temperature. The dimension of the housing is60 � 60 � 120 cm with an additional inlet height of 150 cm. Thisweather housing was secured on a 15 cm sturdy stainless steel rackfor robust and vibration-free operation. Thus the sampling inletstood w3 m above the ground level. Concurrently, various meteo-rological parameters such as temperature (T), relative humidity(RH), wind speed (WS), wind direction (WD), and shortwave solarradiation (SR) were also measured by the automatic weather sta-tion (AWS) located on the NARL campus within the vicinity of theWRAS instrument. Although the WRAS provided the PNSD in thesize range of 5.5 nme32 mm, in the present study we consider onlythe size distribution in the range of 5e1000 nm as particles largerthan 1000 nm were extremely rarely observed.
The size-segregated particle number concentrations were thenderived by integrating the number concentration of particles from5e25, 25e100, 100e1000 and 5e1000 nm size ranges, hereafterdenoted as NNUC, NAIT, NACCU and NTOT respectively. Similarly, totalparticle surface area, total volume, mass concentration (assuming aparticle density of 1 g cm�3), condensation sink and coagulationsink in the size range of 5e1000 nm were also derived. These arehereafter denoted as SATOT, VolTOT, MTOT, CSTOT and CoagSTOT,respectively. Three-day air mass backward trajectories, arriving at100 m above ground level at NARL at 12:00 LT were also calculated,using the National Oceanic and Atmospheric Administration(NOAA) Air Resources Laboratory (ARL) HYbrid Single-ParticleLagrangian Integrated Trajectory (HYSPLIT) Personal Computerversion model (Draxler and Rolph, 2010) and gridded wind fieldsfrom the Global Data Assimilation System (GDAS), with a spatialresolution of 1� �1� and a time resolution of 1 h (Kanamitsu, 1989).Mixed-layer depth data at NARL was obtained from the HYSPLITcalculations. Please note that all times reported in the present studyrefer to local time (LT).
Since there were no simultaneous measurements of aerosolprecursors and other trace gases due to the failure of the respectiveinstruments after a lightning strike, OMI-retrieved troposphericNO2 column data was used to locate large anthropogenic pointsources near, and at distant locations in the upwind direction of the
NARL site. Fig. 1 shows the spatial distribution of NO2 columnamounts averaged overMayeJuly 2012. It is obvious from Fig.1 thatthere are no major anthropogenic pollution sources in the imme-diate vicinity, as well as in the upwind direction, of the samplingsite. Thus, air masses mostly travelled over relatively clean regions.Daytime cloud fraction Level 3 gridded data from the ModerateResolution Imaging Spectroradiometer (MODIS) instrument aboardthe Terra spacecraft, retrieved from the online Giovanni system,was also used. We also used sulfur dioxide (SO2) measurementsmade at this site, but had to rely on data taken during MayeJuly2010, 2011 and 2013, as there were no measurements over the year2012 as stated above. SO2 was measured using a Thermo Environ-mental 43i-pulsed UV-fluorescence analyzer, with an uncertaintyof �10%.
2.3. Calculation of particle growth rates, formation rate, andcondensation sink
The characterization of the observed NPF events was based onthe calculation of the growth rate in the nucleationmode size rangeof 5e25 nm (GR5e25), the overall growth rate over the entire NPFevent duration (GR>5; particles >5 nm), formation rates of 5 nmparticles (J5) and the condensation sink (CS). Here, GR5e25 wasdetermined by fitting a straight line to the geometric mean diam-eter of the nucleation mode, based on the methodology by DalMaso et al. (2005) and given as,
GR5�25 ¼ dDp
dt(1)
where Dp is the nucleation mode geometric mean diameter. Simi-larly, the mean growth rate (GR>5) was also estimated by fitting astraight line to the geometric mean diameter of the entire sizerange, but over the NPF event duration.
The particle formation rate (J) is defined as the flux of thenucleated particles into the measured nucleation mode size range(Kulmala et al., 2004). The empirical particle formation rate wasdetermined by a simplified approximation of the general dynamicequation (GDE), describing the evolution of the particle size dis-tribution (Seinfeld and Pandis, 2006). The formation rate of 5 nmparticles was calculated taking into consideration, the coagulation
V.P. Kanawade et al. / Atmospheric Environment 94 (2014) 264e273 267
loss, and particle flux out of the nucleation mode size range (DalMaso et al., 2005) and is given as,
J5 ¼ dN5�25
dtþ Fcoag þ Fgrowth (2)
The first term in Equation (2) is the rate of the change of freshlynucleated particle concentrations (5e25 nm), the second termdesignates the coagulation loss, and the third term is the conden-sational growth. The coagulation loss is determined as
Fcoag ¼ N5�25$CoagS5�25 (3)
where CoagS5e25 is the coagulation sink that describes the propertyof the aerosols to rapidly remove the particles in the nucleationmode size range. It can be expressed as
PjKijNj, where Nj is the
particle number concentration in size bin j and Kij is the coagulationcoefficient between size bin i (i.e., the reference size, 5 nm) and j,and is given as (Seinfeld and Pandis, 2006),
Kij ¼ 2p�di þ dj
�$�Di þ Dj
�$bFi;j (4)
where d is the diameter of a size bin, D and bF are the sizedependent diffusion coefficient and the Fuchs correction factor ofparticles, respectively.
The growth term in Eq. (2) over the nucleation mode size rangeof width DDp (i.e., 20 nm) is given by
Fgrowth ¼ GR5�25DDp
$N5�25 (5)
The aerosol condensation sink (CS) is a measure of how rapidlymolecules (and clusters) will condense onto pre-existing aerosols,and was calculated as follows (Kulmala, 2001)
CS ¼ 2pDj
X
j
bm;jdjNj (6)
where
bm;j ¼1þ Knj
1þ 0:337Knj þ 4Knj
3a þ 4Kn2j
3a
(7)
Knj ¼2lydj
(8)
where bm;j is the size-dependent transition correction factor, Knj isthe Knudsen number, D is the diffusion coefficient for H2SO4
(0.104 cm2 s�1), a is mass accommodation coefficient (taken asunity), and ly is the mean free path of the H2SO4 molecule(6.7 � 10�6 cm) at 1 atm and 298 K.
3. Results and discussion
3.1. Particle number size distribution characteristics
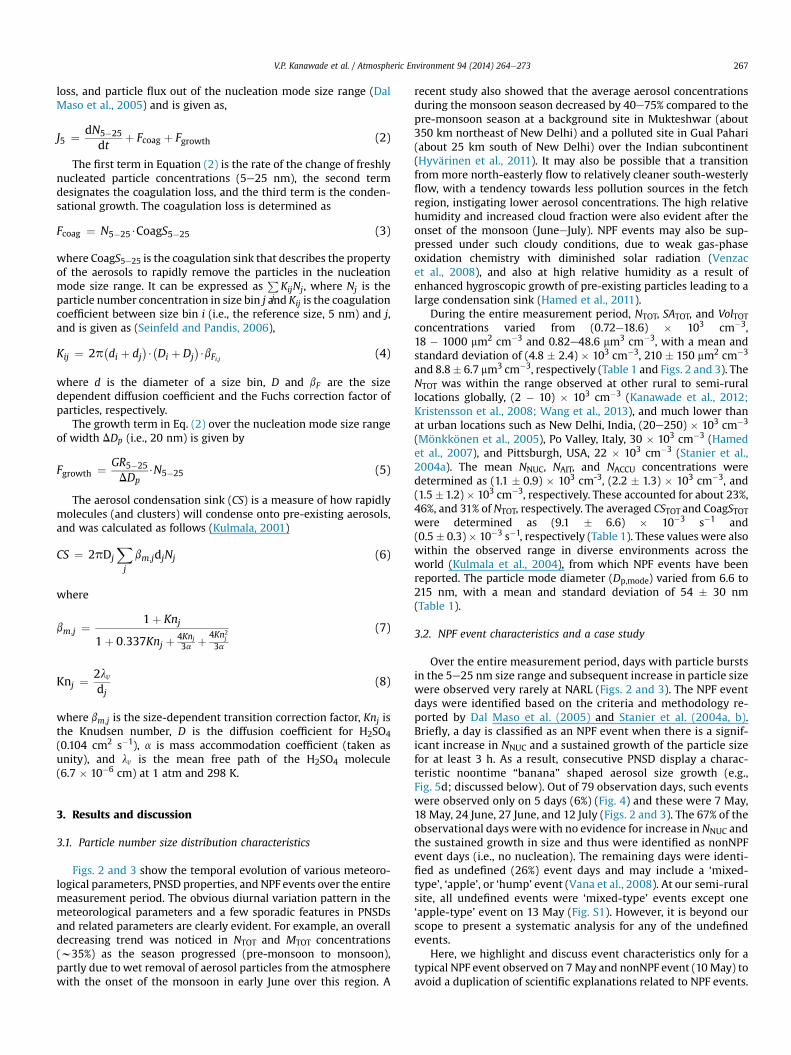
Figs. 2 and 3 show the temporal evolution of various meteoro-logical parameters, PNSD properties, and NPF events over the entiremeasurement period. The obvious diurnal variation pattern in themeteorological parameters and a few sporadic features in PNSDsand related parameters are clearly evident. For example, an overalldecreasing trend was noticed in NTOT and MTOT concentrations(w35%) as the season progressed (pre-monsoon to monsoon),partly due to wet removal of aerosol particles from the atmospherewith the onset of the monsoon in early June over this region. A
recent study also showed that the average aerosol concentrationsduring the monsoon season decreased by 40e75% compared to thepre-monsoon season at a background site in Mukteshwar (about350 km northeast of New Delhi) and a polluted site in Gual Pahari(about 25 km south of New Delhi) over the Indian subcontinent(Hyvärinen et al., 2011). It may also be possible that a transitionfrom more north-easterly flow to relatively cleaner south-westerlyflow, with a tendency towards less pollution sources in the fetchregion, instigating lower aerosol concentrations. The high relativehumidity and increased cloud fraction were also evident after theonset of the monsoon (JuneeJuly). NPF events may also be sup-pressed under such cloudy conditions, due to weak gas-phaseoxidation chemistry with diminished solar radiation (Venzacet al., 2008), and also at high relative humidity as a result ofenhanced hygroscopic growth of pre-existing particles leading to alarge condensation sink (Hamed et al., 2011).
During the entire measurement period, NTOT, SATOT, and VolTOTconcentrations varied from (0.72e18.6) � 103 cm�3,18 � 1000 mm2 cm�3 and 0.82e48.6 mm3 cm�3, with a mean andstandard deviation of (4.8 � 2.4) � 103 cm�3, 210 � 150 mm2 cm�3
and 8.8� 6.7 mm3 cm�3, respectively (Table 1 and Figs. 2 and 3). TheNTOT was within the range observed at other rural to semi-rurallocations globally, (2 � 10) � 103 cm�3 (Kanawade et al., 2012;Kristensson et al., 2008; Wang et al., 2013), and much lower thanat urban locations such as New Delhi, India, (20e250) � 103 cm�3
(Mönkkönen et al., 2005), Po Valley, Italy, 30 � 103 cm�3 (Hamedet al., 2007), and Pittsburgh, USA, 22 � 103 cm�3 (Stanier et al.,2004a). The mean NNUC, NAIT, and NACCU concentrations weredetermined as (1.1 � 0.9) � 103 cm-3, (2.2 � 1.3) � 103 cm�3, and(1.5 �1.2)� 103 cm�3, respectively. These accounted for about 23%,46%, and 31% of NTOT, respectively. The averaged CSTOT and CoagSTOTwere determined as (9.1 � 6.6) � 10�3 s�1 and(0.5� 0.3)� 10�3 s�1, respectively (Table 1). These values were alsowithin the observed range in diverse environments across theworld (Kulmala et al., 2004), from which NPF events have beenreported. The particle mode diameter (Dp,mode) varied from 6.6 to215 nm, with a mean and standard deviation of 54 � 30 nm(Table 1).
3.2. NPF event characteristics and a case study
Over the entire measurement period, days with particle burstsin the 5e25 nm size range and subsequent increase in particle sizewere observed very rarely at NARL (Figs. 2 and 3). The NPF eventdays were identified based on the criteria and methodology re-ported by Dal Maso et al. (2005) and Stanier et al. (2004a, b).Briefly, a day is classified as an NPF event when there is a signif-icant increase in NNUC and a sustained growth of the particle sizefor at least 3 h. As a result, consecutive PNSD display a charac-teristic noontime “banana” shaped aerosol size growth (e.g.,Fig. 5d; discussed below). Out of 79 observation days, such eventswere observed only on 5 days (6%) (Fig. 4) and these were 7 May,18 May, 24 June, 27 June, and 12 July (Figs. 2 and 3). The 67% of theobservational days werewith no evidence for increase in NNUC andthe sustained growth in size and thus were identified as nonNPFevent days (i.e., no nucleation). The remaining days were identi-fied as undefined (26%) event days and may include a ‘mixed-type’, ‘apple’, or ‘hump’ event (Vana et al., 2008). At our semi-ruralsite, all undefined events were ‘mixed-type’ events except one‘apple-type’ event on 13 May (Fig. S1). However, it is beyond ourscope to present a systematic analysis for any of the undefinedevents.
Here, we highlight and discuss event characteristics only for atypical NPF event observed on 7May and nonNPF event (10 May) toavoid a duplication of scientific explanations related to NPF events.
Fig. 2. Time series of the measured meteorological and aerosol parameters during 2 Maye15 June 2012: (a) air temperature (T, red), relative humidity (RH, blue) and MODISdaytime cloud fraction (CF, light grey bars), (b) wind speed (WS, maroon) and wind direction (WD, green), (c) shortwave radiation (SR, filled black) and mixing depth (MD,magenta), (d) contour plot of particle number size distributions (dN/dlogDp), (e) particle number concentration in the size range of 5e25 nm (NNUC, black) and total mass con-centration (MTOT, dark cyan), and (f) particle number concentration in the size range of 5e1000 nm (NTOT, purple) and condensation sink (CSTOT, yellow). The magenta horizontalbars at the bottom indicate the observed NPF event days. (For interpretation of the references to colour in this figure legend, the reader is referred to the web version of this article.)
Fig. 3. Same as Fig. 2, except for 16 Junee31 July 2012.
V.P. Kanawade et al. / Atmospheric Environment 94 (2014) 264e273268
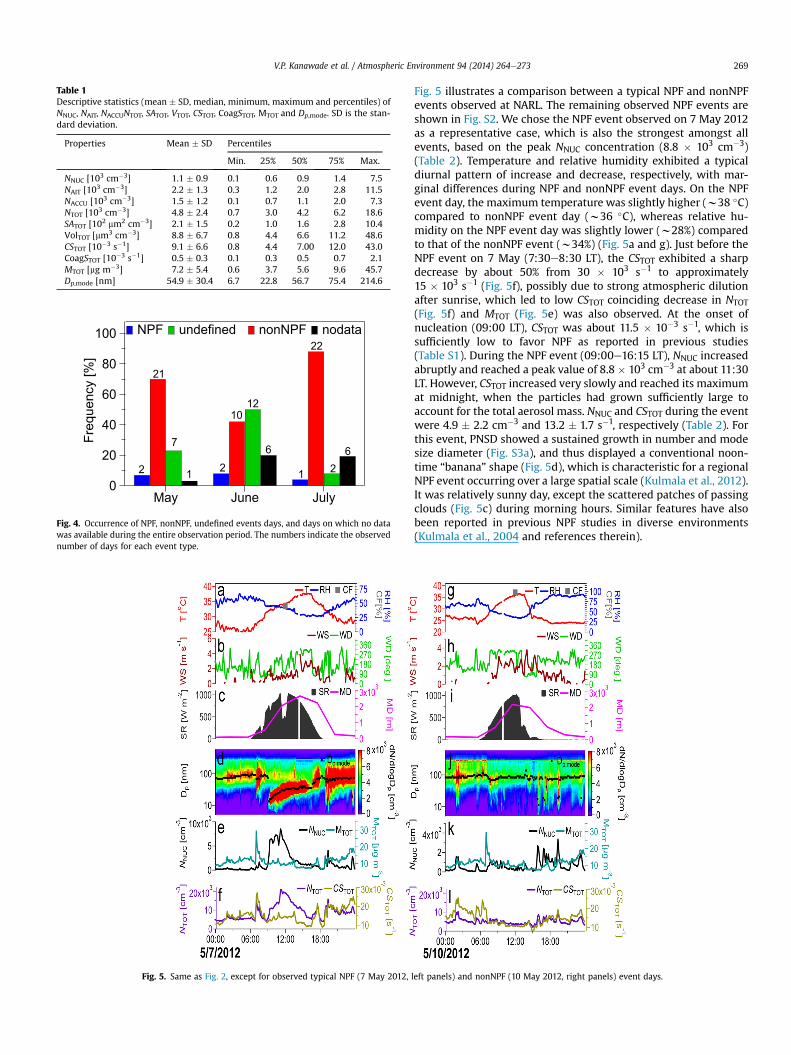
Table 1Descriptive statistics (mean � SD, median, minimum, maximum and percentiles) ofNNUC, NAIT, NACCUNTOT, SATOT, VTOT, CSTOT, CoagSTOT, MTOT and Dp,mode. SD is the stan-dard deviation.
Properties Mean � SD Percentiles
Min. 25% 50% 75% Max.
NNUC [103 cm�3] 1.1 � 0.9 0.1 0.6 0.9 1.4 7.5NAIT [103 cm�3] 2.2 � 1.3 0.3 1.2 2.0 2.8 11.5NACCU [103 cm�3] 1.5 � 1.2 0.1 0.7 1.1 2.0 7.3NTOT [103 cm�3] 4.8 � 2.4 0.7 3.0 4.2 6.2 18.6SATOT [102 mm2 cm�3] 2.1 � 1.5 0.2 1.0 1.6 2.8 10.4VolTOT [mm3 cm�3] 8.8 � 6.7 0.8 4.4 6.6 11.2 48.6CSTOT [10�3 s�1] 9.1 � 6.6 0.8 4.4 7.00 12.0 43.0CoagSTOT [10�3 s�1] 0.5 � 0.3 0.1 0.3 0.5 0.7 2.1MTOT [mg m�3] 7.2 � 5.4 0.6 3.7 5.6 9.6 45.7Dp,mode [nm] 54.9 � 30.4 6.7 22.8 56.7 75.4 214.6
100
80
60
40
20
0
Fre
quen
cy [%
]
May June July
NPF undefined nonNPF nodata
2
21
7
1 2
1012
6
1
22
26
Fig. 4. Occurrence of NPF, nonNPF, undefined events days, and days on which no datawas available during the entire observation period. The numbers indicate the observednumber of days for each event type.
Fig. 5. Same as Fig. 2, except for observed typical NPF (7 May 2012,
V.P. Kanawade et al. / Atmospheric Environment 94 (2014) 264e273 269
Fig. 5 illustrates a comparison between a typical NPF and nonNPFevents observed at NARL. The remaining observed NPF events areshown in Fig. S2. We chose the NPF event observed on 7 May 2012as a representative case, which is also the strongest amongst allevents, based on the peak NNUC concentration (8.8 � 103 cm�3)(Table 2). Temperature and relative humidity exhibited a typicaldiurnal pattern of increase and decrease, respectively, with mar-ginal differences during NPF and nonNPF event days. On the NPFevent day, the maximum temperature was slightly higher (w38 �C)compared to nonNPF event day (w36 �C), whereas relative hu-midity on the NPF event day was slightly lower (w28%) comparedto that of the nonNPF event (w34%) (Fig. 5a and g). Just before theNPF event on 7 May (7:30e8:30 LT), the CSTOT exhibited a sharpdecrease by about 50% from 30 � 103 s�1 to approximately15 � 103 s�1 (Fig. 5f), possibly due to strong atmospheric dilutionafter sunrise, which led to low CSTOT coinciding decrease in NTOT(Fig. 5f) and MTOT (Fig. 5e) was also observed. At the onset ofnucleation (09:00 LT), CSTOT was about 11.5 � 10�3 s�1, which issufficiently low to favor NPF as reported in previous studies(Table S1). During the NPF event (09:00e16:15 LT), NNUC increasedabruptly and reached a peak value of 8.8 � 103 cm�3 at about 11:30LT. However, CSTOT increased very slowly and reached its maximumat midnight, when the particles had grown sufficiently large toaccount for the total aerosol mass. NNUC and CSTOT during the eventwere 4.9 � 2.2 cm�3 and 13.2 � 1.7 s�1, respectively (Table 2). Forthis event, PNSD showed a sustained growth in number and modesize diameter (Fig. S3a), and thus displayed a conventional noon-time “banana” shape (Fig. 5d), which is characteristic for a regionalNPF event occurring over a large spatial scale (Kulmala et al., 2012).It was relatively sunny day, except the scattered patches of passingclouds (Fig. 5c) during morning hours. Similar features have alsobeen reported in previous NPF studies in diverse environments(Kulmala et al., 2004 and references therein).
left panels) and nonNPF (10 May 2012, right panels) event days.
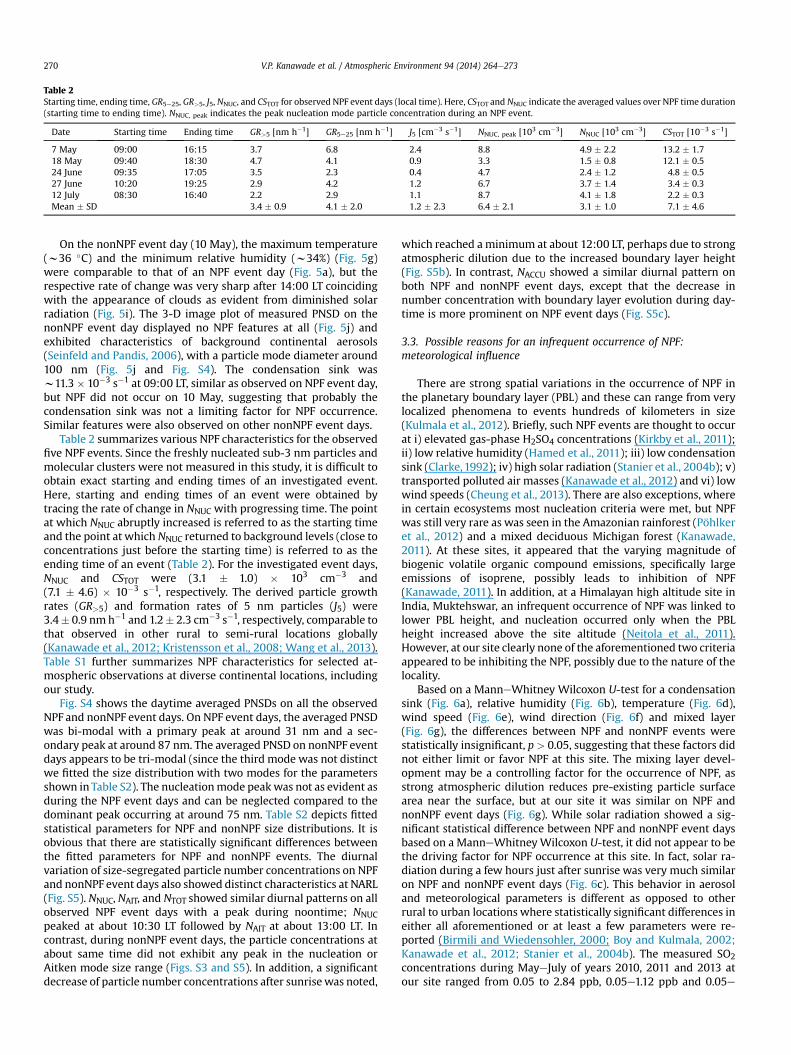
Table 2Starting time, ending time, GR5e25, GR>5, J5, NNUC, and CSTOT for observed NPF event days (local time). Here, CSTOT and NNUC indicate the averaged values over NPF time duration(starting time to ending time). NNUC, peak indicates the peak nucleation mode particle concentration during an NPF event.
Date Starting time Ending time GR>5 [nm h�1] GR5e25 [nm h�1] J5 [cm�3 s�1] NNUC, peak [103 cm�3] NNUC [103 cm�3] CSTOT [10�3 s�1]
7 May 09:00 16:15 3.7 6.8 2.4 8.8 4.9 � 2.2 13.2 � 1.718 May 09:40 18:30 4.7 4.1 0.9 3.3 1.5 � 0.8 12.1 � 0.524 June 09:35 17:05 3.5 2.3 0.4 4.7 2.4 � 1.2 4.8 � 0.527 June 10:20 19:25 2.9 4.2 1.2 6.7 3.7 � 1.4 3.4 � 0.312 July 08:30 16:40 2.2 2.9 1.1 8.7 4.1 � 1.8 2.2 � 0.3Mean � SD 3.4 � 0.9 4.1 � 2.0 1.2 � 2.3 6.4 � 2.1 3.1 � 1.0 7.1 � 4.6
V.P. Kanawade et al. / Atmospheric Environment 94 (2014) 264e273270
On the nonNPF event day (10 May), the maximum temperature(w36 �C) and the minimum relative humidity (w34%) (Fig. 5g)were comparable to that of an NPF event day (Fig. 5a), but therespective rate of change was very sharp after 14:00 LT coincidingwith the appearance of clouds as evident from diminished solarradiation (Fig. 5i). The 3-D image plot of measured PNSD on thenonNPF event day displayed no NPF features at all (Fig. 5j) andexhibited characteristics of background continental aerosols(Seinfeld and Pandis, 2006), with a particle mode diameter around100 nm (Fig. 5j and Fig. S4). The condensation sink wasw11.3 � 10�3 s�1 at 09:00 LT, similar as observed on NPF event day,but NPF did not occur on 10 May, suggesting that probably thecondensation sink was not a limiting factor for NPF occurrence.Similar features were also observed on other nonNPF event days.
Table 2 summarizes various NPF characteristics for the observedfive NPF events. Since the freshly nucleated sub-3 nm particles andmolecular clusters were not measured in this study, it is difficult toobtain exact starting and ending times of an investigated event.Here, starting and ending times of an event were obtained bytracing the rate of change in NNUC with progressing time. The pointat which NNUC abruptly increased is referred to as the starting timeand the point at which NNUC returned to background levels (close toconcentrations just before the starting time) is referred to as theending time of an event (Table 2). For the investigated event days,NNUC and CSTOT were (3.1 � 1.0) � 103 cm�3 and(7.1 � 4.6) � 10�3 s�1, respectively. The derived particle growthrates (GR>5) and formation rates of 5 nm particles (J5) were3.4� 0.9 nmh�1 and 1.2� 2.3 cm�3 s�1, respectively, comparable tothat observed in other rural to semi-rural locations globally(Kanawade et al., 2012; Kristensson et al., 2008; Wang et al., 2013).Table S1 further summarizes NPF characteristics for selected at-mospheric observations at diverse continental locations, includingour study.
Fig. S4 shows the daytime averaged PNSDs on all the observedNPF and nonNPF event days. On NPF event days, the averaged PNSDwas bi-modal with a primary peak at around 31 nm and a sec-ondary peak at around 87 nm. The averaged PNSD on nonNPF eventdays appears to be tri-modal (since the third mode was not distinctwe fitted the size distribution with two modes for the parametersshown in Table S2). The nucleationmode peakwas not as evident asduring the NPF event days and can be neglected compared to thedominant peak occurring at around 75 nm. Table S2 depicts fittedstatistical parameters for NPF and nonNPF size distributions. It isobvious that there are statistically significant differences betweenthe fitted parameters for NPF and nonNPF events. The diurnalvariation of size-segregated particle number concentrations on NPFand nonNPF event days also showed distinct characteristics at NARL(Fig. S5). NNUC, NAIT, and NTOT showed similar diurnal patterns on allobserved NPF event days with a peak during noontime; NNUC
peaked at about 10:30 LT followed by NAIT at about 13:00 LT. Incontrast, during nonNPF event days, the particle concentrations atabout same time did not exhibit any peak in the nucleation orAitken mode size range (Figs. S3 and S5). In addition, a significantdecrease of particle number concentrations after sunrisewas noted,
which reached aminimum at about 12:00 LT, perhaps due to strongatmospheric dilution due to the increased boundary layer height(Fig. S5b). In contrast, NACCU showed a similar diurnal pattern onboth NPF and nonNPF event days, except that the decrease innumber concentration with boundary layer evolution during day-time is more prominent on NPF event days (Fig. S5c).
3.3. Possible reasons for an infrequent occurrence of NPF:meteorological influence
There are strong spatial variations in the occurrence of NPF inthe planetary boundary layer (PBL) and these can range from verylocalized phenomena to events hundreds of kilometers in size(Kulmala et al., 2012). Briefly, such NPF events are thought to occurat i) elevated gas-phase H2SO4 concentrations (Kirkby et al., 2011);ii) low relative humidity (Hamed et al., 2011); iii) low condensationsink (Clarke,1992); iv) high solar radiation (Stanier et al., 2004b); v)transported polluted air masses (Kanawade et al., 2012) and vi) lowwind speeds (Cheung et al., 2013). There are also exceptions, wherein certain ecosystems most nucleation criteria were met, but NPFwas still very rare as was seen in the Amazonian rainforest (Pöhlkeret al., 2012) and a mixed deciduous Michigan forest (Kanawade,2011). At these sites, it appeared that the varying magnitude ofbiogenic volatile organic compound emissions, specifically largeemissions of isoprene, possibly leads to inhibition of NPF(Kanawade, 2011). In addition, at a Himalayan high altitude site inIndia, Muktehswar, an infrequent occurrence of NPF was linked tolower PBL height, and nucleation occurred only when the PBLheight increased above the site altitude (Neitola et al., 2011).However, at our site clearly none of the aforementioned two criteriaappeared to be inhibiting the NPF, possibly due to the nature of thelocality.
Based on a ManneWhitney Wilcoxon U-test for a condensationsink (Fig. 6a), relative humidity (Fig. 6b), temperature (Fig. 6d),wind speed (Fig. 6e), wind direction (Fig. 6f) and mixed layer(Fig. 6g), the differences between NPF and nonNPF events werestatistically insignificant, p > 0.05, suggesting that these factors didnot either limit or favor NPF at this site. The mixing layer devel-opment may be a controlling factor for the occurrence of NPF, asstrong atmospheric dilution reduces pre-existing particle surfacearea near the surface, but at our site it was similar on NPF andnonNPF event days (Fig. 6g). While solar radiation showed a sig-nificant statistical difference between NPF and nonNPF event daysbased on a ManneWhitneyWilcoxon U-test, it did not appear to bethe driving factor for NPF occurrence at this site. In fact, solar ra-diation during a few hours just after sunrise was very much similaron NPF and nonNPF event days (Fig. 6c). This behavior in aerosoland meteorological parameters is different as opposed to otherrural to urban locations where statistically significant differences ineither all aforementioned or at least a few parameters were re-ported (Birmili and Wiedensohler, 2000; Boy and Kulmala, 2002;Kanawade et al., 2012; Stanier et al., 2004b). The measured SO2concentrations during MayeJuly of years 2010, 2011 and 2013 atour site ranged from 0.05 to 2.84 ppb, 0.05e1.12 ppb and 0.05e
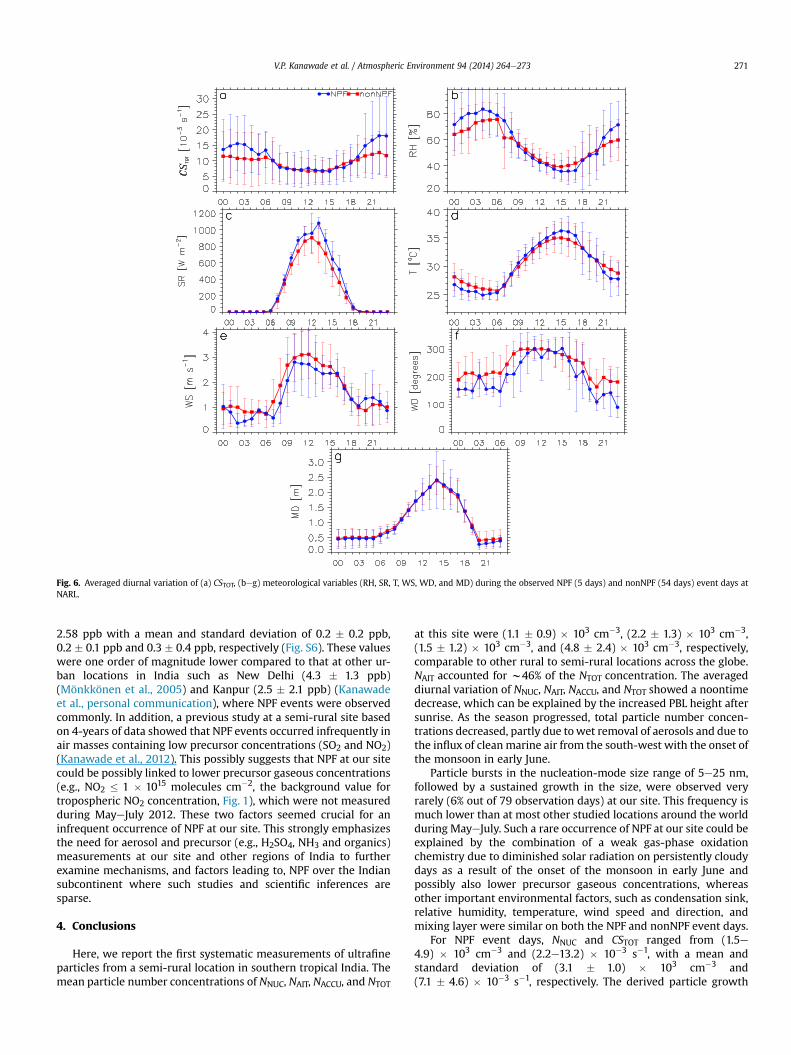
Fig. 6. Averaged diurnal variation of (a) CSTOT, (beg) meteorological variables (RH, SR, T, WS, WD, and MD) during the observed NPF (5 days) and nonNPF (54 days) event days atNARL.
V.P. Kanawade et al. / Atmospheric Environment 94 (2014) 264e273 271
2.58 ppb with a mean and standard deviation of 0.2 � 0.2 ppb,0.2 � 0.1 ppb and 0.3 � 0.4 ppb, respectively (Fig. S6). These valueswere one order of magnitude lower compared to that at other ur-ban locations in India such as New Delhi (4.3 � 1.3 ppb)(Mönkkönen et al., 2005) and Kanpur (2.5 � 2.1 ppb) (Kanawadeet al., personal communication), where NPF events were observedcommonly. In addition, a previous study at a semi-rural site basedon 4-years of data showed that NPF events occurred infrequently inair masses containing low precursor concentrations (SO2 and NO2)(Kanawade et al., 2012). This possibly suggests that NPF at our sitecould be possibly linked to lower precursor gaseous concentrations(e.g., NO2 � 1 � 1015 molecules cm�2, the background value fortropospheric NO2 concentration, Fig. 1), which were not measuredduring MayeJuly 2012. These two factors seemed crucial for aninfrequent occurrence of NPF at our site. This strongly emphasizesthe need for aerosol and precursor (e.g., H2SO4, NH3 and organics)measurements at our site and other regions of India to furtherexamine mechanisms, and factors leading to, NPF over the Indiansubcontinent where such studies and scientific inferences aresparse.
4. Conclusions
Here, we report the first systematic measurements of ultrafineparticles from a semi-rural location in southern tropical India. Themean particle number concentrations of NNUC, NAIT, NACCU, and NTOT
at this site were (1.1 � 0.9) � 103 cm�3, (2.2 � 1.3) � 103 cm�3,(1.5 � 1.2) � 103 cm�3, and (4.8 � 2.4) � 103 cm�3, respectively,comparable to other rural to semi-rural locations across the globe.NAIT accounted for w46% of the NTOT concentration. The averageddiurnal variation of NNUC, NAIT, NACCU, and NTOT showed a noontimedecrease, which can be explained by the increased PBL height aftersunrise. As the season progressed, total particle number concen-trations decreased, partly due towet removal of aerosols and due tothe influx of clean marine air from the south-west with the onset ofthe monsoon in early June.
Particle bursts in the nucleation-mode size range of 5e25 nm,followed by a sustained growth in the size, were observed veryrarely (6% out of 79 observation days) at our site. This frequency ismuch lower than at most other studied locations around the worldduring MayeJuly. Such a rare occurrence of NPF at our site could beexplained by the combination of a weak gas-phase oxidationchemistry due to diminished solar radiation on persistently cloudydays as a result of the onset of the monsoon in early June andpossibly also lower precursor gaseous concentrations, whereasother important environmental factors, such as condensation sink,relative humidity, temperature, wind speed and direction, andmixing layer were similar on both the NPF and nonNPF event days.
For NPF event days, NNUC and CSTOT ranged from (1.5e4.9) � 103 cm�3 and (2.2e13.2) � 10�3 s�1, with a mean andstandard deviation of (3.1 � 1.0) � 103 cm�3 and(7.1 � 4.6) � 10�3 s�1, respectively. The derived particle growth
V.P. Kanawade et al. / Atmospheric Environment 94 (2014) 264e273272
rates (GR > 5 nm) and formation rates of 5 nm particles (J5) rangedfrom 2.2 to 4.7 nm h�1 and 0.4e2.4 cm�3 s�1, with a mean andstandard deviation of 3.4 � 0.9 nm h�1 and 1.2 � 2.3 cm�3 s�1,respectively, comparable to previous investigations at rural tosemi-rural locations. Overall, the occurrence of NPF was not limitedby the condensation sink or other meteorological parameters.These features appear to be distinct compared to other rural tourban locations globally (Birmili and Wiedensohler, 2000; Boyet al., 2003; Kanawade et al., 2012; Stanier et al., 2004b) and, tothe best of our knowledge, similar results have not been reported inprevious investigations.
Lastly, the dataset reported here is representative of theparticular season and the specific conditions observed at this site,and should therefore not be generalized over a larger spatio-temporal scale. For an improved understanding of the mecha-nisms and factors leading to NPF over this and other regions ofIndia, long-term measurements are very necessary and should beencouraged.
Acknowledgments
VPK and SS equally contributed to this work. SSG acknowledgesthe funding from IIT Madras NFSC grant number CIE/11-12/560/NFSC/SACI and from DST-Max Planck Partner Group at IIT Madras(sanctioned under letter No. IGSTC/MPG/PG(SSG)/2012/149) tosupport and carry out this research. The authors are thankful to T.Narayan Rao for meteorological data, and Rohit J. and V. Ravi Kiranfor their support during the campaign at Gadanki. We alsoacknowledge NASA GES DISC for providing OMI and MODISretrieved tropospheric NO2 column and cloud fraction data,respectively. We also acknowledge the NOAA ARL for providingHYSPLIT air mass back trajectory calculations. The authors are alsothankful to the team at GRIMM Aerosol Technik, Ainring, Germanyfor their constant help and support through Alfatech Services. Weare also grateful to two anonymous reviewers for their time andconstructive comments that helped us to improve the overallquality of the manuscript.
Appendix A. Supplementary data
Supplementary data related to this article can be found at http://dx.doi.org/10.1016/j.atmosenv.2014.05.046.
References
Almeida, J., et al., 2013. Molecular understanding of sulphuric acid-amine particlenucleation in the atmosphere. Nature 502, 359e363.
Andreae, M.O., 2013. The aerosol nucleation puzzle. Science 339, 911e912.Andreae, M.O., Rosenfeld, D., 2008. Aerosolecloudeprecipitation interactions. Part
1. The nature and sources of cloud-active aerosols. Earth-Sci. Rev. 89, 13e41.Ball, S.M., Hanson, D.R., Eisele, F.L., McMurry, P.H., 1999. Laboratory studies of par-
ticle nucleation: initial results for H2SO4, H2O, and NH3 vapors. J. Geophys. Res.104, 23709e23718.
Birmili, W., Wiedensohler, A., 2000. New particle formation in the continentalboundary layer: meteorological and gas phase parameter influence. Geophys.Res. Lett. 27, 3325e3328.
Boy, M., Kulmala, M., 2002. Nucleation events in the continental boundary layer:influence of physical and meteorological parameters. Atmos. Chem. Phys. 2,1e16.
Boy, M., Rannik, U., Lehtinen, K.E.J., Tarvainen, V., Hakola, H., Kulmala, M., 2003.Nucleation events in the continental boundary layer: long-term statistical an-alyses of aerosol relevant characteristics. J. Geophys. Res. 108, D21.
Cheung, H.C., Chou, C.C.K., Huang, W.R., Tsai, C.Y., 2013. Characterization of ultrafineparticle number concentration and new particle formation in an urban envi-ronment of Taipei, Taiwan. Atmos. Chem. Phys. 13, 8935e8946.
Clarke, A.D., 1992. Atmospheric nuclei in the remote free-troposphere. J. Atmos.Chem. 14, 479e488.
Dal Maso, M., Kulmala, M., Riipinen, I., Wagner, R., Hussein, T., Aalto, P.,Lehtinen, E.J., 2005. Formation and growth rates of fresh atmospheric aerosols:eight years of aerosol size distribution data from SMEARII, Hyytiälä, Finland.Boreal Environ. Res. 10, 323e336.
Draxler, R.R., Rolph, G.D., 2010. HYSPLIT (HYbrid Single-Particle Lagrangian Inte-grated Trajectory) Model Access via NOAA ARL READY. NOAA Air ResourcesLaboratory, Silver Spring, MD. Website. http://ready.arl.noaa.gov/HYSPLIT.php.
Garg, A., Kapshe, M., Shukla, P.R., Ghosh, D., 2002. Large point source (LPS) emis-sions from India: regional and sectoral analysis. Atmos. Environ. 36, 213e224.
Hamed, A., Joutsensaari, J., Mikkonen, S., Sogacheva, L., dal Maso, M., Kulmala, M.,Cavalli, F., Fuzzi, S., Facchini, M.C., Decesari, S., Mircea, M., Lehtinen, K.E.J.,Laaksonen, A., 2007. Nucleation and growth of new particles in Po Valley, Italy.Atmos. Chem. Phys. 7, 355e376.
Hamed, A., Korhonen, H., Sihto, S.-L., Joutsensaari, J., Jarvinen, H., Petaja, T.,Arnold, F., Nieminen, T., Kulmala, M., Smith, J.N., Lehtinen, K.E.J., Laaksonen, A.,2011. The role of relative humidity in continental new particle formation.J. Geophys. Res. 116, D3.
Hoffmann, T., Bandur, R., Marggraf, U., Linscheid, M., 1998. Molecular composition oforganic aerosols formed in the a-pinene/O3 reaction: implications for newparticle formation processes. J. Geophys. Res. 103, 25569e25578.
Hyvärinen, A.-P., Lihavainen, H., Komppula, M., Panwar, T.S., Sharma, V.P.,Hooda, R.K., Viisanen, Y., 2010. Aerosol measurements at the Gual PahariEUCAARI station: preliminary results from in-situ measurements. Atmos. Chem.Phys. 10, 7241e7252.
Hyvärinen, A.-P., Raatikainen, T., Komppula, M., Mielonen, T., Sundström, A.-M.,Brus, D., Panwar, T.S., Hooda, R.K., Sharma, V.P., de Leeuw, G., Lihavainen, H.,2011. Effect of the summer monsoon on aerosols at two measurement stationsin Northern India e part 2: physical and optical properties. Atmos. Chem. Phys.11, 8283e8294.
Kanamitsu, M., 1989. Description of the NMC global data assimilation and forecastsystem. Weather Forecast 4, 335e342.
Kanawade, V.P., Benson, D.R., Lee, S.-H., 2012. Statistical analysis of 4-year obser-vations of aerosol sizes in a semi-rural continental environment. Atmos. Envi-ron. 59, 30e38.
Kanawade, V.P., Tom Jobson, B., Guenther, A.B., Erupe, M.E., Pressely, S.N.,Tripathi, S.N., Lee, S.-H., 2011. Isoprene suppression of new particle formation inmixed deciduous forest. Atmos. Chem. Phys. 11, 6013e6027.
Kanawade, V.P., Tripathi, S.N., Siingh, D.K., Gautam, A.S., Srivastava, A.K., Kamra,A.K., Soni, V.K., Sethi, V., 2014. Personal communication.
Kerminen, V.-M., Lihavainen, H., Komppula, M., Viisanen, Y., Kulmala, M., 2005.Direct observational evidence linking atmospheric aerosol formation and clouddroplet activation. Geophys. Res. Lett. 32, L14803.
Kirkby, J., et al., 2011. Role of sulphuric acid, ammonia and galactic cosmic rays inatmospheric aerosol nucleation. Nature 476, 429e433.
Kristensson, A., Dal Maso, M., Swietlicki, E., Hussein, T., Zhou, J., Kerminen, V.M.,Kulmala, M., 2008. Characterization of new particle formation events at abackground site in Southern Sweden: relation to air mass history. Tellus B 60,330e344.
Kulmala, M., dal Maso, M., Makela, J.M., Pirjola, L., Vakeva, M., Aalto, P.,Miikkulainen, P., Hameri, K., O’Dowd, C.D., 2001. On the formation, growth, andcomposition of nucleation mode particles. Tellus 53B, 479e490.
Kulmala, M., Kontkanen, J., Junninen, H., Lehtipalo, K., Manninen, H.E., Nieminen, T.,Petäjä, T., Sipilä, M., Schobesberger, S., Rantala, P., Franchin, A., Jokinen, T.,Järvinen, E., Äijälä, M., Kangasluoma, J., Hakala, J., Aalto, P.P., Paasonen, P.,Mikkilä, J., Vanhanen, J., Aalto, J., Hakola, H., Makkonen, U., Ruuskanen, T.,Mauldin, R.L., Duplissy, J., Vehkamäki, H., Bäck, J., Kortelainen, A., Riipinen, I.,Kurtén, T., Johnston, M.V., Smith, J.N., Ehn, M., Mentel, T.F., Lehtinen, K.E.J.,Laaksonen, A., Kerminen, V.-M., Worsnop, D.R., 2013. Direct observations ofatmospheric aerosol nucleation. Science 339, 943e946.
Kulmala, M., Petäjä, T., Nieminen, T., Sipilä, M., Manninen, H.E., Lehtipalo, K., DalMaso, M., Aalto, P.P., Junninen, H., Paasonen, P., Riipinen, I., Lehtinen, K.E.J.,Laaksonen, A., Kerminen, V.-M., 2012. Measurement of the nucleation of at-mospheric aerosol particles. Nat. Protoc. 7, 1651e1667.
Kulmala, M., Vehkamaki, H., Petaja, T., dal Maso, M., Lauri, A., Kerminen, V.M.,Birmili, W.H., McMurry, P.H., 2004. Formation and growth rates of ultrafineatmospheric particles: a review of observations. J. Aerosol Sci. 35, 143e176.
Lee, S.-H., Reeves, J.M., Wilson, J.C., Hunton, D.E., Viggiano, A.A., Miller, T.M.,Ballenthin, J.O., Lait, L.R., 2003. Particle formation by ion nucleation in the uppertroposphere and lower stratosphere. Science 301, 1886e1889.
McMurry, P.H., Fink, M., Sakuri, H., Stolzenburg, M., Mauldin III, R.L., Smith, J.,Eisele, F.L., Moore, K., Sjostedt, S., Tanner, D., Huey, L.G., Nowak, J.B., Edgerton, E.,Voisin, D., 2005. A criterion for new particle formation in the sulfur-rich Atlantaatmosphere. J. Geophys. Res. 110, D22.
Merikanto, J., Spracklen, D.V., Mann, G.W., Pickering, S.J., Carslaw, K.S., 2009. Impactof nucleation on global CCN. Atmos. Chem. Phys. 9, 8601e8616.
Metzger, A., Verheggen, B., Dommen, J., Duplissy, J., Prevot, A.S.H., Weingartner, E.,Riipinen, I., Kulmala, M., Spracklen, D.V., Carslaw, K.S., Baltensperger, U., 2010.Evidence for the role of organics in aerosol particle formation under atmo-spheric conditions. Proc. Natl. Acad. Sci. USA 107, 6646e6651.
Mönkkönen, P., Koponen, I.K., Lehtinen, K.E.J., Hämeri, K., Uma, R., Kulmala, M.,2005. Measurements in a highly polluted Asian mega city: observations ofaerosol number size distribution, modal parameters and nucleation events.Atmos. Chem. Phys. 5, 57e66.
Moorthy, K.K., Sreekanth, V., Prakash Chaubey, J., Gogoi, M.M., Suresh Babu, S.,Kumar Kompalli, S., Bagare, S.P., Bhatt, B.C., Gaur, V.K., Prabhu, T.P., Singh, N.S.,2011. Fine and ultrafine particles at a nearefree tropospheric environment overthe high-altitude station Hanle in the Trans-Himalaya: new particle formationand size distribution. J. Geophys. Res. 116, D20212.
V.P. Kanawade et al. / Atmospheric Environment 94 (2014) 264e273 273
Neitola, K., Asmi, E., Komppula, M., Hyvärinen, A.-P., Raatikainen, T., Panwar, T.S.,Sharma, V.P., Lihavainen, H., 2011. New particle formation infrequentlyobserved in Himalayan foothills e why? Atmos. Chem. Phys., 8447e8458.
O’Dowd, C.D., AAlto, P., Hameri, K., Kulmala, M., Hoffmann, M.R., 2002. Atmosphericparticles from organic vapors. Nature 416, 497e498.
Padma Kumari, B., Londhe, A.L., Daniel, S., Jadhav, D.B., 2007. Observational evi-dence of solar dimming: offsetting surface warming over India. Geophys. Res.Lett. 34, L21810.
Pierce, J.R., Adams, P.J., 2009. Uncertainty in global CCN concentrations from uncertainaerosol nucleation and primary emission rates. Atmos. Chem. Phys. 9, 1339e1356.
Pöhlker, C., Wiedemann, K.T., Sinha, B., Shiraiwa, M., Gunthe, S.S., Smith, M., Su, H.,Artaxo, P., Chen, Q., Cheng, Y., Elbert, W., Gilles, M.K., Kilcoyne, A.L.D.,Moffet, R.C., Weigand, M., Martin, S.T., Pöschl, U., Andreae, M.O., 2012. Biogenicpotassium salt particles as seeds for secondary organic aerosol in the Amazon.Science 337, 1075e1078.
Schwartz, S.E., 1996. The whitehouse effect e shortwave radiative forcing of climateby anthropogenic aerosol: an overview. J. Aerosol Sci. 27, 359e382.
Seinfeld, J.H., Pandis, S.N., 2006. Atmospheric Chemistry and Physics: from AirPollution to Climate Change, second ed. John Wiley and Sons Inc., New York.
Siingh, D., Gautam, A.S., Kamra, A.K., Komsaare, K., 2013. Nucleation events for theformation of charged aerosol particles at a tropical station e preliminary re-sults. Atmos. Res. 132e133, 239e252.
Sipila, M., Berndt, T., Petaja, T., Brus, D., Vanhanen, J., Stratmann, F., Patokoski, J.,Mauldin III, R.L., Hyvarinen, A.-P., Lihavainen, H., Kulmala, M., 2010. The role ofsulfuric acid in atmospheric nucleation. Science 327, 1243e1246.
Spracklen, D.V., Carslaw, K.S., Kulmala, M., Kerminen, V.-M., Sihto, S.-L., Riipinen, I.,Merikanto, J., Mann, G.W., Chipperfield, M.P., Wiedensohler, A., Birmili, W.,
Lihavainen, H., 2008. Contribution of particle formation to global cloudcondensation nuclei concentrations. Geophys. Res. Lett. 35, L06808.
Stanier, C.O., Khlystov, A.Y., Pandis, S.N., 2004a. Ambient aerosol size distributionsand number concentrations measured during the Pittsburgh Air Quality Study(PAQS). Atmos. Environ. 38, 3275e3284.
Stanier, C.O., Kylstov, A.Y., Pandis, S.N., 2004b. Nucleation events during the Pitts-burgh air quality study: description and relation to key meteorological, gasphase, and aerosol parameters. Aerosol. Sci. Technol. 38, 253e264.
Twomey, S., 1991. Aerosols, clouds, and radiation. Atmos. Environ. 25, 2435e2442.Vana, M., Ehn, M., Petäjä, T., Vuollekoski, H., Aalto, P., de Leeuw, G., Ceburnis, D.,
O’Dowd, C.D., Kulmala, M., 2008. Characteristic features of air ions at MaceHead on the west coast of Ireland. Atmos. Res. 90, 278e286.
Venzac, H., Sellegri, K., Laj, P., Villani, P., Bonasoni, P., Marinoni, A., Cristofanelli, P.,Calzolari, F., Fuzzi, S., Decesari, S., Facchini, M.-C., Vuillermoz, E., Verza, G.P.,2008. High frequency new particle formation in the Himalayas. Proc. Natl. Acad.Sci. USA 105, 15666e15671.
Wang, F., Zhang, Z., Massling, A., Ketzel, M., Kristensson, A., 2013. Particle formationevents measured at a semirural background site in Denmark. Environ. Sci. Poll.Res. 20, 3050e3059.
Wang, M., Penner, J.E., 2009. Aerosol indirect forcing in a global model with particlenucleation. Atmos. Chem. Phys. 9, 239e260.
Yu, F., Turco, R.P., 2008. Case studies of particle formation events observed in borealforests: Implications for nucleation mechanisms. Atmos. Chem. Phys. 8, 6085e6102.
Zhang, R., Suh, J., Zhao, J., Zhang, D., Fortner, E.C., Tie, X., Molina, M.T., Molina, M.,J.,2004. Atmospheric new particle formation enhanced by organic acids. Science304, 1487e1490.