Infrastructure Statistics Kerala 2015-16
100
-
Upload
khangminh22 -
Category
Documents
-
view
1 -
download
0
Transcript of Infrastructure Statistics Kerala 2015-16

STORAGE


Report on Infrastructure Statistics 2015-16
Department of Economics and Statistics, Government Kerala


P R E F A C E
Infrastructure development in the State has been receiving the much needed thrust.
Several major projects will become operational in the coming years. Through Kerala
Infrastructure Investment Fund Board, the State is aiming to address the constraints of
resource availability in financing infrastructure projects. This has been one of the innovative
and decisive steps taken by State. This report provides a single comprehensive and reliable
statistics for the variants such as transport, energy, communications, water infrastructure
and food grains storage facility. The State is creating a niche in the field of startups and has
taken several encouraging measures in this regard. Much procurement is to be needed in the
field of energy as the State relies heavily on hydro sources of power for generation of
electricity. The deficient rainfall has worsened the situation on this front. Availability of a
sound infrastructure, including power supply is required to support the other sectors of the
economy. The renewed thrust and focus on infrastructure needs to be continued with vigour
for propelling the State's economic growth as well as social prosperity.
I express my deep gratitude to all the data source agencies for their active co-
operation, contribution and support extended without which it would have not been possible
to this department to bring out this publication.
This publication is an effort of I & ES Wing at the Publication Division under the
leadership of Sri. P.V. Babu, Addl. Director (General). Comments and suggestions with
regard to the improvement of the report is highly appreciated including the quality, contents
and presentation of report.
Thiruvananthapuram
20/02/2020 V. RAMACHANDRAN
Director


Infrastructure Statistics 2015-16
i
C O N T E N T
Descriptive Item Page No.
PREFACE
INTRODUCTION 1
CHAPTERS 1 TRANSPORT 2
2 ENERGY 21
3 COMMUNICATION 26
4 IRRIGATION 28
5 DRINKING WATER 30
6 STORAGE FACILITY 34
Tables / Appendix
CHAPTER 1 ROAD TRANSPORT
11 District wise, Category wise length of Roads maintained by PWD 2015-16 (in km) 36
1.2 Agency wise distribution of State Roads during 2015-16 37
1.3 Category wise length of roads (in km) 37
1.4 Details of Bridges, Flyovers and Culverts in Roads 2015-16 37
1.5 Roads density (in km) 2013-14 to 2015-16 38
1.6 District-wise Category wise number of Newly Registered Motor vehicles during 2015-16 38
1.7 Valid registered motor vehicles in districts 2015-16 39

Infrastructure Statistics 2015-16
ii
1.8 Category-wise number of newly motor vehicles from 2011-12 to 2015-16 40
1.9 Details of road accidents in Kerala over the previous years 2001 to 2016 41
1.2 Kerala State Road Transport Corporation (KSRTC)
1.10 District-wise operational statistics of KSRTC during 2015-16 42
1.11 Major indicators showing operational efficiency of KSRTC/KURTC 2014-15 & 2015-16 43
1.12 District wise category wise vehicle density during 2015-16 44
1.13 Details of Buses owned by KSRTC 44
1.14 District wise & category wise cumulative number of registered vehicles as on 31/03/2016 45
1.15 Vehicle penetration per 1000 population 46
1.16 State & National comparison of vehicle density and vehicle penetration from 2011-12 to 2015-16 46
1.3 WATER TRANSPORT
1.17 Navigable water ways 2015-16 ( Canal / Lake ) 47
1.18 Inland water vessels 2015-16 47
1.19 No. and tonnage of steamers and sailing vessels in minor ports during 2015-16 48
1.20 Inland water transport , length of water ways (kms ) 49
1.21 Navigable water ways 2015-16 ( other water ways ) 49
1.22 Navigable water ways ( Rivers ) 50
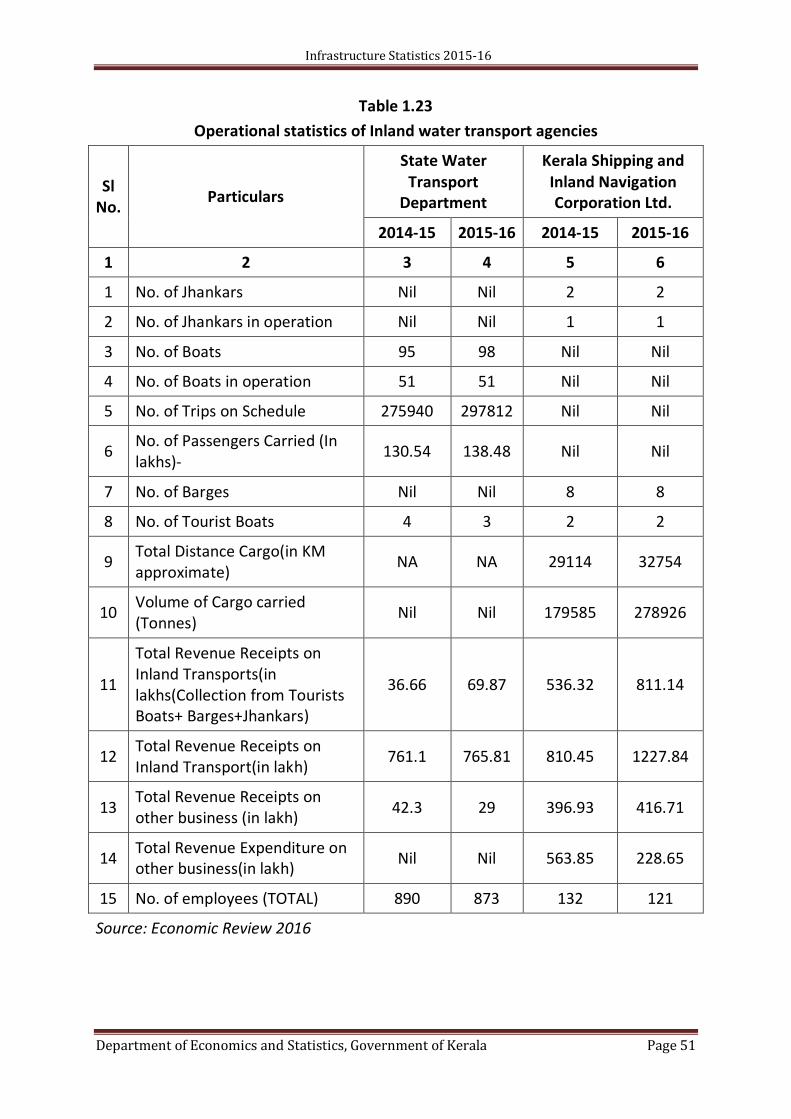
1.23 Operational Statistics of Inland Water Transport Agencies in Kerala 51
1.4 RAIL TRANSPORT

Infrastructure Statistics 2015-16
iii
1.24 Railway route in Kerala ( guage wise ) ( in km) 52
1.25 Railway route in Kerala ( in km) 52
1.26 Quality 52
1.27 Division wise category wise staff 2015-16 53
1.28 Number of Guage wise stations 2015-16 53
1.29 Details of electrification 54
1.5 AIR TRANSPORT
1.30 List of Airports 54
1.31 Details of flights operated by various agencies from Thiruvananthapuram International airport 2015-16 55
1.32 Details of flights operated by various agencies from Cochin International airport 2015-16 56
1.33 Details of flights operated by various agencies from Kozhikkode International airport 2015-16 57
1.34
Passenger traffic, Aircraft Movements & Cargo movement in Thiruvananthapuram, Cochin, Kozhikode International Airports 2015-16
58
CHAPTER 2 ENERGY
2.1 Energy source in Kerala 2011-12 to 2015-16 59
2.2 Total installed Capacity in Kerala 2011-12 to 2015-16 60
2.3 Details of Power Availability 2011-12 to 2015-16 60
2.4 Transmission Infrastructure 2015-16 61
2.5 Transmission Infrastructure owned by KSEB 2015-16 61
2.6 Power Consumption (in MU) and Revenue Collected in Kerala 2015-16 (Rs. In Lakhs) 62

Infrastructure Statistics 2015-16
iv
2.7 Targets and Achievements of distribution Infrastructure 2015-16 63
2.8 Transmission & Distribution Lines 2011-12 to 2015-16 63
2.9 Pump sets, Street lights and Distribution Transformers 2011-12 to 2015-16 64
2.10 Consumers and Connected Load 2011-12 to 2015-16 64
2.11 Generating Capacity, Maximum Demand and Load Factor 2011-12 to 2015-16 65
2.12 Details of KSEB Access 2015-16 65
CHAPTER 3 COMMUNICATION
3.1 Division-wise and Category-wise Post Offices under Kerala Circle 2015-16 68
3.2 District wise Details of Telephone Net Work during 2015-16 69
3.3 Details of Akshaya Centres in Kerala 70
CHAPTER 4 IRRIGATION
4.1 Net Area Irrigated - District wise & Source Wise 2015-16 71
4.2 Net Area Irrigated - Source Wise 2014-15 & 2015-16 72
4.3 Live Storage Position in the Reservoirs 72
4.4 Average for 10 years Storage Position in the Reservoirs 72
CHAPTER 5 DRINKING WATER SUPPLY AND SANITATION
5.1 District wise population covered by Water Supply Scheme 2015-16 73
5.2 District wise number of Water Supply connections and Street Taps 2015-16 74
5.3 District and Category wise Number of Water Supply scheme KWA 2015-16 75

Infrastructure Statistics 2015-16
v
5.4 District wise & category wise number of ongoing water supply schemes during 2015-16 76
5.5 Households by location of source of drinking water in Kerala 77
5.6 District wise details of open defecation free(ODF) declared in Grama panchayats in Kerala 78
CHAPTER 6 STORAGE FACILITIES
6.1 Public Distribution System in Kerala - 2010-11 to 2015-16 79
6.2 Outlets opened by the Civil Supplies Corporation in Kerala 2010-11 to 2015-16 82
6.3 Number of FCI Depots 81
6.4 District wise details of State warehouses, Central warehouses, Cold storages and Container depots 82
6.5 Details of Storage Capacity 83
6.6 Distribution of Rice, Wheat, Kerosene & Sugar through the PDS in Kerala 2010-11 to 2015-16 85
6.7 Details of Cargo storage 85


Infrastructure Statistics 2015-16
Department of Economics and Statistics, Government of Kerala Page 1
INTRODUCTION
Infrastructure Statistics
In India, the notion of infrastructure was discussed extensively by the
Rangarajan Commission while examining the statistical system of India. The
Commission stated that the Infrastructure is important in determining the availability
of inputs that are crucial to a wide variety of productive activities and an important
input for industrial and overall economic development of a country. There is no clear
cut definition of infrastructure nor did its characteristics define which can
differentiate infrastructure sectors from other sectors. Based on the necessity of
infrastructure activities like Power, Transport, Telecommunication, water, sanitation,
disposal of waste etc which are central to the activities of household and economic
production, these could be treated as essential inputs to the economic system.
Although definition and concepts of infrastructure has different meanings in
different contexts, Central Statistical Office (CSO) has compiled statistical publication
on economic infrastructure of the country i.e. infrastructure required to facilitate the
economic development of the country.
The publication includes statistical information on various aspects of
infrastructure subsectors like Transport, Energy, Communication, Drinking water and
Sanitation, irrigation and storage that were recommended by the Standing Committee
on Infrastructural Statistics (SCINS) , Government of India based on the above
parameters.
It was felt that a similar publication needs to be compiled at state level as that
would facilitate the planning of infrastructure at state level. “Infrastructural
Statistics” is prepared to guide the State Statistics Offices in preparing State level
Infra structure statistics. Thereupon DES started publishing “Infrastructural Statistics
Kerala” from 2012-13 onwards collecting data from secondary sources like State
Planning Board, various Central Ministries, and State Government departments
dealing with infrastructure subsectors.

Infrastructure Statistics 2015-16
Department of Economics and Statistics, Government of Kerala Page 2
Chapter - 1
TRANSPORT
1.1 Introduction
The various means of Transport available in Kerala are; road transport, rail
transport, air transport and water transport. Road transport is the dominant mode
both in terms of share in passenger and in terms of contribution to the state
economy. The transport system consists of 2.01 lakh km of roads, 1050 km of
railways, and 837 km of inland water ways and 111 statute miles of airways. This
chapter provides data on different transport parameters. It focuses on the
contribution of transport sector in state economy, information on the road network
in the state, in terms of National Highways, State Highways, and Other PWD Roads
etc. Apart from this, the information on registered motor vehicle population has
been provided in this report. Another major areas covered are; water transport, rail
transport and air transport. The data and indicators presented in this chapter are
based on the details provided by State Public Works department, Kerala State Road
Transport Corporation, Motor Vehicle Department, State Crime Records Bureau,
Trivandrum Railway Division, Palakkad Railway Division, Port Trust Kerala, Irrigation
Department, Cochin Airport Authority, Directorate of Civil Aviation etc.
1.2 Contribution of Transport Sector in State Domestic Product
The contribution from transport sector to Gross State Domestic Product
(GSDP) in 2011-12 at constant price (with base 2011-12) was 6.58%. It increased to
6.7% in 2012-13 and to 6.92% in 2013-14. During 2014-15, it slightly decreased to
6.9% and further to 6.61% in 2015-16. Out of the total share of 6.61% of the GSDP
from transport sector in 2015-16, road transport sub-sector accounted for 5.81%
followed by railways (0.33%), air transport (0.26%) and water transport (0.04%).

Infrastructure Statistics 2015-16
Department of Economics and Statistics, Government of Kerala Page 3
The share of various sub-sectors of the transport sector in the State and
National GDP since 2011-12 is given in Table 1.2.1. While comparing the contribution
of transport sector in State and National GDP, it is seen that, contribution of
transport sector in Kerala state economy is always higher than the national average.
In 2011-12, the transport sector contributed around 6.58% on the state GDP. Then it
slightly increased to 6.7% in 2012-13 and to 6.92% in 2013-14.
Table 1.2.1: Contribution of transport sector in GDP (base 2011-12)
Sector 2011-12 2012-13 2013-14 2014-15 2015-16
Kerala India Kera
la India Kerala India Kera
la India Kerala India
Railways 0.29 0.75 0.33 0.81 0.32 0.8 0.33 0.81 0.33 0.82
Road Transport 5.95 3.24 5.98 3.3 6.29 3.3 6.18 3.28 5.81 3.26
Water Transport 0.08 0.09 0.07 0.08 0.05 0.08 0.06 0.08 0.04 0.08
Air Transport 0.08 0.05 0.14 0.05 0.1 0.05 0.16 0.05 0.26 0.06
Services Incidental to Transport 0.18 0.78 0.18 0.78 0.16 0.77 0.17 0.77 0.17 0.77
Transport - Total 6.58 4.91 6.7 5.02 6.92 5 6.9 4.99 6.61 4.99
1.3 Road Transport:
Road transport is the most commonly used mode of transport within the
state. Roads are the primary infrastructure for road transport. Kerala road network
includes national highways, state highways, district roads, rural roads, urban roads
and project roads. As on 31st march, 2016, Kerala has a wide network of roads
comprising of 2.01 lakh kilometers. Chart 2.3.1 gives the category wise length of
roads as on 31st march 2016 in Kerala. It can be seen from the chart that the share of
rural roads was the highest in the total road length(64%) followed by urban roads
(15%), district roads (14%) project roads (4%), state highway (2%) and national
highway (1 %).

Infrastructure Statistics 2015-16
Department of Economics and Statistics, Government of Kerala Page 4
Chart 1.3.1: Category wise length of roads as on 31st march 2016
Category wise length of roads as on 31st March 2016, at the State and National levels
can be seen in able 2.3 of Appendix A.
1.3.1 Road Density (per Land/Population)
Road density per land is the ratio of length of total road network to the total
geographical area. As on 31st March 2016, Kerala has a road density of 517 km/100
Sq.Km, which is far ahead of national average of 170 Km/100 Sq.Km. The road
density per land in Kerala has increased from 497.88 km as on 31st march, 2014 to
516.78 km as on 31st march, 2016, registering a growth rate of 4%

Infrastructure Statistics 2015-16
Department of Economics and Statistics, Government of Kerala Page 5
Chart 1.3.1.1: Road density per land
The road density per population, defined as the average road length per 1000
population, was 6.01km in Kerala, as on 31st march, 2016. This was around 1.38 km
higher than the national level figure (at the national level, this was 4.63 km). At the
state level, density per 1000 population increased from 5.79 km as on 31st march,
2014 to 6.01 km as on 31st march, 2016, whereas at the national level this increased
from 4.36 km to 4.63 km during this period.
Chart 1.3.1.2: Road density per population

Infrastructure Statistics 2015-16
Department of Economics and Statistics, Government of Kerala Page 6
1.3.2 Public Works Department Maintained Roads:
Kerala Public Works Department (PWD) plays a major role in the construction
and maintenance of National Highways, State Highways and Major District Roads.
The National Highways are maintained by PWD for the Government of India. State
Highways and Major District Roads are managed by Public Works Department with
state funds.
The district wise share of roads maintained by the PWD is represented in
Chart-1.3.2.1. Of the 14 districts in the state, Kottayam district has the largest share
(11%) of PWD roads with a length of 3456.214 kms followed by Eranakulam with
3085.281 kms (10%) and Idukki with 2867.366 kms (9%). Wayanad has the lowest
share with only 3% (1029.314 kms) of the total PWD maintained roads. District wise
and category wise length of roads maintained by PWD during 2015-16 prescribed in
Table 1.1 of Annexure A
Chart 1.3.2.1: District wise share of PWD roads in Kerala
TVPM8%
KLM7%
PTA6%
ALP5%
KTM11%
IDK9%EKM
10%
TCR6%
PKD7%
MLP8%
KKD8%
WND3%
KNR7%
KGD5%
share of PWD roads
TVPM
KLM
PTA
ALP
KTM
IDK
EKM
TCR
PKD
MLP
KKD
WND
KNR

Infrastructure Statistics 2015-16
Department of Economics and Statistics, Government of Kerala Page 7
1.3.3 Newly Registered Motor Vehicles
Category-wise number of newly registered vehicles during the periods 2011-
12, 2012-13, 2013-14, 2014-15 and 2015-16 are given in the Table 1.3.3.1. The total
number of newly registered motor vehicles increased from 8.4 lakh in 2011-12 to 9.7
lakh in 2012-13. After that it has shown a downward trend and reached 8.6 lakh in
2015-16. Category wise number of newly registered vehicles from 2011-12 to 2015-
16 is given in the table 1.3.3.1.
Table 1.3.3.1: Category wise number of newly registered vehicles from 2011-12 to 2015-16
Vehicle Category
Number of newly registered vehicles
2011-12 2012-13 2013-14 2014-15 2015-16
Goods 33595 36993 28917 19928 19310
Buses 5117 5800 5515 4588 5987
Four Wheelers 183383 186645 206750 186647 195692
Three Wheelers 68772 64998 37018 27951 23364
Two Wheelers 529338 654194 637546 634221 606669
Others 20672 17139 12972 8884 10301
Total 840877 965769 928718 882219 861323
A pictorial representation of percentage distribution of newly registered
motor vehicles during 2015-16 may be seen on Chart 1.3.3.1, below. It is clear from
the chart that, during 2015-16, out of the newly registered vehicles in Kerala, 70%
were two wheelers and 23% were four wheelers. The combined share of goods
vehicles, buses, three wheelers tractors and others was only 7%.

Infrastructure Statistics 2015-16
Department of Economics and Statistics, Government of Kerala Page 8
Chart 1.3.3.1Percentage Distribution of newly registered vehicles during 2015-16
District wise and category wise number of vehicles registered during 2015-16
is presented in Table 1.6 and Table 1.7 of Appendix A. Apart from this detailed
category wise newly registered vehicles from 2011-12 to 2015-16 at state level is
included in Table 1.8 of Appendix A.
1.3.4 District -wise Distribution of Registered Motor Vehicle Population
Out of the total 101.72 lakh registered motor vehicles up to 31st March, 2016
in Kerala, Eranakulam accounted for the largest share (15%) followed by
Thiruvananthapuram (13%), Thrissur (10%), Kozhikode (9%) and Malappuram (9%).
These five districts together accounted for 56% of the total vehicles registered in the
state. Wayanad has the smallest share of 1% in the total registered motor vehicles in
Kerala. District wise number of registered motor vehicles up to the period 31st
March 2016 is illustrated in Chart-2.3.4.1below. District wise broad category-wise
number of registered vehicles in 2016 is shown at Table 2.13 of Appendix A

Infrastructure Statistics 2015-16
Department of Economics and Statistics, Government of Kerala Page 9
Chart 1.3.4.1: Total number of registered motor vehicles (as on 31/03/2016)
Ernakulum (16%), Thiruvananthapuram(13%) and Thrissur(10%) districts
together accounted morethan one-third of the total registered cars in Kerala. In the
case of two wheelers these three districts (Ernakulum -16%, Thiruvananthapuram -
13% and Thrissur – 11%) together accounted about 40% to the total two wheelers.

Infrastructure Statistics 2015-16
Department of Economics and Statistics, Government of Kerala Page 10
Chart 1.3.4.2: Total number of registered motor vehicles
The total number of registered motor vehicles in Kerala has increased from
about 68.9 lakh in 2011-12 to 101.7 lakh in 2015-16 (shown in chart 1.3.4.2);
recording a growth rate of about 48%. At the national level the total number of
registered motor vehicles has increased from about 1594 lakh in 2011-12 to 2300
lakh in 2015-16, registering a growth rate of 44%.
1.3.5 Vehicle Density:
Vehicle density is the number of vehicles in Kerala per square kilometre of
road length. In 2011-12, vehicle density was 177 vehicles per square kilometer in
Kerala, which has gone up to 262 vehicles per sqkm during 2015-16. Kerala’s Vehicle
density during 2015-16 was almost four times higher than the corresponding number
at the national level. Vehicle density at the national and state levels during the
period from 2011-12 to 2015-16 is presented in chart 1.3.5.1

Infrastructure Statistics 2015-16
Department of Economics and Statistics, Government of Kerala Page 11
Chart 1.3.5.1: Vehicle density during the period from 2011-12 to 2015-16
The Chart 1.3.5.1 shows that, vehicle density at both national and state levels
have grown over the last five years. The vehicle density in Kerala grew 48% between
2011-12 and 2015-16 and the vehicle density at national level was up by about 43%
during the last five years.
The chart 1.3.5.2 gives the comparison of districts of Kerala according to the
value of vehicle density as on 31/03/2016. This chart clearly shows that
Thiruvananthapuram is the most vehicle-dense district with 590 vehicles for every
one kilometer of road, which is almost two times higher than the corresponding
state average. Ernakulum is the next most vehicle-dense district with 509 vehicles
per square kilometer followed by Alappuzha (493 vehicles) and Kozhikode (395
vehicles). Idukki and Wayanad stood last with 46 and 65 vehicle densities
respectively. The vehicle density for two wheelers and car at the district level during
2015-16 may be seen at Table 1.12 of Appendix A.
177202
226248
262
49 55 58 64 70
0
50
100
150
200
250
300
2011-12 2012-13 2013-14 2014-15 2015-16Kerala National

Infrastructure Statistics 2015-16
Department of Economics and Statistics, Government of Kerala Page 12
Chart 1.3.5.2 District-wise value of vehicle density
1.3.6 Vehicle Penetration:
Vehicular penetration is the number of vehicles per 1000 persons. The vehicle
penetration in Kerala as on 31/03/2016 was 304 (per 1000 people) and at the
national level this was 190. This implies that in Kerala, 304 people out of a thousand
owned any vehicle, while at the national level 190 people per 1000 owned a vehicle.
The penetration level of two wheelers and cars in Kerala as on 31/03/2016 is
presented in Table 1.3.6.1. In Kerala, 62 per 1000 owned car and 194 per 1000
owned two-wheeler.

Infrastructure Statistics 2015-16
Department of Economics and Statistics, Government of Kerala Page 13
Table 1.3.6.1; Vehicle Penetration
The data shows that there exist large intrastate disparities in vehicle
penetration. The following table gives the district-wise, vehicle category-wise vehicle
penetration as on 31/03/2016. Ernakulum is the district with the highest car
penetration in Kerala with 103 cars per 1000 persons. In Ernakulum, one out of every
ten owns a car. This was around three times higher than the car penetration of
Wayanad (34). The districts with the highest cars per 1000 people are Ernakulum
(103), Pathanamthitta (89), Kottayam (87) and Thiruvananthapuram (84). In terms of
car penetration Wayanad (34) is at the last position followed by Palakkad (35) and
Idukki (42).
Another point to be noted is that the two-wheeler penetration is much higher
in Kerala, compared to that of car penetration. In two-wheelers also Ernakulum
stood first with 306 two-wheelers per 1000 persons. Unlike in the case of car
penetration, Thiruvananthapuram attained the second position with 253 two-
wheelers per 1000 persons. In terms of car penetration, Thiruvananthauram was
only at the 4th position. The districts Pathanamthitta and Kottayam were at the 2nd
and 3rd positions respectively, in terms of car penetration whereas in two-wheeler
penetration these districts were at 5th and 8th positions respectively.

Infrastructure Statistics 2015-16
Department of Economics and Statistics, Government of Kerala Page 14
Table 1.3.6.2; District-wise, category-wise vehicle penetration
1.3.7 Kerala State Road Transport Corporation:
The Kerala State Road Transport Corporation (KSRTC) is the large public sector
corporation in Kerala. KSRTC provides bus-based public transport system and offers a
cost effective alternative to various modes of transport in urban and rural areas.
During 2015-16, a total of 10137.76 lakh passengers travelled in KSRTC. As on
31/03/2016, the corporation has 6399 schedules and 6304 buses. The average
earnings per kilometer works out to round about Rs. 29.67 and the average earnings
per bus works out to Rupees 9918. During the period 2015-16 KSRTC had a gross

Infrastructure Statistics 2015-16
Department of Economics and Statistics, Government of Kerala Page 15
revenue of Rs. 2,165.16 crore, gross expenditure of Rs. 2778crore and the operating
loss estimated was around Rs. 613.14 crores.
Chart 1.3.7.1: Major internal indicators of KSRTC
1.3.8 Road Accidents:
A total of 39014 road accidents have been reported in Kerala in the calendar
year 2015, claiming 4196 lives and causing injuries to 43735 persons. That is, in the
calendar year 2015, on an average 107 accident and 12 accidental deaths happened
every day in Kerala. An overview of road accidents from 2005 to 2015 is presented in
chart 2.3.8.1. The chart shows a fluctuating trend in the incidence of road accidents.
It declined from 42363 in 2005 to 35216 in 2011 and thereafter showed an upward
trend and reached 39014 in 2015.

Infrastructure Statistics 2015-16
Department of Economics and Statistics, Government of Kerala Page 16
Chart 1.3.8.1 Road accidents during 2005 to 2015
In terms of accidents on road categories, the National Highways accounted for
24% of total road accidents and 33% of deaths in 2015. Accidents on State Highways
and other roads constitute 18% and 58% respectively. In case of fatality, State
Highways and other roads accounted for 20% and 47% of total road accident deaths,
respectively.
Two-wheelers accounted for the highest share in total road accidents (37%)
followed by the combined cars, jeeps and taxis category of vehicles (26%), then
buses (12%), three wheelers (12%), the combined vehicle category comprising trucks,
lorries, tempos, tractors etc (10%).
Chart 1.3.8.2: Accident Rate
0100002000030000400005000060000
2005 2006 2007 2008 2009 2010 2011 2012 2013 2014 2015
Accidents Persons Killed Persons injured

Infrastructure Statistics 2015-16
Department of Economics and Statistics, Government of Kerala Page 17
Accident rate is used to explain road accident relative to vehicular population
in the country. It is measured by the number of road accidents per 1000 vehicles.
Chart 2.3.8.2 gives the trend of road accident per 1000 registered vehicles in Kerala
and at the national level. The chart shows that, accident rate at both national and
state levels have declining trend over the last five years. The accident rate in Kerala
declined from 5.1 per 1000 vehicles in 2011 to 3.8 per 1000 vehicles in 2015. At the
national level this declined from 3.5 to 2.4 during the last five years.
1.4 Water transport:
Inland water transport is a fuel efficient and environment friendly mode of
transportation. Inland water transport for passengers and freight movement involves
lower operating cost and environmental pollution than road, rail or air mode. Inland
water transport in Kerala includes rivers, canals and backwaters. Govt. agencies
engaged in the operation of inland water transport are Coastal Shipping and Inland
Navigation Department, State Water Transport Department, and Kerala Shipping and
Inland Navigation Corporation Ltd.
Inland Waterways Authority of India (IWAI), a statutory body under the
Ministry of Shipping, is responsible for the planning, development, maintenance,
management and regulation of the national waterways in India. The West Coast
Canal of National Waterway No 3 is a 168-km stretch inland navigational route
located in Kerala, runs from Trivandrum to Kasargod. In addition to the main stretch,
Champakara (14km) and Udyogmandal(23km), Alappuzha – changanassery canal
(28km), Alappuzha – Kottayam Athirampuzha canal (38km) and Kottayam-Vaikom
canal (42 km) are navigable national waterways in Kerala.
1.5 Rail Transport:
Indian Railways is one of the world’s largest rail networks with 66687 route
kilometers of route lengths (as on 31 March, 2016). In Kerala, there is a well
connected network of Trains across the state connecting major cities and towns
except those in highlands Idukki and Wayanad district. Rail connectivity in the

Infrastructure Statistics 2015-16
Department of Economics and Statistics, Government of Kerala Page 18
southern side is better as compared to the northern region. The operations are
controlled by Thiruvananthapuram, Palakkad and Madurai divisions. The total route
length of railway in Kerala state is 1050 km, as on 31st march 2016. 989.82 km route
has been electrified under Thiruvananthapuram and Palakkad divisions and an
average of 165 and 159 trains running per day in Thiruvananthapuram and Palakkad
divisions respectively. Major internal indicators of Railway – Kerala region is given in
chart 1.5.1.
Chart 1.5.1: Performance of railway divisions in Kerala
1.6 Air Transport:
Air transport plays a significant role to provide connectivity to major cities
within the country and abroad. There are three international airports in Kerala,
handling both international and domestic flights. Thiruvananthapuram and Calicut
airports are owned by Airport Authority of India and the Kochi airport was developed
under Public Private Partnership.
Passenger, Aircraft & Cargo movement in airports are shown in table

Infrastructure Statistics 2015-16
Department of Economics and Statistics, Government of Kerala Page 19
Chart 1.6.1: Passengers carried per day (scheduled operations only)
In 2015-16, around 135 million people in India travelled by air. Among this
85.2 million were domestic passengers and 49.8 million were international
passengers. Out of the total 14.25 million air passengers in Kerala, 31.6% were
domestic passengers (4.51 million) and 68.4% were international passengers (9.74
million). The chart 1.6.1 gives the number of air passengers travelled per day in
scheduled operations.
In Kerala, a total of 98031 flights (57901 – international, 40130 – domestic)
took off during the year 2015-16, i.e. 11 flights per hour. In terms of number of
flights, Ernakulum International Airport stood first with 25953 domestic and 29798
international flights followed by Thiruvananthapuram (domestic – 9947,
international – 16429) and Kozhikode (domestic – 4230, international – 11674)
airports. Details of both Domestic and International flights operated by various
agencies from airports in Kerala are given in Table 1.38, Table 2.39 and Table 1.40 of
Appendix A.

Infrastructure Statistics 2015-16
Department of Economics and Statistics, Government of Kerala Page 20
During 2015-16, Indian and foreign airlines carried a total of 2028 metric
tonne of freight to, from and within India and approximately 240.796 metric tonne of
freight from airports in Kerala. The cargo movement from Kerala airports during
2015-16 is given in Chart 1.6.2.
Chart 1.6.2: Freight traffic in Metric Tonne (MT)

Infrastructure Statistics 2015-16
Department of Economics and Statistics, Government of Kerala Page 21
Chapter 2
ENERGY
Introduction
Energy plays a vital role in the socio economic development and human
welfare of the nation as it is required to meet the demand of industry, commerce
and domestic users. Growing economy needs to have stable and sustainable sources
of energy supply as it plays important role in production process. Affordable energy
directly contributes changes in the reduction of poverty, upliftment of productivity
and improvement of health and education system.
Power Sector in Kerala
Kerala generates power from four sources – hydel, thermal, wind and solar. Of
this hydel power generation is dominant whereas wind and solar power generation
make only marginal addition. Monsoon is essential to withstand the hydro power
base and storage in rainfall usually arises power crisis since hydel energy is most
reliable and dependable source. The most visible form of energy, identified as the
power commonly called electricity. In 1957 Kerala State Electricity board was
established under the authority of Department of power in Kerala government. Then
onwards the board had taken seasonal initiatives for the physical and financial
improvement of the sector. KSEB is responsible for the production transmission and
supply of electrical energy from hydroelectric power project
Total Installed Capacity during 2015-16
Total installed capacity of power in the State as on March 2016 is 2880.20
MW. Of which, hydel contributed the major share of 2104.3 MW (73.06 per cent);
while 718.46 MW was contributed by thermal projects, 43.27 MW from wind and
14.15 MW from solar. The total installed capacity of Kerala from hydel, thermal and
renewable sources.

Infrastructure Statistics 2015-16
Department of Economics and Statistics, Government of Kerala Page 22
Source: KSEB
The total additional capacity added from all sources during 2015-16 was 44.5 MW
and scheme wise addition are detailed below
Sl.No Name of Power stations Installed Capacity (MW) Date of commissioning Hydel Solar Wind
1 Chimmony HEP 2.5 22.05.2015 2 Adyanpara HEP 3.5 03.09.2015 3 Barapole HEP 15 29.02.2016 4 Peringalkuthu HEP (capacity
enhancement) 1 29.5.2015
5 Solar Kanjikkode 1 20.08.2015 6 Solar Power Project at
Chalayoor Colony, Agali 0.096 31.8.2015
7 Solar Power Project at Peringalkuthu Power House
0.05 10.9.2015
8 Solar Power Project at Banasurasagar,Wayanad
0.01 21.01.2016
9 Wind Power Project by M/s. Ahali Alternate Energy Pvt Ltd (IPP)
8.4 22.02.2016
10 Solar Power Project by M/s. CIAL (IPP)
13 18.08.2015
Total 22 14.156 8.4 Source: KSEBL.

Infrastructure Statistics 2015-16
Department of Economics and Statistics, Government of Kerala Page 23
In the reference year 2015-16, 22 MW from Hydel source, 14.16 MW from
Solar and 8.4 MW from wind was added to the installed capacity of the State
although it is produced by different agencies.
Chart & Table 3.1 shows the details of energy source and its installed capacity
during the last five years while sector wise details are shown in Chart & Table 3.2 of
the total installed capacity of 2880.20 MW during 2015-16, the contribution of State
sector is 2209.2 MW (76.7 per cent), Central sector 359.6 MW (12.4 per cent) and
Private sector 311.31 MW (10.8 per cent).Details of power availability in Kerala for
the period 2011-2015 is shown Table 3.3
2800 2820 2840 2860 2880 2900
2011-12
2012-13
2013-14
2014-15
2015-16
2879.81
2878.41
2891.72
2835.68
2880.2
2011-12
2012-13
2013-14
2014-15
2015-16
Total Energy Installed Capacity (MW)

Infrastructure Statistics 2015-16
Department of Economics and Statistics, Government of Kerala Page 24
Performance of Power Sector Agencies
Power development activities in the State are carried out mainly through four
agencies viz, Kerala State Electricity Board Limited (KSEBL), Agency for Non-
conventional Energy and Rural Technology (ANERT), Electrical Inspectorate and
Energy Management Centre (EMC). The Outlay and Expenditure (in lakhs) of these
departments for the last two years of the 12th Plan are detailed below
Source: Plan space* Expenditure as on December 5, 2016
0
500
1000
1500
2000
2500
3000
2011-12 2012-13 2013-14 2014-15 2015-16
2879.81 2878.412891.72
2835.68 2880.2
State Sector
Central Sector
Private Sector
Total
Total Installed Capacity (MW)
Sl.No Department Annual Plan 2015-16 Annual Plan 2016-17 Outlay Expendit
ure Per cent of Exp
Outlay Expenditure*
Per cent of
Exp 1 KSEBL 140942 105005.35 74.50 156412 68,378.42 43.72
2 ANERT 4280 2107.71 49.25 4388 2.41 0.05
3 MTSL 560 354.82 63.36 730 1.63 0.22
4 EMC 938 751.21 80.09 740 230.98 31.21
Total 146720 108219.09 73.76 162270 68,613.44 42.28

Infrastructure Statistics 2015-16
Department of Economics and Statistics, Government of Kerala Page 25
Transmission
Transmission of electricity refers to the bulk transfer of power over a long
distance at high voltage, generally of 110 kV and above. A good transmission system
is necessary for effective distribution and to procure power from outside the State.
In the Transmission sector, many planned works could not be taken up due to land
acquisition and right of way related issues. In the year 2015-16 out of the target of 12
numbers of 110 kV substations, 8 substations was completed and in the case of 66 kV
substations, 3 substation was completed against the target of 4. In the case of 33kV
substation, 3 substations was completed while there is no progress in the case of
220kV sub stations. Kerala’s transmission system consisting of substations and its
connected lines are given in Table 2.4 and Table 2.5
Distribution
In the distribution segment, there are 57650 Kms of 11 kV lines, 285970 Kms
of LT lines, and 73460 nos. of distribution transformers. During the financial year
2015-16, 3 81247 service connections were given (against the target of 4,59 ,020),
2,022 kms of 11 kV lines (against the target of 2377kms) and 3312 kms of LT line
(against the target of 4826 kms) were commissioned. Power consumption and
revenue collection from differenent category of consumers the year 2015-16 is
stated in Table 3.6 the target and achievement of the distribution infrastructure
during 2015-16 is given in Table 2.7 to Table 2.12

Infrastructure Statistics 2015-16
Department of Economics and Statistics, Government of Kerala Page 26
Chapter 3
COMMUNICATION
Communication plays a vital role in the socio economic development of a
nation. In Kerala, almost all the modern means of communications are available
including Postal communication, Tele communication, Newspapers and periodicals,
Radio and Television, Internet, mobile phones etc, even in the village level.
Postal Communication: India has the largest postal network in the world. In our
country there are about 1.5 lakhs post offices out of which 5055 post offices are in
Kerala. Detailed report on division wise category wise Post Offices are shown in Table
3.1.Services that are provided by Postal circle include Speed Post, Logistic Post,
Direct Post, Business Post, e-payment, Money transfer etc.
Telecommunication: The Indian Telecom services industry has experienced great
changes and developments for the last two decades. Kerala Telecommunication has
an impressive record in the growth, development and modernization of Telephone
facilities in the state. Kerala was the first state in India with all Telephone exchanges
fully automatic, the first to link all the exchanges through STD facility, the first to
provide public telephone facilities in all Panchayat Headquarters. Kerala
Telecommunication has a large network of modern digital switches linked through
reliable and high capacity optical fibre media. First phase of Next Generation
Network (NGN) has commissioned in Kerala circle on July 2015. The tele density, the
total of telephones per 100 inhabitants is considered as one of the parameters
closely related to the development of a state. The overall tele density in Kerala is 110
against the national figure of 83 at the year end. The growth of Tele Communication
in Kerala is at a very fast pace and is very impressive. District wise details of
Telephone net work is shown in Table 3.2

Infrastructure Statistics 2015-16
Department of Economics and Statistics, Government of Kerala Page 27
Television & Radio: Doordarshan is the state-owned television broad caster. Various
general, news, entertainment and religious channels telecast their programmes. The
only Government owned channel in Malayalam is VICTERS, educational channel
which is working under IT@school project of General Education Department Kerala.
Print media: The habit of reading newspaper in Kerala is widespread. Majority of
people subscribe at least one newspaper in their homes. The principal languages of
publication are Malayalam and English. Dozens of Newspapers and Periodicals are
published in the state.
Internet: Kerala realizes the importance of high speed communication through
internet. There are many internet cafes in the state that provide facilities of surfing
the net at minimum cost and almost everyone in the state is well versed with
internet.
Akshaya Centres: Kerala is the first state in India to take initiative for the mass
transformation of Information and Communication Technology by the
implementation of district wide e-literacy project Akshaya’ with an intention of
empowering Kerala. The Government’s focus on digitization of the state has entailed
a revolution in the design and operation of public services through the reinvention of
service delivery channels. Emergence of digital organizations to create services led to
better opportunities to meet citizen’s needs directing to increase social inclusion. At
present 2628 Akshaya e-centres spread across Kerala with at least 2 centres in each
panchayat. Details of Akshaya centres in districts are shown in Table 3.3

Infrastructure Statistics 2015-16
Department of Economics and Statistics, Government of Kerala Page 28
Chapter 4
Irrigation
Agricultural production relies primarily on climatic conditions. The natural
climatic hurdles in production cannot be beaten by man. These factors are very
important in considering the productivity and economy of the state. Our state
receives about 90% of the annual rainfall during the monsoon months from June to
August and from October to November. The remaining period from December to
May is practically dry. Most of the rain water received during monsoon period flows
to sea within 48 hours of rainfall due to the characteristics of the geographic terrain
of the state. Though there are various methods for providing irrigation water, the
best and the most reliable method which can be used for Kerala is the construction
of storage reservoirs for impounding water during the monsoon and utilizing the
water for critical periods of the crops when there is insufficiency. Hence, major and
medium projects were taken up and a major portion of the cultivable land could be
made ayacut under these projects.
First significant attempt to supply water on controlled basis was through a Lift
Irrigation scheme constructed in 1942. The scheme consisted of lifting water from
Periyar River by electric pumping and feeding through channels for paddy cultivation.
Malampuzha Irrigation Project in Palakkad district is the 1st large-scale irrigation
system in Kerala. The project consists of a dam constructed across the river
Malampuzha, a tributary of Bharathapuzha and a network of canal system to irrigate
an area of 21245 ha. The dam is straight gravity type masonry structure with an
earthen saddle, completed in 1966. Malampuzha Reservoir provides drinking water
for Palakkad Municipality and 6 adjacent panchayaths. Kerala has total irrigated area
of 413833 hectare during the year 2015-16 shown in Table 4.1.

Infrastructure Statistics 2015-16
Department of Economics and Statistics, Government of Kerala Page 29
There are 54 dams in the State. Out of this, 14 dams and 6 barrages are
maintained by the Irrigation Department. The live storage of reservoirs under
Irrigation Department in the State is estimated as 1431 Mm3. The 4 ongoing
irrigation projects viz., Muvattupuzha, Idamalayar, Karapuzha and Banasurasagar
that commenced in 1970s and 1980s, but still continuing with consequent time.
At the same time the irrigation water is one of the most ill-managed
resources, which creates a severe scarcity of water, both for drinking and irrigation in
some region and environmental problem such as water logging in some region. It is
now widely recognised that a paradigm shift from the traditional supply orientated
mind set towards the concept of water conservation and demand management, is
essential for the sustainability of water resources and the environment, as well as
economic efficiency and social development. Source wise net average irrigated
during 2014-15 and 2015-16 are stated in Table 4.2. Live storage position in the
reservoirs for the period from 2014 to 2016 is stated in the Table 5.3 and average
storage position for 2014-15 is stated in Table 4.4

Infrastructure Statistics 2015-16
Department of Economics and Statistics, Government of Kerala Page 30
Chapter 5:
Drinking Water supply and sanitation
Drinking Water
Safe drinking water, its supply and proper sanitation are basic
requirements of a society. The World Water Development Report 2015 says that
around 748 million people today still do not have access to an improved source of
drinking water. The complexity of linkage between water and development provide
us to rethink the present development challenges through the lens of water scarcity.
The availability of fresh water resources on the earth has remained same but the gap
between supply and demand of fresh water has increased over the years. The world
is going to face the problem of global water deficit in the near future unless we could
restore the balance between demand and limited supply of drinking water. The
progress in social, economic and environmental dimensions of sustainable
development is bound by the limits imposed by the management of water resources.
Kerala is considered as the land of water resources with high rainfall, rivers,
backwaters, lakes and many streams. However, Kerala is frequently facing drought
and acute water scarcity in many districts. There are 44 rivers (medium -4 & minor -
40) in Kerala, all but three originating in the Western Ghat, 41 of them flow
westward and 3 eastward. When compared to rivers in the other parts of the nation,
the significance of rivers in terms of water discharge is very minimal. The State
doesn’t have a single major river as per the national norms. Kerala is also bestowed
with a number of lakes and backwater lagoons.
Government of India as well as State Government is committed to provide
safe water to the people. Safe drinking water not only reduces the risk due to water
born diseases but also enhance the quality of life. Piped water coverage in State is

Infrastructure Statistics 2015-16
Department of Economics and Statistics, Government of Kerala Page 31
only 52.43% whereas most of the families depend on Private water sources, which
are usually open wells. Most of these are dry up by early March and remain so till the
monsoon. Studies shows that spread of bacteriological contamination are common in
open wells, bore wells and surface sources.
Kerala Water Authority is an autonomous agency established for the
development and regulation of water supply and waste water management in the
state. Water quality management in India is accomplished under the provision of
water (Prevention to control of pollution) Act 1974. Main objective of the act is to
prevent the pollution of water by Industrial, agricultural and household waste water
that can contaminate our water source. The water quality information is being used
to manage the quality of water from the source of pollution. The upstream water
stations of rivers are having good water quality compared to the downstream
stations.
Providing quality drinking water to all segments of the society is a major
challenge in water supply sector. There are mainly two agencies viz. KWA and KRWSA
(Jalanidhi) involved in the distribution of drinking water in Kerala. KWA is
implementing major schemes and mainly focused in Urban Water Supply, while
Jalanidhi concentrates on minor Rural Water Supply Schemes.
0
100000
200000
300000
400000
500000
256596
157483
6989626168
17008696255
474172
170085131886
803637923216851
6292920526
District wise Water Connections of KWA ( Number)

Infrastructure Statistics 2015-16
Department of Economics and Statistics, Government of Kerala Page 32
Water Supply schemes of Kerala Water Authority covers around 1.75 crore
population which accounts, 52.43% of the total population. The district wise analysis
shows that Ernakulam has the highest coverage of 81.51% followed by
Thiruvananthapuram 72%. Kasaragod District has the least coverage, which is only
19.26% as detailed in Table 5.1. District wise water supply connections and
distribution of street taps are stated in Table 5.2. There are three types of viz.
domestic, non-domestic and industrial water supply connections. Number of such
distribution is stated in Table 5.2. KWA has a total of 18,12,528 water supply
connections and 2,08,034 number of street taps in the state. The total water supply
schemes of KWA in operation as on March 31, 2016 is 1078, of which 1029 are Rural
and 49 are Urban. As detailed in the Table 6.3, Thrissur District has the highest
coverage and Wayanad has the lowest coverage of water supply schemes.
Sanitation
Sanitation refers to public health conditions related to clean drinking water
and adequate treatment and disposal of human excreta and sewage. Sanitation
systems aim to protect human health by providing a clean environment that will stop
the transmission of disease, especially through the fecal–oral route. Kerala has a
coastal belt of 590 km, which covers 15 per cent of the total area of the State.
Majority of drinking water sources in our state are getting polluted due to
unscientific sanitation practices and indiscriminate dumping of waste. A large
majority of drinking water supply sources are bacteriologically and chemically
contaminated. The main bacteriological pathogens are E coli and coliform. The use of
polluted water causes several water borne diseases, which may be fatal. The district
wise analysis shows that total 941 grama panchayats completed 174720 numbers of
toilets construction as detailed in the Table 5.6
Water Management
Water Management is important since it helps determine future Irrigation
expectations. Water management is the management of water resources under set

Infrastructure Statistics 2015-16
Department of Economics and Statistics, Government of Kerala Page 33
policies and regulations. Water, once an abundant natural resource, is becoming a
more valuable commodity due to droughts and overuse.. Water resource
management is the activity of planning, developing, distributing and managing the
optimum use of water resources. It is a sub-set of water cycle management. Ideally,
water resource management planning has regard to all the competing demands for
water and seeks to allocate water on an equitable basis to satisfy all uses and
demands. As with other resource management, this is rarely possible in practice. At
present only about 0.08 percent of world’s fresh water is exploited by mankind in
ever increasing demand for sanitation, drinking, manufacturing, leisure and
agriculture. The mission of the Water Management uses provides a forum for
publishing new findings on Engineering principles and technology. Currently our
primary research objective is to encourage and assist the development of better and
faster measures of engineering activity. In cases where we believe we can contribute
directly, as opposed to through highlighting the work of others, we are producing our
own measures of Water Management.

Infrastructure Statistics 2015-16
Department of Economics and Statistics, Government of Kerala Page 34
Chapter 6
Storage Facility
The storage function assumes paramount importance in organization such as
Food Corporation of India because of its requirement to hold huge inventory of food
grains over a significant period of time. Adequate scientific storage is pre-requisite to
fulfill the policy objectives assigned to the Food Corporation of India for which FCI
has a network of strategically located storage depots including silos all over India.
Besides having own storage capacity, FCI has hired storage capacities from Central
Warehousing Corporation, State Warehousing Corporations, State Agencies and
Private Parties for short term as well as for guaranteed period under Private
Entrepreneurs Guarantee Scheme.
Since Kerala is a deficit state, FCI undertakes the major role of providing scientific
storage of food grains in the state and thereby distributing adequate stocks timely
under GOI schemes to ensure food security. FCI is having 24 depots controlled by 9
District offices. During the year 538566 tones of food grains can be stored in the FCI,
Kerala Region, District wise details are given in Table 6.5. Kerala has well organized
Public Distribution Systems which ensure reasonable supply of cereals to the public
by Civil Supplies Department. As on 31st March 2016, there were 8359573 numbers
of ration card holders who are receiving Food grains through the system. These items
are also getting in the subsidized rate from the wholesale shops including Co-
Operatives, Supplyco, other outlets and retail shops relating to number of ration
cards and permits, outlets opend by the civil supplies corporation, No. of FCI depots,
district wise state ware houses & central ware houses, cold storage and container
depots are stated in the Table 6.1 to 6.4 District wise FCI godowns storage capacity is
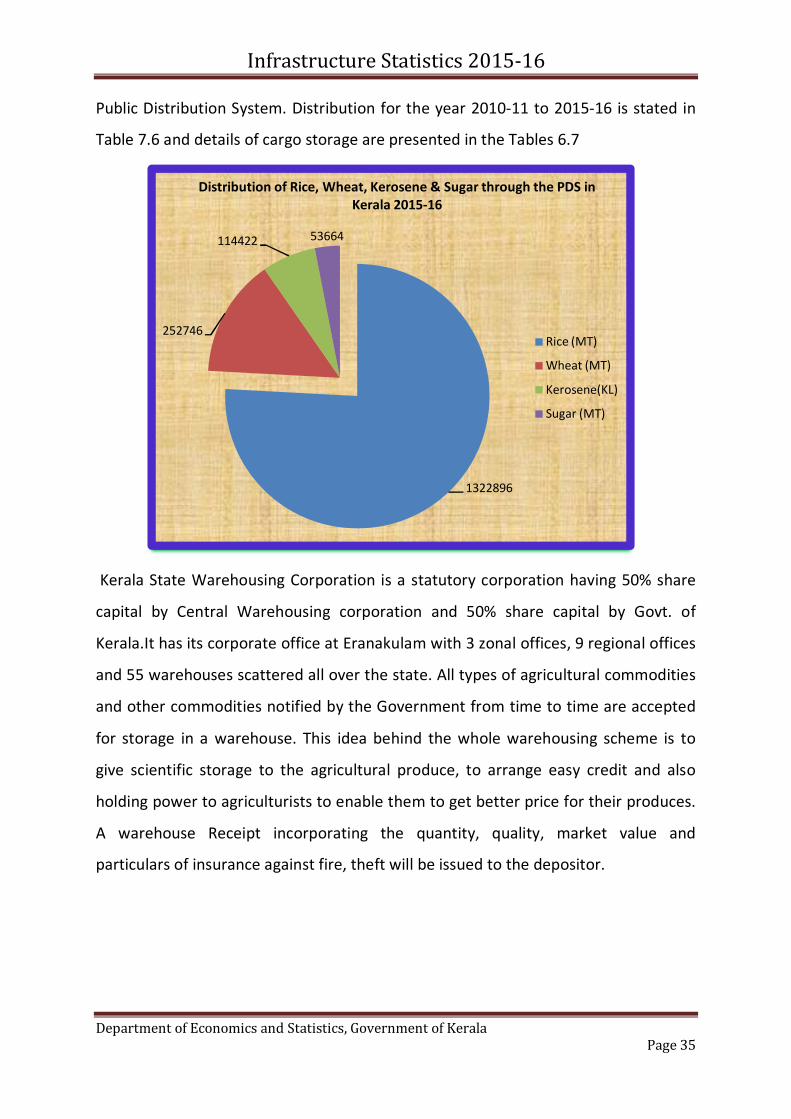
illustrated in Table 6.5. During the year 2015-16 1322896 MTs of rice, 252746 MTs of
wheat, 114422 KLs of kerosene and 53664 MTs of sugar were distributed through the
Infrastructure Statistics 2015-16
Department of Economics and Statistics, Government of Kerala Page 35
Public Distribution System. Distribution for the year 2010-11 to 2015-16 is stated in
Table 7.6 and details of cargo storage are presented in the Tables 6.7
Kerala State Warehousing Corporation is a statutory corporation having 50% share
capital by Central Warehousing corporation and 50% share capital by Govt. of
Kerala.It has its corporate office at Eranakulam with 3 zonal offices, 9 regional offices
and 55 warehouses scattered all over the state. All types of agricultural commodities
and other commodities notified by the Government from time to time are accepted
for storage in a warehouse. This idea behind the whole warehousing scheme is to
give scientific storage to the agricultural produce, to arrange easy credit and also
holding power to agriculturists to enable them to get better price for their produces.
A warehouse Receipt incorporating the quantity, quality, market value and
particulars of insurance against fire, theft will be issued to the depositor.
1322896
252746
114422 53664
Rice (MT)
Wheat (MT)
Kerosene(KL)
Sugar (MT)
Distribution of Rice, Wheat, Kerosene & Sugar through the PDS in Kerala 2015-16

Infrastructure Statistics 2015-16
Department of Economics and Statistics, Government of Kerala Page 36
Appendix -Chapter 1
TRANSPORT
TABLE 1.1 District wise and category wise length of roads maintained by PWD 2015-16 (in Km)
Sl No. District State Highways District Roads Total
1 2 3 4 5
1 Thiruvananthapuram 180.36 2377.384 2557.744
2 Kollam 123.79 2079.079 2202.869
3 Pathanamthitta 170.841 1782.178 1953.019
4 Alappuzha 249.194 1301.493 1550.687
5 Kottayam 406.531 3049.683 3456.214
6 Idukki 998.372 1868.994 2867.366
7 Ernakulam 325.206 2760.075 3085.281
8 Thrissur 374.033 1690.183 2064.216
9 Palakkad 245.987 1938.706 2184.693
10 Malappuram 374.764 2305.388 2680.152
11 Kozhikode 377.173 2077.474 2454.647
12 Wayanad 128.955 900.359 1029.314
13 Kannur 244.665 2020.577 2265.242
14 Kasaragode 141.78 1318.882 1460.662
Total 4341.651 27470.455 31812.106
Source: PWD, Roads

Infrastructure Statistics 2015-16
Department of Economics and Statistics, Government of Kerala Page 37
Table 1.2 Agency wise distribution of State roads during 2015-16
Sl No. Name of Department/Agency Length (km) Percentage
1 2 3 4
1 Panchayats 265421.120 80
2 PWD(R&B) 31812.106 10
3 Municipalities 18411.870 5.6
4 Corporation 6644.000 2
5 Forest 4575.770 1.38
6 Irrigation 2611.900 0.79
7 National Highways 1568.000 0.47
8 Others (Railway, KSEB) 328.000 0.09
Total 331372.766 100
Source: Roads Website, PWD Roads Table 1.3
Category wise length of roads (in Km)
State
Highway National Highway District Rural Urban Project
Kerala 4341.65 1812 27470.46 127985 30788 8411
India 176166 101011 561940 3935337 509730 319109
Table 1.4
Details of Bridges, Flyovers & Culverts in Roads
Sl No. Item Total
1 2 3
1 Total No. of Bridges 2545
2 Total No. of Flyovers 4
3 Total No. of Culverts 42850
Source: PWD, Roads

Infrastructure Statistics 2015-16
Department of Economics and Statistics, Government of Kerala Page 38
Table 1.5
Road Density (in Km)
Year Per Land Per Population
Kerala India Kerala India
2013-14 497.88 164 5.79 4.36
2014-15 501.46 166 5.83 4.36
2015-16 516.78 170 6.01 4.63
Table 1.6
District and Category wise number of Newly Registered Motor vehicles during 2015-16
Sl. No. Name of District Three
Wheelers Two
Wheelers
Car, Jeeps and
Taxis
Buses Goods Vehicles Others Total
1 2 3 4 5 6 7 8 9
1 Thiruvananthapuram 4791 66703 22456 1272 1569 1187 97978
2 Kollam 1739 52262 14647 294 1304 658 70904
3 Pathanamthitta 881 22847 9646 200 757 394 34725
4 Alappuzha 917 39031 11201 293 1207 443 53092
5 Kottayam 1036 29318 13684 510 1341 752 46641
6 Idukki 942 12854 4154 215 617 235 19017
7 Ernakulam 1982 75574 27559 811 2849 1444 110219
8 Thrissur 1429 60701 18073 557 1756 881 83397
9 Palakkad 1117 46620 10694 338 1197 590 60556
10 Malappuram 2586 63442 19366 429 2123 1145 89091
11 Kozhikode 2356 66703 16796 400 1824 881 88960
12 Wayanad 776 11169 3009 65 522 250 15791
13 Kannur 1782 40838 15565 473 1716 944 61318
14 Kasaragode 1030 18607 8842 130 528 497 29634
Total 23364 606669 195692 5987 19310 10301 861323
Source: Motor Vehicle Department

Infrastructure Statistics 2015-16
Department of Economics and Statistics, Government of Kerala Page 39
Table 1.7 Valid registered Motor vehicles in districts 2015-16
Sl No. District
Goods vehicles Buses Four Wheelers Three Wheelers
Two Wheelers Tractors / Trailers
Total
Four
W
heel
ers &
ab
ove
Thre
e w
heel
ers
incl
udin
g te
mpo
s
Stag
e Ca
rria
ges
Cont
ract
ca
rria
ges/
O
mni
bus
es
Cars
Taxi
s
Jeep
s
Auto
ric
ksha
ws
Scoo
ter/
Mot
or c
ycle
s
Trac
tors
/ Ti
llers
Trai
lers
Oth
ers
1 2 3 4 5 6 7 8 9 10 11 12 14 15 16
1 Thiruvananthapuram 1112 457 886 386 21578 878 4791 66703 37 1150 97978
2 Kollam 983 321 31 263 14089 558 1739 52262 14 644 70904
3 Pathanamthitta 530 227 12 188 9223 423 881 22847 7 1 386 34725
4 Alappuzha 904 303 19 274 10247 954 917 39031 18 1 424 53092
5 Kottayam 1082 259 99 411 13054 630 1036 29318 11 1 740 46641
6 Idukki 487 130 57 158 3944 210 942 12854 3 232 19017
7 Ernakulam 2362 487 97 714 25365 2194 1982 75574 35 1 1408 110219
8 Thrissur 1320 436 105 452 16774 1299 1429 60701 36 2 843 83397
9 Palakkad 875 322 88 250 10007 687 1117 46620 57 533 60556
10 Malappuram 1448 675 96 333 18827 539 2586 63442 40 1 1104 89091
11 Kozhikode 1188 636 138 262 16013 783 2356 66703 11 1 869 88960
12 Wayanad 350 172 17 48 2807 202 776 11169 13 6 231 15791
13 Kannur 1288 428 190 283 14582 983 1782 40838 13 931 61318
14 Kasaragode 432 96 24 106 8415 427 1030 18607 11 2 484 29634
Total 14361 4949 1859 4128 184925 10767 0 23364 606669 306 16 9979 861323
Source: Motor Vehicle Department

Infrastructure Statistics 2015-16
Department of Economics and Statistics, Government of Kerala Page 40
Table 1.8
Category wise number of newly registered motor vehicles from 2011-12 to 2015-16
Sl No. Vehicles 2011-12 2012-13 2013-14 2014-15 2015-16
1 Goods vehicles Four Wheelers & above 23463 27508 21099 14141 14361
Three wheelers including tempos 10132 9485 7818 5787 4949
2 Buses Stage Carriages 886 1227 933 935 1859
Contract carriages/ Omni buses 4231 4573 4582 3653 4128
3 Four Wheelers Cars 175032 174301 189394 175519 184925
Taxis 8351 12344 17356 11128 10767
4 Three Wheelers Auto rickshaws 68772 64998 37018 27951 23364
5 Two Wheelers Scooter/Motor cycles 529338 654194 637546 634221 606669
6 Tractors / Trailers
Tractors 556 590 471 280 306
Tillers 1 1
Trailers 52 68 28 16 16
7 Others 20063 16481 12472 8588 9979
Total 840877 965769 928718 882219 861323
Source: Motor Vehicle Department

Infrastructure Statistics 2015-16
Department of Economics and Statistics, Government of Kerala Page 41
Table 1.9
DETAILS OF ROAD ACCIDENTS IN KERALA OVER THE PREVIOUS YEARS 2001 to 2016
Sl. No. Year Total Number of Accidents Persons Killed Persons
Injured
1 2001 38361 2674 49675
2 2002 38762 2792 49460
3 2003 39496 2905 48640
4 2004 41219 3059 51228
5 2005 42363 3203 51124
6 2006 41647 3589 49881
7 2007 39917 3778 48246
8 2008 37263 3901 43857
9 2009 35433 3831 41401
10 2010 35082 3950 41473
11 2011 35216 4145 41379
12 2012 36174 4286 41915
13 2013 35215 4258 40346
14 2014 36282 4049 41096
15 2015 39014 4196 43735
16 2016 39420 4287 44108
Total 610864 58903 727564
Source: Kerala Police, website

Infrastructure Statistics 2015-16
Department of Economics and Statistics, Government of Kerala Page 42
Table 1.10 KERALA STATE ROAD TRANSPORT CORPORATION
District wise operational statistics of KSRTC 2015-16
Sl. No. Unit No. of buses held
No. of schedules
No. of routes
Route Distance
(Kms)
Gross Kms. Operated (in Lakhs)
Effective Operated ( in
Kms)
Passengers carried (in Lakh)
1 2 3 4 5 6 7 8 9
1 Thiruvananthapuram 1383 1540 2212 93440 1248.2 1175.31 2982.17
2 Kollam 595 646 969 58905 614.63 568.63 1293.52
3 Pathanamthitta 311 370 477 33042 322.25 311.77 554.23
4 Alapuzha 453 402 491 33434 436.51 147.57 564.81
5 Kottayam 496 430 531 43567 509.95 485.45 693.49 6 Idukki 246 226 344 27901 259.67 236.05 294.41
7 Ernakulam 555 579 962 53006 554.8 522.26 977.95
8 Thrissur 343 354 398 27881 390.11 362.83 554.48
9 Palakkad 201 194 185 13960 267.59 253.29 335.39
10 Malappuram 198 210 184 12611 248.54 321.56 300.35 11 Kozhikode 235 224 221 15024 266.34 242.72 332.61
12 Wayanad 147 145 153 13440 295.76 266.56 449.14
13 Kannur 246 243 322 25272 295.22 269.71 510.22
14 Kasaragode 268 246 109 7132 160.54 146.18 294.99 Total 5677 5809 7558 458615 5870.11 5309.89 10137.76
Source: Economic Review 2016

Infrastructure Statistics 2015-16
Department of Economics and Statistics, Government of Kerala Page 43
Table 1.11
Major indicators showing operational efficiency of KSRTC/KURTC 2015-16
Sl No. Items
KSRTC Increase/ Decrease
during last year
KURTC Increase/ Decrease
during last year 2014-15 2015-16 2014-
15 2015-
16
1 2 3 4 5 6 7 8
1 Fleet strength (as on 31st march) 5629 6304 (+) 53 320 603 (+) 283
2 Gross revenue earnings (in cores) 1923.82 2165.16 (+)
241.39 105.23 132.27 (+) 26.99
3 Gross revenue expenditure (in cores) 2541.1 2778.3 (+) 237.2 109.23 136.54 (+) 27.33
4 Gross operating loss (in cores) 617.33 613.14 (-) 4.19 3.95 4.27 (+) 0.32
5 No. of schedules
operated as on March 31st
4602 6399 (-) 80 320 603 (+) 283
6 Average earning per
vehicle on road per day (Rs.)
10928 9918 (+) 263 10456 12060 (+) 1604
7 Average earning per
km of buses operated (paisa)
3268 2967 (+) 41 4000 4082 (+) 82
8 Average earning per passenger (paisa) 1636 1741 (+) 105 1663 2311 (+) 648
9 Average route length (km) 63.78 60.76 (-) 3.02
10 Average km run per bus per day 329.16 332.54 (+) 3.38 261.42 295.41 (+) 33.99
11 Average no. of buses held daily (Nos) 5691 5636 (-) 55 320 522 (+) 202
12 Passengers carried (lakhs) 11059.43 10137.76 (-)
921.67 498.73 653.9 (+) 155.17
Source: KSRTC

Infrastructure Statistics 2015-16
Department of Economics and Statistics, Government of Kerala Page 44
Table 1.12 District wise & Category wise Vehicle density during 2015-16
Sl No.
District Vehicle Density
2 Wheelers Cars Total Vehicles
1 Thiruvananthapuram 381.06 127.21 589.58
2 Kollam 203.44 62.40 312.65
3 Pathanamthitta 95.50 39.97 159.98
4 Alappuzha 346.31 81.56 492.72
5 Kottayam 160.03 77.68 289.68
6 Idukki 23.46 10.70 45.78
7 Ernakulam 327.86 109.84 509.07
8 Thrissur 232.03 64.92 349.40
9 Palakkad 104.03 22.18 150.89
10 Malappuram 153.01 50.03 254.27
11 Kozhikode 272.68 66.36 395.47
12 Wayanad 36.22 13.20 65.33
13 Kannur 116.50 45.60 203.24
14 Kasaragode 77.94 34.45 139.64
15 TOTAL 166.57 53.29 261.78
Table 1.13
Details of Buses owned by KSRTC
Year Total No. of Buses No. of New Buses
2010 5402 630
2011 5741 714
2012 5803 209
2013 5812 485
2014 5860 332
2015 5629 173
2016 6304 609
Source: KSRTC

Infrastructure Statistics 2015-16
Department of Economics and Statistics, Government of Kerala Page 45
Table 1.14 District wise & Category wise cumulative number of registered vehicles as on 31.03.2016
Sl No.
District Goods Vehicles
Buses Cars & Taxi 2 Wheelers Others Total % of
Vehicles
% of cars & taxies
% of 2
wheelers
1 Thiruvananthapuram 48664 23498 287495 834151 96784 1290592 13 13 13
2 Kollam 37789 5867 161009 505136 66513 776314 8 7 8
3 Pathanamthitta 20874 3066 111409 253265 35663 424277 4 5 4
4 Alappuzha 34481 5839 124761 490034 42088 697203 7 6 8
5 Kottayam 38222 7552 179779 353356 60707 639616 6 8 5
6 Idukki 14752 2863 50117 102198 29503 199433 2 2 2
7 Ernakulam 86767 14019 353721 1004232 100531 1559270 15 16 16
8 Thrissur 52790 11952 208193 703506 82929 1059370 10 10 11
9 Palakkad 37164 6146 106020 466043 60618 675991 7 5 7
10 Malappuram 67945 7810 183992 543813 100110 903670 9 8 8
11 Kozhikode 48280 7432 165334 639437 66905 927388 9 8 10
12 Wayanad 11110 1344 31095 77139 18463 139151 1 1 1
13 Kannur 44261 7408 143565 344968 61588 601790 6 7 5
14 Kasaragode 13696 1962 71712 155024 35354 277748 3 3 2
TOTAL 556795 106758 2178202 6472302 857756 10171813 100 100 100

Infrastructure Statistics 2015-16
Department of Economics and Statistics, Government of Kerala Page 46
Table 1.15
VEHICLE PENETRATION PER 1000 POPULATION
Sl No.
District Vehicle density per 1000 population
Two Wheelers Cars Total Vehicles
1 Thiruvananthapuram 252.66 84.35 390.92
2 Kollam 191.68 58.79 294.57
3 Pathanamthitta 211.51 88.53 354.33
4 Alappuzha 230.30 54.24 327.67
5 Kottayam 178.96 86.86 323.93
6 Idukki 92.16 42.01 179.84
7 Ernakulam 305.95 102.50 475.04
8 Thrissur 225.40 63.07 339.41
9 Palakkad 165.86 35.37 240.57
10 Malappuram 132.22 43.23 219.71
11 Kozhikode 207.19 50.42 300.49
12 Wayanad 94.37 34.39 170.23
13 Kannur 136.73 53.52 238.52
14 Kasaragode 118.58 52.41 212.45
TOTAL 193.75 61.98 304.49
Table 1.16
State & National comparison of Vehicle density and Vehicle penetration from 2011-12 to 2015-16
Year Total Vehicles
Kerala National
Vehicle Density (Per
sq.km of road)
Vehicle per 1000 Population
Vehicle Density (Per
sq.km of road)
Vehicle per 1000
Population
2011-12 6893314 177.40 206.35 49 131.72
2012-13 7857822 202.22 235.22 55 150.67
2013-14 8775041 225.83 262.68 58 157.49
2014-15 9648320 248.30 288.82 64 173.45
2015-16 10171813 261.78 304.49 70 189.97

Infrastructure Statistics 2015-16
Department of Economics and Statistics, Government of Kerala Page 47
Table 1.17
Navigable water ways 2015-16 Canals/Lake
Sl No. Name Total Length
(Km) Navigable
length (Km)
1 2 3 4
1 Irrigation Division, Kollam 68.38 68.34
2 Inland Navigation Division, Kollam 146.52 128.15
3 Irrigation Division, Kottayam 103.50 103.50
4 Irrigation Division, Ernakulam 294.00 294.00
5 K S I N C, Kochi 42.50 42.50
6 Irrigation Division, Thrissur 68.00 31.00
7 Irrigation Division, Malappuram 31.30 14.34
8 Irrigation Division, Kozhikode 21.70 14.93
9 Inland Navigation Division, Kannur 21.46 3.85
TOTAL 797.36 700.61
Source : Irrigation Department
Table 1.18
Inland water vessels 2015-16
Sl No. Name of Division
State Private
Type of Vessels
Number of Vessels
Type of Vessels
Number of Vessels
1 2 3 4 5 6
1 Kottayam Boat 123 Jangar 4
2 K S I N C ,Kochi Cargo 7
3 Thrissur self propelled 463
Total 586 11
Source: Irrigation Department

Infrastructure Statistics 2015-16
Department of Economics and Statistics, Government of Kerala Page 48
Table 1.19 No. and Tonnage of Steamers and sailing vessels in Minor ports during 2015-16
Sl No.
Name of Port
Coastal /
Foreign
Steamers Sailing Vessels Total No. of Vessels Total Tonnage
Number Tonnage No. Tonnage
2009-15
2015-16 2009-15 2015-
16 2009-
15 2015-
16 2009-15 2015-16
2009-15
2015-16 2009-15 2015-16
1 2 3 4 5 6 7 8 9 10 11 12 13 14 15
1 Azhikkal Coastal 9 3 6804 393 21 1 4411 179 30 4 11215 572
Foreign 0 0 0 0 8 0 6581 0 0 0 6581 0
2 Kozhikode Coastal 1291 155 999644 108943 2356 289 989784 68115 2356 289 199420 177058
Foreign 0 0 0 0 0 0 0 0 0 0 0
3 Kollam Coastal 85 18 93992.98 36172 0 0 0 0 85 18 93992.98 36172
Foreign 5 3 22066 16035 0 0 5680 0 5 3 22066 16035
4 Vizhinjam Coastal 22 3 21363 28 13498 51 3 27043
Foreign 210 39 155882 7580.98 28 0 236 39 176960.983 7580.983
Total 1622 221 1299752 169124 2441 290 1019954 68294 2763 356 537278.963 237417.98

Infrastructure Statistics 2015-16
Department of Economics and Statistics, Government of Kerala Page 49
Table 1.20 INLAND WATER TRANSPORT
Length of Water ways (Kms)
Sl No. Name of Division Year Total Navigable
1 2 3 4 5
1 I N D , Kollam
2015-16
69.460 50.090
2 Kottayam 538.500 490.000
3 Ernakulam 793.000 793.000
4 Thrissur 68.000 31.000
5 Malappuram 11.378 11.378
Source: Irrigation Department Table 1.21
Navigable water ways 2015-16
Other Waterways
Sl No. Name of Division Total Length(KM)
Navigable Length(KM)
1 2 3 4
1 Inland Navigation Division, Kollam 19.10 4.00
2 Irrigation Division, Kottayam 88.00 77.00
3 Irrigation Division, Ernakulam 215.00 215.00
4 Irrigation Division, Thrissur 18.18 7.10
5 Inland Navigation Division, Kannur 20.63 20.63
TOTAL 360.91 323.73
Source: Irrigation Department

Infrastructure Statistics 2015-16
Department of Economics and Statistics, Government of Kerala Page 50
Table 1.22 Navigable water ways
Rivers
Sl No. Name of Division Total Length(KM) Navigable
Length(KM)
1 2 3 4
1 Irrigation Division, Kollam 175.00 10.00
2 Irrigation Division, Kottayam 327.00 307.00
3 Irrigation Division, Ernakulam 246.50 246.50
4 Irrigation Division, Thrissur 111.00 5.00
5 Irrigation Division, Malappuram 572.48 119.60
6 Irrigation Division, Kozhikode 45.21 39.81
7 Inland Navigation Division, Kannur 898.00 215.00
TOTAL 2375.19 942.91
Source: Irrigation Department
Infrastructure Statistics 2015-16
Department of Economics and Statistics, Government of Kerala Page 51
Table 1.23 Operational statistics of Inland water transport agencies
Sl No. Particulars
State Water Transport
Department
Kerala Shipping and Inland Navigation Corporation Ltd.
2014-15 2015-16 2014-15 2015-16
1 2 3 4 5 6
1 No. of Jhankars Nil Nil 2 2
2 No. of Jhankars in operation Nil Nil 1 1
3 No. of Boats 95 98 Nil Nil
4 No. of Boats in operation 51 51 Nil Nil
5 No. of Trips on Schedule 275940 297812 Nil Nil
6 No. of Passengers Carried (In lakhs)- 130.54 138.48 Nil Nil
7 No. of Barges Nil Nil 8 8
8 No. of Tourist Boats 4 3 2 2
9 Total Distance Cargo(in KM approximate) NA NA 29114 32754
10 Volume of Cargo carried (Tonnes) Nil Nil 179585 278926
11
Total Revenue Receipts on Inland Transports(in lakhs(Collection from Tourists Boats+ Barges+Jhankars)
36.66 69.87 536.32 811.14
12 Total Revenue Receipts on Inland Transport(in lakh) 761.1 765.81 810.45 1227.84
13 Total Revenue Receipts on other business (in lakh) 42.3 29 396.93 416.71
14 Total Revenue Expenditure on other business(in lakh) Nil Nil 563.85 228.65
15 No. of employees (TOTAL) 890 873 132 121
Source: Economic Review 2016

Infrastructure Statistics 2015-16
Department of Economics and Statistics, Government of Kerala Page 52
Table 1.24 Railway route in Kerala (in Km)
Sl No. Division Broad Gauge Meter Gauge Total
1 2 3 4 5
1 Thiruvananthapuram 624.31 NIL
624.31
2 Palakkad 468.87 468.87
Total 1093.18 1093.18
Source: Railway TVPM, PKD Dvn
Table 1.25
Railway route (in Km)
Sl No. Division Electrified Non Electrified Total
1 2 3 4 5
1 Thiruvananthapuram 615.58 8.73 624.31
2 Palakkad 371.24 97.63 468.87
Total 986.82 106.36 1093.18
Source: Railway TVPM, PKD dvn
Table 1.26
Quality
Sl No. Division
Average No. of Passenger Trains Running per day
(in No.)
Average No. of Passenger carried per day (in lakhs)
1 2 4 5
1 Thiruvananthapuram 165 3.13
2 Palakkad 159 2.13
Total 324
Source: Railway TVPM, PKD dvn

Infrastructure Statistics 2015-16
Department of Economics and Statistics, Government of Kerala Page 53
Table 1.27
Division wise Category wise Staff 2015-16
Sl No. Category TVM Dvn PKD Dvn Remarks
1 2 3 4 5
1 Administration 220 262
2 Accounts 82 68
3 Engineering 2668 2140
4 Signal and telecom communication 403 293
5 Transportation 1425 1176
6 Commercial 1230 849
7 Mechanical 2060 1285 Mechanical
8 Stores 20
9 Electrical 609
10 Medical 169 238
11 Railway Protection Force 426 319
12 Railway Board and other Railway offices 17
Railway claims Tribunal,
Ernakulam
Source: Railway TVPM, PKD dvn
Table 1.28
Number of Gauge wise Stations 2015-16
Sl. No. Station TVM Dvn PKD Dvn
1 2 3 4
1 Broad Guage 104 94
2 Meter Guage NIL NIL
Total 104 94
Source: Railway TVPM, PKD dvn

Infrastructure Statistics 2015-16
Department of Economics and Statistics, Government of Kerala Page 54
Table 1.29
Details of Electrification
Sl No. Electrification TVM Dvn PKD Dvn
1 2 3 4
1 Signaling System and telecom Installation (number) 69
2 Route Kilometer (% Electrified) 98.60 79.18
3 Track Kilometer (% Electrified) 100%
Source: Railway TVPM, PKD dvn
Table 1.30 List of Airports
Sl No
. City served ICA
O IATA
Airport name Category Ownersh
ip Status
1 2 3 4 5 6 7 8
1 Thiruvananthapuram
VOTV TRV
Trivandrum
International
Airport
International AAI Operatio
nal
2 Kochi
VOCI
COK
Cochin Internation
al Airport
International PPP Operatio
nal
VOCC INS Garuda Defense Indian
Navy Operatio
nal
3 Kozhikode VOCL
CCJ
Calicut Internation
al Airport
International AAI Operatio
nal
ICAO- International Civil Aviation Organization IATA- International Air Transport Association

Infrastructure Statistics 2015-16
Department of Economics and Statistics, Government of Kerala Page 55
Table 1.31 Details of flights operated by various agencies from International Airports 2015-16
Sl No. Airlines
Thiruvananthapuram
2015-16
No of flights No. of Passengers
Domestic International Domestic International
1 2 3 4 5 6
1 Air India (NB) 2930 1322 118269 111937
2 Jet Airways 1451 2042 206735 235675
3 Air Pegasus 1221 0 86118 0
4 Indigo 4032 730 785117 109037
5 Air India Express 0 2539 0 353676
6 Air India 0 206 0 39777
7 SriLankan 0 748 0 99604
8 Kuwait Airways 0 456 0 67073
9 Oman Airways 0 732 0 171512
10 Qatar Airways 0 732 0 122396
11 Silk Air 0 462 0 45618
12 Emirates 0 1432 0 336121
13 Air Arabia 0 1464 0 241498
14 Etihad Airways 0 1258 0 106853
15 Maldivian 0 974 0 76384
16 Gulf Air 0 732 0 103099
17 Fly Dubai 0 314 0 47245
18 Malindo Air 0 228 0 23367
19 Emirates Cargo 0 2 0 0
20 Non scheduled 313 56 864 129
Total 9947 16429 1197103 2291001
Source: Thiruvananthapuram International Airport

Infrastructure Statistics 2015-16
Department of Economics and Statistics, Government of Kerala Page 56
Table 1.32 Details of flights operated by various agencies from International Airports 2015-16
Sl No. Airlines
Cochin 2015-16
No. of flights No. of Passengers Domestic International Domestic International
1 2 3 4 5 6 1 Indigo 8128 734 1181567 117221 2 Jet Airways 5408 4340 482032 609044 3 Air India 2368 3302 234898 458269 4 Air Asia 0 1184 0 163315 5 Emirates 0 1997 0 542895 6 Ethihad Airways 0 2110 0 310669 7 Flydubai 0 422 0 64151 8 Air Arabia 0 1468 0 239960 9 Gulf Air 0 734 0 108504
10 Air India Express 0 3805 0 493713 11 Kuwait Airways 0 1148 0 154873 12 Malaysia Airlines 0 124 0 17118 13 Silk Air 0 802 0 106866 14 Malindo Air 0 804 0 99407 15 Qatar Airways 0 1152 0 305978 16 Spice Jet 5870 1461 756226 154236
17 Saudi Arabian Airlines 0 1360 0 337099
18 Tiger Airways 0 412 0 54735
19 SriLankan Airlines 0 1463 0 173004
20 Oman Air 0 976 0 129651 21 Allianz Air 1430 0 38113 0 22 Go Air 1303 0 190170 0 23 Air Asia India 1446 0 205582 0 Total 25953 29798 3088588 4640708
Source: Cochin International Airport

Infrastructure Statistics 2015-16
Department of Economics and Statistics, Government of Kerala Page 57
Table 1.33 Details of flights operated by various agencies from International Airports 2015-16
Sl No Airlines
Kozhikode 2015-16
No of flights No. of Passengers
Domestic International Domestic International
1 2 3 4 5 6
1 Air India 0 67 0 23128
2 Air India Express 873 4761 21096 706696
3 Indian Airlines 617 1461 53764 227354
4 Saudia Airways 0 64 0 21178
5 Jet Lite 74 0 9419 0
6 Ethihad Airways 0 2020 0 132869
7 Emirates 0 94 0 28578
8 Spice Jet 1274 276 23099 46100
9 Jet Airways 661 0 1338 86491
10 Oman Air 0 734 0 101065
11 Qatar Airways 0 734 0 120764
12 Air Arabia 0 732 0 1210512
13 Indigo 731 731 112286 110762
Total 4230 11674 221002 2815497
Source: Calicut International Airport

Infrastructure Statistics 2015-16
Department of Economics and Statistics, Government of Kerala Page 58
Table 1.34
Passenger traffic, Aircraft Movement & Cargo Movement in Thiruvananthapuram, Cochin and Kozhikode International Airports
Sl No.
Year Airport
Passenger Movement
Aircraft Movement
Cargo Movement ( in MT )
International
Domestic
International
Domestic
International
Domestic
1 2 3 4 5 6 7 8 9
1
2015-16
Thiruvananthapuram 2291001 1197103 16429 9947 28.85 0.942
2 Cochin 4640708 3088588 29798 25953 67.73 11.359
3 Kozhikode 2815497 221002 11674 4230 13.22 0.799
Total 9747206 4506693 57901 40130 109.8 13.1
Source: Thiruvananthapuram, Cochin, Kozhikode International Airport

Infrastructure Statistics 2015-16
Department of Economics and Statistics, Government of Kerala Page 59
Appendix -Chapter 2 ENERGY
Table 2.1
Energy Source 2011-12 to 2015-16
Sl.No. Source of Energy
Installed Capacity (MW)
2011-12 2012-13 2013-14 2014-15 2015-16
1 2 3 4 5 6 7
1 Hydel: KSEBL 2008.80 2007.40 2008.60 2024.15 2046.15
2 Thermal : KSEBL 234.60 234.60 234.60 159.96 159.96
3 Wind : KSEBL 2.03 2.03 2.03 2.03 2.025
4 Solar : KSEBL - - - - 1.156
5 Solar other than KSEBL (Solar connected to Grid other than KSEBL)
- - - - 13.00
6 NTPC 359.60 359.60 359.60 359.60 359.60
7 Thermal IPP 198.93 198.93 198.93 198.93 198.90
8 Hydel Captive 33.00 33.00 33.00 33.00 33.00
9 Hydel IPP 10.00 10.00 22.11 25.16 25.16
10 Wind IPP 32.85 32.85 32.85 32.85 41.25
Total 2879.81 2878.41 2891.72 2835.68 2880.20
Source : Economic Review 2016

Infrastructure Statistics 2015-16
Department of Economics and Statistics, Government of Kerala Page 60
Table 2.2
TOTAL INSTALLED CAPACITY 2011-12 to 2015-16
Sl.No. Sector Installed Capacity (MW)
2011-12 2012-13 2013-14 2014-15 2015-16
1 2 3 4 5 6 7
1 State Sector 2245.43 2244.03 2245.23 2186.14 2222.29
2 Central Sector 359.60 359.60 359.60 359.60 359.60
3 Private Sector 274.78 274.78 286.89 289.94 298.31
Total 2879.81 2878.41 2891.72 2835.68 2880.20
Source: Economic Review 2016
Table 2.3
DETAILS OF POWER AVAILABILITY 2011-12 to 2015-16
Sl.No Particulars Internal Generation(MU)
2011-12 2012-13 2013-14 2014-15 2015-16
1 2 3 4 5 6 7
1 Hydel Generation 8058.01 4848.8 7995.43 7134.00 6639
2 KSEBL-Thermal Generation 290.70 532.7 220.87 207.70 150.63
3 Wind 2.03 1.763 1.8 1.06 1.38
4 Solar 0 0 0 0 0.81
5 Solar other than KSEBL 0 0 0 0 5.92
6 Total Internal Generation 8350.75 5389.6 8218.10 7342.88 6791.9
7 Less: Auxiliary Consumption 60.84 55.35 55.07 55.97 52.6
8 Net Generation 8289.91 5334.3 8163.03 7286.91 6739.3
9 Power Purchase ( CGSs, IPPs, Traders ) 11263.21 14909 14070.4 14996.4 16448
10 External PGCIL line losses 413.21 364.96 293.69 357.98 550.6
11 Energy Available for sale within the State 19139.90 19878 21939.8 21925.8 22944
12 Energy Requirement 18938.81 19877 20525.2 21914.2 22584
13 Surplus /Deficit 201.09 0.97 1414.6 11.64 360.92
Source : Economic Review 2016

Infrastructure Statistics 2015-16
Department of Economics and Statistics, Government of Kerala Page 61
Table 2.4
TRANSMISSION INFRASTRUCTURE 2015 - 2016
Sl.No. Item Target Achievement Unit Percentage of Achievement
1 2 3 4 5 6
1 220KV Substations 1 0 Nos. 0%
2 110KV Substations 12 8 Nos. 67%
3 66KV Substations 4 3 Nos. 75%
4 33KV substations 13 3 Nos. 23.08%
Source : Economic Review 2016
Table 2.5
TRANSMISSION INFRASTRUCTURE OWNED BY KSEB - 2015-16
Sl.No. Capacity Substations No. Lines in Km
1 2 3 4
1 400KV 1 571.96
2 220KV 20 2801.89
3 110KV 142 4345.52
4 66KV 81 2220.56
5 33Kv 134 1826.66
Total 378 11064.00
Source : Economic Review2016
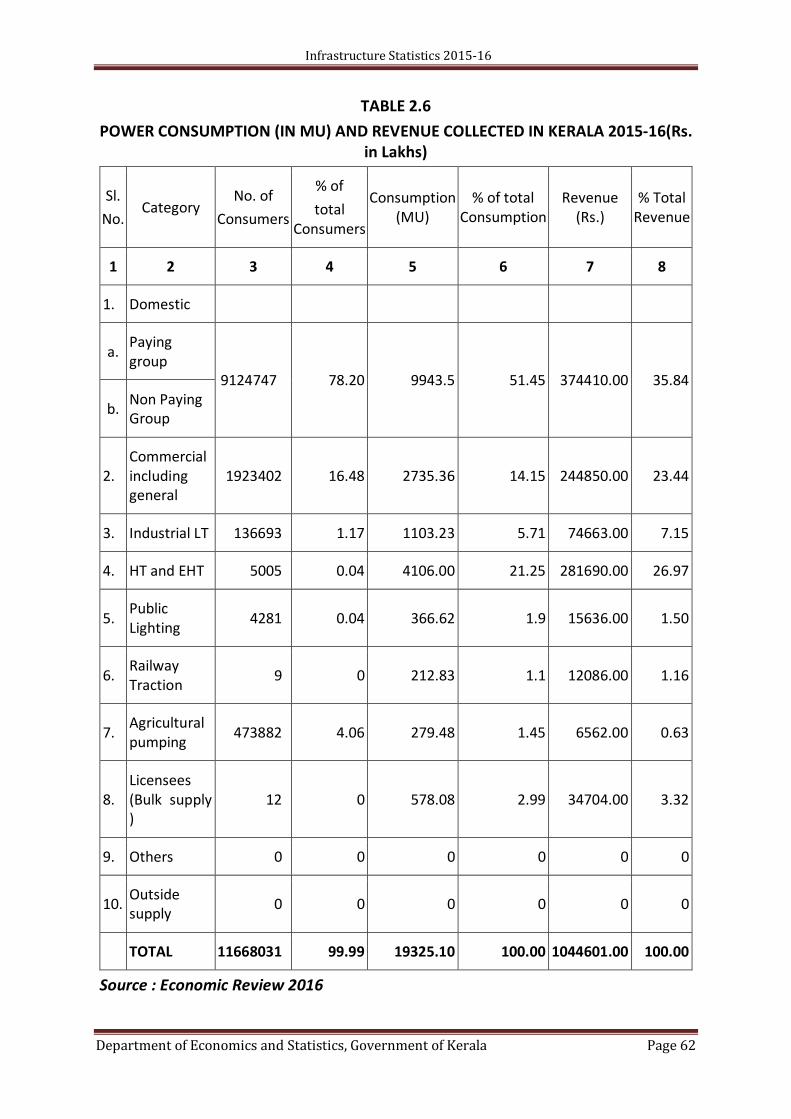
Infrastructure Statistics 2015-16
Department of Economics and Statistics, Government of Kerala Page 62
TABLE 2.6 POWER CONSUMPTION (IN MU) AND REVENUE COLLECTED IN KERALA 2015-16(Rs.
in Lakhs)
Sl. No.
Category No. of
Consumers
% of total
Consumers
Consumption (MU)
% of total Consumption
Revenue (Rs.)
% Total Revenue
1 2 3 4 5 6 7 8
1. Domestic
a. Paying group
9124747 78.20 9943.5 51.45 374410.00 35.84
b. Non Paying Group
2. Commercial including general
1923402 16.48 2735.36 14.15 244850.00 23.44
3. Industrial LT 136693 1.17 1103.23 5.71 74663.00 7.15
4. HT and EHT 5005 0.04 4106.00 21.25 281690.00 26.97
5. Public Lighting 4281 0.04 366.62 1.9 15636.00 1.50
6. Railway Traction 9 0 212.83 1.1 12086.00 1.16
7. Agricultural pumping 473882 4.06 279.48 1.45 6562.00 0.63
8. Licensees (Bulk supply )
12 0 578.08 2.99 34704.00 3.32
9. Others 0 0 0 0 0 0
10. Outside supply 0 0 0 0 0 0
TOTAL 11668031 99.99 19325.10 100.00 1044601.00 100.00
Source : Economic Review 2016

Infrastructure Statistics 2015-16
Department of Economics and Statistics, Government of Kerala Page 63
Table 2.7
TARGETS AND ACHIEVEMENTS OF DISTRIBUTION INFRASTRUCTURE 2015-16
Sl. No
Item Target Unit Achievement Unit % of Achievement
1 2 3 4 5 6 7
1 11KV line 2377 km 2022 km 85.07
2 Distribution transformer 3574 Numbers 2389 Numbers 66.84
3 LT lines 4826 km 3312 km 68.63
4 Service connections 459020 Numbers 381247 Numbers 83.06
Source : Economic Review 2016
Table 2.8
TRANSMISSION AND DISTRIBUTION LINE 2011-12 to 2015-16
Sl.No Year Particulars in Kilometers
220KV 110KV 66KV 33KV 22KV 11KV LT
1 2011-12 2734.70 4151.00 2161.91 1534.80 160.59 51328 260554
2 2012-13 2761.57 4178.55 2166.51 1599.70 160.59 52907 263620
3 2013-14 2765.00 4260.27 2202.81 1719.28 160.59 53579 264117
4 2014-15 2801.20 4299.67 2202.81 1761.57 160.59 55386 268753
5 2015-16 2801.89 4345.52 2220.56 1826.66 160.59 57489 285970
Source: Economic Review 2016

Infrastructure Statistics 2015-16
Department of Economics and Statistics, Government of Kerala Page 64
Table 2.9
PUMPSETS, STREET LIGHTS AND DISTRIBUTION TRANSFORMERS 2011-12 to 2015-16
Sl.No. Year No of Irrigation
pump sets energised
No. of Street lights installed
No. of Distribution Transformers
1 2 3 4 5
1 2011-12 455078 1218610 62329
2 2012-13 466289 1257285 64972
3 2013-14 478449 1297480 67546
4 2014-15 490056 1349101 71198
5 2015-16 500082 1407024 73460
Source : Power System Statistics 2015-16, KSEB
Table 2.10 CONSUMERS AND CONNECTED LOADS
2011-12 to 2015-16
Sl.No. Year No. of consumers at the end of the
year
Connected load at the end of the year (MW)
1 2 3 4
1 2011-12 10457637 17518.42
2 2012-13 10806890 18523.51
3 2013-14 11192890 19684.15
4 2014-15 11430895 20391.53
5 2015-16 11668031 20980.82
Source : Power System Statistics 2015-16, KSEB

Infrastructure Statistics 2015-16
Department of Economics and Statistics, Government of Kerala Page 65
TABLE 2.11 GENERATING CAPACITY, MAXIMUM DEMAND AND LOAD FACTOR
2011–12 to 2015-16
Sl. No. Year Installed Capacity
(MV)
Energy Input to System excl. aux.
cons. & ext. losses ( Gen+ Purchase -
Export ) (MU)
Maximum Demand
Load Factor
1 2 3 4 5 6 1 2011-12 2878.4 18938.81 3348 64.57 2 2012-13 2881.2 19877.16 3268 69.43 3 2013-14 2891.7 20525.16 3588 65.36 4 2014-15 2835.6 21572.95 3602 68.37 5 2015-16 2280.2 22727.34 3860 67.21
Source : Power System Statistics 2015-16, KSEB
Table 2.12 KERALA STATE ELECTRICITY BOARD
No. ACCESS 2015-16 (1) (2) (3) 1) Installed Generating Capacity (GWh) 8677.1 i Utilities a Hydro 6780.27 b Thermal (including steam, gas, diesel) 1502 c Nuclear 0 d RES(Total) 394.83 Small Hydro 389.01 Wind 4 Solar 1.82 ii Non-Utilities a Hydro(SHP) 212.57 b Steam/Diesel/Naphtha/LSHS 3534.7 d Gas 0 e Wind 86.12 f Solar 20.49
2) Non Conventional Energy Sources(MW) i Total ii Wind power 43.275 iii Small Hydro Power 170.06 vi Solar Power 14.156 3) Power Plants (Number)

Infrastructure Statistics 2015-16
Department of Economics and Statistics, Government of Kerala Page 66
Table 2.12 KERALA STATE ELECTRICITY BOARD
No. ACCESS 2015-16 (1) (2) (3)
i Hydro 15 ii Small Hydro 20 iii Thermal 7 iv Nuclear 0 4) Power Plant Capacity (Mega Watt) i Hydro 2046.15 ii Thermal 720.47 iii Nuclear 0
5) Sales of electricity to ultimate consumers by Utilities &
Non Utilities (Giga Watt hour) Electricity sales i Domestic 9953.04 ii Commercial 1923.14 iii Industrial 2955.36 iv Traction 212.825 v Agriculture 286.3 vi Others 3994.41
6) Sales of electricity to ultimate consumers by utilities only (Giga Watt hour)
Total i Domestic 9953.04 ii Sectors Commercial 1923.14 iii Industry 2955.36 iv Traction and Railways 212.825 v Agriculture 286.3 vi Public lighting 366.62 vii Others 3049.71
7) Per capita consumption (Kilo Watt hour) 569 8) Length of transmission lines (Circuit Kilometer) 11194.6 9) Transformers (Number) Total
i Step up 112 ii Step down 1012
10) Percentage of villages electrified 100 QUALITY
1) Percentage share in total electricity generation i Hydro 95.43 ii Thermal(including steam, gas and diesel) 2.22 iii Nuclear 0 iv RES 2.35 Peak Demand (Mega Watt) 3860 Peak Met (Mega Watt) 3985

Infrastructure Statistics 2015-16
Department of Economics and Statistics, Government of Kerala Page 67
Table 2.12 KERALA STATE ELECTRICITY BOARD
No. ACCESS 2015-16 (1) (2) (3)
Surplus/Deficit (Mega Watt) 125 UTILISATION
1) Actual generation of electricity (Giga Watt hours) i Utilities
a Hydro 6481.41 b Thermal (diesel / naphtha / LSHS ) 150.63 c Nuclear 0 d RES Small Hydro 157.61 Wind 1.38 Solar 0.81
ii Non Utilities a Hydro 80.16 b Steam 0 c Diesel / Naphtha 140.72 d Gas 0 e Wind 57.4 f Solar 5.86
2) Plant Load Factor (Percentage) i Thermal
a Central sector 4.12 b State sector 10.74 c Private sector 0.69
ii Nuclear a Central sector

Infrastructure Statistics 2015-16
Department of Economics and Statistics, Government of Kerala Page 68
Appendix - Chapter 3
COMMUNICATION
Table 3.1
DIVISION-WISE AND CATEGORY WISE POST OFFICES 2015-16
Sl.No. Name of Division Head Offices Sub Offices
SO EDSO EDBO Total
1 2 3 4 5 6 7
1 TVPM(N) 2 68 0 148 218
2 TVPM(S) 2 75 0 119 196
3 Kollam 3 91 0 151 245
4 Pathanamthitta 3 77 0 233 313
5 Thiruvalla 2 64 0 93 159
6 Alappuzha 2 48 0 74 124
7 Mavelikkara 2 52 0 73 127
8 Changanacherry 2 46 0 117 165
9 Idukki 2 52 0 239 293
10 Kottayam 3 79 0 176 258
11 Ernakulam 2 71 0 62 135
12 Aluva 3 71 0 181 255
13 Thrissur 3 105 0 185 293
14 Irinjalakuda 2 63 0 127 192
15 Palakkad 3 83 0 150 236
16 Ottappalam 1 55 0 163 219
17 Manjeri 2 46 0 211 259
18 Tirur 2 52 0 119 173
19 Kozhikkode 3 71 0 230 304
20 Vadakara 2 40 0 183 225
21 Thalassery 1 44 0 163 208
22 Kannur 2 66 0 163 231
23 Kasargod 2 29 0 196 227
Total
51 1448 0 3556 5055
Source : Economic Review 2016

Infrastructure Statistics 2015-16
Department of Economics and Statistics, Government of Kerala Page 69
Table 3.2
DISTRICT WISE DETAILS OF TELEPHONE NET WORK DURING 2015-16
Sl.No. Name of District Population Census 2011
No. of Exchanges
Equipped Capacity
Working connections Area(Sq.Kms.) No.of
telephone(Sq.Kms.)
No.of telephone Per 1000
population
1 2 3 4 5 6 7 8 9
1 Allappuzha 2127789 82 246031 156724 1414 110.83 73.65
2 Kozhikkode 3086293 90 282749 164492 2206 74.57 53.29
3 Kannur 2523003 131 299227 202262 2961 68.31 80.17
4 Ernakulam 3282388 117 421654 277802 3063 90.7 84.63
5 Idukki 1108974 79 110823 54159 5105.22 10.61 48.84
6 Kasargod 1307375 72 123163 75980 1989 38.2 58.12
7 Kottayam 1974551 115 285885 151788 2206 68.81 76.87
8 Malappuram 4112920 93 294419 171774 3550 48.39 41.76
9 Palakkad 2809934 123 163322 111461 4480 24.88 39.67
10 Pathanamthitta 1197412 74 206584 111520 2642 42.21 93.13
11 Kollam 2635375 90 314104 171038 2491 68.66 64.9
12 Thrissur 3121200 97 395850 272687 3032 89.94 87.37
13 Thiruvananthapuram 3301427 114 377665 209459 2192 95.56 63.44
14 Wayanad 817420 34 51640 29781 2132 13.97 36.43
Total
33406061 1311 3573116 2160927 39463.2 54.76 64.69 Source: Economic Review 2016,

Infrastructure Statistics 2015-16
Department of Economics and Statistics, Government of Kerala Page 70
Table 3.3
DETAILS OF AKSHAYA CENTRES IN KERALA
Sl. No Name of District No.of Akshaya Centres No. of persons employed
1 2 3 4
1 Thiruvananthapuram 262 786
2 Kollam 156 400
3 Pathanamthitta 113 263
4 Alappuzha 213 426
5 Kottayam 185 410
6 Idukki 121 204
7 Ernakulam 247 852
8 Thrissur 220 680
9 Palakkad 238 432
10 Kozhikkode 174 609
11 Malappuram 291 960
12 Wayanad 65 203
13 Kannur 219 876
14 Kasargod 124 375
Total
2628 7476
Source: Economic Review 2016

Infrastructure Statistics 2015-16
Department of Economics and Statistics, Government of Kerala Page 71
Annexure - Chapter 4
IRRIGATION
Table 4.1 NET AREA IRRIGATED - DISTRICT WISE & SOURCE WISE 2015-16 (area in Ha)
Sl No District
Small stream ( Canal / Thode ) Pond Well Bore
well/ Tube well
Lift & Minor
Irrigation
From River & Lake Other
Sources Grand Total Govt. Private Govt. Private Govt. Private Pump Wheel Other
Methods Total
1 2 3 4 5 6 7 8 9 10 11 12 13 14 15 16 1 Thiruvananthapuram 3833 0 588 21 1 3254 111 0 0 0 0 0 439 8247 2 Kollam 1368 27 15 49 31 2853 33 0 0 0 4 4 1674 6054 3 Pathanamthitta 2751 0 34 0 0 2343 4 113 0 0 7 7 1 5253 4 Alappuzha 6237 1 0 462 0 819 7728 0 5567 0 19255 24822 335 40404 5 Kottayam 15 13 0 276 0 1952 18 107 0 0 12204 12204 10 14595 6 Idukki 1214 11 54 16605 0 8341 4150 0 68 0 1982 2050 9096 41521 7 Ernakulam 7340 6 309 1693 5 6965 465 3130 568 0 1027 1595 357 21865 8 Thrissur 19023 5 224 3567 70 37937 1716 991 561 0 4709 5270 2530 71333 9 Palakkad 42443 25 140 5729 7 13063 8741 514 7801 0 548 8349 8242 87253
10 Malappuram 2443 378 157 4332 69 16019 1362 1290 1072 0 1726 2798 1356 30204 11 Kozhikode 989 8 0 513 1 2363 56 0 216 0 3 219 522 4671 12 Wayanad 0 0 18 52 0 73 0 103 136 0 0 136 12123 12505 13 Kannur 631 281 22 1415 17 9223 438 34 221 0 652 873 2281 15215 14 Kasargode 530 19 43 12141 15 28108 10269 15 3021 0 102 3123 450 54713
Total 88817 774 1604 46855 216 133313 35091 6297 19231 0 42219 61450 39416 413833 Source : EARAS, DES

Infrastructure Statistics 2015-16
Department of Economics and Statistics, Government of Kerala Page 72
Table 4.2 NET AREA IRRIGATED (SOURCE WISE) (in Ha.)
Sl.No. Source 2014-15 2015-16 1 2 3 4 1 Government Canal 85654 88817 2 Private Canal 1249 774 3 Tanks / Ponds 47095 48459 4 Wells 133421 133529 5 Other Sources 146863 142254 6 Total 414282 413833 7 Irrigated Area 469647 483648 8 Net Area Irrigated to Net area sown (%) 20.27 20.46 9 Gross Irrigated area to gross cropped area (%) 17.80 18.4
10 Irrigated Area under paddy to total irrigated area 32.08 31.12 Source : EARAS, DES
Table 4.3 LIVE STORAGE POSITION IN THE RESERVOIRS (Mm3)
Sl. No. Item 2014 2015 2016 1 2 3 4 5 1 Storage at the beginning of the Monsoon 415.19 527.83 488.35 2 Storage at the end of the monsoon 1316.46 901.15 690 3 Increase due to Monsoon 901.26 373.32 201.65
Source : Economic Review 2016
Table 4.4 AVERAGE FOR 10 YEARS STORAGE POSITION IN RESERVOIRS 2015-16
Sl.No Item Storage (Mm3) 1 Storage at the beginning of the Monsoon 442.05 2 Storage at the end of the monsoon 1094.95 3 Increase due to Monsoon 652.9
Source : Economic Review 2016

Infrastructure Statistics 2015-16
Department of Economics and Statistics, Government of Kerala Page 73
Appendix - Chapter 5 DRINKING WATER SUPPLY & SANITATION
Table 5.1 DISTRICT WISE POPULATION COVERED BY WATER SUPPLY SCHEMES OF KWA 2015-16
Sl.No District
Rural Urban Total
Rural population
covered
% of total population
Urban population
covered
% of Urban population
Total population covered % of total population
1 2 3 4 5 5 7 8
1 Thiruvananthapuram 1017000 66.48 1360000 76.77 2377000 72.00
2 Kollam 1089231 75.21 459269 38.69 1548500 58.76
3 Pathanamthitta 510597 47.91 74427 56.55 585024 48.86
4 Alappuzha 590530 60.28 780440 67.97 1370970 64.43
5 Kottayam 1079301 76.59 278740 49.3 1358041 68.78
6 Idukki 304653 28.82 33010 63.43 337663 30.45
7 Ernakulam 743512 70.94 1931808 86.46 2675320 81.51
8 Thrissur 655538 63.97 1508400 71.95 2163938 69.33
9 Palakkad 953800 44.71 543800 80.35 1497600 53.29
10 Malappuram 718155 31.28 312945 17.22 1031100 25.07
11 Kozhikkode 396786 39.14 615487 29.7 1012273 32.80
12 Wayanad 440816 56.09 16585 52.52 457401 55.96
13 Kannur 217000 24.6 630400 38.42 847400 33.59
14 Kasargode 200822 25.16 51000 10.02 251822 19.26
Total 8917741 51.04 8596311 53.95 17514052 52.43
Source : Economic Review 2016

Infrastructure Statistics 2015-16
Department of Economics and Statistics, Government of Kerala Page 74
Table 5.2 DISTRICT WISE NUMBER OF WATER SUPPLY CONNECTIONS AND STREET TAPS 2015-16
Sl. No Name of District Water supply Connections Street Taps
Domestic Non domestic Industrial Total Panchayath Corporation Municipalities Total
1 2 3 4 5 6 7 8 9 10 1 Thiruvananthapuram 230654 25799 143 256596 13987 4027 1809 19823 2 Kollam 150572 6699 212 157483 15132 3248 1522 19902
3 Pathanamthitta 65915 3943 38 69896 11189 1543 12732
4 Alappuzha 23970 2192 6 26168 3480 380 3860 5 Kottayam 165342 4471 273 170086 23523 4593 28116 6 Idukki 90967 5244 44 96255 7880 2111 9991 7 Ernakulam 440106 33661 405 474172 28560 5917 3438 37915
8 Thrissur 164424 5606 55 170085 21774 2301 3081 27156
9 Palakkad 123762 8033 91 131886 12569 3180 15749 10 Malappuram 76153 4191 19 80363 7117 2350 9467
11 Kozhikkode 72467 6703 62 79232 4547 2638 817 8002 12 Wayanad 15333 1512 6 16851 3686 222 3908
13 Kannur 57617 5221 91 62929 5823 1638 7461
14 Kasargode 19412 1104 10 20526 3301 651 3952 Total 1696694 114379 1455 1812528 162568 18131 27335 208034
Source : Economic Review 2016

Infrastructure Statistics 2015-16
Department of Economics and Statistics, Government of Kerala Page 75
Table 5.3 DISTRICT WISE AND CATEGORY WISE NUMBER OF WATER SUPPLY SCHEMES 2015-16
Sl.No. Name of District No. of urban water supply
schemes
Rural Water Supply schemes Total
Multi Pachayat Single Panchayat
1 2 3 4 5 6 1 Thiruvananthapuram 6 12 86 104 2 Kollam 3 6 83 92 3 Pathanamthitta 2 8 61 71 4 Alappuzha 4 1 49 54 5 Kottayam 5 21 43 69 6 Idukki 1 12 64 77 7 Ernakulam 8 17 73 98 8 Thrissur 4 8 95 107 9 Palakkad 4 8 49 61
10 Malappuram 6 10 38 54 11 Kozhikkode 2 13 70 85 12 Wayanad 0 5 23 28 13 Kannur 3 6 91 100 14 Kasargode 1 5 72 78
Total 49 132 897 1078 Source : Economic Review 2016
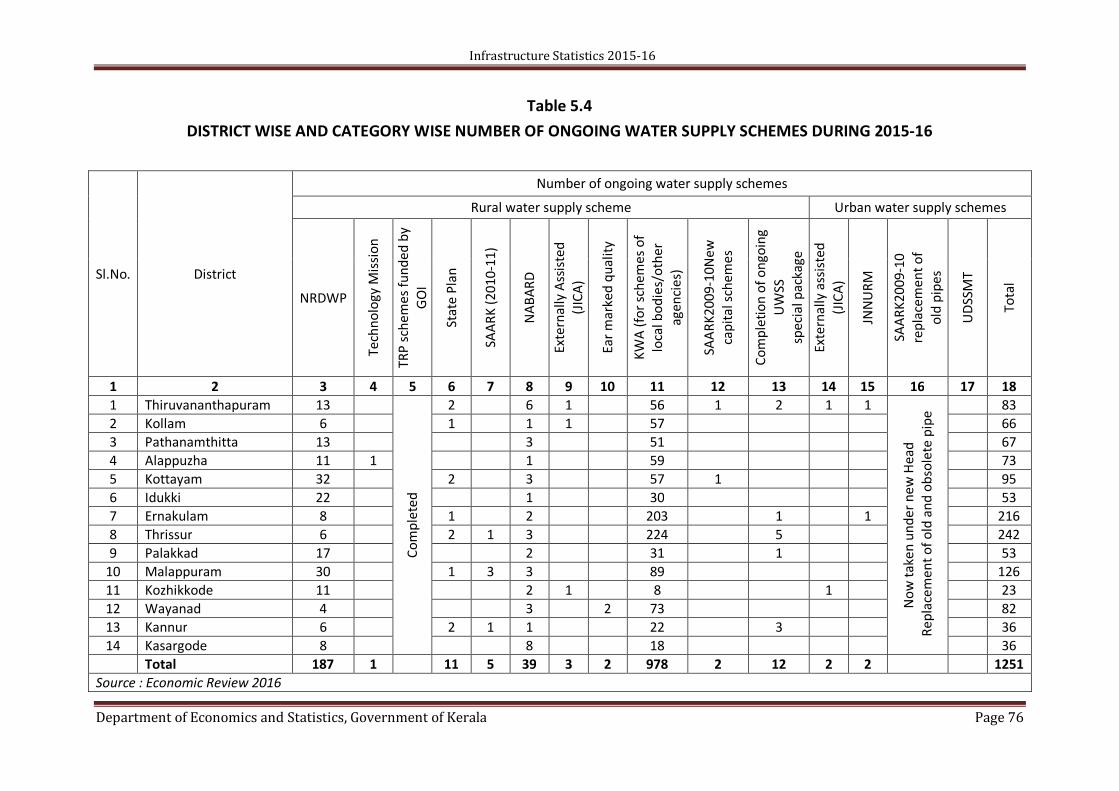
Infrastructure Statistics 2015-16
Department of Economics and Statistics, Government of Kerala Page 76
Table 5.4 DISTRICT WISE AND CATEGORY WISE NUMBER OF ONGOING WATER SUPPLY SCHEMES DURING 2015-16
Sl.No. District
Number of ongoing water supply schemes
Rural water supply scheme Urban water supply schemes
NRDWP
Tech
nolo
gy M
issio
n
TRP
sche
mes
fund
ed b
y GO
I
Stat
e Pl
an
SAAR
K (2
010-
11)
NAB
ARD
Exte
rnal
ly A
ssist
ed
(JICA
)
Ear m
arke
d qu
ality
KWA
(for s
chem
es o
f lo
cal b
odie
s/ot
her
agen
cies
)
SAAR
K200
9-10
New
ca
pita
l sch
emes
Com
plet
ion
of o
ngoi
ng
UW
SS
spec
ial p
acka
ge
Exte
rnal
ly a
ssist
ed
(JICA
)
JNNU
RM
SAAR
K200
9-10
re
plac
emen
t of
old
pipe
s
UDS
SMT
Tota
l
1 2 3 4 5 6 7 8 9 10 11 12 13 14 15 16 17 18 1 Thiruvananthapuram 13
Com
plet
ed
2 6 1 56 1 2 1 1
Now
take
n un
der n
ew H
ead
Rep
lace
men
t of o
ld a
nd o
bsol
ete
pipe
83
2 Kollam 6 1 1 1 57
66 3 Pathanamthitta 13 3 51
67
4 Alappuzha 11 1 1 59
73 5 Kottayam 32 2 3 57 1
95
6 Idukki 22 1 30
53 7 Ernakulam 8 1 2 203 1 1
216
8 Thrissur 6 2 1 3 224 5
242 9 Palakkad 17 2 31 1
53
10 Malappuram 30 1 3 3 89
126 11 Kozhikkode 11 2 1 8 1
23
12 Wayanad 4 3 2 73
82 13 Kannur 6 2 1 1 22 3
36
14 Kasargode 8 8 18
36 Total 187 1 11 5 39 3 2 978 2 12 2 2
1251
Source : Economic Review 2016
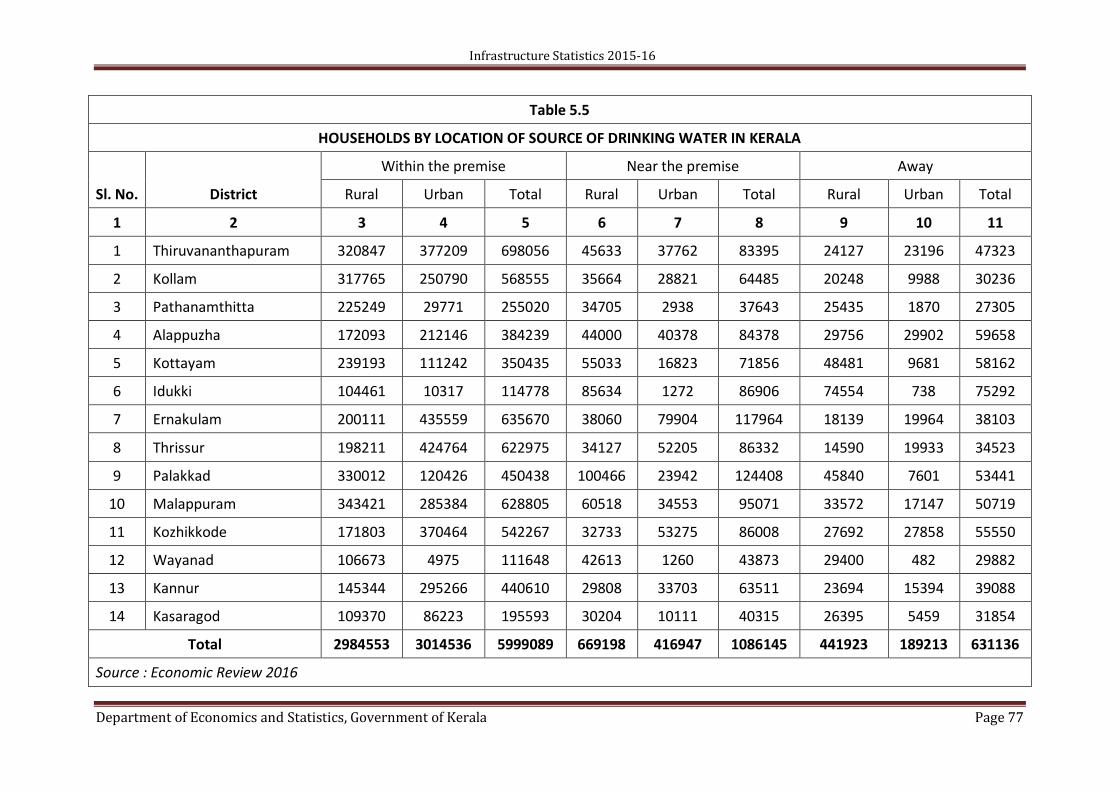
Infrastructure Statistics 2015-16
Department of Economics and Statistics, Government of Kerala Page 77
Table 5.5
HOUSEHOLDS BY LOCATION OF SOURCE OF DRINKING WATER IN KERALA
Sl. No. District
Within the premise Near the premise Away
Rural Urban Total Rural Urban Total Rural Urban Total
1 2 3 4 5 6 7 8 9 10 11
1 Thiruvananthapuram 320847 377209 698056 45633 37762 83395 24127 23196 47323
2 Kollam 317765 250790 568555 35664 28821 64485 20248 9988 30236
3 Pathanamthitta 225249 29771 255020 34705 2938 37643 25435 1870 27305
4 Alappuzha 172093 212146 384239 44000 40378 84378 29756 29902 59658
5 Kottayam 239193 111242 350435 55033 16823 71856 48481 9681 58162
6 Idukki 104461 10317 114778 85634 1272 86906 74554 738 75292
7 Ernakulam 200111 435559 635670 38060 79904 117964 18139 19964 38103
8 Thrissur 198211 424764 622975 34127 52205 86332 14590 19933 34523
9 Palakkad 330012 120426 450438 100466 23942 124408 45840 7601 53441
10 Malappuram 343421 285384 628805 60518 34553 95071 33572 17147 50719
11 Kozhikkode 171803 370464 542267 32733 53275 86008 27692 27858 55550
12 Wayanad 106673 4975 111648 42613 1260 43873 29400 482 29882
13 Kannur 145344 295266 440610 29808 33703 63511 23694 15394 39088
14 Kasaragod 109370 86223 195593 30204 10111 40315 26395 5459 31854
Total 2984553 3014536 5999089 669198 416947 1086145 441923 189213 631136
Source : Economic Review 2016

Infrastructure Statistics 2015-16
DEPARTMENT OF ECONOMICS & STATISTICS Page 78
Table 5.6
DISTRICT WISE DETAILS OF OPEN DEFECATION FREE (ODF) DECLARED GRAMA PANCHAYATS IN KERALA
Sl. No. District Total Numbers
Grama Panchayats
Toilets Construction Completed
1 2 3 4
1 Thiruvananthapuram 73 14211
2 Kollam 68 12777
3 Pathanamthitta 53 10182
4 Alappuzha 72 14985
5 Kottayam 71 9141
6 Idukki 52 21081
7 Ernakulam 82 7808
8 Thrissur 86 3002
9 Palakkad 88 23075
10 Malappuram 94 12011
11 Kozhikkode 70 12799
12 Wayanad 23 13777
13 Kannur 71 7182
14 Kasargode 38 12689
Total 941 174720
Source : Economic Review 2016

Infrastructure Statistics 2015-16
DEPARTMENT OF ECONOMICS & STATISTICS Page 79
Appendix - Chapter 6
STORAGE FACILITIES
TABLE 6.1
PUBLIC DISTRIBUTION SYSTEM IN KERALA- 2010-11 - 2015-16
Sl.No. Item Unit 2010-11 2011-12 2012-13 2013-14 2014-15 2015-16
1 2 3 4 5 6 7 8 9
1 No. of Ration cards and permits
a) Ration Cards for families as on 1st April No 7340488 7863698 8100536 8273778 8313107 8359573
b) Ration Permitted for institution as on Ist April No 7603 6311 6311 6311 4751 2077
2 No. of FCI Sub Depots as on Ist April No 22 22 22 22 25 24
3 No. of Wholesale shop as on Ist April
a) Co-operatives No 36 35 36 28 30 30
b) Others No 288 288 287 291 288 299
c) Total Wholesale shops No 334 333 333 333 330 329
4 No. Of Retail shops as on Ist April
a) Co-operatives No 419 413 411 412 396 392
b) Others No 13833 13854 13890 13912 13935 13288
c) Total Retail shops No 14252 14267 14301 14324 14331 13680
5 Sugar (Allotted) MT 49362 62855 58076 55931 57422 56538.5
6 Kerosene (Allotted) KL 225096 197124 125196 120192 120132 111024 Source : Civil Supplies Dept. Adm. Report 2015-16

Infrastructure Statistics 2015-16
DEPARTMENT OF ECONOMICS & STATISTICS Page 80
Table 6.2 OUTLETS OPENED BY THE CIVIL SUPPLIES CORPORATION IN KERALA 2010-11 - 2015-16
Sl. No. Outlets 2010-11 2011-12 2012-13 2013-14 2014-15 2015-16 1 2 3 4 5 6 7 8
1 Maveli stores 58 18 27 929 946 955
2 Super Markets 17 15 8 375 381 396
3 Maveli Super Stores 0 0 0 21 24 26
4 People's Bazar 1 3 1 93 98 102
5 Medical Stores 1 0 2 14 15 14
6 Petrol Bunks 0 0 1 22 23 23
7 Mobile Maveli Stores 9 0 1 3 3 3
8 Hyper Market 2 0 1 56 56 56
9 Sub Depot 9 10 10
10 N.F.C.A.Godown 0 0 0
11 Apna Bazar/Hyper Market 7 7 7
Total 88 36 41 1529 1563 1592 Source : Economic Review 2016 , Civil Supplies Dept. Adm. Report 2015-16

Infrastructure Statistics 2015-16
DEPARTMENT OF ECONOMICS & STATISTICS Page 81
Table 6.3
No. of FCI Depots
Sl. No. District FCI Owned Private Party SWC CWC State Government(Market Fed) Others Total
1 2 3 4 5 6 7 8 9
1 Thiruvananthapuram 2
2
2 Kollam 4
4
3 Alappuzha 2
2
4 Kottayam 2
1
3
5 Kochi 2
2
6 Thrissur 2
2
7 Palakkad 2
2
8 Kozhikode 4
4
9 Kannur 3
3
Total 23 0 0 1 0 0 24
Source: Food Corporation of India

Infrastructure Statistics 2015-16
DEPARTMENT OF ECONOMICS & STATISTICS Page 82
Table 6.4
District wise details of State warehouses, Central warehouses, Cold storages, and Container depots
Sl. No District
Numbers
State warehouses Central warehouses Cold storage Container Deports
(SWC) (CWC)
1 2 3 4 5 6
1 Thiruvananthapuram 5 1 5
2 Kollam 5
20
3 Pathanamthitta 2
4 Alappuzha 6
45
5 Kottayam 5
1
6 Idukki 3
1
7 Ernakulam 4 4 94 1
8 Thrissur 4 1 4
9 Palakkad 4 1 3
10 Malappuram 3 1
11 Kozhikode 2 1 3
12 Wayanad 3
13 Kannur 5 1 1
14 Kasargod 4
Total 55 10 177 1
Source: Agmark net

Infrastructure Statistics 2015-16
DEPARTMENT OF ECONOMICS & STATISTICS Page 83
Table 6.5 Details of Storage capacity
Sl.No. FCI Districts Godowns Total Capacity (In M.T.) 2015-16
Covered Cover and Plinth (CAP) Total
1 2 3 4 5 6
1 Thiruvananthapuram Valiathura 33440 2250 35690
Kazhakuttom 36136 0 36136
2 Kollam Kollam Main Depot 11900 0 11900
Karunagapally 30000 0 30000
Avaneeswaram 9200 0 9200
Kilikollur 5000 1200 6200
3 Alappuzha Allappuzha Main Depot 10000 0 10000
Mavelikkara 20000 5000 25000
4 Kottayam Chingavanam 15320 0 15320
Arakulam 10000 0 10000
CWC Kunnamthanam 5000 0 5000
5 Ernakulam Kochi Main Depot 18700 0 18700
Angamali 40000 0 40000
6 Thrissur Mulankunnathukavu 48960 5750 54710
Chalakudy 10000 1670 11670

Infrastructure Statistics 2015-16
DEPARTMENT OF ECONOMICS & STATISTICS Page 84
Table 6.5 Details of Storage capacity
Sl.No. FCI Districts Godowns Total Capacity (In M.T.) 2015-16
Covered Cover and Plinth (CAP) Total
1 2 3 4 5 6
7 Palakkad Main Depot,Palakkad 70740 5000 75740
Angadippuram 10000 0 10000
8 Kozhikode West Hill 24160 0 24160
Meenangadi 10000 0 10000
Thikkodi 45000 0 45000
Kuttipuram 5000 0 5000
9 Kannur Muzhappilangad 10640 0 10640
Payyannur 29000 0 29000
Nileswaram 9500 0 9500
Total
517696 20870 538566
Source: Food Corporation of India

Infrastructure Statistics 2015-16
DEPARTMENT OF ECONOMICS & STATISTICS Page 85
Table 6.6 DISTRIBUTION OF RICE & WHEAT, KEROSENE AND SUGAR THROUGH THE PDS IN KERALA
Year Rice (MT) Wheat (MT) Kerosene(KL) Sugar (MT) 2010-11 1159597 186545 196923 86776 2011-12 1276636 153955 166424 60316 2012-13 1265618 180268 125196 58076 2013-14 1302739 200564 120192 54264 2014-15 1328835 178976 94077 55255 2015-16 1322896 252746 114422 53664 Source : Economic Review 2016
Table 6.7 Details of Cargo Storage
COVERED AREA (Transit Sheds and Overflow sheds) Location Total Sheds Area (Sq.m) Mattanchery Wharf 6 19160 Ernakulam Wharf 4 13200 Container Freight Station 1 10000 Grand Total 11 42360 COVERED AREA (Warehouses) Location Total Sheds Area (Sq.m) Mattanchery Wharf 4 11800 Ernakulam Wharf 1 2980 Cement Godown 1 1000 BTP 1 6000 Grand Total 7 21780 Source; Cochin Port Trust