
Information sharing in supply chains with heterogeneous ...
45
Dominguez R., Cannella S., Póvoa A.P., Framinan J.M. 2017. Information sharing in supply chains with heterogeneous retailers. Omega. DOI: https://doi.org/10.1016/j.omega.2017.08.005 Information sharing in supply chains with heterogeneous retailers Roberto Dominguez a,* , Salvatore Cannella b , Ana P. Barbosa-Póvoa a , Jose M. Framinan c a Centre for Management Studies, Instituto Superior Técnico (CEG-IST), Technical University of Lisbon, Portugal b DICAR, University of Catania, Catania, Italy c Industrial Management & Business Administration Department, School of Engineering, University of Seville, Spain E-Mails: [email protected], [email protected], [email protected], [email protected] * Corresponding author: Roberto Dominguez, Centre for Management Studies (CEG-IST), Instituto Superior Técnico, Technical University of Lisbon, Ave. Rovisco Pais 1, 1049-001, Lisbon, Portugal. Abstract This work analyses partial information sharing involving retailers with different operational configurations. Retailers are characterized by four operational factors, i.e., demand variance, lead time average, forecasting period and inventory policy. The findings show that the performance improvement based on information sharing depends on retailers’ operational factors. Consequently, partial information sharing structures need to be carefully designed in order to achieve a substantial performance improvement. The results also serve to provide innovative recommendations to supply chain managers in order to efficiently implement information sharing mechanisms at retailers. Keywords: Supply chain management; partial information sharing; heterogeneous retailers; bullwhip effect; multi-agent systems; dynamic performance.
-
Upload
khangminh22 -
Category
Documents
-
view
5 -
download
0
Transcript of Information sharing in supply chains with heterogeneous ...
Dominguez R., Cannella S., Póvoa A.P., Framinan J.M. 2017. Information sharing in supply chains with
heterogeneous retailers. Omega. DOI: https://doi.org/10.1016/j.omega.2017.08.005
Information sharing in supply chains with heterogeneous retailers
Roberto Domingueza,*, Salvatore Cannellab, Ana P. Barbosa-Póvoaa, Jose M. Framinanc
aCentre for Management Studies, Instituto Superior Técnico (CEG-IST), Technical University of Lisbon,
Portugal bDICAR, University of Catania, Catania, Italy
cIndustrial Management & Business Administration Department, School of Engineering, University of
Seville, Spain
E-Mails: [email protected], [email protected], [email protected],
*Corresponding author: Roberto Dominguez, Centre for Management Studies (CEG-IST), Instituto
Superior Técnico, Technical University of Lisbon, Ave. Rovisco Pais 1, 1049-001, Lisbon, Portugal.
Abstract
This work analyses partial information sharing involving retailers with different
operational configurations. Retailers are characterized by four operational factors, i.e.,
demand variance, lead time average, forecasting period and inventory policy. The
findings show that the performance improvement based on information sharing depends
on retailers’ operational factors. Consequently, partial information sharing structures
need to be carefully designed in order to achieve a substantial performance
improvement. The results also serve to provide innovative recommendations to supply
chain managers in order to efficiently implement information sharing mechanisms at
retailers.
Keywords: Supply chain management; partial information sharing; heterogeneous
retailers; bullwhip effect; multi-agent systems; dynamic performance.
Dominguez R., Cannella S., Póvoa A.P., Framinan J.M. 2017. Information sharing in supply chains with
heterogeneous retailers. Omega. DOI: https://doi.org/10.1016/j.omega.2017.08.005
2
1 INTRODUCTION
1.1 Context
Globalization and a high volume of outsourcing has resulted in decentralized Supply
Chains (SCs), shifting from a sequential linear SC to an increasingly complex global
supply network (see e.g., Merzifonluoglu 2015, Annarelli and Nonino 2016, Li and
Zhen 2016). SC partners have a higher autonomy, as they are part of many parallel
chains at the same time (Zissis et al. 2015, Thomas et al. 2016). This fact reinforced the
presence of conflicting objectives within the SC where competition exists for common
resources and decisions are taken on individually based local incentives (Rached et al.
2016). The complexity of SCs has risen sharply in recent decades (Cardoso et al. 2015,
Guertler and Spinler 2015), often leading to a lack of coordination among SC members.
In this context, SCs from western economies to low-cost countries have been
experiencing unpredictable and intensive deterioration of performance (Christopher and
Holweg 2017). Additionally, the severe and synchronized trade collapse has amplified
inefficiencies within the SCs, and subsequently led to detrimental phenomena such as
the bullwhip effect (see e.g. Altomonte et al. 2012, Duan et al. 2015, Osadchiy et al.
2015). To overcome these inefficiencies, researchers and practitioners have been
working on robust solutions. Among these, SC collaboration practices have been
advocated as some of the most effective approaches (see e.g. Dejonckheere et al. 2004,
Chen and Lee 2009, Trapero et al. 2012, Li and Zhang 2015, among others). At the core
of collaboration practices lies information sharing (IS), a collaborative mechanism in
which the supplier may obtain and utilize the demand and inventory status of the retailer
(Huang et al. 2016).
During the last decade, the benefits of IS in decentralized SCs have been deeply
researched with empirical studies of real cases (see e.g. Huo et al. 2014, Bian et al.
2016, Ren 2017), analytical methods (Chen and Lee 2009, Trapero et al. 2012, Ali et al.
2017), and simulation (Datta and Christopher 2011, Ramanathan 2014, Dominguez et
al. 2015b, Cannella et al. 2017). In general, regardless of the adopted methodologies
and the explored aspects of IS (e.g. reasons for sharing, what information to share with
whom, how to share, as well as pre-requisites, drivers and barriers to IS, see Kembro et
al. 2014), the majority of the literature agrees on the pivotal role benefits of IS practices
in SC performance (Maghsoudi and Pazirandeh 2016). The expected revenues (e.g. a
Dominguez R., Cannella S., Póvoa A.P., Framinan J.M. 2017. Information sharing in supply chains with
heterogeneous retailers. Omega. DOI: https://doi.org/10.1016/j.omega.2017.08.005
3
reduction in inventory holding cost, Hosoda et al. 2008) have been capturing the
attention of SC practitioners (Kembro and Selviaridis 2015). As an example, a recent
survey found that 61% of Chinese firms believe that IS is essential for business success
(Bian et al. 2016). Basically, IS has been and continues to be a major topic in modern
SC management and, contrary to popular belief, there is still significant need for more
research regarding IS in SC (Kembro et al. 2014, Costantino et al. 2015).
1.2 Problem Statement
Despite the potential benefits of IS in SC, its practical implementation presents relevant
difficulties (Fawcett et al. 2011, Spekman and Davis 2016). Full coordination among
SC members, while desirable, is often impractical, since it is deemed to be too costly or
too risky (Geunes et al. 2016). Making information available to other enterprises and
managing the information requires investment in Information Technology (IT) and
entails significant resource investments, which could result in a negative cost–benefit
analysis (Chan and Chan 2010, Kembro et al. 2014). Additionally, companies need to
bear the risk that information may be leaked intentionally or unintentionally by
suppliers (Kong et al. 2013, Huang et al. 2016). Finally, resulting benefits of IS may be
difficult to allocate in a reasonable way among SC partners (Shih et al. 2015).
Evidence of these barriers to achieve full collaboration among SC members can be
found in practice. Accordingly, the Retailer-Direct Data Report of the Grocery
Manufacturers Association (GMA) pointed out that retailers may not have an incentive
to share data with suppliers (GMA 2009, Shang et al. 2016). Additionally, a study
performed by Forrester Research on 89 retailers in 2006 reported that only 27% of
retailers shared POS data (Shang et al. 2016). In this context, achieving a full IS (i.e., all
SC members participate in IS, referred to as FIS in the following) is not always
possible. Thus, in practice, partial IS is found to be prevalent (Shnaiderman and
Ouardighi 2014, Xu et al. 2015). However, in the scientific literature, partial IS has been
rarely analysed because the majority of studies dealing with IS assume a full
collaboration practice among all members (Holmstrőm et al. 2016). In light of these
considerations, studying the dynamics of SC in scenarios where FIS cannot be achieved
represents a challenge for researchers and may bring potential benefits for industry.
Dominguez R., Cannella S., Póvoa A.P., Framinan J.M. 2017. Information sharing in supply chains with
heterogeneous retailers. Omega. DOI: https://doi.org/10.1016/j.omega.2017.08.005
4
To the best of the authors’ knowledge, up to now, partial IS has been addressed in
literature in five relevant studies. Ganesh et al. (2014a,b) and Costantino et al. (2014)
analyse the impact of different degrees of collaboration on SC performance (i.e.,
inventory holding and shortage costs, bullwhip effect and/or customer service level) in a
serial SC, while Lau et al. (2004) analyse partial IS in more complex SCs, in particular
in three divergent SCs. Finally, Huang and Iravani (2005) focus on one capacitated
manufacturer and two retailers under a (Q,R) inventory policy, where the former
receives demand and inventory information from only one of the retailers.
The above-mentioned works have significantly contributed to the unexplored topic of
partial IS by showing two novel insights:
(1) Retailers should be the first members to be involved in IS (Ganesh et al. 2014a,b,
Costantino et al. 2014, Lau et al. 2004), since they report the highest performance
improvement to the SC.
(2) The operational factors (OFs) of retailers, such as market shares and order sizes,
may have a significant impact on the benefits provided by the IS practice under
partial collaboration (Huang and Iravani 2005).
The former insight reasserts the central role of retailers for the efficacy of IS, while the
latter suggests that SCs characterized by heterogeneous retailers (i.e., retailers with
different OFs such as lead times, order policies, market demand, etc.), may perform
differently under the same IS practice. Both insights open interesting challenges for
researchers and advocate important implications for industry, as they point out the
relevance of exploring the efficiency of partial IS at retailers when these are
heterogeneous. According to these insights, we formulate the following research
questions: how retailers with different OFs may impact on SC performance when they
share information about customer demand? Which retailers’ OFs are more relevant in
order to consider a retailer as a potential partner for the IS scheme and at what extent?
1.3 Objective
Motivated by the above considerations, in this paper we aim to contribute to the existing
literature by assessing how heterogeneous retailers, characterized by different critical
OFs (i.e., demand variability, average lead time, forecasting period and inventory
Dominguez R., Cannella S., Póvoa A.P., Framinan J.M. 2017. Information sharing in supply chains with
heterogeneous retailers. Omega. DOI: https://doi.org/10.1016/j.omega.2017.08.005
5
policy), may improve SC performance by sharing (or not) true demand information. We
assume that due to the decentralized nature of modern SCs, companies and, specifically,
the retailers, are autonomous members who work for their own goals and interests and
thus, retailers’ OFs are considered as exogenous factors. In this manner we aim to
provide recommendations to SC managers on how to properly exploit the benefits of
implementing IS practices with retailers by identifying which retailers provide a higher
contribution to SC performance.
To fulfil the research objective, we focus on a four echelon SC (i.e., Factory,
Distributor, Wholesaler and Retailer) in which each echelon is characterized by one
member with the exception of the Retailer’s echelon, which is constituted by four
members. We compare different partial IS scenarios (some retailers may share demand
information, while some others may not share information) under two different
hypothesis: (1) homogeneous retailers and (2) heterogeneous retailers. Under the former
hypothesis we analyse the SC performance when identical retailers are involved in IS
one by one, on variety of SC configurations. Under the latter hypothesis we assess the
impact on SC performance of involving retailers with different OFs in IS. SC
performance is measured using a set of system level metrics (i.e., Bullwhip Slope,
Inventory Slope and Systemic Inventory Level), which provide a clear, comprehensive
and structured assessment of the SC performance at systemic level and the “internal
process efficiency”, as well as provide information on the potential benefits of
partnerships, collaboration and information productivity of SC members (Cannella et al.
2013).
Due to the exploratory nature of this research, we adopt an appropriate and structured
methodology for studying the dynamic of SCs, i.e., computer simulation (Oliveira et al.
2016), and more specifically the Multi-Agent Systems (MAS) modelling approach
(Chatfield et al. 2006, Rahmandad and Sterman 2008). MAS has been recognized as a
useful methodology to perform complex prospective SC analysis, and findings obtained
with its proper adoption have been significantly contributing to understand the
dynamics in SC (see e.g., Swaminathan et al. 1998, Long and Zhang 2014, Hilletofth et
al. 2016 or Ponte et al. 2017). In order to perform a systematic simulation analysis we
adopt reasonable assumptions and data inputs for simulations obtained from different
cases to emulate real-world logistic systems (Rabinovic and Cheon 2011, Cannella et al.
2017).
Dominguez R., Cannella S., Póvoa A.P., Framinan J.M. 2017. Information sharing in supply chains with
heterogeneous retailers. Omega. DOI: https://doi.org/10.1016/j.omega.2017.08.005
6
The results obtained reveal new insights on the impact of IS in SC by showing the need
of individually estimating the potential value of retailers’ information prior to the
implementation of IS. When retailers are homogeneous, their collaboration may provide
equal potential benefits to SC performance (they contribute the same to improve SC
performance when they are involved in IS). Under this hypothesis, benefits of IS
increase with the number of retailers involved and a full IS approach is recommended.
On the contrary, when retailers are heterogeneous they have different potential value
depending on their operational configuration. Under this hypothesis, performance
achieved by different partial IS structures with the same number of retailers might be
significantly different (e.g., we found that involving half of the total number of retailers
into IS may lead to obtain over 70% of the total benefits of a FIS under the boundary
conditions). In fact, retailers with (1) higher demand variance, (2) lower forecasting
period, and (3) higher average lead time, are potentially the most beneficial partners
when implementing IS.
The remainder of this paper is as follows: Section 2 describes the SC model and
methodology. Section 3 presents the design of experiments and performance metrics.
Section 4 analyses the results obtained. Section 5 presents managerial implications.
Finally, Section 6 draws the conclusions, limitations of the study and future research
lines.
2 SC MODEL AND METHODOLOGY
In order to analyse the partial IS scenarios, we develop a SC model to conduct the
experiments. In SC dynamics literature, the most used SC model is the four-echelon
serial SC (see e.g. Sterman 1989, Chatfield et al. 2004, Croson et al. 2014, Cannella et
al. 2015). Echelons are referred as Factory (i=1), Distributor (i=2), Wholesaler (i=3),
and Retailer (i=4). In order to analyse scenarios where only some of the retailers
participate in IS (referred as partial IS) we extend this SC model by increasing the
number of retailers to four, thus resulting a divergent SC (Lau et al. 2004, Dominguez et
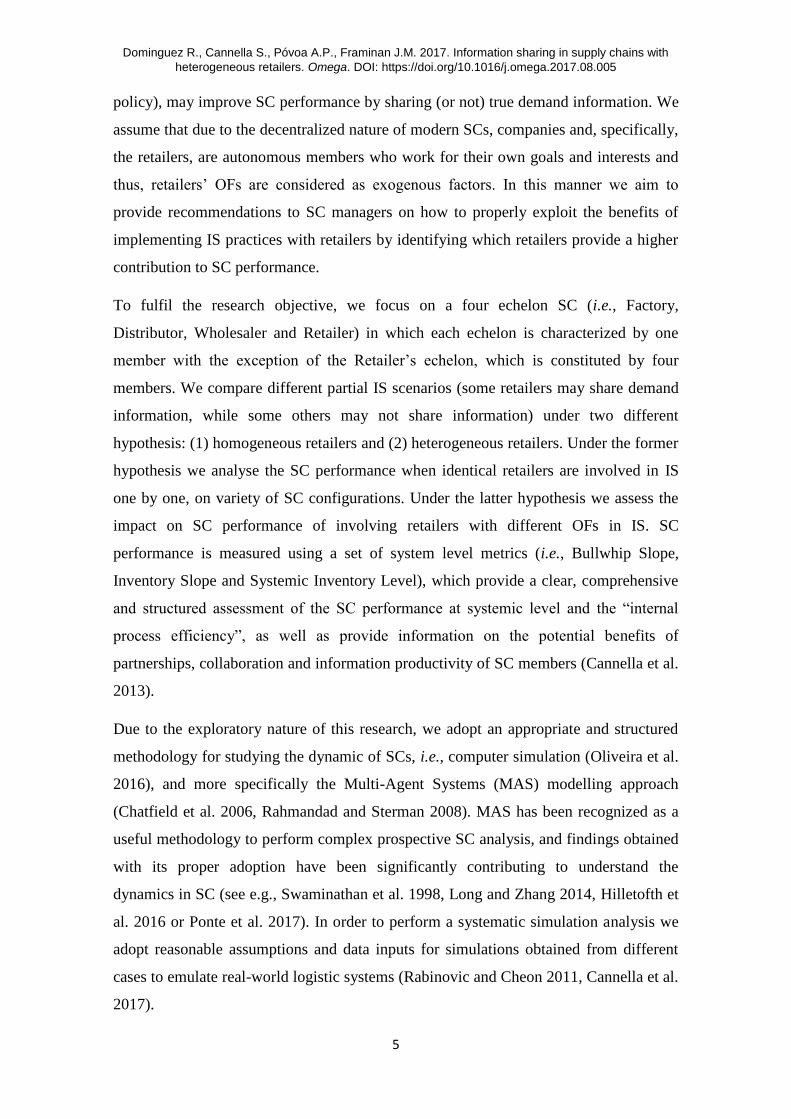
al. 2015a, Rached et al. 2016), as shown in Figure 1.
Dominguez R., Cannella S., Póvoa A.P., Framinan J.M. 2017. Information sharing in supply chains with
heterogeneous retailers. Omega. DOI: https://doi.org/10.1016/j.omega.2017.08.005
7
Figure 1. SC configuration.
In addition, we make the following assumptions regarding IS:
1. As we focus our analysis of partial IS at retailers’ stage, only retailers share
information on customer’s demand.
2. Assuming that, due to some barriers (as described in Section 1) each enterprise
is willing to share its local information only to its immediate upstream enterprise
(see Lau et al. 2004, Kembro and Selviaridis 2015, for similar assumptions),
only the wholesaler will be able to receive information from retailers.
2.1 Supply Chain model
The SC general model has been adapted from Chatfield et al. (2004) so as to model a
generic divergent SC (Dominguez et al. 2015a,b, Cannella et al. 2017) and to include
partial IS (i.e., any node at any echelon of the SC may share information with an
upstream linked node). The notation is described in Table 1. This general model is
adapted in Section 3.1 for the SCs under study with specific parameters values and
experimental factors.
Dominguez R., Cannella S., Póvoa A.P., Framinan J.M. 2017. Information sharing in supply chains with
heterogeneous retailers. Omega. DOI: https://doi.org/10.1016/j.omega.2017.08.005
8
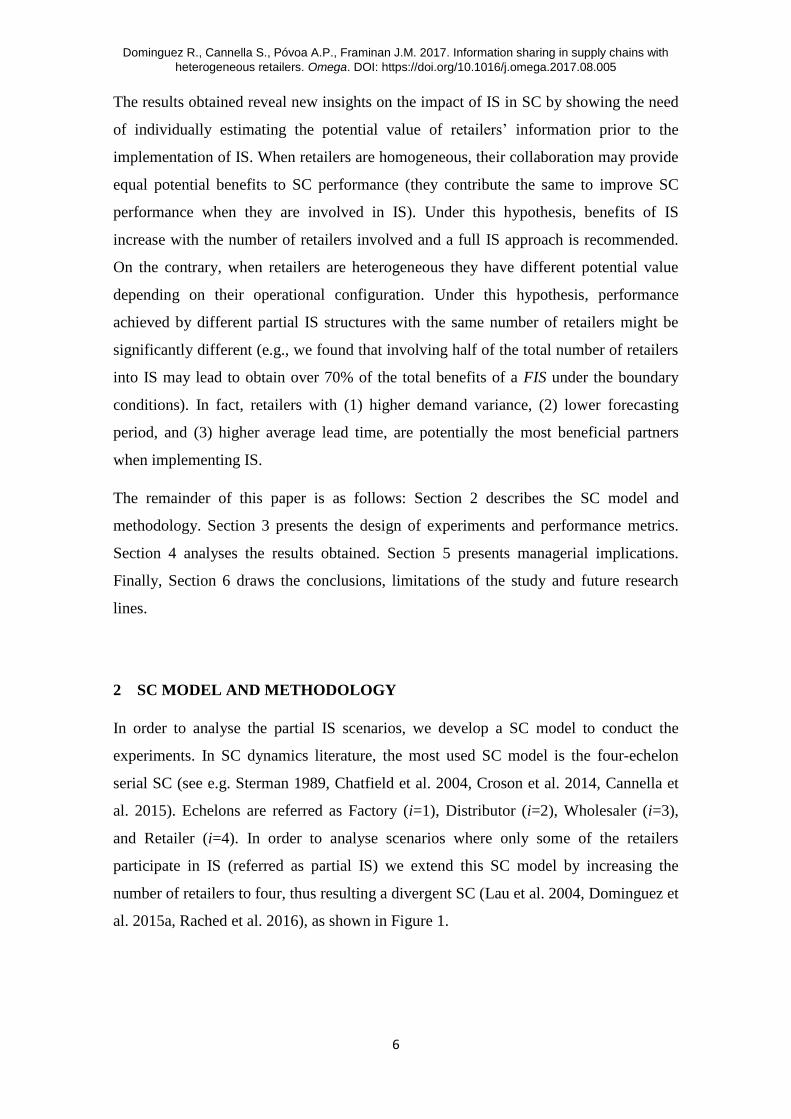
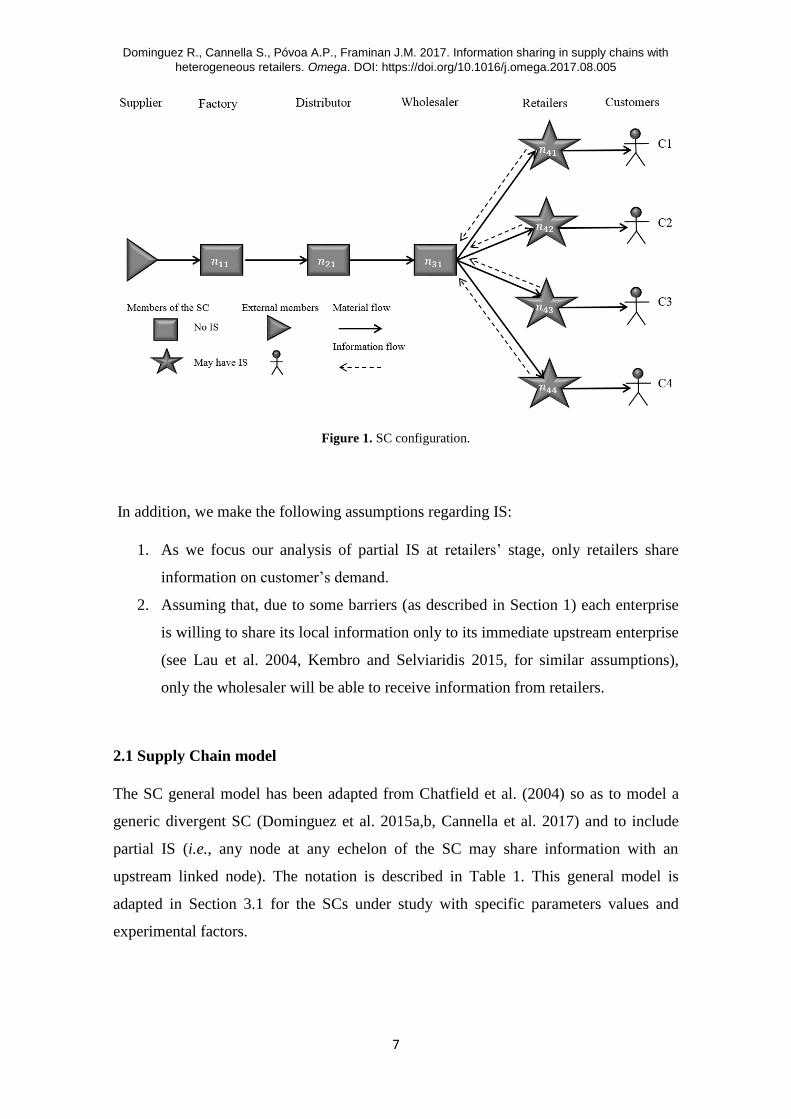
Table 1. Notation.
i Echelon position in the SC 𝜏𝑖𝑗 Forecasting period of 𝑛𝑖𝑗
j Node position within a given echelon 𝑂𝑖𝑗𝑡 Orders placed by 𝑛𝑖𝑗 at time t
𝑛𝑖𝑗 Node at position j in echelon i 𝐼𝑖𝑗𝑡 Inventory on hand of 𝑛𝑖𝑗 at time t
E Total number of echelons 𝑊𝐼𝑃𝑖𝑗𝑡 Work in progress of 𝑛𝑖𝑗 at time t
𝑁𝑖 Total number of nodes in echelon i 𝐵𝑖𝑗𝑡 Backlog of 𝑛𝑖𝑗 at time t
𝑁𝐶 Total number of customers 𝑆ℎ𝐷𝑖𝑗𝑡 Shared demand of 𝑛𝑖𝑗 at time t
𝐶𝑗 Customer at position j 𝛿𝑖𝑗 𝛿𝑖𝑗=1 if 𝑛𝑖𝑗 is involved in IS, 0 otherwise.”
t Current simulation time 𝐼𝑃𝑖𝑗 Inventory policy of 𝑛𝑖𝑗
T Total simulation time (excluding warm-up) 𝑉𝑖𝑗 Set of downstream linked partners of 𝑛𝑖𝑗
𝐷𝐶𝑗
𝑡 Demand placed by customer 𝐶𝑗 at time t 𝑠𝑂𝑖
𝑡2 Estimated variance of orders placed by echelon i
𝜇𝐷𝐶𝑗 Average demand placed by 𝐶𝑗 �̅�𝑖
𝑡 Estimated average of orders placed by echelon i at
time t
�̅�𝐶𝑗
𝑡 Estimated average demand placed by 𝐶𝑗 at
time t 𝜎𝑂𝑖𝑗
2 Variance of orders placed by 𝑛𝑖𝑗
𝜎𝐷𝐶𝑗
2 Variance of demand placed by 𝐶𝑗 𝑠𝑂𝑖𝑗
𝑡2 Estimated variance of orders placed by 𝑛𝑖𝑗
𝑠𝐷𝐶𝑗
𝑡2 Estimated variance demand placed by 𝐶𝑗 𝑠
𝐼𝑖𝑡
2 Estimated variance of inventory at echelon i
𝐷𝑖𝑗𝑡 Demand faced by 𝑛𝑖𝑗 at time t 𝐼�̅�
𝑡 Estimated average of inventory at echelon i at
time t
�̅�𝑖𝑗𝑡
Estimated average demand faced by 𝑛𝑖𝑗 at
time t 𝑠
𝐼𝑖𝑗𝑡
2 Estimated variance of inventory at 𝑛𝑖𝑗
𝑠𝐷𝑖𝑗
𝑡2
Estimated variance demand faced by 𝑛𝑖𝑗 at
time t 𝐼�̅�𝑗
𝑡 Estimated average of inventory at 𝑛𝑖𝑗 at time t
𝐿𝑖𝑗𝑡 Lead time of 𝑛𝑖𝑗 at time t �̅�𝐶
𝑡 Estimated average demand placed by customers at
time t
𝜇𝐿𝑖𝑗 Average lead time of 𝑛𝑖𝑗 𝜋𝑖 Position of the i-th echelon
�̅�𝑖𝑗𝑡 Estimated average lead time of 𝑛𝑖𝑗 at time t 𝑂𝑅𝑉𝑟𝑅𝑖 Order Rate Variance Ratio echelon i
𝜎𝐿𝑖𝑗
2 Variance of the lead time of 𝑛𝑖𝑗 𝐼𝑛𝑣𝑉𝑟𝑅𝑖 Inventory Variance Ratio echelon i
𝑠𝐿𝑖𝑗
𝑡2
Estimated variance of the lead time of 𝑛𝑖𝑗 at
time t 𝐼𝑛𝑣𝐴𝑣𝑖 Inventory Average at echelon i
R Inventory review period BwSl Bullwhip slope
𝑆𝑖𝑗𝑡 Desired level of stock of 𝑛𝑖𝑗 at time t InvSl Inventory slope
z Safety factor for the OUT policy SysInvAv Systemic inventory average
General Modelling Assumptions
At period t, each customer 𝐶𝑗 places an independent stochastic demand
𝐷𝐶𝑗
𝑡 following a normal distribution with mean 𝜇𝐷𝐶𝑗, estimated by �̅�𝐶𝑗
𝑡 , and
variance 𝜎𝐷𝐶𝑗
2 , estimated by 𝑠𝐷𝐶𝑗
𝑡2 . Customers do not fill orders.
Dominguez R., Cannella S., Póvoa A.P., Framinan J.M. 2017. Information sharing in supply chains with
heterogeneous retailers. Omega. DOI: https://doi.org/10.1016/j.omega.2017.08.005
9
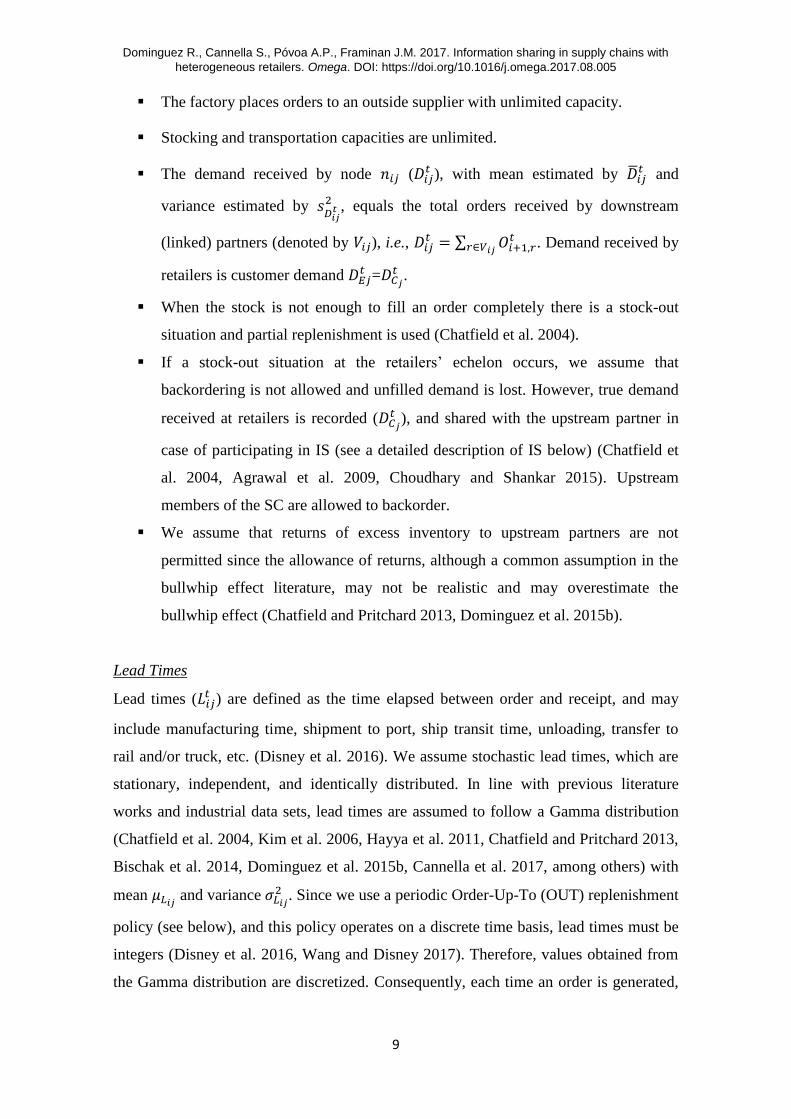
The factory places orders to an outside supplier with unlimited capacity.
Stocking and transportation capacities are unlimited.
The demand received by node 𝑛𝑖𝑗 (𝐷𝑖𝑗𝑡 ), with mean estimated by �̅�𝑖𝑗
𝑡 and
variance estimated by 𝑠𝐷𝑖𝑗
𝑡2 , equals the total orders received by downstream
(linked) partners (denoted by 𝑉𝑖𝑗), i.e., 𝐷𝑖𝑗𝑡 = ∑ 𝑂𝑖+1,𝑟
𝑡𝑟∈𝑉𝑖𝑗
. Demand received by
retailers is customer demand 𝐷𝐸𝑗𝑡 =𝐷𝐶𝑗
𝑡 .
When the stock is not enough to fill an order completely there is a stock-out
situation and partial replenishment is used (Chatfield et al. 2004).
If a stock-out situation at the retailers’ echelon occurs, we assume that
backordering is not allowed and unfilled demand is lost. However, true demand
received at retailers is recorded (𝐷𝐶𝑗
𝑡 ), and shared with the upstream partner in
case of participating in IS (see a detailed description of IS below) (Chatfield et
al. 2004, Agrawal et al. 2009, Choudhary and Shankar 2015). Upstream
members of the SC are allowed to backorder.
We assume that returns of excess inventory to upstream partners are not
permitted since the allowance of returns, although a common assumption in the
bullwhip effect literature, may not be realistic and may overestimate the
bullwhip effect (Chatfield and Pritchard 2013, Dominguez et al. 2015b).
Lead Times
Lead times (𝐿𝑖𝑗𝑡 ) are defined as the time elapsed between order and receipt, and may
include manufacturing time, shipment to port, ship transit time, unloading, transfer to
rail and/or truck, etc. (Disney et al. 2016). We assume stochastic lead times, which are
stationary, independent, and identically distributed. In line with previous literature
works and industrial data sets, lead times are assumed to follow a Gamma distribution
(Chatfield et al. 2004, Kim et al. 2006, Hayya et al. 2011, Chatfield and Pritchard 2013,
Bischak et al. 2014, Dominguez et al. 2015b, Cannella et al. 2017, among others) with
mean 𝜇𝐿𝑖𝑗 and variance 𝜎𝐿𝑖𝑗
2 . Since we use a periodic Order-Up-To (OUT) replenishment
policy (see below), and this policy operates on a discrete time basis, lead times must be
integers (Disney et al. 2016, Wang and Disney 2017). Therefore, values obtained from
the Gamma distribution are discretized. Consequently, each time an order is generated,
Dominguez R., Cannella S., Póvoa A.P., Framinan J.M. 2017. Information sharing in supply chains with
heterogeneous retailers. Omega. DOI: https://doi.org/10.1016/j.omega.2017.08.005
10
a random integer lead time is assigned to it, which corresponds to the number of periods
required for the order to arrive.
Finally, note that uncertain lead times often lead to a phenomenon called order
crossovers (Kim et al. 2006, Hayya et al. 2008, Bischak et al. 2014), i.e., replenishment
may be received in a different sequence than they were ordered (Wang and Disney
2017). Therefore, a node may receive more than one order in some periods, and receive
no orders in other periods (Disney et al. 2016).
OUT replenishment policy
All SC members use a (R,S) or periodic review with OUT level (Nachtmann et al. 2010,
Chatfield and Pritchard 2013, Li et al. 2014). Even though OUT policies are not optimal
when orders may crossover (see Srinivasan et al. 2011, where authors show that, in the
presence of order crossovers, the optimal policy for periodic review systems with
variable lead times is state dependent and thus, computationally intractable; and Disney
et al. 2016, where authors found a linear policy that outperforms the OUT policy in the
presence of order crossovers), they are widely used in SC practice to facilitate the
coordination of product flows, and in the research literature since it is well understood
and implementable (Bischak et al. 2014).
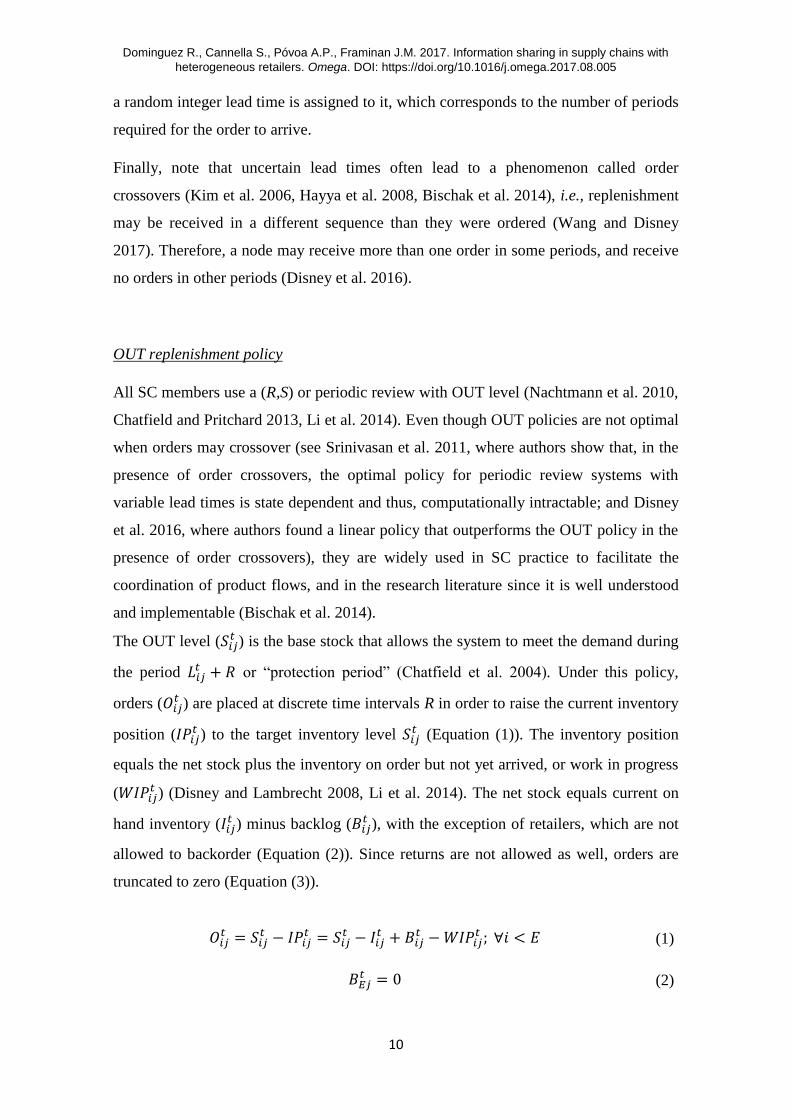
The OUT level (𝑆𝑖𝑗𝑡 ) is the base stock that allows the system to meet the demand during
the period 𝐿𝑖𝑗𝑡 + 𝑅 or “protection period” (Chatfield et al. 2004). Under this policy,
orders (𝑂𝑖𝑗𝑡 ) are placed at discrete time intervals R in order to raise the current inventory
position (𝐼𝑃𝑖𝑗𝑡 ) to the target inventory level 𝑆𝑖𝑗
𝑡 (Equation (1)). The inventory position
equals the net stock plus the inventory on order but not yet arrived, or work in progress
(𝑊𝐼𝑃𝑖𝑗𝑡 ) (Disney and Lambrecht 2008, Li et al. 2014). The net stock equals current on
hand inventory (𝐼𝑖𝑗𝑡 ) minus backlog (𝐵𝑖𝑗
𝑡 ), with the exception of retailers, which are not
allowed to backorder (Equation (2)). Since returns are not allowed as well, orders are
truncated to zero (Equation (3)).
𝑂𝑖𝑗𝑡 = 𝑆𝑖𝑗
𝑡 − 𝐼𝑃𝑖𝑗𝑡 = 𝑆𝑖𝑗
𝑡 − 𝐼𝑖𝑗𝑡 + 𝐵𝑖𝑗
𝑡 − 𝑊𝐼𝑃𝑖𝑗𝑡 ; ∀𝑖 < 𝐸 (1)
𝐵𝐸𝑗𝑡 = 0 (2)
Dominguez R., Cannella S., Póvoa A.P., Framinan J.M. 2017. Information sharing in supply chains with
heterogeneous retailers. Omega. DOI: https://doi.org/10.1016/j.omega.2017.08.005
11
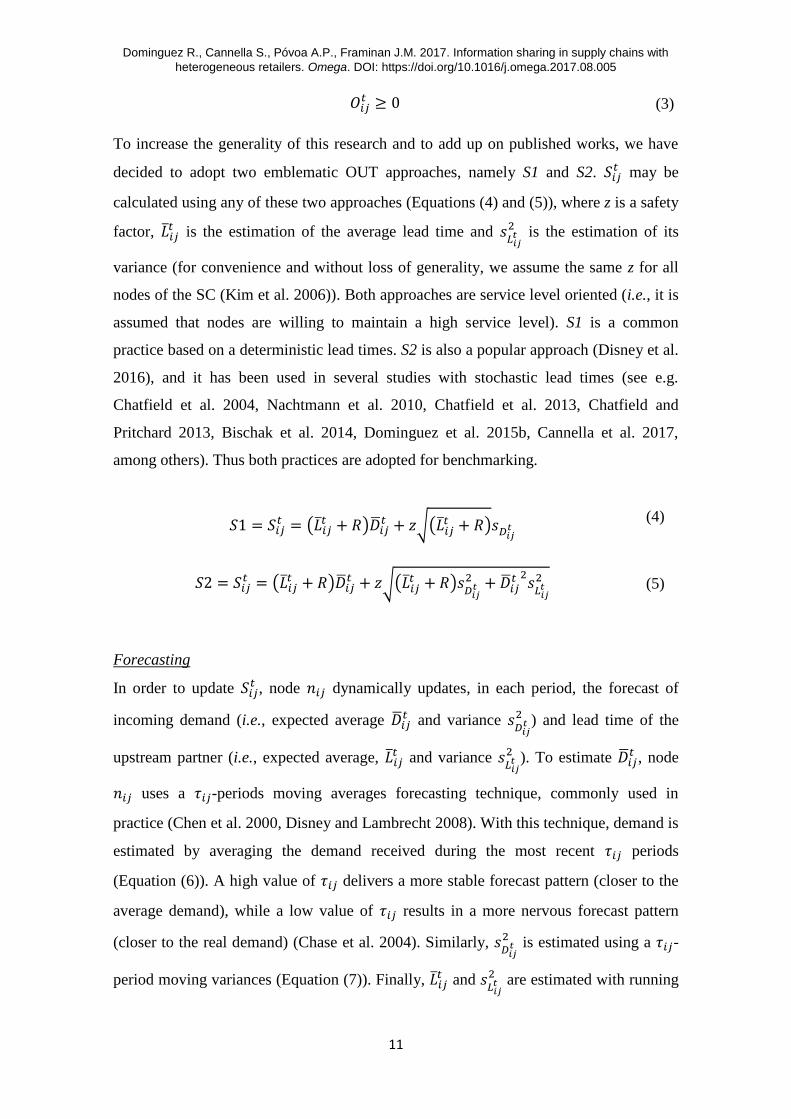
𝑂𝑖𝑗𝑡 ≥ 0 (3)
To increase the generality of this research and to add up on published works, we have
decided to adopt two emblematic OUT approaches, namely S1 and S2. 𝑆𝑖𝑗𝑡 may be
calculated using any of these two approaches (Equations (4) and (5)), where z is a safety
factor, �̅�𝑖𝑗𝑡 is the estimation of the average lead time and 𝑠
𝐿𝑖𝑗𝑡
2 is the estimation of its
variance (for convenience and without loss of generality, we assume the same z for all
nodes of the SC (Kim et al. 2006)). Both approaches are service level oriented (i.e., it is
assumed that nodes are willing to maintain a high service level). S1 is a common
practice based on a deterministic lead times. S2 is also a popular approach (Disney et al.
2016), and it has been used in several studies with stochastic lead times (see e.g.
Chatfield et al. 2004, Nachtmann et al. 2010, Chatfield et al. 2013, Chatfield and
Pritchard 2013, Bischak et al. 2014, Dominguez et al. 2015b, Cannella et al. 2017,
among others). Thus both practices are adopted for benchmarking.
𝑆1 = 𝑆𝑖𝑗𝑡 = (�̅�𝑖𝑗
𝑡 + 𝑅)�̅�𝑖𝑗𝑡 + 𝑧√(�̅�𝑖𝑗
𝑡 + 𝑅)𝑠𝐷𝑖𝑗𝑡
(4)
𝑆2 = 𝑆𝑖𝑗𝑡 = (�̅�𝑖𝑗
𝑡 + 𝑅)�̅�𝑖𝑗𝑡 + 𝑧√(�̅�𝑖𝑗
𝑡 + 𝑅)𝑠𝐷𝑖𝑗
𝑡2 + �̅�𝑖𝑗
𝑡 2𝑠
𝐿𝑖𝑗𝑡
2 (5)
Forecasting
In order to update 𝑆𝑖𝑗𝑡 , node 𝑛𝑖𝑗 dynamically updates, in each period, the forecast of
incoming demand (i.e., expected average �̅�𝑖𝑗𝑡 and variance 𝑠
𝐷𝑖𝑗𝑡
2 ) and lead time of the
upstream partner (i.e., expected average, �̅�𝑖𝑗𝑡 and variance 𝑠
𝐿𝑖𝑗𝑡
2 ). To estimate �̅�𝑖𝑗𝑡 , node
𝑛𝑖𝑗 uses a 𝜏𝑖𝑗-periods moving averages forecasting technique, commonly used in
practice (Chen et al. 2000, Disney and Lambrecht 2008). With this technique, demand is
estimated by averaging the demand received during the most recent 𝜏𝑖𝑗 periods
(Equation (6)). A high value of 𝜏𝑖𝑗 delivers a more stable forecast pattern (closer to the
average demand), while a low value of 𝜏𝑖𝑗 results in a more nervous forecast pattern
(closer to the real demand) (Chase et al. 2004). Similarly, 𝑠𝐷𝑖𝑗
𝑡2 is estimated using a 𝜏𝑖𝑗-
period moving variances (Equation (7)). Finally, �̅�𝑖𝑗𝑡 and 𝑠
𝐿𝑖𝑗𝑡
2 are estimated with running
Dominguez R., Cannella S., Póvoa A.P., Framinan J.M. 2017. Information sharing in supply chains with
heterogeneous retailers. Omega. DOI: https://doi.org/10.1016/j.omega.2017.08.005
12
averages and variances, i.e., using all prior information available instead of only the
most recent 𝜏𝑖𝑗 periods (Chatfield 2013, Cannella et al. 2017).
�̅�𝑖𝑗𝑡 =
∑ 𝐷𝑖𝑗𝑡−𝑘𝜏𝑖𝑗
𝑘=1
𝜏𝑖𝑗 (6)
𝑠𝐷𝑖𝑗
𝑡2 =
1
𝜏𝑖𝑗 − 1∑(𝐷𝑖𝑗
𝑡−𝑘 − �̅�𝑖𝑗𝑡−𝑘)2
𝜏𝑖𝑗
𝑘=1
(7)
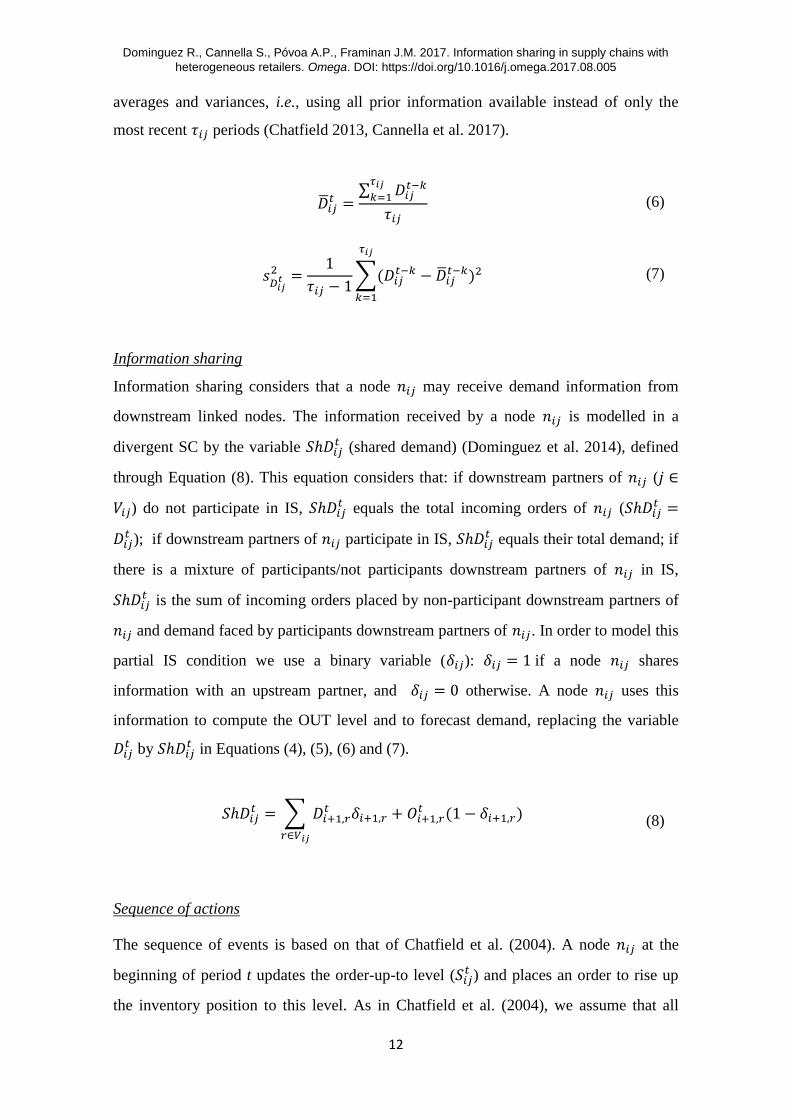
Information sharing
Information sharing considers that a node 𝑛𝑖𝑗 may receive demand information from
downstream linked nodes. The information received by a node 𝑛𝑖𝑗 is modelled in a
divergent SC by the variable 𝑆ℎ𝐷𝑖𝑗𝑡 (shared demand) (Dominguez et al. 2014), defined
through Equation (8). This equation considers that: if downstream partners of 𝑛𝑖𝑗 (𝑗 ∈
𝑉𝑖𝑗) do not participate in IS, 𝑆ℎ𝐷𝑖𝑗𝑡 equals the total incoming orders of 𝑛𝑖𝑗 (𝑆ℎ𝐷𝑖𝑗
𝑡 =
𝐷𝑖𝑗𝑡 ); if downstream partners of 𝑛𝑖𝑗 participate in IS, 𝑆ℎ𝐷𝑖𝑗
𝑡 equals their total demand; if
there is a mixture of participants/not participants downstream partners of 𝑛𝑖𝑗 in IS,
𝑆ℎ𝐷𝑖𝑗𝑡 is the sum of incoming orders placed by non-participant downstream partners of
𝑛𝑖𝑗 and demand faced by participants downstream partners of 𝑛𝑖𝑗. In order to model this
partial IS condition we use a binary variable (𝛿𝑖𝑗): 𝛿𝑖𝑗 = 1 if a node 𝑛𝑖𝑗 shares
information with an upstream partner, and 𝛿𝑖𝑗 = 0 otherwise. A node 𝑛𝑖𝑗 uses this
information to compute the OUT level and to forecast demand, replacing the variable
𝐷𝑖𝑗𝑡 by 𝑆ℎ𝐷𝑖𝑗
𝑡 in Equations (4), (5), (6) and (7).
𝑆ℎ𝐷𝑖𝑗𝑡 = ∑ 𝐷𝑖+1,𝑟
𝑡 𝛿𝑖+1,𝑟 + 𝑂𝑖+1,𝑟𝑡 (1 − 𝛿𝑖+1,𝑟)
𝑟∈𝑉𝑖𝑗
(8)
Sequence of actions
The sequence of events is based on that of Chatfield et al. (2004). A node 𝑛𝑖𝑗 at the
beginning of period t updates the order-up-to level (𝑆𝑖𝑗𝑡 ) and places an order to rise up
the inventory position to this level. As in Chatfield et al. (2004), we assume that all
Dominguez R., Cannella S., Póvoa A.P., Framinan J.M. 2017. Information sharing in supply chains with
heterogeneous retailers. Omega. DOI: https://doi.org/10.1016/j.omega.2017.08.005
13
nodes perform these actions in parallel, thus they are not aware of what is occurring at
the other nodes. Therefore, information on orders, shared demand and lead times at
period t is not available to update 𝑆𝑖𝑗𝑡 , and nodes use data from previous period t-1 (we
are assuming R=1, see Section 3.1) to forecast demand and lead times, and update 𝑆𝑖𝑗𝑡 .
Then, new products are received from the upstream partner, and backlog and the new
incoming demand are satisfied. This modelling assumption is also consistent with Chen
et al. (2000). A summary of the sequence of events is shown next:
1. Update the OUT level (𝑆𝑖𝑗𝑡 ) using the forecasts computed in the previous period.
2. If 𝑆𝑖𝑗𝑡 is higher than the inventory position, place an order 𝑂𝑖𝑗
𝑡 to raise the
inventory position to 𝑆𝑖𝑗𝑡 and increase 𝑊𝐼𝑃𝑖𝑗
𝑡 accordingly. Otherwise, no order is
placed.
3. Receive products from the upstream partner. Reduce 𝑊𝐼𝑃𝑖𝑗𝑡 and increase 𝐼𝑖𝑗
𝑡
accordingly.
4. If i<4 and 𝐼𝑖𝑗𝑡 >0, satisfy backorders. Reduce 𝐼𝑖𝑗
𝑡 and 𝐵𝑖𝑗𝑡 accordingly.
5. Receive new orders from downstream nodes and satisfy demand if possible,
reducing 𝐼𝑖𝑗𝑡 accordingly. If i<4, any unsatisfied demand is backordered, and 𝐵𝑖𝑗
𝑡
is increased accordingly. Otherwise, unsatisfied demand is lost.
6. Update 𝑆ℎ𝐷𝑖𝑗𝑡 and calculate a new forecast to be used in the next period
[𝑆ℎ𝐷̅̅ ̅̅ ̅̅𝑖𝑗𝑡 , 𝑠
𝑆ℎ𝐷𝑖𝑗𝑡
2 , �̅�𝑖𝑗𝑡 , 𝑠
𝐿𝑖𝑗𝑡
2 ].
2.2 Methodology
The inherent complexity of the SCs under analysis (such as the divergent configuration,
partial IS, or stochastic demands and lead times) makes simulation to be a good
approach to infer on bullwhip effect. More specifically, we use SCOPE (Dominguez
and Framinan 2013, Dominguez et al. 2015b), a MAS-based SC simulator specifically
designed to model complex SCs that was implemented through Java-Swarm (Hiebeler
1994, Minar et al. 1996), a toolbox library for MAS development.
Real SCs have multiple layers of abstraction (Lin et al. 2002) and they can be studied in
different levels of detail. Accordingly, SCOPE was developed adopting a two-layer
Dominguez R., Cannella S., Póvoa A.P., Framinan J.M. 2017. Information sharing in supply chains with
heterogeneous retailers. Omega. DOI: https://doi.org/10.1016/j.omega.2017.08.005
14
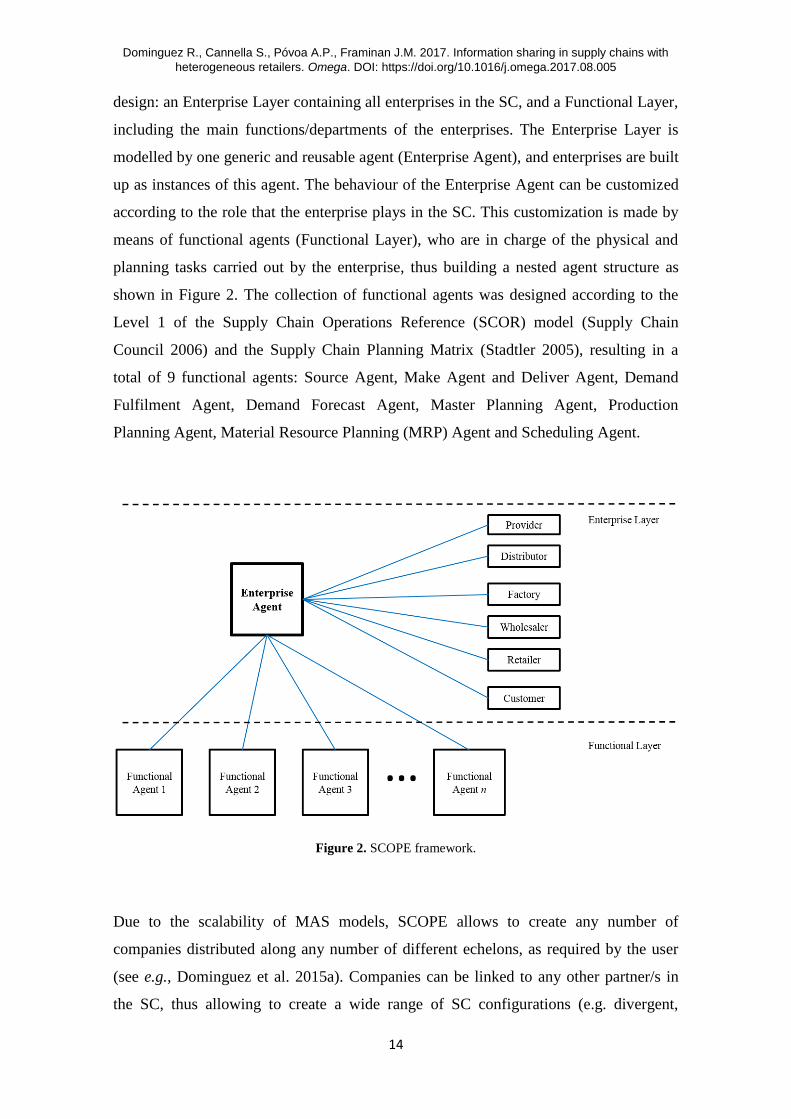
design: an Enterprise Layer containing all enterprises in the SC, and a Functional Layer,
including the main functions/departments of the enterprises. The Enterprise Layer is
modelled by one generic and reusable agent (Enterprise Agent), and enterprises are built
up as instances of this agent. The behaviour of the Enterprise Agent can be customized
according to the role that the enterprise plays in the SC. This customization is made by
means of functional agents (Functional Layer), who are in charge of the physical and
planning tasks carried out by the enterprise, thus building a nested agent structure as
shown in Figure 2. The collection of functional agents was designed according to the
Level 1 of the Supply Chain Operations Reference (SCOR) model (Supply Chain
Council 2006) and the Supply Chain Planning Matrix (Stadtler 2005), resulting in a
total of 9 functional agents: Source Agent, Make Agent and Deliver Agent, Demand
Fulfilment Agent, Demand Forecast Agent, Master Planning Agent, Production
Planning Agent, Material Resource Planning (MRP) Agent and Scheduling Agent.
Figure 2. SCOPE framework.
Due to the scalability of MAS models, SCOPE allows to create any number of
companies distributed along any number of different echelons, as required by the user
(see e.g., Dominguez et al. 2015a). Companies can be linked to any other partner/s in
the SC, thus allowing to create a wide range of SC configurations (e.g. divergent,
Dominguez R., Cannella S., Póvoa A.P., Framinan J.M. 2017. Information sharing in supply chains with
heterogeneous retailers. Omega. DOI: https://doi.org/10.1016/j.omega.2017.08.005
15
convergent, conjoined or a more generic network SC). Also, they can be easily
customized, allowing the user to create SCs with different members (heterogeneous
SCs). Additional features of SCOPE are: (1) the use of random variables allows to
simulate stochasticity in any business process; (2) its modular design and its
codification in Java make possible to easily add new functions and behaviours, or
modify existent ones; (3) all variable are accessible after simulation, thus allowing to
analyse the outputs of interest.
All the above features make SCOPE a good choice to model divergent SC with
heterogeneous companies, stochastic processes and partial IS. SCOPE was validated by
contrasting the results obtained by other authors, such as Chen et al. (2000),
Dejonckheere et al. (2004) and Chatfield et al. (2004) (see Dominguez and Framinan
2013).
3 DESIGN OF EXPERIMENTS (DoE)
The aim of the DoE is to analyse scenarios of partial IS at retailers, assessing how
different partial IS structures (i.e., which retailers are sharing information with the
wholesaler) impact SC performance over a variety of retailers’ operational
configurations. To do so, we consider two different cases (Huang and Iravani 2005): (1)
homogeneous retailers (retailers’ operational configurations are identical); (2)
heterogeneous retailers (retailers’ operational configurations are different). In the
following we describe the OFs that characterize the different retailers’ operational
configurations, the specific model and simulation parameters, the three metrics used to
measure SC performance, and the DoE.
3.1 Operational factors and model parameters
We characterize retailers’ operational configuration by four OFs, i.e., demand variance
(𝜎𝐷𝐶𝑗
2 ), forecasting period (𝜏𝑖𝑗), lead time average (𝜇𝐿𝑖𝑗) and inventory policy (IPij). In
order to provide comprehensive data inputs, we adopt a full-factorial experimental
design (Evers and Wan 2012), which is described in the following sections. We select
two levels for each retailers’ OF, namely Low (OFL) and high (OFH), which represent
Dominguez R., Cannella S., Póvoa A.P., Framinan J.M. 2017. Information sharing in supply chains with
heterogeneous retailers. Omega. DOI: https://doi.org/10.1016/j.omega.2017.08.005
16
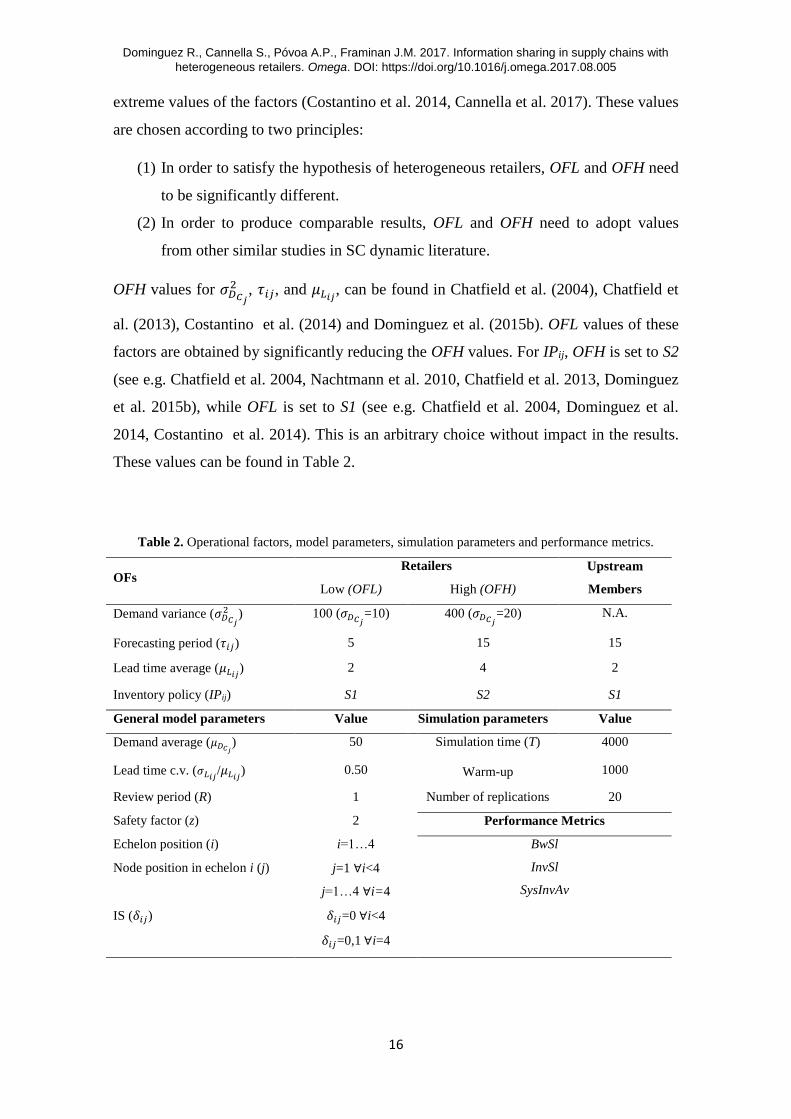
extreme values of the factors (Costantino et al. 2014, Cannella et al. 2017). These values
are chosen according to two principles:
(1) In order to satisfy the hypothesis of heterogeneous retailers, OFL and OFH need
to be significantly different.
(2) In order to produce comparable results, OFL and OFH need to adopt values
from other similar studies in SC dynamic literature.
OFH values for 𝜎𝐷𝐶𝑗
2 , 𝜏𝑖𝑗, and 𝜇𝐿𝑖𝑗, can be found in Chatfield et al. (2004), Chatfield et
al. (2013), Costantino et al. (2014) and Dominguez et al. (2015b). OFL values of these
factors are obtained by significantly reducing the OFH values. For IPij, OFH is set to S2
(see e.g. Chatfield et al. 2004, Nachtmann et al. 2010, Chatfield et al. 2013, Dominguez
et al. 2015b), while OFL is set to S1 (see e.g. Chatfield et al. 2004, Dominguez et al.
2014, Costantino et al. 2014). This is an arbitrary choice without impact in the results.
These values can be found in Table 2.
Table 2. Operational factors, model parameters, simulation parameters and performance metrics.
OFs Retailers Upstream
Members Low (OFL) High (OFH)
Demand variance (𝜎𝐷𝐶𝑗
2 ) 100 (𝜎𝐷𝐶𝑗=10) 400 (𝜎𝐷𝐶𝑗
=20) N.A.
Forecasting period (𝜏𝑖𝑗) 5 15 15
Lead time average (𝜇𝐿𝑖𝑗) 2 4 2
Inventory policy (IPij) S1 S2 S1
General model parameters Value Simulation parameters Value
Demand average (𝜇𝐷𝐶𝑗) 50 Simulation time (T) 4000
Lead time c.v. (𝜎𝐿𝑖𝑗/𝜇𝐿𝑖𝑗
) 0.50 Warm-up 1000
Review period (R) 1 Number of replications 20
Safety factor (z) 2 Performance Metrics
Echelon position (i) i=1…4 BwSl
InvSl
SysInvAv
Node position in echelon i (j) j=1 ∀i<4
j=1…4 ∀i=4
IS (𝛿𝑖𝑗) 𝛿𝑖𝑗=0 ∀i<4
𝛿𝑖𝑗=0,1 ∀i=4
Dominguez R., Cannella S., Póvoa A.P., Framinan J.M. 2017. Information sharing in supply chains with
heterogeneous retailers. Omega. DOI: https://doi.org/10.1016/j.omega.2017.08.005
17
Upstream members of the SC (i.e., Wholesaler, Distributor and Factory) are not subject
of analysis in this work. Hence we simplify the DoE by maintaining the operational
configuration of these members fixed in all experiments (Table 2).
The parameters of the general model –summarised in Table 2– are chosen as usual
values used in SC dynamics literature (see, e.g., Chatfield 2013, Chatfield and Pritchard
2013, Costantino et al. 2014, Dominguez et al. 2015a). The value of the safety factor
(z=2) corresponds with a customer service level of 97.72% when using the normal
approximation.
In order to adapt the model presented in Section 2.1 to the divergent SC under study
(Figure 1), we establish the boundaries of 𝛿𝑖𝑗 and subscripts i and j, as in Table 2.
3.2 Simulation parameters
Uncertainty is inherent to many of the SC’s processes (Heckmann et al. 2015). In order
to account for randomness, multiple replications of the experiments were performed,
and the simulation outputs were statistically analysed. According to Kelton et al. (2007),
when the half-width of confidence interval is smaller than a user-specified value (e.g.
within 10% of the mean, Yang et al. 2011), the number of replications is acceptable for
statistical analysis. As suggested by these authors, simulations were first conducted with
10 replications. Due to the use of systemic performance metrics (see Section 3.3), we
obtained results with very low variances, and thus the half width was below 10% of the
average in all cases. Even though, in order to increase precision of results, we have
performed 20 replications of each experiment (see e.g. Nair and Vidal 2011, Yang et al.
2011).
Total simulation time (T) was set to 4,000 periods to ensure that a steady state of the
system is reached. Also, the first 1,000 periods were removed from the results, as a
warm-up time, to eliminate system’s initialization effects.
3.3 Performance metrics
In order to capture the dynamics of the SC, we adopt a structured non-financial
performance measurement system, given by three common metrics, namely: Order
Dominguez R., Cannella S., Póvoa A.P., Framinan J.M. 2017. Information sharing in supply chains with
heterogeneous retailers. Omega. DOI: https://doi.org/10.1016/j.omega.2017.08.005
18
Variance Ratio, Inventory Variance Ratio and Inventory Average (see e.g. Cannella et
al. 2013, Costantino et al. 2014, Wang and Disney 2016, among others). These metrics
are computed at echelon’s level. Due to the high number of SCs that result from the
DoE (see Section 3.4), we focus instead on the global performance of the SC, allowing
for an easy comparison among the different SCs (Cannella et al. 2017). To do so, we
use systemic metrics (i.e., SC-level metrics), which are computed from their
corresponding echelon’s metrics, i.e., Bullwhip Slope, Inventory Slope, and Systemic
Inventory Average, respectively. A reduction of this set of metrics reflects improved
cost effectiveness of members’ operations. They provide a comprehensive and
structured assessment of the internal process efficiency of the SC at systemic level and
provide information on the potential benefits of partnerships, collaboration and
information productivity of SC members (Cannella et al. 2013). A detailed description
of each metric is provided below.
3.3.1 Order Rate Variance Ratio - Bullwhip Slope
At echelon’s level, Order Rate Variance Ratio (𝑂𝑅𝑉𝑟𝑅𝑖) accounts for order variance
amplification upstream in the SC. In the long-term run it is computed as 𝑂𝑅𝑉𝑟𝑅𝑖 =
𝑠𝑂𝑖
𝑇2 /𝑠
𝐷𝐶𝑇
2 (Chen et al. 2000, Chatfield et al. 2004, Dejonckheere et al. 2004). In order to
apply this metric to a divergent SC, we use aggregate measures for each echelon
(Dominguez et al. 2015b). Therefore, assuming that all customers’ demands are
independent and that each node places orders independently, we can aggregate order
variances at each echelon and thus 𝑂𝑅𝑉𝑟𝑅𝑖 for a divergent SC can be written as in
Equation (9):
𝑂𝑅𝑉𝑟𝑅𝑖 =∑ 𝑠
𝑂𝑖𝑗𝑇
2𝑁𝑖𝑗=1
∑ 𝑠𝐷𝐶𝑗
𝑇2𝑁𝐶
𝑗=1
(9)
At system’s level we use the Bullwhip Slope (BwSl) (Cannella et al. 2013, Dominguez
et al. 2015b). BwSl is computed as the slope of the linear interpolation of the set of
𝑂𝑅𝑉𝑟𝑅𝑖 values for a given SC (Equation (10)), where 𝜋𝑖 is the position of the i-th
echelon in Dejonckheere’s et al. curve. This metric measures the magnitude of the
bullwhip propagation across the SC and allows for a concise and holistic comparison
between different SCs. A high value of BwSl indicates a fast propagation of the
bullwhip effect through the SC, whereas a low value indicates a smooth propagation.
Dominguez R., Cannella S., Póvoa A.P., Framinan J.M. 2017. Information sharing in supply chains with
heterogeneous retailers. Omega. DOI: https://doi.org/10.1016/j.omega.2017.08.005
19
BwSl provides information on potential unnecessary costs for suppliers, such as lost
capacity or opportunity costs, and on all other unexpected costs generated by the
bullwhip effect (Cannella et al. 2013, Trapero and Pedregal 2016).
𝐵𝑤𝑆𝑙 = 𝑡𝑔𝜗𝑂𝑅𝑉𝑟𝑅 =𝐸 ∑ 𝜋𝑖𝑂𝑅𝑉𝑟𝑅𝑖 −𝐸
𝑖=1 ∑ 𝜋𝑖𝐸𝑖=1 ∑ 𝑂𝑅𝑉𝑟𝑅𝑖
𝐸𝑖=1
𝐸 ∑ 𝜋𝑖2𝐸
𝑖=1 − (∑ 𝜋𝑖𝐸𝑖=1 )2
(10)
3.3.2 Inventory Variance Ratio - Inventory Slope
At echelon’s level, the Inventory Variance Ratio (𝐼𝑛𝑣𝑉𝑟𝑅𝑖) (Disney and Towill 2003),
assesses the stability degree of the inventory and it can be associated with the variation
and the potential increment of the holding costs per unit (Cannella et al. 2015). It is
computed as the ratio between the inventory variance at echelon i and the customer
demand variance: 𝐼𝑛𝑣𝑉𝑟𝑅𝑖 = (𝑠𝐼𝑖
𝑇2 /𝐼�̅�
𝑇)/(𝑠𝐷𝐶
𝑇2 /�̅�𝐶
𝑇). Following the same procedure as
with 𝑂𝑅𝑉𝑟𝑅𝑖, we derive 𝐼𝑛𝑣𝑉𝑟𝑅𝑖 for a divergent SC, resulting the expression shown in
Equation (11).
𝐼𝑛𝑣𝑉𝑟𝑅𝑖 =∑ 𝑠
𝐼𝑖𝑗𝑇
2𝑁𝑖𝑗=1 / ∑ 𝐼�̅�𝑗
𝑇𝑁𝑖𝑗=1
∑ 𝑠𝐷𝐶𝑗
𝑇2𝑁𝐶
𝑗=1 / ∑ �̅�𝐶𝑗
𝑇𝑁𝐶
𝑗=1
(11)
At system’s level we use the Inventory Slope (InvSl) (Cannella et al. 2013). This metric
is similar to BwSl (Equation (12)), but accounts for inventory instability propagation
across the SC. An increased InvSl results in higher holding and backlog costs, inflating
the average inventory costs per period (Disney and Lambrecht 2008), increasing holding
unit costs, missing production schedules, job sequencing and resource re-allocation
(Cannella et al. 2013, Duong et al. 2015).
𝐼𝑛𝑣𝑆𝑙 = 𝑡𝑔𝜗𝐼𝑛𝑣𝑉𝑟𝑅 =𝐸 ∑ 𝜋𝑖𝐼𝑛𝑣𝑉𝑟𝑅𝑖 −𝐸
𝑖=1 ∑ 𝜋𝑖𝐸𝑖=1 ∑ 𝐼𝑛𝑣𝑉𝑟𝑅𝑖
𝐸𝑖=1
𝐸 ∑ 𝜋𝑖2𝐸
𝑖=1 − (∑ 𝜋𝑖𝐸𝑖=1 )2
(12)
3.3.3 Inventory Average - Systemic Inventory Average
At echelon’s level, Inventory Average (𝐼𝑛𝑣𝐴𝑣𝑖) can be associated to the average
holding cost over the observation time (Cannella et al. 2013), and it is commonly used
in production-distribution systems analysis to assess concise information on inventory
investment (Cannella and Ciancimino 2010, Ganesh et al. 2014a). It can be viewed as a
metric complementary to 𝐼𝑛𝑣𝑉𝑟𝑅𝑖. For a divergent SC this metric can be expressed as
follows:
Dominguez R., Cannella S., Póvoa A.P., Framinan J.M. 2017. Information sharing in supply chains with
heterogeneous retailers. Omega. DOI: https://doi.org/10.1016/j.omega.2017.08.005
20
𝐼𝑛𝑣𝐴𝑣𝑖 =∑ ∑ 𝐼𝑖𝑗
𝑡𝑇𝑡=1
𝑁𝑖𝑗=1
𝑇 (13)
At system’s level we use the Systemic Inventory Average (SysInvAv) (Cannella et al.
2013). This metric accounts for the average inventory of the whole SC. As it is common
to model holding costs as linearly dependent from stock levels (Sharma 2010, Cachon
and Olivares 2010), this metric quantifies the average holding costs across the
observation time (Cannella et al. 2013). Since all SCs under analysis have the same
number of nodes, we can use the following expression:
𝑆𝑦𝑠𝐼𝑛𝑣𝐴𝑣 =∑ ∑ ∑ 𝐼𝑖𝑗
𝑡𝑇𝑡=1
𝑁𝑖𝑗=1
𝐸𝑖=1
𝑇 (14)
3.4 Experiments
We perform two sets of experiments. In the first one we assume homogeneous retailers,
and intends to assess the contribution of each retailer involved in IS on improving SC
performance when all of them have identical operational configurations. In order to
increase the generality of results, we consider a wide range of possible operational
configurations for the retailers by analysing the full factorial set of the OFs. Since each
OF has two levels, we analyse 24 different retailers’ operational configurations. Then,
each retailers’ operational configuration is evaluated under five IS structures: (1) no IS
(NIS), (2) 1 retailer shares information (1retIS), (3) 2 retailers share information
(2retIS), (4) 3 retailers share information (3retIS), and (5) 4 retailers share information
(FIS). Therefore, we analyse a total of 5x24=80 SCs in this set of experiments.
The second set of experiments is performed under the hypothesis of heterogeneous
retailers, and intends to assess the contribution of each retailer involved in IS on
improving SC performance when they have different operational configurations, and
how retailers’ OFs may influence to their contribution. To this aim, for each of the four
OFs, we model a set of SCs where there are two groups of two retailers. The two
retailers in each group have the same OF value (OF=OF* from now on), but the OF is
different among the two groups. More specifically, the first pair of retailers have the
OFL value and the second pair have the OFH value (e.g. if OF*=𝜎𝐷𝐶𝑗
2 , then the first pair
of retailers will have 𝜎𝐷𝐶𝑗
2 =100 and the second pair of retailers will have 𝜎𝐷𝐶𝑗
2 =400). The
other three OFs remain the same for all the retailers. To increase the generality of the
Dominguez R., Cannella S., Póvoa A.P., Framinan J.M. 2017. Information sharing in supply chains with
heterogeneous retailers. Omega. DOI: https://doi.org/10.1016/j.omega.2017.08.005
21
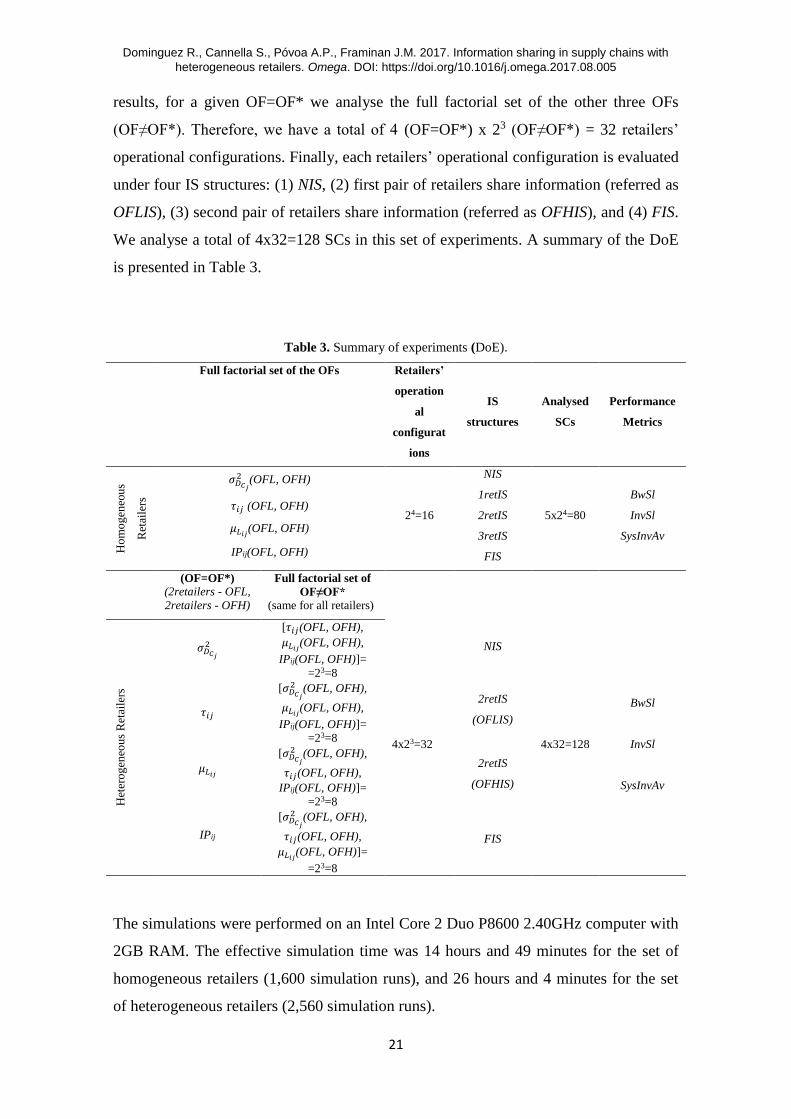
results, for a given OF=OF* we analyse the full factorial set of the other three OFs
(OF≠OF*). Therefore, we have a total of 4 (OF=OF*) x 23 (OF≠OF*) = 32 retailers’
operational configurations. Finally, each retailers’ operational configuration is evaluated
under four IS structures: (1) NIS, (2) first pair of retailers share information (referred as
OFLIS), (3) second pair of retailers share information (referred as OFHIS), and (4) FIS.
We analyse a total of 4x32=128 SCs in this set of experiments. A summary of the DoE
is presented in Table 3.
Table 3. Summary of experiments (DoE).
Full factorial set of the OFs Retailers’
operation
al
configurat
ions
IS
structures
Analysed
SCs
Performance
Metrics
Ho
mo
gen
eou
s
Ret
aile
rs
𝜎𝐷𝐶𝑗
2 (OFL, OFH)
𝜏𝑖𝑗 (OFL, OFH)
𝜇𝐿𝑖𝑗(OFL, OFH)
IPij(OFL, OFH)
24=16
NIS
1retIS
2retIS
3retIS
FIS
5x24=80
BwSl
InvSl
SysInvAv
(OF=OF*)
(2retailers - OFL,
2retailers - OFH)
Full factorial set of
OF≠OF*
(same for all retailers)
Het
ero
gen
eou
s R
etai
lers
𝜎𝐷𝐶𝑗
2
[𝜏𝑖𝑗(OFL, OFH),
𝜇𝐿𝑖𝑗(OFL, OFH),
IPij(OFL, OFH)]=
=23=8
4x23=32
NIS
4x32=128
BwSl
InvSl
SysInvAv
𝜏𝑖𝑗
[𝜎𝐷𝐶𝑗
2 (OFL, OFH),
𝜇𝐿𝑖𝑗(OFL, OFH),
IPij(OFL, OFH)]=
=23=8
2retIS
(OFLIS)
𝜇𝐿𝑖𝑗
[𝜎𝐷𝐶𝑗
2 (OFL, OFH),
𝜏𝑖𝑗(OFL, OFH),
IPij(OFL, OFH)]=
=23=8
2retIS
(OFHIS)
IPij
[𝜎𝐷𝐶𝑗
2 (OFL, OFH),
𝜏𝑖𝑗(OFL, OFH),
𝜇𝐿𝑖𝑗(OFL, OFH)]=
=23=8
FIS
The simulations were performed on an Intel Core 2 Duo P8600 2.40GHz computer with
2GB RAM. The effective simulation time was 14 hours and 49 minutes for the set of
homogeneous retailers (1,600 simulation runs), and 26 hours and 4 minutes for the set
of heterogeneous retailers (2,560 simulation runs).
Dominguez R., Cannella S., Póvoa A.P., Framinan J.M. 2017. Information sharing in supply chains with
heterogeneous retailers. Omega. DOI: https://doi.org/10.1016/j.omega.2017.08.005
22
4 ANALYSIS OF RESULTS
This section presents the results obtained by the simulations performed with SCOPE
according to the DoE presented in Section 3. We also derive meaningful findings on the
implementation of IS on a SC with several retailers.
4.1 Homogeneous retailers
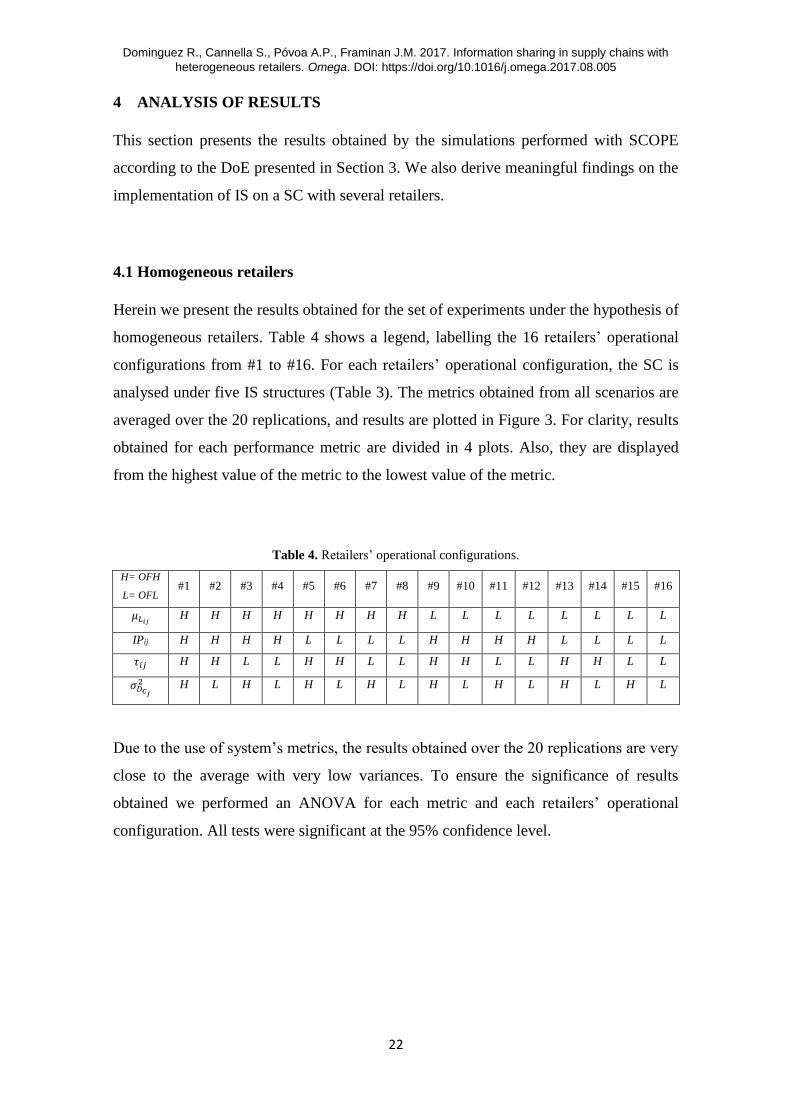
Herein we present the results obtained for the set of experiments under the hypothesis of
homogeneous retailers. Table 4 shows a legend, labelling the 16 retailers’ operational
configurations from #1 to #16. For each retailers’ operational configuration, the SC is
analysed under five IS structures (Table 3). The metrics obtained from all scenarios are
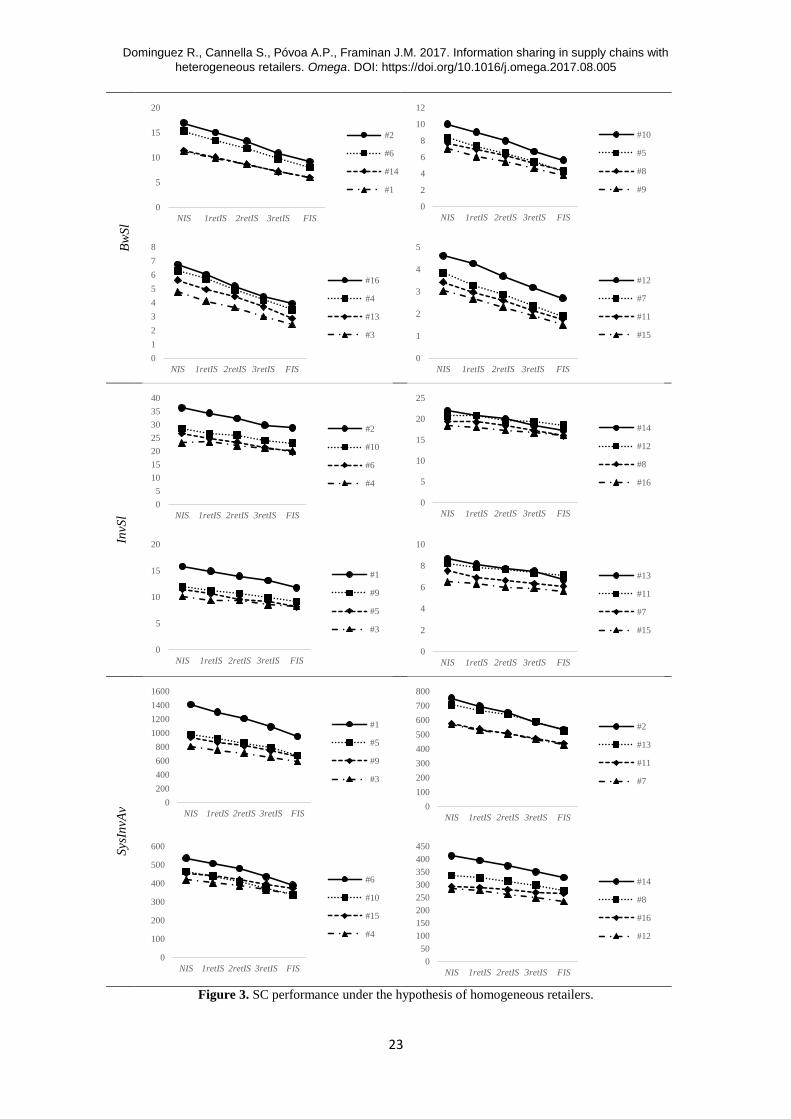
averaged over the 20 replications, and results are plotted in Figure 3. For clarity, results
obtained for each performance metric are divided in 4 plots. Also, they are displayed
from the highest value of the metric to the lowest value of the metric.
Table 4. Retailers’ operational configurations.
H= OFH
L= OFL #1 #2 #3 #4 #5 #6 #7 #8 #9 #10 #11 #12 #13 #14 #15 #16
𝜇𝐿𝑖𝑗 H H H H H H H H L L L L L L L L
IPij H H H H L L L L H H H H L L L L
𝜏𝑖𝑗 H H L L H H L L H H L L H H L L
𝜎𝐷𝐶𝑗
2 H L H L H L H L H L H L H L H L
Due to the use of system’s metrics, the results obtained over the 20 replications are very
close to the average with very low variances. To ensure the significance of results
obtained we performed an ANOVA for each metric and each retailers’ operational
configuration. All tests were significant at the 95% confidence level.
Dominguez R., Cannella S., Póvoa A.P., Framinan J.M. 2017. Information sharing in supply chains with
heterogeneous retailers. Omega. DOI: https://doi.org/10.1016/j.omega.2017.08.005
23
Bw
Sl
InvS
l
Sys
InvA
v
Figure 3. SC performance under the hypothesis of homogeneous retailers.
0
5
10
15
20
NIS 1retIS 2retIS 3retIS FIS
#2
#6
#14
#1
0
2
4
6
8
10
12
NIS 1retIS 2retIS 3retIS FIS
#10
#5
#8
#9
0
1
2
3
4
5
6
7
8
NIS 1retIS 2retIS 3retIS FIS
#16
#4
#13
#3
0
1
2
3
4
5
NIS 1retIS 2retIS 3retIS FIS
#12
#7
#11
#15
0
5
10
15
20
25
30
35
40
NIS 1retIS 2retIS 3retIS FIS
#2
#10
#6
#4
0
5
10
15
20
25
NIS 1retIS 2retIS 3retIS FIS
#14
#12
#8
#16
0
5
10
15
20
NIS 1retIS 2retIS 3retIS FIS
#1
#9
#5
#3
0
2
4
6
8
10
NIS 1retIS 2retIS 3retIS FIS
#13
#11
#7
#15
0
200
400
600
800
1000
1200
1400
1600
NIS 1retIS 2retIS 3retIS FIS
#1
#5
#9
#3
0
100
200
300
400
500
600
700
800
NIS 1retIS 2retIS 3retIS FIS
#2
#13
#11
#7
0
100
200
300
400
500
600
NIS 1retIS 2retIS 3retIS FIS
#6
#10
#15
#4
0
50
100
150
200
250
300
350
400
450
NIS 1retIS 2retIS 3retIS FIS
#14
#8
#16
#12
Dominguez R., Cannella S., Póvoa A.P., Framinan J.M. 2017. Information sharing in supply chains with
heterogeneous retailers. Omega. DOI: https://doi.org/10.1016/j.omega.2017.08.005
24
Results show a quasi-linear performance improvement in BwSl from NIS to FIS, with all
curves yielding a coefficient of determination (R2) over 0.99. In fact, since retailers are
identical and transmit demand information, it is expected that the impact of IS on
reducing demand variability would be linear with the number of retailers. However,
curves related to the inventory metrics (InvSl and SysInvAv) are not strictly linear, with
67% of all curves yielding a coefficient of determination over 99%, and the rest of the
curves showing small deviations from linearity, with 0.90< R2<0.99. This result
suggests that the impact of transmitting demand information on inventory performance
improvement is linear with the number of retailers in most cases, but it may present
some non-linearity.
Performance curves show different slopes depending on retailers’ operational
configurations. Thus, benefits of incorporating a retailer to IS may depend on current
retailers’ operational configuration. In order to appreciate this phenomenon, we
compute the percentage of performance improvement for each metric from NIS to 2retIS
and from NIS to FIS for each of the 16 retailers’ operational configurations and plot the
results in Figure 4. A generic formulation of this measure is shown in Equation (15),
where ‘metric’ can be either BwSl, InvSl or SysInvAv, and A,B represent any of the IS
structures.
∆𝑚𝑒𝑡𝑟𝑖𝑐𝐴→𝐵(%) =(𝑚𝑒𝑡𝑟𝑖𝑐𝐴 − 𝑚𝑒𝑡𝑟𝑖𝑐𝐵)
𝑚𝑒𝑡𝑟𝑖𝑐𝐴∗ 100
(15)
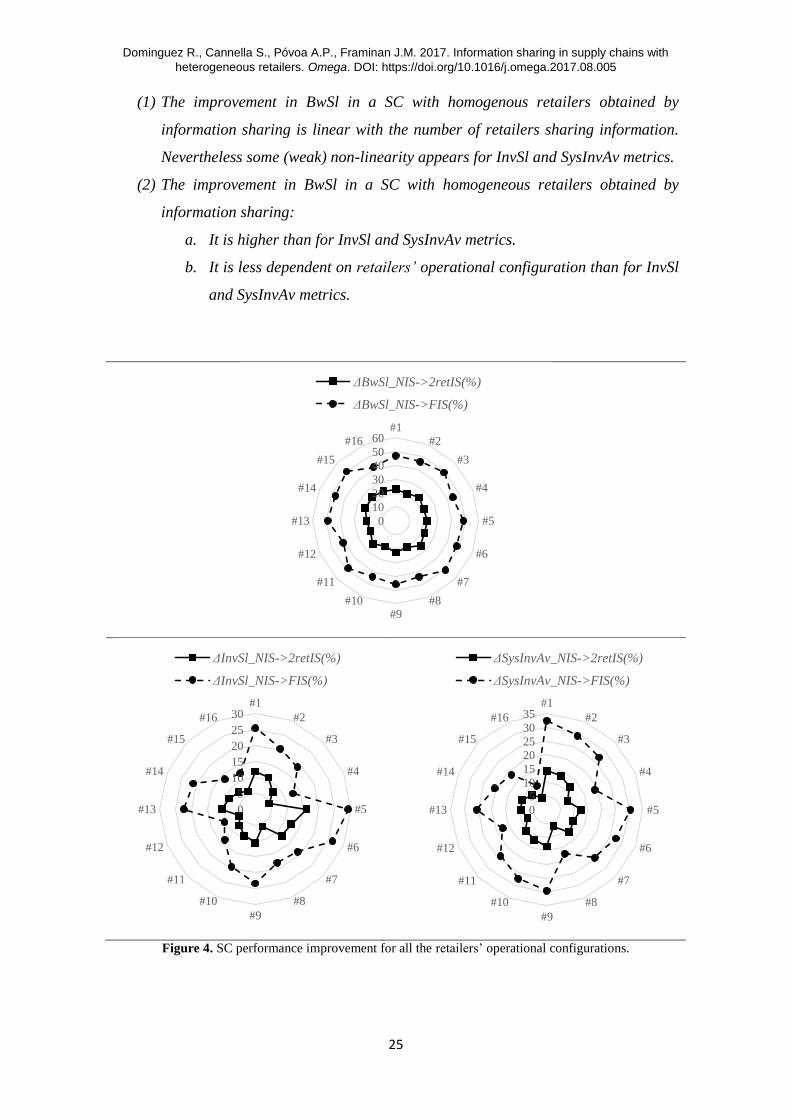
From Figure 4 it can be seen that the benefits obtained in terms of BwSl reduction are
less dependent on retailers’ operational configuration than those related to InvSl and
SysInvAv. In fact, performance improvement in terms of BwSl is very similar for all
scenarios. This result indicates that the expected bullwhip reduction from adding
retailers to IS weakly depends on retailers’ operation. Nevertheless, the performance
improvement related to InvSl and SysInvAv show a stronger dependence on retailers’
operational configuration. Additionally, BwSl reduction is higher than InvSl and
SysInvAv reductions: there is an average BwSl reduction of around 20%-25% for 2retIS
and around 40%-50% for FIS, while average InvSl and SysInvAv reductions are around
5%-16% for 2retIS and 10%-32% for FIS.
We can summarize the above findings as follows:
Dominguez R., Cannella S., Póvoa A.P., Framinan J.M. 2017. Information sharing in supply chains with
heterogeneous retailers. Omega. DOI: https://doi.org/10.1016/j.omega.2017.08.005
25
(1) The improvement in BwSl in a SC with homogenous retailers obtained by
information sharing is linear with the number of retailers sharing information.
Nevertheless some (weak) non-linearity appears for InvSl and SysInvAv metrics.
(2) The improvement in BwSl in a SC with homogeneous retailers obtained by
information sharing:
a. It is higher than for InvSl and SysInvAv metrics.
b. It is less dependent on retailers’ operational configuration than for InvSl
and SysInvAv metrics.
Figure 4. SC performance improvement for all the retailers’ operational configurations.
0
10
20
30
40
50
60#1
#2
#3
#4
#5
#6
#7
#8#9
#10
#11
#12
#13
#14
#15
#16
ΔBwSl_NIS->2retIS(%)
ΔBwSl_NIS->FIS(%)
0
5
10
15
20
25
30#1
#2
#3
#4
#5
#6
#7
#8
#9
#10
#11
#12
#13
#14
#15
#16
ΔInvSl_NIS->2retIS(%)
ΔInvSl_NIS->FIS(%)
0
5
10
15
20
25
30
35#1
#2
#3
#4
#5
#6
#7
#8
#9
#10
#11
#12
#13
#14
#15
#16
ΔSysInvAv_NIS->2retIS(%)
ΔSysInvAv_NIS->FIS(%)
Dominguez R., Cannella S., Póvoa A.P., Framinan J.M. 2017. Information sharing in supply chains with
heterogeneous retailers. Omega. DOI: https://doi.org/10.1016/j.omega.2017.08.005
26
4.2 Heterogeneous retailers
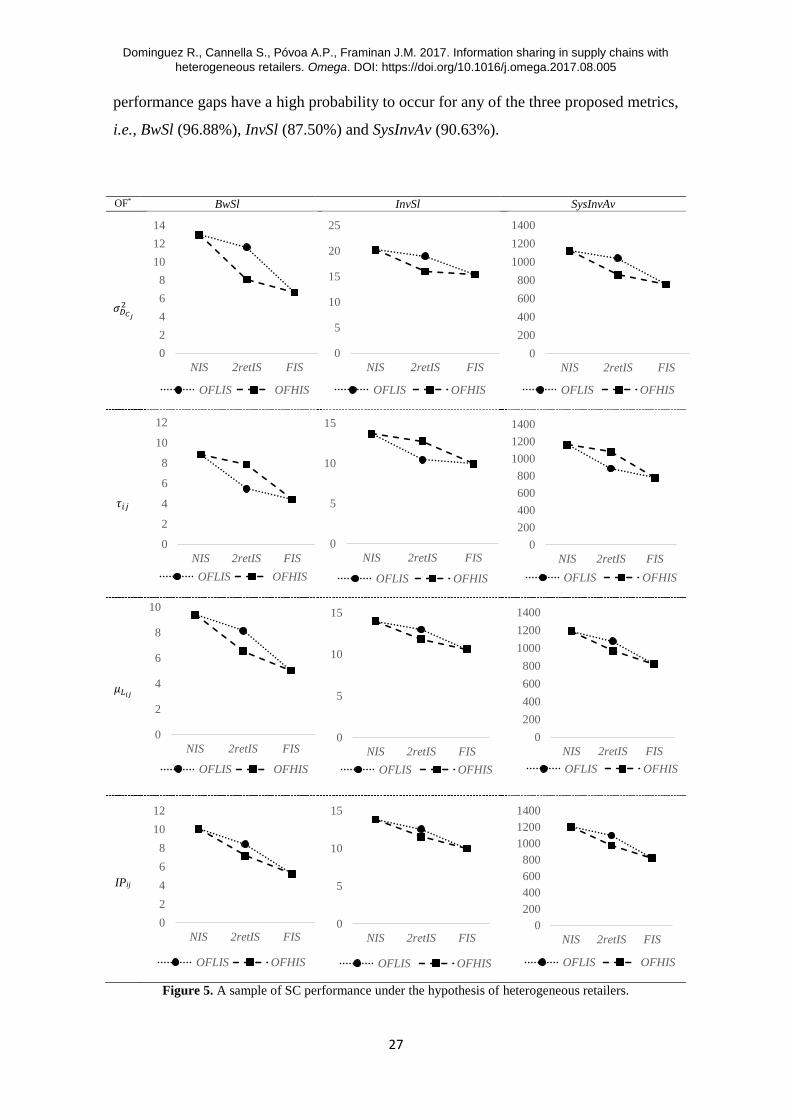
Herein we present the results obtained under the hypothesis of heterogeneous retailers.
Due to the large amount of data obtained, we just present a sample case in Figure 5.
More specifically, for each OF=OF*, we select one of the 8 retailers’ operational
configurations (see DoE, Table 3) and present the results for the three metrics. For each
metric, results obtained for NIS, OFLIS, OFHIS and FIS are averaged over the 20
replications. Since there are two intermediate possibilities to go from NIS to FIS (either
through OFLIS or OFHIS), both curves are plotted in Figure 5.
As seen in Figure 5, the performance improvement obtained from the addition of new
retailers to IS is not linear for all four OFs under consideration and for all metrics. In
fact, the slopes of the curves depend on which retailers are sharing information (either
in the OFLIS or in the OFHIS structure). As a consequence, for any given OF=OF* it
can be observed a performance gap between the OFLIS and the OFHIS structures, so it
can be concluded that the performance improvement structure depends on retailers’
operational configuration.
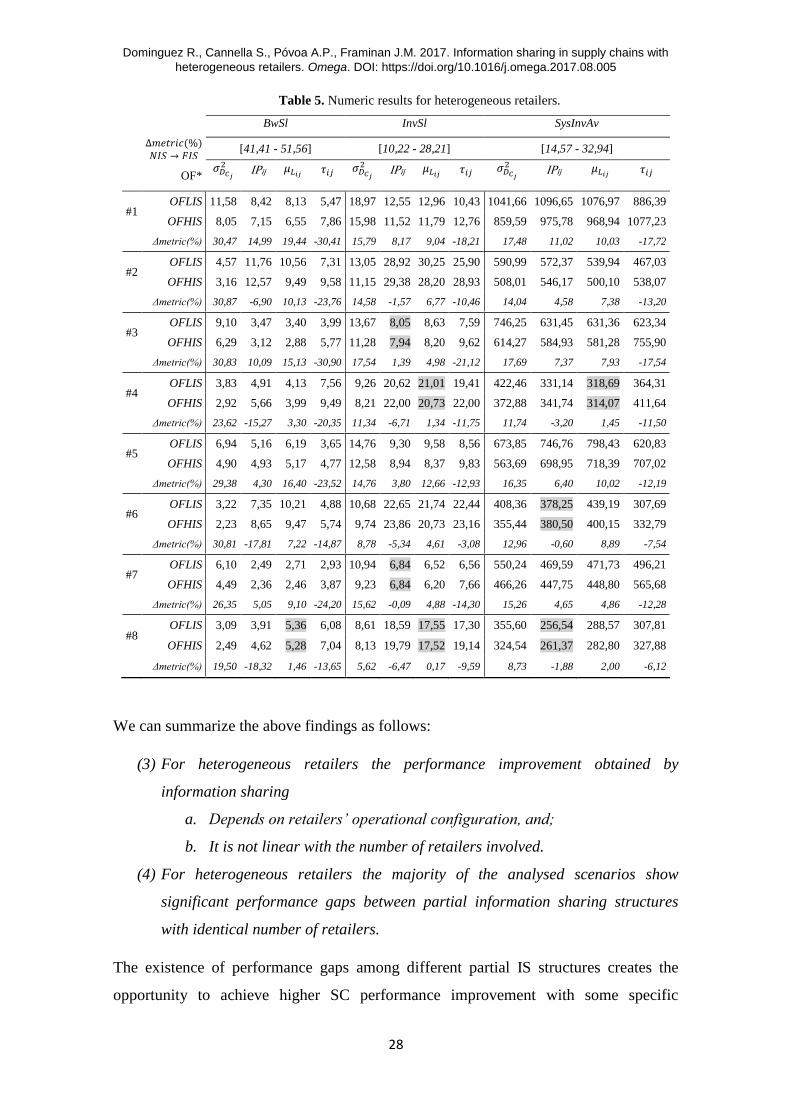
In order to assess how OFs impact the observed performance gaps between OFLIS and
OFHIS, we consider the results obtained from the full set of experiments (allowing for
the 8 different retailers’ operational configurations for each OF=OF*). Numerical
results are shown in Table 5 (results are averaged across the 20 simulations). The first
row shows a range of performance improvement values in percentage that can be
achieved under a FIS structure for each metric (∆𝑚𝑒𝑡𝑟𝑖𝑐𝑁𝐼𝑆→𝐹𝐼𝑆(%)). It can be noticed
that these values are similar to those obtained assuming homogeneous retailers. Then,
for each metric, a given column of Table 5 shows the results obtained for the 8 retailers’
operational configurations (labelled from #1 to #8) when the OF indicated in the second
row is the OF*. For each retailer operational configuration, the absolute values for
OFLIS and OFHIS are provided (values for NIS and FIS are omitted to make the results
clearer).
We use ANOVA to statistically assess the significance of the performance gaps
observed between OFLIS and OFHIS (see Table 5, where scenarios with non-significant
performance gap with a 95% confidence level are shaded in grey). These results indicate
that, when retailers with different operational configurations are involved in IS,
Dominguez R., Cannella S., Póvoa A.P., Framinan J.M. 2017. Information sharing in supply chains with
heterogeneous retailers. Omega. DOI: https://doi.org/10.1016/j.omega.2017.08.005
27
performance gaps have a high probability to occur for any of the three proposed metrics,
i.e., BwSl (96.88%), InvSl (87.50%) and SysInvAv (90.63%).
OF* BwSl InvSl SysInvAv
𝜎𝐷𝐶𝑗
2
𝜏𝑖𝑗
𝜇𝐿𝑖𝑗
IPij
Figure 5. A sample of SC performance under the hypothesis of heterogeneous retailers.
0
2
4
6
8
10
12
14
NIS 2retIS FIS
OFLIS OFHIS
0
5
10
15
20
25
NIS 2retIS FIS
OFLIS OFHIS
0
200
400
600
800
1000
1200
1400
NIS 2retIS FIS
OFLIS OFHIS
0
2
4
6
8
10
12
NIS 2retIS FIS
OFLIS OFHIS
0
5
10
15
NIS 2retIS FIS
OFLIS OFHIS
0
200
400
600
800
1000
1200
1400
NIS 2retIS FIS
OFLIS OFHIS
0
2
4
6
8
10
NIS 2retIS FIS
OFLIS OFHIS
0
5
10
15
NIS 2retIS FIS
OFLIS OFHIS
0
200
400
600
800
1000
1200
1400
NIS 2retIS FIS
OFLIS OFHIS
0
2
4
6
8
10
12
NIS 2retIS FIS
OFLIS OFHIS
0
5
10
15
NIS 2retIS FIS
OFLIS OFHIS
0
200
400
600
800
1000
1200
1400
NIS 2retIS FIS
OFLIS OFHIS
Dominguez R., Cannella S., Póvoa A.P., Framinan J.M. 2017. Information sharing in supply chains with
heterogeneous retailers. Omega. DOI: https://doi.org/10.1016/j.omega.2017.08.005
28
Table 5. Numeric results for heterogeneous retailers.
BwSl InvSl SysInvAv
∆𝑚𝑒𝑡𝑟𝑖𝑐(%)𝑁𝐼𝑆 → 𝐹𝐼𝑆
[41,41 - 51,56] [10,22 - 28,21] [14,57 - 32,94]
OF*
𝜎𝐷𝐶𝑗
2 IPij 𝜇𝐿𝑖𝑗 𝜏𝑖𝑗 𝜎𝐷𝐶𝑗
2 IPij 𝜇𝐿𝑖𝑗 𝜏𝑖𝑗 𝜎𝐷𝐶𝑗
2 IPij 𝜇𝐿𝑖𝑗 𝜏𝑖𝑗
#1 OFLIS 11,58 8,42 8,13 5,47 18,97 12,55 12,96 10,43 1041,66 1096,65 1076,97 886,39
OFHIS 8,05 7,15 6,55 7,86 15,98 11,52 11,79 12,76 859,59 975,78 968,94 1077,23
Δmetric(%) 30,47 14,99 19,44 -30,41 15,79 8,17 9,04 -18,21 17,48 11,02 10,03 -17,72
#2 OFLIS 4,57 11,76 10,56 7,31 13,05 28,92 30,25 25,90 590,99 572,37 539,94 467,03
OFHIS 3,16 12,57 9,49 9,58 11,15 29,38 28,20 28,93 508,01 546,17 500,10 538,07
Δmetric(%) 30,87 -6,90 10,13 -23,76 14,58 -1,57 6,77 -10,46 14,04 4,58 7,38 -13,20
#3 OFLIS 9,10 3,47 3,40 3,99 13,67 8,05 8,63 7,59 746,25 631,45 631,36 623,34
OFHIS 6,29 3,12 2,88 5,77 11,28 7,94 8,20 9,62 614,27 584,93 581,28 755,90
Δmetric(%) 30,83 10,09 15,13 -30,90 17,54 1,39 4,98 -21,12 17,69 7,37 7,93 -17,54
#4 OFLIS 3,83 4,91 4,13 7,56 9,26 20,62 21,01 19,41 422,46 331,14 318,69 364,31
OFHIS 2,92 5,66 3,99 9,49 8,21 22,00 20,73 22,00 372,88 341,74 314,07 411,64
Δmetric(%) 23,62 -15,27 3,30 -20,35 11,34 -6,71 1,34 -11,75 11,74 -3,20 1,45 -11,50
#5 OFLIS 6,94 5,16 6,19 3,65 14,76 9,30 9,58 8,56 673,85 746,76 798,43 620,83
OFHIS 4,90 4,93 5,17 4,77 12,58 8,94 8,37 9,83 563,69 698,95 718,39 707,02
Δmetric(%) 29,38 4,30 16,40 -23,52 14,76 3,80 12,66 -12,93 16,35 6,40 10,02 -12,19
#6 OFLIS 3,22 7,35 10,21 4,88 10,68 22,65 21,74 22,44 408,36 378,25 439,19 307,69
OFHIS 2,23 8,65 9,47 5,74 9,74 23,86 20,73 23,16 355,44 380,50 400,15 332,79
Δmetric(%) 30,81 -17,81 7,22 -14,87 8,78 -5,34 4,61 -3,08 12,96 -0,60 8,89 -7,54
#7 OFLIS 6,10 2,49 2,71 2,93 10,94 6,84 6,52 6,56 550,24 469,59 471,73 496,21
OFHIS 4,49 2,36 2,46 3,87 9,23 6,84 6,20 7,66 466,26 447,75 448,80 565,68
Δmetric(%) 26,35 5,05 9,10 -24,20 15,62 -0,09 4,88 -14,30 15,26 4,65 4,86 -12,28
#8 OFLIS 3,09 3,91 5,36 6,08 8,61 18,59 17,55 17,30 355,60 256,54 288,57 307,81
OFHIS 2,49 4,62 5,28 7,04 8,13 19,79 17,52 19,14 324,54 261,37 282,80 327,88
Δmetric(%) 19,50 -18,32 1,46 -13,65 5,62 -6,47 0,17 -9,59 8,73 -1,88 2,00 -6,12
We can summarize the above findings as follows:
(3) For heterogeneous retailers the performance improvement obtained by
information sharing
a. Depends on retailers’ operational configuration, and;
b. It is not linear with the number of retailers involved.
(4) For heterogeneous retailers the majority of the analysed scenarios show
significant performance gaps between partial information sharing structures
with identical number of retailers.
The existence of performance gaps among different partial IS structures creates the
opportunity to achieve higher SC performance improvement with some specific

Dominguez R., Cannella S., Póvoa A.P., Framinan J.M. 2017. Information sharing in supply chains with
heterogeneous retailers. Omega. DOI: https://doi.org/10.1016/j.omega.2017.08.005
29
structures (see Section 5 for a detailed discussion). Hence, we focus our analysis on the
performance gaps. To do so, we measure the percentage of performance variation
between OFLIS and OFHIS using OFLIS as reference, i.e., ∆𝑚𝑒𝑡𝑟𝑖𝑐𝑂𝐹𝐿𝐼𝑆→𝑂𝐹𝐻𝐼𝑆(%).
Results are shown in Table 5 under the label Δmetric(%).
For a given OF=OF*, the sign of Δmetric(%) indicates which IS structure (either OFLIS
or OFHIS structure) provides the best performance. For OF*=𝜎𝐷𝐶𝑗
2 and OF*=𝜇𝐿𝑖𝑗 the
sign of Δmetric(%) is always positive, thus indicating that the OFHIS structure (i.e.
involving retailers with higher value of 𝜎𝐷𝐶𝑗
2 or 𝜇𝐿𝑖𝑗) is more favourable. On the
contrary, for OF*= 𝜏𝑖𝑗 the sign of Δmetric(%) is always negative, indicating that the
OFLIS structure (i.e., involving retailers with lower value of 𝜏𝑖𝑗) is more favourable.
Finally, for OF*=IPij there is not a dominant sign of Δmetric(%), since it can be positive
or negative depending on retailers’ operational configuration. Therefore, it is not clear
which level of IPij is more favourable.
In order to assess how each OF=OF* may impact on Δmetric(%), we also compute
related statistical data (i.e., average, standard deviation, and coefficient of variation
(c.v.)) for each metric over the 8 retailers’ operational configurations (see Table 6). The
absolute average of Δmetric(%) measures the overall performance gap found between
OFLIS and OFHIS for a given OF=OF*, indicating the relevance of such factor on
producing a significant gap. The relative variability (c.v.) of Δmetric(%) measures how
reliable is the obtained average (or how the obtained performance gaps depends on
retailers’ operational configuration). Using these statistics we can infer on which OFs
are more decisive to create performance gaps.
From the results, it can be seen that OF*=𝜎𝐷𝐶𝑗
2 and OF*=𝜏𝑖𝑗 provide the highest
(absolute) average Δmetric(%) for all the three metrics with a low dependence of
retailers’ operational configuration. The next factor in importance is OF*=𝜇𝐿𝑖𝑗, with
lower average and higher dependence of retailers’ operational configuration. Finally,
OF*= IPij obtains an average close to zero and very high c.v., thus indicating that
performance gaps are highly dependent on retailers’ operational configuration, and the
value of Δmetric(%) alternates between positive and negative. Also, it can be noticed
that Δmetric(%) obtained for BwSl are more important than those obtained for InvSl or
SysInvAv.
Dominguez R., Cannella S., Póvoa A.P., Framinan J.M. 2017. Information sharing in supply chains with
heterogeneous retailers. Omega. DOI: https://doi.org/10.1016/j.omega.2017.08.005
30
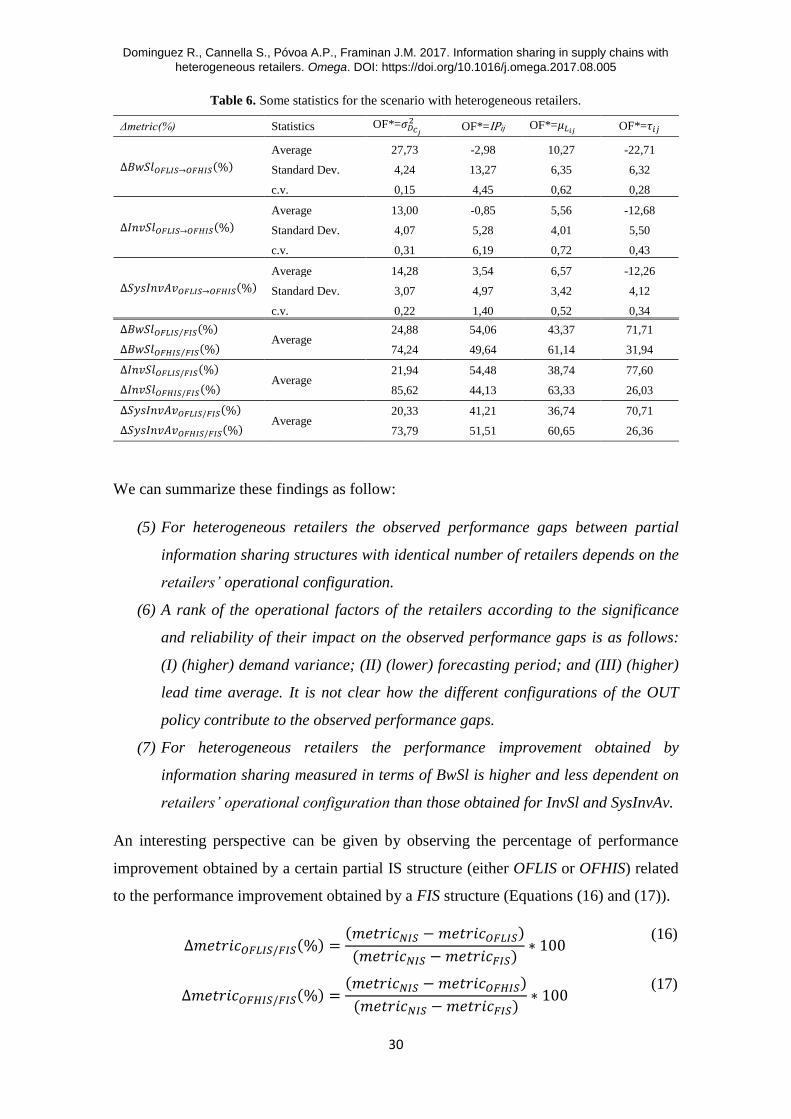
Table 6. Some statistics for the scenario with heterogeneous retailers.
Δmetric(%) Statistics OF*=𝜎𝐷𝐶𝑗
2 OF*=IPij OF*=𝜇𝐿𝑖𝑗 OF*=𝜏𝑖𝑗
∆𝐵𝑤𝑆𝑙𝑂𝐹𝐿𝐼𝑆→𝑂𝐹𝐻𝐼𝑆(%)
Average 27,73 -2,98 10,27 -22,71
Standard Dev. 4,24 13,27 6,35 6,32
c.v. 0,15 4,45 0,62 0,28
∆𝐼𝑛𝑣𝑆𝑙𝑂𝐹𝐿𝐼𝑆→𝑂𝐹𝐻𝐼𝑆(%)
Average 13,00 -0,85 5,56 -12,68
Standard Dev. 4,07 5,28 4,01 5,50
c.v. 0,31 6,19 0,72 0,43
∆𝑆𝑦𝑠𝐼𝑛𝑣𝐴𝑣𝑂𝐹𝐿𝐼𝑆→𝑂𝐹𝐻𝐼𝑆(%)
Average 14,28 3,54 6,57 -12,26
Standard Dev. 3,07 4,97 3,42 4,12
c.v. 0,22 1,40 0,52 0,34
∆𝐵𝑤𝑆𝑙𝑂𝐹𝐿𝐼𝑆 𝐹𝐼𝑆⁄ (%) Average
24,88 54,06 43,37 71,71
∆𝐵𝑤𝑆𝑙𝑂𝐹𝐻𝐼𝑆 𝐹𝐼𝑆⁄ (%) 74,24 49,64 61,14 31,94
∆𝐼𝑛𝑣𝑆𝑙𝑂𝐹𝐿𝐼𝑆/𝐹𝐼𝑆(%) Average
21,94 54,48 38,74 77,60
∆𝐼𝑛𝑣𝑆𝑙𝑂𝐹𝐻𝐼𝑆/𝐹𝐼𝑆(%) 85,62 44,13 63,33 26,03
∆𝑆𝑦𝑠𝐼𝑛𝑣𝐴𝑣𝑂𝐹𝐿𝐼𝑆/𝐹𝐼𝑆(%) Average
20,33 41,21 36,74 70,71
∆𝑆𝑦𝑠𝐼𝑛𝑣𝐴𝑣𝑂𝐹𝐻𝐼𝑆/𝐹𝐼𝑆(%) 73,79 51,51 60,65 26,36
We can summarize these findings as follow:
(5) For heterogeneous retailers the observed performance gaps between partial
information sharing structures with identical number of retailers depends on the
retailers’ operational configuration.
(6) A rank of the operational factors of the retailers according to the significance
and reliability of their impact on the observed performance gaps is as follows:
(I) (higher) demand variance; (II) (lower) forecasting period; and (III) (higher)
lead time average. It is not clear how the different configurations of the OUT
policy contribute to the observed performance gaps.
(7) For heterogeneous retailers the performance improvement obtained by
information sharing measured in terms of BwSl is higher and less dependent on
retailers’ operational configuration than those obtained for InvSl and SysInvAv.
An interesting perspective can be given by observing the percentage of performance
improvement obtained by a certain partial IS structure (either OFLIS or OFHIS) related
to the performance improvement obtained by a FIS structure (Equations (16) and (17)).
∆𝑚𝑒𝑡𝑟𝑖𝑐𝑂𝐹𝐿𝐼𝑆/𝐹𝐼𝑆(%) =(𝑚𝑒𝑡𝑟𝑖𝑐𝑁𝐼𝑆 − 𝑚𝑒𝑡𝑟𝑖𝑐𝑂𝐹𝐿𝐼𝑆)
(𝑚𝑒𝑡𝑟𝑖𝑐𝑁𝐼𝑆 − 𝑚𝑒𝑡𝑟𝑖𝑐𝐹𝐼𝑆)∗ 100
(16)
∆𝑚𝑒𝑡𝑟𝑖𝑐𝑂𝐹𝐻𝐼𝑆/𝐹𝐼𝑆(%) =(𝑚𝑒𝑡𝑟𝑖𝑐𝑁𝐼𝑆 − 𝑚𝑒𝑡𝑟𝑖𝑐𝑂𝐹𝐻𝐼𝑆)
(𝑚𝑒𝑡𝑟𝑖𝑐𝑁𝐼𝑆 − 𝑚𝑒𝑡𝑟𝑖𝑐𝐹𝐼𝑆)∗ 100
(17)
Dominguez R., Cannella S., Póvoa A.P., Framinan J.M. 2017. Information sharing in supply chains with
heterogeneous retailers. Omega. DOI: https://doi.org/10.1016/j.omega.2017.08.005
31
Values are shown in Table 6. We found significant differences between both IS
structures for some OFs. This means that a substantial part of the benefits obtained by a
FIS structure can be achieved by choosing one of the partial IS structures. Particularly it
can be seen involving 50% of the total number of retailers into IS yields around 70% of
the average performance improvement of a FIS for OF*=𝜎𝐷𝐶𝑗
2 and OF*=𝜏𝑖𝑗, and around
60% of a FIS for OF*=𝜇𝐿𝑖𝑗, for all retailers’ configurations and all the three metrics. On
the contrary, choosing the alternative partial IS structure may lead to obtain a poor
performance increase, as it can be seen in Table 6. Average values obtained for OF*=
IPij are close to 50% for the reasons discussed above. Also, it can be noticed that these
values are slightly higher for InvSl than for BwSl and SysInvAv.
We formalize this last finding as follows:
(8) A partial information sharing structure implemented according to the
recommendations of finding (6) is able to achieve a significant part of the
benefits provided by full information sharing. On the contrary, alternative
partial information sharing structures may lead to a poor performance increase
when compared to a full information sharing structure.
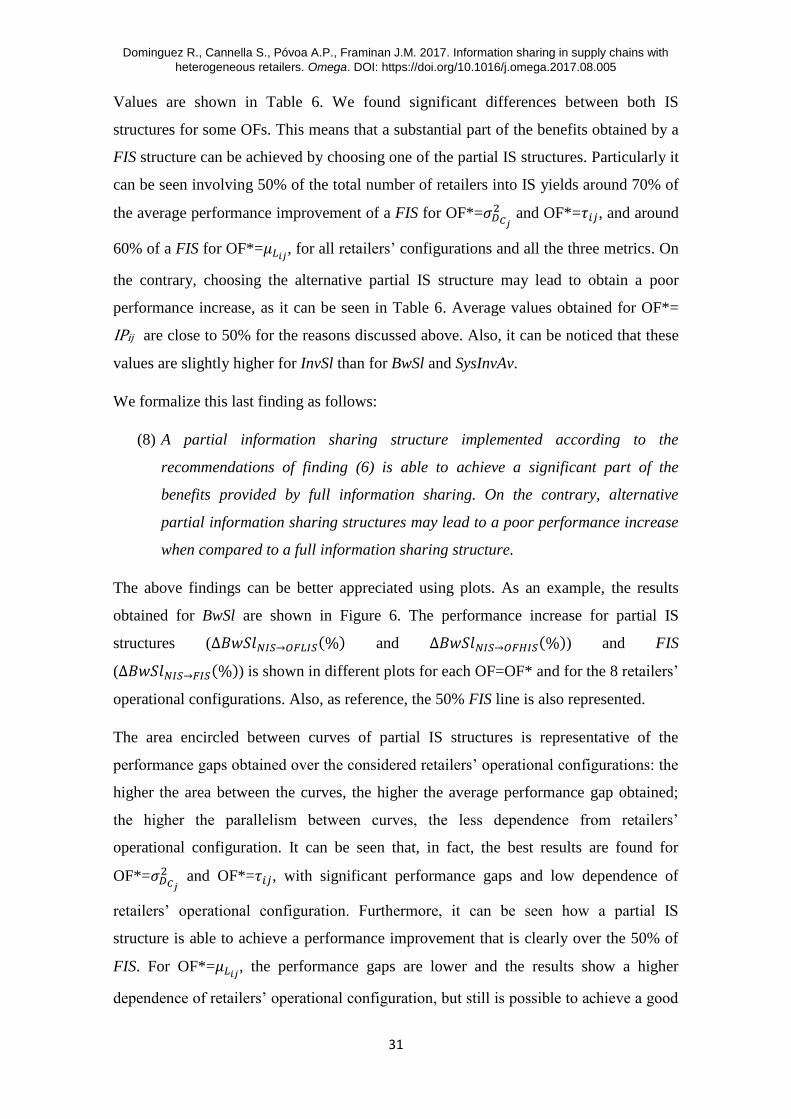
The above findings can be better appreciated using plots. As an example, the results
obtained for BwSl are shown in Figure 6. The performance increase for partial IS
structures (∆𝐵𝑤𝑆𝑙𝑁𝐼𝑆→𝑂𝐹𝐿𝐼𝑆(%) and ∆𝐵𝑤𝑆𝑙𝑁𝐼𝑆→𝑂𝐹𝐻𝐼𝑆(%)) and FIS
(∆𝐵𝑤𝑆𝑙𝑁𝐼𝑆→𝐹𝐼𝑆(%)) is shown in different plots for each OF=OF* and for the 8 retailers’
operational configurations. Also, as reference, the 50% FIS line is also represented.
The area encircled between curves of partial IS structures is representative of the
performance gaps obtained over the considered retailers’ operational configurations: the
higher the area between the curves, the higher the average performance gap obtained;
the higher the parallelism between curves, the less dependence from retailers’
operational configuration. It can be seen that, in fact, the best results are found for
OF*=𝜎𝐷𝐶𝑗
2 and OF*=𝜏𝑖𝑗, with significant performance gaps and low dependence of
retailers’ operational configuration. Furthermore, it can be seen how a partial IS
structure is able to achieve a performance improvement that is clearly over the 50% of
FIS. For OF*=𝜇𝐿𝑖𝑗, the performance gaps are lower and the results show a higher
dependence of retailers’ operational configuration, but still is possible to achieve a good
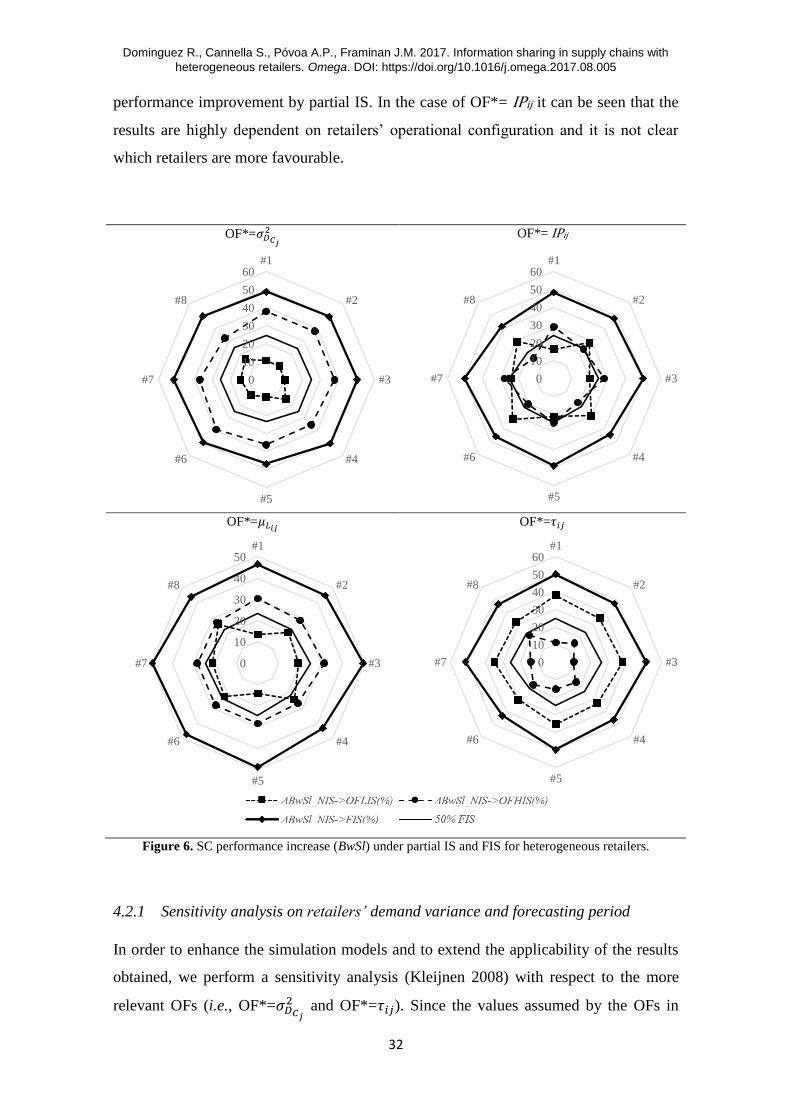
Dominguez R., Cannella S., Póvoa A.P., Framinan J.M. 2017. Information sharing in supply chains with
heterogeneous retailers. Omega. DOI: https://doi.org/10.1016/j.omega.2017.08.005
32
performance improvement by partial IS. In the case of OF*= IPij it can be seen that the
results are highly dependent on retailers’ operational configuration and it is not clear
which retailers are more favourable.
OF*=𝜎𝐷𝐶𝑗
2 OF*= IPij
OF*=𝜇𝐿𝑖𝑗
OF*=𝜏𝑖𝑗
Figure 6. SC performance increase (BwSl) under partial IS and FIS for heterogeneous retailers.
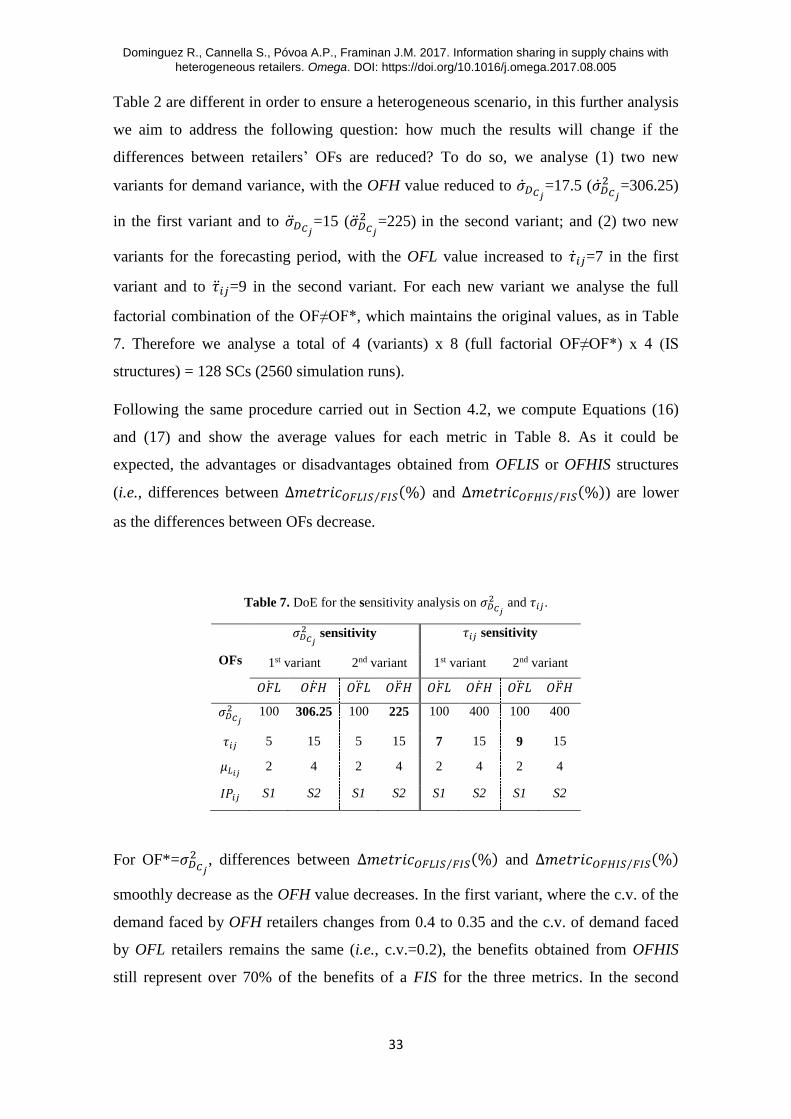
4.2.1 Sensitivity analysis on retailers’ demand variance and forecasting period
In order to enhance the simulation models and to extend the applicability of the results
obtained, we perform a sensitivity analysis (Kleijnen 2008) with respect to the more
relevant OFs (i.e., OF*=𝜎𝐷𝐶𝑗
2 and OF*=𝜏𝑖𝑗). Since the values assumed by the OFs in
0
10
20
30
40
50
60#1
#2
#3
#4
#5
#6
#7
#8
0
10
20
30
40
50
60#1
#2
#3
#4
#5
#6
#7
#8
0
10
20
30
40
50#1
#2
#3
#4
#5
#6
#7
#8
0
10
20
30
40
50
60#1
#2
#3
#4
#5
#6
#7
#8
Dominguez R., Cannella S., Póvoa A.P., Framinan J.M. 2017. Information sharing in supply chains with
heterogeneous retailers. Omega. DOI: https://doi.org/10.1016/j.omega.2017.08.005
33
Table 2 are different in order to ensure a heterogeneous scenario, in this further analysis
we aim to address the following question: how much the results will change if the
differences between retailers’ OFs are reduced? To do so, we analyse (1) two new
variants for demand variance, with the OFH value reduced to �̇�𝐷𝐶𝑗=17.5 (�̇�𝐷𝐶𝑗
2 =306.25)
in the first variant and to �̈�𝐷𝐶𝑗=15 (�̈�𝐷𝐶𝑗
2 =225) in the second variant; and (2) two new
variants for the forecasting period, with the OFL value increased to �̇�𝑖𝑗=7 in the first
variant and to �̈�𝑖𝑗=9 in the second variant. For each new variant we analyse the full
factorial combination of the OF≠OF*, which maintains the original values, as in Table
7. Therefore we analyse a total of 4 (variants) x 8 (full factorial OF≠OF*) x 4 (IS
structures) = 128 SCs (2560 simulation runs).
Following the same procedure carried out in Section 4.2, we compute Equations (16)
and (17) and show the average values for each metric in Table 8. As it could be
expected, the advantages or disadvantages obtained from OFLIS or OFHIS structures
(i.e., differences between ∆𝑚𝑒𝑡𝑟𝑖𝑐𝑂𝐹𝐿𝐼𝑆 𝐹𝐼𝑆⁄ (%) and ∆𝑚𝑒𝑡𝑟𝑖𝑐𝑂𝐹𝐻𝐼𝑆 𝐹𝐼𝑆⁄ (%)) are lower
as the differences between OFs decrease.
Table 7. DoE for the sensitivity analysis on 𝜎𝐷𝐶𝑗
2 and 𝜏𝑖𝑗.
OFs
𝜎𝐷𝐶𝑗
2 sensitivity 𝜏𝑖𝑗 sensitivity
1st variant 2nd variant 1st variant 2nd variant
𝑂𝐹𝐿̇ 𝑂𝐹𝐻̇ 𝑂𝐹𝐿̈ 𝑂𝐹𝐻̈ 𝑂𝐹𝐿̇ 𝑂𝐹𝐻̇ 𝑂𝐹𝐿̈ 𝑂𝐹𝐻̈
𝜎𝐷𝐶𝑗
2 100 306.25 100 225 100 400 100 400
𝜏𝑖𝑗 5 15 5 15 7 15 9 15
𝜇𝐿𝑖𝑗 2 4 2 4 2 4 2 4
𝐼𝑃𝑖𝑗 S1 S2 S1 S2 S1 S2 S1 S2
For OF*=𝜎𝐷𝐶𝑗
2 , differences between ∆𝑚𝑒𝑡𝑟𝑖𝑐𝑂𝐹𝐿𝐼𝑆 𝐹𝐼𝑆⁄ (%) and ∆𝑚𝑒𝑡𝑟𝑖𝑐𝑂𝐹𝐻𝐼𝑆 𝐹𝐼𝑆⁄ (%)
smoothly decrease as the OFH value decreases. In the first variant, where the c.v. of the
demand faced by OFH retailers changes from 0.4 to 0.35 and the c.v. of demand faced
by OFL retailers remains the same (i.e., c.v.=0.2), the benefits obtained from OFHIS
still represent over 70% of the benefits of a FIS for the three metrics. In the second
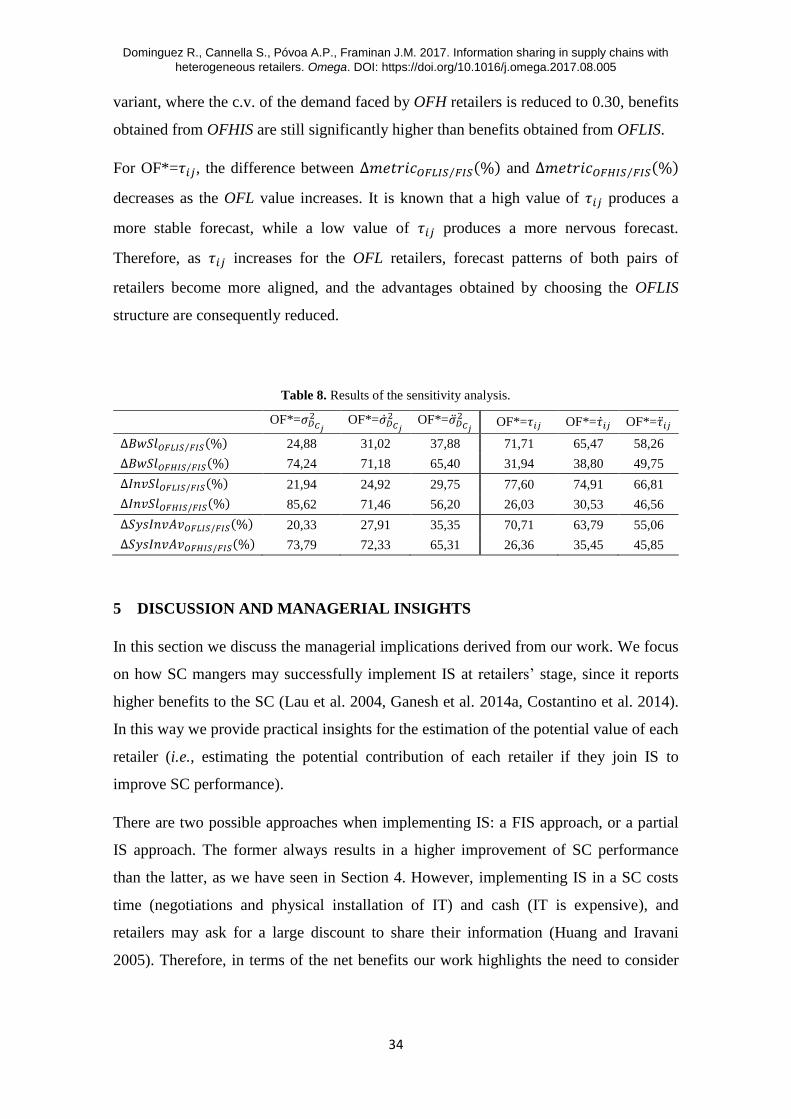
Dominguez R., Cannella S., Póvoa A.P., Framinan J.M. 2017. Information sharing in supply chains with
heterogeneous retailers. Omega. DOI: https://doi.org/10.1016/j.omega.2017.08.005
34
variant, where the c.v. of the demand faced by OFH retailers is reduced to 0.30, benefits
obtained from OFHIS are still significantly higher than benefits obtained from OFLIS.
For OF*=𝜏𝑖𝑗, the difference between ∆𝑚𝑒𝑡𝑟𝑖𝑐𝑂𝐹𝐿𝐼𝑆 𝐹𝐼𝑆⁄ (%) and ∆𝑚𝑒𝑡𝑟𝑖𝑐𝑂𝐹𝐻𝐼𝑆 𝐹𝐼𝑆⁄ (%)
decreases as the OFL value increases. It is known that a high value of 𝜏𝑖𝑗 produces a
more stable forecast, while a low value of 𝜏𝑖𝑗 produces a more nervous forecast.
Therefore, as 𝜏𝑖𝑗 increases for the OFL retailers, forecast patterns of both pairs of
retailers become more aligned, and the advantages obtained by choosing the OFLIS
structure are consequently reduced.
Table 8. Results of the sensitivity analysis.
OF*=𝜎𝐷𝐶𝑗
2 OF*=�̇�𝐷𝐶𝑗
2 OF*=�̈�𝐷𝐶𝑗
2 OF*=𝜏𝑖𝑗 OF*=�̇�𝑖𝑗 OF*=�̈�𝑖𝑗
∆𝐵𝑤𝑆𝑙𝑂𝐹𝐿𝐼𝑆 𝐹𝐼𝑆⁄ (%) 24,88 31,02 37,88 71,71 65,47 58,26
∆𝐵𝑤𝑆𝑙𝑂𝐹𝐻𝐼𝑆 𝐹𝐼𝑆⁄ (%) 74,24 71,18 65,40 31,94 38,80 49,75
∆𝐼𝑛𝑣𝑆𝑙𝑂𝐹𝐿𝐼𝑆/𝐹𝐼𝑆(%) 21,94 24,92 29,75 77,60 74,91 66,81
∆𝐼𝑛𝑣𝑆𝑙𝑂𝐹𝐻𝐼𝑆/𝐹𝐼𝑆(%) 85,62 71,46 56,20 26,03 30,53 46,56
∆𝑆𝑦𝑠𝐼𝑛𝑣𝐴𝑣𝑂𝐹𝐿𝐼𝑆/𝐹𝐼𝑆(%) 20,33 27,91 35,35 70,71 63,79 55,06
∆𝑆𝑦𝑠𝐼𝑛𝑣𝐴𝑣𝑂𝐹𝐻𝐼𝑆/𝐹𝐼𝑆(%) 73,79 72,33 65,31 26,36 35,45 45,85
5 DISCUSSION AND MANAGERIAL INSIGHTS
In this section we discuss the managerial implications derived from our work. We focus
on how SC mangers may successfully implement IS at retailers’ stage, since it reports
higher benefits to the SC (Lau et al. 2004, Ganesh et al. 2014a, Costantino et al. 2014).
In this way we provide practical insights for the estimation of the potential value of each
retailer (i.e., estimating the potential contribution of each retailer if they join IS to
improve SC performance).
There are two possible approaches when implementing IS: a FIS approach, or a partial
IS approach. The former always results in a higher improvement of SC performance
than the latter, as we have seen in Section 4. However, implementing IS in a SC costs
time (negotiations and physical installation of IT) and cash (IT is expensive), and
retailers may ask for a large discount to share their information (Huang and Iravani
2005). Therefore, in terms of the net benefits our work highlights the need to consider
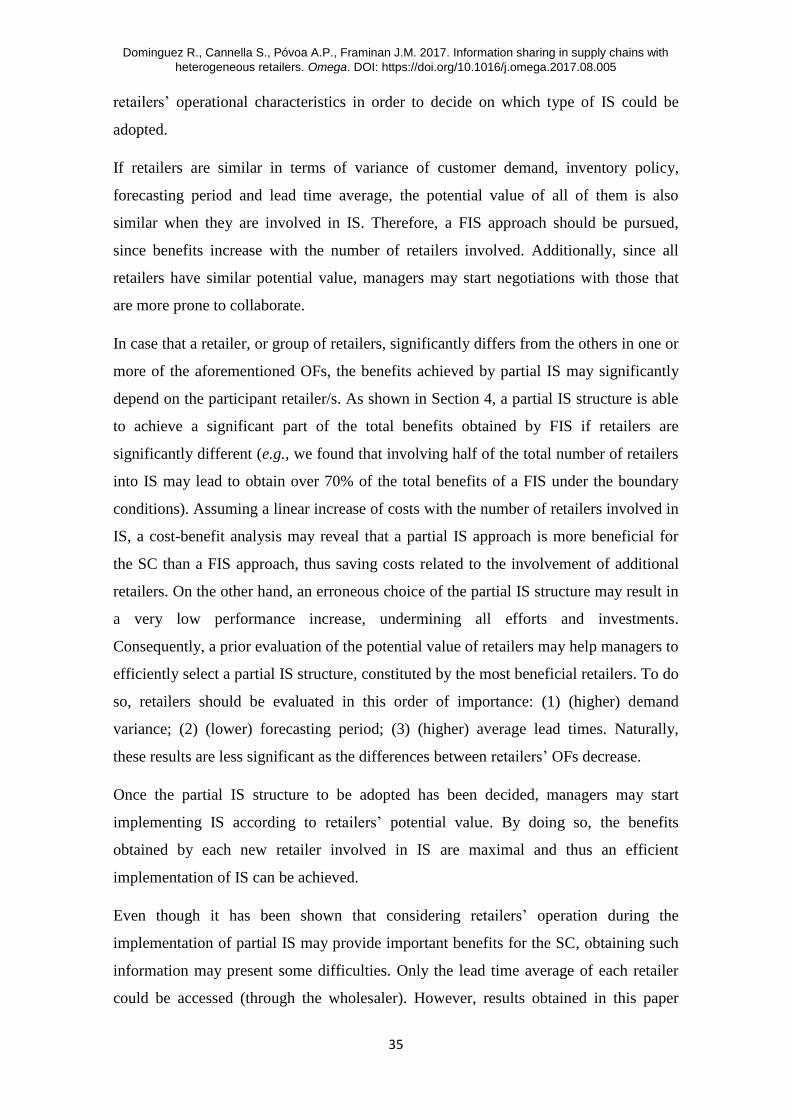
Dominguez R., Cannella S., Póvoa A.P., Framinan J.M. 2017. Information sharing in supply chains with
heterogeneous retailers. Omega. DOI: https://doi.org/10.1016/j.omega.2017.08.005
35
retailers’ operational characteristics in order to decide on which type of IS could be
adopted.
If retailers are similar in terms of variance of customer demand, inventory policy,
forecasting period and lead time average, the potential value of all of them is also
similar when they are involved in IS. Therefore, a FIS approach should be pursued,
since benefits increase with the number of retailers involved. Additionally, since all
retailers have similar potential value, managers may start negotiations with those that
are more prone to collaborate.
In case that a retailer, or group of retailers, significantly differs from the others in one or
more of the aforementioned OFs, the benefits achieved by partial IS may significantly
depend on the participant retailer/s. As shown in Section 4, a partial IS structure is able
to achieve a significant part of the total benefits obtained by FIS if retailers are
significantly different (e.g., we found that involving half of the total number of retailers
into IS may lead to obtain over 70% of the total benefits of a FIS under the boundary
conditions). Assuming a linear increase of costs with the number of retailers involved in
IS, a cost-benefit analysis may reveal that a partial IS approach is more beneficial for
the SC than a FIS approach, thus saving costs related to the involvement of additional
retailers. On the other hand, an erroneous choice of the partial IS structure may result in
a very low performance increase, undermining all efforts and investments.
Consequently, a prior evaluation of the potential value of retailers may help managers to
efficiently select a partial IS structure, constituted by the most beneficial retailers. To do
so, retailers should be evaluated in this order of importance: (1) (higher) demand
variance; (2) (lower) forecasting period; (3) (higher) average lead times. Naturally,
these results are less significant as the differences between retailers’ OFs decrease.
Once the partial IS structure to be adopted has been decided, managers may start
implementing IS according to retailers’ potential value. By doing so, the benefits
obtained by each new retailer involved in IS are maximal and thus an efficient
implementation of IS can be achieved.
Even though it has been shown that considering retailers’ operation during the
implementation of partial IS may provide important benefits for the SC, obtaining such
information may present some difficulties. Only the lead time average of each retailer
could be accessed (through the wholesaler). However, results obtained in this paper
Dominguez R., Cannella S., Póvoa A.P., Framinan J.M. 2017. Information sharing in supply chains with
heterogeneous retailers. Omega. DOI: https://doi.org/10.1016/j.omega.2017.08.005
36
show that retailers’ demand variance and retailers’ forecasting period are the most
significant OFs. Since these factors are retailers’ private information, a pre-
collaboration strategy to share these data needs to be developed with retailers prior to
the implementation of partial IS. In this case, SC managers should start by developing
channels of trust and/or revenue contracts.
To sum up, we suggest managers to implement partial IS at heterogeneous retailers
using the following steps:
1. Analyse retailers’ operational characteristics.
2. If they are significantly different in one or more OFs, estimate the potential
value of each retailers’ collaboration in IS and rank them accordingly.
3. Estimate costs of involving retailers into IS and perform a cost/benefit analysis.
4. Decide the best IS structure using results from 3) and proceed involving
retailers according to 2).
6 CONCLUSIONS AND FUTURE RESEARCH
This work presents an exploratory study on partial information sharing at retailers level,
i.e., some retailers may not participate in information sharing. We analyse the potential
contribution of the participation of each individual retailer in information sharing under
two different hypothesis: (1) retailers are homogeneous (i.e., they have identical
operational configuration), and (2) retailers are heterogeneous (i.e., they have different
operational configuration). Using a Multi-Agent Systems simulation approach, we
model a four echelon supply chain with four retailers, with stochastic demands and lead
times, using two common Order-Up-To inventory policies. Retailers’ operation is
characterized by four operational factors: demand variance, forecasting period, lead
time average, and inventory policy. We measure the supply chain performance using
systemic supply chain metrics: Bullwhip Slope, Inventory Slope and Systemic
Inventory Average. Supply chain performance is measured for different partial
information sharing structures and different retailers’ operational configurations.
The results of our study emphasize the need of individually estimating the potential
value of retailers’ information prior to the implementation of information sharing, and
provides the following insights:

Dominguez R., Cannella S., Póvoa A.P., Framinan J.M. 2017. Information sharing in supply chains with
heterogeneous retailers. Omega. DOI: https://doi.org/10.1016/j.omega.2017.08.005
37
- When retailers are homogeneous they have equal potential value if they are
involved in information sharing (i.e., they identically contribute to improve
supply chain performance). Thus, a full information sharing approach is
recommended.
- When retailers are heterogeneous they have different potential value if they are
involved in information sharing, depending on their operational configuration.
As a consequence
o The performance improvement achieved by different partial information
sharing structures with the same number of retailers might be
significantly different.
o A partial information sharing structure involving retailers with high
potential value may capture a substantial part of the benefits of full
information sharing.
o Assuming a linear increase of costs with the number of retailers involved
in information sharing, a cost-benefit analysis may reveal that a partial
information sharing approach is more beneficial for the supply chain
than a full information sharing approach, thus saving costs related to the
involvement of additional retailers.
- Retailers’ operation need to be carefully examined in order to develop an
efficient implementation of information sharing. In this order of importance,
retailers with (1) higher demand variance, (2) lower forecasting period, and (3)
higher average lead time, are potentially more beneficial partners for
implementing information sharing.
Due to the complex relationships between retailers’ operational factors and retailers’
potential value when become participants of information sharing, it was not possible to
come up with a single and precise rule for identifying the most beneficial information
sharing structure. In fact, properly balancing each operational factor is still an issue.
Nevertheless, the findings reported in this paper should help managers to better
understand the opportunities for partial information sharing and put them in a stronger
position in their negotiations about establishing information sharing links.
The present study has some limitations that may create room for improvement and
further research. Also, due to the exploratory nature of this work, there are many ways
of possible extensions:
Dominguez R., Cannella S., Póvoa A.P., Framinan J.M. 2017. Information sharing in supply chains with
heterogeneous retailers. Omega. DOI: https://doi.org/10.1016/j.omega.2017.08.005
38
- Deepening the analysis of each operational factor by increasing the number of
intermediate values, and considering other different set ups of supply chain (i.e.,
different demand or lead time distributions, different forecast methods, etc.)
would provide additional results that might be useful to precisely balance the
importance of each operational factor on a wide variety of conditions and to look
for a single rule for choosing the best information sharing structure.
- Analysing scenarios where retailers may differ in more than one factor at the
same time would provide more realistic results.
- This work analyses either homogeneous or heterogeneous retailers. The “grey
zone” that falls in the middle of both scenarios has been briefly analysed through
a sensitivity analysis. Determining the limits between both scenarios would be a
significant contribution in this line of research.
- A similar analysis to that conducted in this work on other operational factors
(e.g. lead time variance, forecast method, safety factor, etc.) would provide a
wider perspective of this problem to supply chain managers.
- Results of this work are scalable to higher or lower number of retailers.
However, it could be interesting to analyse how the upstream part of the supply
chain may impact on the results obtained. More specifically, it should be
addressed how the upstream supply chain structure and upstream member’s
operational configuration may impact on the implementation of information
sharing at retailers. Additionally, a similar research to that presented in this work
could be performed on the upstream echelons of the supply chain, in order to
come up with a more general overview on how to efficiently implement
information sharing in supply chain.
ACKNOWLEDGEMENTS
This research was supported by the Portuguese Foundation for Science and Technology
[Grant SFRH/BPD/108491/2015], by the Italian Ministry of Education, University and
Research (Rita Levi Montalcini fellow), and by the Spanish Ministry of Science and
Innovation, under the project PROMISE with reference DPI201680750P.
Dominguez R., Cannella S., Póvoa A.P., Framinan J.M. 2017. Information sharing in supply chains with
heterogeneous retailers. Omega. DOI: https://doi.org/10.1016/j.omega.2017.08.005
39
REFERENCES
Agrawal, S., Sengupta, R.N., Shanker, K. 2009. Impact of information sharing and lead time on bullwhip
effect and on-hand inventory. European Journal of Operational Research, 192(2), 576-593.
Ali, M. M., Babai, M. Z., Boylan, J. E., Syntetos, A. A. 2017. Supply chain forecasting when information
is not shared. European Journal of Operational Research, 260(3), 984–994.
Altomonte, C., Mauro, F. D., Ottaviano, G., Rungi, A., Vicard, V. 2012 Global value chains during the
great trade collapse: a bullwhip effect?. European Central Bank. Working Paper Series 1412.
Annarelli, A., Nonino, F. 2016. Strategic and operational management of organizational resilience:
Current state of research and future directions. Omega, 62, 1-18.
Bian, W., Shang, J., Zhang, J. 2016. Two-way information sharing under supply chain competition.
International Journal of Production Economics, 178, 82-94.
Bischak, D.P., Robb, D.J., Silver, E.A., Blackburn, J.D. 2014. Analysis and management of periodic
review, Order-Up-To level inventory systems with order crossover. Production and Operations
Management, 23 (5), 762-772.
Cachon, G.P., Olivares, M. 2010. Drivers of finished-goods inventory in the U.S. automobile industry.
Management Science, 56 (1), 202-216.
Cannella, S., Barbosa-Povoa, A.P., Framinan J.M., Relvas S. 2013. Metrics for bullwhip effect analysis.
Journal of the Operational Research Society, 64, 1-16.
Cannella, S., Ciancimino, E. 2010. On the bullwhip avoidance phase: supply chain collaboration and
order smoothing. International Journal of Production Research, 48 (22), 6739-6776.
Cannella, S., Dominguez, R., Framinan, J.M. 2017. Inventory record inaccuracy – The impact of
structural complexity and lead time variability. Omega, 68, 123-138.
Cannella, S., López-Campos, M., Dominguez, R., Ashayeri, J., Miranda, P.A. 2015. A simulation model
of a coordinated decentralized supply chain. International Transactions in Operational Research, 22
(4), 735-756.
Cardoso, S.R., Barbosa-Póvoa, A.P., Relvas, S., Novais, A.Q. 2015. Resilience metrics in the assessment
of complex supply-chains performance operating under demand uncertainty. Omega, 56, 53-73.
Chan, H.K., Chan, F.T.S. 2010. A Review of Coordination Studies in the Context of Supply Chain
Dynamics. International Journal of Production Research, 48 (10), 2793-2819.
Chase, R. B., Jacobs, F. R., Aquilano, N. J. 2004. Operations management for competitive advantage
(10th ed.). Boston, MA: Irwin/McGraw-Hill.
Chatfield, D. C., Harrison, T. P., Hayya, J. C. 2006. SISCO: An object-oriented supply chain simulation
system. Decision Support Systems, 42(1), 422-434.
Chatfield, D.C. 2013. Underestimating the bullwhip effect: A simulation study of the decomposability
assumption. International Journal of Production Research, 51 (1), 230-244.
Dominguez R., Cannella S., Póvoa A.P., Framinan J.M. 2017. Information sharing in supply chains with
heterogeneous retailers. Omega. DOI: https://doi.org/10.1016/j.omega.2017.08.005
40
Chatfield, D.C., Hayya, J.C., Cook, D.P. 2013. Stockout propagation and amplification in supply chain
inventory systems. International Journal of Production Research, 51 (5), 1491-1507.
Chatfield, D.C., Kim, J.G., Harrison, T.P., Hayya, J.C. 2004. The bullwhip effect - Impact of stochastic
lead time, information quality, and information sharing: A simulation study. Production and
Operations Management, 13 (4), 340-353.
Chatfield, D.C., Pritchard, A.M. 2013. Returns and the bullwhip effect. Transportation Research Part E:
Logistics and Transportation Review, 49 (1), 159-175.
Chen, F., Drezner, Z., Ryan, J.K., Simchi-Levi, D. 2000. Quantifying the bullwhip effect in a simple
supply chain: The impact of forecasting, lead times, and information. Management Science, 46 (3),
436-443.
Chen, L., Lee, H.L. 2009. Information sharing and order variability control under a generalized demand
model. Management Science, 55 (5), 781-798.
Choudhary, D., Shankar, R. 2015. The value of VMI beyond information sharing in a single supplier
multiple retailers supply chain under a non-stationary (Rn, Sn) policy. Omega, 51, 59-70.
Christopher, M., & Holweg, M. 2017. Supply Chain 2.0 revisited: a framework for managing volatility-
induced risk in the supply chain. International Journal of Physical Distribution & Logistics
Management, 47 (2), 2-17.
Costantino, F., Di Gravio, G., Shaban, A., Tronci, M. 2014. The impact of information sharing and
inventory control coordination on supply chain performances. Computers and Industrial Engineering,
76, 292-306.
Costantino, F., Di Gravio, G., Shaban, A., Tronci, M. 2015. The impact of information sharing on
ordering policies to improve supply chain performances. Computers & Industrial Engineering, 82,
127-142.
Croson, R., Donohue, K., Katok, E., Sterman, J. 2014. Order stability in supply chains: coordination risk
and the role of coordination stock. Production and Operations Management, 23 (2), 176-196.
Datta, P. P., Christopher, M. G. 2011. Information sharing and coordination mechanisms for managing
uncertainty in supply chains: a simulation study. International Journal of Production Research, 49(3),
765-803.
Dejonckheere, J., Disney, S. M., Lambrecht, M. R., Towill, D. R. 2004. The impact of information
enrichment on the Bullwhip effect in supply chains: A control engineering perspective. European
Journal of Operational Research, 153 (3), 727-750.
Disney, S.M., Lambrecht, M.R. 2008. On replenishment rules, forecasting, and the bullwhip effect in
supply chains. Foundations and Trends in Technology, Information and Operations Management, 2
(1), 1–80.
Disney, S.M., Maltz, A., Wang, X., Warburton, R.D.H. 2016. Inventory management for stochastic lead
times with order crossovers, European Journal of Operational Research, 248, 473-486.
Dominguez R., Cannella S., Póvoa A.P., Framinan J.M. 2017. Information sharing in supply chains with
heterogeneous retailers. Omega. DOI: https://doi.org/10.1016/j.omega.2017.08.005
41
Disney, S.M., Towill, D.R. 2003. On the bullwhip and inventory variance produced by an ordering
policy. Omega – The International Journal of Management Science, 31 (3), 157-167.
Dominguez, R., Cannella, S., Framinan, J.M. 2014. On bullwhip-limiting strategies in divergent supply
chain networks. Computers and Industrial Engineering, 73 (1), 85-95.
Dominguez, R., Cannella, S., Framinan, J.M. 2015a. The impact of the supply chain structure on bullwhip
effect. Applied Mathematical Modelling, 39 (23-24), 7309-7325.
Dominguez, R., Cannella, S., Framinan, J.M. 2015b. On returns and network configuration in supply
chain dynamics. Transportation Research Part E: Logistics and Transportation Review, 73, 152-167.
Dominguez, R., Framinan, J.M. 2013. A decisión management tool: modelling the order fulfilment
process by multi-agent systems. International Journal of Management and Decision Making, 12 (3),
240-258.
Duan, Y., Yao, Y., Huo, J. 2015. Bullwhip effect under substitute products. Journal of Operations
Management, 36, 75-89.
Duong, L.N., Wood, L.C., Wang, W.Y. 2015. A multi-criteria inventory management system for
perishable & substitutable products. Procedia Manufacturing, 2, 66-76.
Evers, P. T., & Wan, X. 2012. Systems analysis using simulation. Journal of Business Logistics, 33(2),
80-89.
Fawcett, S.E., Wallin, C., Allred, C., Fawcett, A.M., Magnan, G.M. 2011. Information technology as an
enabler of supply chain collaboration: A dynamic-capabilities perspective. Journal of Supply Chain
Management, 47 (1), 38-59.
Ganesh, M., Raghunathan, S., Rajendran, C. 2014a. Distribution and equitable sharing of value from
information sharing within serial supply chains. IEEE Transactions on Engineering Management, 61
(2), 6573365, 225-236.
Ganesh, M., Raghunathan, S., Rajendran, C. 2014b. The value of information sharing in a multi-product,
multi-level supply chain: Impact of product substitution, demand correlation, and partial information
sharing. Decision Support Systems, 58 (1), 79-94.
Geunes, J., Romeijn, H.E., Van Den Heuvel, W. 2016. Improving the efficiency of decentralized supply
chains with fixed ordering costs. European Journal of Operational Research, 252 (3), 815-828.
GMA - Grocery Manufacturers Association. 2009. Retail-direct data report. Report, GMA, Washington,
DC, http://www.gmaonline .org/downloads/research-and-reports/WP-Retailer-DDR09-6.pdf.
Guertler, B., Spinler, S. 2015. When does operational risk cause supply chain enterprises to tip? A
simulation of intra-organizational dynamics. Omega, 57, 54-69.
Hayya, J.C., Bagchi, U., Kim, J.G., Sun, D. 2008. On static stochastic order crossover. International
Journal of Production Economics, 114 (1), 404-413.
Dominguez R., Cannella S., Póvoa A.P., Framinan J.M. 2017. Information sharing in supply chains with
heterogeneous retailers. Omega. DOI: https://doi.org/10.1016/j.omega.2017.08.005
42
Hayya, J.C., Bagchi, U., Ramasesh, R. 2011. Cost relationships in stochastic inventory systems: A
simulation study of the (S, S-1, t=1) model. International Journal of Production Economics, 130 (2),
196-202.
Heckmann, I., Comes, T., Nickel, S. 2015. A critical review on supply chain risk–Definition, measure and
modeling. Omega, 52, 119-132.
Hiebeler, D. 1994. The Swarm Simulation System and Individual-Based Modeling. Proceedings of
Decision Support 2001: Advanced Technology for Natural Resource Management, Toronto, Canada.
Hilletofth, P., Hilmola, O. P., Wang, Y. 2016. Simulation based decision support systems in the supply
chain context. Industrial Management & Data Systems, 116(2).
Holmstrőm, J., Småros, J., Disney, S. M., & Towill, D. R. (2016). Collaborative supply chain
configurations: the implications for supplier performance in production and inventory control. In
Developments in Logistics and Supply Chain Management 27-37. Palgrave Macmillan UK.
Hosoda, T., Naim, M. M., Disney, S. M., & Potter, A. (2008). Is there a benefit to sharing market sales
information? Linking theory and practice. Computers & industrial engineering, 54(2), 315-326.
Huang, B., Iravani, S.M.R. 2005. Production control policies in supply chains with selective-information
sharing. Operations Research, 53 (4), 662-674.
Huang, Y.-S., Li, M.-C., Ho, J.-W. 2016. Determination of the optimal degree of information sharing in a
two-echelon supply chain. International Journal of Production Research, 54 (5), 1518-1534.
Huo, B., Zhao, X., Zhou, H. 2014. The effects of competitive environment on supply chain information
sharing and performance: an empirical study in China. Production and Operations Management,
23(4), 552-569.
Kelton, W.D., Sadowki, R.P., Sadowki, D.A. 2007. Simulation with Arena, fourth ed. McGraw-Hill, New
York.
Kembro, J., Selviaridis, K., Näslund, D. 2014. Theoretical perspectives on information sharing in supply
chains: a systematic literature review and conceptual framework. Supply Chain Management: An
International Journal, 19, 609-625.
Kembro, J., Selviaridis, K. 2015. Exploring information sharing in the extended supply chain: an
interdependence perspective. Supply Chain Management: An International Journal, 20(4), 455-470.
Kim, J.G., Chatfield, D., Harrison, T.P., Hayya, J.C. 2006. Quantifying the bullwhip effect in a supply
chain with stochastic lead time. European Journal of Operational Research, 173 (2), 617-636.
Kleijnen, JPC. 2008. Simulation experiments in practice: statistical design and regression analysis.
Journal of Simulation, 2 (1), 19–27.
Kong, G., Rajagopalan, S., Zhang, H. 2013. Revenue sharing and information leakage in a supply chain.
Management Science, 59 (3), 556-572.
Dominguez R., Cannella S., Póvoa A.P., Framinan J.M. 2017. Information sharing in supply chains with
heterogeneous retailers. Omega. DOI: https://doi.org/10.1016/j.omega.2017.08.005
43
Lau, J.S.K., Huang, G.Q., Mak, K.L. 2004. Impact of information sharing on inventory replenishment in
divergent supply chains. International Journal of Production Research, 42 (5), 919-941.
Li, Q., Disney, S.M., Gaalman, G. 2014. Avoiding the bullwhip effect using Damped Trend forecasting
and the Order-Up-To replenishment policy. International Journal of Production Economics, 149, 3-
16.
Li, T., Zhang, H. 2015. Information sharing in a supply chain with a make-to-stock manufacturer. Omega,
50, 115-125.
Li, Y., Zhen, X., Qi, X., Cai, G.G. 2016. Penalty and financial assistance in a supply chain with supply
disruption. Omega, 61, 167-181.
Lin, F.-R., Huang, S.-H., Lin, S.-C. 2002. Effects of Information Sharing on Supply Chain Performance
in Electronic Commerce. IEEE Transactions on Engineering Management, 49 (3), 258-268.
Long, Q and Zhang, W. (2014). An integrated framework for agent based inventory–production–
transportation modeling and distributed simulation of supply chains. Information Sciences, 277, 567-
581.
Maghsoudi, A., Pazirandeh, A. 2016. Visibility, resource sharing and performance in supply chain
relationships: insights from humanitarian practitioners. Supply Chain Management: An International
Journal, 21(1), 125-139.
Merzifonluoglu, Y. 2015. Risk averse supply portfolio selection with supply, demand and spot market
volatility. Omega, 57, 40-53.
Minar, N., Burkhart, R., Langton, C., Askenazi, M. 1996. The Swarm simulation system: A toolkit for
building multi-agent simulations. Working Paper 96-06-042, Santa Fe Institute, Santa Fe.
Nachtmann, H., Waller, M.A., Rieske, D.W. 2010. The impact of point‐of‐sale data inaccuracy and
inventory record data errors. Journal of Business Logistics, 31 (1), 149-158.
Nair, A., Vidal, J.M. 2011. Supply network topology and robustness against disruptions - An
investigation using multi-agent model. International Journal of Production Research, 49 (5), 1391-
1404.
Oliveira, J. B., Lima, R. S., Montevechi, J. A. B. 2016. Perspectives and relationships in Supply Chain
Simulation: A systematic literature review. Simulation Modelling Practice and Theory, 62, 166-191.
Osadchiy, N., Gaur, V., Seshadri, S. 2015. Systematic risk in supply chain networks. Management
Science, 62(6), 1755-1777.
Ponte, B., Sierra, E., de la Fuente, D., & Lozano, J. 2017. Exploring the interaction of inventory policies
across the supply chain: An agent-based approach. Computers & Operations Research, 78, 335-348.
Rabinovich, E., Cheon, S. 2011. Expanding horizons and deepening understanding via the use of
secondary data sources. Journal of Business Logistics, 32(4), 303-316.
Dominguez R., Cannella S., Póvoa A.P., Framinan J.M. 2017. Information sharing in supply chains with
heterogeneous retailers. Omega. DOI: https://doi.org/10.1016/j.omega.2017.08.005
44
Rached, M., Bahroun, Z., Campagne, J.-P. 2016. Decentralised decision-making with information sharing
vs. centralised decision-making in supply chains. International Journal of Production Research, 1-22.
Article in Press.
Rahmandad, H., Sterman, J. 2008. Heterogeneity and network structure in the dynamics of diffusion:
Comparing agent-based and differential equation models. Management Science, 54(5), 998-1014.
Ramanathan, U. 2014. Performance of supply chain collaboration–A simulation study. Expert Systems
with Applications, 41(1), 210-220.
Ren, Z. J. 2017. Empirical Studies in Information Sharing. In Handbook of Information Exchange in
Supply Chain Management (pp. 27-38). Springer International Publishing.
Shang, W., Ha, A.Y., Tong, S. 2016. Information sharing in a supply chain with a common retailer.
Management Science, 62 (1), 245-263.
Sharma, S. 2010. Policies concerning decisions related to quality level. International Journal of
Production Economics, 125 (1), 146-152.
Shih, H.P., Lai, K.H., Cheng, T.E. 2015. Examining structural, perceptual, and attitudinal influences on
the quality of information sharing in collaborative technology use. Information Systems Frontiers, 17
(2), 455-470.
Shnaiderman, M., Ouardighi, F.E. 2014. The impact of partial information sharing in a two-echelon
supply chain. Operations Research Letters, 42 (3), 234-237.
Spekman, R., Davis, E.W. 2016. The extended enterprise: a decade later. International Journal of
Physical Distribution & Logistics Management, 46 (1), 43-61.
Srinivasan, M., Novack, R., Thomas, D. 2011. Optimal and approximate policies for inventory systems
with order crossover. Journal of Business Logistics, 32 (2), 180–193.
Stadtler, H. 2005. Supply chain management and advanced planning - Basics, overview and challenges.
European Journal of Operational Research, 163 (3), 575-588.
Sterman, J. 1989. Modeling managerial behavior: misperceptions of feedback in a dynamic decision
making experiment. Management Science, 35 (3), 321-339.
Supply Chain Council. 2006. Supply-Chain Operations Reference-model—Overview of SCOR Version
8.0, Washington. Available from: <http://www.supply-chain.org>.
Swaminathan, J. M., Smith, S. F., Sadeh, N. M. 1998. Modeling supply chain dynamics: A multiagent
approach. Decision sciences, 29(3), 607-632.
Thomas, A., Krishnamoorthy, M., Venkateswaran, J., Singh, G. 2016. Decentralised decision-making in a
multi-party supply chain. International Journal of Production Research, 54 (2), 405-425.
Trapero, J.R., Kourentzes, N., Fildes, R. 2012. Impact of information exchange on supplier forecasting
performance. Omega, 40 (6), 738-747.
Dominguez R., Cannella S., Póvoa A.P., Framinan J.M. 2017. Information sharing in supply chains with
heterogeneous retailers. Omega. DOI: https://doi.org/10.1016/j.omega.2017.08.005
45
Trapero, J.R., Pedregal, D.J. 2016. A novel time-varying bullwhip effect metric: An application to
promotional sales. International Journal of Production Economics, 182, 465-471.
Wang, X., Disney, S. M. 2016. The bullwhip effect: Progress, trends and directions. European Journal of
Operational Research, 250 (3), 691-701.
Wang, X., Disney, S.M. 2017. Mitigating variance amplification under stochastic lead-time: The
proportional control approach. European Journal of Operational Research, 256, 151–162.
Xu, K., Dong, Y., Xia, Y. 2015. 'Too little' or 'Too late': The timing of supply chain demand
collaboration. European Journal of Operational Research, 241 (2), 370-380.
Yang, T., Wen, Y.-F., Wang, F.-F. 2011. Evaluation of robustness of supply chain information-sharing
strategies using a hybrid Taguchi and multiple criteria decision-making method. International Journal
of Production Economics, 134 (2), 458-466.
Zissis, D., Ioannou, G., Burnetas, A. 2015. Supply chain coordination under discrete information
asymmetries and quantity discounts. Omega, 53, 21-29.
View publication statsView publication stats