Information Conversion in Measuring Channels with ... - MDPI
18
Citation: Kukharchuk, V.V.; Pavlov, S.V.; Holodiuk, V.S.; Kryvonosov, V.E.; Skorupski, K.; Mussabekova, A.; Karnakova, G. Information Conversion in Measuring Channels with Optoelectronic Sensors. Sensors 2022, 22, 271. https://doi.org/ 10.3390/s22010271 Academic Editor: Yang Yue Received: 25 November 2021 Accepted: 28 December 2021 Published: 30 December 2021 Publisher’s Note: MDPI stays neutral with regard to jurisdictional claims in published maps and institutional affil- iations. Copyright: © 2021 by the authors. Licensee MDPI, Basel, Switzerland. This article is an open access article distributed under the terms and conditions of the Creative Commons Attribution (CC BY) license (https:// creativecommons.org/licenses/by/ 4.0/). sensors Article Information Conversion in Measuring Channels with Optoelectronic Sensors Vasyl V. Kukharchuk 1 , Sergii V. Pavlov 2 , Volodymyr S. Holodiuk 1 , Valery E. Kryvonosov 3 , Krzysztof Skorupski 4, *, Assel Mussabekova 5 and Gaini Karnakova 6 1 Faculty for Power Engineering and Electromechanics, Vinnytsia National Technical University, Khmelnytske Shose 95, 21021 Vinnytsia, Ukraine; [email protected] (V.V.K.); [email protected] (V.S.H.) 2 Laboratory of Biomedical Optics, Faculty for Infocommunications, Radioelectronics and Nanosystems, Vinnytsia National Technical University, Khmelnytske Shose 95, 21021 Vinnytsia,Ukraine; [email protected] 3 Department of “Engineering and Technology” of the Azov Maritime Institute, NU “Odessa Maritime Academy”, st. Chernomorskaya, 19, 87517 Mariupol, Ukraine; [email protected] 4 Faculty of Electrical Engineering and Computer Science, Lublin University of Technology, Nadbystrzycka 38d, 20-618 Lublin, Poland 5 Academy of Logistics and Transport, 97 Shevchenko st., Almaty 050012, Kazakhstan; [email protected] 6 M.Kh.Dulaty Taraz Regional University, Tole Bi St 40, Taraz 080000, Kazakhstan; [email protected] * Correspondence: [email protected]; Tel.: +48-81-538-4313 Abstract: The purpose of this work is the authors’ attempt to identify the main phases of information transformation in measurement channels on the example of an optical measurement channel with microprocessor control. The authors include such phases: hardware implementation and analytical representation of an optical sensor’s converting functions and a current-to-voltage converter; based on the methods of experimental computer science, the converting functions and sensitivity are deduced, analytical dependences for estimation of a range of measurement are obtained. It is shown that the choice of information transmission type in the microprocessor measuring channel significantly affects the speed of the measuring channel. Based on the uncertainty in the form of entropy before and after measurements, the amount of information for measuring channels with optoelectronic sensors is estimated. The application of the results obtained in the work allows even at the design stage of physical and mathematical modeling to assess the basic static metrological characteristics of measuring channels, aimed at reducing the stage of development and debugging of hardware and software and standardization of their metrological characteristics. Keywords: conversion of measuring information; optoelectronic sensor; measuring transducer; analog-to-digital converter; quantization; conversion function; sensitivity equation 1. Introduction Nowadays, there exists is an intensive development of registration, processing, and information storage instruments. As information becomes a strategic resource of society, its storage requires constant improvement of sensory measuring transducers, which ultimately boils down to increasing the productivity of the information measuring systems [1–4]. One of the broad classes of sensor transducers are optical sensors, where the information about the object of study is provided by converting optical radiation into an electrical signal, and their principle of operation is based on the laws of optics. Prospects for the use of optical sensors are great since light allows us to transform quite large streams of information at low power and without significantly affecting the state of the object, without damaging it, and can penetrate the object to a considerable depth. Optical methods have several advantages over electrochemical and mechanical meth- ods. The most widely used optical methods are absorption, fluorescence, spectrophotome- try, chemiluminescence, photoplethysmography, and surface plasmon resonance [2,5–7]. Sensors 2022, 22, 271. https://doi.org/10.3390/s22010271 https://www.mdpi.com/journal/sensors
-
Upload
khangminh22 -
Category
Documents
-
view
2 -
download
0
Transcript of Information Conversion in Measuring Channels with ... - MDPI

�����������������
Citation: Kukharchuk, V.V.; Pavlov,
S.V.; Holodiuk, V.S.; Kryvonosov, V.E.;
Skorupski, K.; Mussabekova, A.;
Karnakova, G. Information
Conversion in Measuring Channels
with Optoelectronic Sensors. Sensors
2022, 22, 271. https://doi.org/
10.3390/s22010271
Academic Editor: Yang Yue
Received: 25 November 2021
Accepted: 28 December 2021
Published: 30 December 2021
Publisher’s Note: MDPI stays neutral
with regard to jurisdictional claims in
published maps and institutional affil-
iations.
Copyright: © 2021 by the authors.
Licensee MDPI, Basel, Switzerland.
This article is an open access article
distributed under the terms and
conditions of the Creative Commons
Attribution (CC BY) license (https://
creativecommons.org/licenses/by/
4.0/).
sensors
Article
Information Conversion in Measuring Channels withOptoelectronic SensorsVasyl V. Kukharchuk 1, Sergii V. Pavlov 2, Volodymyr S. Holodiuk 1, Valery E. Kryvonosov 3,Krzysztof Skorupski 4,*, Assel Mussabekova 5 and Gaini Karnakova 6
1 Faculty for Power Engineering and Electromechanics, Vinnytsia National Technical University,Khmelnytske Shose 95, 21021 Vinnytsia, Ukraine; [email protected] (V.V.K.); [email protected] (V.S.H.)
2 Laboratory of Biomedical Optics, Faculty for Infocommunications, Radioelectronics and Nanosystems,Vinnytsia National Technical University, Khmelnytske Shose 95, 21021 Vinnytsia, Ukraine; [email protected]
3 Department of “Engineering and Technology” of the Azov Maritime Institute, NU “Odessa MaritimeAcademy”, st. Chernomorskaya, 19, 87517 Mariupol, Ukraine; [email protected]
4 Faculty of Electrical Engineering and Computer Science, Lublin University of Technology, Nadbystrzycka 38d,20-618 Lublin, Poland
5 Academy of Logistics and Transport, 97 Shevchenko st., Almaty 050012, Kazakhstan; [email protected] M.Kh.Dulaty Taraz Regional University, Tole Bi St 40, Taraz 080000, Kazakhstan; [email protected]* Correspondence: [email protected]; Tel.: +48-81-538-4313
Abstract: The purpose of this work is the authors’ attempt to identify the main phases of informationtransformation in measurement channels on the example of an optical measurement channel withmicroprocessor control. The authors include such phases: hardware implementation and analyticalrepresentation of an optical sensor’s converting functions and a current-to-voltage converter; based onthe methods of experimental computer science, the converting functions and sensitivity are deduced,analytical dependences for estimation of a range of measurement are obtained. It is shown thatthe choice of information transmission type in the microprocessor measuring channel significantlyaffects the speed of the measuring channel. Based on the uncertainty in the form of entropy beforeand after measurements, the amount of information for measuring channels with optoelectronicsensors is estimated. The application of the results obtained in the work allows even at the designstage of physical and mathematical modeling to assess the basic static metrological characteristics ofmeasuring channels, aimed at reducing the stage of development and debugging of hardware andsoftware and standardization of their metrological characteristics.
Keywords: conversion of measuring information; optoelectronic sensor; measuring transducer;analog-to-digital converter; quantization; conversion function; sensitivity equation
1. Introduction
Nowadays, there exists is an intensive development of registration, processing, andinformation storage instruments. As information becomes a strategic resource of society, itsstorage requires constant improvement of sensory measuring transducers, which ultimatelyboils down to increasing the productivity of the information measuring systems [1–4]. Oneof the broad classes of sensor transducers are optical sensors, where the information aboutthe object of study is provided by converting optical radiation into an electrical signal, andtheir principle of operation is based on the laws of optics. Prospects for the use of opticalsensors are great since light allows us to transform quite large streams of information atlow power and without significantly affecting the state of the object, without damaging it,and can penetrate the object to a considerable depth.
Optical methods have several advantages over electrochemical and mechanical meth-ods. The most widely used optical methods are absorption, fluorescence, spectrophotome-try, chemiluminescence, photoplethysmography, and surface plasmon resonance [2,5–7].
Sensors 2022, 22, 271. https://doi.org/10.3390/s22010271 https://www.mdpi.com/journal/sensors

Sensors 2022, 22, 271 2 of 18
Their main advantages are high speed, measurement accuracy, high sensitivity, widemeasuring range, and various applications. The disadvantage is the high cost of measuringchannels of conversion and processing [1,7–9].
According to the principle of optical–electrical conversion, optical sensors can bedivided into four types: those, based on the effects of photoelectron emission, photocon-ductivity, photovoltaic and pyroelectric.
The class of optical sensors also includes sensors in which the active light is applied ac-cording to the laws of reflection and refraction of light, its passage through a heterogeneousmedium, the phenomenon of light diffraction, etc., are used to obtain information.
The main advantages over other types of sensors are the possibility of non-contactmeasurement, the ability to measure the parameters of objects of both extremely large andextremely small sizes, high speed, application of integrated technology that provides smallsize and long service life, as well as a variety of applications that allow to measure differentphysical quantities, determine shapes and recognize objects, etc. Along with the advantages,optical sensors have some disadvantages, namely sensitivity to pollution, exposure toextraneous light, light background, as well as temperature, and have a significant cost.
At present, optical sensors are widely used in biology and medicine. However, untilrecently, as a rule, optical sensors analyzed preparations of biological substances (in vitro).But nowadays, optical sensors allow receiving information from a living object (in vivo),without destroying living tissue, non-invasively, with the least impact on natural processesoccurring in humans, animals, and plants. And in these cases, the most valuable researchtool is light radiation. Optoelectronic sensors provide only the conversion of the inputphysical quantity into the output electrical. To obtain the result it is necessary to comparethe electrical value of the output of the sensor with the sample. As a result of quantization, abinary code is obtained, which is exported to the microprocessor battery, stored in RAM, andthe result with a unit of measurement is obtained from the conversion equation. This wholesequence of measuring information transformation takes place in the measuring channel.
The measuring channel (Figure 1) is a set of measuring devices SO and SH, measuringinstruments ADC and PPI communication, designed to create measuring informationabout one physical quantity [3,10–15]. The generalized architecture of construction of themeasuring channel with the optoelectronic sensor is given in Figure 1.
Figure 1. Generalized block diagram of the measuring channel.
In this structure, relating to direct conversion circuits, the main components are thefollowing: SO—Optoelectronic sensor; SH—Shunt (current-to-voltage converter; ADC—Analog-to-digital converter; PPI—Parallel programmable interface; MPS—microprocessorsystem consisting of CPU microprocessor, RAM, and permanent ROM memory; BA, BD,BC—Address bus, data, and management, respectively.
This block diagram is well-known and widely used by the developers of informationand measurement technologies. Mathematical models of analog, analog-to-digital, anddigital converters, which adequately describe the different phases of information trans-formation in optical measurement channels, remain unexplored here. The lack of suchtheoretical results is a scientific and applied problem, the solution of which will allow atthe stage of hardware design and development to model such basic static metrological

Sensors 2022, 22, 271 3 of 18
characteristics of the optical channel selected for research as the transformation equa-tion (calibration characteristic), sensitivity, quantization error, measuring range, speed,which together will give new knowledge in the field of metrological support of opticalmeasuring channels.
The aim and scientific novelty of the work is to develop new mathematical models,which are the transformation function of the optical measuring channel, the equation ofsensitivity and quantization error, analytical dependences for estimating the measuringrange in the form of lower and upper measurement limits, speed.
2. Phases of Transformation of Measuring Information in the Optoelectronic Sensor
The input (measured) physical non-electric quantity here is the optical intensity IX,which in the process of transformations is converted into a numerical value—the measure-ments’ result. First, the sensor SO converts the optical intensity into the value of the currentIΦ. Next, the physical value of the current IΦ in the shunt SH is converted into a voltage U,which value is fed to the analog input In of the analog-to-digital converter ADC, where thesignal triggers Зn quantized by size and in the process is converted into 12-bit binary codeN [00-11]. Simultaneously with the fixing of the binary code on the digital outputs of theADC, a signal of logic “1” is formed at the output of the CP (end of the conversion). Theunit level of this signal binary code N [00-11] from the digital outputs of the ADC is storedin the input ports PA and PB parallel program interface PPI with simultaneous setting inthe port PC [02]: = “1”. The presence of the PC [02]: = “1” flag is perceived by the softwaredriver as a command that records binary code N [00-11] in the input ports PA and PB, canbe transmitted via the PPI interface to the accumulator of the microprocessor system MPS,with storing this binary code in the RAM of the microprocessor system MPS [16–18].
In order to further develop the applied “cybernetic” science of measurement, weconsider in detail the sequence of converting information in the measurement channeland analyze it from the standpoint of mathematics, experimental computer science, andmetrology [19–21]. Starting with the analysis of the measurement transformation of theoptical sensor SO, which means the operation of converting the input non-electric value ofthe optical intensity IX into the output electric value of the photocurrent I f , functionallyrelated dependence [4]:
I f = f (IX). (1)
The photocurrent I f at the output of the photodetector is directly proportional tothe intensity of the reflected scattered radiation IX, for example from a bio-object, isdetermined [5,6,22,23] as:
I f = −SIλ·τλ·I·10−3·τoпт·π·r2
l2·L2 ·cosα·cosβ·W, (2)
where SIλis the integral sensitivity of the photodetector (selected from the table with
the characteristics of photosensors [6,7] SIλ= 0.02; τλ—is the transmittance of the po-
larized filter in the transducer (0.5 ÷ 0.6); I—is light power of the radiation sourceI = P
S = 5[
Wtcm2
]; τoпт.—is the coefficient that characterizes the passage of light through
the optical system (0.9–0.95); l—is the distance from the source of radiation to the bio-object l = (2÷ 3)·10−1 cm; L—is the distance from the bio-object to the photosensorL = 2·l = 2·(2÷ 3)·10−1 cm; α—is the angle of incidence of light on the site of the pho-tosensor α = 90◦; β—is the angle between the normal to the reflective surface and thedirection of the reflective side of the bio-tissue β = 70◦; r—the radius r = 0.7 cm.
Assuming that IX = Wτoпт
the final conversion equation for the photodetector is writtenas follows [24,25]:
I f = −SIλ·τλ·I·10−3·τ2oпт·π·r2
l2·L2 ·cosα·cosβ·Ix. (3)

Sensors 2022, 22, 271 4 of 18
From (3), analytical dependence for assessing the sensitivity of optical sensor is obtained
SSOdI f
dIX= SIλ·τλ·I·10−3·τ
2oпт·π·r2
l2·L2 ·cosα·cosβ = const. (4)
Considering (4), Equation (3) is given as:
I f = SSO·IX . (5)
Since the sensitivity of the sensor is a constant value, the obtained transformationEquation (4) and its static characteristic (Figure 2) are linear.
Figure 2. Static characteristic of the sensor.
Using a shunt resistor, the current is converted into voltage, and this measurementtransformation is mathematically represented as follows [24–26]:
U = I f ·Rs =
(−SIλ·τλ·I·10−3·
τ2opt·π·r2
l2·L2 ·cosα·cosβ·Ix
)·Rs. (6)
Since the range of voltage change (Figure 3) at the output of the shunt (D ∈ 0 ÷ 5 V)corresponds to the area of the possible change of the input signal at the analog input Inanalog-to-digital converter ADC, the proposed scheme of the measuring channel (Figure 1)does not need scale transformation [27–30].
Thus, with the help of measuring devices (sensor and shunt) hardware and using theobtained conversion Functions (3) and (6) mathematically describes the process of convert-ing a non-electric analog value of optical intensity IX into analog electric value—voltage U,which range is sufficient for reliable operation of the analog-to-digital converter [31,32].

Sensors 2022, 22, 271 5 of 18
Figure 3. Voltage changing at the output of the shunt.
3. Analog-to-Digital Conversion
Conversion of analog voltage U into digital binary code N is carried out as a result ofanalog-to-digital conversion, which is based on such methods of experimental computerscience as reproduction, comparison, counting [33].
The block diagram for modeling the sequential approximation ADC is shown inFigure 4.
Figure 4. Block diagram of the sequential approximation ADC.
These methods [8] are realized by the following elements of the given diagram:
1. Counting—generator G, logic gate “AND”, n-bit binary counter CT;2. Reproduction of the sample value (quantization step h) provides n-bit digital-to-
analog converter DAC with an internal reference voltage source U0; and3. Comparison of the analog measured voltage U and the sample value h is performed
by a comparator.
During the time of analog-to-digital conversion tADC logic gate “AND” is open andpulses with a frequency f0 from the output of the generator G are fed to the input of thebinary counter CT, counting their quantity N. From the output of the counter binary codeis fed to the inputs of digital-to-analog converter DAC.
With the arrival of each frequency pulse f0, the voltage value at the output of the DACincreases by the value of the quantization step [33–35]
h =U0
2n . (7)
The step-quantized voltage formed at the DAC output increases at the second inputof the comparator until its value becomes equal to the value of the measured voltage Usupplied to the first input of the comparator.

Sensors 2022, 22, 271 6 of 18
The main operation performed during the conversion of analog voltage into binarycode is to compare the measured U and sample h values
N =Uh
. (8)
Taking into account (8) and (6), the final equation of transformation of the measuringchannel of optical intensity takes the form
N =Uh
=2n
U0·U =
2n
U0Rs
(−SIλ·τλ·I·10−3·
τ2opt·π·r2
l2·L2 ·cosα·cosβ
)·Ix (9)
and due to the sensitivity equation of the sensor (4) the transfer function of the measuringchannel in analytical form is given as
N =SSO Rs 2n
U0·IX (10)
From the transfer Function (10) we obtain the sensitivity equation for a given measur-ing channel
SBK =d Nd IX
=SSO Rs 2n
U0= const . (11)
Analysis of the sensitivity Equation (11) of the measuring channel shows that itstransfer Function (10) and static characteristics (Figure 5) are linear.
Figure 5. Static characteristics of the measuring channel.
4. Transmission and Evaluation of the Measuring Information Amount
Exporting the binary code N [00 . . . 07] from the ADC outputs to the RAM (Figure 1)can be implemented in different ways: by hardware or software, serial or parallel interface.Data can be transmitted in program mode, interrupt mode, and capture mode (direct accessto memory) [36,37].
Data transmission does not convert measurement information, but the interface (par-allel or serial) and transmission mode (software, interrupt, capture) significantly affect theperformance of the measurement channel.
We will consider this statement in the example of using a parallel interface andsoftware mode of information exchange between the outputs of the ADC and the MPSaccumulator [38–40].
According to signal 3n (Figures 1 and 6) the process of AD-conversion begins and atthe output, the level of logical zero Kn: = “0” is formed.
Sensors 2022, 22, 271 7 of 18
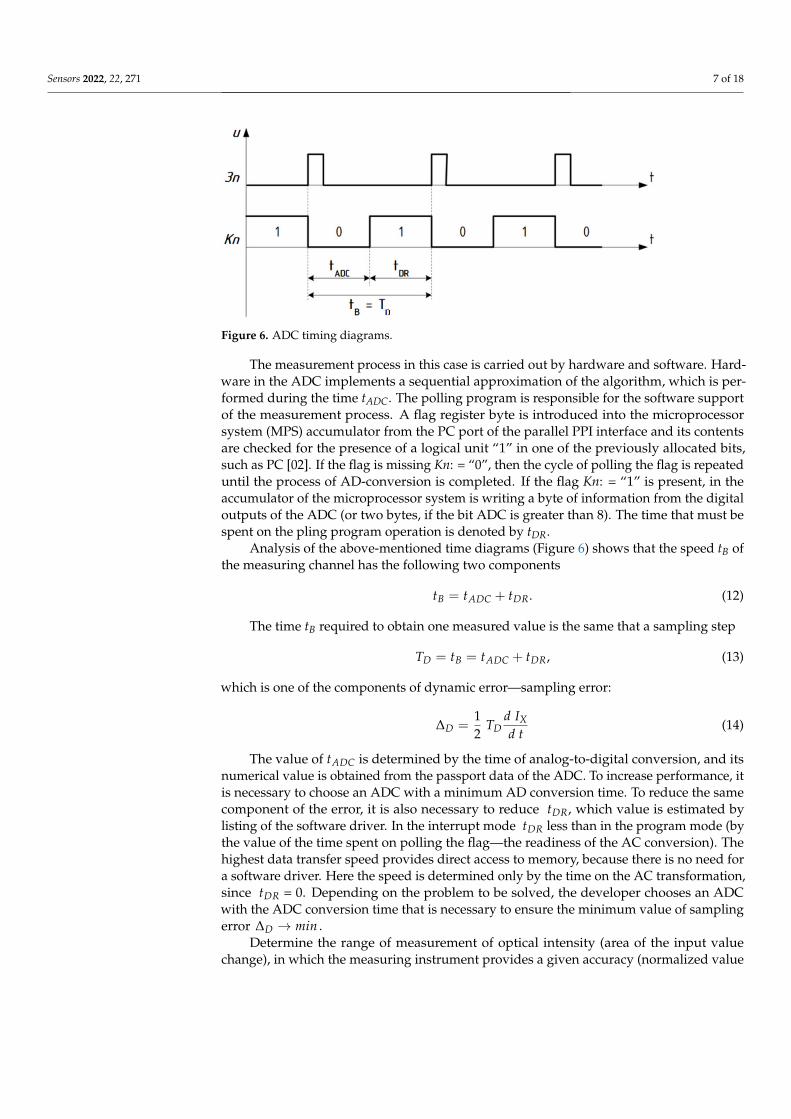
Figure 6. ADC timing diagrams.
The measurement process in this case is carried out by hardware and software. Hard-ware in the ADC implements a sequential approximation of the algorithm, which is per-formed during the time tADC. The polling program is responsible for the software supportof the measurement process. A flag register byte is introduced into the microprocessorsystem (MPS) accumulator from the PC port of the parallel PPI interface and its contentsare checked for the presence of a logical unit “1” in one of the previously allocated bits,such as PC [02]. If the flag is missing Kn: = “0”, then the cycle of polling the flag is repeateduntil the process of AD-conversion is completed. If the flag Kn: = “1” is present, in theaccumulator of the microprocessor system is writing a byte of information from the digitaloutputs of the ADC (or two bytes, if the bit ADC is greater than 8). The time that must bespent on the pling program operation is denoted by tDR.
Analysis of the above-mentioned time diagrams (Figure 6) shows that the speed tB ofthe measuring channel has the following two components
tB = tADC + tDR. (12)
The time tB required to obtain one measured value is the same that a sampling step
TD = tB = tADC + tDR, (13)
which is one of the components of dynamic error—sampling error:
∆D =12
TDd IXd t
(14)
The value of tADC is determined by the time of analog-to-digital conversion, and itsnumerical value is obtained from the passport data of the ADC. To increase performance, itis necessary to choose an ADC with a minimum AD conversion time. To reduce the samecomponent of the error, it is also necessary to reduce tDR, which value is estimated bylisting of the software driver. In the interrupt mode tDR less than in the program mode (bythe value of the time spent on polling the flag—the readiness of the AC conversion). Thehighest data transfer speed provides direct access to memory, because there is no need fora software driver. Here the speed is determined only by the time on the AC transformation,since tDR = 0. Depending on the problem to be solved, the developer chooses an ADCwith the ADC conversion time that is necessary to ensure the minimum value of samplingerror ∆D → min .
Determine the range of measurement of optical intensity (area of the input valuechange), in which the measuring instrument provides a given accuracy (normalized value

Sensors 2022, 22, 271 8 of 18
of relative quantization error—accuracy class). The lower boundary of measurement scaleIX min is limited by the normalized value δKH of relative quantization error.
IX min =U0 100%
δKH SSO RS 2n , (15)
and the upper boundary r is limited by the maximum capacity Nmax = 2n of the binarycounter CT2:
IX max =2n h
SSO RS. (16)
Graphical dependences of the lower boundary of measurement IX min on the normal-ized value of the quantization error δKH and the upper boundary of measurement on thebit n of the binary counter ADC are shown in Figure 7.
Figure 7. To the range of measuring transformation. (a) Dependence IX min = f (δKH), (b) Depen-dence IX max = f (n).
As a result of the research, there was an opportunity to model the first obtaineddependences (9)–(13), which will allow at the design stage of the measuring channelto obtain parameters for its structure that will convert the measured value into binarycode in the range IX min to IX max with a predetermined normalized value of the relativequantization error [41–43].
Analysis of the sensitivity Equation (11) suggests that by choosing its components it ispossible to achieve the value of the quantization error within δKH ∈ {0.1%–0.5%} In thisrange of possible changes in the quantization error, respectively, it is possible to perform(Figure 7) intensity measurements in the range from 1 to 100 mW.
The information obtained during the measurements [9] can be quantified by decreas-ing the entropy H(IX), which characterizes the uncertainty of the optical intensity beforethe measurement, to the value of H(IX/δKH), which remains after obtaining the measure-ment result:
II = H(IX)− H(IX/δKH) (17)
These estimates of uncertainty in the form of entropy before and after measurementsare determined on the basis of K. Shannon’s 16th theorem, which is described by thefunctional [10,11,44]:
H(IX) = −+∞∫−∞
P(IX)·log2P(IX)dIX . (18)
Measurements of optical intensity are carried out by a measuring channel (Figure 1),in which the measurement range is limited by the lower IX min and the upper IX max limits

Sensors 2022, 22, 271 9 of 18
(Figure 7). Then the probability of obtaining the measurement result in the region of changeIX from −∞ to IX min and from IX max to +∞ is zero.
Therefore, the measurement result of the physical quantity IX must be expected in themeasurement range from IX min to IX max. Assume that the measurement result is equallylikely to fall into any part of this range [45–47].
Therefore:
P(IX) =1
IX max − IX minf or IX min ≤ IX ≤ IX max; (19)
P(IX) = 0 f or IX < IX min i IX > IX max. (20)
taking into account the latter a priori determined entropy to measure
H(IX) = −+∞∫−∞
1IX max − IX min
·log21
IX max − IX mindIX . (21)
After performing the measurement, the entropy cannot be reduced to zero, becausethere is always uncertainty introduced by the error.
Determine the differential residual entropy for the case when the measurement erroris distributed according to the normal law [12,48] and its standard deviation is equals σ
P(IX/δKH) =1
σ√
2 π· exp
(−((
δKH2 σ
)2))
. (22)
Then the posteriori entropy (after) the measurements is determined [8]
H(IX/δKH) = −+∞∫−∞
P(IX/δKH)·log2P(IX/δKH) d IX log2
(σ√
2 π e)
. (23)
The solution of the last equation is obtained by K. Shannon and has the following finalform [47,49,50].
The amount of information obtained in the process of measuring the optical intensityof the proposed measuring channel is determined by the difference between a priori andposteriori entropy
II = H(IX)− H(IX/δKH) = −+∞∫−∞
·log21
IX max − IX mindIX − log2
(σ√
2 π e)
. (24)
For the set measuring range (Figure 7) and the standard deviation of the quantizationerror for (24), the amount of information of the measuring channel of optical intensity isII = 12 bits. This result does not contradict the empirical methods for determining the bitsize of the analog-to-digital converter [40,47,49,50].
5. Requirements for Optical Luminous f51lux Sensors Example
The study of the pulse waves (FIG) parameters allows us to get a correct idea of a bloodcirculation parameters number. Arterial peripheral pulse is the result of the interactionof various oscillatory and wave processes. The volume pulse wave consists of two typesof waves: connected with release and movement of systolic volume of blood and createdby the hydraulic shock arising in a phase of the maximum expulsion of blood. In general,the shape of a volumetric pulse wave is determined mainly by the process of expulsion ofblood from the ventricles of the heart and vibrations that occur both in the heart and inadjacent arterial vessels, as well as the damping effect of the vascular wall and surroundingorgans and tissues.
Sensors 2022, 22, 271 10 of 18
The emitters must provide radiation in two spectral bands in the red and infraredranges, the wavelength of radiation in the maximum of the spectral band (max) must be inthe range of 650–670 nm for red glow and 800–1000 nm for infrared radiation, the radiationspectrum must be one of the narrowest possible band and no sidebands, high externalquantum radiation output (VN) to obtain the maximum values of radiation power (Re) atlow supply currents.
Linear dependence of radiation power on current in a wide range of currents.High speed, which provides the ability to use emitters in different pulse modes.Small single design with flexible tape leads for emitters on both spectral ranges or
small design containing two crystals in one housing the distance between the emittingcrystals in both cases should not exceed 3 mm.
For matrix processing of optical signals, optoelectronic signal converters must providethe required maximum sensitivity of 10–5 and 10–6 lux.
Ensure the homogeneity of the photodetector cells with a spread of not more than2–5%.
All photodetectors as converters of optical signals in IIS are subject to the follow-ing requirements:
• Spectral distribution of photosensitivity, which corresponds to the spectral characteris-tics of the radiation source;
• High photosensitivity, which determines the minimum level of the input signal at agiven level of output;
• Low noise level in a given frequency band and a given gain, which determines a lowsensitivity threshold and high detection ability;
• Set electrical parameters: resistance, capacitance, voltage, and current, which deter-mine the coordination of the photodetector with the load; and
• Wide bandwidth and large dynamic range for both optical input and electrical output,which leads to high speed and the possibility of analog conversion.
Different types of emitters are used in AF sensors. Depending on the sensitivity ofthe device, the radiation source is also selected. The use of low-power light emitters isnot effective, as the photocell begins to act on the oscillations of extraneous light, andtherefore for the sensor, it is necessary to create a case of opaque fabric, which disrupts theheat transfer of the studied organ. In addition, a further strong gain of the useful signal isrequired. At the same time, a powerful emitter causes the tissues to heat up.
The emitters must provide radiation in two spectral bands in the red and infraredranges, the wavelength of the radiation in the maximum of the spectral band must be inthe range of 650–670 nm for red glow and 800–1000 nm for infrared radiation, the radiationspectrum has one maximum narrow band, high external quantum radiation output, toobtain maximum values of radiation power at low supply currents, the linear dependenceof radiation power on current in a wide range of currents, high speed, which allows the useof emitters in different pulse modes of operation, as well as low design with flexible tapeleads for emitters on both spectral ranges or small design containing two crystals in onehousing, the distance between the emitting crystals in both cases should not exceed 3 mm.
5.1. Requirements for Optical Sensors
One of the problems that arise in the development of photosensors in the AF is toensure a large dynamic range (more than 150 dB) and high accuracy of signal measurementfrom the sensor. This follows from the need to measure the constant and variable (pulse)components that have passed through the tissues (or reflected) light, and their ratio maybe at the level of tenths of a percent. In addition, the optical characteristics of the patient’stissue have great variability.
Different types of photosensors can be used for FIGs: photomultipliers, photodiodes,photoresistors, valve photocells, emission type photocells. Each of these devices hasits advantages and disadvantages. Extremely sensitive photoresistors are unstable withfluctuations in external temperature. In addition, their sensitivity in the infrared region

Sensors 2022, 22, 271 11 of 18
was low. Photomultipliers are large and require a high voltage current source, whichnecessitates additional human protection. Photocells of the emission type are bulky, whichprevents the examination of such parts of the body as the fingers, mucous membranes ofthe nose, throat, and others.
5.2. Requirements for Emitters
The emitters in both spectral ranges are made in a single small polymer housing witha size of 2.5 × 2.5 × 2.4 mm with deep tape leads.
Since the crystals used are transparent to the generating radiation and have significantlateral radiation, the holder contains a built-in light reflector, which allows us to increasethe radiation power in each direction by 1.5–2 times.
To obtain an optimal radiation angle of 50 ± 10◦, the housing has a hemisphericalpolymer dome with a radius R = 1 mm, which is located relative to the crystal in such away that the S/R ratio is in the range of 1.6–1.7.
5.3. Main Parameters
1. Emitters with red and infrared radiation based on Ga1−xAlxAs are characterized by acombination of high values of external quantum radiation output and speed. Thereare prospects for increasing ηBH of infrared diodes to 30–35% and red LEDs to 15–20%.
2. Recently developed light diodes may also be of interest to the medical industry:
• With a blue glow, on SiC-6H (λmax—470–280 nm half-width ∆λ1/2 = 60 nm) withηBH = 10–2%;
• With a violet glow on SiC-4H (λmax = 423 nm, ∆λ1/2 = 25 nm) with ηBH =10–3%; and
• With a yellow glow with GaAs0.15 P0.85:N/CaP (λmax = 580 nm, ∆λ1/2 = 30 nm)with ηBH = 0.25% and many others.
One of the problems that arise in the development of optoelectronic analyzers ofphotoplethysmography signals is the provision of a large dynamic range (more than150 dB) and high accuracy of signal measurement from a photo sensor. It follows from theneed to measure the constant and variable (pulse) components that have passed throughthe fabric (or reflected) light, and their ratio may be at the level of tenths of a percent. Inaddition, the optical characteristics of the patient’s tissue have great variability. Thus, in thetraditional ideology of the device there is a need to use 16-bit analog-to-digital converters(ADC) and preamplifiers with a programmable conversion ratio controlled, as a rule, by amicroprocessor [30].
When recording processes in biological tissues, there is no need for a high samplingfrequency of the signal, in particular, the spectrum of the photoplethysmogram is limitedfrom above to 10–15 Hz. In this regard, it is proposed to use in this area sigma-delta-ADCwith a high bit rate (up to 24) and with a working bandwidth of tens–hundreds of hertz.
5.4. Requirements for Luminous Flux Transformation Systems
When passing through the tissue, the radiation is scattered, getting on the skin locatednext to the photocell. Therefore, vascular reactions can be recorded at 10 mm away from thelight source. The rays of light emanating from the illuminator must be collected in a singlecylindrical beam equal in diameter to the photocell and directed to its working surface.
It is advisable to use a light guide, which gives, on the one hand, the ability to recordvascular reactions with a certain size of the skin (usually only 1 cm2), and on the other,reduces the thermal effect of light on the tissue. In addition, it protects the photocell andthe light emitter from sweat condensation.
The function of the optical fiber is also the supply of a parallel beam to the object ofstudy. Quantitative determination of the distribution of blood supply using the Lambert–Beer formula is possible only for a parallel beam of light. To transmit light over a distance,special-shaped optical fibers are used, that give a complete internal reflection. When theworking area of the photocell is small, the fiber is made in the form of a truncated cone.

Sensors 2022, 22, 271 12 of 18
The working end can be given any shape that allows to conduct research on a certain areaof skin, such as 1 cm2. The fiber with a variable cross-section is wide facing the light source,and narrow—the study object. This significantly increases the concentration of radiation incases where a low-power light source is used.
During the development of the complex, several requirements were put forward tothe created device:
• Availability of two channels for obtaining biomedical information; and• Interaction and exchange of information with the computer via the interface.
The device schematically shown in Figure 8 contains a source 1 of pulse voltage,the first 2 and the second 3 source of infrared radiation (LEDs), the first 4 and second5 receivers of infrared radiation (photodiodes), the first 6 and second 7 blocks of analogsignal processing, control unit 8, analog multiplexer 9, analog-to-digital converter (ADC)10, first 11 and second 12 display units, register 13, first 14 and second 15 random accessmemory (RAM), microprocessor (MP) 16, display 17, information output of the device 18.
Figure 8. Block diagram of a device for diagnosing vascular disorders.
The output of the source 1 of the pulse voltage is connected to the inputs of thefirst 2 and second 3 sources of IR radiation, the optical outputs of which are connectedrespectively to the optical inputs of the first 4 and second 5 IR receivers, the outputs ofwhich are connected to the inputs of the first 6 and the second 7 analog signal processingunits, the outputs of which are connected to the input of the analog multiplexer 9, theaddress inputs of which are connected to the first and second inputs of the control device 8,and the output to the ADC input 10, the output bus of which is connected to the inputs ofthe first 11 and a second 12 display units, the control inputs of which are connected to thecorresponding address inputs of the multiplexer 9 and to the input of the register 13, theoutput bus of which is connected to the inputs of the first 14, second 15 RAM, the controlinputs of which are connected to the outputs, the output buses of the RAM are connectedto each other and connected to the input of the register 13 and the MP 16, the output ofwhich is connected to the output of the device 18 and the display 17.

Sensors 2022, 22, 271 13 of 18
The device works as follows. Paired photometric sensors consisting of sources 2,3 of IR radiation and photodetectors 4, 5 are located in the intervertebral depressionssymmetrically relative to the spine. The pulse voltage source 1 forms a periodic sequenceof rectangular pulses that are fed to the sources 2, 3 of the IR radiation operating in thepulse mode. Pulses of radiation, passing through the studied vessels, are modulated by theamplitude of blood flow pulsations.
Modulated radiation flux is converted by photosensors 4, 6 into an electrical signal,which is pre-amplified by the amplifier 19. Next, the signal is amplified by the AC amplifier20 at the operating frequency of the pulse voltage source 2. From the output of the demod-ulator 21, the signal 1 through the low-pass filter 22 having a bandwidth correspondingto the spectrum of the pulse wave signal is fed to the input of the analog multiplexer 9,through which the corresponding signals from the control unit 8 are fed to the ADC 9 inthe digital code required for the operation of the MP 16. The control unit 8 controls theoperation of the RAM, producing at the outputs of the decoder 25 signals to the inputs ofthe RAM recording permission.
6. Practical Implementation
Today, more and more methods, based on the use of optoelectronic devices, are beingintroduced into medical diagnostics. These include the photoplethysmographic method(PPM), which measures blood flow in strong veins and arteries, as well as in peripheralvessels and capillaries [31–33].
PPM, in comparison with other means of diagnostics of a biological object (BO) onoptical indicators, for example, with a photoacoustic method, distinguishes by the simplicityof devices for its realization, and also that introduction in photoplethysmographic (PPG)devices of elements of light fiber technics and sources with different wavelengths of probingradiation, it is possible to easily solve the problems of photodynamic research, remotemeasurement of certain parameters of the desired BO, etc.
At this stage, the introduction of PPGs in medical practice PPG has not yet found itswide application for a number of reasons. One of them is the lack of biophysical justificationfor obtaining a photoplethysmographic signal.
There are two types of PPM—PPG in transmitted light and PPG in reflected light. Mostoften studies are performed in transmitted light, because in this case the direct assessmentof blood supply in the required area of the BO is possible. But it is often quite difficult toconduct such research, for example, for optically opaque BO or for hard-to-reach areas ofobjects. Then use of the PPG method in reflected light, which not only allows to assess thetotal blood flow in the study area, but also gives an integrated assessment of the propertiesof the study surface.
In the case of PPG in reflected light, i.e., when the photoplethysmographic transducer(PMT) perceives the reflected radiant flux from the BO, it is shown that PPM allows torecord the magnitude of changes in blood supply to the pulsation closest to PMT of thestudied light flux depending on the amplitude of the pulsation of the tissue.
The usage of optoelectronic and laser sensors in biology and medicine can be carriedout in several areas, one of which can be considered the development of new optoelectronicand laser technologies for the detection, identification, study of biological objects, as wellas to study the nature of the processes, occurring in them.
Figure 9 shows the implementation of an optoelectronic sensor to determine peripheralblood flow and an example of the results of the study, shown in Figure 10.

Sensors 2022, 22, 271 14 of 18
Figure 9. Optoelectronic device for diagnosing peripheral blood circulation.
Figure 10. An example of deriving the results of the study.
The Characteristics of the Optoelectronic Sensor
The emitters must provide radiation in two spectral bands in the red and infraredranges, and the wavelength of the radiation in the maximum of the spectral band (max)must be in the range of 600–800 nm for red glow and 800–1000 nm for infrared radiation.To process optical signals, optical sensors must provide the required maximum sensitivityof 10–5÷ 10–6 lux. The following requirements apply to all photodetectors as optical signalconverters: spectral distribution of photosensitivity, which corresponds to the spectral char-acteristics of the radiation source; high photosensitivity, which determines the minimumlevel of the input signal at a given level of output; low noise level in a given frequencyband and a given gain, which determines a low sensitivity threshold and high detectioncapability; set electrical parameters: resistance, capacitance, voltage and current, whichdetermine the coordination of the photodetector with the load; wide bandwidth and largedynamic range for both optical input and electrical output, which leads to high speed andthe possibility of analog conversion.
When choosing photosensors for an optical sensor, there is a requirement to ensure alarge dynamic range (more than 150 dB) and high accuracy of signal measurement from thesensor. This is due to the need to measure the constant and variable (pulse) componentsthat reflected light, and their ratio may be at the level of tenths of a percent.
Red and IR wavelengths radiation output could be changed in the interval 90–280 µW,while the blue radiation output is constant. A new method was used for measuring PPGsignals—digital PPG without analogue amplifier and filters. The signals acquired frommeasuring photodiode discharge time are inverse to the absorption of the light. Theemission wavelengths were 660 nm and 880 nm.
For the task of registering a photoplethysmogram under the conditions of artifacts:
Sensors 2022, 22, 271 15 of 18
• A sensor with radiation sources evenly distributed around the circumference of theworking surface, in the center of which a photodetector with a collecting lens isinstalled; and
• A sensor with an emitting surface formed using an optical system based on an LED,located in the center of the working surface of the sensor.
The authors of the article received more than ten patents of Ukraine for the implemen-tation of an optical sensor and an optical-electronic device for the study of peripheral bloodflow [29,30,32].
To increase the reliability of photoplethysmographic information, a priori informationis used, which includes the physical characteristics of the object of study, mathematicalrelationships between the measured values, data on the spectral composition of informativecomponents and interference, and basic biophysical characteristics of the controlled object.
7. Conclusions
On the example of the optical intensity measuring channel, the measurement resultof which is given in binary code, the following phases of information conversion arehighlighted: hardware implementation and mathematical description of the conversion ofanalog physical quantities in sensor and measuring current-to-voltage converter. shunt.The obtained conversion Functions (3) and (6) are the source for modeling the processes ofconversion of analog information, the results of which are shown in Figures 2 and 3.
Having applied the methods of experimental computer science of reproduction, com-parison, and calculation on the example of ADC of sequential approximation the process ofconverting the analog value I_X into binary code N is described analytically, the functionof converting a continuous value to a discontinuous value, sensitivity equation is obtainedand measuring range is determined where the normalized value of the quantization erroris provided for the measuring channels with optoelectronic sensors.
It is shown that the choice of the type of information transmission and interfacein microprocessor measuring instruments significantly affects the performance of themeasuring channel, which has two components: hardware and software. To establish themeasurement range, based on the uncertainty in the form of entropy before and after themeasurements, the amount of information the numerical value of which coincides withthe empirical methods for determining the bit size of the analog-to-digital converter isestimated, which is also extremely important for for the developer at the design stage ofdigital measurement channels.
Analysis of the sensitivity equation suggests that by choosing its components it ispossible to achieve the value of the quantization error within δKH ∈ {0.1%–0.5%}. In thisrange of possible changes in the quantization error, respectively, it is possible to performintensity measurements in the range from 1 to 100 mW.
The application of the results obtained in the work allows even at the design stage ofphysical and mathematical modeling to assess the basic static metrological characteristicsof measuring channels, aimed at reducing the stage of development and debugging ofhardware and software and standardization of their metrological characteristics.
Author Contributions: Conceptualization: V.V.K., S.V.P.; Methodology: V.V.K., S.V.P., V.S.H., K.S.;Software: S.V.P., V.S.H., V.E.K., G.K.; Validation: S.V.P.; Formal Analysis: V.S.H., K.S., A.M., G.K.;Investigation: V.V.K., S.V.P., V.S.H., G.K.; Writing-Original Draft Preparation: V.V.K., S.V.P., V.S.H.,K.S., A.M.; Writing-Review & Editing: V.S.H., V.E.K., K.S., A.M., G.K.; Visualization: V.S.H., V.E.K.,K.S., A.M., G.K.; Project Administration: S.V.P., K.S. All authors have read and agreed to the publishedversion of the manuscript.
Funding: The work was performed in accordance with the plan of scientific research and the Ministryof Education and Science of Ukraine “Creation of Information Diagnostic Technologies for Assessingthe Status and Determination of Human Health Index” (State Registration Number 0108U000656).
Informed Consent Statement: Informed consent was obtained from all subjects involved in the study.

Sensors 2022, 22, 271 16 of 18
Data Availability Statement: The data were taken from the scientific reports of the Faculty forPower Engineering and Electromechanics, Vinnytsia National Technical University, Laboratory ofBiomedical Optics, Faculty for Infocommunications, Radioelectronics and Nanosystems, VinnytsiaNational Technical University, Lublin University of Technology and Department of “Engineering andTechnology” of the Azov Maritime Institute, NU “Odessa Maritime Academy”.
Conflicts of Interest: The authors declare no conflict of interest. The founding sponsors had no rolein the design of the study; in the collection, analyses, or interpretation of data; in the writing of themanuscript, and in the decision to publish the results.
References1. Kozhemyako, V.P.; Gotra, Z.Y.; Pavlov, S.V. Circuitry of Modern Device Building: Part 3 Optical Sensors; VSTU: Vinnytsia, Ukraine,
2002; p. 164.2. Dorozhynsky, G.V.; Maslov, V.P.; Ushenin, Y.V. Sensor Devices Based on Surface Plasmon Resonance; Publishing House Polytechnic:
Kyiv, Ukraine, 2016; p. 264.3. Kukharchuk, V.V.; Kucheruk, V.Y.; Volodarsky, E.T.; Grabko, V.V. Fundamentals of Metrology and Electrical Measurements: A Textbook;
Oldi-Plus: Kherson, Ukraine, 2013; p. 538.4. Ornatsky, P.P. Introduction to the Methodology of the Science of Measurement; Tutorial: Kyiv, Ukraine, 1994; p. 160.5. Allen, J. Photoplethysmography and its application in clinical physiological measurement. Physiol. Meas. 2007, 28, R1. [CrossRef]
[PubMed]6. Kozlovska, T.I.; Zlepko, S.M.; Kolesnic, P.F. Optoelectronic multispectral device for determining the state of peripheral blood
circulation. In Proceedings of the Photonics Applications in Astronomy, Communications, Industry, and High Energy PhysicsExperiments 2020, Wilga, Poland, 31 August–2 September 2020; Volume 11581.
7. Khairullina, A.J. Multi wavelenght pulse oximetry in the measurement of gemoglobin fractions. In Proceedings of the PhotonicsWest 1996, San Jose, CA, USA, 27 January–2 February 1996; SPIE: Bellingham, WA, USA, 1996; Volume 2676, p. 332.
8. Kukharchuk, V.V.; Vedmitsky, Y.G.; Volodarsky, E.T. Function of analytical quantization of continuous, piecewise continuous anddiscrete signals. Metrol. Devices 2014, 4–10.
9. Novitsky, P.V.; Zograf, I.A. Measurements Results Errors Estimation; Energoatomizdat: Saint Petersburg, Russia, 1985; p. 248.10. Shannon, K. Mathematical Theory of Communication, Works on the Theory of Information and Cybernetics; Publishing House of Foreign
Literature: Moscow, Russia, 1963; pp. 243–332.11. Shannon, K. Modern Achievements of Communication Theory, Works on Information Theory and Cybernetics; Publishing House of
Foreign Literature: Moscow, Russia, 1963; pp. 403–414.12. Malikov, M.F. Fundamentals of Metrology, Part 1; Standartgiz: Moscow, Russia, 1949; p. 478.13. Vasilenko, A.M.; Zhukolenko, L.V.; Ponnova, A.M. Tensogalometry. Russ. Med. J. 1998, 1, 51–53.14. Goloshchapov-Aksenov, R.S.; Kurdo, S.A.; Sitanov, A.C. Treatment of patients with critical ischemia of the lower extremities with
common atherosclerotic lesion of the arterial bed. Int. J. Interv. Cardioangiol. 2013, 35, 38.15. Zaitseva, T.A. Combined method of stimulation of neoangiogenesis in patients with critical ischemia of the lower extremities.
Success Mod. Nat. Sci. 2014, 6, 41–42.16. Kaputin, M.Y. Transluminal balloon angioplasty in patients with diabetes mellitus with critical ischemia of the lower extremities.
Med. Acad. J. 2008, 2, 84–91.17. Kaputin, M.Y. Balloon angioplasty in the treatment of critical ischemia of the lower extremities. Mod. Technol. Med. 2010, 1, 62–63.18. Kislov, E.E. The results of treatment of patients with critical ischemia of the lower limb and distal arterial lesions. Ural Med. J.
2009, 1, 50–53.19. Ovcharenko, D.V. Peripheral Angioplasty (PAP) with atypical blood supply in patients with critical ischemia. Int. J. Interv.
Cardioangiol. 2011, 24, 92–93.20. Pityk, A.I.; Prasol, V.A.; Boyko, V.V. Revascularization of the lower extremities in patients with critical ischemia due to infra-red
blood vessel arteries. Angiol. Vasc. Surg. 2014, 4, 153–158.21. Sedov, V. Effectiveness of cell therapy in patients with critical ischemia of the lower extremities. Reg. Blood Circ. Microcirc. 2011, 2,
45–52.22. Abdelhamid, M.F. Below-the-ankle angioplasty is a feasible and effective intervention for critical leg ischaemia. Eur. J. Vasc.
Endovasc. Surg. 2010, 39, 762–768. [CrossRef]23. Brochado, F.C. Inframalleolar bypass grafts for limb salvage. Eur. J. Vasc. Endovasc. Surg. 2010, 40, 747–753. [CrossRef]24. Masaki, H.; Tabuchi, A.; Yunoki, Y.; Watanabe, Y.; Mimura, D.; Furukawa, H.; Yamasawa, T.; Honda, T.; Takiuchi, H.; Tanemoto, K.
Bypass vs. endovascular therapy of infrapopliteal lesions for critical limb ischemia. Ann. Vasc. Dis. 2014, 7, 227–231. [CrossRef]25. Romiti, M.; Albers, M.; Brochado-Neto, F.C.; Durazzo, A.E.S.; Pereira, C.A.D.B.; De Luccia, N. Meta-analysis of infrapopliteal
angioplasty for chronic critical limb ischemia. J. Vasc. Surg. 2008, 47, 975–981.e1. [CrossRef]26. Soga, Y.; Iida, O.; Kawasaki, D.; Hirano, K.; Yamaoka, T.; Suzuki, K. Impact of cilostazol on angiographic restenosis after balloon
angioplasty for infrapopliteal artery disease in patients with critical limb ischemia. Eur. J. Vasc. Endovasc. Surg. 2012, 44, 577–581.[CrossRef]

Sensors 2022, 22, 271 17 of 18
27. Pavlov, S.V.; Kozlovska, T.I.; Vasilenko, V.B. Opto-Electronic Devices for Diagnosis of Peripheral Circulation with High Reliability.Ph.D. Thesis, Vinnitsa National Medical University, Vinnitsa, Ukraine, 2014.
28. Pavlov, S.V.; Sander, S.V.; Kozlovska, T.I.; Kaminsky, A.S.; Wojcik, W.; Junisbekov, M.S. Laser photoplethysmography in integratedevaluation of collateral circulation of lower extremities. In Proceedings of the Optical Fibers and Their Applications 2012,Krasnobrod, Poland, 10–13 October 2012; SPIE: San Francisco, CA, USA, 2013; p. 869808. [CrossRef]
29. Sander, S.V.; Kozlovska, T.I.; Vassilenko, V.; Pavlov, V.S.; Klapouschak, A.Y.; Kisała, P.; Romaniuk, R.; Sagymbekova, A. Laserphotoplethysmography in integrated evaluation of collateral circulation of lower extremities. Opt. Fibers Appl. 2015, 9816, 98161K.[CrossRef]
30. Wójcik, W.; Smolarz, A. Information Technology in Medical Diagnostics; Taylor & Francis Group CRC Press Reference: London, UK,2017; p. 210.
31. Vassilenko, V.; Valtchev, S.; Teixeira, J.P.; Pavlov, S. Energy harvesting: An interesting topic for education programs in engineeringspecialities. Internet Educ. Sci. IES 2016, 1, 149–156.
32. Pavlov, S.V.; Kozhemiako, V.P.; Kolesnik, P.F. Physical Principles of Biomedical Optics; Vinnytsia National Technical University:Vinnytsya, Ukraine, 2010; p. 152.
33. Pavlov, S.V.; Kozhemiako, V.P.; Petruk, V.G.; Kolesnik, P.F. Photoplethysmohrafic Technologies of the Cardiovascular Control; Universum:Vinnitsa, Ukraine, 2007; p. 254.
34. Wójcik, W.; Pavlov, S.; Kalimoldayev, M. Information Technology in Medical Diagnostics II; CRC Press: London, UK, 2019; p. 336.35. Pavlov, S.V.; Kozhukhar, A.T.; Titkov, S.V.; Barylo, O.S.; Sorochan, O.M.; Wójcik, W.; Romaniuk, R.; Zyska, T.; Annabaev, A.
Electro-optical system for the automated selection of dental implants according to their colour matching. Przeglad Elektrotechniczny2017, 93, 121–124. [CrossRef]
36. Kholin, V.V.; Chepurna, O.M.; Shton, I.O.; Voytsehovich, V.S.; Azarov, O.D.; Pavlov, S.V.; Gamaleia, N.F.; Harasim, D. Methodsand fiber optics spectrometry system for control of photosensitizer in tissue during photodynamic therapy. In Proceedings ofthe Photonics Applications in Astronomy, Communications, Industry, and High-Energy Physics Experiments, Wilga, Poland,29 May–6 June 2016; p. 1003138.
37. Rovira, R.H.; Tuzhanskyy, S.Y.; Pavlov, S.V.; Savenkov, S.N.; Kolomiets, I.S.; Stasenko, V.A.; Bayas, M.M.; Omiotek, Z.;Małecka-Massalska, T.; Dzierzak, R. Polarimetric characterisation of histological section of skin with pathological changes.In Proceedings of the Photonics Applications in Astronomy, Communications, Industry, and High-Energy Physics Experiments,Wilga, Poland, 29 May–6 June 2016; Volume 10031, p. 100313.
38. Zabolotna, N.I.; Pavlov, S.V.; Radchenko, K.O.; Stasenko, V.A.; Wójcik, W. Diagnostic efficiency of Mueller-matrix polarizationreconstruction system of the phase structure of liver tissue. In Proceedings of the Optical Fibers and Their Applications2015, Nałeczów, Poland, 22–25 September 2015; International Society for Optics and Photonics: Bellingham, WA, USA, 2015;Volume 9816, p. 98161E.
39. Avrunin, O.G.; Tymkovych, M.Y.; Pavlov, S.V.; Timchik, S.V.; Kisała, P.; Orakbaev, Y. Classification of CT-brain slices based onlocal histograms. In Optical Fibers and Their Applications 2015; International Society for Optics and Photonics: Bellingham, WA,USA, 2015; Volume 9816, p. 98161J.
40. Kukharchuk, V.V.; Hraniak, V.F.; Vedmitskyi, Y.G.; Bogachuk, V.V.; Zyska, T.; Komada, P.; Sadikova, G. Noncontact method oftemperature measurement based on the phenomenon of the luminophor temperature decreasing. In Proceedings of the PhotonicsApplications in Astronomy, Communications, Industry, and High-Energy Physics Experiments, Wilga, Poland, 29 May–6 June2016; p. 100312F.
41. Chepurna, O.; Shton, I.; Kholin, V.; Voytsehovich, V.; Popov, V.; Pavlov, S.; Gamaleia, N.; Wójcik, W.; Zhassandykyzy, M.Photodynamic therapy with laser scanning mode of tumor irradiation. In Proceedings of the 16th Conference on Optical Fibersand Their Applications, Naleczow, Poland, 22–25 September 2015; SPIE: Bellingham, WA, USA, 2015; Volume 9816, p. 98161F.[CrossRef]
42. Dubolazov, A.V.; Koval, G.D.; Zabolotna, N.I.; Pavlov, S.V. Fractal structure of optical anisotropy Mueller-matrices imagesof biological layers. In Proceedings of the Eleventh International Conference on Correlation Optics, Chernivtsi, Ukraine,18–21 September 2013; p. 90661W.
43. Zabolotna, N.I.; Wojcik, W.; Pavlov, S.V.; Ushenko, O.G.; Suleimenov, B. Diagnostics of pathologically changed birefringentnetworks by means of phase Mueller matrix tomography. In Proceedings of the Optical Fibers and Their Applications 2012,Krasnobrod, Poland, 10–13 October 2012; SPIE: Bellingham, WA, USA, 2013; Volume 8698, p. 86980E.
44. Rovira, J.R.; Pavlov, S.V.; Vassilenko, V.B.; Wójcik, W.; Sugurova, L. Methods and resources for imaging polarimetry. In Proceedingsof the Optical Fibers and Their Applications 2012, Krasnobrod, Poland, 10–13 October 2012; International Society for Optics andPhotonics: Bellingham, WA, USA, 2013; Volume 8698, p. 86980T.
45. Zabolotna, N.I.; Pavlov, S.V.; Ushenko, A.G.; Karachevtsev, A.O.; Savich, V.O.; Sobko, O.V.; Olar, O. System of the phasetomography of optically anisotropic polycrystalline films of biological fluids. In Proceedings of the SPIE NanoScience +Engineering, San Diego, CA, USA, 17 August 2014; Volume 9166, p. 916616. [CrossRef]
46. Zabolotna, N.I.; Pavlov, S.V.; Ushenko, A.G.; Sobko, O.V.; Savich, V.O. Multivariate system of polarization tomography ofbiological crystals birefringence networks. Biosensing Nanomed. 2014, 9166, 916615. [CrossRef]
47. Vedmitskyi, Y.G.; Kukharchuk, V.V.; Hraniak, V.F. New non-system physical quantities for vibration monitoring of transientprocesses at hydropower facilities, integral vibratory accelerations. Przeglad Elektrotechniczny 2017, 93, 69–72. [CrossRef]

Sensors 2022, 22, 271 18 of 18
48. Tymchenko, L.; Tverdomed, V.; Petrovsky, N.; Kokryatskaya, N.; Maistrenko, Y. Development of a method of processing imagesof laser beam bands with the use of parallelhierarchic networks. East. Eur. J. Enterp. Technol. 2019, 6, 21–27. [CrossRef]
49. Kukharchuk, V.V.; Kazyv, S.S.; Bykovsky, S.A. Discrete wavelet transformation in spectral analysis of vibration processes athydropower units. Przeglad Elektrotechniczny 2017, 93, 65–68. [CrossRef]
50. Kukharchuk, V.V.; Bogachuk, V.V.; Hraniak, V.F.; Wójcik, W.; Suleimenov, B.; Karnakova, G. Method of magneto-elastic con-trol of mechanic rigidity in assemblies of hydropower units. In Proceedings of the Photonics Applications in Astronomy,Communications, Industry, and High Energy Physics Experiments, Wilga, Poland, 31 August–2 September 2017; p. 104456A.