Genotype/Phenotype Correlation in Autosomal Recessive Lamellar Ichthyosis
Upload
independentCategory
view
0download
0
Influence of APOE Genotype on Whole-Brain FunctionalNetworks in Cognitively Normal ElderlyEun Hyun Seo1,3, Dong Young Lee1,2,3*, Jong-Min Lee4, Jun-Sung Park4, Bo Kyung Sohn1,2, Young MinChoe1,2, Min Soo Byun1,2, Hyo Jung Choi1,2, Jong Inn Woo1,2,3
1 Department of Neuropsychiatry, Seoul National University Hospital, Seoul, Korea, 2 Department of Neuropsychiatry, Seoul National University College ofMedicine, Seoul, Korea, 3 Interdisciplinary Program of Cognitive Science, Seoul National University, Seoul, Korea, 4 Department of Biomedical Engineering,Hanyang University, Seoul, Korea
Abstract
This study aimed to investigate the influence of apolipoprotein E (APOE) ε4 allele on whole-brain functional networksin cognitively normal (CN) elderly by applying graph theoretical analysis to brain glucose metabolism. Eighty-six CNelderly [28 APOE ε4 carriers (ε4+) and 58 non-carriers (ε4-)] underwent clinical evaluation and resting [18F]fluorodeoxyglucose positron emission tomography scan. Whole-brain functional networks were constructed fromcorrelations of the 90 regions of interest using the automated anatomical labeling template, and analyzed using graphtheoretical approaches. The overall small-world property seen in ε4- was preserved in ε4+. However, both localclustering and path length were lower in ε4+ compared to ε4-. In terms of the hubs of functional networks, ε4+showed decreased centrality of the right hippocampus but increased centrality of several brain regions associatedwith the default mode network compared to ε4-. Our results indicate that genetic vulnerability to Alzheimer’s diseasemay alter whole-brain functional networks even before clinical symptoms appear.
Citation: Seo EH, Lee DY, Lee J-M, Park J-S, Sohn BK, et al. (2013) Influence of APOE Genotype on Whole-Brain Functional Networks in CognitivelyNormal Elderly. PLoS ONE 8(12): e83205. doi:10.1371/journal.pone.0083205
Editor: Yong He, Beijing Normal University,Beijing, China
Received April 15, 2013; Accepted November 11, 2013; Published December 11, 2013
Copyright: © 2013 Seo et al. This is an open-access article distributed under the terms of the Creative Commons Attribution License, which permitsunrestricted use, distribution, and reproduction in any medium, provided the original author and source are credited.
Funding: This study was supported by a grant from the Seoul National University Hospital (Grant No. 2012-0568), a grant from the Korea HealthcareTechnology R & D Project, Ministry of Health, Welfare & Family Affairs, Republic of Korea (Grant No. A092145), a grant from KIST Open ResearchProgram (Grant No. 2013-1520), and a grant from Korea government (MEST) (Grant No. 2011-0028333). The funders had no role in study design, datacollection and analysis, decision to publish, or preparation of the manuscript.
Competing interests: The authors have declared that no competing interests exist.
* E-mail: [email protected]
Introduction
Alzheimer’s disease (AD) is the most common cause ofdementia, and is characterized by progressive cognitive declineincluding memory impairment. The apolipoprotein E (APOE) ε4allele is a major genetic risk factor for late-onset AD and itsinheritance lowers the age at onset of AD [1,2]. Neuroimagingstudies on the influence of APOE ε4 allele on brain functionand structure in cognitively normal (CN) elderly individuals canprovide important clues for understanding the preclinical ADprocess which occurs in the brain.
The AD process is known to disrupt higher-order neuralnetworks, as well molecular pathways, neuronalsubpopulations, and local circuits in specific brain regions [3].Evidence from various clinical and preclinical studies [4]supports the idea of AD being a disconnection syndromeimplying that a network-based approach at the whole-brainlevel is critical to understand brain alterations and cognitivedeficits associated with the AD process.
Graph theoretical analysis provides a mathematical andconceptual framework for understanding the brain as a wholenetwork [5]. Graph theory allows capturing various aspects ofthe brain networks’ global topological organization as well aslocal contributions of each area to network function [6]. Manystudies have confirmed that the human brain has a “small-world” property including a much higher local clustering andsimilar path length compared to matched random networks,which provides a balance between local specialization andglobal integration to maximize the efficiency of informationprocessing [7–10]. Furthermore, as this approach primarilyconsiders the integration of each region of the brain into aglobal unit rather than regarding each region as independent, itprobably detects early subtle alterations with high sensitivity[9]. Nevertheless, whole-brain functional network propertiesbased on the graph theoretical approach have not yet beenexplored in cognitively normal (CN) individuals with AD riskgenes including the APOE ε4 allele.
Mounting evidence suggests that AD begins with subtlealteration of synaptic function [11]. Regional cerebral glucose
PLOS ONE | www.plosone.org 1 December 2013 | Volume 8 | Issue 12 | e83205
metabolism (rCMglc), measured by [18F] fluorodeoxyglucosepositron emission tomography (FDG-PET), is a reliable and ahighly sensitive index of synaptic function [12,13]. In line withthis, clinical AD patients show the typical pattern of regionalglucose hypometabolism. Even CN individuals with the geneticrisk or family history of AD were reported to show decreasedglucose metabolism in regions similar to those where ADpatients show typical hypometabolism [14–17].
Therefore, we aimed to investigate the influence of APOEε4allele on whole-brain functional networks in CN elderly peopleby applying graph theoretical analyses to the resting FDG-PETdata.
Materials and Methods
ParticipantsIn this study, 86 CN elderly, aged 55-84 years were included.
They were recruited among community-dwelling elderly peoplewho participated in a service program for the early detectionand management of dementia at three centers located inSeoul, Korea (two public health centers and one the Dementiaclinic of Seoul National University Hospital) from January 2007to September 2011. Participants underwent clinical evaluation,APOE genotyping, and resting FDG-PET scan. None of thesubjects had dementia or mild cognitive impairment, and theyall had received a clinical dementia rating [18] score of 0. Theexclusion criteria were presence of any serious medical,psychiatric, and neurological disorders that could affect themental function; evidence of focal brain lesions on magneticresonance imaging; presence of severe behavioral orcommunication problems that would make a clinicalexamination or FDG-PET scan difficult; left-handedness;absence of a reliable informant; and inability to read Korean.Individuals with minor physical abnormalities (e.g., diabeteswith no serious complications, essential hypertension, mildhearing loss, or others) were included. The Institutional ReviewBoard of the Seoul National University Hospital, Korea,approved the study protocol. All subjects gave written informedconsent.
Determination of the APOE GenotypeGenomic DNA was extracted from venous blood using
standard procedures. APOE genotyping was performedaccording to the previously described method [19].
Clinical and neuropsychological assessmentsAll subjects were examined by neuropsychiatrists, who had
advanced training in neuropsychiatry and dementia research,according to the Consortium to Establish a Registry forAlzheimer’s Disease (CERAD) clinical and neuropsychologicalassessment batteries. Standard administration of the CERADbattery has been described previously in detail [20,21]. Reliableinformants were interviewed to acquire accurate informationregarding the cognitive, emotional, and functional changes aswell as the subject’s medical history. A panel consisting of fourpsychiatrists with expertise in dementia research made the
clinical decisions after reviewing all available raw data fromclinical evaluations.
PET Image acquisition and preprocessingPET studies were performed using the ECAT EXACT 47
scanner (Siemens-CTI, Knoxville, Tenn., USA), which has anintrinsic resolution of 5.2-mm full width at half maximum(FWHM) and the images of 47 contiguous transverse planeswith a 3.4-mm thickness for a longitudinal field of view of 16.2cm. The mean interval between PET scan and clinicalassessment was 10 days. All of the [18F] FDG PET scans wereperformed in a dimly lit room with minimal auditory stimulationduring both the injection and PET scanning. Subjects wereplaced in the supine position with eyes closed during thescanning to minimize the confounding effects of any activity.More specific information on image acquisition procedures hasbeen described previously in detail [22].
Imaging data were preprocessed using Statistical ParametricMapping 2 (SPM2; Institute of Neurology, University College ofLondon, UK) implemented in the Matlab (Mathworks Inc, USA).Before statistical analysis, all images were spatially normalizedto the Montreal Neurological Institute (MNI; McGill University,Montreal, Canada) space. Normalized images were smoothedby convolution using an isotropic Gaussian kernel with 12 mmfull width at half maximum.
Construction of functional networks using graphtheoretical approaches
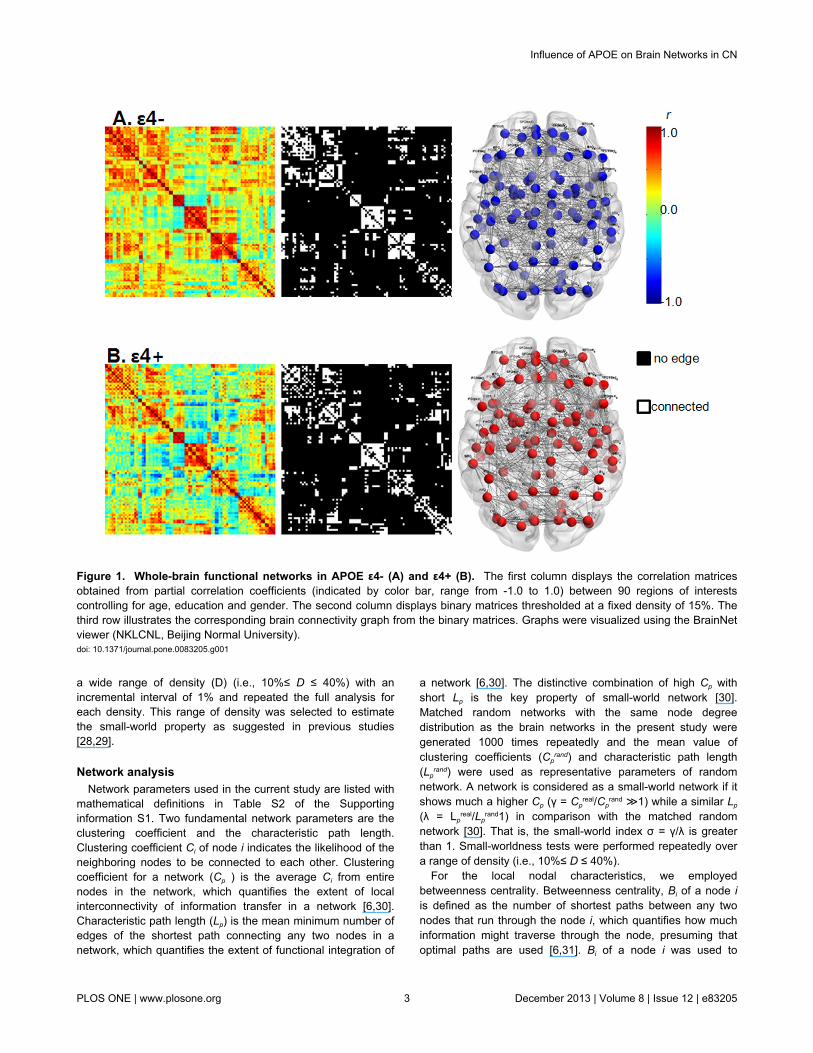
In graph theory, a network is a set of nodes and edgesbetween pairs of nodes [6]. In our study, nodes wererepresented by 90 regions of interest (ROI) defined usingautomated anatomical labeling (AAL) template [23], which hasbeen broadly used in brain network studies [7,24–26]. In theAAL template, 45 ROIs in each hemisphere except thecerebellum were defined based on an anatomical parcellationof MNI-normalized single-subject high-resolution T1 volume[23]. The whole-brain functional networks were constructedwith these 90 cortical and subcortical mean values of rCMglc(Table S1 in the informationS 1). The rCMglc of each ROI wasglobally normalized with respect to the mean metabolic rate forglucose in each individual’s whole brain. We selected theglobal normalization procedure because it has a higher signal-to-noise ratio compared to the cerebellar count normalizationmethod [27] and correlation coefficients are obtainedseparately for each diagnostic group. Interregional correlationmatrix (90X90) was acquired by partial correlation analysiscontrolling for the effects of age, gender, and education Thesepartial correlation coefficients between every pair of ROIsrepresent edges (i.e., functional connections between nodes).To avoid complicated statistical descriptions in the followingnetwork analysis, our graph theoretical analysis was confinedto a simple undirected and unweighted binary matrix (Figure 1).The interregional correlation matrix was then transformed into abinary matrix using the fixed density threshold method. Densityis the fraction of present connections to possible connections[6]. Fixed density threshold method ensures that the graphsfrom two study groups have the same number of edges [28].As there is no gold standard for a single threshold, we applied
Influence of APOE on Brain Networks in CN
PLOS ONE | www.plosone.org 2 December 2013 | Volume 8 | Issue 12 | e83205
a wide range of density (D) (i.e., 10%≤ D ≤ 40%) with anincremental interval of 1% and repeated the full analysis foreach density. This range of density was selected to estimatethe small-world property as suggested in previous studies[28,29].
Network analysisNetwork parameters used in the current study are listed with
mathematical definitions in Table S2 of the Supportinginformation S1. Two fundamental network parameters are theclustering coefficient and the characteristic path length.Clustering coefficient Ci of node i indicates the likelihood of theneighboring nodes to be connected to each other. Clusteringcoefficient for a network (Cp ) is the average Ci from entirenodes in the network, which quantifies the extent of localinterconnectivity of information transfer in a network [6,30].Characteristic path length (Lp) is the mean minimum number ofedges of the shortest path connecting any two nodes in anetwork, which quantifies the extent of functional integration of
a network [6,30]. The distinctive combination of high Cp withshort Lp is the key property of small-world network [30].Matched random networks with the same node degreedistribution as the brain networks in the present study weregenerated 1000 times repeatedly and the mean value ofclustering coefficients (Cp
rand) and characteristic path length(Lp
rand) were used as representative parameters of randomnetwork. A network is considered as a small-world network if itshows much a higher Cp (γ = Cp
real/Cprand ≫1) while a similar Lp
(λ = Lpreal/Lp
rand1) in comparison with the matched randomnetwork [30]. That is, the small-world index σ = γ/λ is greaterthan 1. Small-worldness tests were performed repeatedly overa range of density (i.e., 10%≤ D ≤ 40%).
For the local nodal characteristics, we employedbetweenness centrality. Betweenness centrality, Bi of a node iis defined as the number of shortest paths between any twonodes that run through the node i, which quantifies how muchinformation might traverse through the node, presuming thatoptimal paths are used [6,31]. Bi of a node i was used to
Figure 1. Whole-brain functional networks in APOE ε4- (A) and ε4+ (B). The first column displays the correlation matricesobtained from partial correlation coefficients (indicated by color bar, range from -1.0 to 1.0) between 90 regions of interestscontrolling for age, education and gender. The second column displays binary matrices thresholded at a fixed density of 15%. Thethird row illustrates the corresponding brain connectivity graph from the binary matrices. Graphs were visualized using the BrainNetviewer (NKLCNL, Beijing Normal University).doi: 10.1371/journal.pone.0083205.g001
Influence of APOE on Brain Networks in CN
PLOS ONE | www.plosone.org 3 December 2013 | Volume 8 | Issue 12 | e83205
determine candidate hubs in a network. The Bi was normalizedas bi= Bi /averaged Bi for all nodes of the entire network. Thenodes that have a high bi (>1.5) are considered as functionalhubs of a network. The bi of each node was calculated at afixed density of 15%. Certain density threshold, which ensuresthat all of the 90 ROIs are included and false-positive paths areminimized, was determined as a fixed density. The lowestdensity where the largest component size was 90 (i.e., allconnected nodes included) was density of 15% in the presentstudy.
Calculations of these network parameters were performedusing ‘Brain connectivity analysis software’ (http://www.brain-connectivity-toolbox.net) [6] and the MatlabBGL package(http://www.stanford.edu/~dgleich/progrma/matlab_bgl/).
Statistical analysesDifferences in rCMglc between groups were measured on a
voxel-by-voxel basis using the 2-sample t test (p < 0.001,uncorrected for multiple comparisons). Between-groupdifferences in network parameters (Cp, Lp, and bi) were testedusing a nonparametric permutation test with 5000 repetitionsand the 95 percentile scores of each difference-distributionwere considered as the critical values (p<0.05, one-tailed)[28,32]. To test if the observed group difference occurred bychance (the null hypothesis), we randomly reassigned eachparticipant’s 90 ROI rCMglc values to one of the two groups.After the randomization procedure, the interregional correlationmatrix was calculated again and a set of binary matrices wasalso obtained over the same density threshold range as in thereal brain networks. Cp, Lp, σ, and bi were calculated in eachnetwork separately, and then between-group differences in thenetwork parameters were obtained. This procedure wasrepeated 5000 times and the 95 percentile scores of eachdifference-distribution were considered as the critical values(p<0.05, one-tailed). This nonparametric permutation testprocedure was performed repeatedly at 10%≤D≤40%. We didnot make any adjustment for multiple comparisons because wetried to explore the general trends of between-groupdifferences through the wide range of density level rather thanputting a separate and specific interpretation on the result at acertain density level.
Results
Subject characteristicsDemographic and neuropsychological characteristics of all
the subjects are summarized in Table 1.Twenty-eight subjectswere ε4+ (all carried the ε3/ε4 allele) and 58 were ε4- (8subjects carried the ε2/ε3 allele and 50 subjects carried the ε3/ε3 allele). There were no significant differences betweengroups in age, gender, education, and eight cognitive testscores.
Comparison of rCMglcCompared to ε4-, ε4+ showed a significant decrease in
rCMglc in the bilateral cuneus, whereas ε4+ showed an
increase in rCMglc in the left frontal regions and bilateraltemporal gyri (Figure 2 and Table 2).
Global network properties and their alterations in APOEε4 carriers
Both groups demonstrated small-world property (σ >1) overan entire range of density (Figure 3A). Between-groupcomparison revealed that σ was not significantly different. Onthe other hand, in terms of individual parameters, ε4+ showeda significantly lower Cp than ε4- at a density of 28%, and a non-significant trend toward lower Cp over a wide range of density(Figure 3B). ε4+ also showed a significantly shorter Lp than ε4-at a density of 10% and 11%, and a non-significant trendtoward shorter Lp over a wide range of density (Figure 3C).
Functional hubs and their alterations in APOE ε4carriers
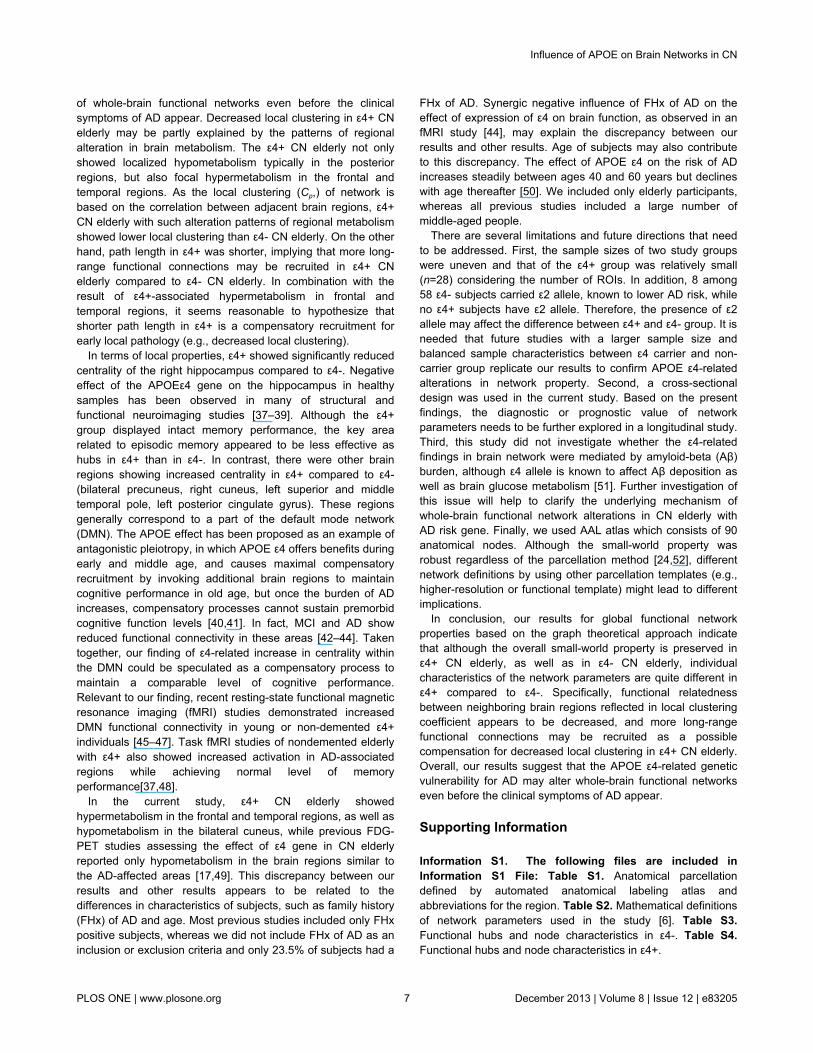
The number of identified hubs was reduced in ε4+ comparedwith ε4- (26 hubs for ε4- vs. 17 hubs for ε4+). A majority ofhubs were identified in the multimodal or unimodal associationcortex in both groups. However, specific hub regions weredissimilar. In ε4-, hubs were located mainly in the frontal andtemporal lobes, such as the bilateral inferior frontal regions,bilateral middle frontal gyri, right hippocampus, rightparahippocampal gyrus and bilateral temporal gyri. On theother hand, in ε4+, hubs were located mainly in the posteriorregions and the cingulate regions, such as the bilateralprecuneus, right cuneus, bilateral middle cingulate gyri andright anterior cingulate (Tables S3 and S4). Further statisticalanalysis revealed that ε4+ showed a significant decrease in bi
in the right hippocampus than ε4- (bi =0.14 for ε4+, bi = 2.23 forε4-). In contrast, ε4+ showed a significant increase in bi in thebilateral precuneus, left superior temporal pole, and rightcuneus (Figure 4).
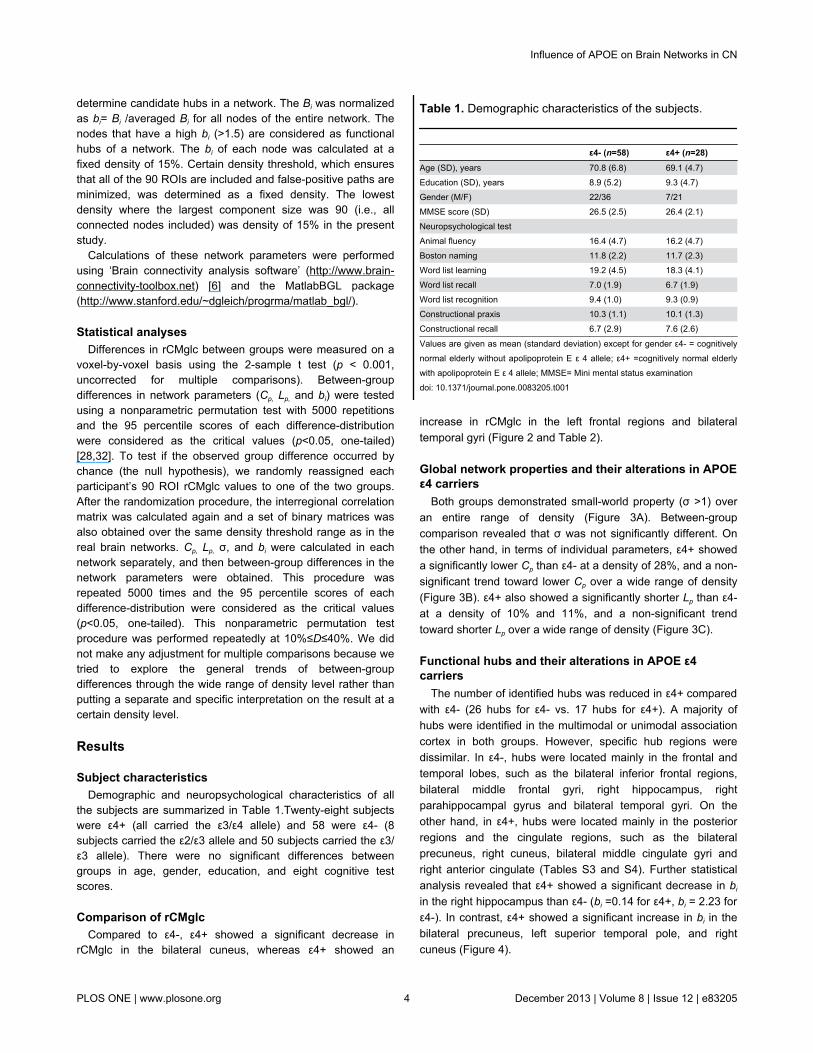
Table 1. Demographic characteristics of the subjects.
ε4- (n=58) ε4+ (n=28)Age (SD), years 70.8 (6.8) 69.1 (4.7)Education (SD), years 8.9 (5.2) 9.3 (4.7)Gender (M/F) 22/36 7/21MMSE score (SD) 26.5 (2.5) 26.4 (2.1)Neuropsychological test Animal fluency 16.4 (4.7) 16.2 (4.7)Boston naming 11.8 (2.2) 11.7 (2.3)Word list learning 19.2 (4.5) 18.3 (4.1)Word list recall 7.0 (1.9) 6.7 (1.9)Word list recognition 9.4 (1.0) 9.3 (0.9)Constructional praxis 10.3 (1.1) 10.1 (1.3)Constructional recall 6.7 (2.9) 7.6 (2.6)
Values are given as mean (standard deviation) except for gender ε4- = cognitivelynormal elderly without apolipoprotein E ε 4 allele; ε4+ =cognitively normal elderlywith apolipoprotein E ε 4 allele; MMSE= Mini mental status examinationdoi: 10.1371/journal.pone.0083205.t001
Influence of APOE on Brain Networks in CN
PLOS ONE | www.plosone.org 4 December 2013 | Volume 8 | Issue 12 | e83205
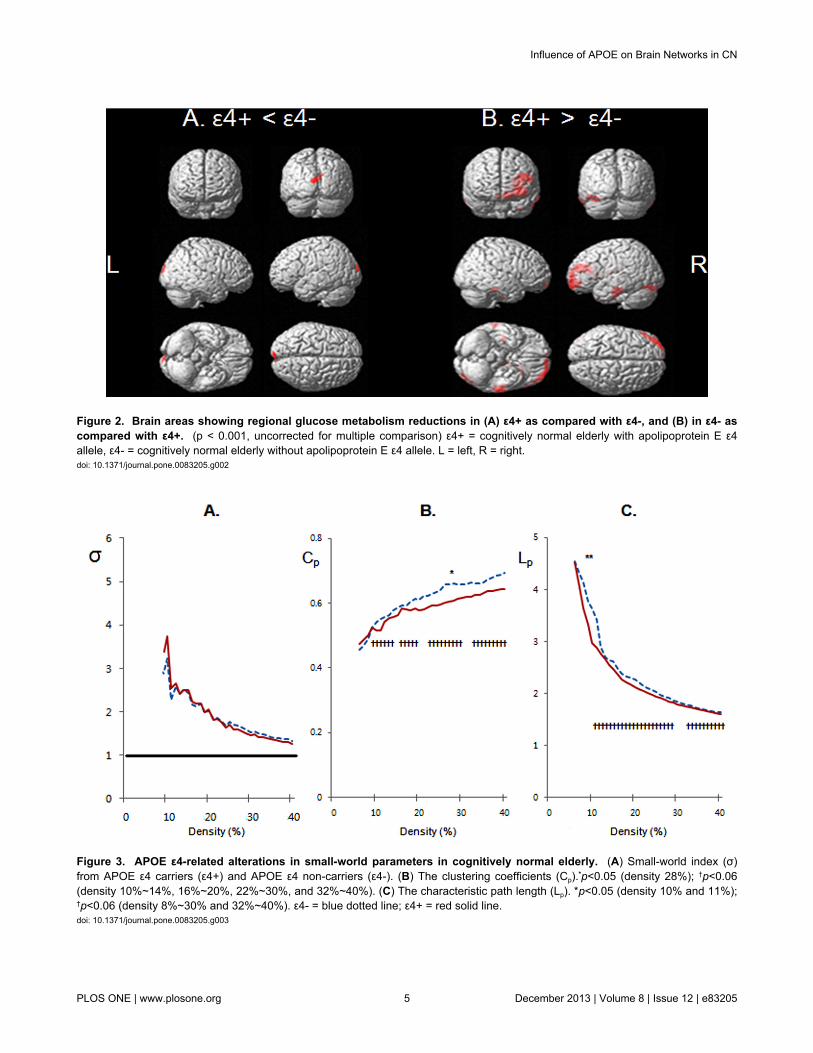
Figure 2. Brain areas showing regional glucose metabolism reductions in (A) ε4+ as compared with ε4-, and (B) in ε4- ascompared with ε4+. (p < 0.001, uncorrected for multiple comparison) ε4+ = cognitively normal elderly with apolipoprotein E ε4allele, ε4- = cognitively normal elderly without apolipoprotein E ε4 allele. L = left, R = right.doi: 10.1371/journal.pone.0083205.g002
Figure 3. APOE ε4-related alterations in small-world parameters in cognitively normal elderly. (A) Small-world index (σ)from APOE ε4 carriers (ε4+) and APOE ε4 non-carriers (ε4-). (B) The clustering coefficients (Cp).*p<0.05 (density 28%); †p<0.06(density 10%~14%, 16%~20%, 22%~30%, and 32%~40%). (C) The characteristic path length (Lp). *p<0.05 (density 10% and 11%);†p<0.06 (density 8%~30% and 32%~40%). ε4- = blue dotted line; ε4+ = red solid line.doi: 10.1371/journal.pone.0083205.g003
Influence of APOE on Brain Networks in CN
PLOS ONE | www.plosone.org 5 December 2013 | Volume 8 | Issue 12 | e83205
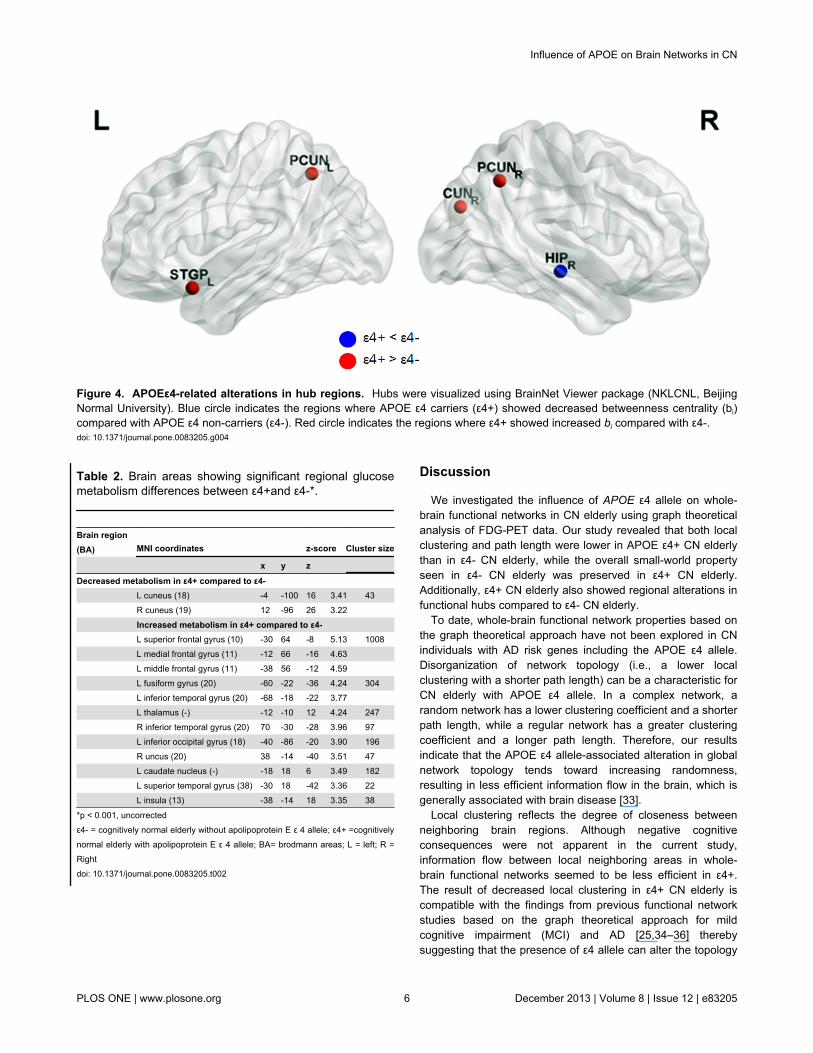
Table 2. Brain areas showing significant regional glucosemetabolism differences between ε4+and ε4-*.
Brain region(BA) MNI coordinates z-score Cluster size
x y z
Decreased metabolism in ε4+ compared to ε4- L cuneus (18) -4 -100 16 3.41 43 R cuneus (19) 12 -96 26 3.22 Increased metabolism in ε4+ compared to ε4- L superior frontal gyrus (10) -30 64 -8 5.13 1008 L medial frontal gyrus (11) -12 66 -16 4.63 L middle frontal gyrus (11) -38 56 -12 4.59 L fusiform gyrus (20) -60 -22 -36 4.24 304 L inferior temporal gyrus (20) -68 -18 -22 3.77 L thalamus (-) -12 -10 12 4.24 247 R inferior temporal gyrus (20) 70 -30 -28 3.96 97 L inferior occipital gyrus (18) -40 -86 -20 3.90 196 R uncus (20) 38 -14 -40 3.51 47 L caudate nucleus (-) -18 18 6 3.49 182 L superior temporal gyrus (38) -30 18 -42 3.36 22 L insula (13) -38 -14 18 3.35 38
*p < 0.001, uncorrectedε4- = cognitively normal elderly without apolipoprotein E ε 4 allele; ε4+ =cognitivelynormal elderly with apolipoprotein E ε 4 allele; BA= brodmann areas; L = left; R =Rightdoi: 10.1371/journal.pone.0083205.t002
Discussion
We investigated the influence of APOE ε4 allele on whole-brain functional networks in CN elderly using graph theoreticalanalysis of FDG-PET data. Our study revealed that both localclustering and path length were lower in APOE ε4+ CN elderlythan in ε4- CN elderly, while the overall small-world propertyseen in ε4- CN elderly was preserved in ε4+ CN elderly.Additionally, ε4+ CN elderly also showed regional alterations infunctional hubs compared to ε4- CN elderly.
To date, whole-brain functional network properties based onthe graph theoretical approach have not been explored in CNindividuals with AD risk genes including the APOE ε4 allele.Disorganization of network topology (i.e., a lower localclustering with a shorter path length) can be a characteristic forCN elderly with APOE ε4 allele. In a complex network, arandom network has a lower clustering coefficient and a shorterpath length, while a regular network has a greater clusteringcoefficient and a longer path length. Therefore, our resultsindicate that the APOE ε4 allele-associated alteration in globalnetwork topology tends toward increasing randomness,resulting in less efficient information flow in the brain, which isgenerally associated with brain disease [33].
Local clustering reflects the degree of closeness betweenneighboring brain regions. Although negative cognitiveconsequences were not apparent in the current study,information flow between local neighboring areas in whole-brain functional networks seemed to be less efficient in ε4+.The result of decreased local clustering in ε4+ CN elderly iscompatible with the findings from previous functional networkstudies based on the graph theoretical approach for mildcognitive impairment (MCI) and AD [25,34–36] therebysuggesting that the presence of ε4 allele can alter the topology
Figure 4. APOEε4-related alterations in hub regions. Hubs were visualized using BrainNet Viewer package (NKLCNL, BeijingNormal University). Blue circle indicates the regions where APOE ε4 carriers (ε4+) showed decreased betweenness centrality (bi)compared with APOE ε4 non-carriers (ε4-). Red circle indicates the regions where ε4+ showed increased bi compared with ε4-.doi: 10.1371/journal.pone.0083205.g004
Influence of APOE on Brain Networks in CN
PLOS ONE | www.plosone.org 6 December 2013 | Volume 8 | Issue 12 | e83205
of whole-brain functional networks even before the clinicalsymptoms of AD appear. Decreased local clustering in ε4+ CNelderly may be partly explained by the patterns of regionalalteration in brain metabolism. The ε4+ CN elderly not onlyshowed localized hypometabolism typically in the posteriorregions, but also focal hypermetabolism in the frontal andtemporal regions. As the local clustering (Cp,) of network isbased on the correlation between adjacent brain regions, ε4+CN elderly with such alteration patterns of regional metabolismshowed lower local clustering than ε4- CN elderly. On the otherhand, path length in ε4+ was shorter, implying that more long-range functional connections may be recruited in ε4+ CNelderly compared to ε4- CN elderly. In combination with theresult of ε4+-associated hypermetabolism in frontal andtemporal regions, it seems reasonable to hypothesize thatshorter path length in ε4+ is a compensatory recruitment forearly local pathology (e.g., decreased local clustering).
In terms of local properties, ε4+ showed significantly reducedcentrality of the right hippocampus compared to ε4-. Negativeeffect of the APOEε4 gene on the hippocampus in healthysamples has been observed in many of structural andfunctional neuroimaging studies [37–39]. Although the ε4+group displayed intact memory performance, the key arearelated to episodic memory appeared to be less effective ashubs in ε4+ than in ε4-. In contrast, there were other brainregions showing increased centrality in ε4+ compared to ε4-(bilateral precuneus, right cuneus, left superior and middletemporal pole, left posterior cingulate gyrus). These regionsgenerally correspond to a part of the default mode network(DMN). The APOE effect has been proposed as an example ofantagonistic pleiotropy, in which APOE ε4 offers benefits duringearly and middle age, and causes maximal compensatoryrecruitment by invoking additional brain regions to maintaincognitive performance in old age, but once the burden of ADincreases, compensatory processes cannot sustain premorbidcognitive function levels [40,41]. In fact, MCI and AD showreduced functional connectivity in these areas [42–44]. Takentogether, our finding of ε4-related increase in centrality withinthe DMN could be speculated as a compensatory process tomaintain a comparable level of cognitive performance.Relevant to our finding, recent resting-state functional magneticresonance imaging (fMRI) studies demonstrated increasedDMN functional connectivity in young or non-demented ε4+individuals [45–47]. Task fMRI studies of nondemented elderlywith ε4+ also showed increased activation in AD-associatedregions while achieving normal level of memoryperformance[37,48].
In the current study, ε4+ CN elderly showedhypermetabolism in the frontal and temporal regions, as well ashypometabolism in the bilateral cuneus, while previous FDG-PET studies assessing the effect of ε4 gene in CN elderlyreported only hypometabolism in the brain regions similar tothe AD-affected areas [17,49]. This discrepancy between ourresults and other results appears to be related to thedifferences in characteristics of subjects, such as family history(FHx) of AD and age. Most previous studies included only FHxpositive subjects, whereas we did not include FHx of AD as aninclusion or exclusion criteria and only 23.5% of subjects had a
FHx of AD. Synergic negative influence of FHx of AD on theeffect of expression of ε4 on brain function, as observed in anfMRI study [44], may explain the discrepancy between ourresults and other results. Age of subjects may also contributeto this discrepancy. The effect of APOE ε4 on the risk of ADincreases steadily between ages 40 and 60 years but declineswith age thereafter [50]. We included only elderly participants,whereas all previous studies included a large number ofmiddle-aged people.
There are several limitations and future directions that needto be addressed. First, the sample sizes of two study groupswere uneven and that of the ε4+ group was relatively small(n=28) considering the number of ROIs. In addition, 8 among58 ε4- subjects carried ε2 allele, known to lower AD risk, whileno ε4+ subjects have ε2 allele. Therefore, the presence of ε2allele may affect the difference between ε4+ and ε4- group. It isneeded that future studies with a larger sample size andbalanced sample characteristics between ε4 carrier and non-carrier group replicate our results to confirm APOE ε4-relatedalterations in network property. Second, a cross-sectionaldesign was used in the current study. Based on the presentfindings, the diagnostic or prognostic value of networkparameters needs to be further explored in a longitudinal study.Third, this study did not investigate whether the ε4-relatedfindings in brain network were mediated by amyloid-beta (Aβ)burden, although ε4 allele is known to affect Aβ deposition aswell as brain glucose metabolism [51]. Further investigation ofthis issue will help to clarify the underlying mechanism ofwhole-brain functional network alterations in CN elderly withAD risk gene. Finally, we used AAL atlas which consists of 90anatomical nodes. Although the small-world property wasrobust regardless of the parcellation method [24,52], differentnetwork definitions by using other parcellation templates (e.g.,higher-resolution or functional template) might lead to differentimplications.
In conclusion, our results for global functional networkproperties based on the graph theoretical approach indicatethat although the overall small-world property is preserved inε4+ CN elderly, as well as in ε4- CN elderly, individualcharacteristics of the network parameters are quite different inε4+ compared to ε4-. Specifically, functional relatednessbetween neighboring brain regions reflected in local clusteringcoefficient appears to be decreased, and more long-rangefunctional connections may be recruited as a possiblecompensation for decreased local clustering in ε4+ CN elderly.Overall, our results suggest that the APOE ε4-related geneticvulnerability for AD may alter whole-brain functional networkseven before the clinical symptoms of AD appear.
Supporting Information
Information S1. The following files are included inInformation S1 File: Table S1. Anatomical parcellationdefined by automated anatomical labeling atlas andabbreviations for the region. Table S2. Mathematical definitionsof network parameters used in the study [6]. Table S3.Functional hubs and node characteristics in ε4-. Table S4.Functional hubs and node characteristics in ε4+.
Influence of APOE on Brain Networks in CN
PLOS ONE | www.plosone.org 7 December 2013 | Volume 8 | Issue 12 | e83205
(DOC)
Author Contributions
Conceived and designed the experiments: EHS DYL.Performed the experiments: EHS DYL BKS YMC MSB HJC
JIW. Analyzed the data: EHS DYL JML JSP. Contributedreagents/materials/analysis tools: DYL JML JSP. Wrote themanuscript: EHS DYL JML JSP BKS YMC MSB HJC JIW.
References
1. Bertram L, McQueen MB, Mullin K, Blacker D, Tanzi RE (2007)Systematic meta-analyses of Alzheimer disease genetic associationstudies: the AlzGene database. Nat Genet 39: 17-23. doi:10.1038/ng1934. PubMed: 17192785.
2. Corder EH, Saunders AM, Strittmatter WJ, Schmechel DE, Gaskell PCet al. (1993) Gene dose of apolipoprotein E type 4 allele and the risk ofAlzheimer's disease in late onset families. Science 261: 921-923. doi:10.1126/science.8346443. PubMed: 8346443.
3. Palop JJ, Chin J, Mucke L (2006) A network dysfunction perspective onneurodegenerative diseases. Nature 443: 768-773. doi:10.1038/nature05289. PubMed: 17051202.
4. Delbeuck X, Van der Linden M, Collette F (2003) Alzheimer's diseaseas a disconnection syndrome? Neuropsychol Rev 13: 79-92. doi:10.1023/A:1023832305702. PubMed: 12887040.
5. Sporns O, Chialvo DR, Kaiser M, Hilgetag CC (2004) Organization,development and function of complex brain networks. Trends Cogn Sci8: 418-425. doi:10.1016/j.tics.2004.07.008. PubMed: 15350243.
6. Rubinov M, Sporns O (2010) Complex network measures of brainconnectivity: uses and interpretations. NeuroImage 52: 1059-1069. doi:10.1016/j.neuroimage.2009.10.003. PubMed: 19819337.
7. Achard S, Salvador R, Whitcher B, Suckling J, Bullmore E (2006) Aresilient, low-frequency, small-world human brain functional networkwith highly connected association cortical hubs. J Neurosci 26: 63-72.doi:10.1523/JNEUROSCI.3874-05.2006. PubMed: 16399673.
8. He Y, Chen ZJ, Evans AC (2007) Small-world anatomical networks inthe human brain revealed by cortical thickness from MRI. Cereb Cortex17: 2407-2419. doi:10.1093/cercor/bhl149. PubMed: 17204824.
9. Brown JA, Terashima KH, Burggren AC, Ercoli LM, Miller KJ et al.(2011) Brain network local interconnectivity loss in aging APOE-4 allelecarriers. Proc Natl Acad Sci U S A 108: 20760-20765. doi:10.1073/pnas.1109038108. PubMed: 22106308.
10. Stam CJ, Jones BF, Nolte G, Breakspear M, Scheltens P (2007) Small-world networks and functional connectivity in Alzheimer's disease.Cereb Cortex 17: 92-99. PubMed: 16452642.
11. Selkoe DJ (2002) Alzheimer's disease is a synaptic failure. Science298: 789-791. doi:10.1126/science.1074069. PubMed: 12399581.
12. Jueptner M, Weiller C (1995) Review: does measurement of regionalcerebral blood flow reflect synaptic activity? Implications for PET andfMRI. NeuroImage 2: 148-156. doi:10.1006/nimg.1995.1017. PubMed:9343597.
13. Sokoloff L (1981) Relationships among local functional activity, energymetabolism, and blood flow in the central nervous system. Fed Proc 40:2311-2316. PubMed: 7238911.
14. Mosconi L, Rinne JO, Tsui WH, Murray J, Li Y et al. (2013) Amyloidand metabolic positron emission tomography imaging of cognitivelynormal adults with Alzheimer's parents. Neurobiol Aging 34: 22-34. doi:10.1016/j.neurobiolaging.2012.03.002. PubMed: 22503001.
15. Reiman EM, Caselli RJ, Chen K, Alexander GE, Bandy D et al. (2001)Declining brain activity in cognitively normal apolipoprotein E epsilon 4heterozygotes: A foundation for using positron emission tomography toefficiently test treatments to prevent. Journal of Alzheimer'S Disease -Proc Natl Acad Sci U S A 98: 3334-3339. doi:10.1073/pnas.061509598.
16. Reiman EM, Chen K, Alexander GE, Caselli RJ, Bandy D et al. (2005)Correlations between apolipoprotein E epsilon4 gene dose and brain-imaging measurements of regional hypometabolism. Proc Natl AcadSci U S A 102: 8299-8302. doi:10.1073/pnas.0500579102. PubMed:15932949.
17. Small GW, Ercoli LM, Silverman DH, Huang SC, Komo S et al. (2000)Cerebral metabolic and cognitive decline in persons at genetic risk forAlzheimer's disease. Proc Natl Acad Sci U S A 97: 6037-6042. doi:10.1073/pnas.090106797. PubMed: 10811879.
18. Morris JC (1993) The Clinical Dementia Rating (CDR): current versionand scoring rules. Neurology 43: 2412-2414. doi:10.1212/WNL.43.11.2412-a. PubMed: 8232972.
19. Kim KW, Youn JC, Jhoo JH, Lee DY, Lee KU et al. (2002)Apolipoprotein E epsilon 4 allele is not associated with the cognitive
impairment in community-dwelling normal elderly individuals. Int JGeriatr Psychiatry 17: 635-640. doi:10.1002/gps.664. PubMed:12112161.
20. Lee JH, Lee KU, Lee DY, Kim KW, Jhoo JH et al. (2002) Developmentof the Korean version of the Consortium to Establish a Registry forAlzheimer's Disease Assessment Packet (CERAD-K): clinical andneuropsychological assessment batteries. J Gerontol B Psychol SciSoc Sci 57: 47-53. doi:10.1093/geronb/57.1.P47. PubMed: 11773223.
21. Lee DY, Lee KU, Lee JH, Kim KW, Jhoo JH et al. (2004) A normativestudy of the CERAD neuropsychological assessment battery in theKorean elderly. J Int Neuropsychol Soc 10: 72-81. PubMed: 14751009.
22. Jhoo JH, Lee DY, Choo IH, Seo EH, Oh JS et al. (2010) Discriminationof normal aging, MCI and AD with multimodal imaging measures on themedial temporal lobe. Psychiatry Res 183: 237-243. doi:10.1016/j.pscychresns.2010.03.006. PubMed: 20705437.
23. Tzourio-Mazoyer N, Landeau B, Papathanassiou D, Crivello F, Etard Oet al. (2002) Automated anatomical labeling of activations in SPM usinga macroscopic anatomical parcellation of the MNI MRI single-subjectbrain. NeuroImage 15: 273-289. doi:10.1006/nimg.2001.0978. PubMed:11771995.
24. Sanz-Arigita EJ, Schoonheim MM, Damoiseaux JS, Rombouts SA,Maris E et al. (2010) Loss of 'small-world' networks in Alzheimer'sdisease: graph analysis of FMRI resting-state functional connectivity.PLOS ONE 5: e13788. doi:10.1371/journal.pone.0013788. PubMed:21072180.
25. Supekar K, Menon V, Rubin D, Musen M, Greicius MD (2008) Networkanalysis of intrinsic functional brain connectivity in Alzheimer's disease.PLoS Comput Biol 4: e1000100. PubMed: 18584043.
26. Yao Z, Zhang Y, Lin L, Zhou Y, Xu C et al. (2010) Abnormal corticalnetworks in mild cognitive impairment and Alzheimer's disease. PLoSComput Biol 6: e1001006. PubMed: 21124954.
27. Dukart J, Mueller K, Horstmann A, Vogt B, Frisch S et al. (2010)Differential effects of global and cerebellar normalization on detectionand differentiation of dementia in FDG-PET studies. NeuroImage 49:1490-1495. doi:10.1016/j.neuroimage.2009.09.017. PubMed:19770055.
28. He Y, Chen Z, Evans A (2008) Structural insights into aberranttopological patterns of large-scale cortical networks in Alzheimer'sdisease. J Neurosci 28: 4756-4766. doi:10.1523/JNEUROSCI.0141-08.2008. PubMed: 18448652.
29. Zhu W, Wen W, He Y, Xia A, Anstey KJ et al. (2012) Changingtopological patterns in normal aging using large-scale structuralnetworks. Neurobiol Aging, 33: 899–913. PubMed: 20724031.
30. Watts DJ, Strogatz SH (1998) Collective dynamics of 'small-world'networks. Nature 393: 440-442. doi:10.1038/30918. PubMed: 9623998.
31. Power JD, Fair DA, Schlaggar BL, Petersen SE (2010) Thedevelopment of human functional brain networks. Neuron 67: 735-748.doi:10.1016/j.neuron.2010.08.017. PubMed: 20826306.
32. Bullmore E, Sporns O (2009) Complex brain networks: graphtheoretical analysis of structural and functional systems. Nat RevNeurosci 10: 186-198. doi:10.1038/nrn2575. PubMed: 19190637.
33. Sporns O (2011) The non-random brain: efficiency, economy, andcomplex dynamics. Front - Journal of Comput Neuroscience 5: 5.PubMed: 21369354.
34. Buldú JM, Bajo R, Maestú F, Castellanos N, Leyva I et al. (2011)Reorganization of functional networks in mild cognitive impairment.PLOS ONE 6: e19584. doi:10.1371/journal.pone.0019584. PubMed:21625430.
35. Seo EH, Lee DY, Lee J-M, Park J-S, Sohn BK et al. (2013) Whole-brainFunctional Networks in Cognitively Normal, Mild Cognitive Impairment,and Alzheimer’s Disease. PLOS ONE 8: e53922. doi:10.1371/journal.pone.0053922. PubMed: 23335980.
36. Stam CJ, de Haan W, Daffertshofer A, Jones BF, Manshanden I et al.(2009) Graph theoretical analysis of magnetoencephalographicfunctional connectivity in Alzheimer's disease. Brain 132: 213-224.PubMed: 18952674.
Influence of APOE on Brain Networks in CN
PLOS ONE | www.plosone.org 8 December 2013 | Volume 8 | Issue 12 | e83205
37. Bondi MW, Houston WS, Eyler LT, Brown GG (2005) fMRI evidence ofcompensatory mechanisms in older adults at genetic risk for Alzheimerdisease. Neurology 64: 501-508. doi:10.1212/01.WNL.0000150885.00929.7E. PubMed: 15699382.
38. Lemaître H, Crivello F, Dufouil C, Grassiot B, Tzourio C et al. (2005) Noepsilon4 gene dose effect on hippocampal atrophy in a large MRIdatabase of healthy elderly subjects. NeuroImage 24: 1205-1213. doi:10.1016/j.neuroimage.2004.10.016. PubMed: 15670698.
39. Lind J, Larsson A, Persson J, Ingvar M, Nilsson LG et al. (2006)Reduced hippocampal volume in non-demented carriers of theapolipoprotein E epsilon4: relation to chronological age and recognitionmemory. Neurosci Lett 396: 23-27. doi:10.1016/j.neulet.2005.11.070.PubMed: 16406347.
40. Chen TF, Lin CC, Chen YF, Liu HM, Hua MS et al. (2009) Diffusiontensor changes in patients with amnesic mild cognitive impairment andvarious dementias. Psychiatry Res 173: 15-21. doi:10.1016/j.pscychresns.2008.09.002. PubMed: 19442496.
41. Tuminello ER, Han SD (2011) The apolipoprotein e antagonisticpleiotropy hypothesis: review and recommendations. Int J AlzheimersDis 2011: 726197
42. Pihlajamäki M, Sperling RA (2009) Functional MRI assessment of task-induced deactivation of the default mode network in Alzheimer'sdisease and at-risk older individuals. Behav Neurol 21: 77-91. PubMed:19847047.
43. Sorg C, Riedl V, Mühlau M, Calhoun VD, Eichele T et al. (2007)Selective changes of resting-state networks in individuals at risk forAlzheimer's disease. Proc Natl Acad Sci U S A 104: 18760-18765. doi:10.1073/pnas.0708803104. PubMed: 18003904.
44. Sperling RA, Dickerson BC, Pihlajamaki M, Vannini P, LaViolette PS etal. (2010) Functional alterations in memory networks in early. Journal ofAlzheimer'S Disease - Neuromolecular Med 12: 27-43.
45. Filippini N, MacIntosh BJ, Hough MG, Goodwin GM, Frisoni GB et al.(2009) Distinct patterns of brain activity in young carriers of the APOE-
epsilon4 allele. Proc Natl Acad Sci U S A 106: 7209-7214. doi:10.1073/pnas.0811879106. PubMed: 19357304.
46. Fleisher AS, Sherzai A, Taylor C, Langbaum JB, Chen K et al. (2009)Resting-state BOLD networks versus task-associated functional MRIfor distinguishing Alzheimer's disease risk groups. NeuroImage 47:1678-1690. doi:10.1016/j.neuroimage.2009.06.021. PubMed:19539034.
47. Westlye ET, Lundervold A, Rootwelt H, Lundervold AJ, Westlye LT(2011) Increased hippocampal default mode synchronization duringrest in middle-aged and elderly APOE epsilon4 carriers: relationshipswith memory performance. J Neurosci 31: 7775-7783. doi:10.1523/JNEUROSCI.1230-11.2011. PubMed: 21613490.
48. Bookheimer SY, Strojwas MH, Cohen MS, Saunders AM, Pericak-Vance MA et al. (2000) Patterns of brain activation in people at risk forAlzheimer's disease. N Engl J Med 343: 450-456. doi:10.1056/NEJM200008173430701. PubMed: 10944562.
49. Reiman EM, Caselli RJ, Yun LS, Chen K, Bandy D et al. (1996)Preclinical evidence of Alzheimer's disease in persons homozygous forthe epsilon 4 allele for apolipoprotein E. N Engl J Med 334: 752-758.doi:10.1056/NEJM199603213341202. PubMed: 8592548.
50. Farrer LA, Cupples LA, Haines JL, Hyman B, Kukull WA et al. (1997)Effects of age, sex, and ethnicity on the association betweenapolipoprotein E genotype and Alzheimer disease. A meta-analysis.APOE and Alzheimer Disease Meta Analysis Consortium. JAMA 278:1349-1356. doi:10.1001/jama.1997.03550160069041. PubMed:9343467.
51. Reiman EM, Chen K, Liu X, Bandy D, Yu M et al. (2009) Fibrillaramyloid-beta burden in cognitively normal people at 3 levels of geneticrisk for Alzheimer's disease. Proc Natl Acad Sci U S A 106: 6820-6825.doi:10.1073/pnas.0900345106. PubMed: 19346482.
52. Wang J, Wang L, Zang Y, Yang H, Tang H et al. (2009) Parcellation-dependent small-world brain functional networks: a resting-state fMRIstudy. Hum Brain Mapp 30: 1511-1523. doi:10.1002/hbm.20623.PubMed: 18649353.
Influence of APOE on Brain Networks in CN
PLOS ONE | www.plosone.org 9 December 2013 | Volume 8 | Issue 12 | e83205
Copyright © 2022 FDOKUMEN