Machine-Learning-Based Elderly Stroke Monitoring ... - MDPI
18
applied sciences Article Machine-Learning-Based Elderly Stroke Monitoring System Using Electroencephalography Vital Signals Yoon-A Choi 1 , Sejin Park 2 , Jong-Arm Jun 1 , Chee Meng Benjamin Ho 3 , Cheol-Sig Pyo 1 , Hansung Lee 4 and Jaehak Yu 1, * Citation: Choi, Y.-A; Park, S.; Jun, J.-A.; Ho, C.M.B.; Pyo, C.-S.; Lee, H.; Yu, J. Machine-Learning-Based Elderly Stroke Monitoring System Using Electroencephalography Vital Signals. Appl. Sci. 2021, 11, 1761. https://doi.org/10.3390/app11041761 Academic Editor: José Ignacio Serrano Received: 30 January 2021 Accepted: 12 February 2021 Published: 17 February 2021 Publisher’s Note: MDPI stays neutral with regard to jurisdictional claims in published maps and institutional affil- iations. Copyright: © 2021 by the authors. Licensee MDPI, Basel, Switzerland. This article is an open access article distributed under the terms and conditions of the Creative Commons Attribution (CC BY) license (https:// creativecommons.org/licenses/by/ 4.0/). 1 Department of KSB Convergence Research, Electronics and Telecommunications Research Institute (ETRI), Daejeon 34129, Korea; [email protected] (Y.-AC.); [email protected] (J.-A.J.); [email protected] (C.-S.P.) 2 Research Team for Health & Safety Convergence, Korea Research Institute of Standards and Science (KRISS), Daejeon 34113, Korea; [email protected] 3 AI Research Team, Sewon Intelligence Company, 35 Sejong-daero, Jung-gu, Seoul 04512, Korea; [email protected] 4 School of Computer Engineering, Youngsan University, 288 Junam-Ro, Yangsan, Gyeongnam 50510, Korea; [email protected] * Correspondence: [email protected]; Tel.: +82-42-860-6794 Abstract: Stroke is the third highest cause of death worldwide after cancer and heart disease, and the number of stroke diseases due to aging is set to at least triple by 2030. As the top three causes of death worldwide are all related to chronic disease, the importance of healthcare is increasing even more. Models that can predict real-time health conditions and diseases using various healthcare services are attracting increasing attention. Most diagnosis and prediction methods of stroke for the elderly involve imaging techniques such as magnetic resonance imaging (MRI). It is difficult to rapidly and accurately diagnose and predict stroke diseases due to the long testing times and high costs associated with MRI. Thus, in this paper, we design and implement a health monitoring system that can predict the precursors of stroke diseases in the elderly in real time during daily walking. First, raw electroencephalography (EEG) data from six channels were preprocessed via Fast Fourier Transform (FFT). The raw EEG power values were then extracted from the raw spectra: alpha (α), beta ( β), gamma (γ), delta (δ), and theta (θ) as well as the low β, high β, and θ to β ratio, respectively. The experiments in this paper confirm that the important features of EEG biometric signals alone during walking can accurately determine stroke precursors and occurrence in the elderly with more than 90% accuracy. Further, the Random Forest algorithm with quartiles and Z-score normalization validates the clinical significance and performance of the system proposed in this paper with a 92.51% stroke prediction accuracy. The proposed system can be implemented at a low cost, and it can be applied for early disease detection and prediction using the precursor symptoms of real-time stroke. Furthermore, it is expected that it will be able to detect other diseases such as cancer and heart disease in the future. Keywords: electroencephalography; machine learning; stroke prediction; real-time health monitor- ing; stroke disease analysis 1. Introduction Stroke is a disease in which the blood vessels of the brain are blocked or have burst, thus resulting in sudden brain dysfunction such as motor or sensory disorders, pronuncia- tion disorders, unconsciousness, or limb paralysis [1,2]. Strokes can be divided into two categories: cerebral infarction caused by large blockage of the blood vessels or cerebral hemorrhage caused by blood vessels bursting [3]. Cerebral infarction occurs when clots from the heart and carotid arteries (arteriosclerosis) eventually clog the cerebral blood vessels, while brain hemorrhages are marked by hemorrhages in the cerebral cortex and Appl. Sci. 2021, 11, 1761. https://doi.org/10.3390/app11041761 https://www.mdpi.com/journal/applsci
-
Upload
khangminh22 -
Category
Documents
-
view
1 -
download
0
Transcript of Machine-Learning-Based Elderly Stroke Monitoring ... - MDPI

applied sciences
Article
Machine-Learning-Based Elderly Stroke Monitoring SystemUsing Electroencephalography Vital Signals
Yoon-A Choi 1, Sejin Park 2, Jong-Arm Jun 1, Chee Meng Benjamin Ho 3, Cheol-Sig Pyo 1, Hansung Lee 4
and Jaehak Yu 1,*
�����������������
Citation: Choi, Y.-A; Park, S.; Jun,
J.-A.; Ho, C.M.B.; Pyo, C.-S.; Lee, H.;
Yu, J. Machine-Learning-Based
Elderly Stroke Monitoring System
Using Electroencephalography Vital
Signals. Appl. Sci. 2021, 11, 1761.
https://doi.org/10.3390/app11041761
Academic Editor: José
Ignacio Serrano
Received: 30 January 2021
Accepted: 12 February 2021
Published: 17 February 2021
Publisher’s Note: MDPI stays neutral
with regard to jurisdictional claims in
published maps and institutional affil-
iations.
Copyright: © 2021 by the authors.
Licensee MDPI, Basel, Switzerland.
This article is an open access article
distributed under the terms and
conditions of the Creative Commons
Attribution (CC BY) license (https://
creativecommons.org/licenses/by/
4.0/).
1 Department of KSB Convergence Research, Electronics and Telecommunications Research Institute (ETRI),Daejeon 34129, Korea; [email protected] (Y.-AC.); [email protected] (J.-A.J.); [email protected] (C.-S.P.)
2 Research Team for Health & Safety Convergence, Korea Research Institute of Standards and Science (KRISS),Daejeon 34113, Korea; [email protected]
3 AI Research Team, Sewon Intelligence Company, 35 Sejong-daero, Jung-gu, Seoul 04512, Korea;[email protected]
4 School of Computer Engineering, Youngsan University, 288 Junam-Ro, Yangsan, Gyeongnam 50510, Korea;[email protected]
* Correspondence: [email protected]; Tel.: +82-42-860-6794
Abstract: Stroke is the third highest cause of death worldwide after cancer and heart disease, andthe number of stroke diseases due to aging is set to at least triple by 2030. As the top three causes ofdeath worldwide are all related to chronic disease, the importance of healthcare is increasing evenmore. Models that can predict real-time health conditions and diseases using various healthcareservices are attracting increasing attention. Most diagnosis and prediction methods of stroke forthe elderly involve imaging techniques such as magnetic resonance imaging (MRI). It is difficult torapidly and accurately diagnose and predict stroke diseases due to the long testing times and highcosts associated with MRI. Thus, in this paper, we design and implement a health monitoring systemthat can predict the precursors of stroke diseases in the elderly in real time during daily walking.First, raw electroencephalography (EEG) data from six channels were preprocessed via Fast FourierTransform (FFT). The raw EEG power values were then extracted from the raw spectra: alpha (α),beta (β), gamma (γ), delta (δ), and theta (θ) as well as the low β, high β, and θ to β ratio, respectively.The experiments in this paper confirm that the important features of EEG biometric signals aloneduring walking can accurately determine stroke precursors and occurrence in the elderly with morethan 90% accuracy. Further, the Random Forest algorithm with quartiles and Z-score normalizationvalidates the clinical significance and performance of the system proposed in this paper with a 92.51%stroke prediction accuracy. The proposed system can be implemented at a low cost, and it can beapplied for early disease detection and prediction using the precursor symptoms of real-time stroke.Furthermore, it is expected that it will be able to detect other diseases such as cancer and heart diseasein the future.
Keywords: electroencephalography; machine learning; stroke prediction; real-time health monitor-ing; stroke disease analysis
1. Introduction
Stroke is a disease in which the blood vessels of the brain are blocked or have burst,thus resulting in sudden brain dysfunction such as motor or sensory disorders, pronuncia-tion disorders, unconsciousness, or limb paralysis [1,2]. Strokes can be divided into twocategories: cerebral infarction caused by large blockage of the blood vessels or cerebralhemorrhage caused by blood vessels bursting [3]. Cerebral infarction occurs when clotsfrom the heart and carotid arteries (arteriosclerosis) eventually clog the cerebral bloodvessels, while brain hemorrhages are marked by hemorrhages in the cerebral cortex and
Appl. Sci. 2021, 11, 1761. https://doi.org/10.3390/app11041761 https://www.mdpi.com/journal/applsci

Appl. Sci. 2021, 11, 1761 2 of 18
intraventricular hemorrhage. Cerebral hemorrhage occurs spontaneously without any ex-ternal shock, and high blood pressure is reported as its main cause [4]. Stroke disease is oneof the most common severe disorders that causes functional disabilities in adults and olderpeople, which can lead to substantial difficulties with social or economic activities [5–8].For stroke patients, it is important to assess the current level of disability and to implementproper rehabilitation visits to medical institutions [9]. However, it is hard to classify strokesymptoms, making it difficult to properly diagnose disorders caused by stroke and anyaccompanying neurological damage. Therefore, there is a desperate need for technologythat can keep track of potential stroke victims and support them during visits to medicalinstitutions and allow them to receive diagnoses and treatments from medical staff as soonas possible.
Current research is attempting to identify major risk factors for stroke by evaluatingthe initial disability of stroke patients and monitoring their conditions [10,11]. Variousmethods for preventing the recurrence of these early disorders in stroke patients havebeen developed and studied, the Canadian Neurologic Scale and the National Institutesof Health Stroke Scale (NIHSS) are some of the scales used to diagnose the severity ofstroke. In particular, the NIHSS developed by Lyden et al. is used as a measurement thatis relatively easy and simple to perform at the beginning of hospitalization [12]. It is aproven tool used widely throughout the world. Based on various studies for reliabilityand feasibility, 14 key categories have been chosen for evaluation by the medical staff forthe NIHSS: consciousness level, facial paralysis, vision, upper and lower extremism, distalmotion, limb motion, hearing impairment, and sensory touch. Although it only takesabout six minutes to evaluate a patient according to the NIHSS, it has the limitation of notproviding accurate predictive information results for the early detection of stroke or initialdisability [12].
A study by Jee et al. established a predictive model of stroke occurrence for Kore-ans [13]. Based on health examination data from the Korea National Health InsuranceCorporation, Jee et al. developed 10 year prediction models for the average risk of strokeusing age, diabetes, smoking, total cholesterol, drinking volume, systolic blood pressure,exercise, and body mass index (BMI). However, that study follows the same method asthe construction of the stroke risk prediction model by the Framingham Heart Study [14].It is important to know what type of stroke (brain infarction, cerebral hemorrhage) hasoccurred and how much damage the brain has taken within three hours of the strokeoutbreak [15]. Based on these risk factors, studies have attempted to predict stroke diseasesusing various statistical methods and machine-learning methods; these include researchusing logistic models such as Kannel [16] and studies based on Cox’s proportional riskmodel [14] and the Weibull model [17]. However, it is difficult to apply these risk-basedmodels to predict the occurrence of stroke diseases in Koreans. Therefore, there is a needto find a new model for stroke prediction that is appropriate for the elderly in Korea. Inaddition, clinical studies have reported that stroke recurrence rates vary depending on thetype of stroke and risk factors, but the typical recurrence rate within a year is 10–15% [18].Therefore, it is important to quickly predict the early onset in stroke patients and thosewith a stroke history.
In this paper, we propose a health monitoring system that enables the real-time earlydetection of stroke and other diseases in older people based on EEG vital signals collectedduring daily activities. To accurately predict and to analyze the stroke disease, studies basedon information on the features and patterns of EEG are being actively conducted [19,20].In this paper, important features in EEG vital signals were newly defined and used inexperiments. Specifically, raw EEG biometric signals data from elderly people aged 65or older were collected during walking and stored in real time. These real-time raw EEGdata were preprocessed with decomposing functions or frequency components via FastFourier Transform (FFT). The extracted raw spectrum includes alpha (α), beta (β), gamma(γ), delta (δ), theta (θ), low β, high β, and θ to β ratio, each taken from six measurementlocations (Fz, Oz, T7, T8, C1, and C2), meaning 66 important attributes were used in total.

Appl. Sci. 2021, 11, 1761 3 of 18
Our experiments have shown that the chosen attributes collected in real time while theelderly were walking can help detect and determine the precursor symptoms of more than90% of stroke diseases in advance. Further, the Random Forest algorithm-based predictionmodel for stroke conditions with quartiles and a Z-score was experimentally identifiedwith performance indicators such as accuracy and recall, preservation, and an F1-score ofup to 92.51%. Thus, we present in-depth analysis results obtained through the performanceand semantic interpretation of the elderly disease prediction and health monitoring systemproposed in this paper, which are significant. Our initial results confirm that the proposedhealth monitoring system is able to detect and predict stroke precursors for older people inreal time, and that it can be implemented at a low cost.
The remaining parts of this paper are organized as follows. In Section 2, we provide theliterature review of the methodology involved in stroke diseases using EEG and machinelearning. The elderly health monitoring system based on a machine-learning predictionmodel that collects real-time EEG vital signals is proposed in Section 3. Section 4 details theexperimental results and presents an in-depth analysis of this paper, and finally, Section 5discusses the conclusions and future research.
2. Related Works
Electroencephalography (EEG) is a human physiological signal that measures humanbrain waves [19–21]. Most of the studies utilizing EEG data have used them to identifyand analyze epilepsy diseases, but reports of unique brain waves have recently been foundin other diseases, including schizophrenia, depression, and stroke [11,21,22]. Beyond theraw EEG spectrum, prior research has shown that the absolute power value, which isthe value of the attribute depending on the frequency domain, and the relative powervalue, which represents the ratio of the total amplitude at the frequency band, are betterindicators for determining brain dysfunction [22]. Relative power is based on the ratioof the total amplitude of the frequency band, independent of the electrical resistance tothe skull thickness and other non-brain wave electrical activity. Thus, each signal canvary depending on the reader’s noise screening ability, ability to compare absolute powerwith relative power, understanding of psychoanalysis, and neurological knowledge [23,24].Many studies have attempted to classify and predict various brain diseases using EEGdata [25–32]; these have included studies on brain function location [25,26] as well asanalyses of brain wave changes with human emotion [27,28] and brain wave changes withsleep level [29–31]. There have also been a number of studies predicting brain diseasesusing various frequency attribute values, such as absolute power values or relative powervalues [22]. For example, there have been studies attempting to automatically classify orpredict patients with epilepsy [31], detect and diagnose depression [32], and detect earlyAlzheimer’s conditions [33]. Further, the environments required of vital-signal collectionmethods, including EEG, limit such methods to studies based on data collected throughmedical equipment, such as large hospitals, rather than data collected from the dailyactivities of the elderly.
Several studies have reported the appearance of certain attribute values in strokepatients with EEG-based stroke analysis [34–37]. For example, Simon et al. [34] confirmedthat the main properties of EEG with respect to stroke include the generation of abnormaland slow signals generated at the delta wave (δ) wave frequency range (1–4 Hz) with thesimultaneous reductions of normal and fast activities at the alpha (α) wave frequency range(8–12 Hz). Through these experiments, we can confirm that relative delta power, delta andalpha power ratio, and the addition of delta and theta wave against alpha and beta waveratios can be used to detect and predict stroke. Schneider et al. [35] studied EEG frequencyanalysis and topographic maps and found an increase in large delta waves and a decreasein alpha wave activity in 17 out of 20 mild stroke patients. Panayiotis et al. [36] confirmedthat a rhythmic and high amplitude theta versus delta wave appeared in a patient withepilepsy during a stroke. Ip et al. [37] confirmed that brain waves in stroke patients thatwere measured in the cerebral cortex affected the activity and stability of the theta wave

Appl. Sci. 2021, 11, 1761 4 of 18
and the delta wave, while the delta wave (0.1–3 Hz), alpha (7–13 Hz), beta wave (13–30 Hz),and high gamma wave (62–200 Hz) increased rapidly in the right hemisphere. Based onthese studies, we believe that EEG research can help minimize medical costs and enablethe early detection stroke diseases in the elderly during their daily activities.
A quick literature review found a few studies using various machine-learning techniques,including artificial neural networks (ANN), for stroke diagnosis or prediction [38–42]. Forexample, Shanthi et al. [38] reported that an individual’s risk rate for stroke can be detectedusing ANN based on stroke patient data. Specifically, they used the backpropagationalgorithm for learning, and showed improvements in consistency and diagnostic accuracyfor the prediction. Nwosu et al. [39] studied the analysis and prediction of risk factorsassociated with the onset of stroke using data mining techniques and individual patientelectronic health records. According to the experimental results, the prediction accuracyof decision tree (DT) was 74.31%, Random Forest was 74.53%, and ANN algorithm was75.02%. Bentley et al. [40] reported a prediction method considering CT information andclinical variables in the treatment of ischemic stroke. Based on computed tomography (CT)images of 116 ischemic stroke patients, they successfully found 9 out of 16 patients withhemorrhage symptoms using support vector machines (SVMs). Hanifa et al. [41] predictedand verified the risk factors of stroke by adjusting the parameter values of the SVMprediction model using various kernel functions. Yu et al. [42] published a study detailinga prior detection and prediction methodology for stroke diseases with machine-learningand deep-learning methodologies by collecting electromyography (EMG) biological signalsfrom thighs and calves in real time. More specifically, they measured and collected EMGdata from the left and right thighs and the calves at 1500 Hz from the healthcare device.Using those data, they achieved over 90% stroke disease prediction accuracy.
Yu et al. [43,44] published an analytical study based on the decision tree methodology,which is a representative classification model of machine learning or data mining. Inaddition, Yu et al. [44] attempted to implement automatic classification and interpretationof the severity of NIHSS based on the C4.5 decision tree algorithm. By analyzing the ruleson the additional operating principles provided by C4.5 decision trees, they were ableto develop a novel attempt at the semantic interpretation of stroke severity. However,decision trees are predictive model algorithms by nature, which only provide partialinterpretations, thus requiring in-depth analysis inherent in the data. In addition, Aminiet al. [45] conducted a study to predict stroke outbreaks based on abundant medical dataon a wide range of diseases. However, such research methodologies, like prior studies, arenot suitable for use in early prediction models of stroke symptoms in real time in everydaylife. Because these strokes interact with various risk factors rather than with one factor,studies of stroke disease prediction using various statistical methods and machine-learningmethods are needed, and they are actively underway.
3. Elderly Stroke Monitoring System Based on Machine Learning and EEG
For the elderly stroke monitoring system, information on the important attributeswas extracted from the raw data of EEG collected from six channels. After collecting andanalyzing real-time EEG data, we proposed a monitoring system that can make earlypredictions of stroke and diseases in the elderly. The structure of the proposed systemis presented in Figure 1 and includes (1) the EEG sensor and transmission module thatcollects and transmits the vital signals; (2) a collection module that integrates and storesvarious real-time generated multi vital-signals collector units (MVCU) and transmits themto a server; (3) a storage module that filters and stores the EEG information; and (4) theproposed system collects various types of vital-signal data, including actual EEG from theelderly, undertakes a series of data preprocessing and critical attribute extractions, andapplies machine-learning models to predict and analyze stroke precursors in real time.

Appl. Sci. 2021, 11, 1761 5 of 18Appl. Sci. 2021, 11, x FOR PEER REVIEW 5 of 20
Figure 1. Elderly stroke monitoring system based on machine learning using electroencephalog-raphy (EEG). * MVCU: Multi Vital-Signals Collector Units.
3.1. Real-Time EEG Data Collection This section describes the process used to measure and collect different types of bio-
metric signal data, including EEG, ECG, EMG, pulse wave (PPG), and motion (motion), to validate the performance of the AI-based elderly stroke disease prediction and analysis system. Brain waves are the most basic electrical signals used to determine brain abnor-malities, and they are measured through electrodes attached to the surface of the head. In this work, scalp EEG is used to measure and collect brain waves from the general elderly and stroke elderly patients. We hypothesize that these EEG vital-signal data can represent medical and kinematic parameters if the balance of the body collapses or if a walking disorder occurs during walking. The measurement and collection of the brainwave vital-signal data tested in this paper were conducted by the Emergency Medical Center and Rehabilitation Department of Chungnam National University Hospital for the elderly from 2017 to 2018. The subjects were aged 65 or older and had received rehabilitation treatment for stroke, since our focus is on elderly health monitoring. Various biometric signals, including EEG, ECG, EMG, voice, pulse, and motion, were collected using wear-able sensors. To separate the general patients from the stroke patients, patients who had been diagnosed as a confirmed stroke case within one month were classified as stroke patients. The EEG data were collected at a sampling rate of 1000 Hz at a total of six chan-nels (Fz, Oz, T7, T8, C1, and C2), with the location of each channel highlighted in Figure 2.
Figure 1. Elderly stroke monitoring system based on machine learning using electroencephalography(EEG). * MVCU: Multi Vital-Signals Collector Units.
3.1. Real-Time EEG Data Collection
This section describes the process used to measure and collect different types of bio-metric signal data, including EEG, ECG, EMG, pulse wave (PPG), and motion (motion),to validate the performance of the AI-based elderly stroke disease prediction and anal-ysis system. Brain waves are the most basic electrical signals used to determine brainabnormalities, and they are measured through electrodes attached to the surface of thehead. In this work, scalp EEG is used to measure and collect brain waves from the generalelderly and stroke elderly patients. We hypothesize that these EEG vital-signal data canrepresent medical and kinematic parameters if the balance of the body collapses or if awalking disorder occurs during walking. The measurement and collection of the brainwavevital-signal data tested in this paper were conducted by the Emergency Medical Center andRehabilitation Department of Chungnam National University Hospital for the elderly from2017 to 2018. The subjects were aged 65 or older and had received rehabilitation treatmentfor stroke, since our focus is on elderly health monitoring. Various biometric signals, in-cluding EEG, ECG, EMG, voice, pulse, and motion, were collected using wearable sensors.To separate the general patients from the stroke patients, patients who had been diagnosedas a confirmed stroke case within one month were classified as stroke patients. The EEGdata were collected at a sampling rate of 1000 Hz at a total of six channels (Fz, Oz, T7, T8,C1, and C2), with the location of each channel highlighted in Figure 2.
3.2. EEG Data Preprocessing
The data used in the experiments in this paper consist of three types: (1) raw EEG datacollected from the brain wave measurement sensor; (2) absolute power value expressedby measuring absolute brain wave values regardless of external conditions such as scalpresistance, skull thickness, etc.; (3) relative power values to control for the differencein external states. The collected raw values that were imprecise were removed prior tolearning, and a Z-score technique was applied on a channel-by-channel basis to completethe normalization process. The finalized data that had been preprocessed were then tailoredto the input frame of the learning model. Finally, the number of selected EEG data stroke

Appl. Sci. 2021, 11, 1761 6 of 18
patients used in the experiment was matched to the number of EEG data for the generalelderly. Figure 3 below shows an example of the actual raw data values collected from sixchannels of brain waves measured and collected in real time. Figure 3a presents randomlyselected EEG general elderly data and Figure 3b presents randomly selected stroke elderlydata collected during walking.
Appl. Sci. 2021, 11, x FOR PEER REVIEW 6 of 20
Figure 2. 6-channel measurement and collection locations of EEG vital signals.
3.2. EEG Data Preprocessing The data used in the experiments in this paper consist of three types: (1) raw EEG
data collected from the brain wave measurement sensor; (2) absolute power value ex-pressed by measuring absolute brain wave values regardless of external conditions such as scalp resistance, skull thickness, etc.; (3) relative power values to control for the differ-ence in external states. The collected raw values that were imprecise were removed prior to learning, and a Z-score technique was applied on a channel-by-channel basis to com-plete the normalization process. The finalized data that had been preprocessed were then tailored to the input frame of the learning model. Finally, the number of selected EEG data stroke patients used in the experiment was matched to the number of EEG data for the general elderly. Figure 3 below shows an example of the actual raw data values collected from six channels of brain waves measured and collected in real time. Figure 3a presents randomly selected EEG general elderly data and Figure 3b presents randomly selected stroke elderly data collected during walking.
(a) Raw EEG signals from normal elderly patient.
Figure 2. 6-channel measurement and collection locations of EEG vital signals.
Appl. Sci. 2021, 11, x FOR PEER REVIEW 6 of 20
Figure 2. 6-channel measurement and collection locations of EEG vital signals.
3.2. EEG Data Preprocessing The data used in the experiments in this paper consist of three types: (1) raw EEG
data collected from the brain wave measurement sensor; (2) absolute power value ex-pressed by measuring absolute brain wave values regardless of external conditions such as scalp resistance, skull thickness, etc.; (3) relative power values to control for the differ-ence in external states. The collected raw values that were imprecise were removed prior to learning, and a Z-score technique was applied on a channel-by-channel basis to com-plete the normalization process. The finalized data that had been preprocessed were then tailored to the input frame of the learning model. Finally, the number of selected EEG data stroke patients used in the experiment was matched to the number of EEG data for the general elderly. Figure 3 below shows an example of the actual raw data values collected from six channels of brain waves measured and collected in real time. Figure 3a presents randomly selected EEG general elderly data and Figure 3b presents randomly selected stroke elderly data collected during walking.
(a) Raw EEG signals from normal elderly patient.
Appl. Sci. 2021, 11, x FOR PEER REVIEW 7 of 20
(b) Raw EEG signals from stroke elderly patient
Figure 3. Example of raw EEG vital-signals waveform changes while walking: (a) normal elderly patient, (b) stroke elderly patient.
In this paper, the absolute and relative power values collected from each subject were extracted and used. As the population of subjects is bound to have more general elderly people than stroke patients, the same amounts of data from stroke patients and randomly chosen general patients were selected; this was done to remove any form of bias in learn-ing for stroke precursors and disease prediction.
3.3. Attribute Definition and Extraction in EEG The experiments in this paper require raw data to be collected in the form of EEG
signals during walking scenarios, as it does not use segment data from various experi-mental protocols. We conduct experimental and stroke disease prediction model studies by extracting the important properties from the raw values of these EEG signals. FFT was applied from the raw value of the EEG signal from each channel to extract the measure-ment variables raw spectrum alpha (α), beta (β), gamma (γ), delta (δ), and theta (θ), as well as the properties between the value’s low β, high β, and theta-to-beta ratio. In this experiment, 66 attributes in total were newly defined and extracted in the form of the absolute power and relative values of waveforms (signals) from the raw EEG spectrum. The absolute power value and relative value used in the experiment in this paper consist of 11 attribute values for each of the six channels (Fz, Oz, T7, T8, C1, and C2), as listed in Table 1, which ultimately account for 66 attribute values and class.
Figure 3. Example of raw EEG vital-signals waveform changes while walking: (a) normal elderly patient, (b) strokeelderly patient.

Appl. Sci. 2021, 11, 1761 7 of 18
In this paper, the absolute and relative power values collected from each subject wereextracted and used. As the population of subjects is bound to have more general elderlypeople than stroke patients, the same amounts of data from stroke patients and randomlychosen general patients were selected; this was done to remove any form of bias in learningfor stroke precursors and disease prediction.
3.3. Attribute Definition and Extraction in EEG
The experiments in this paper require raw data to be collected in the form of EEGsignals during walking scenarios, as it does not use segment data from various experimen-tal protocols. We conduct experimental and stroke disease prediction model studies byextracting the important properties from the raw values of these EEG signals. FFT wasapplied from the raw value of the EEG signal from each channel to extract the measurementvariables raw spectrum alpha (α), beta (β), gamma (γ), delta (δ), and theta (θ), as well as theproperties between the value’s low β, high β, and theta-to-beta ratio. In this experiment,66 attributes in total were newly defined and extracted in the form of the absolute powerand relative values of waveforms (signals) from the raw EEG spectrum. The absolutepower value and relative value used in the experiment in this paper consist of 11 attributevalues for each of the six channels (Fz, Oz, T7, T8, C1, and C2), as listed in Table 1, whichultimately account for 66 attribute values and class.
Table 1. Detailed Descriptions of Newly Defined and Extracted EEG Attributes.
No.Contents
Features Meaning and Explanation
1~66
6 Channel(Fz, Oz, T7, T8,
C1, C2)
Delta (δ) Delta power (1~4 Hz)Theta (θ) Theta power (4~8 Hz)Alpha (α) Alpha power (8~13 Hz)Beta (β) Beta power (14~30 Hz)
Gamma (γ) Gamma power (30 Hz or more)Low_Beta Low beta power (12~25 Hz)High_Beta High beta power (25~30 Hz)
Theta_to_Beta Value of the beta ratio in theta(extracting abnormal theta waves)
Delta divided byAlpha (DAR)
IDAR
Ratio of mean power (Delta/Alpha)Inverse ratio of DAR (Alpha/Delta)
PRIPRI power ratio index (delta+theta
to alpha+beta),Low frequency to high frequency
67 Class Labeling Normal or Stroke Elderly
Choosing an efficient subset of attributes for pattern classification is one of the mostimportant research steps [46,47]. In this paper, we use the method described by Hall [48],which has already proven its performance in various fields of attribute subset selectionfor power and relative values of EEG. A merit function (Equation (1)) is used to evaluatehow efficiently each subset of Fs ⊂ F expresses the entire attributes. The subset with thelargest value of the merit function is determined by the subset that best represents theentire property [48].
Merit(Fs) =krc f√
k + k(k− 1)r f f
(1)
where k is the number of attributes in subset Fs, rc f is the mean distribution of attributescontained in Fs, and r f f is the mean correlation value of the attributes. Tables 2 and 3present the optimal subset of attributes chosen from absolute power value and relative

Appl. Sci. 2021, 11, 1761 8 of 18
value using Hall’s method. Table 2 lists a subset of eight attributes selected from the powervalue, and Table 3 lists a subset of 15 optimal attributes selected from the relative value.
Table 2. Optimal feature subset extracted from the power value of EEG.
No. Features Meaning and Explanation
1 Fz(Theta) Theta power of Fz channel2 Fz(Theta_to_Beta) Beta ratio value in theta of Fz channel3 Fz(IDAR) Inverse ratio of DAR of Fz channel4 Fz(RRI) Power ratio index of Fz channel5 T7(RRI) Power ratio index of T7 channel6 C1(DAR) Ratio of mean power of C1 channel7 Oz(IDAR) Inverse ratio of DAR of Oz channel8 T8(RRI) Power ratio index of T8 channel
Table 3. Optimal feature subset extracted from the relative value of EEG.
No. Features Meaning and Explanation
1 Fz(Alpha) Alpha power of Fz channel (8~13 Hz)2 Fz(Beta) Beta power of Fz channel (14~30 Hz)3 Fz(Gamma) Gamma power of Fz channel (30 Hz or more)4 Fz(IDAR) Inverse ratio of DAR of Fz channel5 T7(Theta) Theta power of T7 channel (4~8 Hz)6 T7(Alpha) Alpha power of T7 channel (8~13 Hz)7 T7(Gamma) Gamma power of T7 channel (30 Hz or more)8 C1(Theta) Theta power of C1 channel (4~8 Hz)9 Oz(Beta) Beta power of Oz channel (14~30 Hz)10 Oz(Gamma) Gamma power of Oz channel (30 Hz or more)11 C2(Beta) Beta power of C2 channel (14~30 Hz)12 C2(Gamma) Gamma power of C2 channel (30 Hz or more)13 C2(Low_Beta) Low beta power of C2 channel (12~25 Hz)14 T8(Theta) Theta power of T8 channel (4~8 Hz)15 T8(Gamma) Gamma power of T8 channel (30 Hz or more)
3.4. Stroke Prediction Module for the Elderly Based on Machine Learning
The module proposed in this paper uses real-time EEG biometric signals to detect andpredict elderly stroke precursors in advance, and it consists of two submodules in total. Theoffline submodules provide predictive models via Machine-Learning (ML) Training, whichperforms machine-learning model-specific learning from the preprocessing of brainwavesignals. Meanwhile, the online sub-module provides medical staff with the risk of stroke inolder adults based on real-time EEG data as shown in Figure 4.
First, the offline module consists of a total of four sub-blocks: (1) the biometric reposi-tory stores various biological signals generated while the elderly participate in daily activi-ties. For example, this block collects, stores, and manages EEGs, electrocardiograms (ECGs),pulse waves, and EMGs. (2) In the preprocessing of brain waves, the null and missingvalues of raw values collected in real time from the six channels are corrected or deleted.(3) Fast Fourier Transform (FFT) performs the task of decomposing functions or signalsinto frequency components, specifically by transforming the raw value of brain waves intoindividual spectral components. Next, the frequency information for the signal is extractedin real time. For example, alpha, beta, etc. are extracted, as shown in Table 2. Further, alearning model can be developed using both absolute power and relative values for 11properties extracted per six channels. Finally, as presented in Tables 2 and 3, learning andprediction models are developed by selecting the optimal set of attributes used in real-timestroke disease prediction. (4) The machine-learning-based learning module implementslearning based on attributes extracted from EEG biometric signals collected in real time.At this time, the prediction model learned from machine-learning algorithms in this blockuses brainwave data from older people collected in real time during everyday activities. In

Appl. Sci. 2021, 11, 1761 9 of 18
addition, the learned predictive model is passed to the online module so it can be used todetermine the degree of precursors and predictions for stroke.
The online module also consists of a total of four sub-blocks: (1) Real-time data onbrain waves are collected in the form of biological signals during everyday life, suchas walking, from the elderly. (2) In the preprocessing of brain waves, corrections andnoise data collected in real time during daily life are deleted. (3) Through FFT, the rawdata values of each of the six channels of brain waves are decomposed into frequencycomponents, and frequency information is extracted for the signal. (4) In the real-timestroke disease prediction block, the machine-learning-based learning module of the offlinemodule uses a learned prediction model to make real-time predictions of elderly strokedisease using the incoming EEG data. Finally, the stroke disease prediction results andanalysis information are delivered to the medical staff to be used as objective data forclinical treatment and diagnosis.
Appl. Sci. 2021, 11, x FOR PEER REVIEW 9 of 20
Table 3. Optimal feature subset extracted from the relative value of EEG.
NO. Features Meaning and Explanation 1 Fz(Alpha) Alpha power of Fz channel (8~13 Hz) 2 Fz(Beta) Beta power of Fz channel (14~30 Hz) 3 Fz(Gamma) Gamma power of Fz channel (30 Hz or more) 4 Fz(IDAR) Inverse ratio of DAR of Fz channel 5 T7(Theta) Theta power of T7 channel (4~8 Hz) 6 T7(Alpha) Alpha power of T7 channel (8~13 Hz) 7 T7(Gamma) Gamma power of T7 channel (30 Hz or more) 8 C1(Theta) Theta power of C1 channel (4~8 Hz) 9 Oz(Beta) Beta power of Oz channel (14~30 Hz)
10 Oz(Gamma) Gamma power of Oz channel (30 Hz or more) 11 C2(Beta) Beta power of C2 channel (14~30 Hz) 12 C2(Gamma) Gamma power of C2 channel (30 Hz or more) 13 C2(Low_Beta) Low beta power of C2 channel (12~25 Hz) 14 T8(Theta) Theta power of T8 channel (4~8 Hz) 15 T8(Gamma) Gamma power of T8 channel (30 Hz or more)
3.4. Stroke Prediction Module for the Elderly Based on Machine Learning The module proposed in this paper uses real-time EEG biometric signals to detect
and predict elderly stroke precursors in advance, and it consists of two submodules in total. The offline submodules provide predictive models via Machine-Learning (ML) Training, which performs machine-learning model-specific learning from the prepro-cessing of brainwave signals. Meanwhile, the online sub-module provides medical staff with the risk of stroke in older adults based on real-time EEG data as shown in Figure 4.
Figure 4. Overall structure of ML-based elderly stroke disease prediction module using real-time EEG vital signals.
First, the offline module consists of a total of four sub-blocks: (1) the biometric repos-itory stores various biological signals generated while the elderly participate in daily ac-tivities. For example, this block collects, stores, and manages EEGs, electrocardiograms (ECGs), pulse waves, and EMGs. (2) In the preprocessing of brain waves, the null and missing values of raw values collected in real time from the six channels are corrected or deleted. (3) Fast Fourier Transform (FFT) performs the task of decomposing functions or signals into frequency components, specifically by transforming the raw value of brain waves into individual spectral components. Next, the frequency information for the signal is extracted in real time. For example, alpha, beta, etc. are extracted, as shown in Table 2. Further, a learning model can be developed using both absolute power and relative values
Figure 4. Overall structure of ML-based elderly stroke disease prediction module using real-time EEG vital signals.
4. Experiment and Analysis4.1. Dataset and Experimental Environment
In this section, we describe the brain stroke precursor detection and disease predictionexperiments that were conducted with older people on the previously described machine-learning models with raw value, power value, and relative value. We collected dataon 48 stroke patients and 75 control patients in 2017, as well as 13 stroke patients and137 control groups in 2018. For our experiments, all 61 stroke patients and a randomizedselection of 61 patients from the control group were selected to balance the data from thestroke and control groups. In total, five scenario-specific measurement protocols wereimplemented, including walking, sleeping, moving objects, standing, and standing from achair to stimulate the daily activities of an elderly person. The experiment was designed sothat all subjects would go through one practice round before executing the measurementprotocol according to each scenario. Despite the initial trial run, the first measured andcollected values were not used as experimental data, because they could reflect human noisevalues stemming from the subject’s tension and discomfort. The last fifth measurementprotocol was also not reflected in the experimental data, because repeated experiments andfatigue were likely to be reflected in the data.
For the machine-learning-based experiments, we conducted stroke disease predictionexperiments and analyze the data by extracting power and relative values based on rawvalues in the form of brain waves. We also experimented with the optimal set of attributeschosen using CFS (Correction Feature Selection) by power and relative values. The optimalsubset of attributes from the power value is: Fz(θ), Fz(θ_to_β), Fz(IDAR), Fz(RRI), T7(RRI),C1(DAR), Oz(IDAR), T8(RRI), and the optimal set of attributes from the relative values

Appl. Sci. 2021, 11, 1761 10 of 18
is: Fz(α), Fz(β), Fz(γ), Fz(IDAR), T7(θ), T7(α), T7(γ), C1(θ), Oz(β), Oz(γ), C2(β), C2(γ),C2(Low_β), T8(θ), and T8(γ). This combination of 23 attributes was used, and the algorithmsof machine learning used in the experiment were Random forest, C4.5 decision tree, C5.0decision tree, naive Bayes, MLP (multi-layer perceptron), logistic regression, two-class SVM(support vector machine), C&RT (classification and regression tree), and QUEST (quickunbiased efficient statistical tree).
4.2. Performance Evaluation Measurement
This section describes the statistical indicators used in disease screening to assessthe system’s performance in predicting strokes with EEG data, and the definitions of theperformance evaluation indicators used are as follows (see Table 4) [47,49]. In this paper,we validate the performance of the system using four performance metrics, which aredescribed in detail below. The misclassification of patients with stroke symptoms as normalelderly people can have a significant impact on their lives. Therefore, this misclassificationis used as the most important performance evaluation indicator in health and medicalservices. As a result, it is important to find a model with high precision and high accuracyfor stroke diseases in older people, while also having low false positives (FP).
Table 4. Confusion matrix of performance evaluation for prognostic symptoms and predictionof stroke.
True Condition
Stroke Elderly Normal Elderly
Predicted ConditionStroke Elderly True Positive False Positive
Normal Elderly False Negative True Negative
4.3. Experiment Based on Machine-Learning Methodology
This section extracts the power values, relative values from real-time EEG data, andmachine-learning methods described in Section 3, Random Forest, C4.5 decision tree, C5.0decoration tree, naive Bayes, logistic regression, MLP, and SVM-class. We learned andtested each machine-learning-based predictive model with power values and relativevalues, and we conducted our experiment and analysis based on eight optimal sets ofattributes of power values using CFS (Correlation Feature Selection, Equation (1)).
4.3.1. Predicting and Analyzing Stroke Diseases Based on Power Values
In the first experiment, 2940 data sets were extracted and tested for the elderly andthe elderly with stroke power values. To verify the performance of this model, we usedthe performance indicators defined in Section 4.2. Tables 5 and 6 below show the predic-tion accuracy and the performance indicators of F1-score, recall, and precision using all66 attributes as well as different datasets per algorithm.
The second experiment performed a Z-score (normalization) for all 66 attributes. Asan example of normalization application, it is necessary to prevent the patient-specificOz_θ value from varying in category and size of the minimum and maximum values, sincethere are problems that can arise depending on the unit of measure. This normalizationprocess translates the data so that they are within a small range of 0.0 to 1.0, so that thesame weights are applied for all attributes.
→xi =
xi − µ
σ× α (2)
In Equation (2), σ and µ are the standard deviation and mean of attribute x, respec-tively, and α is the weighted value, which is set as 1.0 in this paper. The proposed approachwith Random Forest achieved over 91% in an accuracy, F1-score, Recall and Precisioncriteria. It also showed an accuracy of 92.52%, a F1-score of 92.5%, a recall of 92.5%, and aprecision of 92.8% on the 10-fold CV dataset. It achieved over 90% in an accuracy, F1-score,
Appl. Sci. 2021, 11, 1761 11 of 18
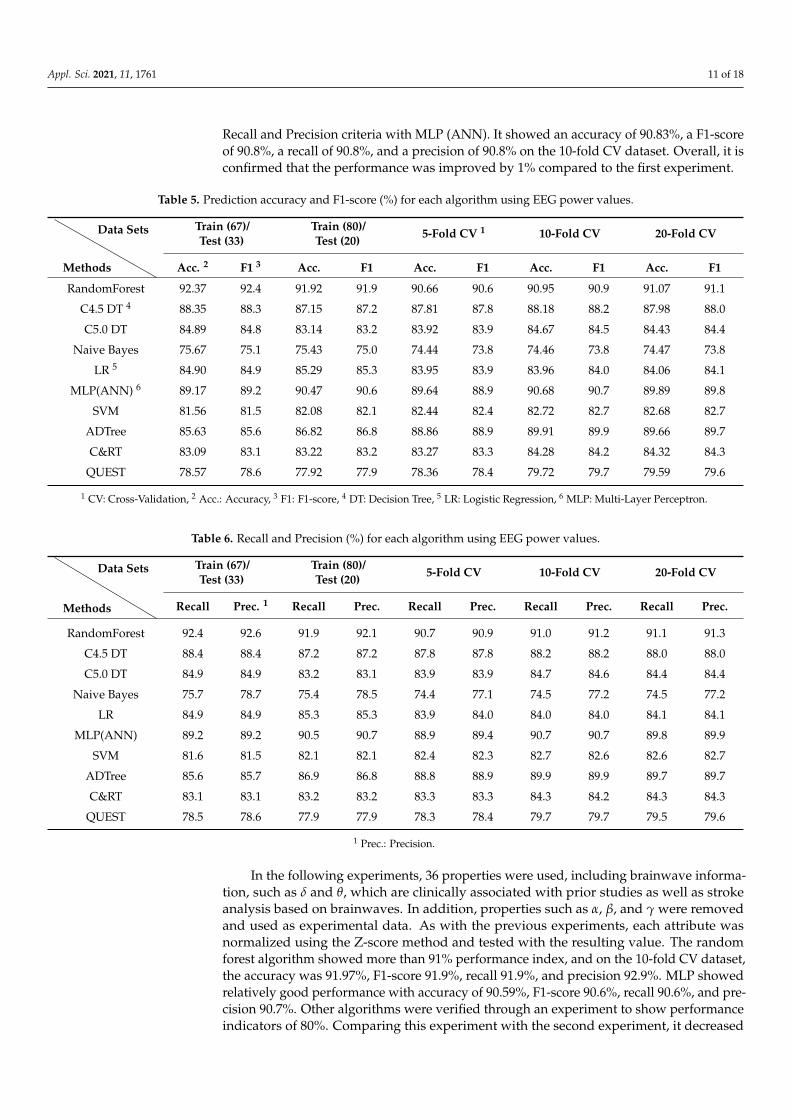
Recall and Precision criteria with MLP (ANN). It showed an accuracy of 90.83%, a F1-scoreof 90.8%, a recall of 90.8%, and a precision of 90.8% on the 10-fold CV dataset. Overall, it isconfirmed that the performance was improved by 1% compared to the first experiment.
Table 5. Prediction accuracy and F1-score (%) for each algorithm using EEG power values.
Methods
Data Sets Train (67)/Test (33)
Train (80)/Test (20) 5-Fold CV 1 10-Fold CV 20-Fold CV
Acc. 2 F1 3 Acc. F1 Acc. F1 Acc. F1 Acc. F1
RandomForest 92.37 92.4 91.92 91.9 90.66 90.6 90.95 90.9 91.07 91.1
C4.5 DT 4 88.35 88.3 87.15 87.2 87.81 87.8 88.18 88.2 87.98 88.0
C5.0 DT 84.89 84.8 83.14 83.2 83.92 83.9 84.67 84.5 84.43 84.4
Naive Bayes 75.67 75.1 75.43 75.0 74.44 73.8 74.46 73.8 74.47 73.8
LR 5 84.90 84.9 85.29 85.3 83.95 83.9 83.96 84.0 84.06 84.1
MLP(ANN) 6 89.17 89.2 90.47 90.6 89.64 88.9 90.68 90.7 89.89 89.8
SVM 81.56 81.5 82.08 82.1 82.44 82.4 82.72 82.7 82.68 82.7
ADTree 85.63 85.6 86.82 86.8 88.86 88.9 89.91 89.9 89.66 89.7
C&RT 83.09 83.1 83.22 83.2 83.27 83.3 84.28 84.2 84.32 84.3
QUEST 78.57 78.6 77.92 77.9 78.36 78.4 79.72 79.7 79.59 79.6
1 CV: Cross-Validation, 2 Acc.: Accuracy, 3 F1: F1-score, 4 DT: Decision Tree, 5 LR: Logistic Regression, 6 MLP: Multi-Layer Perceptron.
Table 6. Recall and Precision (%) for each algorithm using EEG power values.
Methods
Data Sets Train (67)/Test (33)
Train (80)/Test (20) 5-Fold CV 10-Fold CV 20-Fold CV
Recall Prec. 1 Recall Prec. Recall Prec. Recall Prec. Recall Prec.
RandomForest 92.4 92.6 91.9 92.1 90.7 90.9 91.0 91.2 91.1 91.3
C4.5 DT 88.4 88.4 87.2 87.2 87.8 87.8 88.2 88.2 88.0 88.0
C5.0 DT 84.9 84.9 83.2 83.1 83.9 83.9 84.7 84.6 84.4 84.4
Naive Bayes 75.7 78.7 75.4 78.5 74.4 77.1 74.5 77.2 74.5 77.2
LR 84.9 84.9 85.3 85.3 83.9 84.0 84.0 84.0 84.1 84.1
MLP(ANN) 89.2 89.2 90.5 90.7 88.9 89.4 90.7 90.7 89.8 89.9
SVM 81.6 81.5 82.1 82.1 82.4 82.3 82.7 82.6 82.6 82.7
ADTree 85.6 85.7 86.9 86.8 88.8 88.9 89.9 89.9 89.7 89.7
C&RT 83.1 83.1 83.2 83.2 83.3 83.3 84.3 84.2 84.3 84.3
QUEST 78.5 78.6 77.9 77.9 78.3 78.4 79.7 79.7 79.5 79.6
1 Prec.: Precision.
In the following experiments, 36 properties were used, including brainwave informa-tion, such as δ and θ, which are clinically associated with prior studies as well as strokeanalysis based on brainwaves. In addition, properties such as α, β, and γ were removedand used as experimental data. As with the previous experiments, each attribute wasnormalized using the Z-score method and tested with the resulting value. The randomforest algorithm showed more than 91% performance index, and on the 10-fold CV dataset,the accuracy was 91.97%, F1-score 91.9%, recall 91.9%, and precision 92.9%. MLP showedrelatively good performance with accuracy of 90.59%, F1-score 90.6%, recall 90.6%, and pre-cision 90.7%. Other algorithms were verified through an experiment to show performanceindicators of 80%. Comparing this experiment with the second experiment, it decreased

Appl. Sci. 2021, 11, 1761 12 of 18
by about 1% in performance indicators including accuracy. However, by reducing thenumber of attributes used in the experiment by 36, the advantage of using less computingresources and an easier system operation in terms of the service of the stroke predictionmodel was obtained.
In the last experiment employing power values, the optimal set of attributes usingEquation (1) is: Fz(θ), Fz(θ_to_β), Fz(IDAR), Fz(RRI), T7(RRI), C1(DAR), Oz(IDAR), andT8(RRI). Only eight were tested and analyzed for algorithm-specific predictive accuracy (seeTable 2). Comprehensively examining the experimental results, most of the performanceindicators were 80%. Regarding the Random Forest algorithm on the 10-fold CV dataset,the accuracy was 87.12%, F1-score 87.4%, recall 87.4%, and precision 87.4%, showingrelatively good performance. The accuracy of the C4.5 DT algorithm was 86.39%, F1-score85.79%, recall 86.4%, and precision 85.2%. Although the overall performance is inferior tothe previous experiment, it could obtain the advantage of enabling semantic interpretationbased on rule-based analysis and leaf node of decision tree. This semantic interpretationand in-depth analysis are explained in detail in Section 4.4.
4.3.2. Predicting and Analyzing Stroke Diseases Based on Relative Values
In the first experiment, 2979 data sets of the general elderly and the elderly with strokewere extracted and tested, respectively, with their relative values. Tables 7 and 8 belowuse 66 complete attributes and show prediction accuracy and performance indicators ofF1-score, recall, and prescription by algorithm.
Table 7. Prediction accuracy and F1-score (%) for each algorithm using EEG relative values.
Methods
Data Sets Train (67)/Test (33)
Train (80)/Test (20) 5-Fold CV 10-Fold CV 20-Fold CV
Acc. F1 Acc. F1 Acc. F1 Acc. F1 Acc. F1
RandomForest 89.19 89.2 89.77 89.8 89.76 89.8 90.50 90.5 90.16 90.2
C4.5 DT 81.38 81.4 83.56 83.6 82.49 82.5 82.86 82.8 82.49 82.5
C5.0 DT 77.05 77.1 78.85 78.9 77.69 77.7 78.73 78.7 78.81 78.8
Naive Bayes 72.99 72.9 73.74 73.6 73.53 83.4 73.45 73.3 73.39 73.2
LR 78.54 78.5 79.11 79.1 78.70 78.7 78.68 78.7 78.60 78.6
MLP(ANN) 84.35 84.4 86.41 86.4 86.06 86.1 87.11 87.1 87.03 87.0
SVM 74.21 74.2 74.82 74.8 73.91 73.9 74.65 74.7 74.42 74.4
ADTree 79.91 79.9 79.36 79.4 79.33 79.3 79.48 79.5 79.31 79.3
C&RT 80.12 80.1 80.34 80.3 80.24 80.2 80.47 80.5 80.42 80.4
QUEST 73.88 73.9 73.91 73.9 73.55 73.6 73.94 73.7 73.75 73.8
In the second experiment, for all 66 attributes, the Z-score method (Equation (2)) ofnormalization was applied and these values were used for testing. In this experiment,Z-score was applied to the datasets used in Tables 7 and 8, and performance indicatorsranged from 75% to 87% for each algorithm. In particular, regarding the Random Forestalgorithm on the 10-fold CV dataset, the accuracy was 87.52%, F1-score 92.5%, recall 92.5%,and precision 92.8%, showing relatively good performance.
In the following experiments, 36 attributes, including brainwave information such asdelta (δ) and theta (θ), which are highly associated with EEG-based stroke analysis andprevious experiments, were normalized with Z-score methods and subsequently tested. Inthis experiment, performance indicators ranged from 72 to 85% for each algorithm. Similarto the previous experiment, regarding the Random Forest algorithm on the 20-fold CVdataset, the accuracy of 86.15%, F1-score 86.1%, recall 86.2%, and precision 86.2% wereconfirmed. On the other hand, regarding the SVM algorithm on the 5-fold CV dataset, theaccuracy was 72.07%, F1-score 72.1%, recall 72.0%, and precision 72.3%. Compared to the
Appl. Sci. 2021, 11, 1761 13 of 18
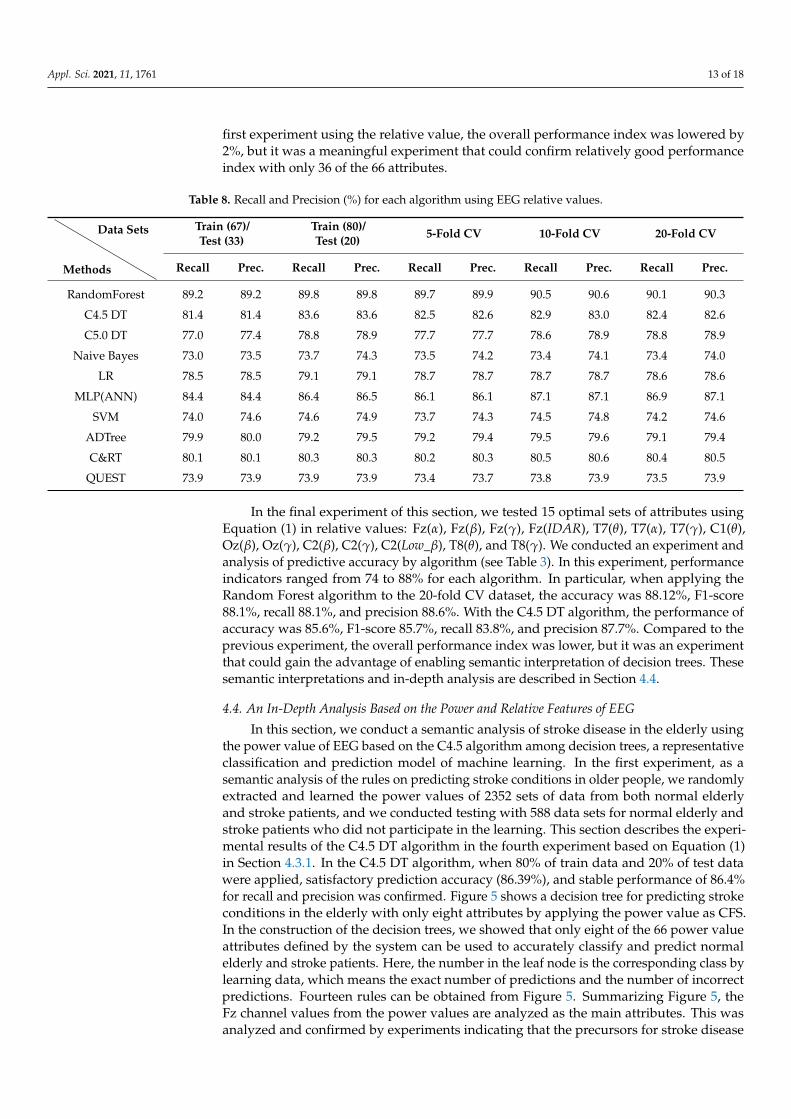
first experiment using the relative value, the overall performance index was lowered by2%, but it was a meaningful experiment that could confirm relatively good performanceindex with only 36 of the 66 attributes.
Table 8. Recall and Precision (%) for each algorithm using EEG relative values.
Methods
Data Sets Train (67)/Test (33)
Train (80)/Test (20) 5-Fold CV 10-Fold CV 20-Fold CV
Recall Prec. Recall Prec. Recall Prec. Recall Prec. Recall Prec.
RandomForest 89.2 89.2 89.8 89.8 89.7 89.9 90.5 90.6 90.1 90.3
C4.5 DT 81.4 81.4 83.6 83.6 82.5 82.6 82.9 83.0 82.4 82.6
C5.0 DT 77.0 77.4 78.8 78.9 77.7 77.7 78.6 78.9 78.8 78.9
Naive Bayes 73.0 73.5 73.7 74.3 73.5 74.2 73.4 74.1 73.4 74.0
LR 78.5 78.5 79.1 79.1 78.7 78.7 78.7 78.7 78.6 78.6
MLP(ANN) 84.4 84.4 86.4 86.5 86.1 86.1 87.1 87.1 86.9 87.1
SVM 74.0 74.6 74.6 74.9 73.7 74.3 74.5 74.8 74.2 74.6
ADTree 79.9 80.0 79.2 79.5 79.2 79.4 79.5 79.6 79.1 79.4
C&RT 80.1 80.1 80.3 80.3 80.2 80.3 80.5 80.6 80.4 80.5
QUEST 73.9 73.9 73.9 73.9 73.4 73.7 73.8 73.9 73.5 73.9
In the final experiment of this section, we tested 15 optimal sets of attributes usingEquation (1) in relative values: Fz(α), Fz(β), Fz(γ), Fz(IDAR), T7(θ), T7(α), T7(γ), C1(θ),Oz(β), Oz(γ), C2(β), C2(γ), C2(Low_β), T8(θ), and T8(γ). We conducted an experiment andanalysis of predictive accuracy by algorithm (see Table 3). In this experiment, performanceindicators ranged from 74 to 88% for each algorithm. In particular, when applying theRandom Forest algorithm to the 20-fold CV dataset, the accuracy was 88.12%, F1-score88.1%, recall 88.1%, and precision 88.6%. With the C4.5 DT algorithm, the performance ofaccuracy was 85.6%, F1-score 85.7%, recall 83.8%, and precision 87.7%. Compared to theprevious experiment, the overall performance index was lower, but it was an experimentthat could gain the advantage of enabling semantic interpretation of decision trees. Thesesemantic interpretations and in-depth analysis are described in Section 4.4.
4.4. An In-Depth Analysis Based on the Power and Relative Features of EEG
In this section, we conduct a semantic analysis of stroke disease in the elderly usingthe power value of EEG based on the C4.5 algorithm among decision trees, a representativeclassification and prediction model of machine learning. In the first experiment, as asemantic analysis of the rules on predicting stroke conditions in older people, we randomlyextracted and learned the power values of 2352 sets of data from both normal elderlyand stroke patients, and we conducted testing with 588 data sets for normal elderly andstroke patients who did not participate in the learning. This section describes the experi-mental results of the C4.5 DT algorithm in the fourth experiment based on Equation (1)in Section 4.3.1. In the C4.5 DT algorithm, when 80% of train data and 20% of test datawere applied, satisfactory prediction accuracy (86.39%), and stable performance of 86.4%for recall and precision was confirmed. Figure 5 shows a decision tree for predicting strokeconditions in the elderly with only eight attributes by applying the power value as CFS.In the construction of the decision trees, we showed that only eight of the 66 power valueattributes defined by the system can be used to accurately classify and predict normalelderly and stroke patients. Here, the number in the leaf node is the corresponding class bylearning data, which means the exact number of predictions and the number of incorrectpredictions. Fourteen rules can be obtained from Figure 5. Summarizing Figure 5, theFz channel values from the power values are analyzed as the main attributes. This wasanalyzed and confirmed by experiments indicating that the precursors for stroke disease

Appl. Sci. 2021, 11, 1761 14 of 18
in older people were significant in the frontal lobe of the brain. Further, as shown inprevious studies, attribute values such as θ_to_β(θ/β), PRI(δ+θ)/(α+β), and theta (θ) arewell identifiable and predictable for the characteristics of stroke patient brain waves.
Appl. Sci. 2021, 11, x FOR PEER REVIEW 15 of 20
Figure 5. The C4.5 decision tree for elderly stroke prediction and monitoring based on power value (14 rules).
Figure 6 shows the experimental results of extracting eight attributes from the power values through the CFS and applying 10-fold CV. When compared to Figure 5, these ex-perimental results suggest that stroke precursors in older people can be accurately pre-dicted and determined by only seven rules. We showed the improvement in the predic-tion accuracy of stroke disease to 86.96%. A detailed interpretation of the seven rules in Figure 6 is presented in Table 9.
Figure 6. The C4.5 decision tree learning eight features of power value with 10-fold CV (7 rules).
Table 9. The rules for elderly stroke prediction with only eight features of 10-fold CV (Figure 6).
Rules The Rule and In-Depth Analysis 1 IF Fz_PRI 102.4606 then Stroke.
2 IF Fz_PRI > 102.4606 and Fz_Theta 0.000039 and Fz_PRI 2526416.637 and C1_DAR 84.787 then Normal.
3 IF Fz_PRI > 102.4606 and Fz_Theta 0.000039 and Fz_PRI 2526416.637 and C1_DAR > 84.787 then Stroke.
4 IF Fz_PRI > 102.4606 and Fz_Theta 0.000039 and Fz_PRI > 2526416.637 and T7_PRI 4.483 then Normal.
5 IF Fz_PRI > 102.4606 and Fz_Theta 0.000039 and Fz_PRI > 2526416.637 and T7_PRI > 4.483 and Fz_PRI 2836110.757 then Normal.
6 IF Fz_PRI > 102.4606 and Fz_Theta 0.000039 and Fz_PRI > 2526416.637 and T7_PRI > 4.483 and Fz_PRI > 2836110.757 then Stroke.
Figure 5. The C4.5 decision tree for elderly stroke prediction and monitoring based on power value (14 rules).
Figure 6 shows the experimental results of extracting eight attributes from the powervalues through the CFS and applying 10-fold CV. When compared to Figure 5, theseexperimental results suggest that stroke precursors in older people can be accuratelypredicted and determined by only seven rules. We showed the improvement in theprediction accuracy of stroke disease to 86.96%. A detailed interpretation of the seven rulesin Figure 6 is presented in Table 9.
Appl. Sci. 2021, 11, x FOR PEER REVIEW 15 of 20
Figure 5. The C4.5 decision tree for elderly stroke prediction and monitoring based on power value (14 rules).
Figure 6 shows the experimental results of extracting eight attributes from the power values through the CFS and applying 10-fold CV. When compared to Figure 5, these ex-perimental results suggest that stroke precursors in older people can be accurately pre-dicted and determined by only seven rules. We showed the improvement in the predic-tion accuracy of stroke disease to 86.96%. A detailed interpretation of the seven rules in Figure 6 is presented in Table 9.
Figure 6. The C4.5 decision tree learning eight features of power value with 10-fold CV (7 rules).
Table 9. The rules for elderly stroke prediction with only eight features of 10-fold CV (Figure 6).
Rules The Rule and In-Depth Analysis 1 IF Fz_PRI 102.4606 then Stroke.
2 IF Fz_PRI > 102.4606 and Fz_Theta 0.000039 and Fz_PRI 2526416.637 and C1_DAR 84.787 then Normal.
3 IF Fz_PRI > 102.4606 and Fz_Theta 0.000039 and Fz_PRI 2526416.637 and C1_DAR > 84.787 then Stroke.
4 IF Fz_PRI > 102.4606 and Fz_Theta 0.000039 and Fz_PRI > 2526416.637 and T7_PRI 4.483 then Normal.
5 IF Fz_PRI > 102.4606 and Fz_Theta 0.000039 and Fz_PRI > 2526416.637 and T7_PRI > 4.483 and Fz_PRI 2836110.757 then Normal.
6 IF Fz_PRI > 102.4606 and Fz_Theta 0.000039 and Fz_PRI > 2526416.637 and T7_PRI > 4.483 and Fz_PRI > 2836110.757 then Stroke.
Figure 6. The C4.5 decision tree learning eight features of power value with 10-fold CV (7 rules).
A comprehensive analysis of Figure 6 and Table 9 above yields that the PRI(δ + θ)/(α + β)values in the frontal lobe are the most important attribute for classifying stroke brain signals,and that θ values are also used as important attributes.
The second experiment is the same as the first experimental scenario, and we proceedwith relative values instead of power values. In other words, both experiments wereconducted by dividing the data into 80% for the learning data and 20% for the test data,in Section 4.3.2, which achieve stable performances of 83.8% and 87.7%, respectively, inprediction accuracy (85.6%), along with reproducibility and precision. The performanceindicators, including prediction accuracy, were slightly lower than those of the experimentswith power values, but they were identified when relative values were used, and none

Appl. Sci. 2021, 11, 1761 15 of 18
of the key attributes of power values were present. Figure 7 shows a decision tree forpredicting stroke conditions in the elderly with only 15 attributes by applying the relativevalue as CFS. Experiments have shown that in the construction of decision trees, only15 of the 66 relative value attributes defined by the system can accurately predict strokeprecursors for normal and stroke elderly. Seventeen rules can be obtained from Figure 7.
Table 9. The rules for elderly stroke prediction with only eight features of 10-fold CV (Figure 6).
Rules The Rule and In-Depth Analysis
1 IF Fz_PRI ≤ 102.4606 then Stroke.
2 IF Fz_PRI > 102.4606 and Fz_Theta ≤ 0.000039 and Fz_PRI ≤ 2,526,416.637and C1_DAR ≤ 84.787 then Normal.
3 IF Fz_PRI > 102.4606 and Fz_Theta ≤ 0.000039 and Fz_PRI ≤ 2,526,416.637and C1_DAR > 84.787 then Stroke.
4 IF Fz_PRI > 102.4606 and Fz_Theta ≤ 0.000039 and Fz_PRI > 2,526,416.637and T7_PRI ≤ 4.483 then Normal.
5 IF Fz_PRI > 102.4606 and Fz_Theta ≤ 0.000039 and Fz_PRI > 2,526,416.637and T7_PRI > 4.483 and Fz_PRI ≤ 2,836,110.757 then Normal.
6 IF Fz_PRI > 102.4606 and Fz_Theta ≤ 0.000039 and Fz_PRI > 2,526,416.637and T7_PRI > 4.483 and Fz_PRI > 2,836,110.757 then Stroke.
7 IF Fz_PRI > 102.4606 and Fz_Theta > 0.000039 then Stroke.
Appl. Sci. 2021, 11, x FOR PEER REVIEW 16 of 20
7 IF Fz_PRI > 102.4606 and Fz_Theta > 0.000039 then Stroke.
A comprehensive analysis of Figure 6 and Table 9 above yields that the PRI( + )/( + ) values in the frontal lobe are the most important attribute for classifying stroke brain signals, and that values are also used as important attributes.
The second experiment is the same as the first experimental scenario, and we proceed with relative values instead of power values. In other words, both experiments were con-ducted by dividing the data into 80% for the learning data and 20% for the test data, in Section 4.3.2, which achieve stable performances of 83.8% and 87.7%, respectively, in pre-diction accuracy (85.6%), along with reproducibility and precision. The performance indi-cators, including prediction accuracy, were slightly lower than those of the experiments with power values, but they were identified when relative values were used, and none of the key attributes of power values were present. Figure 7 shows a decision tree for pre-dicting stroke conditions in the elderly with only 15 attributes by applying the relative value as CFS. Experiments have shown that in the construction of decision trees, only 15 of the 66 relative value attributes defined by the system can accurately predict stroke pre-cursors for normal and stroke elderly. Seventeen rules can be obtained from Figure 7.
Figure 7. The C4.5 decision tree for elderly stroke prediction and monitoring based on relative value (17 rules).
Figure 8 shows the experimental results of extracting 15 key attributes via CFS from the relative values and applying 10-fold CV. These experimental results indicate that rel-ative values can accurately predict and determine stroke precursors in older people with only 13 rules, as compared to the results illustrated in Figure 8. The predicted accuracy of stroke disease was 84.5%. By reducing and simplifying from 17 rules to 13 rules, the de-velopment and implementation of stroke monitoring systems for the elderly can help.
Figure 7. The C4.5 decision tree for elderly stroke prediction and monitoring based on relative value(17 rules).
Figure 8 shows the experimental results of extracting 15 key attributes via CFS from therelative values and applying 10-fold CV. These experimental results indicate that relativevalues can accurately predict and determine stroke precursors in older people with only13 rules, as compared to the results illustrated in Figure 8. The predicted accuracy of strokedisease was 84.5%. By reducing and simplifying from 17 rules to 13 rules, the developmentand implementation of stroke monitoring systems for the elderly can help.
In a comprehensive analysis of the experiments using relative value, the properties ofFz channels corresponding to the frontal lobe, as shown in power values, are consideredto be important properties for predicting stroke precursors in older people. However, therelative value data confirmed that the alpha (α) property of the Fz channel, which wasnot used in deep analysis using power values, was a significant value for determiningand predicting the precursor symptoms of stroke. Further, through an in-depth analysisusing relative value, we experimentally validate that not only Fz, but also attribute valuesfor measurement positions such as T8, C2, and T7, are meaningful. Specifically, theanalysis based on attributes extracted from relative value showed that θ_to_β(θ/β) andPRI(δ+θ)/(α+β) utilized in experiments employing power value were not used. As a

Appl. Sci. 2021, 11, 1761 16 of 18
result, the experimental and in-depth analysis results showed that the entire portion of thebrainwave measurement location is evenly utilized in the prediction of stroke precursorsin older people using the attribute value of relative value.
Appl. Sci. 2021, 11, x FOR PEER REVIEW 17 of 20
Figure 8. The C4.5 decision tree learning eight features of relative value with 10-fold CV (13 rules).
In a comprehensive analysis of the experiments using relative value, the properties of Fz channels corresponding to the frontal lobe, as shown in power values, are considered to be important properties for predicting stroke precursors in older people. However, the relative value data confirmed that the alpha ( ) property of the Fz channel, which was not used in deep analysis using power values, was a significant value for determining and predicting the precursor symptoms of stroke. Further, through an in-depth analysis using relative value, we experimentally validate that not only Fz, but also attribute values for measurement positions such as T8, C2, and T7, are meaningful. Specifically, the analysis based on attributes extracted from relative value showed that _to_ ( / ) and PRI( + )/( + ) utilized in experiments employing power value were not used. As a result, the experimental and in-depth analysis results showed that the entire portion of the brain-wave measurement location is evenly utilized in the prediction of stroke precursors in older people using the attribute value of relative value.
5. Conclusions We propose a new health monitoring system that detects and predicts the precursor
symptoms of stroke diseases with the attribute information of power and relative values from raw data in the form of brain waves collected during elderly walking. Further, the prediction and analysis model in machine-learning attempts to analyze the results of real-time predictions and experiments of stroke disease in older people. In addition, to gener-alize machine-learning-based predictive models, the measurement positions are diversi-fied to extract raw spectra, raw spectrum, alpha ( ), beta ( ), gamma ( ), delta ( ), and theta ( ) values from six channels (Fz, Oz, T7, T8, C1, and C2) as well as low and high
. By extracting additional ratio values between and , 66 new attributes were ulti-mately discovered and tested. Above all, the health monitoring system in this study can detect and predict the precursors of stroke, a fatal disease for elderly people, in real time, thus providing accurate prediction results in a system that can be implemented at a low cost. This is an important experimental result that can detect the possibility of an outbreak of stroke disease early and provide scientific rules that can interpret it. As a result, the system in this study has great advantages, as it can provide in-depth analysis information useful for older patients, particularly about everyday activities such as walking. Thus, the proposed system and experimental results in this paper imply that they are meaningful findings that can reduce the aftereffects of stroke as well as social and economic losses.
In the future, research on stroke and other important diseases in the elderly should be conducted based on various real-time biological signals such as ECG and EMG as well as EEG. We will also study the prediction of precursors and outbreaks by disease and conduct in-depth analyses. We believe this will be a significant step toward developing more reliable and clinically useful health and disease prediction methods such as cancer
Figure 8. The C4.5 decision tree learning eight features of relative value with 10-fold CV (13 rules).
5. Conclusions
We propose a new health monitoring system that detects and predicts the precursorsymptoms of stroke diseases with the attribute information of power and relative valuesfrom raw data in the form of brain waves collected during elderly walking. Further,the prediction and analysis model in machine-learning attempts to analyze the resultsof real-time predictions and experiments of stroke disease in older people. In addition,to generalize machine-learning-based predictive models, the measurement positions arediversified to extract raw spectra, raw spectrum, alpha (α), beta (β), gamma (γ), delta (δ),and theta (θ) values from six channels (Fz, Oz, T7, T8, C1, and C2) as well as low β andhigh β. By extracting additional ratio values between θ and β, 66 new attributes wereultimately discovered and tested. Above all, the health monitoring system in this study candetect and predict the precursors of stroke, a fatal disease for elderly people, in real time,thus providing accurate prediction results in a system that can be implemented at a lowcost. This is an important experimental result that can detect the possibility of an outbreakof stroke disease early and provide scientific rules that can interpret it. As a result, thesystem in this study has great advantages, as it can provide in-depth analysis informationuseful for older patients, particularly about everyday activities such as walking. Thus, theproposed system and experimental results in this paper imply that they are meaningfulfindings that can reduce the aftereffects of stroke as well as social and economic losses.
In the future, research on stroke and other important diseases in the elderly should beconducted based on various real-time biological signals such as ECG and EMG as well asEEG. We will also study the prediction of precursors and outbreaks by disease and conductin-depth analyses. We believe this will be a significant step toward developing morereliable and clinically useful health and disease prediction methods such as cancer andheart disease for the elderly through multimodal studies combining various vital signals,individual-specific electronic medical recording (EMR) data, and image information suchas CT and MRI information.

Appl. Sci. 2021, 11, 1761 17 of 18
Author Contributions: Conceptualization, Y.-AC. and J.Y.; methodology, Y.-AC., S.P., J.-A.J., C.M.B.H.,C.-S.P., H.L. and J.Y.; software, Y.-AC. and J.Y.; validation, Y.-AC., S.P., J.-A.J., C.M.B.H., C.-S.P., H.L.and J.Y.; formal analysis, Y.-AC. and J.Y.; investigation, Y.-AC., S.P., J.-A.J., C.M.B.H., C.-S.P., H.L. andJ.Y.; resources, Y.-AC. and J.Y.; data curation, Y.-AC. and J.Y.; writing—original draft preparation,Y.-AC., S.P., J.-A.J., C.M.B.H., C.-S.P., H.L. and J.Y.; writing—review and editing, Y.-AC., H.L. and J.Y.;visualization, Y.-AC. and J.Y.; supervision, J.Y and C.-S.P.; project administration, C.-S.P.; fundingacquisition, C.-S.P. All authors have read and agreed to the published version of the manuscript.
Funding: This work was supported by the National Research Council of Science & Technology (NST)grant by the Korea government (MSIP) (No. CRC-15-05-ETRI).
Institutional Review Board Statement: This paper was researched after review and approval byKRISS-IRB (Institutional Bioethics Committee of Korea Research Institute of Standards and Science).
Informed Consent Statement: Informed consent was obtained from all subjects involved in the study.
Conflicts of Interest: The authors declare no conflict of interest.
References1. Seo, K.-D.; Kang, M.J.; Kim, G.S.; Lee, J.H.; Suh, S.H.; Lee, K.-Y. National Trends in Clinical Outcomes of Endovascular Therapy
for Ischemic Stroke in South Korea between 2008 and 2016. J. Stroke 2020, 22, 412–415. [CrossRef]2. Mackay, J.; Mensah, G.A. The Atlas of Heart Disease and Stroke; World Health Organization: Geneva, Switzerland, 2004; pp. 22–43.3. Kim, J.Y.; Bae, H.-J. Spontaneous Intracerebral Hemorrhage: Management. J. Stroke 2017, 19, 28–39. [CrossRef] [PubMed]4. Johansson, B.B. Hypertension Mechanisms Causing Stroke. Clin. Exp. Pharmacol. Physiol. 1999, 26, 563–565. [CrossRef] [PubMed]5. Gottesman, R.F.; Hillis, A.E. Predictors and assessment of cognitive dysfunction resulting from ischaemic stroke. Lancet Neurol.
2010, 9, 895–905. [CrossRef]6. Korpelainen, J.T.; Kauhanen, M.-L.; Kemola, H.; Malinen, U.; Myllylä, V.V. Sexual dysfunction in stroke patients. Acta Neurol.
Scand. 1998, 98, 400–405. [CrossRef]7. Pikija, S.; Trkulja, V.; Ramesmayer, C.; Mutzenbach, J.S.; Killer-Oberpfalzer, M.; Hecker, C.; Bubel, N.; Füssel, M.U.; Sellner, J.
Higher Blood Pressure during Endovascular Thrombectomy in Anterior Circulation Stroke Is Associated with Better Outcomes. J.Stroke 2018, 20, 373–384. [CrossRef]
8. Boden-Albala, B.; Litwak, E.; Elkind, M.; Rundek, T.; Sacco, R.L. Social isolation and outcomes post stroke. Neurology 2005, 64,1888–1892. [CrossRef]
9. Langhorne, P.; Bernhardt, J.; Kwakkel, G. Stroke rehabilitation. Lancet 2011, 377, 1693–1702. [CrossRef]10. Bushnell, C.D.; Johnston, D.C.; Goldstein, L.B. Retrospective assessment of initial stroke severity: Comparison of the NIH stroke
scale and the Canadian neurological scale. Stroke 2001, 32, 656–660. [CrossRef]11. Lee, M.; Ryu, J.; Kim, D. Automated epileptic seizure waveform detection method based on the feature of the mean slope of
wavelet coefficient counts using a hidden Markov model and EEG signals. ETRI J. 2020, 42, 217–229. [CrossRef]12. Lyden, P.; Brott, T.; Tilley, B.; Welch, K.M.; Mascha, E.J.; Levine, S.; Haley, E.C.; Grotta, J.; Marler, J. Improved reliability of the NIH
Stroke Scale using video training. NINDS TPA Stroke Study Group. Stroke 1994, 25, 2220–2226. [CrossRef]13. Lee, J.S.; Park, J.M.; Park, T.H.; Lee, K.B.; Lee, S.J.; Cho, Y.J.; Lee, J.Y. Development of a stroke prediction model for Korean. J.
Korean Neurol. Assoc. 2010, 28, 13–21.14. D’Agostino, R.B.; A Wolf, P.; Belanger, A.J.; Kannel, W.B. Stroke risk profile: Adjustment for antihypertensive medication. The
Framingham Study. Stroke 1994, 25, 40–43. [CrossRef]15. Musuka, T.D.; Wilton, S.B.; Traboulsi, M.; Hill, M.D. Diagnosis and management of acute ischemic stroke: Speed is critical. Can.
Med Assoc. J. 2015, 187, 887–893. [CrossRef] [PubMed]16. Kannel, W.; McGee, D.; Castelli, W. Latest perspectives on cigarette smoking and cardiovascular disease: The Framingham Study.
J. Card. Rehabil. 1984, 4, 267–277.17. Carroll, K.J. On the use and utility of the Weibull model in the analysis of survival data. Control. Clin. Trials 2003, 24, 682–701.
[CrossRef]18. Zhang, J.; Zhu, P.; Liu, B.; Yao, Q.; Yan, K.; Zheng, Q.; Li, Y.; Zhang, L.; Li, M.; Wang, J.; et al. Time to recurrence after first-ever
ischaemic stroke within 3 years and its risk factors in Chinese population: A prospective cohort study. BMJ Open 2019, 9, e032087.[CrossRef] [PubMed]
19. Cicioglu, M.; Çalhan, A. SDN-based wireless body area network routing algorithm for healthcare architecture. ETRI J. 2019, 41,452–464. [CrossRef]
20. Subasi, A.; Alkan, A.; Koklukaya, E.; Kiymik, M.K. Wavelet neural network classification of EEG signals by using AR model withMLE preprocessing. Neural Netw. 2005, 18, 985–997. [CrossRef]
21. Guler, I.; Ubeyli, E.D. Multiclass Support Vector Machines for EEG-Signals Classification. IEEE Trans. Inf. Technol. Biomed. 2007,11, 117–126. [CrossRef] [PubMed]
22. Rim, B.; Sung, N.-J.; Min, S.; Hong, M. Deep Learning in Physiological Signal Data: A Survey. Sensors 2020, 20, 969. [CrossRef]

Appl. Sci. 2021, 11, 1761 18 of 18
23. Williams, G.W.; Lüders, H.O.; Brickner, A.; Goormastic, M.; Klass, D.W. Interobserver variability in EEG interpretation. Neurology1985, 35, 1714. [CrossRef] [PubMed]
24. Benbadis, S.R.; Lafrance, W.C.; Papandonatos, G.D.; Korabathina, K.; Lin, K.; Kraemer, H.C.; Workshop, F.T.N.T. Interraterreliability of EEG-video monitoring. Neurology 2009, 73, 843–846. [CrossRef] [PubMed]
25. Toraman, S.; Tuncer, S.A.; Balgetir, F. Is it possible to detect cerebral dominance via EEG signals by using deep learning? MedHypotheses 2019, 131, 109315. [CrossRef]
26. Sakhavi, S.; Guan, C.; Yan, S. Learning Temporal Information for Brain-Computer Interface Using Convolutional Neural Networks.IEEE Trans. Neural Netw. Learn. Syst. 2018, 29, 5619–5629. [CrossRef] [PubMed]
27. Kwon, Y.-H.; Shin, S.-B.; Kim, S.-D. Electroencephalography Based Fusion Two-Dimensional (2D)-Convolution Neural Networks(CNN) Model for Emotion Recognition System. Sensors 2018, 18, 1383. [CrossRef]
28. Bălan, O.; Moise, G.; Moldoveanu, A.; Leordeanu, M.; Moldoveanu, F. Fear Level Classification Based on Emotional Dimensionsand Machine Learning Techniques. Sensors 2019, 19, 1738. [CrossRef]
29. Chambon, S.; Thorey, V.; Arnal, P.; Mignot, E.; Gramfort, A. DOSED: A deep learning approach to detect multiple sleepmicro-events in EEG signal. J. Neurosci. Methods 2019, 321, 64–78. [CrossRef] [PubMed]
30. Acharya, R.; Faust, O.; Kannathal, N.; Chua, T.L.; Laxminarayan, S. Non-linear analysis of EEG signals at various sleep stages.Comput. Methods Programs Biomed. 2005, 80, 37–45. [CrossRef]
31. Tian, X.; Deng, Z.; Ying, W.; Choi, K.-S.; Wu, D.; Qin, B.; Wang, J.; Shen, H.; Wang, S. Deep Multi-View Feature Learning forEEG-Based Epileptic Seizure Detection. IEEE Trans. Neural Syst. Rehabil. Eng. 2019, 27, 1962–1972. [CrossRef]
32. Acharya, U.R.; Oh, S.L.; Hagiwara, Y.; Tan, J.H.; Adeli, H.; Subha, D.P. Automated EEG-based screening of depression using deepconvolutional neural network. Comput. Methods Programs Biomed. 2018, 161, 103–113. [CrossRef]
33. Kim, D.; Kim, K. Detection of Early Stage Alzheimer’s Disease using EEG Relative Power with Deep Neural Network. InProceedings of the 2018 40th Annual International Conference of the IEEE Engineering in Medicine and Biology Society (EMBC),Honolulu, HI, USA, 18–21 July 2018; pp. 352–355.
34. Finnigan, S.; Wong, A.; Read, S.J. Defining abnormal slow EEG activity in acute ischaemic stroke: Delta/alpha ratio as an optimalQEEG index. Clin. Neurophysiol. 2016, 127, 1452–1459. [CrossRef] [PubMed]
35. Schneider, A.L.; Jordan, K.G. Regional Attenuation without Delta (RAWOD): A distinctive EEG pattern that can aid in thediagnosis and management of severe acute ischemic stroke. Am. J. Electroneurodiagnostic Technol. 2005, 45, 102–117. [CrossRef][PubMed]
36. Varelas, P.N.; Hacein-Bey, L. Ischemic Stroke, Hyperperfusion Syndrome, Cerebral Sinus Thrombosis, and Critical Care Seizures.Seizures Crit. Care 2017, 14, 155–186. [CrossRef]
37. Ip, Z.; Rabiller, G.; He, J.W.; Yao, Z.; Akamatsu, Y.; Nishijima, Y.; Liu, J.; Yazdan-Shahmorad, A. Cortical stroke affects activity andstability of theta/delta states in remote hippocampal regions. In Proceedings of the 2019 41st Annual International Conference ofthe IEEE Engineering in Medicine and Biology Society (EMBC), Berlin, Germany, 23–27 July 2019; pp. 5225–5228.
38. Shanthi, D.; Sahoo, G.; Saravanan, N. Designing an artificial neural network model for the prediction of thrombo-embolic stroke.Int. J. Biom. Bioinform. 2009, 3, 10–18.
39. Nwosu, C.S.; Dev, S.; Bhardwaj, P.; Veeravalli, B.; John, D. Predicting Stroke from Electronic Health Records. In Proceedings of the2019 41st Annual International Conference of the IEEE Engineering in Medicine and Biology Society (EMBC), Berlin, Germany,23–27 July 2019; pp. 5704–5707.
40. Bentley, P.; Ganesalingam, J.; Jones, A.L.C.; Mahady, K.; Epton, S.; Rinne, P.; Sharma, P.; Halse, O.; Mehta, A.; Rueckert, D.Prediction of stroke thrombolysis outcome using CT brain machine learning. NeuroImage Clin. 2014, 4, 635–640. [CrossRef]
41. Hanifa, S.M.; Raja, S.K. Stroke risk prediction through non-linear support vector classification models. Int. J. Adv. Res. Comput.Sci. 2010, 1, 47–53.
42. Yu, J.; Park, S.; Kwon, S.-H.; Ho, C.M.B.; Pyo, C.-S.; Lee, H. AI-based Stroke Disease Prediction System Using Real-TimeElectromyography Signals. Appl. Sci. 2020, 10, 6791. [CrossRef]
43. Yu, J.; Kim, D.; Park, H.; Chon, S.-C.; Cho, K.H.; Kim, S.-J.; Yu, S.; Park, S.; Hong, S. Semantic Analysis of NIH Stroke Scale usingMachine Learning Techniques. In Proceedings of the International Conference on Platform Technology and Service (PlatCon),Jeju, Korea, 28–30 January 2019; Institute of Electrical and Electronics Engineers (IEEE): Piscataway, NJ, USA, 2019; pp. 1–5.
44. Yu, J.; Park, S.; Lee, H.; Pyo, C.-S.; Lee, Y.S. An Elderly Health Monitoring System Using Machine Learning and In-Depth AnalysisTechniques on the NIH Stroke Scale. Mathematics 2020, 8, 1115. [CrossRef]
45. Amini, L.; Azarpazhouh, R.; Farzadfar, M.T.; Mousavi, S.A.; Jazaieri, F.; Khorvash, F.; Norouzi, R.; Toghianfar, N. Prediction andControl of Stroke by Data Mining. Int. J. Prev. Med. 2013, 4, S245–S249. [PubMed]
46. Oh, I.-S.; Lee, J.-S.; Moon, B.-R. Hybrid genetic algorithms for feature selection. IEEE Trans. Pattern Anal. Mach. Intell. 2004, 26,1424–1437. [CrossRef] [PubMed]
47. Han, J.; Kamber, M.; Pei, J. Data Mining: Concepts and Techniques, 3rd ed.; Morgan Kaufmann: 225 Wyman Street, Waltham, MA02451, USA, 2011.
48. Hall, M. Correlation-based Feature Selection for Machine Learning. Ph.D. Thesis, Deptartment of Computer Science, WaikatoUniversity, Hamilton, NZ, USA, 1998.
49. Grandini, M.; Bagli, E.; Visani, G. Metrics for multi-class classification: An overview. arXiv 2020, arXiv:2008.05756.