influence of total quality management practices on - UoN ...
91
INFLUENCE OF TOTAL QUALITY MANAGEMENT PRACTICES ON EFFECTIVENESS OF PROJECT MANAGEMENT IN MOI TEACHING AND REFERRAL HOSPITAL UASIN GISHU COUNTY, KENYA BY JOSPHINE CHEROTICH LABOSO RESEARCH PROJECT REPORT SUBMITTED IN PARTIAL FULFILMENT OF THE REQUIREMENTS FOR THE AWARD OF DEGREE OF MASTERS OF ARTS IN PROJECT PLANNING AND MANAGEMENT OF THE UNIVERSITY OF NAIROBI 2016
-
Upload
khangminh22 -
Category
Documents
-
view
0 -
download
0
Transcript of influence of total quality management practices on - UoN ...

INFLUENCE OF TOTAL QUALITY MANAGEMENT PRACTICES ON
EFFECTIVENESS OF PROJECT MANAGEMENT IN MOI TEACHING
AND REFERRAL HOSPITAL UASIN GISHU COUNTY, KENYA
BY
JOSPHINE CHEROTICH LABOSO
RESEARCH PROJECT REPORT SUBMITTED IN PARTIAL FULFILMENT OF THE
REQUIREMENTS FOR THE AWARD OF DEGREE OF MASTERS OF ARTS IN
PROJECT PLANNING AND MANAGEMENT OF THE UNIVERSITY OF NAIROBI
2016

ii
DECLARATION
This research project report is my original work and has not been presented in any other institution.
No other part of this project may be produced without permission of author and/ or University of Nairobi.
Signature: ………………………..………………. Date…………………………….
JOSPHINE CHEROTICH LABOSO
REGISTRATION NUMBER L50/73304/2014
This research project report has been submitted for examination with my approval as a
University Supervisor
Signature: ………………………………………… Date……………………………………..
MR JOHNBOSCO KISIMBII,
LECTURER, DEPARTMENT OF EXTRA MURAL STUDIES,
UNIVERSITY OF NAIROBI

iii
DEDICATION
I dedicate this proposal to my lovely husband Mr. Rotich and our lovely son Adley for their
concerted efforts for the success of this proposal.

iv
ACKNOWLEDGEMENT
I would like to take this opportunity to express my sincere appreciation to Justus Mboya who
gave me invaluable advice on how to go about this study and for going through the proposal
relentlessly. I am grateful for my friend Cornell for his helpful assistance in writing this
proposal. Without their time and support it would be quite challenging to complete this proposal.
Secondly, I would like to appreciate my lecturer Mr. Kisimbii for his guidance and correction
while undertaking this proposal.

v
TABLE OF CONTENTS
DECLARATION ............................................................................................................................ ii
DEDICATION ............................................................................................................................... iii
ACKNOWLEDGEMENT ............................................................................................................. iv
TABLE OF CONTENTS ................................................................................................................ v
LIST OF FIGURES ........................................................................................................................ x
LIST OF TABLES ......................................................................................................................... xi
LIST OF ACRONYMS ............................................................................................................... xiii
ABSTRACT ................................................................................................................................. xiv
CHAPTER ONE: INTRODUCTION ………………..…………………………….…………..1
1.1Background of the Study ...………………………………………………………………..1
1.2 Statement of the Problem .………………………………………………………………..2
1.3 Purpose of the Study .…………………………………………………………………….4
1.4 Objectives of the Study ………………………………………….……………………….4
1.5 Research Questions ………………………………………………..……………………...4
1.6 Study Hypothesis …………………………………………………..……………………..5
1.7 Significance of the Study …………………………………………..……………………..5
1.8 Limitations of the Study ……………………………………………..……………………5
1.9 Delimitations of the Study ……………………………………………..…………………6
1.10 Assumptions of the Study …….………………………………………………………...6
1.11 Definitions of Central terms…..…………………………………………………………6
CHAPTER TWO: LITERATURE REVIEW………………….……..….………..…………...7
2.1 Introduction ………………………………………………………….………………..7

vi
2.2 The Influence of Customer- Focus on Effectiveness of Project
management…………………………………………………………………………..…...7
2.3 The Influence of Supplier Relationship on Effectiveness of Project
Management……………………………….…………………………………..…………..8
2.4 The Influence of Leadership on Effectiveness on Project Management……………...9
2.5 The Influence of Continual Improvement on Effectiveness on Project
Management ……………………………………………………………………………..10
2.6 Theoretical frame work ……………………………………………………………...11
2.7 Conceptual Framework………………………………………………………………14
2.8 Knowledge Gap ……………………………………………………………………..15
2.9 Summary of the Chapter …………………………………………………………….15
CHAPTER THREE: RESEARCH METHODOLOGY….....……………………………….17
3.1 Introduction ………………………………………………………………………….17
3.2 Research Design …………………………………….……………………………….17
3.3 Target population…………………………………………………………………….17
3.4 Sample and Sample Size ……………………………………………………………17
3.4.1. Sampling Procedure ………………………………………………………………17
3.4.2 Sample Size ..……………………………………………………………………...18
3.5 Data Collection method ……………………………………………………………..18
3.6 data Collection Procedure ….………………………………………………………..19
3.7 Validity and Reliability of Research Instruments……………………………………19

vii
3.7.1 Pilot Study …………………………………………………………………………19
3.7.2 Validity of Research Instruments………………………….……………………….19
3.7.3 Reliability of the Research Instruments..……………..……………………………19
3.8 Data Analysis …..…………………………………………………………………...20
3.9 Ethical Considerations ………………………………………………………………20
CHAPTER FOUR: DATA ANALYSIS, PRESENTATION AND INTEPRETATION …..25
4.1 Introduction…………………………………………………………………………………..25
4.2 Questionnaire Response Rate.………………..……………………………………………...25
4.3 Demographic Characteristics of the Respondents…………………………………………...25
4.3.1 Distribution of Respondents by Gender ………………..………………………………….26
4.3.2 Distribution of Respondents by Age ………………………………………………………26
4.3.3 Distribution of Respondents by Education Level …………………………………………27
4.3.4 Distribution of Respondents by Departments ……………………………………….…….27
4.3.5 Distribution of Respondents by Working Period ………………………………………….28
4.3.6 Distribution of Respondents according to Supplying Period………...…………………….28
4.3.7 Distribution of Respondents by Clientele Period ………………………………………….29
4.4 Impact of Customer Service on Project Management Performance …..…………………….30
4.4.1Descriptive Statistics on Customer Focus…………………………………………………..30
4.4.2 Inferential Statistics on Customer Focus ………………………………………………….31
4.5 Impact of Supplier Relationship on Project Management Performance …………………….31
4.5.1 Sourcing for Companies and Suppliers ……………………………………………………32
4.5.2 Timely Delivery …………………………………………………………………………...32
4.5.3 Comprehensive Supplier System ………………………………………………………….33

viii
4.5.4 Payments Duly Paid ………………………………………………………………………34
4.5.5 Continual Monitoring of Delivery and Conformity Check-Ups ………………………….34
4.5.6 Inferential Descriptive on Supplier Relationship and Project Management Performance..35
4.6 Impact of Leadership on Project Management Performance ………………………………36
4.6.1Leadership ensures Conducive Environment ……………………………………………..36
4.6.2 Quality Improvement as Strategy to achieve Profitability ……………………………….36
4.6.3 Incentives increases Performance of Employees………………………………………….37
4.6.4 Miscommunication affects Performance ………………………………………………….38
4.6.5 Employees’ Trust increase their Turnover...……………………………………………….38
4.6.6 Supervisors promotes Customer Satisfaction……………………………………………...39
4.6.7 Inferential Statistics on Leadership and Effectiveness of Project Management …………..39
4.7 Impact of Continual Improvement on Project Management Performance ……...…………..40
4.7.1 CI is adopted in the Organization …………………………………………………………40
4.7.2 Continual Improvement through use of Information System……………………………...41
4.7.3 Continual Improvement through Development of Vision and Mission ………….………..41
4.7.4 Continual Improvement through trainings ……….………………………………………..42
4.7.5 Continual Improvement through Quality Policy….………………………………………..42
4.7.6 Continual Improvement though Data Analysis ……………………………………………43
4.7.7 Continual Improvement through Audit Results .…………………………………………..43
4.8 Inferential Descriptive on Continual Improvement …………………………………………44
CHAPTER FIVE: SUMMARY OF THE FINDINGS, CONCLUSION AND
RECOMMENDATIONS……………………………………………………………………….45
5.1 Introduction ………………………………………………………………………………….45
5.2 Summary of Findings ………………………………………………………………………..45
5.2.1 Influence of Customer focus on Effectiveness of Project management ……………...…...45
ix
5.2.2 Influence of Supplier relationship on Effectiveness of Project Management .…………….46
5.2.3 Influence of Leadership on Effectiveness of Project Management ……………………….46
5.2.4 Influence of Continual Improvement on Effectiveness of Project Management …………47
5.3 Discussion …………………………………………………………………………………...47
5.3.1Customer Focus and Effectiveness of Project Management ……………………………….48
5.3.2Supplier Relationship and Effectiveness of Project Management …………………………48
5.3.3 Leadership and Effectiveness of Project Management ……………………………………49
5.3.4 Continual Improvement and Effectiveness of Project Management ……………………...50
5.4 Conclusion ………………………………………………………………………………..…51
5.5 Recommendations……………………………………………………………………………53
5.6 Suggestions for Further Research …………………………………………………………...53
REFERENCES .………………………………………………………………………………..54
APPENDICES………………………………………………………………………………….60
APPENDIX A: LETTER OF INTRODUCTION ……………………………………………60
APPENDIX I: QUESTIONAIRRE FOR STAFF…………………………………………….61
APPENDIX II: QUESTIONAIRE FOR SUPPLIERS……………………………………….66
APPENDIX III: QUESTIONAIRE FOR CLIENTS…………………………………………71

x
LIST OF FIGURES
Figure 1: Illustration of Conceptual Framework ……………………………………………14

xi
LIST OF TABLES
Table 3.1 Sampling Frame………………………………………………………………………18
Table 4.1 Questionnaire Response Rate…………………………………………………………25
Table 4.2 Representation of Respondents by Gender..………………………………………….26
Table 4.3 Representation of Age Brackets of the Respondents...………………………………..26
Table 4.4 Representation of respondents by Education Level.………………….……………….27
Table 4.5 Representation of Respondents by Departments ……………………………………..27
Table 4.6 Representation of respondents by Working Period ….……………………………….28
Table 4.7 Representation of Respondents by Supplying Period ………………………………..29
Table 4.8 Representation of Respondents by Clientele Period …………………………………29
Table 4.9 Representation of Rating by Respondents ……………………………………………30
Table 4.10 Representation of Respondents’ Awareness ………………………………………..30
Table 4.11 Inferential Description on Customer Focus and Effectiveness of Project
Management……………………………………………………………………………………..31
Table 4.12 Representation of respondents on Sourcing of Companies and Supplies……………32
Table 4.13 Distribution of Response on Timely Delivery ………………………………………33
Table 4.14 Distribution of Respondents on Comprehensive Supplier System…………………..33
Table 4.15 Distribution of respondents on Payments Duly Paid ………………………………..33
Table 4.16 Distribution of respondents on Continual Monitoring of Delivery and Conformity
Check—ups ……………………………………………………………………………………..34
Table 4.17 Inferential Descriptive of Supplier Relationship and Effectiveness of Project
Management Performance …………………………………………………………………….35
Table 4.18 Distribution of Respondents on Leadership ensures Conducive Environment …..36
Table 4.19 Distribution of respondents on Quality Improvement as Strategy ……………….37
Table 4.20 Distribution of Respondents on Incentive increases Employees’ Performance…..37

xii
Table 4.21 Distribution of Respondents on Miscommunication ……………………………..38
Table 4.22 Distribution of Respondents on Employees’ Trust………………………………..38
Table 4.23 Distribution of Respondents on Supervisors Promotes Customer Satisfaction……...38
Table 4.24 Inferential Statistics on Leadership and Effectiveness of Project management……..39
Table 4.25 Distribution of Respondents on Adoption of CI…………………………………….40
Table 4.26 Distribution of Respondents on Information System……………………..…………41
Table 4.27 Distribution of respondents on Development of Vision and Mission……………….41
Table 4.28 Distribution on Respondents on CI through trainings ………………………………42
Table 4.29 Distribution of Respondents on CI through Quality Policy…………………………42
Table 4.30 Distribution of Respondents on CI through Data Analysis ..………………………..43
Table 4.31 Distribution of respondents on CI through Audit Results…………………………...43
Table 4.32 Inferential descriptive in Continual Improvement…………………………………..44

xiii
LIST OF ACRONYMS
CI Continual Improvement
IAEA International Atomic Energy Agency
ROI Return on Investment
SPSS Statistical Package for Social Sciences
TQM Total Quality Management

xiv
ABSTRACT
Total quality management (TQM) is considered a very important factor for the long-term success
of an organization. TQM implementation has been an important aspect for improving
organizational efficiency. The study intended to investigate the influence of TQM practices on
effectives of project management. It further purported to examine the influence of customer-
focus, supplier relationship, leadership and continual improvement on effectiveness on project
management. The study adopted descriptive survey design since the researcher interacted one on
one with the respondent. Data collected using closed-ended questionnaires. The study employed
non-probabilistic approach. Also, systematic and strata sampling techniques was adopted. The
study targeted doctors, nurses, subordinate staff, suppliers and clients hence sample size was 150
respondents. The study concluded that effective project management in an organization should
be customer centric hence continuously improve its products and service delivery. Valuing
clients more increases value of the organization through profitability, cost reduction and
increased market share. The relationship between the suppliers and the organization determines
the performance of the organization. Timely respond is one of the manifests of good relationship.
Poor quality supplier’s products lead to extra cost for purchaser, consequently affecting
operations of the organization. Leadership influence is determined by leadership qualities, policy
direction and social environment. Commitment by top management and leaders in an
organization determine the leadership culture. Successful quality management is highly linked
top management commitment. CI is one of the critical areas of focus in an organization. It entails
modern quality research and practice. An organization should be in capacity to improve its
quality of product and service henceforth minimizing cost burden to the customers. Due to
increased competition in the market, continual improvement is necessary. Lack of CI in
leadership of an organization leads to market share loss to competitors. Training among staffs is
critical to ensure effective implementation of strategies and continual improvements.

1
CHAPTER ONE
INTRODUCTION
1.1 Background of the Study
Total Quality Management (TQM) can be defined as a management strategy that commenced in
1950s and advanced more in 1980s. It is the description of the culture, attitude and organization
of a company that endeavors to provide customers with products and services with aim of
satisfying their needs. The culture in an organization requires quality in all aspects of the
company’s operations. Process should follow certain order with compulsory first ones queuing
first and waste eliminated from the process. According to Esin (2008) it is the method which
management of an organization and its employees get involved in continuous production. Both
quality and management tools are combined purporting to increase business and lower losses. It
serves to eliminate loss causing actions or resources underutilizing. TQM emphasizes.
A study in Iran concluded that managers and other leaders in an organization attain energy
through customers’ satisfaction and organizational survival. All these are embedded in
philosophy of total quality management. A study conducted in Indonesia revealed that Total
quality management (TQM) principles and techniques were adopted almost by every manager in
their management (Musran, 2013). Competitive advantage can be defined as the extent to which
an organization creates a defensible position over its competitors. It is the ability of a firm to
differentiate itself from its competitors as an outcome of its critical decisions. It comprises of
identifying prices, quality, cost of production and delivery.
Total quality management (TQM) is considered a very important factor for the long-term success
of an organization. TQM implementation has been an important aspect for improving
organizational efficiency. The links between TQM and performance have been investigated by
numerous scholars. While examining the relationship between TQM and performance scholars
have used different performance types such as financial, innovative, operational and quality
performance. Recent research on total quality management has examined the relationships
between the Total quality management and organizational performance (Esin, 2008).
Achieving better organizational performance requires successful efficient and effective use of
organisation resources and competencies with the aim of creating and sustaining competitive

2
advantage locally and globally. Competitive advantage can be defined as a status that
organization achieved when it outperforms its competitors in such marketplace. Anoop et.al
(2012) asserted that there are two types or models of competitive advantage which are installed
in the in economic theory. The first one is the market based model which involves the cost and
differentiation and argues that market uncovers inefficient organizations particularly those that
do not offer products for which consumers are prepared to pay premium price. And it's driven by
factors that are external to the organization such as threats and opportunities. The second one is
the resource based model which focuses on the organizations resources and is driven by factors
internal to the organization. Tracey et al (1999) have investigated competitive advantage from
the aspect of, price, cost, delivery, flexibility and quality.
The main intent of this paper was to examine the influence of total quality management on
organizational performance. The study endeavored to find out how practices such as customer-
focus, supplier relationship, leadership, continual improvement and process approach affect
performance of an organization (Nilsson et.al, 2001).
1.2 Statement of the Problem
A study conducted in Turkey by Esin (2008) revealed that size of a firm statistically affects TQM
efforts. It points out that large firms implement employee management information and analysis,
supplier management, and continuous improvement practices intensively compared to small
firms. Employees working in small firms ends up being less motivated to participate in team
work and empowerment.
According to Zulnaidi (2014) firms undertake TQM based on several factors which include
customer focus continuous improvement, teamwork and management commitment. Customer
focus is related to customer satisfaction hence critical factor that affect performance of an
organization. A study conducted in Australia by Anoop et.al (2012) TQM utilized in an
organization increase the ability and performance of the organization. The performance can be
measured by financial performance, operational performance, customer retention, employee
retention and quality of products. Performance of an organization can be widely affected
environmental and organizational factors. Use of TQM affects financial performance either
directly or indirectly.

3
A study conducted in South Africa by Masejane (2012) revealed that measuring performance is
very essential to the success of any organization. TQM has changed operations of many
organizations as mangers recognize fundamental management practices such as leadership,
decision-making, strategic planning, customer focus, and continual improvement. A Ghanian
study by Didik, Moses & Patdomo (2011) noted that quality management is a better method of
management that encourages improvement in organizational performance. According to
Korankye (2013) most of the organizations in Ghana were adopting total quality management
practices to produce better products and meet customer needs. Empirical studies provided
evidence that firms that practice total quality management practices win major quality awards.
An integrated total quality management system reduces errors and wastage of resources leading
to effective and efficient administration.
Karani (2013) argued that Total quality management is a management strategy of an
organization which focuses on quality, participation of all staff members and aims at long term
success. All this can be achieved through customer satisfaction and benefits to all members of
the organization and to society. Therefore, TQM is a philosophy for managing an organization in
a way that meets expectations of shareholders and motivation of staffs. A study by Jeremiah
(2015) indicated that a business should have continuous improvement for it to remain
competitive. Currently, many County hospitals have faced challenge with staffs striking often
hence performance in the health facilities being questionable. In the year 2014 the management
of the hospital was grilled and questioned about multi-billion upgrading project that was been
carried out. There are other projects such as Cancer and Chronic Disease Management Centre,
the Alcohol and Drug Abuse Rehabilitation Centre, the Mental Health Ward, Piping Oxygen and
Medial Gases and the Integrated Health Information Centre.
There are numerous TQM practices that influence effectiveness of project management. This
study focused on only four that seemed to greatly project management. Leadership and customer
focus are critical in every organization hence need to establish their relationship with project
management. Projects are undertaken on ongoing concern thus Continuous Improvement is
significant for effective management.There has been no other study that has been carried out to
investigate the influence of TQM practices on undertaking projects in Moi Teaching and Referral
4
Hospital in Uasin Gishu County. Therefore, the study was relevant to examine the influence of
customer focus, supplier relationship, leadership, and continuous improvement on effectiveness
of project management in the hospital.
1.3 Purpose of the Study
This study intended to establish the influence of total quality management practices on
effectiveness of undertaking projects in Moi Teaching and Referral Hospital, Uasin Gishu
County.
1.4 Objectives of the Study
This study intended to determine influence of TQM practices in Moi Teaching and Referal
Hospital on effectiveness of project implementation. It was guided by the following objectives.
1. To determine the influence of customer-focus on effectiveness of project management in Moi
Teaching and Referral Hospital in Uasin Gishu County
2. To explore the influence of supplier relationship on effectiveness of projects management in
Moi Teaching and Referral Hospital in Uasin Gishu County.
3. To investigate the influence of leadership on effectiveness of projects management in Moi
Teaching and Referral Hospital in Uasin Gishu County.
4. To examine the influence of continual improvement on effectiveness of projects management
in Moi Teaching and Referal Hospital in Uasin Gishu County.
1.5 Research Questions
The study tried to answer the following questions.
1. Does customer-focus influence effectiveness of projects management in Moi Teaching and
Referal Hospital in Uasin Gishu County?
2. Does supplier relationship influence effectiveness of projects management in Moi Teaching
and Referal Hospital in Uasin Gishu County?

5
3. Does leadership influence effectiveness of projects management in Moi Teaching and Referal
Hospital in Uasin Gishu County?
4. Does continual improvement influence effectiveness of projects management in Moi Referal
Hospital in Uasin Gishu County?
1.6 Study Hypothesis
The study was guided by the following hypothesis to be tested at 95%s significance level.
Hypothesis 1
HI There is significant relationship between customer-focus and effectiveness of projects
management.
Hypothesis 2
HI There is significant relationship between supplier relationship and effectiveness of projects
management.
Hypothesis 3
HI There is significant relationship between leadership and effectiveness of projects
management.
Hypothesis 4
HI There is significant relationship between continual improvement and effectiveness of projects
management.
1.7 Significance of the Study
The study was anticipated to be helpful to management team of organizations. They were to
understand more on how TQM practice affect their performances and benefit on utilizing them.
Strategic management will gain more knowledge on how the performance will be affected by
TQM practices applied.
This study was to give reliable information to stakeholders of Moi Teaching and Referral
Hospital and any other institutions to ensure high performance. Moreover, policy makers were
also benefit from the findings of this study by understanding the need of adopting TQM practices
in order to enhance performance in health facilities and institutions in Kenya.

6
Staffs of any organization were to comprehend TQM applicable and how they affected their
organization and individual performance. Moreover, academicians and researchers can utilize the
findings, conclusions and recommendations of this study for future reference purposes.
1.8 Limitations of the Study
The study was anticipated to experience time challenge. The study was envisaged to run short of
time. Also, the study faced challenge of insufficiency of funds to meet all the financial
obligations adequately. However the researcher expected optimize available resources in the
prevailing circumstances.
Unwillingness of respondents to take part in giving required information was anticipated also to
pose a dare. The problem curbed by assuring respondents that the study is merely academic and
their information was to be handled with confidently.
1.9 Delimitations of the Study
The study only covered Moi Teaching and Referral Hospital in Uasin Gishu County. It had
sample of 100 staffs in the Hospital.
1.10 Assumptions of the Study
The study assumed that the respondents were available; they were prepared to respond to the
research questionnaires. Also, it was assumed that respondents were honest and gave reliable
information to achieve the purpose of the study.
1.11 Definitions of Significant Terms
Total quality management (TQM) is an integrated organizational effort designed to improve
quality at every level.
Performance refers to the attaining a given goal or accomplishing a certain task measured in
terms of cost, speed, accuracy and completeness.
Customer-focus is concentration on elements that affect customer either positively or
negatively to ensure good relationship between clients and the hospital.
Supplier relationship is the discipline between the hospital and the third party who provide
goods and/or service.

7
Leadership is a process in which a management team or an individual in high authority
influences others to accomplish certain goals and embraces cohesiveness in an organization.
Continual improvement is a concept that allows serial improvements to ensure better service
delivery of any organization.
8
CHAPTER TWO
LITERATURE REVIEW
2.1 Introduction
Total Quality Management (TQM) is a means for improving personal effectiveness and project
management and for aligning and focusing all individual efforts throughout an organization. It
provides a framework within which you may continuously improve everything you do and affect.
It is a way of leveraging your individual effort and extending its effect and its importance
throughout an organization and beyond. This chapter reviews studies of other researchers on
customer focus, supplier relationship, leadership, continual improvement and process approach
on project management performance.
2.2 The Influence of Customer-Focus on Effectiveness of Project Management
Quality is defined as meeting or exceeding customer expectations. The goal is to first identify
and then meet customer needs. TQM recognizes that a perfectly produced product has little value
if it is not what the customer wants. Therefore, we can say that quality is customer driven.
However, it is not always easy to determine what the customer wants, because tastes and
preferences change (Zulnaidi, 2014). Also, customer expectations often vary from one customer
to the next. For example, in the auto industry trends change relatively quickly, from small cars to
sports utility vehicles and back to small cars. The same is true in the retail industry, where styles
and fashion are short lived. Companies need to continually gather information by means of focus
groups, market surveys, and customer interviews in order to stay in tune with what customers
want. They must always remember that they would not be in business if it were not for their
customers.
Yu-yeon et.al (2012) concluded that customer satisfaction is one of key drivers of firms’
performance. Study by Zulnaidi (2014) ascertained that integral TQM practices based on
customer focus compel employees to deliver quality service intending to meet customers’
satisfaction. A firm that is customer centric has to continuously improve its products and service
delivery. Other practice such as supplier relationship considerations are factored in. Qualified
suppliers are to be engaged to maintain customer confidence and satisfaction. Mohamad, et.al
(2014) indicated that knowledge management is critical for customer relationship management.

9
A well defined example of knowledge management is the information management on corporate
database. Relationship marketing enhances customer-firm relationship hence improved
performance of a firm.
A study conducted in Ghana by Elvis, Andrew & Bonye (2014) noted that customer focus in one
the key principles of TQM. Success of an organization is determined by how well customer
needs are understood. Internal customers who are employees form crucial component of TQM
implementation team. TQM is a system which ensures quality in an organization. Globally much
attention has been given to customer focus in hospitality, construction and health care. Product
focus is one of the approaches on customer focus.
Customer satisfaction increases when effective implementation on TQM practices is conducted.
Quality service offered enhances customer loyalty through satisfaction, hence good reputation of
business leading attraction of more customers. Customer satisfaction and good reputation turns
to be cost effective means of marketing the business, therefore profitability and market share of
the organization most likely increases (Bhah & Tee, 2002). Kanorio (2014) states that TQM is a
management philosophy which applies devolution of authority from the front line staffs. It is a
practice that encompasses every staffs in decision making process through activities such as
quality cycles and strong team work.
A study on effects of TQM implementation in performance of microfinance institutions in Kenya
by Faith (2014) stated that organizational strategy should be based on customers’ needs. Faith
noted that a study by Samson & Rerziovski (1999) pointed out customer focus in underpinning
ideologies for an organization to implement TQM programs.
2.3 The Influence of Supplier Relationship on Effectiveness of Project Management
In every organization there must be suppliers who provide the required necessities for smooth
running of the organization. The relationship between the suppliers and the organization
determines the performance of the organization. Timely respond is one of the manifests of good
relationship. Definitely, this increases trust in the mutual relationship between suppliers and the
organization. According to Almanda (2010) materials and purchased parts have to be availed for
an organization to execute effectively and efficiently. Poor quality supplier’s products lead to

10
extra cost for purchaser. For better performance of an organization, strong and good relationship
between management and supplier is necessary. Just-in-Time delivery of goods or provision of
services should be ensured for effective administration of a project. A study undertaken in
Turkey by Esin & Hilal (2014) highlighted that effective knowledge management enables
employees to access data and information timely, accurately and effectively while executing
their mandates, thus improving effectiveness of operations.
Karani (2011) asserted that every organization should treat their suppliers as long-term partners.
Suppliers are to be treated as integral part of the organizations business operations. Best quality
management practices facilitate establishment of relationships with suppliers and customers,
hence promoting and facilitating communication intending to improve effectiveness and
efficiency of processes that create value. Every organization should treat their suppliers as long-
term partners. Suppliers are to be treated as integral part of the organizations business operations.
(Bhah & Tee, 2002).
Suppliers are to be encouraged to carry out programs that favor continual improvement of
performance. Involving partners in identifications of purchasing needs and joint strategic
development is critical. This includes evaluation and recognition of others efforts and rewarding
them (Brian and Nicholas, 1989). Chang (2009) pointed out that for realization of mutual
dependence between supplier and an organization there should be breaking of boundary among
supply chain members and build integrated system. TQM authorities wok hand in hand with
some suppliers to ensure their raw materials are of high quality. Moreover, some collaborate with
suppliers to improve quality of their products. Maintaining mutual relationship between
management and suppliers creates room for improving value for both.
A research conducted by Abedalfattah (2013) indicated that materials and purchased items in an
organization are element of quality management. Supplier relationship is based on number of
suppliers, involvement of suppliers in product development, evaluation of suppliers based on
quality and provision of training. Tangus, Luke & Charles (2015) asserted that supplier
relationship management entails investment of time and resources. Firms should analyze each
supplier to establish high preference suppliers. Suhong et.al (2004) affirmed that there are
usually long time relationships between organizations and some suppliers. Basically, the

11
strategic partnership is designed to influence strategic and operational competencies of
individuals in regard to achieving particular benefits or targets. This kind of partnership is done
directly and is a long term mutual benefit association.
Supplier development is significant in any organizational performance. According to Wachiuri,
Waiganjo & Oballah (2015) most of the elements of supplier development influence greatly
performance of an organization, particularly, financial support, direct firm involvement and
rewards. Supplier development plays a critical role in performance of an organization since it
leads to profitability, reduction in production cost and improvement in product quality.
Production in well facilitated by effective supplier relationship hence growth on the organization.
In order to have positive supplier relationship there should be supplier development process
which involve visitation of the supplier premises by the organizational management team.
A study by Antic and Bojana (2012) singled out that many companies encountered great
challenge in attaining competitive advantage. Just-in-Time business system was helpful as it
reduced overhead costs. Also, backflush cots which rationalize procedures of cost tracking and
analysis enable total quality management hence high quality of product. To achieve this there
should be high involvement of employees and achieving best in every department in the
organization. Just in Time system is mostly used because of its effectiveness in elimination of
errors, non-value adding activities, defects breakdown and timely delivery. It is widely used in
TQM as it eliminates defects and enables prompt solution provision. It also helps in engaging
and keeping employees that possess such knowledge and skills.
2.4 The Influence of Leadership on Effectiveness of Project Management
According to Gary (2008) performance in organizations is widely influence by leadership
behaviors, management programs, structural forms and external initiatives. Effective
management requires combated efforts by leaders in an organization. There is need to have
flexibility and adaptability culture in an organization. According to (Kanorio, 2014) management
focuses on integrating all individual efforts towards improving performance of an organization.
Tangible improvements are measured by reduced costs, human resource developments, new
product developments, schedules, and customer satisfaction.
12
A study conducted in Chicago by Stanley & James (2003) leadership was viewed as a product of
organizational environmental constraints and its leadership variance. Leadership influence is
determined by leadership qualities, policy direction and social environment. Influence made by
one person in leadership may be insignificant, considering the ability of influence though the
person may have leadership qualities. According to George (2016) effectiveness of employees is
usually affected by leadership of an organization. Leadership affects morale of employees
directly. Democratic leaders allow employees to participate in success of the company and
appreciate their efforts (Morris, Thomas, & Sherry, 2012).
Total Quality Management practices are determined by people who lead or are led. Effective
leadership leads to effective TQM. Therefore, model leadership has to be demonstrated for
effective TQM practices to be adopted effectively. Brian & Nicholas (1989) noted that TQM
leadership is essential in every department or all organization levels. Effective TQM leadership
is determined by each worker’s enthusiasm and individual visible commitment to the process of
continuous improvement rather than on your place in the organization.
Commitment by top management and leaders in an organization determine the leadership
culture. Effective leadership is influenced by deep involvement of leaders to the organizational
strategy, open communication and cooperation. TQM implementation improves the
organizational performance. Issues related to quality are related to effectiveness of management.
The more the issues arise from suppliers, stakeholders and customers depicts poor management
and leadership of an organization. Successful quality management is highly linked top
management commitment (Kanorio, 2014). It requires that top management commitment to
quality must convey the philosophy that quality will receive a higher priority over cost and that
on long run will achieve operational performance as well as reduced operational cost.
In every organization management is responsible for mentoring product design and evaluating
market demands and consumer needs. Management focus on critical for organizations to produce
goods or render service that meet needs of the consumers (Gary, 2008). Management level plays
a noteworthy responsibility on conducting organizational operation as well as in decision-making
and resource allocation processes. Therefore, it is evident that management team of any

13
organization has positive effects on human resource, suppliers management, and design
management.
Faith (214) pointed out that management leadership is significant driver of TQM and greatly
influence implementation of TQM practices. Management leadership refers to the way
management leads or guides personnel in the firm in an appropriate manner. Eman (2001) noted
that top management has a major role in guiding organizational activities towards improved
performance. Leadership in any organization has upper hand in directing organization to accept
and implement TQM. Competitive advantage comes through people and quality products and / or
service and management through quality. Efficient leadership enables high competitive
advantage to any organization.
Success of any project in an organization is determined by employee-employer relationship.
Managers who are leaders spearheading projects in an organization have the responsibility of
ensuring full implementation of the projects. Coordination among the work force determines
whether a project will succeed or not. Human resource involves employee training and employee
relation which positively relate to improvement of quality. According to Flynn, Schroeder &
Sakakibara (1995) revealed that quality improvement is achieved through utilizing quality data
and timely reporting. Application of principle of employee involvement results to open
discussion of problem at work place free sharing of knowledge and experience, performance
evaluation against targets people owing their problems and people knowing the need to
participate and their role in the organization (Chang, 2009). Additionally, the effective quality
management is determined by effectiveness of leadership due to quality efforts inserted and
support of the leadership. Leadership establishes development strategy and operation targets
which affect actual competence. Every management team in an organization should be able to set
holistic goals, and inspire team to strive achieve the goals jointly.
2.5 The Influence of Continual Improvement on Effectiveness of Project Management
Damjan, Maletic and Gomiscek (2012) noted that challenges posed by contemporary competitive
environment calls for quality and performance improvement initiatives to improve
competitiveness. IAEA (2006) observed that continuous improvement (CI) as a set of routines

14
that helps an organization improve its performance. A well predictor of performance
improvement in an organization is continuous improvement.
CI is a process which requires clear comprehension of organization objectives and process of
measuring effectiveness and efficiency. Critical elements such as good leadership and objectives
of company are critical in the process. Success of this process is more or less influenced by
commitment of leadership (Jiri, 2000). According to IAEA (2016) strategy adopted in continual
process should be flexible enough to allow the selection of the most appropriate approach for
each improvement. Rigid strategies hinder effective use suitable tools and methodologies hence
should be avoided.
Jiri (2000) defines CI as a result or product achieved in an organization after certain changes are
made. It cuts across all levels in an organization such as leadership, people and processes.
Consequently, according to Kaynak (2002) it should direct an organization to better prices, cost
and productivity. This process can be effectively conducted through the use of the quality policy,
quality objectives, audit results, analysis of data, corrective and preventive actions and
management review. Since is a continual process management device how to improvement
effectiveness in organization operations instead of waiting problems to emerge. These
improvements vary from small step ongoing continual improvement to strategic breakthrough
improvement projects.
Several items are involved in the cycle of CI which includes establishing customer requirements,
meeting the requirements, measuring success, and continuing to check customers’ requirements
to find areas in which improvements can be made (Esin, 2008). Customers can be either internal
or external depending on their location in the organization. Customers inside the organization are
internal while those outside the organization. Internal customers usually work towards external
customer satisfaction. Measures like service flow, ROI, profits and material flow fail when
continual improvement process is not duly implemented (Chang, 2005).
Chang (2009) revealed that CI is one of the critical areas of focus in an organization. It entails
modern quality research and practice. An organization should be in capacity to improve its
quality of product and service henceforth minimizing cost burden to the customers. Due to
increased competition in the market, continual improvement is necessary.

15
Continual improvement is a management strategy which is an integral part of TQM. Fauzi,
Arsono & Bambang (2016) asserted that CI is a gradual, planned and organized systematic
approach for an organization to ensure continuity in incorporating different phases on
implementation.CI sustains organization’s ability. There are several approaches of measuring
continual improvement which include customer service, complaints, requests for replacements
and returns.
According to Jiri (2000) performance management and continuous performance improvement
are significant in every organization especially when intending to achieve international
competitiveness and sustained growth. CI is all about activities that facilitate products, services
and processes to be produced effectively at reduced cost and improve quality. The improvements
are either breakthrough or incremental. CI demands for effective project management because it
is related to vision, mission and goals of the organization. Lack of CI in leadership of an
organization leads to market share loss to competitors. In order to maintain organizational
culture, CI is undertaken (Fauzin, Arsono & Bambang, 2016).
2.6 Theoretical Framework
This study was guided by two theories to explore on the impact of total quality management
practice such as leadership, continual improvement, and customer-focus and supplier relationship
influence performance of an organization. Deming and Crosby’s theory are utilized in this study.
2.6.1 Deming’s Theory
Deming’s theory of total quality management was built on fourteen points of management. It
was based on philosophy plan-do-check-act. He argued that ratio-quality is equivalent to output
of workforce over total costs. According to Deming, if an organization focuses on reduction of
costs then its quality of output goes down. In order for a company to remain at competitive edge
it has to offer quality products into the market. Poor quality is an expense to company because it
has to put more resources in marketing the poor quality products. In his theory Deming adopted
four key concepts which are system appreciation, variation knowledge, knowledge theory, and
psychology knowledge. In TQM it is important to understand company’s processes, and how
they work, causes of variation, what can be known and human nature in that organization. This
will help the organization to facilitate continual improvement process and trainings.

16
Further, he argued that there should be constant purpose in TQM and adoption of new
philosophies. There should by continual improvements in terms of staff knowledge, product
quality and management style. TQM should not be based on mass inspection or awarding
businesses based upon prices. For TQM to be achievable there should continuous production and
service, trainings and cutting edge for leadership. Any organization striving to attain TQM it
should break the barriers in departmental. Free and ease flow of information should be evident in
the organization.
Deming demonstrated the Plan-Do-Check-Act in cycle created for continuous improvement. In
planning phase objective and actions are set first. Implementation process begins thereafter by
taking actions to ensue improvements in the organization. Periodical checks are ensured in order
to maintain the set quality. Deliveries made by suppliers should be highly inspected to ensure
standard quality is maintained. Lastly, acting is necessary to certain that intended changes in CI
are achieved. Management should ensure that right and exact things are done timely and
customers are satisfied.
2.6.2 Crosby’s Theory
Philip Crosby also credited the initiation of TQM movement. He argued similarly to Deming but
pointed out that money spent on quality is money well spent. Management is commitment to
quality. Crosby defines quality as adherence to requirements and prevention is best way to
ascertain quality. Also, he posed challenge that zero mistakes is the performance standards of
quality. Furthermore, Crosby’s theory stated that quality is the measured by the price of
nonconformity. More precisely consistency in producing conforming products and services at
optimum price should be the ideal target.
Continuous quality improvements can be achieved through total commitment from management.
This is realistic where quality leadership in an organization is manifested. Significantly, an
organization should form quality improvement teams to champion for quality improvements in
the management, product and service. Specifically, each department should nominate a person to
the team for quality in the organization to create equal opportunity for participation. Also, each
quality improvement activity should have metrics for measurement.

17
Every organization that strives at achieving TQM then it should be able to determine the cost of
quality and gains attributed to improvements. Effective management should be in a position to
encourage its employees to fix their mistakes and create zero-defect committee. Also, every
member staffs in that organization should comprehend steps to quality. In order to keep quality
management root causes of errors need to be established and eliminated from the system or
process. Communication on both current and anticipated nonconformance issues should be done
to permit timely corrections. Hackman (1995) pointed out that an organization is combination of
several departments which involve different sectors in the economy hence there is need to
address collectively by representation from all functions. Life span of an organization is
determined by the commitment to continuous improvement.
2.7 Conceptual Framework
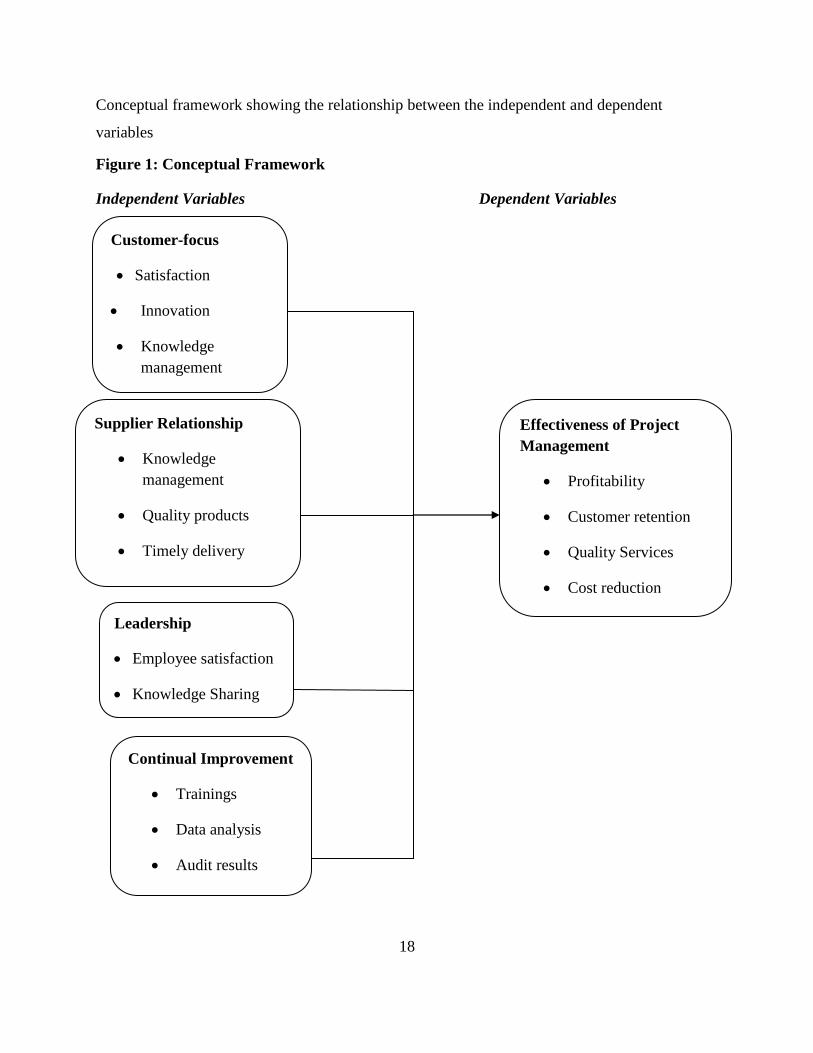
The conceptual framework of the study was developed basing on the objectives of the study,
dependent and independent variables. Below illustration was framed to show the relationship
between dependent and independent variables.
It is anticipated that customer focus will have positive correlation with project management
performance. Also the correlation between supplier relationship and project management is
expected to be positive as it ultimately influences implementation of projects in any organization.
Leaders spearhead every project in organization hence the study anticipates positive correlation
between leadership and project management performance. success of an organization is
determined by how continuously it improves it implementation strategies. Therefore, there are
anticipations of positive correlation between continual improvement and project management
performance.
18
Conceptual framework showing the relationship between the independent and dependent
variables
Figure 1: Conceptual Framework
Independent Variables Dependent Variables
Customer-focus
Satisfaction
Innovation
Knowledge
management
Leadership
Employee satisfaction
Knowledge Sharing
Supplier Relationship
Knowledge
management
Quality products
Timely delivery
Continual Improvement
Trainings
Data analysis
Audit results
Effectiveness of Project
Management
Profitability
Customer retention
Quality Services
Cost reduction

19
2.8 Knowledge Gap
A study conducted in Turkey by Esin (2008) revealed that size of a firm statistically affects TQM
efforts. It points out that large firms implement employee management information and analysis,
supplier management, and continuous improvement practices intensively compared to small
firms. Employees working in small firms ends up being less motivated to participate in team
work and empowerment.
A study conducted in Australia by Anoop et.al (2012) TQM utilized in an organization increase
the ability and performance of the organization. The performance can be measured by financial
performance, operational performance, customer retention, employee retention and quality of
products. Performance of project management in an organization can be widely affected
environmental and organizational factors. Use of TQM affects financial performance either
directly or indirectly.
Karani (2013) argued that Total quality management is a management strategy of an
organization which focuses on quality, participation of all staff members and aims at long term
success. All this can be achieved through customer satisfaction and benefits to all members of
the organization and to society. Therefore, TQM is a philosophy for managing an organization in
a way that meets expectations of shareholders and motivation of staffs. A study by Jeremiah
(2015) indicated that a business should have continuous improvement for it to remain
competitive. Currently, many County hospitals have faced challenge with staffs striking often
hence performance in the health facilities being questionable. There was no other study that has
been carried out to investigate the influence of TQM practices on effectiveness of project
management in Moi Teaching and Referral Hospital in Uasin Gishu County. Therefore, the study
was relevant to examine the influence of customer focus, supplier relationship, leadership, and
continuous improvement on project management performance.
20
2.10 Summary of the Chapter
Quality is defined as meeting or exceeding customer expectations. The goal is to first identify
and then meet customer needs. TQM recognizes that a perfectly produced product has little value
if it is not what the customer wants. The study has found that customer satisfaction is one of key
drivers of firms’ performance. In every organization there must be suppliers who provide the
required necessities for smooth running of the organization. The relationship between the
suppliers and the organization determines the performance of the organization.
Performance in organizations is widely influence by leadership behaviors, management
programs, structural forms and external initiatives. Effective management requires combated
efforts by leaders in an organization. There is need to have flexibility and adaptability culture in
an organization. CI is a process which requires clear comprehension of organization objectives
and process of measuring effectiveness and efficiency. Critical elements such as good leadership
and objectives of company are critical in the process. Success of this process is more or less
influenced by commitment of leadership.
The study looked into two theories based on management and employees effectiveness in service
delivery. These theories are Deming theory and Crosby’s theory. It also formulated a
comprehensive conceptual framework. Lastly, knowledge gap of the study was established.

21
CHAPTER THREE
RESEARH METHODOLOGY
3.1 Introduction
This chapter presents research methodology that was adopted by the study. It entails the research
design, target population, sample and sampling procedure, data collection procedure, validity and
reliability of the data collection instruments, data analysis procedure and ethical issues observed.
3.2 Research Design
The study used descriptive survey design sine it assess opinions and trends in Moi Referral and
Teaching Hospital. According to Mugenda and Mugenda (2003) survey research is normally
significant in describing characteristics of a population. Arguably, no other research design that
can provide broad capabilities ensuring that sample gives accurate results to draw conclusions
and make decision on behalf of whole population.
Descriptive design entails collection of quantitative information that can be tabulated in
numerical form. It involves gathering data that describe an event, and then tabulate it. Therefore,
the study adopted this design to establish the correlation between dependent and independent
variables. Since the researcher had no control over independent variables, descriptive survey
design will be used. The design enables one to collect data without changing the environment
because it collected from specific area.
Mugenda and Mugenda (2003) pointed out that descriptive design focuses on in-depth rather
than breadth. This gave the researcher room for intensely determine the influence of TQM
practices on project management performance.
3.3 Target Population
Population can be defined as the total number of individuals of interest in certain study. The
study sought to Glenn (1992) the study targeted all staffs in Moi Teaching and Referral Hospital.
The study targeted doctors, nurses, subordinate staffs, 10 suppliers and 40 clients. The
participants were assumed to have reliable information on TQM practices influencing project
management performance of the hospital.
3.4 Sample Size and Sampling Procedure
This section intended to inform the technique to be adopted for sampling and the sample size.
Therefore, it was categorized into two; sampling technique and sample size.

22
3.4.1 Sampling Procedure
The study employed non-probabilistic sampling since the data could not be randomly selected.
Purposive sampling was applied in order to collect data from specific respondents. Snowball
sampling was also incorporated to help identify the opinion of the staffs and management staffs.
The study used systematic sampling techniques and strata stratification. Each department formed
a stratum. The study intended to get information from staffs in the hospital, taking the level of
confidence as 95%, and margin of error would be 5%.
3.4.2 Sample Size
According to Yamane (1965) as noted by Glenn sample is a proportion of population. The
sample size used was 20% of population of Doctors, nurses, subordinates staffs, suppliers and
clients.
Table 3.1 Sampling Frame
No. Targeted respondents Sample Size (n)
1. Doctors 10
2. Nurses 70
3. Subordinate staffs 20
4. Suppliers 10
5. Clients 40
6. Total 150
3.5 Data Collection Method
The study used closed-ended questionnaire as instrument of data collection. The questionnaires
were divided into two parts. Part A entailed demographic information of the respondents. This
included their title or designation, the sector they are in and the experience they have in the
industry. Part B was divided into four sections according to objectives of the study. Researcher
assistant was required to help in the distribution of questionnaires and also their collection.

23
3.6 Data Collection Procedure
The researcher issued out questionnaire to the identified respondents randomly. Specific
questionnaire were administered to specific groups according to classification of the researcher.
After a stipulated period of time, the questionnaires were collected back for analysis.
3.7 Validity and Reliability of Research Instrument
3.7.1 Pilot Study
The researcher conducted a prior test study to test whether the aim of study undertaken were
achievable. Instruments were tested while conducting pilot study to prove the reliability and
establish any ambiguity. 10 questionnaires were administered to the respondents for pilot study.
The data obtained will be tested to prove that it will give actual expected information.
Improvements were done to the instrument for accuracy. By the end of data collection process,
the researcher personally issued another 10 questionnaires to test the consistency of the
instrument.
3.7.2 Validity of Research Instrument
Validity refers to the ability of the instrument to measure what it is designed to measure. Kumar,
(2005) as cited by Shammar (2014) defined validity as the degree to which the researcher has
measured what he set out to measure. It is the accuracy and meaningfulness of inferences which
are based on research results. Validity was proven if the instrument collected anticipated
information. The researcher worked hand in hand with the supervisor to prove validity of the
instrument. Peer reviews were also incorporated to ensure validity of the instrument.
3.7.3 Reliability of Research Instrument
Reliability is a measure of the degree to which a research instrument yields consistent results or
data the same each time it was used under the same condition. If consistent results were obtained
by the same participants in the same repeated measurements then the higher the reliability of the
measuring procedure. A research tool is reliable if it is consistent, stable, predictable and
accurate.
3.8 Data Analysis
The questionnaires were edited and coded to check that all responses were given and indicate the
accuracy. Descriptive statistics used to analyze the data. Descriptive statistics allows for

24
narration to be used to interpret the data on variables. The Statistical Package for Social Sciences
(SPSS) computer program was used due to the enormous quantity of data. Spearman rank
correlation was used to determine the relationship between variables.
3.9 Ethical Considerations
Plagiarism is using others’ ideas and words without clearly acknowledging the source of that
information. The researcher acknowledged other person’s idea, opinion, or theory when used.
Furthermore, the researcher paraphrased other studies so as not to commit plagiarism.
After data collection, information obtained was kept secure in order not to expose it to the public
or used for any another use. Furthermore, the information was kept free from irrelevant users.
The researcher strived to sustain intellectual honesty and sought collaborative support which was
duly acknowledged. The researcher also endeavored to arrive at conclusions based on objective
inferences that are purely and blindly guided by the data collected.

25
CHAPTER FOUR
DATA ANALYSIS, PRESENTATION AND INTERPRETATION
4.1 Introduction
This chapter analyses the data collected, presents it in tables and undertakes data interpretation.
The chapter provides the major findings and results of the study as obtained from the
questionnaire.
4.2 Questionnaire Response Rate
Questionnaire response rate indicates the percentages of the questionnaires that were filled and
returned by the respondents. The returned questionnaires were the ones analyzed. Table 4.1
shows the response rate from the sample size.
Table 4.1: Questionnaire Response Rate
Stratum Sample Size Return Rate
Doctors 10 8
Nurses 70 60
Subordinate staff 20 20
Suppliers 10 6
Clients 40 35
Total 150 129
Out of 150 of targeted respondents, 129 of them completed and returned the questionnaires
which constitutes to 94.23%. This response rate is excellent indicating good representative of the
population. According to Mugenda and Mugenda (2003) response above 70% is excellent, rate
of 60% to 69% is good while 50% is adequate for analysis and reporting (average).
4.3 Demographic Characteristics of the Respondents
Demographic information of the respondents was sought to establish their gender, age, education
level and working period.

26
4.3.1Distribution of Respondents by their Gender
The study sought to find out the gender of the respondents. The study targeted doctors, nurses,
subordinate staffs, suppliers and clients. The information is anticipated to be reliable.
Table 4.2 Distribution of Respondents by their Gender
Gender Frequency Valid percentage Cumulative percentage
Male 85 65.9 65.9
Female 44 34.1 100
Total 1 129 100
As shown in table 4.2 above, a good number of the respondents (65.9%) were male while less
than half (34.1%) were female.
4.3.2 Distribution of Respondents by Age
The study sought to establish ages of the respondents from the two locations. Their ages were
categorized into various groups as follows; 26 – 30 years, 31 -35 years, 36 – 40 years, 41- 45
years, 46- 50 years and over 50 years.
Table 4.3 Representation of Age Brackets of the Respondents
Age bracket Frequency Percent Cumulative percent
26 -30 years 45 34.9 34.9
31 - 35 years 10 7.8 42.7
36 - 40 years 15 11.6 54.3
41 -45 years 30 23.3 77.6
46 -50 years 21 16.2 93.8
Over 50 years 8 6.2 100
Total 129 100

27
According to the table 4.3, nearly half of the respondents (30%) were aged between 26 and 30
years.20% of the respondents aged between 36 - 40 years. Also, similar number of respondents
aged 41 to 45 years. A very number of respondents noted that the belonged to age bracket 31 and
35 years, 46 and 50, and over 50 years represented 10%.
4.3.3 Distribution of Respondents by Education level
The study categorized education into three; tertiary, graduate and post-graduate.
Table 4.4 Representation of Education Level of the Respondents
Education Level Frequency Percent Cumulative percent
Tertiary 45 34.9 34.9
Graduate 69 53.5 88.4
Post-graduate 15 11.6 100
Total 129 100
According to the table 4.4 above slightly more than half of the respondents were graduates while
34.9% were of tertiary level. Only 11.6% of the respondents were post-graduates.
4.3.4 Distribution of Respondents by departments
The study intended to identify where various staffs in the organization were working at. The
study considered four departments; finance, administration, procurement and customer service.
Table 4.5 Representation of the Respondents by Departments
Department Frequency Valid percent Cumulative percent
Finance 8 9 9
Administration 47 53.4 62.5
Procurement 20 22.7 85.2
Customer service 13 14.8 100
Total 88 100

28
Above table 4.5 depicts that slightly more than half of the respondents (staffs) were working in
the administration department. 22.7% of them worked in procurement department while 14.8%
worked in the customer service department. Only 9% of them were in finance department.
4.3.5 Distribution of the respondents by Working Period
The study purported to find out to find for how long the staffs who respondents had been
working. Below table gives representation of their response.
Table 4.6 Representation of Respondents by their Working Period
Working period Frequency Percent Cumulative percent
1 month – 5 years 15 17 17
6 - 10 years 20 22.7 39.7
11 – 15 years 25 28.4 68.1
16 -20 years 12 13.6 81.7
Over 20 years 16 18.3 100
Total 88 100
The study according to table 4.6 found out that 28.4% of the respondents had worked for
between 11 and 15 years. 22.7% and 18.3% had worked for 6 – 10 years and over 20 years
respectively. 17% of the respondents had worked for period between one month and 5 years.
Only 13.6% had worked for period ranging between 16 and 20 years.
4.3.6 Distribution of Respondents according to Supplying Period
The study purposed to find out for how long suppliers had been undertaking their business. The
period was categorized as follows; 1 month – 5 years, 6 – 10 years, 11 – 15 years, 16 – 20 years
and over 20 years.

29
Table 4.7 Representation of Respondents by Supplying Period
Supplying period Frequency Percent Cumulative percent
1 month - 5 years 1 16.7 16.7
6 – 10 years 2 33.3 50
11 – 15 years 2 33.3 83.3
16 – 20 years 1 16.7 100
Total 6 100
As depicted by the table 4.7 above, 33.3% of the suppliers had been engaged in the business for a
period of 6 – 10years and 11-15 years. Similarly, 16.7% had been doing the supplying business
for a period of less than five years and 16 -20 years.
4.3.7 Distribution of Respondents by Clientele period
The study sought to establish for how long the respondents (clients) had sought services from the
organization.
Table 4.8 Representation of respondents by Clientele Period
Clientele period Frequency Percent Cumulative percent
Less than 5 years 8 22.9 22.9
6 – 10 years 10 28.6 51.5
11 – 15 years 10 28.6 80.1
16 – 20 years 5 14.3 94.4
Over 20 years 2 5.6 100
Total 35 100
According to table 4.8, 28.6% of the respondents indicated that they had sought service in the
organization for a period of 11- 15 years and 6 – 10 years. 14.3 had been loyal for 16 – 20 years
while 22.9% had enjoyed services for less than 5 years. Only 5.6% noted that they had sought
services in the organization for over 20 years.

30
4.4 Impact of Customer Service on Project Management Performance
The study sought to establish the consequences of customer service on undertaking projects in
Moi Referral and Teaching Hospital.
4.4.1 Descriptive Statistics on Customer Focus
Rating of the Organization
In regard to rating of the organization, respondents indicated as represented below.
Table 4.9 Representation of Rating by respondents
According to table 4.9, a good number of staffs rated the services of the organization as good
while 29.5% indicated that services offered by the organization were excellent. More than half of
suppliers rated the services as good. 33.3% revealed that the services were excellently provided.
A good number of clients (62.9%) noted that services rendered to them were good while 22.8%
indicated that services were excellent. A few of the respondents (14.3%) were not satisfied by
service in the organization.
Awareness on Current Customer Needs
The study purported to establish if the staffs understood customer needs. It intended to find out
awareness among staffs towards needs of their clients.
Table 4.10 Representation of Respondents’ Awareness
Frequency Percent Cumulative percent
Yes 82 93.2 93.2
No - - -
Unaware 6 6.8 100
Total 88 100
Rate Staffs Suppliers clients
n % n % n %
Poor - - 5 14.3
Good 62 70.5 4 66.7 22 62.9
Excellent 26 29.5 2 33.3 8 22.8
Total 88 100 6 100 35 100

31
An overwhelming number of the respondents (93.2%) were aware of current customer needs
while a few of them (6.8%) indicated that they were not aware of current customer needs.
4.4.2 Inferential Statistics on Customer focus
Spearman correlation analysis was conducted at 95% confidence interval and 5% significance
level and was a 2-tailed test. Table 4.11 indicates the correlation between the customer focus and
effectiveness of project management.
Table 4.11 Inferential Descriptive on Customer Focus and Effectiveness of projects management
Customer Focus Effectiveness of
project
management
Spearman’s
rho
Customer focus Correlation
Coefficient
1.000 0.130*
Sig. (2-tailed) 0.022
N 129 129
Effectiveness
of project
management
Correlation
Coefficient
0.130*
Sig. (2-tailed) 0.022
N 129
The table 4.11 shows positive relationship between customer focus in undertaking projects and
effectiveness of project management with spearman rho valuing at 0.130. This implies that there
is positive correlation between customer-focus and project management performance. The value
of 0.130 for the sample of 129 at significance level of 0.022 is statistically significant. The
alternative hypothesis tested is accepted. Hence;
H1 There was a significant relationship between customer focus and effectiveness of project
management is accepted
4.5 Impact of Supplier relationship on Project Management Performance
The study intended to investigate the relationship between suppliers and effectiveness of project
management. Several questions were asked concerning governance effect on utilization of

32
completed projects. The coding employed in the analysis was 1 represented neutral, 2 – disagree,
3- strongly disagree, 4 - agree and 5 – strongly agree.
4.5.1 Sourcing for Companies and Suppliers
The study intended to find out the organization partners with other companies and business
entities in provision of its services. The study targeted staffs, clients and suppliers to respond on
this aspect.
Table 4.12 Representation of Respondents on Sourcing other Companies and Supplier
Frequency Valid percent Cumulative per cent
Neutral 5 4 4
Disagree - - -
Strongly disagree - - -
Agree 20 16.3 20.3
Strongly agree 98 79.7 100
Total 129 100
According to table above more than half of the respondents (79.7%) strongly agree that the
organization outsourced services from other companies and suppliers. 16.3% of them indicated
that they agreed while 4% were unaware if the organization outsources from other companies
and suppliers. Every organization requires other organization to provide services or goods that it
cannot on its own.

33
4.5.2 Timely Delivery
The study further sought to establish if delivery of ordered goods and service is done within
specified time.
Table 4.13 Distribution of Response on Time Delivery
Frequency Valid percent Cumulative per cent
Unaware 5 4 4
Disagree 5 4 8
Strongly disagree - - -
Agree 20 16.3 24.3
Strongly agree 93 75.7 100
Total 129 100
Good number of the respondents (75.7%) strongly agreed that timely delivery was being done
while 16.3% agreed that time delivery was adhered to. Only 4% were unaware with similar
number disagreeing that time delivery was being observed. Time is critical input in every
organization hence failure to deliver on time affects operations of an organization.
4.5.3 Comprehensive Supplier System
The study sought to find out whether there was integrated supply system adopted in the
organization.
Table 4.14 Distribution of Respondents on Comprehensive Supplier System
Frequency Valid percent Cumulative per cent
Unaware 2 1.6 1.6
Disagree - - -
Strongly disagree - - -
Agree 123 95.1 96.7
Strongly agree 4 3.3 100
Total 129 100

34
Table 4.14 show that an overwhelming number of the respondents (95.1%) agreed that there was
comprehensive supplier system while few of them (3.3%) strongly agreed. Only 1.6%
corresponding to two individuals who were unaware if there was integrated supplier system.
4.5.4 Payments Duly Paid
The study purported to find out whether suppliers were paid in time. Below table gives a
representation of the responses.
Table 4.15 Representation of Respondents on Payments Duly Paid
Frequency Valid percent Cumulative per cent
Unaware 15 12.2 12.2
Disagree -
Strongly disagree - - -
Agree 91 71.5 83.7
Strongly agree 23 16.3 100
Total 129 100
80% of the respondents affirmed that payments were duly paid without delays while a few of
them (16.3%) strongly asserted that payments were duly paid. Only 12.2% were unaware that
payments were paid on time. Probably and more certain not all employees are aware how
payments are done in the same organization since they are less concerned or not involved at all.
4.5.5 Continual Monitoring of Delivery and Conformity Check-ups
The study intended to establish if goods delivered were being inspected to ensure that goods are
of high quality and standard goods.

35
Table 4.16 Distribution of Respondents on Continual Monitoring of Delivery and Conformity
Check-ups
Frequency Valid percent Cumulative per cent
Unaware 7 4.1 4.1
Disagree - - -
Strongly disagree - - -
Agree 118 93.5 97.6
Strongly agree 3 2.4 100
Total 129 100
A thrilling number of respondents (93.5%) agreed that delivery of goods was being monitored by
the organization relevant department. They also asserted that conformity of goods was being
checked before acceptance of goods supplied. Only 2.4% strongly agreed while 4.1% being
unaware.
4.5.6 Inferential Descriptive on Supplier Relationship on Project Management
Performance
Spearman correlation analysis was conducted at 95% confidence interval and 5% significance
level and was a 2-tailed test. Table 4.14 shows the correlation between the supplier relationship
and effectiveness of project management.

36
Table 4.17 Inferential Descriptive on Supplier Relationship and Effectiveness of Projects
management
Supplier
Relationship
Effectiveness of
project
management
Spearman’s
rho
Supplier
relationship
Correlation
Coefficient
1.000 0.105*
Sig. (2-tailed) 0.018
N 129 129
Effectiveness
of project
management
Correlation
Coefficient
0.105*
Sig. (2-tailed) 0.018
N 129
The table 4.17 indicates a positive relationship between supplier relationship in procuring
supplies of the organization and effectiveness project management. The value of Spearman rho
valued at 0.105 indicating a positive correlation between supplier relationship and project
management performance. The value of 0.105 for the sample of 129 at significance level of
0.018 is statistically significant. The alternative hypothesis tested is accepted. Hence;
H1 There was a significant relationship between supplier relationship and effectiveness of
project management is accepted.
4.6 Impact of Leadership on Project Management Performance
Leadership is critical in every organization, hence this study purposed to examine how leadership
influences performance of projects.

37
4.6.1 Leadership ensures Conducive environment
Good leadership creates cozy environment which eases undertakings in the organization.
Table 4.18 Distribution of Respondents on Leadership ensures Conducive Environment
Frequency Valid percent Cumulative per cent
Yes 126 97.7 97.7
No 3 2.3 100
Unaware - - -
Total 129 100
Most of the respondents (97.7%) indicated that leadership creates cozy environment for
operations in an organization. Insignificant number of them 2.3% declined that leadership creates
conducive environment for business operations.
The relationship among individuals in an organization determines how they coordinate in
executing their roles in strive to achieve goals of the organization. Disparity among senior and
junior threatens flow of information and effectiveness in operations hence affecting performance
of any project being undertaken.
4.6.2 Quality Improvement as Strategy to achieve profitability
Quality products and services increase competitiveness edge of an organization. Quality
improvement promotes customer loyalty and retention hence driving an organization towards
high earnings.
Table 4.19 Distribution of Respondents on Quality improvement as a Strategy
Frequency Valid percent Cumulative per cent
Unaware - -
Disagree - - -
Strongly disagree - - -
Agree 101 78.3 78.3
Strongly agree 28 21.7 100
Total 129 100
Concerning whether quality improvement is a strategy that helps to increase profitability of an
organization most of the respondents agreed while 21.7% strongly agree. Quality is basic

38
principle in marketing hence producing quality products or service definitely markets the
organization and increases competitive edge.
4.6.3 Incentives increases Performance of Employees
Motivation of employees is critical in every organization. Table below represent the distribution
of response on employee incentives.
Table 4.20 Distribution of Respondents on Employees’ Incentives
Frequency Valid percent Cumulative per cent
Unaware 11 8.5 8.5
Disagree 2 1.6 10.1
Strongly disagree - - -
Agree 87 67.4 77.5
Strongly agree 29 22.5 100
Total 129 100
Regarding whether incentive offered to employees by their management of the organization
affects their performance, majority of the respondents agreed while 22.5% strongly agreed. Only
8.5% of the respondents were unaware with 1.6% of them declining.
Motivated employee is more effective hence it is a sign of recognizing his/ her efforts. Effective
performance of individual employee contributes to effective running of projects in an
organization.
4.6.4 Miscommunication affects Performance
Effective communication is crucial in every stage of production. Miscommunication implies
poor leadership and coordination hence poor quality service offered.

39
Table 4.21 Representation of Respondents on Miscommunication
Frequency Valid percent Cumulative per cent
Unaware - -
Disagree - - -
Strongly disagree - - -
Agree 83 64.3 64.3
Strongly agree 46 35.7 100
Total 129 100
More than half of the respondents (64.3%) affirmed that miscommunication affects performance
of organization while 35.7% declared strongly that miscommunication adversely affects
performance of an organization. None of the respondents declined or was unaware.
4.6.5 Employees’ Trust Increases their turnover
Trust among employees horizontally and vertically determines the productivity of individual.
Mistrust among them kills their morale to deliver his or her best.
Table below represents the responses.

40
Table4.22 Distribution of Employees’ Trust increases their Turnover
Frequency Valid percent Cumulative per cent
Unaware - -
Disagree - - -
Strongly disagree - - -
Agree 32 24.8 24.8
Strongly agree 97 75.2 100
Total 129 100
A good number of respondents (75.2%) indicated that strongly agreed that mistrust among
employees affect effectiveness in implementing project undertaken by the organization. Low
number of the respondents (24.8%) affirmed that.
4.6.6 Supervisors Promotes Customer Satisfaction
Supervisors ensure employees deliver according and work flow as required. Effective flow of
information and smooth operation prompts customer satisfaction.
Table 4.23 Distribution of Respondents on Supervisors Promotes Customer Satisfaction
Frequency Valid percent Cumulative per cent
Unaware 13 10.1 10.1
Disagree 7 5.4 15.5
Strongly disagree - - -
Agree 100 77.5 93
Strongly agree 9 7 100
Total 129 100
According to table above more than half of the respondents (77.5%) agreed that supervisors play
critical role that ensures customers are satisfied while 7% strongly agreed. A few of the
respondents were unaware while 5.4% disagreed.

41
4.6.7 Inferential Statistics on Leadership and Effectiveness of Project Management
The study sought to examine Spearman correlation analysis at 95% confidence interval and 5%
significance level and was a 2-tailed test. Table 4.14 shows the correlation between the
leadership and effectiveness of project management.
Table 4.24 Inferential Descriptive on Leadership and Effectiveness of projects management
Leadership Effectiveness of
project
management
Spearman’s
rho
Leadership Correlation
Coefficient
1.000 0.145*
Sig. (2-tailed) 0.028
N 129 129
Effectiveness
of project
management
Correlation
Coefficient
0.145*
Sig. (2-tailed) 0.028
N 129
The table 4.24 indicates a positive relationship between leadership of an organization and
effectiveness of project management. The spearman rho valued at 0.145. This simply implies that
there is positive correlation between supplier relationship and project management performance.
The value of 0.145 for the sample of 129 at significance level of 0.028 is statistically significant.
The alternative hypothesis tested is accepted. Hence;
H1 There was a significant relationship between leadership and effectiveness of project
management is accepted.
4.7 Impact of Continual Improvement on Project Management Performance
Every institution is established based on ongoing concern therefore this study purposes to
explore continual improvement practices and how they affect organizational performance.
4.7.1 CI is adopted in the organization
The study intended to find out whether continual improvement strategies were being adopted in
the organization. The response provided were YES, NO and Unaware.

42
Table 4.25 Distribution of respondents on Adoption of CI
Response Frequency Percent Cumulative percent
YES 123 95.3 95.3
No 6 4.7 100
Total 129 100
Regarding adoption of CI in the organization majority of the respondents indicated that it was
being used. Only 4.7% declined that there was continual improvement strategies adopted in the
organization.
4.7.2 Continual Improvement through Use of Information System
Information system offers reliable access to information hence eases decision making. Data that
is well kept provides evidence hence, increases accountability in an organization.
Table 4.26 Distribution of Respondents on Information System
Response Frequency Percent Cumulative percent
Neutral 31 24 24
To some extent 52 40.3 64.3
To greater extent 46 35.7 100
Total 129 100
Nearly half of the respondents indicated that to some extent information system encourages
continual improvement while 35.7% noted that to greater extent information system promotes
continual improvement. Only 24% were neutral.
4.7.3 Continual Improvement through Development of Vision and Mission
Every organization works to fulfill certain vision and meet its mission. Vision and mission
refocuses an organization towards its direction of success. The initial mind-set is kept in track by
vision and mission of organization.

43
Table 4.27Response on Development of Vision and Mission
Response Frequency Percent Cumulative percent
Neutral 9 7 7
To some extent 21 16.3 23.3
To greater extent 99 76.7 100
Total 129 100
More than half of the participants (76.7%) in the study conceded that development of vision and
mission of a company help continuity improvement process while 16.3% indicated to some
extent. 7% of the participants of the study revealed that they were neutral.

44
4.7.4 Continual Improvement through Trainings
Trainings increases product knowledge among employee hence increases chances of producing
quality products and services.
Table 4.28 Distribution of Respondents on CI through Trainings
Response Frequency Percent Cumulative percent
To some extent 52 40.3 40.3
To greater extent 77 59.7 100
Total 129 100
More than half of the respondents (59.7%) affirmed that to greater extent continual improvement
is enhanced by trainings. Only 40.3% indicated that to some extent continual improvement is
enhanced through training staffs.
4.7.5 Continual Improvement through Quality Policy
The study intended whether quality policy encourages continual improvement. Below table
depicts the response about CI through quality policy.
Table 4.29 Representation of CI through Quality Policy
Response Frequency Percent Cumulative percent
Neutral 9 7 7
To some extent 118 91.5 98.5
To greater extent 2 1.5 100
Total 129 100
An overwhelming number of participants (91.5%) replied that to some quality policy promotes
continual improvements, 7% were neutral and low number of them (1.5%) affirmed that to
greater extent quality policy enhances continual improvement. Adherence to quality policy
ensures quality production hence better performance of the organization.

45
4.7.6 Continual Improvement though Data Analysis
Data analysis on trends of performance in an organization provides reliable information that can
be utilized in decision making. Quality in projects can be enhanced through data analysis.
Table 4.30 distribution of respondents on Continual Improvement through Data Analysis
Response Frequency Percent Cumulative percent
Neutral 2 1.6 1.6
To some extent 115 89.1 90.7
To greater extent 12 9.3 100
Total 129 100
Significant number of respondents (89.1%) declared that to some extent data analysis enhances
continual improvement while 9.3% conceded that to greater extent data analysis promotes
continual improvement.
4.7.7 Continual Improvement though Audit results
Auditing helps to identify errors and rectify hence better results. Therefore, results of audit
results help an organization to improve in its operations hence better performance.
Table 4.31 Distribution of Respondents on Continual Improvement though Audit Results
Response Frequency Percent Cumulative percent
Neutral - - -
To some extent 19 14.7 14.7
To greater extent 110 85.3 100
Total 129 100
A good number of respondents (85.3%) noted that to greater extent audit results enhances quality
improvement in an organization. Only 14.7% emphasized that to some extent audit results help
in quality improvement in projects. Reviewing and elimination of errors and mistake assist in
ensuring continuity quality production.

46
4.8 Inferential Descriptive on Continual Improvement
Table 4.32 Inferential Descriptive on Continual Improvement
Continual o
Improvement
Effectiveness of
project
management
Spearman’s
rho
Continual
Improvement
Correlation
Coefficient
1.000 0.145*
Sig. (2-tailed) 0.005
N 129 129
Effectiveness
of project
management
Correlation
Coefficient
0.145*
Sig. (2-tailed) 0.005
N 129
The table indicates a positive relationship between continual improvement and effectiveness
project management. The r value was valued at 0.105 at significance level 0.05. The relationship
was found to be positive. The alternative hypothesis is accepted, hence;
H11 There was a significant relationship between continual improvement and effectiveness of
project management is not rejected.

47
CHAPTE FIVE
SUMMARY OF THE FINDINGS, CONCLUSION AND RECOMMENDATIONS
5.1 Introduction
This chapter entails a summary of the findings, discussions, conclusions and recommendations.
The findings of the study are summarized in accordance with objectives of the study which are
customer focus, supplier relationship, leadership and continual improvement influence on
effectiveness of project management. The independent variables were studied against dependent
variable which is effectiveness of project management.
5.2 Summary of the Findings
This section represents findings of the study on the influence of TQM practices on effectiveness
of project management in Moi Teaching and Referral Hospital
5.2.1 Influence of Customer Focus on Effectiveness of project management
The study found that a good number of staffs rated the services of the organization as good
while 29.5% indicated that services offered by the organization were excellent. More than half of
suppliers rated the services as good. 33.3% revealed that the services were excellently provided.
A good number of clients (62.9%) noted that services rendered to them were good while 22.8%
indicated that services were excellent. A few of the respondents (14.3%) were not satisfied by
service in the organization. 14.3% of clients rated the organization as poor. An overwhelming
number of the respondents (93.2%) were aware of current customer needs while a few of them
(6.8%) indicated that they were not aware of current customer needs.
The r value of relationship between customer focus and effective project management was 0.130
with significance value of 0.05. This indicates that there is positive relationship between
customer focus and effective project management. This implies that increase in customer focus
in project management increases effectiveness of project management. The relationship between
the two variables was found to be significant.

48
5.2.2 Influence of Supplier Relationship on Effectiveness of Project Management
More than half of the respondents (79.7%) strongly agree that the organization outsourced
services from other companies and suppliers. 16.3% of them indicated that they agreed while 4%
were unaware if the organization outsources from other companies and suppliers. Every
organization requires other organization to provide services or goods that it cannot on its own.
Good number of the respondents (75.7%) strongly agreed that timely delivery was being done
while 16.3% agreed that time delivery was adhered to. Only 4% were unaware with similar
number disagreeing that time delivery was being observed. an overwhelming number of the
respondents (95.1%) agreed that there was comprehensive supplier system while few of them
(3.3%) strongly agreed. Only 1.6% corresponding to two individuals who were unaware if there
was integrated supplier system. 80% of the respondents affirmed that payments were duly paid
without delays while a few of them (16.3%) strongly asserted that payments were duly paid. A
thrilling number of respondents (93.5%) agreed that delivery of goods was being monitored by
the organization relevant department. They also asserted that conformity of goods was being
checked before acceptance of goods supplied. Only 2.4% strongly agreed while 4.1% being
unaware.
The study found out that there was a positive relationship between supplier relationship in
procuring supplies of the organization and effectiveness project management. The r value was
0.105 with significance value of 0.018. The relationship is positive and significant. s
5.2.3 Influence of Leadership on Effectiveness of Project Management
Most of the respondents (97.7%) indicated that leadership creates cozy environment for
operations in an organization. All the respondents agreed that quality improvement is a strategy
to achieve profitability in an organization. Regarding whether incentive offered to employees by
their management of the organization affects their performance, majority of the respondents
agreed while 22.5% strongly agreed. Only 8.5% of the respondents were unaware with 1.6% of
them declining. The respondents conceded that miscommunication adversely affects
effectiveness of project management. A good number of respondents (75.2%) indicated that
strongly agreed that mistrust among employees affect effectiveness in implementing project

49
undertaken by the organization. More than half of the respondents (77.5%) agreed that
supervisors play critical role that ensures customers are satisfied while 7% strongly agreed.
There was a positive relationship between leadership of an organization and effectiveness of
project management. The spearman rho valued at 0.145 implying that increases in leadership
values would increase effectiveness of project management. The relationship has significance
value of 0.028.
5.2.4 Influence of Continual Improvement on Effectiveness of Project Management
Regarding adoption of CI in the organization majority of the respondents indicated that it was
being used. Nearly half of the respondents indicated that to some extent information system
encourages continual improvement while 35.7% noted that to greater extent information system
promotes continual improvement. More than half of the participants (76.7%) in the study
conceded that development of vision and mission of a company help us continuity improvement
process while 16.3% indicated to some extent. An overwhelming number of participants (91.5%)
replied that to some extent quality policy promotes continual improvements while significant
number of respondents (89.1%) declared that to some extent data analysis enhances continual
improvement while 9.3% conceded that to greater extent data analysis promotes continual
improvement. It was established that audit results are significant in project management.
There was a positive relationship between continual improvement and effectiveness project
management. The r value was valued at 0.105 at significance level 0.05. The relationship was
found to be significant and positive.
5.3 Discussion
This section presents the discussion of the findings. The relation between the dependent and
independent variables was found to be positive.

50
5.3.1 Customer Focus and Effectiveness of Project Management
Many respondents rated the services in the Hospital good. Quality is defined as meeting or
exceeding customer expectations. The goal is to first identify and then meet customer needs.
Staffs revealed that they were aware customer needs and services offered were good. Zulnaidi
(2014) revealed that TQM recognizes that a perfectly produced product has little value if it is not
what the customer wants. Integral TQM practices based on customer focus compel employees to
deliver quality service intending to meet customers’ satisfaction. Clients responded that services
offered were good despite few who opposed. An effective project management in an
organization should be customer centric hence continuously improve its products and service
delivery (Andrew & Bonya, 2014).
Evidently, customer-focus is one of the key principles of TQM. Success of an organization is
determined by how well customer needs are understood. Yu-yeon etal (2012) pointed out that
employees who are internal customers constitute to TQM implementation team. TQM is a
system which ensures quality in an organization. The relationship between customer focus and
effective project management was found to be positive. Valuing clients more increases value of
the organization through profitability, cost reduction and increased market share.
Customer satisfaction increases when effective implementation on TQM practices is conducted.
Quality service offered enhances customer loyalty through satisfaction, hence good reputation of
business leading attraction of more customers. Customer satisfaction and good reputation turns
to be cost effective means of marketing the business, therefore profitability and market share of
the organization most likely increases.
5.3.2 Supplier Relationship and Effective Project Management
In every organization there must be suppliers who provide the required necessities for smooth
running of the organization. The relationship between the suppliers and the organization
determines the performance of the organization. Timely respond is one of the manifests of good
relationship (Almanda, 2010). The study found the relationship between supplier relationship
and effective project management being significant and positive. This implies that poor quality
supplier’s products lead to extra cost for purchaser, consequently affecting operations of the

51
organization. For better performance of an organization, strong and good relationship between
management and supplier is necessary.
The study found that there were integrated supplier systems. Just-in-Time delivery of goods or
provision of services should be ensured for effective administration of a project. Every
organization should treat their suppliers as long-term partners. Esin and Hilal revealed that
suppliers are to be treated as integral part of the organizations business operations. Moreover,
every organization should treat their suppliers as long-term partners. Suppliers are to be treated
as integral part of the organizations business operations.
Development among suppliers is significant in any organizational performance. Just in Time
system is mostly used by suppliers because of its effectiveness in elimination of errors, non-
value adding activities, defects breakdown and timely delivery. It is widely used in TQM as it
eliminates defects and enables prompt solution provision (Chang, 2009). It also helps in
engaging and keeping employees that possess such knowledge and skills. Supplier development
plays a critical role in performance of an organization since it leads to profitability, reduction in
production cost and improvement in product quality. Production in well facilitated by effective
supplier relationship hence growth on the organization (Suhong etal, 2004). In order to have
positive supplier relationship there should be supplier development process which involve
visitation of the supplier premises by the organizational management team.
5.3.3 Leadership and Effective Project Management
Management focuses on integrating all individual efforts towards improving performance of an
organization (Karani, 2013). Tangible improvements are measured by reduced costs, human
resource developments, new product developments, schedules, and customer satisfaction.
Staffs conceded that there should be trust among employees for effective project management.
Leadership influence is determined by leadership qualities, policy direction and social
environment. Influence made by one person in leadership may be insignificant, considering the
ability of influence though the person may have leadership qualities. Gary (2008) stated that
leadership affects morale of employees directly. Democratic leaders allow employees to
participate in success of the company and appreciate their efforts.

52
Leadership by example is leadership by style. Commitment by top management and leaders in an
organization determine the leadership culture. Effective leadership is influenced by deep
involvement of leaders to the organizational strategy, open communication and cooperation.
TQM implementation improves the organizational performance (Kanorio, 2014). Issues related
to quality are related to effectiveness of management. The more the issues arise from suppliers,
stakeholders and customers depicts poor management and leadership of an organization.
Successful quality management is highly linked top management commitment.
5.3.4 Continual Improvement and Effective Project Management
Continuous improvement (CI) as a set of routines that helps an organization improves its
performance. A well predictor of performance improvement in an organization is continuous
improvement. CI is a process which requires clear comprehension of organization objectives and
process of measuring effectiveness and efficiency (Esin, 2005). Critical elements such as good
leadership and objectives of company are critical in the process. Success of this process is more
or less influenced by commitment of leadership.
Training is one of the approaches of enhancing CI. CI as a result or product achieved in an
organization after certain changes are made. It cuts across all levels in an organization such as
leadership, people and processes. CI can be improved through audit results. CI is one of the
critical areas of focus in an organization. It entails modern quality research and practice. An
organization should be in capacity to improve its quality of product and service henceforth
minimizing cost burden to the customers. Due to increased competition in the market, continual
improvement is necessary.
Continual improvement is a management strategy which is an integral part of TQM. CI is a
gradual, planned and organized systematic approach for an organization to ensure continuity in
incorporating different phases on implementation (Kaynak, 2002).CI sustains organization’s
ability. There are several approaches of measuring continual improvement which include
customer service, complaints, requests for replacements and returns.
Performance management and continuous performance improvement are significant in every
organization especially when intending to achieve international competitiveness and sustained
53
growth. CI is all about activities that facilitate products, services and processes to be produced
effectively at reduced cost and improve quality. The improvements are either breakthrough or
incremental. CI demands for effective project management because it is related to vision,
mission and goals of the organization. Arsono & Bambang (20016) noted that lack of CI in
leadership of an organization leads to market share loss to competitors. Therefore, training
among staffs is critical to ensure effective implementation of strategies and continual
improvements.
5.4 Conclusion
Organization should identify their client needs and strive to provide quality services. Integral
TQM practices based on customer focus compel employees to deliver quality service intending
to meet customers’ satisfaction. An effective project management in an organization should be
customer centric hence continuously improve its products and service delivery. Success of an
organization is determined by how well customer needs are understood. Valuing clients more
increases value of the organization through profitability, cost reduction and increased market
share. Customer satisfaction increases when effective implementation on TQM practices is
conducted. Quality service offered enhances customer loyalty through satisfaction, hence good
reputation of business leading attraction of more customers. Customer satisfaction and good
reputation turns to be cost effective means of marketing the business, therefore profitability and
market share of the organization most likely increases.
The relationship between the suppliers and the organization determines the performance of the
organization. Timely respond is one of the manifests of good relationship. Poor quality supplier’s
products lead to extra cost for purchaser, consequently affecting operations of the organization.
For better performance of an organization, strong and good relationship between management
and supplier is necessary. Moreover, organizations should have integrated supply system to
facilitate their transactions. Also, firms should embrace strictness in scrutinizing delivered goods
whether they are high quality. Just-in-Time delivery of goods or provision of services should be
ensured for effective administration of a project. Every organization should treat their suppliers
as long-term partners. Suppliers are to be treated as integral part of the organizations business
operations and long term partners.

54
Management focuses on integrating all individual efforts towards improving performance of an
organization. Tangible improvements are measured by reduced costs, human resource
developments, new product developments, schedules, and customer satisfaction. Trust among
employees affects effectiveness of project management. Leadership influence is determined by
leadership qualities, policy direction and social environment. Influence made by one person in
leadership may be insignificant, considering the ability of influence though the person may have
leadership qualities. Leadership affects morale of employees directly. Democratic leaders allow
employees to participate in success of the company and appreciate their efforts. Commitment by
top management and leaders in an organization determine the leadership culture. Effective
leadership is influenced by deep involvement of leaders to the organizational strategy, open
communication and cooperation. TQM implementation improves the organizational
performance. Issues related to quality are related to effectiveness of management. The more the
issues arise from suppliers, stakeholders and customers depicts poor management and leadership
of an organization. Successful quality management is highly linked top management
commitment.
Continuous improvement (CI) as a set of routines that helps an organization improves its
performance. A well predictor of performance improvement in an organization is continuous
improvement. CI is a process which requires clear comprehension of organization objectives and
process of measuring effectiveness and efficiency. Success of this process is more or less
influenced by commitment of leadership. Training is one of the approaches of enhancing CI can
be improved through audit results. CI is one of the critical areas of focus in an organization. It
entails modern quality research and practice. An organization should be in capacity to improve
its quality of product and service henceforth minimizing cost burden to the customers. Due to
increased competition in the market, continual improvement is necessary. Lack of CI in
leadership of an organization leads to market share loss to competitors. Therefore, training
among staffs is critical to ensure effective implementation of strategies and continual
improvements.

55
5.5 Recommendations
The following were the recommendations of the study;
1. Organization should concentrate on needs of the clients in order to undertake project
effectively.
2. For effective continual improvement in project management there should be data analysis,
audit results and training of staffs. This will reduce errors and mistakes in service delivery.
3. Organizations striving to have effective project management should ensure effective
communication among departments.
4. Every organization should adopt quality policy to keep in track of offering best quality
services.
5. CI in leadership should be adopted to increase competitiveness.
6. Every organization should have supply chain system and also often check-ups on goods or
serviced delivered.
5.6 Suggestions of Further Studies
On the basis of what has been found out from this study, the researcher recommends that related
studies be conducted in other referral hospitals in Kenya.
Also, more studies need to be conducted on other factors that influence effective project
management.

56
REFERENCES
Abedalfattah, A., (2013). The Effects of Quality Management Practices on Organizational
Performance in Jordan: an Empirical Study. International Journal of Financial Research.
Vol 4(1). Pp102-123.
Amanda D. (2010). Overview of TQM Quality Management Practices. Retrieved from
http://www.brighthubpm.com/methods-strategies/100167-overview-of-tqm-quality-
management-practices/
Anoop, P., Michael, C. G., and Ying W. (2012). Competition, total quality management
practices, and performance: evidence from upscale hotels. Tourism Analysis. Cognizant
Comm. Corp. USA. Vol 17.pp195- 211.
Antic, L & Bojana, N., (2012). Just in Time and Total Quality Management for Need of
Achieving Competitive Advantage of Companies.
Brah, S & Tee, B., (2002). Relationship between TQM and Performance of Singapore
Companies. International Journal of Quality and Reliability Management. Vol. 19 (4).
Pp 356 -379.
Brian, E & Nicholas, R (1989). Total Quality Management. A Guide to Implementation.
Retrieved from http://dtic.mil/dtic/tr/fulltext/u2/a232070.pdf.
Chang, H., (2005) The Influence of Continual Improvement and Performance Factors in Total
Quality Management. Total Quality Management and Business Excellence. Retrieved
from https://www.researchgate.net/publication/247523706.
Chang (2009). Total Quality Management in Supply Chain. International Business Research.
Vol. 2. Issue 2. Retrieved from www.ccsenet.org/journal.html.
Damjan, M., Maletic, M., & Gomiscek, B., (2012). The Relationship between Continuous
Improvement and Maintenance Performance. Journal of Quality in Maintenance
Engineering. Vol 18. No.1. pp 30 -41.

57
Didik, W. Moses, L. & patdono, S. (2011). Impact of Quality Management Practices on Film
Performance: The Research Revolution. Retrieved from
http://fportfolio.petra.ac.id/user_files/93-
015/Impact%20of%20Quality%20Management%20Practices%20on%20Firm%20Perfor
mance%20The%20Research%20Evolution.pdf.
Elvis, A., Andrew, S & Bonye, F., (2014). Total Quality Management and its Impact on the
Level of Customer Focus within Construction Project Management in Ghana.
International Journal of Business and Management Invention. Vol 3 (7). pp 36-48.
Esin, K. (2008). The Impact of Contextual Factors on Total Quality Management Practices.
Journal of Global Strategic Management. Retrieved from
http://isma.info/uploads/files/088-the-impact-of-contextual-factors-on-total-quality-
management-practices.pdf
Esin, S & Hilal, O., (2014). The Effects of Total Quality Management Practices on Performance
and the Reasons of and Barriers to TQM Practices in Turkey. Kocaeli, Turkey.
Fauzi, A. Arsono, L. & Bambang, T. (2016). Association of Organizational Structure,
Continuous Improvement capability and Company Performance: The Mediatory Role of
Continuous Improvement Capability of Big Manufacturing Company in Indonesia.
International Business Management. Vol. 10. (13). Pp 2592 -2596.
Finn, O., (2013). Maslow’s Hierarchy for Project Management. Retrieved from
http://www.brighthubpm.com/monitoring-projects/50474-maslows-hierarchy-for-project-
management/
Flynn, B. Schroeder, R. & Sakakibara S., (1995). Impact of Quality Management Practices on
Performance and Competitive Advantage. Decision Sciences. Vol 26 (5). Pp. 659 -691.
Gary, Y. (2008). How Leaders Influence Organizational Effectiveness. Retrieved from
http://www.sciencedirect.com/science/article/pii/S104898430800129X

58
George, R., (2016). How Does Leadership Style Influence Organizational Productivity.
Retrieved from http://smallbusiness.chron.com/leadership-style-influence-
organizational-productivity-11643.html.
Hackamn, R. (1995). Total Quality Management: Empirical, Conceptual and Practical Issues.
Cornell University.
International Atomic Energy Agency IAEA, (2006). Management of continual improvement for
facilities and activities: A structured approach. Vienna, Austria. Retrieved from
http://www-pub.iaea.org/MTCD/publications/PDF/te_1491_web.pdf.
Jeremiah, N, W., (2015). Total Quality Management and Performance of Pharmaceutical
Manufacturing and Distributing Firms in Kenya. Retrieved from
http://erepository.uonbi.ac.ke:8080/bitstream/handle/11295/94811/Wangai%20Njimia%2
0Jeremiah.pdf?sequence=1&isAllowed=y
Jerome, N., (2013). Application of Maslows’ Hierarchy of Need Theory: Impacts and
Applications of Organizational Culture, Human resource and Employees’ Performance.
International Journal of Business and management Invention. Vol 2 (31). Pp 39- 45.
Jiri, P. (2000). Continual Improvement within the Quality Management System. Retrieved from
http://qip-journal.eu/files/2000/1/plura/plura.pdf.
Ju-yeon, L. Shrihari, S., Henderson, C., & Palmatier, R., (2012). Effect of Customer-Centric
Structure on Firm Performance. Retrieved from
http://www.lehigh.edu/~incbeug/Attachments/Lee%20et%20al%202012%20MSI_Report
Kanorio, C. (2014). Total Quality Management Practices and Operational Performance of
Commercial Banks in Kenya. Retrieved from
http://erepository.uonbi.ac.ke:8080/bitstream/handle/11295/76526/Kathaari_Total%20qu
ality%20management%20practices%20and%20operational%20performance.pdf?sequenc
e=4&isAllowed=y
Karani, S. (2011). Effects of Total Quality Management implementation on business
performance in service institutions: A case of Kenya Wildlife Services. International

59
Journal of Research Studies in Management. Retrieved from
http://www.consortiacademia.org/files/journals/5/articles/61/public/61-196-1-PB.pdf
Kayank, H. (2002). The Relationship between Total Quality Management Practices and their
Effects on Firm Performance. Journal of Operations Management. Retrieved from
http://s3.amazonaws.com/academia.edu.documents/45765091/_11__hale_kaynak_2003.p
df?AWSAccessKeyId=AKIAJ56TQJRTWSMTNPEA&Expires=1473023177&Signature
=TJ8AjX%2FR%2FquYUOIpFYDfKl104sE%3D&response-content-
disposition=inline%3B%20filename%3DThe_relationship_between_total_quality_m.pdf
Korankye, A. (2013). Total Quality Management (TQM): A Source of Competitive Advantage.
A Comparative Study of Manufacturing and Service Firms in Ghana. International
Journal of Asian Social Science. Retrieved from http://www.aessweb.com/pdf-files/ijass-
3(6)-1293-1305.pdf.
Masejane, T. P. (2012). Total Quality Management and Organizational Performance in the
Maluti-A-Phofung Municipality in the Free State Province. Retrieved from
http://uir.unisa.ac.za/bitstream/handle/10500/6045/thesis_masejane_t.pdf?sequence=1
Mohamad, S., Othman, N. A., Jabar, J. Mjid, I., (2014). Customer relationship Management
Practices: Impact on Organizational Performance in SMEs of Food Manufacturing
Industry. European Journal of Business and Management. Vol. 6. Issue 13. Malaysia.
Morris, L., Thomas, J., & Sherry, C., (2012). Achieving Performance Excellence: The Influence
of Leadership on Organizational Performance. National Institute of Corrections.
`Washington DC.
Muia, F. M. (2014). Effects of total Quality Management Implementation in Performance of
Microfinance Institutions in Kenya. A Case of K-Rep Development Agency. Retrieved
from http://ir-
library.ku.ac.ke/bitstream/handle/123456789/10196/Effects%20of%20total%20quality....
pdf?sequence=1

60
Mugenda, O. & Mugenda, A,. (2203). Research Methods: Quantitative & Qualitative Approach.
Laba Graphics services. Nairobi.
Musran, M. (2013). The Impact of Total Quality Management Practices towards Competitive
Advantage and Organizational Performance: Case of Fishery Industry in South Sulawesi
Province of Indonesia. Pakistan Journal of Commerce and Social Sciences. Vol. 7 (1),
184-197. Indonesia.
Nilsson, L. Michael, D. J & Anders, G. (2001). Impact of Quality Practice on Customer
Satisfaction and Business results: Products versus Service Organization. Journal of
Quality Management. Retrieved from
http://citeseerx.ist.psu.edu/viewdoc/download?doi=10.1.1.468.4386&rep=rep1&type=pdf
Shekoufeh, N. & Siavash, E. (2013). A study of the Impact of TQM on Organizational
Performance of the Telecommunication Industry in Iran. European Online Journal of
Natural and Social Sciences 2013. Retrieved from file:///C:/Users/user/Downloads/558
-1727-1-PB.pdf
Stanley, L., & James, F. (2003). Leadership and organizational Performance. A study of Large
Corporations. American Sociological Review. Vol.7. Issue2. 117-130.
Suhong, L., Bhanu, R., Ragu-Nathan & Rao, S., (2004). The Impact of Supply Chain
Management Practices on Competitive Advantage and Organizational Performance. The
International Journal of Management Science. Retrieved from www.sciencedirect.com.
Tangus, C., Luke, O., L and Charles, R., (2015). Effect of Supplier Relationship Management
Practices on Performance of Manufacturing Firms in Kisumu County. International
Journal of Economics, Commerce and Management. Vol. 3 (11). Pp 499-512.
Wachiuri, E., Waiganjo, E., & Oballah, D., (2015). Role of Supplier Development on
Organizational Performance of Manufacturing Industry in Kenya. A Case of East Africa
Breweries Limited. International Journal of Education and Research. Vol. 3. No.3. pp
683-694.

61
Zulnaidi Y. (2014). The Direct and Indirect Effects of Customer Focus on Performance in Public
Firms. International Journal for Quality Research. Retrieved from
http://www.ijqr.net/journal/v8-n2/10.pdf.

62
APPENDICES
APPENDIX A: LETTER OF INTRODUCTION
Josphine Cherotich Laboso
P.O Box 75967 00200
Nairobi, Kenya
Cell Phone: 0728667910
Email: [email protected]
October 31st , 2016
Dear Sir/Madam,
REQUEST FOR RESEARCH ASSISTANCE
I am a Masters student at University of Nairobi, pursuing Masters of Arts in Project Planning and
Management. I am undertaking a project on:
Influence of total quality management practices on effectiveness of project management in Moi
Teaching and Referral Hospital, Uasin Gishu County, Kenya.
This questionnaire has been designed to help gather data on the research. You have been selected
as one of the respondents in the study. In this regard, I kindly request you to assist in providing
the data by answering the following questions as briefly and accurate as possible. However your
participation is at your own free will.
Your response to questions therein and any other information provided will be solely for
academic research purpose and strict confidentiality is assured.
Your assistance and cooperation will be highly appreciated.
Yours Faithfully,
Josphine Cherotich Laboso
Researcher

63
APPENDIX I: QUESTIONNAIRE FOR STAFF
This questionnaire will be used specifically for academic purposes. All information of the
respondents will be treated as confidential and restricted to this study only.
Kindly tick your appropriate response in the box provided.
PART A: Demographic Information of the Respondents
1. Gender i. Male [ ] ii. Female [ ]
2 Age Bracket
i. 18- 25 years [ ] ii. 26-30 years [ ] iii. 31 – 35 years [ ] iv. 36 – 40 years [ ]
v. 41- 45 years [ ] vi. 46 -50 years [ ] vii. Over 50years
3. Educational level
i. Tertiary level [ ] ii. Graduate level [ ] iii. Post-graduate level [ ]
4. Department:
i. Finance [ ]
ii. Administration [ ]
iii. Procurement [ ]
iv. Customer service [ ]
Any other(
specify)……………………………………………………………………………………………
…………………………………………………………………………………………
5. Working Period
i. 1 month -5 yrs [ ]
ii. 6- 10 years [ ]

64
iii. 11- 15 years [ ]
iv. 16 – 20 years [ ]
v. Over 20 years [ ]
Part B: Impact of Total Quality Management Practices on Project Management
Performance:
This section is sub-divided according to specific objectives of the study. Kindly respond to each
item and give us your view concerning the influence of practices adopted by the Moi Teaching
and Referal Hospital in implementing its projects.
2.1 Impact of Customer-Focus on Project Management Performance
The researcher intents to determine how do customer-focus in Moi Teaching and Referal
Hospital affects performance of project management.
6. How do you rate your organization?
i. Poor [ ] ii. Good [ ] iii. Excellent [ ]
7. Are you aware of current customer needs in your organization?
i. Yes [ ] ii. NO [ ] iii. Unaware [ ]
Statement To no
extent
To some
Extent
To greater
extent
8.The major responsibility of the organization is
customer satisfaction
9. The organization ensures customer satisfaction
relative to their competitors.
10. The organization links internal performance
indicators with customer satisfaction to meet goals.
11. The organization resets standards when customers’
needs and expectations change to maintain customer

65
loyalty.
12. The organization uses customer complaints to
improve service delivery
13. Customer retention stabilizes profitability of the
organization.
2.2 Impact of Supplier Relationship on Project Management Performance
The research intents to investigate how do supplier relationship with Moi Teaching and Referral
Hospital project management affects its performance.
Statement Unaware Disagree Strongly
disagree
Agree Strongly
agree
14. The organization value sourcing
for companies and suppliers.
15. The organization ensures on-time
delivery.
16. There is a comprehensive supplier
rating system that cut across all issues
such as ethnicity.
17. Payments to suppliers are duly
paid.
18. Suppliers are encouraged to carry
out programs that favor continual
improvement of performance
19. There is continual monitoring of
delivering conforming products and
eliminating redundant products
20. There is optimization of number of
suppliers and customers hence
increasing value of the organization.

66
2.3 Impact of Leadership on Project Management Performance
Leadership being significant in every organization, this study purposes to examine how
leadership influences performance in project management.
21. Does the leadership in your organization ensure conducive environment in regarding to
achieving organizational objectives.
i. YES [ ] ii. NO [ ] iii. Unaware [ ]
Statement Unaware Disagree Strongly
Disagree
Agree Strongly
Agree
22. Management takes the
responsibility of ensuring quality
performance
23. Management views quality
improvement as a strategy to earn
more profits
24. Management offers incentives
to achieve quality goals resulting
to low employee absenteeism
25. minimized miscommunication
between organizational level
improves performance
26.Management tries to obtain
trust of employees, hence high
employee turnover
27. Supervisors promote customer
satisfaction which increases
productivity

67
2.4 Impact of Continual Improvement on Project Management Performance
Every institution is established ongoing concern basis, hence this study intents to explore the
practices that enhance continual improvement and how they affect performance of project
management.
28. There are continual improvement strategies in the organization.
i. YES [ ] ii. NO [ ] iii. Unaware [ ]
Statement Neutral To Some
Extent
To Greater
Extent
29. Use of information system to ensure
continuity in quality service delivery
30. The organization develops and
communicates clearly vision and mission
31. The organization offers trainings for
staffs
32. Continual Improvement can be achieved
through the use of the quality policy.
33. Continual Improvement can be achieved
through data analysis.
34. Continual improvement can be achieved
through audit results.
Any other (please
specify)………………………………………………………………………………………………
………………………………………………………………………………………………………
………………………………………………………………………………………………………
………………………………………………………………………………………………………
……………………………………………………………………………………………………
END

68
APPENDIX II: QUESTIONNAIRE FOR SUPPLIERS
This questionnaire will be used specifically for academic purposes. All information of the
respondents will be treated as confidential and restricted to this study only.
Kindly tick your appropriate respond in the box provided.
PART A: Demographic Information of the Respondents
1. Gender i. Male [ ] ii. Female [ ]
2 Age Bracket
i. 18- 25 years [ ] ii. 26-30 years [ ] iii. 31 – 35 years [ ] iv. 36 – 40 years [ ]
v. 41- 45 years [ ] vi. 46 -50 years [ ] vii. Over 50years
3. Educational level
i. Tertiary level [ ] ii. Graduate level [ ] iii. Post-graduate level [ ]
4. Supplying Period
vi. 1 month -5 yrs [ ]
vii. 6- 10 years [ ]
viii. 11- 15 years [ ]
ix. 16 – 20 years [ ]
x. Over 20 years [ ]
Part B: Impact of Total Quality Management Practices on Project Management
Performance:
This section is sub-divided according to specific objectives of the study. Kindly respond to each
item and give us your view concerning the influence of practices adopted by the Moi Teaching
and Referal Hospital in implementing its projects.

69
2.1 Impact of Customer-Focus on Project Management Performance
The researcher intents to determine how do customer-focus in Moi Teaching and Referal
Hospital affects performance of project management.
6. How do you rate this organization?
i. Poor [ ] ii. Good [ ] iii. Excellent [ ]
7. does this organization offer quality customer services?
i. Yes [ ] ii. NO [ ] iii. Unaware [ ]
Statement To no
extent
To some
Extent
To greater
extent
8. according to your understanding the major
responsibility of the organization is customer
satisfaction
9. The organization ensures customer satisfaction
relative to their competitors.
10. The organization resets standards when customers’
needs and expectations change to maintain customer
loyalty.
2.2 Impact of Supplier Relationship on Project Management Performance
The research intents to investigate how do supplier relationship with Moi Teaching and Referral
Hospital project management affects its performance.
Statement Unaware Disagree Strongly
disagree
Agree Strongly
agree
14. The organization value sourcing
for companies and suppliers.
15. The organization ensures on-time

70
delivery?
16. There is a comprehensive supplier
rating system that cut across all issues
such as ethnicity.
17. Payments to suppliers are duly
paid.
18. Suppliers are encouraged to carry
out programs that favor continual
improvement of performance
19. There is continual monitoring of
delivering conforming products and
eliminating redundant products
20. There is optimization of number of
suppliers and customers hence
increasing value of the organization.
2.3 Impact of Leadership on Project Management Performance
Leadership being significant in every organization, this study purposes to examine how
leadership influences performance in project management.
21. Does the leadership in your organization ensure conducive environment in regarding to
achieving organizational objectives.
ii. YES [ ] ii. NO [ ] iii. Unaware [ ]
Statement Unaware Disagree Strongly
Disagree
Agree Strongly
Agree
22. Management takes the
responsibility of ensuring quality

71
performance
23. Management views quality
improvement as a strategy to earn
more profits
24. Management offers incentives
to achieve quality goals resulting
to low employee absenteeism
25. minimized miscommunication
between organizational level
improves performance
26.Management tries to obtain
trust of employees, hence high
employee turnover
27. Supervisors promote customer
satisfaction which increases
productivity

72
2.4 Impact of Continual Improvement on Project Management Performance
Every institution is established ongoing concern basis, hence this study intents to explore the
practices that enhance continual improvement and how they affect performance of project
management.
28. There are continual improvement strategies in the organization.
i. YES [ ] ii. NO [ ] iii. Unaware [ ]
Statement Neutral To Some
Extent
To Greater
Extent
29. Use of information system to ensure
continuity in quality service delivery
30. The organization develops and
communicates clearly vision and mission
31. The organization offers trainings for
staffs
32. Continual Improvement can be achieved
through the use of the quality policy.
33. Continual Improvement can be achieved
through data analysis.
34. Continual improvement can be achieved
through audit results.
Any other (please
specify)………………………………………………………………………………………………
………………………………………………………………………………………………………
………………………………………………………………………………………………………
………………………………………………………………………………………………………
END

73
APPENDIX III: QUESTIONNAIRE FOR CLIENTS
This questionnaire will be used specifically for academic purposes. All information of the
respondents will be treated as confidential and restricted to this study only.
Kindly tick your appropriate respond in the box provided.
PART A: Demographic Information of the Respondents
1. Gender i. Male [ ] ii. Female [ ]
2 Age Bracket
i. 18- 25 years [ ] ii. 26-30 years [ ] iii. 31 – 35 years [ ] iv. 36 – 40 years [ ]
v. 41- 45 years [ ] vi. 46 -50 years [ ] vii. Over 50years
3. Educational level
i. Tertiary level [ ] ii. Graduate level [ ] iii. Post-graduate level [ ]
4. Clientele Period
xi. 1 month -5 yrs [ ]
xii. 6- 10 years [ ]
xiii. 11- 15 years [ ]
xiv. 16 – 20 years [ ]
xv. Over 20 years [ ]
Part B: Impact of Total Quality Management Practices on Project Management
Performance:
This section is sub-divided according to specific objectives of the study. Kindly respond to each
item and give us your view concerning the influence of practices adopted by the Moi Teaching
and Referal Hospital in implementing its projects.

74
2.1 Impact of Customer-Focus on Project Management Performance
The researcher intents to determine how do customer-focus in Moi Teaching and Referal
Hospital affects performance of project management.
5. How do you rate the organization?
i. Poor [ ] ii. Good [ ] iii. Excellent [ ]
6. Are your needs meet when you seek their services?
i. Yes [ ] ii. NO [ ]
Statement To no
extent
To some
Extent
To greater
extent
7.The major responsibility of the organization is
customer satisfaction
8. The organization ensures customer satisfaction
relative to their competitors.
9. The organization links internal performance
indicators with customer satisfaction to meet goals.
10. The organization resets standards when customers’
needs and expectations change to maintain customer
loyalty.
11. The organization uses customer complaints to
improve service delivery
12. Customer retention stabilizes profitability of the
organization.
13. There is optimization of customers to ensure
retention of clientele.

75
2.2 Impact of Supplier Relationship on Project Management Performance
The research intents to investigate how do supplier relationship with Moi Teaching and Referral
Hospital project management affects its performance.
Statement Unaware Disagree Strongly
disagree
Agree Strongly
agree
14. The organization products are of
high quality.
15. The organization do not delay
service because of delayed supply.
16. There is continual monitoring of
delivering conforming products and
eliminating redundant products
17. There is optimization of number of
suppliers and customers hence
increasing value of the organization.
18. The organization often offers
training for suppliers.

76
2.3 Impact of Leadership on Project Management Performance
Leadership being significant in every organization, this study purposes to examine how
leadership influences performance in project management.
19. Does the leadership in your organization ensure conducive environment in regarding to
achieving organizational objectives.
iii. YES [ ] ii. NO [ ] iii. Unaware [ ]
Statement Unaware Disagree Strongly
Disagree
Agree Strongly
Agree
20. Management takes the
responsibility of ensuring quality
performance
21. in your opinion, management
views quality improvement as a
strategy to earn more profits
22. Staffs serve with motivated
spirit from their leaders
23. Miscommunication between
organizational level has caused
inconveniences in seeking
services in the organization
25. Trust between management
and employees increases quality
of service offered.
26. Supervisors promote customer
satisfaction which increases
productivity

77
2.4 Impact of Continual Improvement on Project Management Performance
Every institution is established ongoing concern basis, hence this study intents to explore the
practices that enhance continual improvement and how they affect performance of project
management.
28. There are continual improvement strategies in the organization.
i. YES [ ] ii. NO [ ] iii. Unaware [ ]
Statement Neutral To Some
Extent
To Greater
Extent
29. Use of information system to ensure
continuity in quality service delivery
30. The organization develops and
communicates clearly vision and mission
31. The organization offers trainings for
staffs
32. Continual Improvement can be achieved
through the use of the quality policy.
33. Continual Improvement can be achieved
through data analysis.
34. Continual improvement can be achieved
through audit results.
Any other (please
specify)………………………………………………………………………………………………
………………………………………………………………………………………………………
………………………………………………………………………………………………………
………………………………………………………………………………………………………
END