effect of total quality management practices on operational
85
EFFECT OF TOTAL QUALITY MANAGEMENT PRACTICES ON OPERATIONAL PERFORMANCE OF FOOD MANUFACTURING FIRMS IN NAIROBI COUNTY, KENYA WANGUI OBADIAH WAGARA A thesis submitted to the Graduate School in partial Fulfillment for the Requirements of the Award of the Master of Business Administration Degree of Egerton University EGERTON UNIVERSITY MAY, 2018
-
Upload
khangminh22 -
Category
Documents
-
view
3 -
download
0
Transcript of effect of total quality management practices on operational

EFFECT OF TOTAL QUALITY MANAGEMENT PRACTICES ON OPERATIONAL
PERFORMANCE OF FOOD MANUFACTURING FIRMS IN NAIROBI COUNTY,
KENYA
WANGUI OBADIAH WAGARA
A thesis submitted to the Graduate School in partial Fulfillment for the Requirements
of the Award of the Master of Business Administration Degree of Egerton University
EGERTON UNIVERSITY
MAY, 2018

ii
DECLARATION AND RECOMMENDATION
Declaration
I declare that this research project is my original work and has never been submitted in this or
any other institution.
Signature ……………………………………………..Date ……………………………….
Wangui, Obadiah Wagara
CM11/00760/13
Recommendation
Irene Riungu
Department of Accounting, Finance and Management science
Faculty of Commerce
Dr. Richard B. Nyaoga
Department of Accounting, Finance and Management science
Faculty of Commerce
Egerton University

iii
COPYRIGHT
© 2018 Wangui Obadiah Wagara
All rights reserved. No part of this Thesis may be reproduced, stored in a retrieval system, or
transmitted in any form or by any means, electronic, mechanical, photocopying, recording or
otherwise, or translated in any language, without the prior written permission of the author or
Egerton University.

iv
DEDICATION
To my mother Nelius Wangui Wagara, my guardian Prof. Isabel Wagara and my wife Teresia
Njeri for their support and encouragement all through the study.

v
ACKNOWLEDGEMENT
My heartfelt gratitude goes to the supreme God for protecting and helping me throughout the
study period. I wish to express my gratidute to Egerton University for giving me the opportunity and
resources to pursue this noble course. I am delighted to offer my appreciation to my supervisors
who guided me during the research process and the various people who made it possible for
the accomplishment of this study. I express appreciation to my supervisor Madam Irene
Riungu for her assistance, guidance, patience, advice and continuous support. I am greatly
indebted to her, God bless you a lot. I would also like to thank Dr. Richard B. Nyaoga for his
guidance and assistance, may the almighty God bless you abundantly. I am grateful to other
lecturers who contributed to the successful completion of the course and thus inputting me
with the required knowledge in the field of study. I express my gratitude to my friends who
supported me throughout the study.

vi
ABSTRACT
Total Quality Management (TQM) has availed to operations management key practices for
measuring corporate performance in today's rapidly evolving environment. As a result food
industries are adopting TQM practices to manage their operations for competitive advantage
as well as improved operational performance. Previous studies have shown the importance of
organizational performance, very few empirical examinations have been done on effect of
TM on Operational performance. The overall objective of this work was to examine the
outcome of the implementation of TQM practices on operational performance of Food and
Beverages manufacturing industries in Nairobi. Both Explanatory and Cross sectional study
designs were adopted to study the connection between TQM practices implementation and
operational performance. The target population comprised large food manufacturing firms in
Nairobi which are subdivided into 7 subsectors. A Survey of all the 87 firms was used in the
study. Primary data was collected using a questionnaire. The respondents were managers
involved in the operations management of the organization. To summarize the data,
descriptive statistics such as Mean and Standard deviation were used. Cross tabulation was
used to bring out the actual response by the various firms. The data was analyzedwith the
help of Statistical Package for Social Sciences (SPSS 20.0). To examine the relationship
between TQM implementation and Operational performance, Pearson’s product-moment
correlation analysis was used. To examine the effect of TQM implementation on operational
performance; multiple regression analysis was used. The results revealed a significant
positive relationship between TQM implementation and operational performance. The first,
second and fourth null hypothesis were rejected, we fail to reject the third and the fifth null
hypothesis. The findings also revealed that among all TQM practices, Top management
commitment had the strongest relationship with operational performance. The results also
showed that the joint effect of TQM practices operational performance was significant. The
researcher recommends replication of the study in different sectors and countries to enhance
understanding of the relationship between TQM implementation and operational
performance. The study is significant as it will provide the management of Food and
beverage firms with information on how to implement total quality management on
operational performance.

vii
TABLE OF CONTENTS
DECLARATION AND RECOMMENDATION ..................................................................... ii
COPYRIGHT ............................................................................................................................. iii
DEDICATION............................................................................................................................ iv
ACKNOWLEDGEMENT .......................................................................................................... v
ABSTRACT ................................................................................................................................ vi
LIST OF TABLES ...................................................................................................................... x
LIST OF FIGURES ................................................................................................................... xi
ACRONYMS AND ABREVIATIONS ................................................................................... xii
CHAPTER ONE ......................................................................................................................... 1
INTRODUCTION....................................................................................................................... 1
1.1 Background of the Study ................................................................................................... 1
1.1.1 Total Quality Management (TQM) .................................................................................. 1
1.1.2 Operational Performance(OP) .......................................................................................... 2
1.1.3 Food and Beverages companies in Kenya ........................................................................ 3
1.2 Problem Statement .................................................................................................................. 4
1.3Objectives of the Study ............................................................................................................ 4
1.4 Research Hypotheses .............................................................................................................. 5
1.5 Significance of the Study ........................................................................................................ 5
1.6 Scope of the study ................................................................................................................... 6
1.7 Limitations of the study ......................................................................................................... ̀ 6
1.8 Definition of terms .................................................................................................................. 7
CHAPTER TWO ........................................................................................................................ 9
LITERATURE REVIEW .......................................................................................................... 9
2.1 Introduction ............................................................................................................................. 9
2.2 Theoretical framework ............................................................................................................ 9
2.2.1Resource Based View Theory ........................................................................................... 9
2.2.2 Knowledge Based View Theory .................................................................................... 10
2.3. Total Quality Management (TQM) ...................................................................................... 12
2.4 Operational Performance ...................................................................................................... 13
2.5 Total Quality Management Practices .................................................................................... 15
2.5 1. Top Management Commitment on TQM Implementation ........................................... 15
2.5.2. Customer Focus on TQM Implementation.................................................................... 16
2.5.3 Supplier Quality Management on TQM Implementation .............................................. 17

viii
2.5.4. Continuous Improvement &Innovation on TQM Implementation ............................... 17
2.5.5 Employee Involvement on TQM Implementation ......................................................... 18
2.6 Empirical Literature Review ................................................................................................. 18
2.7 Conceptual Frame work ........................................................................................................ 24
CHAPTER THREE .................................................................................................................. 27
RESEARCH METHODOLOGY ............................................................................................ 27
3.1 Introduction ........................................................................................................................... 27
3.2 Research Design.................................................................................................................... 27
3.3 Population of the Study ......................................................................................................... 27
3.4 Data Collection ..................................................................................................................... 28
3.4.1 Data collection Instrument ............................................................................................. 28
3.5 Validity and Reliability ......................................................................................................... 28
3.6 Data Analysis and Presentation ............................................................................................ 29
CHAPTER FOUR ..................................................................................................................... 31
RESULTS AND DISCUSSION ............................................................................................... 31
4.1 Introduction ........................................................................................................................... 31
4.2 Descriptive Statistics ............................................................................................................. 31
4.2.1 Response rate.................................................................................................................. 31
4.2.2 Profile of the Respondents ............................................................................................. 31
4.2.2 Profile of the Firms ........................................................................................................ 32
4.2.3 Top Management Commitment ..................................................................................... 35
4.2.4 Customer focus ............................................................................................................... 37
4.2.5 Supplier Quality Management ....................................................................................... 39
4.2.6 Continuous Improvement & Innovation ........................................................................ 40
4.2.7 Employee Involvement Practices ................................................................................... 41
4.2.8 Operational Performance................................................................................................ 44
4.3 Test of Correlation ................................................................................................................ 47
4.3.1 Correlation between Top Management Commitment of TQM on Operational
performance ............................................................................................................................. 48
4.3.2 Correlation between Customer Focus on TQM on Operational performance ............... 49
4.3.3 Correlationbetween Supplier quality Management on TQM on Operational
performance ............................................................................................................................. 49
4.3.4 Correlation between Continuous Improvement and Innovation of TQM on
Operational performance ......................................................................................................... 49

ix
4.3.5 Correlation between Employee Involvement of TQM on Operational performance ..... 49
4.4 Test of Hypotheses ................................................................................................................ 50
4.4.1 Regression Model Summary .......................................................................................... 51
4.4.2 Analysis of Variance ...................................................................................................... 51
4.4.3 Multiple Regression Analysis ........................................................................................ 51
CHAPTER FIVE ...................................................................................................................... 57
SUMMARY, CONCLUSION AND RECOMMENDATIONS............................................. 57
5.1 Summary ............................................................................................................................... 57
5.1.1 Summary of the Findings ............................................................................................... 57
5.2 Conclusion ............................................................................................................................ 59
5.3 Recommendation .................................................................................................................. 60
5.4 Limitations ............................................................................................................................ 61
5.5 Suggestions for further Studies ............................................................................................. 61
REFERENCE ............................................................................................................................ 63
APPENDICES ........................................................................................................................... 68
APPENDIX I: QUESTIONAIRE ............................................................................................ 68
APPENDIX II: List of Food and Beverages Manufacturing Companies in Nairobi
County ........................................................................................................................................ 72

x
LIST OF TABLES
Table 3.1 Reliability coefficients ................................................................................................ 29
Table 4.1: Distribution of Respondents by Position ................................................................... 31
Table 4.2: Distribution of Firms by Ownership .......................................................................... 32
Table 4.3 Distribution of Firms by Type .................................................................................... 32
Table 4.4 Distribution of Firms by Years in Operation .............................................................. 32
Table 4.5 Distribution of Firms by Nature of Business .............................................................. 34
Table 4.6 Distribution of Firms by Number of Employee .......................................................... 34
Table 4.7 Mean and standard deviation measures for Top management commitment .............. 35
Table 4.8 Mean and standard deviation measures for Customer Focus ..................................... 37
Table 4.9 Mean and standard deviation measures for Supplier quality management ................ 39
Table 4.10 Mean and standard deviation measures for Continuous improvement and
innovation ................................................................................................................................... 40
Table 4.11 Mean and standard deviation measures for Employee involvement practices ......... 42
Table 4.12 Mean and standard deviation Operational performance ........................................... 45
Table 4 13 Correlation Matrix for TQM practices; Top management commitment, Customer
Focus, Supplier Quality Management, Continuous improvement and Employee Involvement
on Operational Performance ....................................................................................................... 47
Table 4.14 Model Summary ....................................................................................................... 50

xi
LIST OF FIGURES
Figure 1: Conceptual Frame work……………………………………………………….…..24

xii
ACRONYMS AND ABREVIATIONS
KAM Kenya Association of Manufacturers
KBV Knowledge Based View
RBV Resource Based View
ROA Return on Assets
SPSSS Statistical Package for Social Sciences
TQM Total Quality Management
NBK National Bank of Kenya
KM Knowledge Management
ICT Information Communications Technology
MNCs Multinational Corporations
OP Operational Performance
SME Small and Medium Enterprises

1
CHAPTER ONE
INTRODUCTION
1.1 Background of the Study
1.1.1 Total Quality Management (TQM)
The principle of Total Quality Management (TQM) target of cutting edge operations
management methodologies is to advance execution in manufacturing industries. Giving a higher
quality administration with lower expense as a system for making and supporting aggressive
position have turned into a vital methodology for some business associations over the world.
Thus, quality has turned into a key instrument for measuring corporate performance in today's
evolving environment. Selection of Total Quality Management has ended up far-reaching among
organizations amid the most recent decades as it has been perceived as a noteworthy wellspring
of competitive advantage and overall benefit. It assumes a fundamental part in the improvement
of administration operations (Rawashdeh, 2014).
Amid the most recent three decades, Total Quality Management (TQM) has been accepting far-
flung acknowledgment by the various parts of the economy, for example, producing and
administration government social insurance, banking and training. This TQM wonder is wide
coming to give that maybe few would differ that no other administration issue since Frederick
Taylor's Scientific Management toward the start of the century has made such a significant effect
as what the TQM development has accomplished has even put TQM as achieving a second
modern insurgency (Hassan, Mukhtar, Qureshi, & Sharif, 2012).
The fascinating usage of TQM practices will form purchaser loyalty with the organization’s
offerings. Quality improves purchaser loyalty through completion; this thusly can produce repeat
production and hence guide to the appeal of new clients through affirmative verbal. The informal
communication will help in cost diminishment. The alteration in quality will convey about
expanded piece of the overall industry and benefit. Total Quality administration is an
administration rationality which advocates the delegation of command to the cutting edge
personnel. It guarantees the cooperation of everybody in the decision making process through
exercises, for instance, quality cycles and co-operation (Kathaara, 2014).
The carrying out of TQM guarantees that each expert in the organization does his job with
quality the first run through, as a result enhancing the effectiveness of operation and staying
away from some outflow connected with waste. This thus will recommend more regard to

2
customers as far as price and management of quality, accordingly making them satisfied. Usage
of TQM further guarantees that organizations alters how they carry out exercises in order to wipe
out wastefulness, heighten consumer loyalty in addition to achieve the best practice. TQM help
in augmenting the nature of items additionally decreases and sets up a sound generation process.
Ceaseless change which is a component of TQM is said to diminish the item process duration
accordingly enhancing execution. Various other TQM practices, for instance, preparing, data
structure organization, organizations with supplier and so on optimistically affect operational
execution. The proficient administration conduct of these practices will enhance success and
doubtlessly manipulate the benefit of the firm (Kathaara, 2014).
Application of TQM can lessen the aggregate expense of generation through single sourcing.
The expense for this situation is lessened by constraining the quantity of suppliers utilized by the
organization and furnishing them with important preparing and innovation. The effective
working of an function will then rely on upon how fit the suppliers get together with the desires
of the organization. This is the reason the TQM standard underlines the totality of value in all
features which incorporates the suppliers. The total quality methodology makes a coordinated
technique for focusing so as to examine operation the procedures of creation on consumer
loyalty. Consequently, it requires that quality incorporated with every one of the procedures to be
effective in the general operation (Kathaara, 2014).
1.1.2 Operational Performance(OP)
According to Truong (2014) Operational performance is defined as the capability of a
corporation in dropping managing costs, bid succession time – meet bids, getting better
unprocessed material well-organized use and delivery capacity. Operational execution can be
defined as the practice of enumerating the competence and usefulness of things. Effectiveness
denotes the degree to which client needs are met, whereas competence is a assess to how cost-
effectively to firms’ assets are applied when providing client satisfaction. Fruitful
implementation of TQM will construct customer loyalty with the organization offerings, ensures
that organization's change how they perform practices to wipe out inefficiency, improve
purchaserfulfilment and achieve the best practice (Kathaara, 2014). TQM help in improving the
way of things are done besides diminishing the scrap, repeat process and the prerequisite for
bolster stock by setting up an enduring work process. TQM enhance agents ‘gettingready,
information structure organization, relationship with customers’ Authoritative execution can be
measured in two critical estimations: operational execution and general legitimate execution. By

3
operational performance of an organization can be depicted similarly as inside operations of the
relationship, for instance, made progress versatility, improved movement execution, cost and
waste decline and productivity change (Irfan, Kee, & Awan, 2012).
Operational performance is connected with errorlimits of the organization's error plant to make
and pass on things to customers while operational execution relates to organization's capacities to
extra adequately make and pass on things and organizations that satisfy their customers
(Kabergey & Richu, 2015). Operational performance insinuates the quantifiable parts of the
after-effects of an organization's methodology, for instance, immovable quality, era process term,
and stock turns. Operational performance along these lines impacts business execution measures,
for instance, profitability index and customer satisfaction (Blackmon, 1997).
1.1.3 Food and Beverages companies in Kenya
Food and beverages manufacturing is the largest sector comprising of 147 members, who
constitute 23.43% of total KAM membership, the sub- sectors in this constitutes; Alcoholic
beverages& spirits, Bakers& millers, Cocoa, Chocolate and Sugar confectionery, Dairy products,
Juices/water/ Carbonated soft drinks, Slaughtering, preparation and preservation of meat,
Tobacco and Vegetable oils. Alcoholic Beverages & Spirits is involved in distilling, rectifying
and blending of alcoholic liquors such as whiskey, brandy, malt, beers among many others.
While Bakers and Millers are involved in milling grains, producing products such as flour, seal
and stock dry feeds, preparation of breakfast foods among many others. In addition cocoa,
chocolate and sugar confectionary is involved in manufacture of cocoa and chocolate powder
from beans and all types of sugar confectionery. We also have dairy products industries which
are involved in the manufacture of creamery, processed butter, powdered and fresh milk among
many others (Kenya Association of Manufacturers, 2014).
In addition there are Juices/ Waters/Carbonated Soft drink industries which are involved in the
manufacture of non-alcoholic beverages such as soft drinks and mineral water among others.
Another sub category is Slaughtering, preparation and preservation of meat which does
processing and packaging of meat, sausages and edible animal products. Another sub sector is
Tobacco industry which manufactures tobacco products such as cigarettes, cigars, snuffs among
others. Lastly in the sector we have Vegetable Oils industry which is involved in the production
of vegetable oils, the refining and hydrogenation of oils, fats and margarine among many others
(Kenya Association of Manufacturers, 2014).

4
1.2 Problem Statement
Firms today face various changes in the environment posed by globalization. These changes can
present an opportunity or a threat to firms. In order to be competitive in the dynamic
environment and enhance success, firms must adopt effective strategies to react to the changes in
the surroundings. Manufacturing organizations endeavour to accomplish more elevated amounts
of operational performance. Operational performance has been a topic of discussion in the last
two decades, however many of those studies have been done out in the developed countries.
Theimplementation of TQM by organizations has been held back due to non compliance with the
practices of TQM implementation. Whilst some organizations, run TQM-like a program that they
suppose to function and perform the magic by itself, others have used indifferent approach to it,
by using some bits and pieces of the philosophy. This has count for the breakdown of the most
association in meeting their likely target from implementing these principles.
Thus this study sought to fill up this gap by establishing the association between total quality
management practices and operational performance of food and beverage manufacturing
companies. Literature review proposes that a lot of explorations work has been done on TQM
and relationship of TQM and organizational performance, yet just a small figure of studies have
been done on the impact of TQM usage in the manufacturing industry. Therefore this study
sought to fill this gap on the effect of TQM practices implementation on operational performance
of food and beverage firms in Nairobi.
1.3Objectives of the Study
The overall objective of this study was to examine the effect of the implementation of TQM
practices on operational performance of Food and Beverages manufacturing industries in
Nairobi.
The specific objectives were to:
i. Determine the effect of Top Management Commitment of TQM on operational
performance of Food and Beverages Manufacturing Companies in Kenya.
ii. Determine the effect of customer Focus of TQM on operational performance of Food and
Beverages Manufacturing Companies in Kenya.
iii. Determine the effect of supplier quality management of TQM on operational
performance of Food and Beverages Manufacturing Companies in Kenya.

5
iv. Determine the effect of Continuous Improvement and innovation of TQM on operational
performance of Food and Beverages Manufacturing Companies.
v. Establish the effect of Employee’s Involvement of TQM on operational performance of
Food and Beverages Manufacturing Companies in Kenya.
vi. Determine the combined effect of Total Quality management on operational performance
of Food and Beverage Companies in Kenya.
1.4 Research Hypotheses
H01: Top management commitment of TQM does not have effect on Operational Performance of
Food &Beverages Manufacturing Companies in Kenya.
H02: Customer focus of TQM does not have effect on Operational Performance of Food and
Beverages Manufacturing Companies in Kenya
H03: Supplier quality management of TQM does not have effect on Operational Performance
of Food and Beverages Manufacturing Companies in Kenya.
H04: Continuous improvement and innovation of TQM does not have effect on Operational
Performance of Food and Beverages Manufacturing Companies in Kenya.
H05: Employees involvement of TQM does not have effect on Operational performance of
Food and Beverages Manufacturing Companies in Kenya.
H06: Total Quality management does not have effect on operational performance of Food and
Beverage Companies in Kenya.
1.5 Significance of the Study
This study has important implications for organizations to capitalize in the time and assets to
implement TQM programs. Second the importance of mounting an environment or philosophy of
support to enhance further the performance results of TQM implementation. This study will also
benefit those would be investors in these companies because they would see how their varied
interests are taken care of; the main interest of stakeholders has been continued survival of the
business and its profitability. This study will, therefore, show the importance of using TQM
practices in organisation and how this practice affects operational performance.
The study will serve as a guide for Food & Beverages manufacturing companies to cultivate
policies that will advance its overall service delivery, principally in areas where gaps linking
expectations as well as perceptions are so varied to heighten customer satisfaction. The study
will aid as a guideline for further exploration in service quality in the manufacturing industry or

6
related field. Under improved services, manufacturing companies and other service companies
alike can benchmark the policies and strategies of manufacturing companies in Kenya for their
quality improvement programs leading to total improvement in the manufacturing sector and
perhaps translate to other segments of the economy.
1.6 Scope of the study
This research exploration covers the effects of the implementation of Total Quality Management
practices on operation performance of Kenyan Food & Beverages Manufacturing Companies in
Nairobi Kenya. According to KAM there are 87 Food & Beverages manufacturing companies in
Nairobi County, a survey of the companies in Nairobi were targeted for the study. The study was
done for the period between June and September 2016 and therefore its findings are limited for
that specific period (Kenya Association of Manufacturers, 2014).
1.7 Limitations of the study
Owing to the qualitative and vibrant nature of TQM, the study was restricted to qualitative data
that will apply to the time of the study. The findings are, therefore, highly reliant on upon the
feelings of the respondents at the time of completing this study. In the empirical study, centre of
attention relies on Total Quality Management and its outcome on operational performance.
There were challenges acquiring certain types of information from respondents as they might be
deemed sensitive and may havelimited cooperation. However, this limitation was minimized by
promising confidentiality and including a clause promising so in the questionnaire. Other aspects
measured being connected with the usage of Total Quality Management, Are subsequently not
engaged into account; Network interconnectivity to enhance elaborate research, Organization
operational huddle.

7
1.8 Definition of terms
Competitive Advantage This wordis used to refer to superiority gained by a firm
Over its competitors that arises from matching its centre
Competencies to the opportunity in the surroundings.
Customer Focus This term is used to refer tothe direction of an
association toward helping its clientele wants to get better
the associationlinking an organization and its
customers.
Customer Satisfaction This term is used to refer to a measure of how
companies meet or surpass customers or customer
expectations.
Employee Involvement This term is used to refer to the regular involvement of
personnel in determining how their job is completed,
making recommendations for perfection, goal setting,
Preparation and monitoring of their performance.
Employee Satisfaction This term is used to refer to whether employees
(institution staff) are contented and satisfied and gratifying
their desires and needs.
Knowledge -based theory this theory is used in this study in reference to firms as
bundles of knowledge resources. It considers these stocks
of knowledge and informationas the underlying sources
of competitive advantage as they arevaluable as the are
Difficult to imitate and are socially complex in nature.
Knowledge Management This term is used to refer to where a firm consciously
collectsclassifiesand segments knowledge in terms of
assets, documents and people skills.
Large Firms The criteria for determining a large firm in this research is
by the number of employees and as an enterprise
employing above 100 employees.
Organizational Performance This term is used to refer to the actual yield or marks of an
organization as evaluated against its proposed outputs. It
encompasses four specific areas of firm outcomes;

8
customer satisfaction, employee satisfaction, quality
guidance and firms performance.
Operational Performance This term is defined as the way of enumerating the
competence and success of an action. Effectiveness denotes
the level to which customers’ needs are met, while
competence is extent to how cost-effectively to firms’
assets are utilized to satisfy customers.
Top Management Commitment This term is used to refer to the amount, to which top
administration set up value management goals and strategy,
arrange for and allocate essential assets, contribute to value
improvement efforts, and evaluates value management
execution and performance
Total Quality Management This term is used to refer toanadministrationviewpoint, a
practice, of continuous upgrading approach to doing
business through a new management ideal.
Anorganizationviewpoint under which an organization
operates, which seek to get better quality and increase
customer contentment.
Resource Based View This term is used to refer to a theory based on the
premise that development and appropriate usage of all
resources determine its competitive advantage.
9
CHAPTER TWO
LITERATURE REVIEW
2.1 Introduction
This chapter consists of the literature review that is an evaluative account of information
available in the literature connected to my area of study. It summarizes the findings of other
researchers who have studied the field. Both the theoretical and the empirical reviews of the
existing literature will be covered in this chapter. The theoretical review being a proposed
manner of thinking about the information that is potentially related to my area of study will assist
in understanding the current body of knowledge on the research topic. The empirical review on
the other hand that is a means of obtaining knowledge through direct and indirect observation or
experience will help in understanding the findings and observations of other related studies. The
conceptual framework will later be developed using the information from the two reviews.
2.2 Theoretical framework
2.2.1Resource Based View Theory
This study has been guided by two theories; the Knowledge Based Theory and Resource Based
Theory. The resource based theory does consider with the aim of firms competitive advantage
come up from the application of intangible and tangible resources in the disposal of the firms
(Penrose, 1959). Although the proponents of the resource based view recognize the importance
of knowledge to firms it does recognize and treat knowledge as a generic resource which
deserves recognition other than special characteristic.
Resource Based View (RBV) is a system that is used to achieve high ground against competitors
by firms in their specific business activities the theory at first rose in the 1980s and 1990s,
following the critical works that was conveyed via Wernerfelt, B. ("The Resource-Based View of
the Firm"), ("The Core Competence of The Corporation"), Barney, J. ("Firm resources and
bolstered high ground") and others. Genuine supporters of this point of view battle that
organizations should look inside the organization to find the wellsprings of a high ground instead
of looking at the engaged environment for it. Resource based point of view (RBV) develops its
premises from the work of Penrose which was done in (1959) that envisioned that the firm as a
definitive organization assets have the possibility to give the firm a maintained upper hand. Past
writing on the RBV has every now and again centred on assets as a steady idea that can be
distinguished at a point in time and will persevere after some time. RBV concentrated on key

10
setting, introducing assets and abilities as key to picking up a managed upper hand and
predominant performance. RBV focuses to impalpable assets as the primary drivers of the
supportability of performance contrasts crosswise over firms. Indeed, such resources that are
rare, specific and hard to exchange, mimic, or proper are seen as elusive. An assortment of
definitions have been offered when allude to these assets, including both tangibles and
intangibles, and money related and non-fiscal. Along these lines, the contention built up in this
study is spotlight on the dealing with organizations’ assets as determinants for operational
performance. The progressions of the company's asset were distinguished through the
operational performance pointers (Yew & Ahmad, 2014). An amassing of profitable resources,
both physical, material resources, and moreover human resource, which can outfit the firm with a
collection of organizations. The same resources can be put to use in different structures and ways
(Jurevicius, 2015).
Resource Based View (RBV) is applicable in my area of study because, RBV is discovered
fitting, displaying interior assets as a vital component to picking up a supported competitive
advantage and predominant performance that is the operational perfection. The centre abilities
clarify the companies “competitive achievement taking into account their skills. The Resource
Based View (RBV) highlighted the firm as an interesting accumulation of assets yet underlines
that not all This theory is applicable in my study because Operations approach refers to the
valuable use of inputs and the theory of RBV towards the operations management can add cost to
operation control explore in at the least two approaches. First, the operations method considers
operations as a tactical procedure regarding the cut-throat positioning of operations' assets and
talents. Therefore, RBV, especially useful resource orchestration, complementoperation
performance with a focal point on acquiring and bundling the strategic sources to create talents
which can be leveraged to acquire a competitive gain. Secondly, operations strategy calls for a
synergistic manner of integrating and aligning business and operations. Further, RBV and
particularly useful resource orchestration, highlight the synchronization of the methods worried
in obtaining, bundling, and leveraging. The attainment and bundle of operations assets are
leveraged with an operations method and by this means make contributions to a competitive
benefit.
2.2.2 Knowledge Based View Theory
The knowledge based theory of the organization makes consideration to knowledge being the
most strategically significant resource disposable to firms. This is because people’s capabilities
11
are usually complex to imitate and socially complex, therefore heterogeneous knowledge is a
major determinantof sustainable competitive advantage and elevated corporateperformance.
This hypothesis can be based from Penrose (1959) work that was the beginning stage for
Resource Based View, which conceptualized that the firm is an element which is invested with a
wide arrangement of assets which are rendered into asset based administrations that prompt a
vital point of interest. Moreover, Wernerfelt (1984) based upon Penrose's work by presenting
asset specificity and setting, where he recommended that vital activity requires a particular
arrangement of physical, monetary, human or hierarchical assets, and, therefore, a company's
upper hand is controlled by its capacity to get and shield its assets. While Wernerfelt did
consider information as an asset required to get and change different assets (Kaplan et.al, 2001).
The Resource Based View (RBV) demonstrates that, organizations which groups' important,
uncommon, and matchless assets have the capability of increasing upper hand. A practical upper
hand as far as low costs, better administration, quicker conveyance, imaginativeness can be
portrayed as the improvement of the learning based perspective hypothesis. In the KBV, the
necessary purpose of the organization is the use of existing learning to the generation of products
and administrations. Learning and aptitudes give a firm upper hand against contenders, while it is
throughout this preparation of information and abilities that a firm can press forward new items
and form, or augment existing ones all the more capably as well as viable a one of a kind item
advertise mix, by utilizing assets and taking particular vital choices concerning the business. One
of a kind assets or mixes of assets now and again additionally alluded to as unmistakable
capacities or centre abilities which are sorted as un-systematized institutional information in
organized individuals; which are inserted in procedures versus sunken expenses and irreversible
interests in notoriety (Sijtsema & Postma, 2004).
Fundamental contrasts from examinations of the Resource-based perspective of the firm and the
Knowledge based perspective of the firm are that the Resource-based perspective considers
learning to be a non-exclusive asset which can give an upper hand if, together with different
assets are legitimately overseen and communicated in aptitudes and used deliberately. Then
again Knowledge-based scholars consider information to be the largely vital asset of the firm.
The Proponents of the learning based perspective contend that Knowledge based assets are
difficult to mimic since they are socially perplexing, stationary as well as heterogeneous and
along these lines are significant determinants of supported upper hand. Upper hands are

12
subsequently shared, or aggregate, and implicit learning, which represent the causal
equivocalness of information as a Resource-based scholars consent to these determinants for
maintained upper hand, however, include that assets likewise should be uncommon, significant
and non-substitutable. Later ideas of the information based perspective of the firm propose that
authoritative learning assumes a key part in the manageability of upper hands (Fenwick, 2011).
The theory of KBV is applicable in this study because in an economy knowledge management is
vital detail of hard work and entrepreneurship. Information management deals with the capability
of expertise acquisition, knowledge conversion, and alertness of expertise, which is rooted in the
organization's operations and comes from the configuration of the organizational structure and
lifestyle elaborated, information and facts are various things, but there are linkages between
them. Knowledge is composed of a mixture of values, related information, and professional
views that offer a framework for assessing and incorporating new stories and records,
understanding management is quite simple, combining phrases of management and information
in addition to time management, corporation control, family management and the management of
other elements.
2.3. Total Quality Management (TQM)
There is denial of agreement on the significance of quality.consideration of quality has been
portrayed in unmistakable courses by various researchers. The gurus of the Total value
Management disciples, for instance, Juran, Crosby, Deming, Ishikawa and Feigenbaum
described the thought of value and Total quality management in unmistakable ways. Garvin in
like manner perceived eight credits to evaluate quality Juran described quality like "wellbeing for
use". Juran focused on an arrangement of three of value organizing, quality control, and quality
change. Crosby portrayed quality as "conformance to essentials or determinations". As
demonstrated by Crosby, requirements are considering purchaser needs. Crosby recognized 14
stages for a zero disfigurement quality change plan to achieve performance change (Munizu,
2013).
As demonstrated by Deming, quality is an likely level of consistency and reliability at
insignificant exertion and suitable to the business segment. Deming in like manner recognized 14
guidelines of quality organization to improve throughput and operational performance of an
organization. Ishikawa additionally underscored the importance of Total quality control to
upgrade organization performance. He added to this extent by using circumstances and deciding

13
results chart (Ishikawa framework) to examine quality issues. Feigenbaum depicted the thought
of organization total quality control. He was the in any case customer of Total quality control
thought in the quality written work. He portrayed quality as "the total composite thing and
organization properties of advancing, building, gathering and backing through which the thing
and organization being utilized will meet the yearnings of the customer" (Munizu, 2013).
TQM is a belief system which is focussed on the accomplishment of client's need. TQM oblige
organizations to build up a customercentred operational techniques and in the meantime
conferring the assets that position clients and meeting their desire beneficially. This suggests a
methodology of changing the corporate society of an organization to be client driven. TQM
requires viable change in authoritative society which is upgraded by the profound addition/duty
of organization to the association's technique of nonstopadjust, open correspondence in addition
to collaboration all through the association; expansive representative interest, backing and pledge
during the time spent quality administration. Forerunners in a TQM context see the firm as a
structure which shouldstrengthen worker improvement, shape up a multipoint association among
the personnel, administrators, and customers and use data proficiently and adequately. In
addition, pioneers support worker interest in choice making and enable the workers to be
innovative (Kathaara, 2014).
TQM requires compelling learning administration in order to guarantee that workers get
convenient dependable, steady, exact, and important information in addition toinformation as
they have to transmit out their employ adequately and effectively in the firm. TQM is worried
with the ceaseless change in all the procedure of outline and operation, from the levels of
arranging and choice making to the execution of work by the bleeding edge staff. The emphasis
on ceaseless change prompts the progress of imposing group whose membership is controlled by
their work on the point by point information of the process, and their capacity to make change
move. TQM likewise infers diminishing and reorganization the seller base to
supportsupervisiondealer connections, creating key organizations jointly with suppliers,
functioning with vendors to undertaking that client needs are met (Kathaara, 2014).
2.4 Operational Performance
Operational Performances like benefit and piece of the overall industry, customer fulfilment,
individuals’ fulfilment, business execution, and effect on society and setting as a consequence of
a quality administration project might also be resolved. All out Quality Management isn't a static

14
trait; it's ceaselessly alterable focus as a consequence of it speaks to a charmed customer, since
the client's desires rise, consequently ought to the item's quality. This practice winds up in the
rule of persistent change and every month new routes that of change ought to be considered and
upheld. Also, this nonstop change should be coordinated not at yields however at the inputs and
procedures that the supervisor wills specifically administration. The supervisor should centre
rather, in accordance with TQM on enhancing structure procedures and inputs in order to
improve quality, on the grounds that expanded quality can bring about customer loyalty
(Kathaara, 2014).
Operational performance is connected with generation capacities of the organization's creation
plant to create and convey items to clients. Operational execution identifies with association's
abilities to all the more productively create and convey items and administrations that fulfil their
clients. Calls attention to that enhanced operations prompts increment in the quantify of products
conveyed on time, diminish in supply levels, diminish in scrap rate, increment in item quality,
increment in product offering, enhanced limit use. Operational performance is connected with
the accompanying advantages; diminished work cost, expanded profitability, expanded
understanding of partner execution, expanded office throughput, amplifying limit and enhanced
administration levels , lessened client administration grievances, decreased specialized quality
protests and arranged support , talks about four markers of operational performance (Kabergey &
Richu, 2015).
Operational performance reflects the execution of inner operations of an association as far as
quality enhancements, compliance change, conveyance change, profitability change, cost and
waste lessening. Then again, feasible execution is one of the contemporary business issues,
organizations must discover approaches to encourage and ecological success while making
monetary thriving. The organizational economic performance markersprocess in present study
are environment execution and social execution, while the cashassociated measures, for example,
deals development, profit development, return on value, and return on Assets (ROA). It is along
these lines the talked about performance markers (quality, time, adaptability, expense and
manageability) were utilized to gauge firm performance inundertaking operational improvement.
More precise operational performance was improved by quality, flexibility, speed, and cost,
social and ecological in present study. In addition, supervision individuals, innovation, authority,
methodology, organization, society and employees‟ inclusion to change are vital variables
influence the operational greatness (Yew & Ahmad, 2014).

15
The principal marker is operations change which takes a gander at the best practice of the
organizational operation and the degree to which they accomplish productivity and viability in
such operations. The second marker is profitability following which takes a gander at
departmental and organization wide following to permit compelling management of operations
and give opportune criticism on performance. The third marker is the built guidelines created
through time and movement studies to gauge singular benchmarks. Designed guidelines must be
objective and must give exact and reasonable objectives. The last marker is motivation program
that takes a gander at how performance is remunerated. Readily available are four keys to
operational performance. The primary key is operations change went for improving and
institutionalizing appropriation and assembling. Operations methodology must be comprehended
by the partners and all partners enabled to perform the different capacities. It isimperative to
follow departmental and office wide profitability andexpenses. Exact efficiency is connected
with advantages, for example, adjusted staffing and best distribution of assets (Kabergey &
Richu, 2015).
2.5 Total Quality Management Practices
2.5 1. Top Management Commitment on TQM Implementation
Top Management assumes a basic part in any key business choice. Therefore, the
accomplishment of any basic choice made in an organization is very subject to top administration
backing and responsibility. Quality issue has happened to extraordinary implication to each
organization and no administration can just stand to let environment follow through to its logical
end with regards to quality. The top administration must assume a centralpiece by
buildingreachable the basic assets, build up an institute extensive quality strategy so as to around
convey to all partners, set up a value management organization and dealing with the entire
process in the course of close checking and appraisal. This must be bolstered by an organization
society and atmosphere of open participation and cooperation among partners in quality
administration (Oruma, 2014).
TQM use in any organization calls for top organization commitment as it is within vital to and
the driver of TQM application and results can't be come to without it. It is in addition basic for
the top organization to understand TQM applications finish and ensure that workers'
responsibilities are cleared up. TQM requires the improvement from 'organization by control' to
'organization by commitment. The last consolidates participative organization and individuals’
16
leading to focus on and perceive out and out quality destinations and commitment to different
levelled structures that are made to ensure rigid quality (Al-Nasser, Yusoff, & Islam, 2013).
2.5.2. Customer Focus on TQM Implementation
With reference to International Organization for Standardization ISO 9000-14000 accentuated
shows that all jointly for the relationship to be client focused, they should centre on their
clientele by awareness the provisions of their present and potential client, and ought to address
client issues and endeavour to surpass client longings. Focusing on the client is among the
critical destinations of quality. Clients are the generally essential section and are a basic key
during the business that purposeful in this study by giving them diverse organizations to provide
and cover up a foremost degree of clients (Mohammed, Alharthi, Alhabashi, & Hasan, 2014).
The imperativeness of tending to and surpassing clientele needs and yearnings can transform into
the reason of a strong high ground that could provoke extended profitability index and pushed
efficiency rates. Shopper dependability and customer duty to the organization's things and
organizations are practically identical however not unclear thoughts, as "contentment" shows a
point while "dedication" induces a behaviour. Together these requisites are necessary for
finishing upgraded suitability, bearing in mind that the imperative pre-condition for making
devoted clients is the contentment of their wants. In this way, unwavering quality is, all around,
recognized to be a vital part of an organization's future accomplishment (Economou &
Chatzikonstantinou, 2009).
Finally, successful firms tend to gauge purchaser loyalty's, survey it against contenders'
imperative results and after that, impel all the inside systems as required. Nowadays, genuinely
exceptional organizations propel closer relationship with clientele in a way that engages
dependability to be guarded through shopper relationship organization structures. shopper
relationship organization focus on building client commitment, ensuring purchaser support,
overseeing the complaint and figuring reasonable philosophies for improving buyer
unwaveringness. Starting at this moment, the information got from clientele is of basic
importance for the attempt, since it offers them some help with acknowledging how satisfied its
customers are while they can in like manner get imperative information about their opponents'
material things and organizations Customer focus (Economou & Chatzikonstantinou, 2009).

17
2.5.3 Supplier Quality Management on TQM Implementation
The supplier quality is a basic segment of quality organization in the relationship since materials
and acquired parts are an important wellspring of worth issues. Supplier relationship focuses and
relies on somewhat number of suppliers; incorporate suppliers in thing progression; survey
suppliers in light of worth; give planning and concentrated help to suppliers. Scientists proposed
that organizations picked their suppliers on the reason of quality, rather than just on expense.
Supplier quality organization enhances the coordinated effort amidst suppliers and organization
by allowing suppliers' incorporation and collaboration in the design process and in the creation
method, and suppliers' organization helps the acquirements of materials gather the organization's
essentials and be viably utilized. Suppliers' organization used to energize endeavours, for
instance, bringing in the wake of planning with suppliers to ensure to meet the customers'
yearnings, administering supplier relationship, incorporating suppliers requirements in the
process, making key associations with suppliers, and enhancing the methodology (Al-abedallat,
2013).
2.5.4. Continuous Improvement &Innovation on TQM Implementation
There must be nonstop change in all policies, systems and exercises set everywhere in top
administration for the organization. Recognition that TQM is a "process" not a
structurenecessitates that we are conferred in the long haul to the endless quest for approaches to
carry out the employment better. There will dependably be occasion to get better, however little
(Sharma, Gupta, and Singh, 2014). The creative limit of organization is a measurement less
shocked in authoritative analytic models in spite of the fact that there are various studies that
have been centred around recognizing effect of the inventive Capacity on operation (Gavrea,
Ilies, & Stegerean, 2011).
Constant change and advancement, which is the most imperative piece of administrations, means
scanning for ceaseless upgrades and creating procedures to discover innovative or enhanced
strategies during the time, spent altering over inputs into valuable yields. It helps in lessening the
procedure variability along these lines ceaselessly enhancing the yield execution, affirmed that in
TQM, the most ideal approach to enhance organizational performance is to constantly enhance
the execution exercises (Talib, Rahman, & Qureshi, 2010).
According to Deming (1986) shows in one of his 14 focuses used for organization that, one
ought to enhance always and forever improve the arrangement of creation and administration, to
progress quality and profitability and along these lines continually diminish costs. Deming

18
likewise underscored the utilization of the change cycle, additionally known as the Shewhart
cycle and the Deming cycle, the change cycle is made out of four phases: plan, do, study and act
(PDSA). Any movement can be improved in the event that you steadily plan the change,
understand the present practice, plan and accomplish the arrangements, break down the outcomes
and their causes and perform the cycle once more (Adza, 2012).
2.5.5 Employee Involvement on TQM Implementation
Job preparing is an essential component that helps workers' endeavours towards change. To him,
quality prepareincorporatetraining and preparing of representatives at all points in the
organization with an expectation of expanding their comprehension on quality issues and plans
and giving them data about the organization's quality mission, vision and universal
desiredheading, worker preparing is a standout amongst the most essential prerequisites in a
fruitful TQM performance. Administration faculty, directors and different employees require
abilities and information on quality measurements and administration and also their parts in
TQM usage. Attributable to the techniquewith the purpose of market quality needs are
exceptionally alterable, association must guarantee ceaseless worker improvement and preparing
on quality administration, employee preparing that is centred around quality administration
decides how successful an organization's quality administration activities will be (Oruma, 2014).
2.6 Empirical Literature Review
According to Kathaara (2014) inspected that total quality organization practices and operational
performance of business banks in Kenya. Assessments of all the 43 business banks were taken in
this study. The study used data which was assembled through a composed survey to assemble
the destinations of the study via five-point Likert scale. The review questions focused on total
quality administration practices utilization and operational execution of the Kenya business
banks. The questionnaire was both open ended and close ended. The results revealed that quality
organization practices were earnestly related to an operational execution of business banks in
Kenya. This is dependable with the theory of this study which predicts a positive connection
between TQM programs and budgetary execution of banking firms in Kenya.

19
According to Irfan, Kee and Awan (2012) in their work on Improving Operational performance
of Public Hospital in Pakistan used a study with fourteen Quality organization structures
practices to gauge the impact of value organization systems sharpens on operational performance
of hospitals in Pakistan. A sum of 239 studies was fused in the study and the results show that
picked Quality organization structures practices has a tremendous constructive outcome on
quality organization systems execution besides on operational execution to the extent extended
flexibility, improved nature of organizations, diminishment in organization time and effective
diagnostics (Irfan, Ijaz, Kee, & Awan, 2012).
Mwaniki and Bichanga (2014) study was on the Effects of Total Quality Management on bank
performance in the dealing with a record division: a logical examination of the national bank of
Kenya. This study was confined to setting up how the backbones of TQM, to be particular
supplier relationship, customer relationship, process and top organization commitment relate to
the bank’s performance. The four pillars of TQM molded the autonomous variables of the study
while budgetary execution was the dependent variable. The disclosures of the study exhibited a
affirmative relationship amid top organization consideration, strategy, and supplier relationship
and monetary execution.
In their study Hassan, Mukhtar, Qureshi and Sharif (2012) reviewed the connection between
quality organization practices and presentation, i.e. value, business, as well as legitimate
execution. The quantitative data was traversed research from 171 quality directors of Pakistan's
manufacturing industry. This study backs the hypothesis that quality organization systems
sharpen unequivocally influence the performance. Quality organization structures instruments
and strategies (Incentive and Recognition System, Process, Monitoring and Control and
Continuous Improvement) and Behavioural variables (Fact based-organization, top
organization's commitment to quality, laborer consideration and customer focus) add to the
productive utilization of worth organization systems.
The study reports that productive assignment and utilization of quality organization structures
sharpens results in upgrading the execution of organization. The essential implications of the
revelations for executives are that with quality organization manufacturing organizations will
presumably perform better execution in buyer dedication, employees relations, quality and
business execution than without quality organization structures improves (Hassan, Mukhtar,
Qureshi, and Sharif, 2012).
According to Mwaniki and Obiro (2014) their study was focused on showing how the pillars of
TQM, that is supplier relationship, customer relationship, processes and top management

20
connection recount to fiscal presentation. The four pillars of TQM shaped the autonomous
variables of this study even as economic performance turned into the dependent variable. These
variables were calculated to fill the gap of amplification how using TQM in country wide bank
of Kenya impacts its financial overall performance. This study was descriptive in character and
the scholar used case study technique. The target populace of the take a look at comprised of
NBK personnel. The researcher used stratified random sampling in deciding on respondents. The
results showed a positive connection among top management participation, method and
contractor relationship and financial execution. However, customer focus adversely affected
financial performance. The regression analysis confirmed a vulnerable courting a few of the
variables with by using the f-test a look at and a susceptible coefficient of determination the
studies recommend that steps to advance top management involvement, manner and supplier
courting to improve financial performance (Mwaniki&Okibo,2014).
In addition the study discovered that Total quality management enhances operation effectiveness
in this manner lessening operation cost. Consequently the usage of quality management
frameworks has expanded bank gainfulness, upgraded deals, expanded bank aggressiveness and
brought about obtaining of greater piece of the overall industry, upgraded administration
conveyance in the bank, guaranteed successful waste lessening in operations, enhanced operation
productivity accordingly decreasing operation costs and expanded client maintenance as an after-
effect of consumer loyalty. The study set up that bank administration rehearses influence the
operational performance of banks (Kathaara, 2014).
There is a positive critical relationship of measure of inside and outside clients' needs,
concentrate on client necessities and objection resolutions connected to practices of TQM
affecting organization performance (Fening, Amaria, & Frempong, 2013). Consequently the
usage of quality management frameworks has expanded bank gainfulness, decreasing operation
costs and expanded client maintenance as an after-effect of consumer loyalty (Kathaara, 2014).
There is a positive noteworthy relationship of worker contribution, representative fulfilment,
worker acknowledgment and a worker utilizing quality control apparatuses for procedure control
and change connected to practices of TQM affecting organization performance (Fening, Amaria,
& Frempong, 2013).
Quality key practices has given an instrument to bank directors to shape their outer business
environment, limit dangers, exploit opportunities and empower to react to quality issues
proactively. Moreover quality vital practices have encouraged the working of banks centre

21
abilities and fortifying the boycott intensity empowering it to convey compelling administrations
to clients. The study discovered that representative strengthening rehearses impacts operation
performance of banks. The discoveries of the study demonstrates that usage of quality
administration has influenced representatives personal satisfaction, bank spends a lot of its yearly
spending plan on workers preparing and advancement on TQM frameworks, representatives at
all levels have the obligation and power to settle on choices that influence them and their work
groups, quality administration frameworks have advanced the flexibility of representatives to
utilize their drive in matters of client conveyance(Kathaara, 2014).
There is boundless inclusion and correspondence to representatives on all matters that worry
their occupation and organization performance, reward frameworks that bolster worker
execution, interest, activity and encouraging of collaboration have been initiated in the bank
makes methodologies, arrangements and frameworks for accomplishing unrivalled quality in the
establishment and that has motivated staff and administration in compelling and productive
utilization of the assets and endeavors of the organization towards quality perfection (Kathaara,
2014).
Quality organization as a top administration advance .It is the task of direction to put into
practice the value. The rationale of this investigate was to test out out. Does the management
manners have an effect on the achievement of quality organization? In methodology 180
managers were functioning under the practical head, advertising and HR division were taken as a
sample. information was composed through questionnaire. Proposition of the study is that the
manners of management in an association are certainly interconnected to the accomplishment of
TQM and the substitute hypothesis is supported by the consequences and null hypothesis was
rejected. As a result it is proven that the management in any business has a strong impact on the
value administration. Study concerning the management subject faced by the on the increase
countries particularly in Nigeria and try to discover out the explanation to societal, political and
economic tribulations. This object evaluate five factors which are further imperative for the value
administration effectiveness, control and administration obligation, member of staff and person
involvement, general community contribution, and uninterrupted improvement. This expose is
about the impact of value supervision on the leadership. From the problem statement of the paper
was to advance poor direction in Nigeria. Management responsibility is very significant for the
accomplishment of quality administration. Participation of each being is an active course towards
the improvement of Nigeria production. Constant enhancement is mainly vital element of the
value administration if the presentation principles go up constantly value can be achieved in a

22
improved way. Member of staff empowerment and management are the two most significant
essentials of the quality administration in organizations (Samia, 2015).
Quality guru articulate that the foundation of value looks upon the managerial leadership. In
2005 a nationwide study of 1,375 in US the information revealed a country that feel that there
was a need of honesty in control and that community assurance in business management was
little since of public leaders. control provides break for value in public as well as in business
leadership. This piece of writing also outline the typical description of worth leadership. Value
manager is defined by its character manners and individuality of leadership .Control are an
imperative part of the value organization and it plays a crucial task in quality administration
execution. To put into practice quality top administration ought to take charge of it. It as well
gives the key divergence between a organizational management and a quality management which
are strategic administration has more significance in quality leadership, imaginative leadership is
more imperative for quality leader since the achievement of quality management depends on
workforce sharing a widespread Idea, Empowerment and collaboration appropriate response to
client concern and quality is all the time connected to the client satisfaction. Support creativeness
and innovation that is further significant for quality. The paper give importance to on the
significant of the management for the value management. In twenty first century there is
contention and uninterrupted change in the international market. The sustained existence of a
corporation looks upon the skills and experise of the manager. On a foundation level the
initiative is that the administration in a corporation should act as a person in charge. When a
executive acts as head he produce the quality goods. Administrator produce vision for the
corporation he ought to be in touch to his human resources and persuade them to attain it. If he
will not perform so the corporation will not be capable to endure. Shewheart Deming’s fourteen
points (Samia, 2015).
The study developed and tested the associations between quality management, worker
engagement, continuous improvement, and customer satisfaction. The results lend sturdy support
for the declaration that quality management is an important determinant of customer satisfaction.
(Kim, 2016).
Kangethe (2015) in his study of purchaser excellent practices they nation that the customer is
continually right this in reference to the reality that the consumer generates income/ sales to the
agency in which the employer benefits through earnings. This applies to authorities’ entities that
may be providing services the cease result is the consumer satisfaction score. Client high-quality
awareness practices widespread seem at some five key elements that shape the base on which
23
handing over high-quality offerings are primarily based on. Corporations rely upon their clients
and therefore should recognize modern and destiny patron needs, must meet consumer
requirements and strive to exceed patron expectancies. these elements, in line with Kangethe(
2015) shipping of best offerings requires an business enterprise to: recognize what the client
honestly values, create a climate for service within the company, make certain that the
employees also shop at the equal area the other customers do, religiously keep at the
competition‟ premises, and hyperlink inner great metrics with client needs. For a corporation to
be successful, it has to align their operational practices to what the client needs. This indicates
setting measures in location where conversation between control of the company and the
customer is -way for waft of ideas and issues, to comments being relayed each method
(Kangethe, 2015).
It has been put up that dealer quality administration is definitely connected to communal
responsibility. A firm cannot add to the public successfully devoid of the collaboration amid the
supply chain associates. All associates in the supply chain ought to understand the result of their
work, services in relation to fitness of the the social order and surroundings. while vendors have
excellence executive systems, they are measured with reverence to value and delivery
presentation and contribute in value training, progression development, and the novel invention
growth procedure. The synergy amid the entire supply chain resolve to make logic of
accountability of the the public so that every associate try to do their finest to defend the
surroundings and lessen sound and toxic waste. This allow the organization to bear out social
reliability project for the people with extra successful and well-organized manner (Sadikoglu &
Olcay, 2014).
It has been established that preparation is confidently connected to operational performance,
member of staff presentation, and client outcome. allocate firm assets to preparation on value
pays off as expert workers recognize advanced numerical technique, concepts of excellence,
essential distinctiveness of their production, and the arrangement and process of the organization.
In addition, treating workers as a precious resource increases their allegiance to the firm, inspire
them and make them proud of their jobs, improve their occupation related execution, minimizes
absence, and minimizes intent to leave. Well-informed staff will add to quality, dependability,
and well-timed supply of the products as well as services. With effectual preparation, workers
know the production and the configuration of the organization better. Successful preparation on
worth also elevates workers skill to labor successfully and competently. In addition, it will
advance employees’ allegiance to the organization, their enthusiasm, and job-related execution.

24
workers instruction on supplying elevated quality and dependable goods or services reduces
purchaser complaint (Sadikoglu & Olcay, 2014).
2.7 Conceptual Frame work
In this section, the conceptual framework is outlined in a schematic interpretation that presents a
set of broad ideas to clarify the relationship between variables. In this study, the independent
variable is Total Quality Management (TQM) Practices; the dependent variable is operational
performance while the moderating variables are environmental factors; legal environment and
organizational policies. These variables are related as shown in Figure 2.1.
According to Kathaara (2014) Operational execution can be expressed essentially as the manner
of measuring the competence and usefulness of action. Profoundly focused firms have higher
than normal operational execution, deciding operational performance considers four variables
known as aggressive needs; Cost, Quality, Delivery and Flexibility. These competitive priorities
are widely used as indicators of the competitive dimensions of manufacturing. Theoretical
literature indicate that firms that conducted studies on different Total Quality Management
measurements appears that there are few exploration work, still has aggregately thought
seriously about every one of these measurements in the management. As it is said the objective
of this examination was to determine the relationship between quality management and
operational performance of manufacturing companies in Nairobi Kenya.

25
Intervening Variable
Indepedent Variable
Indepedent Variable Depedent Variable
(Source, Author 2018)
As shown in figure 2.1 above, there exists a relationship between TQM practices and Operational
performance that are the structured and unbiased variables inside the have a look at respectively.
However, these variables are laid low with intervening variables which include the
organizational policies and legal environment. According to Kathaara (2014) the study results
showed that the respondents agree that the financial institution management plays an active role
in developing strategies, plans and structures and neutral on financial institution leadership has
furnished the necessary assets bank leadership has supplied conductive operating surroundings,
bank management influences the selection of selecting certified providers and financial
institution management has stimulated group of workers and control.
According to Mukhtar, Qureshi and Sharif (2012) TQM practices have affirmative relationship
with organizational execution conventionally, organizational performance is measured by using
monetary guidelines inclusive of marketplace percentage, overall sale, and profit and so forth. for
this reason, to conquer capacity inadequacies of organizational overall performance frameworks,
this observe further carries non-monetary classes: development in employees ‘mind-set towards
high-quality, reduction in absenteeism, reduction in exhaustion rate, development in skill’s
degree, and so on for measuring organizational performance.
Operational Performance
i. Cost and waste reduction
ii. Productivity
improvement.
Environmental factors
Legal environment
Organizational policies
Total Quality Management
practices
Top Management
Commitment
Customer Focus
Supplier Quality
Management
Continuous improvement
and innovation
Employee Involvement

26
The legal environment influences the enterprise and its managers substantially. Legal elements
contain how flexible and adaptable the regulation and felony policies that govern the enterprise
are. Additionally it is the exact rulings and courts selection. Criminal provisions may
additionally contribute to more or much less earnings relying at the environment of operation.
The political surroundings in a country influence the rules and authorities regulations and rules
under which an overseas company operates. every us of a within the world follows its personal
system of regulation and a overseas organisation running inside it has to put up with by those
rules for as lengthy as it maintains to perform there. Consistent with geringer, 2012, the felony
surroundings constitute the numerous overseas and home legal guidelines leading how global
firms ought to operate. The criminal surroundings is in addition classified as home, host and
global environments. The house surroundings stipulates that an organisation should follow the
laws in its country these encompass laws concerning exportation of merchandise which include
the ones forbidding positive goods to sure nation.Organizational regulations, methods, tactics,
and structures for why are like written hints that each worker, from the pinnacle management to
the janitorial offerings, and upkeep personnel(gactaern, 2010).

27
CHAPTER THREE
RESEARCH METHODOLOGY
3.1 Introduction
The chapter has set out a description of the research method. It has set out ways to evaluate the
effect of TQM implementation on operational performance of Food & Beverages manufacturing
companies in Kenya. This section outlines the research design that was adopted and the methods
of information collection and analysis employed to respond the research questions.
3.2 Research Design
This study adopted an explanatory research design study which is a quantitative process was
used to investigate the possibility of the relationship between TQM implementation and
operational performance. A cross-sectional survey design was as well used to study the
association between TQM practices implementation and operational execution at a single point
in time. The study used an explanatory research design. In relation to Mugenda and Mugenda
(2003), a consistent examination configuration is one which gathers facts with a precise end goal
to test the hypothesis or to answer inquiries regarding the existing status of the subjects under
study. A logical examination outline is an attempt to gather information from individuals from a
population so as to decide the present status of that population as for one or more variables. The
study set up the connection and causal association between total excellence management
practices and operational performance of Food & Beverage manufacturing companies.
3.3 Population of the Study
There are a total of 87 big food and beverage industrialized firms in Nairobi (Appendix II) which
are members of KAM (KAM 2014). The firms are classified into 7 sub-sectors of the Food and
Beverages Sector: The Sub-sectors are: Alcoholic Beverages; Bakers and Millers; Cocoa,
Chocolate and Sugar; Juices/Waters/Dairy/Carbonated Soft Drinks; Tobacco; Vegetable Oils and
Slaughtering/Preparation and Preservation of Meat. The population of the study comprised of big
food and beverage industrialized firms in Nairobi County, Kenya.
According to Kibera (1996), the criteria used to determine the size of a firm are capital, sales
turnover or number of employees. He recommends use of number of employees’ criteria as it is
information which is readily available to researchers. He further classifies size of firms in
Kenyan context as micro firms (11-50 employees), medium firms (51-100 employees) and large

28
firms (above 100 employees). These manufacturing firms were identified using the Kenya
Association of Manufacturers and Exporters Directory (KAM 2014) because the researcher
established that KAM maintains the most updated coverage of manufacturing firms in Kenya.
3.4 Data Collection
The study used primary data. Primary data consists of uniqueinformation gathered by the scholar
for the specific purpose of the study at hand (Mugenda & Mugenda, 1999). Data was collected
by use of questionnaires administered by the researcher. The use of questionnaires is justified
because this is the most valuable and affordable way of collecting information from a small
factual sample within a short period of time. The unit of analysis was the firms and data will be
collected at the firm level. For each firm one respondent filled in a questionnaire. The
respondents were the operations managers conversant with the organization’s operations
management.
3.4.1 Data collection Instrument
The researcher used a Questionnaire collection tool mostly used in normative surveys. This is a
scientifically prepared form or document comprising a set of questions purposefully intended to
prompt, response from interviewees or research informers for the drive of collecting information
or information. It is a form of inquiry document, which encompasses a systematically assembled
and well organized string of questions projected to draw out the information which
presentcomprehension into the character of the predicament under study. Structured
questionnaires were used they are those in which various control or direction is given for the
response. This may be defined as closed form since the questions are essentially short, calling for
the respondent filling for an article out of a list of specified responses. See appendix one for the
questionnaire.
3.5 Validity and Reliability
Validity brings up to the accuracy and significance of inference which are based on the research
result (Mugenda et al. 2003). If such data is a true replication of the variables, then conclusions
based on such data was precise and meaningful. To ascertain the validity, the researcher used
content validity through supervisor assistance. Construct validity of the instrument was obtained
through the development of the scales with the help of the experts. The questionnaire items
(questions) were developed to represent each variable in the research. A pre-test was done on the
items and their measurement by checking the results obtained from the focus groups. Expertise

29
opinions were also sought from lecturers and environmentalists. To ensure data collection
procedure was reliable, cronbach alpha coefficient was computed using SPSS version 20. A
value of 0.8 was obtained and compared with the threshold of 0.7. In addition, a pilot test was
conducted in 10 food and beverage companies in Kiambu. 12.
Table 3.1 Reliability coefficients
a) alpha coefficients
Cronbach's Alpha N of Items
.816 61
The results indicated that the overall Cronbach alpha is above the threshold of 0.7, thereby
reliable for study.
b) Cronbach alpha coefficients for the measurement scales for the constructs
Construct measured Number of Items Alpha
Top management commitment 9 .748
Customer focus 6 .719
Supplier quality management 5 .713
Continuous improvement and innovation 5 .713
Employee involvement 9 .716
Operational performance 11 .732
The results in Table 3.2b indicates that the alpha reliability coefficient of the items in each
objective of the study was appropriate because they were all above the threshold of 0.7. The
reliability coefficient ranged from 0.708 to 0.748. Therefore all the questionnaire items were
considered to have internal consistency and hence were used for further analysis.
3.6 Data Analysis and Presentation
The data collected was analysed by the use of descriptive statistics. Composed data was
chronologically organized in relation to the questionnaire outline to guarantee that the correct
code was entered for the exact variable cleaned and tabulated. The tabulated data was evaluated
using descriptive, correlation as well as regression statistics in with the aid of Statistical Package
for Social Sciences (SPSS 20.0). Pearson correlation statistics was used to create the relationship

30
between the total quality management practices and operational performance of Food&
Beverages manufacturing companies based on the regression model shown here below.
A multiple regression analysis was used whereby the independent variable was regressed against
the dependent variable in order to establish the relationship between the two variables. To test
hypothesis H01 to H05, Pearson’s Correlation Analysis was used. To test hypothesis H06, Multiple
Regression model; the model is presented below;
Y= α + β1 X1 + β2 X2+ β3 X3 + β4 X4+β5 X5 +e
Where:
α=constant
β1 - β4 = Regression coefficients
Y= Operational Performance
X1= Top management commitment
X2 =Customer Focus
X3= Supplier quality management
X4= Continuous Improvement & Innovation.
X5== People management/ Human Resource Management

31
CHAPTER FOUR
RESULTS AND DISCUSSION
4.1 Introduction
This chapter presents results and discussions of the results with reference to the specific research
objectives and hypotheses. This chapter presents the results and discussions of the results of the
study. The presentation of the results is based on the objectives. The chapter starts with
descriptive statistics of the study variables, correlation analysis and test of hypotheses. Finally,
the chapter presents discussion of the results of the study. It presents the effect of Total Quality
Management on operational performance of large food manufacturing firms in Nairobi County.
4.2 Descriptive Statistics
4.2.1 Response rate
The study targeted 87 large food manufacturing firms in Nairobi County. Responses were
returned from 78 organizations which represents a response rate of 89.66%.Therefore the rate of
response was considered to be adequate for the study. The characteristics of the respondents
which were assessed by the study includes age of the organization, number of employees in the
company and the nature of the business.
4.2.2 Profile of the Respondents
This section presents and discusses results of descriptive statistics of the profile of respondents
and organizations. It also presents descriptive analyses results of the study variables.
Table 4.1: Distribution of Respondents by Position
Position Frequency Percentage
Production/Operations Manager 40 51.28
Sales/Marketing Manager 12 15.38
Human Resource Manager 11 14.10
Administrator 6 7.69
Finance Manager 4 5.12
Other 5 6.41
Total 78 100

32
As shown in Table 4.1, the majority of the respondents were production and operation managers
(51.28%), 15.38% were sales and marketing managers, 14.10% were human resource managers,
7.69% were administrators and 5.12% were financial managers. Given the positions of the
respondents, in can be concluded that the respondents’ responses were considered informed.
4.2.2 Profile of the Firms
The study sought to establish the demographic variables of the company in terms of age of the
organization, number of employees in the company and the nature of the business. The study
also sought to establish how old the organization is, this was important to the study in
establishing the effectiveness of TQM and operational performance in the firms.
Table 4.2: Distribution of Firms by Ownership
Frequency Percentage
Local 66 84.46
Foreign 12 15.38
Total 78 100
Regarding ownership of firms, Table 4.2 shows that majority of the firms were local (84.46%),
while the rest were foreign (15.54%).
Table 4.3 Distribution of Firms by Type
Frequency Percentage
Public 9 12
Private 69 88
Total 78 100
From the table 4.3 shows that majority of the firms were private by 88% then 12%.
Table 4.4 Distribution of Firms by Years in Operation
Number of years in operation
Years Frequency Percentage
Less than 5 years 20 25.64
5 to 10 years 18 23.07
11 to 19 years 20 25.64
More than 20 years 20 25.64
Total 78 100.0

33

34
Table 4.4 demonstrates the number of years these firms have been in operation. It established
that 20 firms (25.64%) had operated for over 20 years, 20firms (25.64%) had operated for 11-19
years, 18 firms (23.07%) had operated for 5-10 years and 20(25.64%) firms had operated for 5
years and below. This indicated that most firms had operated for long enough for the employees
to evaluate the strategic knowledge management aspects in the firms and their impact.
Table 4.5 Distribution of Firms by Nature of Business
Frequency Percentage
Bakers and Millers 30 38.4
Juices/Water/Soft drinks/Dairy 14 17.9
Vegetable Oils 14 17.9
Cocoa/Chocolate/Sugar 6 7.6
Alcoholic Beverages 5 6.4
Tobacco 2 2.5
Other 7 10.3
Total 78 100.0
As shown in Table 4.5 below, the study established that 30 firms (38.4%) that participated in the
study were Bakers and Millers, 14 firms (17.94%) were Juices/Waters/Soft Drinks/Dairy firms
and 14 firms (17.94%) were Vegetable oil firms. 6 firms (7.69%) represented Cocoa, Chocolate
and Sugar firms while 5 firms (6.4%) represented Alcoholic Beverages firms. Only 3 firms
(2.5%) represented Tobacco Firms. The rest 7(10.3%) were involved in other food
manufacturing activities not included in the above categories.
Table 4.6 Distribution of Firms by Number of Employee
Employees Frequency Percentage
Less than 50 12 15.38
51 to 100 36 46.15
More than 100 30 38.46
Total 78 100.0
From Table 4.6 demonstrates the number of employees and establishes that majority of the
firms; 36 (46.15%) had between 51-100 employees and they were in the private firms. While 30

35
firms (38.46%) had more than 100 employees and only 12 firms (15.38%) had between 20-50
employees.
4.2.3 Top Management Commitment
The study sought to determine the effects of Top Management Commitment on implementation
of TQM. The scale that was used was Likert scale of 1-5, where 1= strongly Disagree;
2=Disagree; 3=Neutral; 4=Agree; 5=Strongly Agree.
Table 4.7 Mean and standard deviation measures for Top management commitment
Top management commitment N Mean Std.
Deviation
Organization leaders take on the responsibility for developing
quality oriented management systems
78 4.23 .788
Leadership has provided necessary resources to meet new
requirements
78 4.40 .690
Leaders evaluate the application and advancement of TQM 78 4.29 .854
Leaders assign resources for non-stop improvement of the
management system
78 4.42 .694
Leadership has provided conducive working environment to
employees
78 4.24 .648
Leadership influences the decision of selecting qualified suppliers 78 4.10 .713
Leadership has inspired staff and management in effective and
efficient use of resources
78 4.21 .709
Leaders intermingle with customers and keep in mind their
contributions with designing goods and services
78 4.28 .881
Leadership improves operational performance 77 4.37 .705
Overall Mean 4.28 0.744
As demonstrated in table 4.7 On determining whether the organization leaders take on the
obligation for developing quality oriented management systems, the outcome indicate that
majority of those that responded strongly agreed, (mean = 4.23: Standard deviation = 0.788).

36
This indicates that the current decisions in most of the organization leaders take on the obligation
for developing quality oriented management systems.
From the table 4.7 On whether firms’ leadership has provided the essential assets to meet the
new needs resultant from value management systems implementation, The study results show
that most of the respondents strongly agreed with the statement, (mean =4.40; Standard
deviation= 0.690). This indicates that most of the firms’ leadership has provided the essential
assets to meet the original requirements ensuing from value management systems
implementation. On whether the leaders personally evaluate the application and advancement of
Total Quality principles, the findings indicate that majority of the firms (mean = 4.29; standard
deviation = 0.854) agreed that emphasis in the companies leaders personally assess the
application and progress of Total Quality principles.
On whether leaders assign resources for non-stop improvement of the management system, the
results show that most of the firms strongly agreed that leaders assign resources for non-stop
improvement of the management system (mean = 4.42; standard deviation = 0.694).
The results show that majority of the firms strongly agreed that company leadership has provided
conducive working environment to employee involvement in quality management process (mean
= 4.24; standard deviation = 0.648). This indicates that the companies top managers of company
leadership has provided conducive working environment to employee involvement in quality
management process.
From the result it is also evident that majority of the firms indicated that company leadership
influences the decision of selecting qualified suppliers and certifying suppliers for quality
material (mean = 4.10; standard deviation = 0.713). This shows that the top management of the
firms from the result it is also evident that majority of the firms indicated that company
leadership influences the decision of selecting qualified suppliers and certifying suppliers for
quality material.
On whether the organization leadership has inspired staff and management in successful and
competent use of the assets and efforts of the institution towards value excellence, the study
findings show that majority of firms strongly agreed with the statement our organization
leadership has inspired staff and management in successful and competent use of the resources
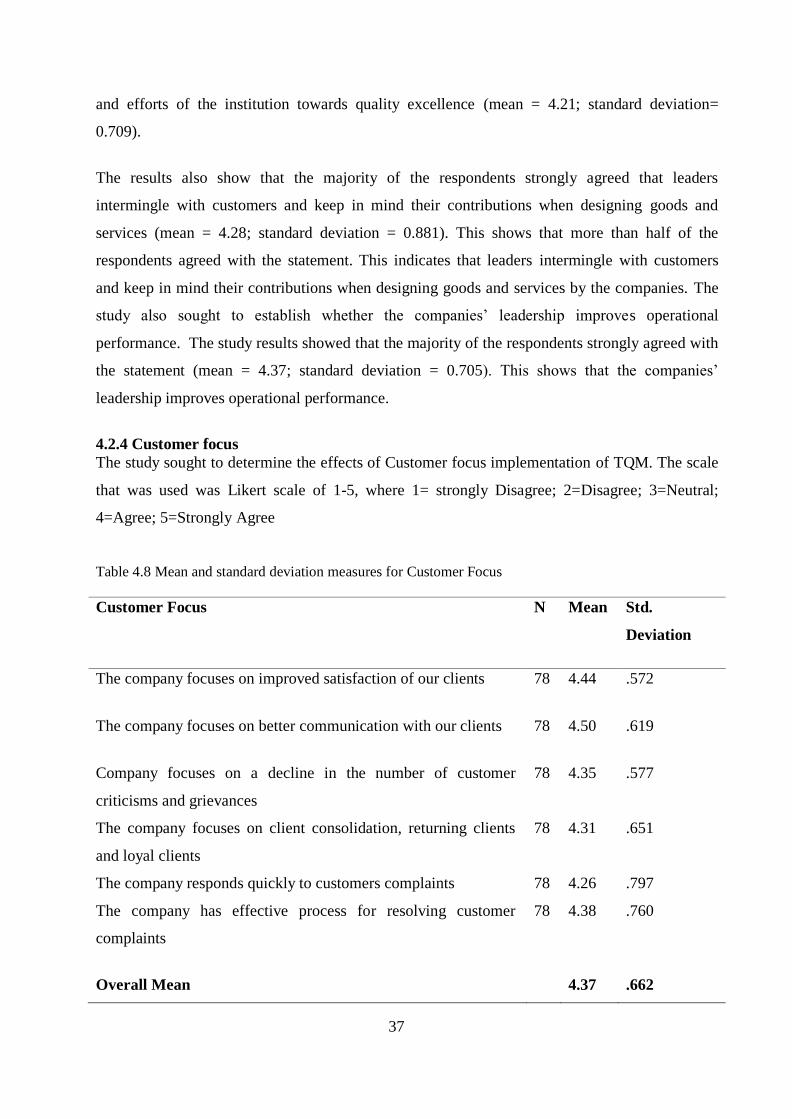
37
and efforts of the institution towards quality excellence (mean = 4.21; standard deviation=
0.709).
The results also show that the majority of the respondents strongly agreed that leaders
intermingle with customers and keep in mind their contributions when designing goods and
services (mean = 4.28; standard deviation = 0.881). This shows that more than half of the
respondents agreed with the statement. This indicates that leaders intermingle with customers
and keep in mind their contributions when designing goods and services by the companies. The
study also sought to establish whether the companies’ leadership improves operational
performance. The study results showed that the majority of the respondents strongly agreed with
the statement (mean = 4.37; standard deviation = 0.705). This shows that the companies’
leadership improves operational performance.
4.2.4 Customer focus
The study sought to determine the effects of Customer focus implementation of TQM. The scale
that was used was Likert scale of 1-5, where 1= strongly Disagree; 2=Disagree; 3=Neutral;
4=Agree; 5=Strongly Agree
Table 4.8 Mean and standard deviation measures for Customer Focus
Customer Focus N Mean Std.
Deviation
The company focuses on improved satisfaction of our clients 78 4.44 .572
The company focuses on better communication with our clients 78 4.50 .619
Company focuses on a decline in the number of customer
criticisms and grievances
78 4.35 .577
The company focuses on client consolidation, returning clients
and loyal clients
78 4.31 .651
The company responds quickly to customers complaints 78 4.26 .797
The company has effective process for resolving customer
complaints
78 4.38 .760
Overall Mean 4.37 .662

38
As demonstrated in table 4.8 on whether the company focuses on improved satisfaction of our
clients, the outcome show that the majority of the respondents strongly agreed with the statement
(mean = 4.44 and standard deviation = 0.572) which indicates that company focuses on
improved satisfaction of our clients.
From table 4.8 the study also sought to establish whether the company focuses on improved
communication with their clients. The results show that majority of respondents strongly agreed
with the statement that the company focuses on improved communication with their clients
(mean = 4.50 and standard deviation = 0.619). This indicates that the company focuses on
improved communication with their clients.
To establish whether the company focuses on a reduction in the number of customer complaints
and grievances, the results presented in table shows that most of the respondents strongly agreed
(mean =4.35 and standard deviation = 0.577) with the statement that the company focuses on a
reduction in the number of customer complaints and grievances.
The study sought to establish whether the firms focuses on Client consolidation, returning
clients and loyal clients, the results shows that most of the respondents from the different firms
strongly agreed with the statement that the firms focuses on Client consolidation, returning
clients and loyal clients (mean = 4.31 and standard deviation = 0.651).
On whether the firms responds quickly to customers complaints, the findings shows that most of
the respondents agreed with the statement that firms responds quickly to customers complaints (
mean = 4.26 and standard deviation = 0.797). This indicates that the comp responds quickly to
customers complaints.
Finally, it was important to assess whether the company has effective process for resolving
customer complaints. The results show that majority of the respondents strongly agreed that the
company has successful process for resolving customer complaints (mean =4.38 and standard
deviation = 0.760). This indicates that the company has effective process for resolving customer
complaints.

39
4.2.5 Supplier Quality Management
The study sought to determine the effects of supplier quality management on implementation
of TQM. The scale that was used was Likert scale of 1-5, where 1= strongly Disagree;
2=Disagree; 3=Neutral; 4=Agree; 5=Strongly Agree.
Table 4.9 Mean and standard deviation measures for Supplier quality management
Supplier Quality Management N Mean Std.
Deviation
The organization develops strategic alliances with suppliers 78 4.15 .774
The organization works with suppliers to guarantee that
expectations are met
78 4.36 .683
The organization involves suppliers timely in the product
development process
78 4.06 .958
Suppliers should embrace TQM and be involved in this
process
78 4.13 .709
Effective SCM practices enable the suppliers to adopt quality
management and deliver reliable products/services
78 4.46 .715
Overall Mean 4.232 0.7678
As demonstrated in table 4.9 the study also sought to establish whether the organization develops
strategic alliances with the suppliers. The study results also indicates that largely of the
respondents agreed with the statement (mean =4.15 and a standard deviation of 0.774). This
indicates that the organization develops strategic alliances with the suppliers.
From table 4.9 on whether the organization works with suppliers to guarantee that hope are met,
the results of the study showed that majority of the respondents strongly agreed with the
statement (mean = 4.36 and standard deviation of 0.783). This shows that organizations work
with vendors to ensure that outlook are met.

40
On whether the organizations involves suppliers near the beginning in the merchandise
development course to take benefit of their capabilities and expertise, the study results shows
that most of the respondents agreed with the statement, that the organization involves suppliers
timely in the manufactured goods advance process to take benefit of their capabilities and
capability (mean =4.06 and a standard deviation =0.958).
The study also wanted to establish if the suppliers should adopt TQM and be involved in this
process. From the results shown it is noted that majority of the respondents strongly agreed with
the statement. This indicates that most of the respondents believe that whether the suppliers
should adopt TQM and be involved in this process (mean = 4.13; standard deviation = 0.709).
The study wanted to establish if the companies in the food processing industry encourages
active supply management practices to facilitate the contractors to take on excellence
management and convey reliable and great quality goods and or services timely . From the
results it is noted that majority of the companies strongly agreed that they encourage effective
supply administrationpractices enable the suppliers to assume quality management and deliver
reliable and high quality products and or services timely (mean = 4.46; standard deviation =
0.715).
4.2.6 Continuous Improvement & Innovation
The study sought to determine the effects of Continuous improvement and innovation on
implementation of TQM. The scale that was used was Likert scale of 1-5, where 1= strongly
Disagree; 2=Disagree; 3=Neutral; 4=Agree; 5=Strongly Agree.
Table 4.10 Mean and standard deviation measures for Continuous improvement and innovation
Continuous improvement and innovation
N Mean Std.
Deviation
The company undertakes quality audits and evaluation regularly 78 4.21 .691
Use of customers complaints as a method to initiate
improvements in current processes
78 4.40 .671
The company evaluates the performance of suppliers 78 4.40 .727
The company improves employees competencies through
training
78 4.33 .816
Regular departmental and employee appraisals carried 78 4.24 .840
Overall Mean 4.316 .749

41
As demonstrated in table 4.10 thestudy sought to establish whether the company undertakes
quality audits and evaluation. The study results also shows that the majority of the respondents
agreed with the statement (mean = 4.21 and a standard deviation of 0.691). This indicates that
firms the company undertakes quality audits and evaluation.
On whether the organization use of purchaser complaints as a method to commence
improvements in existing processes, the results of the study showed that majority of the
respondents strongly agreed with the statement (mean = 4.40 and standard deviation of 0.671).
This shows that organizations use of client complaints as a means to kick off improvements in
current processes.
On whether the organizations evaluates the performance of suppliers, the study results shows that
most of the respondents agreed with the statement, that the organization evaluates the
performance of suppliers (mean =4.40 and a standard deviation = 0.727).
On whether the company improves employees’ competencies through trainings, the results
indicate that majority of the respondents strongly with the statement that company improves
employees’ competencies through trainings (mean =4.33) standard deviation = 0.816).
The study also sought to establish whether there are regular departmental and employee
appraisals carried out. From the results shown it is noted that majority of the respondents
strongly agreed with the statement. This indicates that most of the firms that participated in the
regular departmental and employee appraisals (mean = 4.24; standard deviation = 0.840).
On continuous enhancement practice, result show that the Food and beverage firms undertake
value audits and evaluation to improve the quality of products being marketed by the firms and
consequently, the organization undertakes standard departmental and worker appraisals to brief
and assess how the nonstop improvements plans of the products is available on in the firm. This
process of continually improving on the product is achieved through registering customer
complaints as a method of initiating improvement in the current process, and also training
employees with an aim of improving their competencies on the product quality and safety.
disparity of opinion of respondents is manifest as the standard deviation is greater than one
except on the regular departmental and employee appraisal that they all seem to agree.
4.2.7 Employee Involvement Practices
The aim of the study was to determine the effects of employee involvement practices on
implementation of TQM. The scale that was used was Likert scale of 1-5, where 1= strongly
Disagree; 2=Disagree; 3=Neutral; 4=Agree; 5=Strongly Agree.

42
Table 4.11 Mean and standard deviation measures for Employee involvement practices
Employee involvement practices N Mean Std.
Deviation
Employees effective knowledge and learning capability will
provide sustainability of quality management in the firm
78 4.21 .752
Employees are involved in decision making that affect their work 78 4.33 .832
Quality does not originate in one department or function; it is the
concern of the whole firm
78 4.42 .845
Employees are given opportunity to suggest quality improvement 78 4.42 .765
Training is given to all employees based on the results of the
training needs assessment to improve quality
78 4.19 .854
The employees are provided with feedback on their quality
performance
78 4.15 .955
Effective training will lead to employees loyalty to the firm,
motivation and work performance
78 4.27 .848
If employees are educated on producing dependable
products/services their participation will be productive
78 4.37 .758
Employees believe that quality is their responsibility 78 4.26 .918
Overall Mean 4.29 0.836
From the table 4.11 the study sought to establish whether employees’ effective knowledge and
learning capability will offer sustainability of quality management in the firm. The study results
also indicates that most of the respondents agreed with the statement (mean = 4.21 and a
standard deviation of 0.752). This indicates that firms’ workers’ effective knowledge and
learning competence will provide sustainability of quality administration in the firm.
On whether the employees are involved in decision making that affect their work, the results of
the study showed that majority of the respondents strongly agreed with the statement (mean =
4.33 and standard deviation of 0.832). This shows that organizations employees are involved in
decision making that affect their work.
On whether the organizations Quality does not originate in one department or function; or
whether it is the concern of the whole firm, the study results shows that most of the respondents
agreed with the statement that organizations Quality does not begin in one department or

43
function; or whether it is the responsibility of the whole firm (mean =4.42 and a standard
deviation =0.845).
On whether the employees are given opportunity to suggest quality improvement, the results
indicate that majority of the respondents strongly with the statement (mean =4.42) standard
deviation = 0.765).This shows that the company gives the employees are given opportunity to
suggest quality improvement.
The study’s aim was to establish whether training is provided to all employees centred on results
of the training needs assessment to improve quality. From the results shown it is noted that
majority of the respondents strongly agreed with the statement. This indicates that most of the
firms training is given to all employees centred on results of the training needs assessment to
improve quality (mean = 4.19; standard deviation = 0.859).
The study’s aim was to establish whether the companies in the food processing business
employees are provided with feedback on their quality performance. From the results it is noted
that majority of the companies strongly agree that employees are provided with feedback on their
quality performance (mean = 4.13; standard deviation = 0.955). This indicates that companies
that embrace employees are provided with feedback on their quality performance.
On whether organizations effective training will advance employees’ loyalty to the firm,
motivation, and work performance. The result shows that majority of the companies strongly
agreed that organizations effective training will increase workers faithfulness to the firm,
motivation, and work performance (mean = 4.27; standard deviation = 0.848). This indicates that
organizations learning are enhanced by the employment of professionals who control how
information and knowledge is stored. With this stored information it is noted that organizations
can effectively perform.
The study also sought to establish whether the workers are skilled on producing dependable and
high quality merchandise and or services, their full involvement in the assembly stage would be
more fruitful. The study results also shows that the majority of the respondents agreed with the
statement (mean = 4.37 and a standard deviation of 0.758). This indicates that firms the workers
are trained on producing dependable and high quality merchandise and or services, their full
participation in the production stage would be more fruitful.

44
On whether the organization employees believe that quality is their responsibility, the results of
the study showed that majority of the respondents strongly agreed with the statement (mean =
4.26 standard deviation of 0.918). This shows that organizations employees believe that quality
is their responsibility.
4.2.8 Operational Performance
The study aimed at establishing the Effect of TQM practices on Operational performance . The
scale that was used was Likert scale of 1-5, where 1= strongly Disagree; 2=Disagree; 3=Neutral;
4=Agree; 5=Strongly Agree.

45
Table 4.12 Mean and standard deviation Operational performance
Operational Performance N Mean Std.
Deviation
Effective Waste reduction 78 4.19 .807
Cost reduction 78 4.43 .843
Improved Product/service quality 78 4.47 .716
Enhanced Company profitability 78 4.59 .574
Improved Product reliability 78 4.42 .730
Acquisition of a bigger market share 78 4.36 .720
Increased customer retention as a result of customer
satisfaction
78 4.23 .805
Improved operational efficiency thus reducing operation costs 78 4.44 .783
Overall Mean 4.39 0.747
From Table 4.12 demonstrates that On determining if Operational performance leads to effective
waste reduction the outcome indicate that majority of the organizations strongly agreed, (mean =
4.19: Std deviation = 0.807).
From table 4.12 on whether operational performance leads to cost reduction , the study results
show that most of the respondents strongly agreed with the statement, (mean =4.36; Standard
deviation= 0.772).
On whether operational performance leads to improvement in product/service quality, the
findings indicate that majority of the firms (mean = 4.47; standard deviation = 0.716) agreed
that there is improvement in product/service quality due to operational performance .
On whether Operational performance has enhanced company profitability, the results show that
most of the firms strongly agreed that profitability has improved as as result of Operational
performance (mean = 4.59; standard deviation = 0.574). This indicates that and this contributes
to performance of the firms.Operational Performance is a determinant to competitive success of
the firm.
It was also noted that operational performance leads to improvement in product reliability. The
results show that majority of the firms strongly agreed that operational performance leads to

46
improved product reliability (mean = 4.42; standard deviation = 0.730). This indicates that there
is influence of operational performance on products reliability.
On determining if Operational Performance leads to acquisition of bigger market share, the
outcome indicate that majority of those who answered strongly agreed, (mean = 4.36: Standard
deviation = 0.720). This indicates that there is a positive association between Operational
performance and acquisition of a bigger market share.
On determining if operational performance leads to improvement in order placement, the study
results show that most of the respondents strongly agreed with the statement, (mean =4.22;
Standard deviation= 0.658). This indicates that order placementis positively associated with
operational performance.
On if operational performance has led to increased customer retention which results in customer
satisfaction, the findings indicate that majority of the firms (mean = 4.23; standard deviation =
0.805) agreed that there is customer retention which has a positive effect on operational
performance.
On determining if operational performance leads to improvement in operational efficiency , the
study results show that most of the respondents strongly agreed with the statement, (mean
=4.44; Standard deviation= 0.783). This indicates that operational efficiency is positively
associated with operational performance.

47
4.3 Test of Correlation
The analysis was done using Pearson’s correlation matrix. The results were shown in table 4.13
below.
Table 4 13 Correlation Matrix for TQM practices; Top management commitment, Customer Focus,
Supplier Quality Management, Continuous improvement and Employee Involvement on Operational
Performance
Top
manage
ment
commit
ment
Custo
mer
focus
Supplier
s
relations
hip
Continuo
us
improve
ment
Employe
e
involve
ment
Operatio
n
performa
nce
Top
managem
ent
Pearson
Correlat
ion
1 .241* .167 .112 .411
** .388
**
Sig. (2-
tailed)
.033 .143 .331 .000 .000
N 78 78 78 78 78 78
Customer
focus
Pearson
Correlat
ion
.241* 1 .269
* -.020 .105 .347
**
Sig. (2-
tailed)
.033 .017 .861 .359 .002
N 78 78 78 78 78 78
Suppliers
relationsh
ip
Pearson
Correlat
ion
.167 .269* 1 -.051 .341
** .270
*
Sig. (2-
tailed)
.143 .017 .657 .002 .017
N 78 78 78 78 78 78
Continuo Pearson .112 -.020 -.051 1 -.057 -.181

48
us
improve
ment
Correlat
ion
Sig. (2-
tailed)
.331 .861 .657 .622 .113
N 78 78 78 78 78 78
Employe
e
involvem
ent
Pearson
Correlat
ion
.411**
.105 .341**
-.057 1 .251*
Sig. (2-
tailed)
.000 .359 .002 .622 .027
N 78 78 78 78 78 78
Operatio
nal
performa
nce
Pearson
Correlat
ion
.388**
.347**
.270* -.181 .251
* 1
Sig. (2-
tailed)
.000 .002 .017 .113 .027
N 78 78 78 78 78 78
*. Correlation is significant at the 0.05 level (2-tailed).
**. Correlation is significant at the 0.01 level (2-tailed).
4.3.1 Correlation between Top Management Commitment of TQM on Operational
performance
The first intention of the study was to establish the effect of Top Management Commitment of
TQM on Operational performance of Food and Beverages Manufacturing Companies in Kenya.
This objective is discussed below. Pearson’s correlation Table 4.13 shows that there is a positive
significant relationship between Top management commitment and dependent Operational
Performance. (r = .0388, p< 0.05). There is a affirmative relationship between the results
indicates a positive correlation Top management commitment and dependent Operational
Performance.

49
4.3.2 Correlation between Customer Focus on TQM on Operational performance
The second objective of the study was to determine the effect of Customer Focus on TQM on
Operational performance of Food and Beverages Manufacturing Companies in Kenya. This
objective is discussed below. A correlation analysis with two tailed significance level produced
the values shown in table 4.14 the r value (r = 0.347, p< 0.05). This indicates a positive
correlation between customer focus and operational performance. This means that customer has
positive effect on organizational performance.
4.3.3 Correlationbetween Supplier quality Management on TQM on Operational
performance
The third aim of the study was to establish the effect of Supplier quality Management on TQM
on Operational performance of Food and Beverages Manufacturing Companies in Kenya. This
objective is discussed below. Pearson’s correlation Table 4.15 indicates that The Pearson
correlation value of (r = 0.270, p< 0.05) indicates a positive correlation between Supplier quality
management and operational performance.
4.3.4 Correlation between Continuous Improvement and Innovation of TQM on
Operational performance
The fourth objective of the study was to determine the effect of Continuous Improvement and
Innovation of TQM on Operational performance of Food and Beverages Manufacturing
Companies in Kenya. The r value of (r =-0.57, p> 0.05) indicates a negative correlation between
continuous improvement and innovation and operational performance.
4.3.5 Correlation between Employee Involvement of TQM on Operational performance
The fifth objective of the study was to determine the effect of Employee Involvement of TQM on
Operational performance of Food and Beverages Manufacturing Companies in Kenya. This
objective is discussed below. The results of correlation analysis were as shown in table 4.13
above.The value of (r = 0.251, p< 0.05) shows existence of a positive correlation between
Employee involvement and operational performance.

50
4.4 Test of Hypotheses
Table 4.14 Model Summary
Mode
l
R R Square Adjusted R
Square
Std. Error of
the Estimate
1 .533a .284 .235 .35723
a. Predictors: (Constant), Employee involvement,
continous improvement and innovation, customer focus,
supplier quality mgt, top mgt commitment
ANOVAa
Model Sum of
Squares
Df Mean
Square
F Sig.
1
Regression 3.649 5 .730 5.719 .000b
Residual 9.188 72 .128
Total 12.838 77
a. Dependent Variable: operational performance
b. Predictors: (Constant), Employee involvement, continous improvement and
innovation, customer focus, supplier quality mgt, top mgt commitment
Coefficientsa
Model Unstandardized
Coefficients
Standardized
Coefficients
T Sig.
B Std. Error Beta
1
(Constant) 2.108 .706 2.986 .004
top mgt commitment .302 .108 .318 2.803 .007
customer focus .236 .111 .226 2.133 .036
supplier quality mgt .111 .092 .132 1.201 .234
continous
improvement and
innovation
-.161 .080 -.203 -2.006 .049
Employee involvement .035 .103 .040 .343 .732

51
a. Dependent Variable: operational performance
4.4.1 Regression Model Summary
Model on table 4.14 sought to establish the regression between degree to which total quality
practices are related to operational performance of Food companies is expressed in the positive
correlation coefficient (r) = 0.533 and coefficient of determination, (r2) =0.284 as shown on table
above This implies that the five independent variables together predict about 28 % of the
variation in operational performance is explained by the joint dimensions of TQM of food and
beverages companies.
4.4.2 Analysis of Variance
As shown in table 4.14 Analysis of variance (ANOVA) was used to test the implication of the
regression model in relations to differences in means of the dependent and independent variables
as shown on table above. The ANOVA test produced an F-value of 5.719 which is significant at
p=0.000. This depicts that the regression model is significant at 95% confidence level. . The
ANOVA results show that the model was significant (F=5.719 , p<0.05. as a result the regression
model is statistically significant in predicting how top management commitment, customer
focus, supplier partnership, continuous improvements and employees’ involvement practices
affect operational performance of food companies.
4.4.3 Multiple Regression Analysis
This section discusses the results of hypotheses testing in relation to the research hypotheses.
The study sought to examine how the variables of the study; Top management commitment,
customer focus, supplier management, continuous improvement and innovation and lastly
employees involvement (Hypothesis H01to H05). )
H01: Top management commitment of TQM does not have effect on Operational
Performance of Food &Beverages Manufacturing Companies in Kenya.
As shown in the table 4.14 the standardized coefficients show that the effect of Top management
commitment on operational performance is positive and significant (β =0.302, t =2.803, p< 0.05).
Therefore according to the results, the hypothesis was thus rejected. Therefore, it was concluded

52
that Top management commitment has statistically significant positive effect on operational
performance. The study found that the coefficient of Top Management Involvement was
positive. This indicates that the top management is involved in day to day operations of the
company operations for the performance to improve.
This result concurs with the study of Mwaniki and Okibo (2014) where they found out that Top
administration of NBK had shaped a clear vision that all personnel can classify and construe. By
top management setting practical and attainable goals the complete team work hard towards
achieving the goals this in turn is seen in go up in income of the bank. The top management of
NBK recognize want for providing its personnel with required guidance and assets to ensure they
carry out their duties well. From the findings NBK trains its staff previous to posting them to any
new sector (Mwaniki & Okibo, 2014).
On the practice of top management commitment, the finding were consistent with that of
Sigei(2014) who observed that there is increased tendency of managers to continue with an
interior focus for TQM rather than adopt a customer focus, and this could enlighten why there is
a shift in recognition from TQM to ISO9000, which is perhaps suggestive of managers’ pre-
occupation with achieving short-term results. TQM requires total support of top management,
who understand that it is not a temporary cost lessening project but rather a long term venture,
One possible elucidation could be due to the accomplishment of TQM implementation as
measured by speed of delivery, high flexibility and high productivity that would lead to success
in the minor measures such as financial and non-financial performance. (Sigei, 2014).
The findings were also consistent with those of Kathaara(2014) where the study results
indicated that bank leadership plays an active role in creating strategies, plans and systems
consequential from value management systems, provide conductive operational background to
worker involvement in quality administration process, inclined the decision of selecting qualified
suppliers and certifying suppliers for quality substance, creates strategies, plans and systems for
achieving higher value in the organization and that has encouraged staff and administration in
successful and competent use of the assets and efforts of the institution towards quality
excellence.

53
H02: Customer focus of TQM does not have effect on Operational Performance of Food and
Beverages Manufacturing Companies in Kenya
The effect of customer focus on operational performance is positive and significant (β =0.236, t
=2.133, p<0.05). The second hypothesis was therefore rejected. It was therefore concluded that
customer focus has statistically significant positive effect on operational performance.
The findings were consistent with the findings of Mwaniki and Okibo(2014) who found out that
when the affiliation amid NBK and the purchaser improves, monetary performance improves and
when the turn round happen, financial feat drops. NBK rolled out a 24 hour working call centre
to be reception any customer’s complaint as well as respond any purchaser query anytime any
day. This was done as a way of the bank move to get better how it serves its clients. From the
result NBK should build up ways of preparation its clientele how to use the merchandise the
bank rolled out (Mwaniki & Okibo, 2014).
H03: Supplier quality management of TQM does not have effect on Operational
Performance of Food and Beverages Manufacturing Companies in Kenya.
The third hypothesis for this study was that supplier quality management of TQM does not have
an effect on Operational Performance of Food and Beverages Manufacturing Companies in
Kenya the effect of supplier relationship on operational performance is positive and insignificant
(β =0.111, t =1.201, p> 0.05)and thus we fail to reject the third hypothesis. It was therefore
concluded that Supplier quality management has statistically insignificant positive effect on
operational performance.
The finding differs with those of Mwaniki and Okibo (2014) which indicates that when
association between NBK and its vendors improves, monetary presentation also improves. When
the association between NBK and suppliers deteriorates, financial performance drop (Mwaniki &
Okibo, 2014).
The findings also differs with those of Kathaara(2014) that the banks had arrived into tactical
corporation with sellers so as to make certain sustained execution of the bank’s processes are
continuous, The bank’s has successfully harness the possible payback of creating partnership
with suppliers, The bank’s stimulates and facilitates communication with key suppliers the
purpose of getting better their success and competence of stipulation of the requisite supplies,

54
The bank’s habitually share with vendors information such as their desires and prospect and that
the Bank’s promote supplier value teamwork ensuing in operational execution.
H04: Continuous improvement and innovation of TQM does not have effect on Operational
Performance of Food and Beverages Manufacturing Companies in Kenya.
The fourth hypothesis for this study was that of Continuous Improvement and Innovation of
TQM of TQM does not have an effect on Operational Performance of Food and Beverages
Manufacturing Companies in Kenya. The effect of continuous improvement on operational
performance is negative and insignificant (β = -0.161, t =-2.006, p<0.05). . Therefore we reject
the fourth hypothesis. It is therefore concluded that there is statistically significant negative
effect of continuous improvement and innovation and operational performance.
From the findings on continuous improvement, there seems to be an agreement with Sigei (2014)
with the aim of the objective of quality administration is to lessen costs and improve customer
contentment. This shows that the outcomes will support the market-based theory that the
competitive improvement coming from a bigger cost arrangement or being able to distinguish
goods in a way that add worth for clientele and by producing products that better satisfy the
requirements of customers, there is the potential for differentiation. (Sigei, 2014).
H05: Employees involvement of TQM does not have effect on Operational performance of
Food and Beverages Manufacturing Companies in Kenya.
The fifth hypothesis for this study was that Employee Involvement of TQM does not have an
effect on Operational Performance of Food and Beverages Manufacturing Companies in Kenya,
the effect of employee involvement on operational performance is positive and insignificant (β
=0.035,t=0.343, p> 0.05). This shows that Employee involvement has positive insignificanteffect
on operational performance and thus the fifth hypothesis was not rejected, the results shows
existence of statistically insignificant positive effect of employee involvement on operational
performance.
The results on employee involvement were not consistent with the view of Sigei (2014) who
pointed that quality hitches requires cross-functional communication at countless levels through
the organization, which characteristically means establishing and using teams. The finding on

55
employee empowerment and training suggests that the companies undertake regular and
continuous training aimed at improving the quality of the firm’s products (Sigei, 2014).
The findings of the study were not consistent with those of Kathaara(2014) which shows that
implementation of superiority organization has affected workers value of life, bank spend a big
quantity of its yearly budget on workers guidance and growth on total quality supervision
systems, workforce at all stages have the duty and authority to formulate decisions that touch
them and their job teams, quality administration systems programme promotes the liberty of
workforce to use their inventiveness in matters of customer delivery. There is extensive
involvement and communication to employees on all matter that apprehension their work and
association performance, payment system that support worker performance, contribution, idea
and development of team-work have been instituted in the bank and Bank management has
promoted the establishment of an environment that encourages employee efforts toward
attainment of institutional objective.
H06: Total Quality management does not have effect on operational performance of Food
and Beverage Companies in Kenya.
The results shows that Top management commitment has the greatest effect on operational
performance (β =0.3035).
The full regression model in Table 4.14 can also be interpreted to show how dimensions of top
management commitment, customer focus, supplier quality management and Employee
involvement practices have positive coefficients, implying that these independent variables
positively predict operational performance of food and beverages companies. Therefore taking
all independent variables (top management commitment, customer focus, and Employee
involvement practices) constant at zero (0); operational performance of food and beverage
companies will be at 2.108 .
Therefore a unit increase in top management commitment, customer focus, Supplier quality
management and Employee involvement practices will lead to, 0.3035, 0.236, 0.111, and 0.035
unit increase in operation performance of food and beverage companies.
The results of the study further indicate that p-value of (0.07) for Top management commitment,
(0.036) for customer focus; (0.049) for continuous improvement and innovation are smaller than

56
the significance level of 0.05. The implications of these results are that there is a significant
relationship between Top management commitment, customer focus, Continuous improvement
and innovation, and operational performance of food and beverage companies in Nairobi.
Therefore the sixth hypothesis was rejected. Hence, the equation for the regression model can be
given by;
Y = β0 + β1X1+ β2X2+ β3X3+ β4X4 +β5 X5
Y=2.108+0.3035X1+0.236X2+0.111X3-0.161X4+0.035 X5
Where;
Y= Operational Performance
X1= Top management commitment
X2= Customer focus
X3= Supplier quality management
X4=Continuous improvement and innovation
X5 = Employee empowerment practices
β0β1 β2 β3 β4 β5 are the coefficient of the variables.

57
CHAPTER FIVE
SUMMARY, CONCLUSION AND RECOMMENDATIONS
5.1 Summary
The study found out that total quality management improves operation performance thus
reducing operation cost. Therefore the implementation of quality management systems has
increased Food and beverages profitability, enhanced sales, increased company’s
competitiveness and resulted in acquisition of bigger market share, enhanced service delivery in
the company, ensured effective waste reduction in operations, improved operation efficiency
thus reducing operation costs and increased customer retention as a result of customer
satisfaction.
5.1.1 Summary of the Findings
The first objective was to find out the effect of Top management commitment on operational
performance. The findings reveal a positive significant relationship between Top management
commitment and operational performance. Thus Hypothesis H01 was rejected. The study
established that Food and beverages companies Top management commitment practices affect
the operational performance of Food companies. That the implementation of total quality
management has facilitated Food companies management to make available the essential assets
to meet the new desires ensuing from quality administration systems, availed conductive
functioning surroundings to worker taking part in quality association procedure, predisposed the
resolution of selecting capable vendors and certifying suppliers for value material, create
strategies, tactics and systems for achieving greater quality in the company and that has
stimulated personnel and management in successful and competent use of the resources and
efforts of the corporation towards quality distinction.
The second objective of the study was to determine the effect of customer focus on operational
performance. The findings reveal a positive significant relationship between customer focus and
operational performance. Therefore Hypothesis H02 was rejected. The study established that
Food and beverage companies Customer focus affect operational performance of Food
companies. The implementation of Customer focus has facilitated improved customer
satisfaction, communication with clients has improved, and the number of complaints has also
reduced due to effective complaint handling thereby leading to increase in number of loyal
customers.

58
The third objective of the study was to determine the effect of Supplier quality management on
operational performance. The findings reveal a positiveinsignificant relationship between
supplier relationship and quality management and operational performance. Hence Hypothesis
H03was notrejected. The results of the study showed that supplier partnership does not influence
operation performance of food and beverage companies. The implementation of total quality
management companies has not entered into tactical partnership with providers as a result as to
ensure sustained execution of the food companies processes are continuous, The food companies
has not effectively coupled the possible payback of creating partnerships with vendors, The food
companies doesn’t endorse and enables announcement with key vendors the aim of cultivating
their usefulness and competence of stipulation of the requisite provisions, The food companies
regularly shares with vendors information such as their wants and prospects and that the Food
and beverages promotes supplier quality cooperation resulting in operational presentation.
The fourth objective of the study was to determine the effect of continuous improvement and
innovation on operational performance. The findings reveal a negative significant relationship
between continuous improvement and innovation and operational performance. Therefore we
reject Hypothesis H04. This therefore shows that the results will back the market-based theory
that the aggressive advantage arising from a greater price structure or being able to distinguish
products in a way that enhances value for clients and by producing products that better satisfy the
requirements of customers, there is the potential for differentiation.
The fifth objective of the study was to determine the effect of employee involvement on
operational performance. The findings reveal a positiveinsignificant relationship between
employee involvement and operational performance. Therefore, Hypothesis H05 was not rejected.
The study found out that employee empowerment practices does not influences operation
performance of Food companies. The findings of the study shows that implementation of
excellence management has not affected workers quality of life, Food companies doesn’t spend
a bulky quantity of its yearly resources on workers guidance and growth on total quality
administration systems, workers at all levels don’t have the obligation and authority to make
decisions that shape them and their job groups, quality administration systems have promoted the
autonomy of workforce to utilize their proposal in matters of client delivery. There is no
prevalent participation and announcement to workers on all matter that involve their job and
association performance, prize systems that sustain employee feat, contribution, initiative and
encouragement of team-work have been institute in the companies.

59
The sixth objective of the study was to determine the joint effect of Total Quality Management
practices on Operational performance, Top management commitment, customer focus and
Supplier quality management, continuous improvement and innovation and Employee
involvement on operational performance. The corresponding hypothesis was tested using
multiple regression analysis. The regression results showed that the combination of Top
management commitment, Customer focus, Continuous improvement and innovationexplained a
greater variance in Operational performance than individual variables alone. The findings further
revealed that Top management commitment had the greatest effect on operational performance.
Therefore Hypothesis H06 was rejected.
5.2 Conclusion
The usage of quality administration frameworks has expanded organizations' benefit, upgraded
deals, and expanded organizations' intensity and brought about procurement of greater piece of
the pie, improved administration conveyance in the organizations, guaranteed compelling waste
diminishment in operations, enhanced operation execution hence lessening operation costs and
expanded client maintenance therefore of consumer loyalty.
Execution of Total quality administration has encouraged organizations to give the essential
assets to meet the new prerequisites coming about because of value administration frameworks,
gave conductive workplace to representative inclusion in quality administration prepare,
impacted the choice of choosing guaranteeing providers for quality material, makes
methodologies, arrangements and frameworks for accomplishing predominant quality in the
establishment and that has roused staff and administration in compelling and proficient
utilization of the assets and endeavours of the foundation towards quality magnificence.
Quality administration has not influenced employees satisfaction, organizations doesn’t spends
a lot of its yearly spending plan on representatives preparing and improvement on Total quality
administration frameworks, representatives at all levels have the obligation and expert to settle
on choices that influence them and their work groups, quality administration frameworks have
not advanced the opportunity of workers to utilize their drive in matters of client conveyance.
There is no broad inclusion and correspondence to representatives on all matters that worry
their occupation and association execution, remunerate frameworks that bolster worker
execution, interest, activity and cultivating of collaboration have been founded in the sustenance
organizations.

60
The usage of TQM in the organizations has not gone into vital association with providers in
order to guarantee proceeded with execution of the organizations forms continuous, The
organizations has not adequately bridled the potential advantages of setting up associations with
providers, The organizations doesn’t advances and encourages correspondence with key
providers the point of enhancing their viability and productivity of arrangement of the required
supplies, The organizations doesn’t regularly imparts to providers data, for example, their
necessities and desires and doesn’t advances provider quality participation bringing about
operational execution.
5.3 Recommendation
There is need for the organization's administration to execute authoritative TQM practices
change in the association to upgrade the usage TQM to improve the association's methodology of
ceaseless change, open correspondence and participation all through the association. Also, the
organizations' administration sense of duty regarding quality need to pass on the stance,
rationality and activities that aggregate quality administration usage will get a higher need in the
association.
There is need for the organizations to organize and upgrade add up to quality administration
preparing procedure to help in get ready representatives towards dealing with the total quality
administration, in order to have the capacity to recognize and add to progressing quality change
procedure of operational productivity.
There is need for organizations' administration to set clear, quantifiable and achievable targets
with the goal that they will set the correct course for the firm. Furthermore they have to viably
assign sufficient required assets and abilities in order to accomplish those destinations and in this
way enhance operational execution and productivity.
There is need for organizations administration to set up develop and regard their providers as
long haul accomplices as they are basic piece of the associations business operations and
materials and bought parts are frequently a noteworthy wellspring of value issues. This will
advance and encourage correspondence and in this way enhancing the adequacy and
effectiveness of procedures that make esteem.

61
5.4 Limitations
The review utilized poll that depend on self-report reactions, however the issue with utilizing a
survey is that it depends on the supposition that members would react to the inquiries in a
legitimate and precise way.
It is not generally the case that members reply in a legitimate way. This is on account of
members frequently giving answers that they accept to be alluring. However the scientist utilized
subjective information to supplement the data gotten through the poll.
There were a few respondents who did not give legitimate data but rather gave general data
making it hard to acquire the required data. However the specialist rotated shut and open finished
inquiries with a specific end goal to find coordinate solutions.
Attributable to the way of the subject respondents, some hesitance was experienced from a few
respondents as far as unveiling data as to the TQM works on ascending from dread of being
decried by the directors in the association who are in charge of taking care of issues identified
with the matter under review. However the analyst guaranteed the respondents of the privacy of
the data that they gave and looked for expert from administration to attempt inquire about in the
association. The analyst likewise connected the letter of expert from the college to the poll so as
give further affirmation on the reason for the review.
5.5 Suggestions for further Studies
This review was conducted on Food and beverages manufacturing firms in Nairobi County.
Manufacturing firms may contrast as far as learning needs and levels of competency in such
manner when contrasted with administration firms and innovative firms. Along these lines the
outcomes can't be summed up to all organizations. Other relevant contrasts countrywide may
influence level of execution as this review concentrated on assembling firms inside Nairobi
County as it were. The review ought to be duplicated in different ventures and in different
nations. Such replication could additionally decide if the after-effects of this review can be
summed up to a more extensive setting.
The study adopted an explanatory research design in which data was collected once at a single
point in time due to constraints of cost and time. Although explanatory studies are helpful in
getting insights into aspects of variables, perceptions vary over time and faces limitations in
determining other causal relationships that may affect the study. Therefore, future research

62
should adopt longitudinal research design in data collection to enhance understanding of the
linkages between variables or other causal relationships involved in the study.
This study only examined specific TQM management practices effects on total quality
management practices and operational performance of Food and beverage companies in Kenya.
However there are other effects TQM management practices which similarly have a say
operational performance of Food and beverage companies hence it is recommended that further
research on TQM management practices be done to recognize and inspect additional variables
effect on performance of food and beverage companies.
In this study, knowledge based theory and resource based view were the only theory of reference
for the study thus limiting other aspects of study that may affect organizational performance.
Future research should broaden the conceptualization of knowledge theory to include other
theories that may give depth to the study.

63
REFERENCE
Al-Nasser, A., Yusoff, 1. Z., & Islam, 2. (2013). The Moderator Effect of the Relationship
Between Soft Total Quality Management Practices and Performance in
Municipalities. Australian Journal of Basic and Applied Sciences,7(8),1-4.
Bahri, S., Hamzah, D., & Yusuf, R. M. (2012). Implementation of Total Quality Management
and Its Effect on Organizational Performance of Manufacturing Industries Through
Organizational Culture in South Sulawesi, Indonesia. IOSR Journal of Business and
Management (IOSR-JBM), 5(1), 1-6.
Brah, S., & Lim, H. (2006). The Effects of Technology and TQM on the Performance of
Logistics Companies. International Journal of Physical Distribution & Logistics
Management, 36(3), 192-209.
Blackmon, C. A. (1997). Benchmarking and operational performance: some empirical results.
International Journal of Operations & Production Management .
Curado, C., (2006). The Knowledge Based-View of the Firm: from theoretical origins to future
implications.Int. J. Learning and Intellectual Capital, 3(4), 2-15.
Dale. E. Z. (1993). Managers and Consulting: A Total Quality Perspective. The Journal of
Management Development, 12(7), 45-60.
Economou, V. P., & Chatzikonstantinou, P. G. (2009). Gaining Company’s Sustained
Competitive Advantage, Is Really a Necessary Precondition for Improved Organizational
Performance? The Case of TQM. European Research Studies, 12(3),5-15.
Ekise, I. E., Nahayo, A., Mirukiro, J. d., & Nsengiyumva, B. (2013). Analysis of the Impact
of Agricultural Input Subsidies Voucher Programme on the Livelihoods of Small
ScaleMaize Producers in Kirehe District, Eastern Rwanda. New York Science Journal
, 3-4.
Fening, D. F., Amaria, D. P., & Frempong, E. O. (2013). Linkages between Total Quality
Management and Organizational Survival in Manufacturing Companies in Ghana.
International Journal of Business and Social Science, 4(10),1-4.

64
Fenwick .A, (2011). Differences between the resource-based view and the knowledge-based view
of the firm.https://alifenwick.wordpress.com/2012/07/17/differences-between-the-resource-
%C2%ADbased-view-and-the-knowledge-%C2%ADbased-view-of-the-firm-a-fenwick-2011/,
Retrieved [30th January 2016], 1-1.
Gactaern, O. (2010). The Political, Economic And Legal Environments of International
Business. Retrieved from Gactaern organization:http://gactaern.org/uniton
8/05/20118.
Gharakhani, D., Rahmati, H., Farrokhi, M. R., & Farahmandian, A. (2013). Total Quality
Management and Organizational Performance.Journal of Education and Practice, 6(15),
1-13.
Hassan, M. u., Mukhtar, A., Qureshi, S. U., & Sharif, S. (2012). Impact of TQM Practices on
Firm’s Performance of Pakistan’s Manufacturing Organizations. International
Journal of Academic Research in Business and Social Sciences, 2(10), 2-7.
Irfan, S., Ijaz, A., Kee, D., & Awan, M. (2012). Improving Operational Performance of Public
Hospital in Pakistan: A TQM Based Approach. World Applied Sciences Journal,19(6), 2-
4.
Jaafreh, A. B., & Al-abedallat, A. Z. (2013). The Effect of Quality Management Practices on
Organizational Performance in Jordan: An Empirical Study. International Journal of
Financial Research, 8(3),2-1.
Jurevicius, O., (2015).Resource Based view: Strategic Insight Management
https://www.strategicmanagementinsight.com/topics/resource-based-view.htmlretrieved[30th
January 2016].
Jorgensen, K. B., & Nielsen, A. F. (2013). The effects of TQM critical Success factors on
Organizational Performance An empirical study on small and medium sized Danish
manufacturing companies, 17-30.
Kabergey, M., & Richu, S. (2015). Effect of Reverse Logistics on Operational Performance
of Sisal Processing Firms in Nakuru County, Kenya. International Journal of
Economics, Finance and Management Sciences, 3(5), 5-6.

65
Kathaara, C. K. (2014). Total Quality Management Practices And Operational Performance
Of Commercial Banks In Kenya, 2-70.
Kenya Association of Manufacturers. (2014). Kenya Manufactureres & Exporters Directory
2014.57-67
Kaplan, S., Schenkel, A., Krogh, G., Weber, C., (2001). Knowledge-Based Theories of the
Firm in Strategic Management: A Review and Extension, Academy of Management
review, 17-23.
Kibera, F.N. (1996). Introduction to Business: A Kenyan Perspective, Kenya Literature
Bureau, Nairobi, Kenya.
Kim, G. S. (2016). Effect Of Total Quality Management On Customer Satisfaction. nternational
Journal of Engineering Sciences & Research Technology , 4-7.
Kor, Y. and Mahoney, J. 2004. Edith Penrose’s (1959) contributions to the Resource-based
View of the Strategic Management’. Journal of Management Studies 41: 183-192.
Lakhe, R., & Mohanty, R. (1993). Total Quality Management Concepts, Evolution and
Acceptability in Developing Economies, 9,2-18.
Lia, S., Ragu-Nathan, B., & Raob, S. S. (2006). The impact of supplychain management
practices on competitive advantage and organizational performance. Omega the
International Journal of Management Science, 34,3-10.
Mohammed, A., Alharthi, A. A., Alharthi, D. K., Alhabashi, W. S., & Hasan, S. H. (2014).
Organization Performance Improvement using TQM. International Journal of
Computer Applications, 108(9),1-5.
Mugenda, M., & Mugenda, G. (1999). Research Methods: Qualitative and quantitative
approaches. Nairobi: Acts Press.
Mukonyo, M. F. (2014). Effects Of Total Quality Management Implementation In
Performance Of Microfinance Institutions In Kenya:(A Case Of K-Rep Development
Agency (KDA),15-33.

66
Munizu, M. (2013). The Impact of Total Quality Management Practices towards Competitive
Advantage and Organizational Performance: Case of Fishery Industry in South
Sulawesi Province of Indonesia. Pakistan Journal of Commerce & Social Sciences, 7,
184-197.
Mwaniki, C., & Okibo, D. B. (2014). Effects of total quality management on financial
performance in the banking sectora case study of national bank of Kenya. IOSR
Journal of Economics and Finance (IOSR .1-17.
Nilsson, L., Johnson, M. D., & Gustafsson, A. (2001).The impact of quality practices on
customer satisfaction and business results: Product versus service
organizations[Electronic version]. Retrieved [30th January 2016], from Cornell
University, School of Hospitality Administration site:
http://scholarship.sha.cornell.edu/articles/6941-1.
Oruma, W. B. (2014). Factors Influencing Implementation Of Total Quality Management In
Construction Companies In Kenya: A Case Of Nakuru County, 15-50.
Raja, M. W., Bodla, D. M., & Malik, D. S. (2011). Evaluating the Effect of Total Quality
Management Practices on Business Performance:A Study of Manufacturing Firms of
Pakistan. International Journal of Business and Social Science, 2(9),2-8.
Rawashdeh, A. M. (2014). TQM As A Source Of Bank Performance And Competitive
Advantage Empirical Study In Jordanian Banking Sector. European Scientific
Journal,2-10.
Sadikoglu, E., & Olcay, H. (2014). The Effects of Total Quality Management Practices on
Performance and the Reasons of and the Barriers to TQM Practices in Turkey.
Advances in Decision Sciences , 5-7.
Samia, J. (2015). Impact of Top Management Commitment on Quality Management.
International Journal of Scientific and Research Publications,5(8) , 3-5.
Sigei, C. K. (2014). Total Quality Management And Performance Of Multinational
Pharmaceutical Firms In Nairobi,Kenya.

67
Sijtsema.B.P, Postma. J.B.M (2004). Knowledge –Based Approach to Innovation: An
application for project –based firms. 1-5
Yew, O. F., & Ahmad, H. (2014). Management of Change and Operational Excellence in the
Electrical and Electronics Industry. International Review of Management and
Business Research, 4(8), 3-1.

68
APPENDICES
APPENDIX I: QUESTIONAIRE
Introduction
I am an MBA (Operations Management) student at Egerton University. The purpose of this
questionnaire is to gather information on the effect of implementation of Total Quality
Management (TQM) on operational performance of large food manufacturing firms in Nairobi.
The information provided for this research will be purely for academic purposes and will be
treated with utmost confidentially.
SECTION A: BACKGROUND INFORMATION
This section of the questionnaire refers to the background or biological information. Although I
am aware of the sensitivity of the questions in this section, the information will allow me to
compare group's respondents. Once again I assure you that your response will remain
anonymous. Your co-operation is much appreciated.
SECTION A: Company’s Profile
Please tick the appropriate box for the questions that follow below:
1. What is your job position in the firm?
2. What type of firm do you operate?
(a) Private (b) Majority Local
Public Majority Foreign
3. How old is your organization?
5 years and below 5-10 years 11-19 years over 20 years
4. How many employees are in this company?

69
Less than 20 between 20-50 between 51-100 above 100
5. What is the nature of business of your manufacturing company?
Alcoholic beverages Cocoa, Chocolate & Sugar Tobacco
Bakers and Millers Juices/Waters/Soft Drinks/Dairy Vegetable Oils
Slaughtering/Meat Preparation and Preservation
SECTION B: Extent of Application of TQM in Food& Beverages Manufacturing Industry
in Kenya over the Past 5 Years
The questions are ranked on a five Likert scale. Rankings are 1. Strongly Disagree; 2.Disagree;
3.Neutral; 4. Agree; 5.Strongly Agree; please tick the number in the boxes that correspond to the
Likert scale. Please indicate the extent to which you agree with the following statements
B. Top Management Commitment aspects 1
2
3
4
5
Organizational leaders take on the responsibility for developing quality
oriented management systems
Company leadership has provided the necessary resources to meet the new
requirements resulting from quality management systems implementation
Leaders personally evaluate the application and advancement of total quality
principles
Leaders assign resources for nonstop improvement of the management system
Company Leadership has provided conductive working environment to
employee involvement in quality management process
The company Leadership influences the decision of selecting qualified
suppliers and certifying suppliers for quality material
The company leadership has inspired staff and management in effective and
efficient use of the resources and efforts of the institution towards quality
excellence
Leaders intermingle with customers and keep in mind their contributions when
designing goods and services
leadership improves operational performance
C. Customer Focus 1
2
3
4
5
The company focuses on improved satisfaction of our clients.
The company focuses on better communication with our clients.
Company focuses on a decline in the number of customer criticisms and
grievances.
The company focuses on Client consolidation, returning clients and loyal
clients

70
The company responds quickly to customers complaints
The company has effective process for resolving customer complaints
C. Operational Performance
1 2 3 4
5
1. Cost reduction
2. Improved product/service quality
3. Enhanced company profitability
D. Supplier Quality Management 1 2 3 4 5
The organization develops strategic alliances with suppliers
The organization Works with suppliers to guarantee that expectations are met
The organization involves suppliers timely in the product development
process to take advantage of their capabilities and expertise
Suppliers should embrace TQM and be involved in this process.
Effective supply management practices enable the suppliers to adopt quality
management and deliver reliable and high quality products and/or services
timely
F. Continuous Improvement & Innovation 1 2 3 4 5
The company undertakes quality audits and evaluation regularly
Use of customer complaints as a method to initiate improvements in current
processes
The company evaluate the performance of suppliers
The company improves employees competencies through trainings
Regular departmental and employee appraisals carried out
E. Employees Involvement Practices 1
2 3 4
5
Employees’ effective knowledge and learning capability will provide
sustainability of quality management in the firm.
Employees are involved in decision making that affect their work
Quality does not originate in one department or function; it is the concern of
the whole firm
Employees are given opportunity to suggest quality improvement
Training is given to all employees based on the results of the training needs
assessment to improve quality
The employees are provided with feedback on their quality performance
Effective training will lead to employees’ loyalty to the firm, motivation, and
work performance.
If employees are educated on producing dependable and high quality products
and/or services, their full participation in the production stage would be more
productive
employees believe that quality is their responsibility

71
4. Improved product reliability
5. Acquisition of bigger market share
6. Increased order placement
7. Effective waste reduction in operations
8. Increased retention as a result of customer satisfaction
9. Improved operation efficiency thus reducing operation costs
10. Increased order placement
………………………….Thank you for your participation............................

72
APPENDIX II: List of Food and Beverages Manufacturing Companies in Nairobi County
ALCOHOLIC BEVERAGES COCOA, CHOCOLATE & SUGAR
Cadbury Kenya Limited
Africa Spirits Limited C.Dormans Ltd
London Distillers Chandaria Industries
EA Breweries Candy Kenya Ltd.
Kenya Breweries Ltd. Kenafric Industries Ltd.
Erdemann Co. Kenya Sweets Ltd.
Global Merchants Kwality Candies & Sweets Ltd.
Kenya Wine Agencies Kenya Nut Company
BAKERS AND MILLERS Nestle Foods Kenya
Pembe Flour Mills Patco Industries Ltd
Rafiki Millers LTD. Pearl Industries
Unga Group Wrigley Company EA
Kamili Packers Desbro Kenya Ltd
Kapa Oil Refineries Kenafric Dairies
Tri-Clover Industries Premiere Food Industries
Barley EAML Ltd Tru Foods Ltd
Jambo Biscuits C.Czarnikorv Sugar EA
Bakers Corner Ltd. Al-Mahra Industries
Ennsvalley Bakery Ltd. Kenya Tea Development Agency
Mini Bakeries Ltd.
Company (K) JUICES/WATERS/CARBONATED SOFT
DRINKS/DAIRY
Proctor & Allan (E.A) Ltd Aquamist Ltd.
Manji Food Industries Excel Chemicals Ltd
Danone Baby Nutrition Kevian Kenya Ltd
Haco Tiger Bands Europack Industries Ltd
Gonas Best Ltd Avoken Limited
Chirag Kenya Limited Razco Ltd
Tropikal Brand (Afrika) Ltd. Glaciers Products
DPL Festive Ltd. Beverage Services Ltd
Spice World Miritini Kenya Ltd

73
Nairobi Flour Mills Pristine International
Premier Flour Mills Coca-cola East and Central Africa Ltd
Mayfeeds Kenya Limited Kuguru Food Complex Limited
Melvin Marsh International Nairobi Bottlers
Promasidor Kenya Limited SBC Kenya Ltd
Wanji Food Industries Ltd Green Forest Foods
Belfast Millers Bounty Ltd
Biofood Products Trust Feeds Ltd
Value Pack Foods New KCC Ltd
SLAUGHTERING/PREPARATION AND
PRESERVATION OF MEAT
Sameer Agriculture& Livestock Kenya Ltd.
Kenchic Ltd Palmhouse Dairies
Highland Canners Ltd TOBACCO
Alpha Fine Foods Ltd. British American Tobacco Kenya Ltd.
W.E Tilley Ltd Mastermind Tobacco Ltd
Farmers Choice Ltd VEGETABLE OILS
East African Sea Food Ltd Edible Oil Products
Giloil Company Limited
Frigoken Ltd
.
( Kenya Association of Manufacturers, 2014).