Evaluation of dam overtopping risk based on univariate and bivariate flood frequency analyses
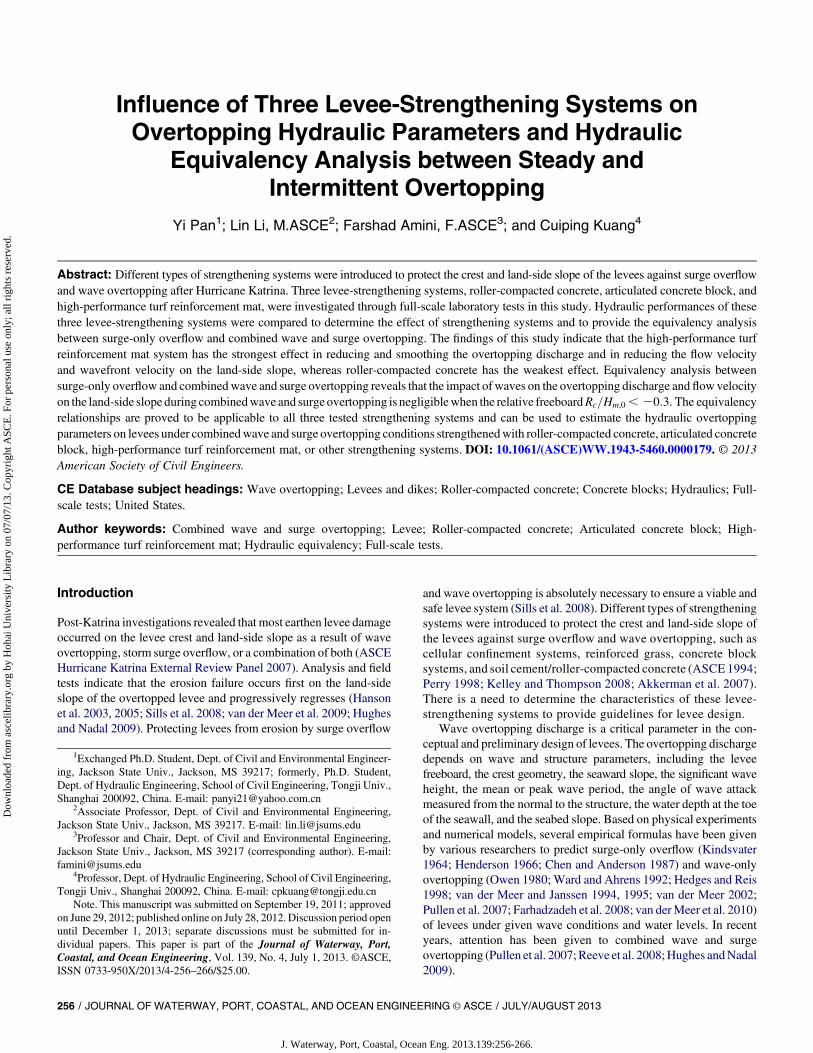
Influence of Three Levee-Strengthening Systems onOvertopping Hydraulic Parameters and Hydraulic
Equivalency Analysis between Steady andIntermittent Overtopping
Yi Pan1; Lin Li, M.ASCE2; Farshad Amini, F.ASCE3; and Cuiping Kuang4
Abstract: Different types of strengthening systems were introduced to protect the crest and land-side slope of the levees against surge overflowand wave overtopping after Hurricane Katrina. Three levee-strengthening systems, roller-compacted concrete, articulated concrete block, andhigh-performance turf reinforcement mat, were investigated through full-scale laboratory tests in this study. Hydraulic performances of thesethree levee-strengthening systems were compared to determine the effect of strengthening systems and to provide the equivalency analysisbetween surge-only overflow and combined wave and surge overtopping. The findings of this study indicate that the high-performance turfreinforcement mat system has the strongest effect in reducing and smoothing the overtopping discharge and in reducing the flow velocityand wavefront velocity on the land-side slope, whereas roller-compacted concrete has the weakest effect. Equivalency analysis betweensurge-only overflow and combinedwave and surge overtopping reveals that the impact of waves on the overtopping discharge and flowvelocityon the land-side slope during combinedwave and surge overtopping is negligiblewhen the relative freeboardRc=Hm,0 , 20:3. The equivalencyrelationships are proved to be applicable to all three tested strengthening systems and can be used to estimate the hydraulic overtoppingparameters on levees under combinedwave and surge overtopping conditions strengthenedwith roller-compacted concrete, articulated concreteblock, high-performance turf reinforcement mat, or other strengthening systems. DOI: 10.1061/(ASCE)WW.1943-5460.0000179. © 2013American Society of Civil Engineers.
CE Database subject headings: Wave overtopping; Levees and dikes; Roller-compacted concrete; Concrete blocks; Hydraulics; Full-scale tests; United States.
Author keywords: Combined wave and surge overtopping; Levee; Roller-compacted concrete; Articulated concrete block; High-performance turf reinforcement mat; Hydraulic equivalency; Full-scale tests.
Introduction
Post-Katrina investigations revealed that most earthen levee damageoccurred on the levee crest and land-side slope as a result of waveovertopping, storm surge overflow, or a combination of both (ASCEHurricane Katrina External Review Panel 2007). Analysis and fieldtests indicate that the erosion failure occurs first on the land-sideslope of the overtopped levee and progressively regresses (Hansonet al. 2003, 2005; Sills et al. 2008; van der Meer et al. 2009; Hughesand Nadal 2009). Protecting levees from erosion by surge overflow
and wave overtopping is absolutely necessary to ensure a viable andsafe levee system (Sills et al. 2008). Different types of strengtheningsystems were introduced to protect the crest and land-side slope ofthe levees against surge overflow and wave overtopping, such ascellular confinement systems, reinforced grass, concrete blocksystems, and soil cement/roller-compacted concrete (ASCE 1994;Perry 1998; Kelley and Thompson 2008; Akkerman et al. 2007).There is a need to determine the characteristics of these levee-strengthening systems to provide guidelines for levee design.
Wave overtopping discharge is a critical parameter in the con-ceptual and preliminary design of levees. The overtopping dischargedepends on wave and structure parameters, including the leveefreeboard, the crest geometry, the seaward slope, the significant waveheight, the mean or peak wave period, the angle of wave attackmeasured from the normal to the structure, the water depth at the toeof the seawall, and the seabed slope. Based on physical experimentsand numerical models, several empirical formulas have been givenby various researchers to predict surge-only overflow (Kindsvater1964; Henderson 1966; Chen and Anderson 1987) and wave-onlyovertopping (Owen 1980; Ward and Ahrens 1992; Hedges and Reis1998; van der Meer and Janssen 1994, 1995; van der Meer 2002;Pullen et al. 2007; Farhadzadeh et al. 2008; van derMeer et al. 2010)of levees under given wave conditions and water levels. In recentyears, attention has been given to combined wave and surgeovertopping (Pullen et al. 2007;Reeve et al. 2008;Hughes andNadal2009).
1Exchanged Ph.D. Student, Dept. of Civil and Environmental Engineer-ing, Jackson State Univ., Jackson, MS 39217; formerly, Ph.D. Student,Dept. of Hydraulic Engineering, School of Civil Engineering, Tongji Univ.,Shanghai 200092, China. E-mail: [email protected]
2Associate Professor, Dept. of Civil and Environmental Engineering,Jackson State Univ., Jackson, MS 39217. E-mail: [email protected]
3Professor and Chair, Dept. of Civil and Environmental Engineering,Jackson State Univ., Jackson, MS 39217 (corresponding author). E-mail:[email protected]
4Professor, Dept. of Hydraulic Engineering, School of Civil Engineering,Tongji Univ., Shanghai 200092, China. E-mail: [email protected]
Note. This manuscript was submitted on September 19, 2011; approvedon June 29, 2012; published online on July 28, 2012.Discussion period openuntil December 1, 2013; separate discussions must be submitted for in-dividual papers. This paper is part of the Journal of Waterway, Port,Coastal, and Ocean Engineering, Vol. 139, No. 4, July 1, 2013. ©ASCE,ISSN 0733-950X/2013/4-256–266/$25.00.
256 / JOURNAL OF WATERWAY, PORT, COASTAL, AND OCEAN ENGINEERING © ASCE / JULY/AUGUST 2013
J. Waterway, Port, Coastal, Ocean Eng. 2013.139:256-266.
Dow
nloa
ded
from
asc
elib
rary
.org
by
Hoh
ai U
nive
rsity
Lib
rary
on
07/0
7/13
. Cop
yrig
ht A
SCE
. For
per
sona
l use
onl
y; a
ll ri
ghts
res
erve
d.

However, the average overtopping discharge by itself cannotdescribe all the features of a wave overtopping case. The volumes ofindividual waves are developed from the average discharge. Hughesand Nadal (2009) and van der Meer and Janssen (1994) used theWeibull distribution to represent the distribution of water volume inindividual waves. The details of hydraulic parameters of flow onthe levee crest and land-side slope in wave-only overtopping andcombined wave and surge overtopping cases have been in-vestigated by Schüttrumpf and Oumeraci (2005) and Hughes andNadal (2009), respectively.
The hydraulic performance and erosion resistance of roller-compacted concrete (RCC) have been studied by many research-ers [United States Army Corps of Engineers (USACE) 1980a, b;McLean andHansen 1993; Hansen 2002; Hunt et al. 2005; Hunt andKadavy 2007;Woolbright et al. 2008]. A review of the performanceof RCC spillways and overtopping protection is given by Abdo andAdaska (2007). The articulated concrete block (ACB) system hasbeen recently tested in the overtopping flume at Colorado StateUniversity (Ayres Associates 2000). The moment stability analysismethod for determining safety factors of ACBs has been presentedby Cox (2010). Studies on the critical flow velocity/shear stress ofhigh-performance turf reinforcement mat (HPTRM)/turf re-inforcement mat (TRM) have been conducted by many researchers(Hewlett et al. 1987; Northcutt andMcFalls 1998; Nelson 2005). Themethods for growing and testing TRMs have been discussed witha performance test by Lancaster (1996) and Lipscomb et al. (2003).Dean et al. (2010) established an equivalency relationship betweensurge-only overflow and wave overtopping in terms of soil erosion.The equivalency between steady overflow and unsteady overtoppingcan leverage existing knowledge related to tolerable overtopping forvarious erosion-control alternatives under steady-state overflow forpossible use under the unsteady overtopping flow condition.
The objectives of this paper are to compare hydraulic perfor-mances of three levee-strengthening systems and to develop flowequivalency between surge-only overflow and combined wave andsurge overtopping. The performances of three types of levee-strengthening systems, including RCC, ACB, and HPTRM, wereinvestigated through full-scale experiments conducted in the LargeWave Flume (LWF) at Oregon State University. The three typesof levee-strengthening systems are illustrated in Fig. 1. In the
experiments, the three levee-strengthening systems were testedunder surge-only overflow and combined wave and surge over-topping conditions (Fig. 2). The hydraulic performances of the threelevee-strengthening systems were compared to provide an intuitivefeature of the flow on the crest and land-side slope of the leveeprotected by the three levee-strengthening systems. The comparedparameters include the overtopping discharge, flow thickness, flowvelocity, and the wave features on the land-side slope. Generalequivalency relationships applicable for RCC, ACB, and HPTRMare developed between surge-only overflow and combined waveand surge overtopping, which can be used to estimate the hydraulicparameters of combined wave and surge overtopping for leveesstrengthened with RCC, ACB, HPTRM, or other strengtheningsystems. With the general equivalency relationships, most of thehydraulic parameters of the flow on the levee crest and land-sideslope during combined wave and surge overtopping can be esti-mated with the corresponding hydraulic parameters during surge-only overflow, which is much less complicated.
Brief Description of Laboratory Experiments
The full-scale tests were conducted in the LWF of the O.H.Hinsdale Wave Research Laboratory at Oregon State University.The dimensions of the LWF and the levee embankment modelare shown in Fig. 3.
The levee model was built with a sand core and a concrete capwith a 0.76-m-deep (2.5-ft-deep) test section for the crest and land-side slope as shown in Fig. 3. For RCC tests, a layer of 0.3-m-thick(1-ft-thick) RCC was placed on top of 0.46 m (1.5 ft) of compactedlean clay on the crest and the land-side slope in the test section. Thecomponents of RCC included sand (1,050 kg/m3), 19 mm (3/4 in.)gravel (1,030 kg/m3), pozzolan (270 kg/m3), cement (60 kg/m3), andwater (50 kg/m3). For ACB tests, 70-T concrete blocks, inter-connected by flexible cables, were installed over the geogrid, gravel,and geotextile on 0.46 m (1.5 ft) of compacted lean clay in the testsection. For HPTRM tests, the HPTRM system was built into a steeltray, which was put into the test section before the tests. The grasswas a warm-season southern Bermuda grass. At the time the full-scale overtopping tests were conducted (November 2009), the veg-etation had a standing thickness of 0.3m (12 in.). The gap between thetray and the side wall of the test section was sealed with lumber. Tosecure the ACB system, an anchor of steel cable was installed at theinterface of the crest and seaward face. For the HPTRM, U-shapedstaples were used as anchors to keep the HPTRM mat on the com-pacted soil. The RCC system did not have any anchoring system.
The wave maker is a single-channel piston-type hydraulicallydriven system. The piston canmove at up to 4m/s and has a 4m totalstroke. The wave maker can generate regular waves, irregular waveswith standard spectral shapes, solitary waves, and user-defined
Fig. 1. Illustration of three studied levee-strengthening methods: (a)RCC in spillway application; (b) interlocking matrix of ACB connectedby cables; (c) three-dimensional structure of HPTRM; (d) vegetatedHPTRM system; the open space of HPTRM allows roots to growthrough and become entwined with the HPTRM to reinforce the plantroots
Fig. 2. Overtopping scenarios for earthen levees strengthened withRCC, ACB, or HPTRM on crest and land-side slope; freeboard Rc isdefined as vertical distance between the still water elevation and crestelevation
JOURNAL OF WATERWAY, PORT, COASTAL, AND OCEAN ENGINEERING © ASCE / JULY/AUGUST 2013 / 257
J. Waterway, Port, Coastal, Ocean Eng. 2013.139:256-266.
Dow
nloa
ded
from
asc
elib
rary
.org
by
Hoh
ai U
nive
rsity
Lib
rary
on
07/0
7/13
. Cop
yrig
ht A
SCE
. For
per
sona
l use
onl
y; a
ll ri
ghts
res
erve
d.

waves up to a maximum wave height of 1.7 m. Active absorption isused during the hydraulic tests.
An acoustic Doppler velocimeter (ADV)was used tomeasure thex-component (parallel to the levee crest or slope; Fig. 4) of the flowvelocity from P1 to P4. The ADV measures the flow velocity 5 cmfrom the probe, where the probe must be submerged. When the flowthickness is too small to submerge the probe of the downlookingADV, no meaningful velocity data can be collected by the down-looking ADV. To obtain velocity data when the flow thickness wassmall, a side-looking ADV was utilized. The probe of the side-looking ADV and the measuring point are at the same elevation.Therefore, as long as the probe could be placed, the velocity at thesame elevation could be measured. At each point, the side-lookingADV was fixed about 2 cm above the surface of the levee-strengthening system, measuring the flow velocity at the same
height. The downlooking ADV was fixed about 10 cm above thesurface of the levee-strengthening system, measuring the flow ve-locity about 5 cm above the surface. The data from the downlookingADV is relatively noisy, because the position of the probe is high (10cm above the levee surface), and during troughs, the influence ofbubbles and turbulence is significant. The data of the side-lookingADV is less noisy, because the position of the probe is close to thelevee surface where the flow is less turbulent. However, the datafrom the downlooking ADV is closer to the depth-averaged flowvelocity, because the measurement point is higher and is near themiddle point of the water depth. The measurement of the side-looking ADV can be used to identify and correct some obviouserrors in the measurements from the downlooking ADV. In thedischarge calculations, the data from both the side-looking ADVand the downlooking ADV were used.
Fig. 3. Profile view of the LWF and location of levee embankment
Fig. 4. Locations of ADVs, acoustic range finders, and wave gauges on the levee embankment model
258 / JOURNAL OF WATERWAY, PORT, COASTAL, AND OCEAN ENGINEERING © ASCE / JULY/AUGUST 2013
J. Waterway, Port, Coastal, Ocean Eng. 2013.139:256-266.
Dow
nloa
ded
from
asc
elib
rary
.org
by
Hoh
ai U
nive
rsity
Lib
rary
on
07/0
7/13
. Cop
yrig
ht A
SCE
. For
per
sona
l use
onl
y; a
ll ri
ghts
res
erve
d.

An acoustic range finder was used to measure the flow thicknessat P1, P3, P4, and P5. Five surface-piercing wave gauges wereplaced at the locations shown in Fig. 4. Gauges 2–4 were placed asa three-gauge array, and Gauge 1 was placed not far from the array,functioning as a backup. Sea surface elevation time series from thethree-gauge array were analyzed for incident and reflected waveenergy using the least-squares method of Mansard and Funke(1980). The results were expressed in terms of energy-based incidentsignificant wave height, Hm,0. The other key parameters taken fromfrequency-domain analysis were the peak wave period, Tp, asso-ciated with the spectral peak and the mean energy wave period,Tm21,0, determined from the resolved incident wave spectrum. Thedespiking of the flow velocity time series from all the ADVs wasconducted mainly by using Goring and Nikora’s (2002) method.Gauge 5 was placed at the end of the flume to monitor the down-stream water level. The acoustic range finder placed betweenGauges 3 and 4 was used to calibrate the wave gauges.
Based on the capability of the piston wave maker and the pumpsystem, surge-only overflow cases and combined wave and surgecases with different conditions were designed for different levee-strengthening systems. Table 1 shows the surge height, signifi-cant wave height, peak wave period, and average overtoppingdischarge for each case. The upstream heads in the table are mea-sured data. In the combined wave and surge cases, irregular wavetime series realization was generated conforming to the idealizedTexel, Marsen, and Arsloe (TMA) spectrum. The time series ofwater surface elevation data at five wave gauges and five acousticrange finders and the x-component (parallel to the levee crest orslope; Fig. 4) of the flow velocity at P1–P4were collected at a 50-Hzrate. Additional details about the three tested strengthening systemsand the flume tests can be found in Hulitt (2010).
Comparison of Hydraulic Performances betweenStrengthening Systems
Hydraulic parameters such as overtopping discharge, distribution ofovertopping discharge on the crest, average flow thickness on theland-side slope, average flow velocity on the land-side slope, andcharacteristic wave heights on the land-side slope are comparedamong the three levee-strengthening systems.
Overtopping Discharge
The average discharges of surge-only overflow and combined waveand surge overtopping are discussed separately. The time seriesof flow thickness and the time series of flow velocity at P1 in themiddle of the levee crest are used to estimate the time series ofboth surge-only overflow discharge (qs) and combined wave andsurge discharge (qws) for each trial. Averages are calculated forthe data points collected during each trial.
When the surge-only overflow reaches uniform steady-stateflow, Eq. (1) can be used to estimate the steady discharges ofsurge-only overflow tests for the three levee-strengthening systems
qs ¼ Cfffiffiffig
ph3
=21 (1)
Eq. (1) uses an empirical coefficient Cf to describe the re-lationship between the steady overflow discharge qs and the up-stream head h1 (Kindsvater 1964). The steady surge-only overflowdischarge (qs) versus the upstream head (h1) for the three levee-strengthening systems is shown in Fig. 5. The empirical coefficientCf ð50:5445Þ of RCC tests is the same as the recommended valueof Henderson (1966), whereas the Cf of ACB and HPTRM tests
are calculated to be 0.444 and 0.415, respectively. The Manningcoefficients (n) of the surfaces of RCC, ACB, and HPTRM arecalculated to be 0.018, 0.025, and 0.035, respectively. The calcu-lation of Manning coefficients was based on the Manning formulausing the measured flow velocity and flow thickness data duringsurge overflow cases. It is noted that the calculation of Cf and n forACB and HPTRM may not be precise because of the lack of suf-ficient data points. However, the values of Cf and n are stillmeaningful for comparison purposes. Fig. 5 shows that the steadysurge-only overflow discharge over the RCC-strengthened levee isclose to the existing estimation of Henderson (1966) based onlaboratory tests, whereas the discharge over the ACB-strengthenedlevee is smaller. The overflow discharge over the HPTRM-strengthened levee is the smallest among the three levee-strengthening systems.
Dimensionless average overtopping discharge [qws=ðgHm, 03Þ1=2]versus relative freeboard (Rc=Hm,0) for all the combined wave andsurge overtopping tests is shown in Fig. 6, together with empiricalequations that have been developed for overtopping discharge esti-mation in the combined wave and surge overtopping (Pullen et al.
Table 1. Hydrodynamic Parameters and Average Overtopping Dischargefor the Tests
Strengtheningsystem
Trialnumber
Rcð52h1Þ(m)
Hm,0
(m) Tp (s)qs (qws)(m3/s/m)
Surge-only overflow
RCC Trial 1 20.151 — — 0.078RCC Trial 2 20.242 — — 0.185RCC Trial 3 20.308 — — 0.258RCC Trial 4 20.310 — — 0.285RCC Trial 5 20.388 — — 0.391ACB Trial 1 20.305 — — 0.247HPTRM Trial 1 20.296 — — 0.251
Combined wave and surge overtopping
RCC Trial 1 20.075 0.659 7.047 0.659RCC Trial 2 20.078 0.475 3.378 0.475RCC Trial 3 20.025 0.491 4.929 0.491RCC Trial 4 20.017 0.568 3.432 0.568RCC Trial 5 20.289 0.406 3.378 0.406RCC Trial 6 20.343 0.381 4.819 0.381RCC Trial 7 20.328 0.408 7.087 0.408RCC Trial 8 20.321 0.496 4.682 0.496RCC Trial 9 20.287 0.496 7.087 0.496RCC Trial 10 20.289 0.580 5.120 0.580RCC Trial 11 20.236 0.659 7.047 0.659ACB Trial 1 20.219 0.583 4.338 0.583ACB Trial 2 20.182 0.646 6.473 0.646ACB Trial 3 20.255 0.783 4.728 0.783ACB Trial 4 20.279 0.747 4.728 0.747HPTRM Trial 1 20.117 0.527 6.775 0.527HPTRM Trial 2 20.317 0.553 7.008 0.553HPTRM Trial 3 20.307 0.649 6.826 0.649HPTRM Trial 4 20.096 0.642 6.794 0.642HPTRM Trial 5 20.271 0.841 6.916 0.841HPTRM Trial 6 20.280 0.858 6.553 0.858HPTRM Trial 7 20.285 0.868 6.863 0.868HPTRM Trial 8 20.282 0.881 6.863 0.881HPTRM Trial 9 20.277 0.908 7.047 0.907
Note: Here, Rc is freeboard; h1 is upstream head; Hm,0 is energy-basedsignificant wave height; Tp is peak spectral wave period; qs is average surge-only overflow discharge; and qws is average combined wave and surgeovertopping discharge.
JOURNAL OF WATERWAY, PORT, COASTAL, AND OCEAN ENGINEERING © ASCE / JULY/AUGUST 2013 / 259
J. Waterway, Port, Coastal, Ocean Eng. 2013.139:256-266.
Dow
nloa
ded
from
asc
elib
rary
.org
by
Hoh
ai U
nive
rsity
Lib
rary
on
07/0
7/13
. Cop
yrig
ht A
SCE
. For
per
sona
l use
onl
y; a
ll ri
ghts
res
erve
d.
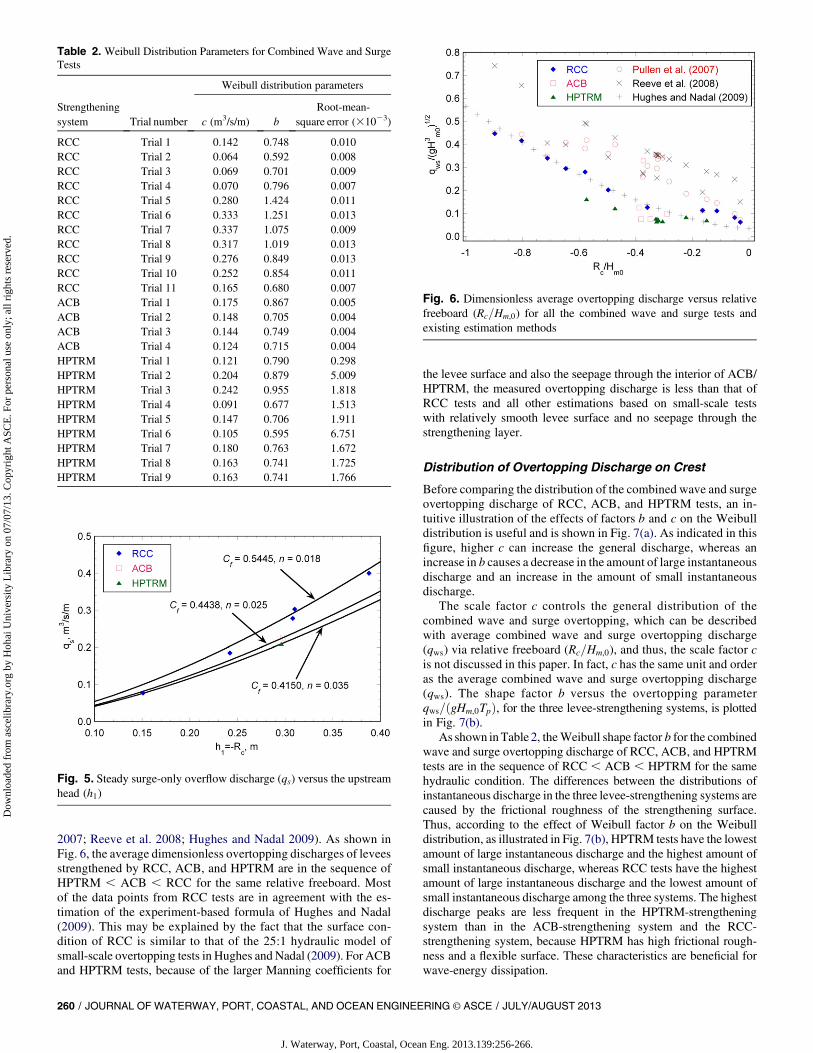
2007; Reeve et al. 2008; Hughes and Nadal 2009). As shown inFig. 6, the average dimensionless overtopping discharges of leveesstrengthened by RCC, ACB, and HPTRM are in the sequence ofHPTRM , ACB , RCC for the same relative freeboard. Mostof the data points from RCC tests are in agreement with the es-timation of the experiment-based formula of Hughes and Nadal(2009). This may be explained by the fact that the surface con-dition of RCC is similar to that of the 25:1 hydraulic model ofsmall-scale overtopping tests in Hughes and Nadal (2009). For ACBand HPTRM tests, because of the larger Manning coefficients for
the levee surface and also the seepage through the interior of ACB/HPTRM, the measured overtopping discharge is less than that ofRCC tests and all other estimations based on small-scale testswith relatively smooth levee surface and no seepage through thestrengthening layer.
Distribution of Overtopping Discharge on Crest
Before comparing the distribution of the combined wave and surgeovertopping discharge of RCC, ACB, and HPTRM tests, an in-tuitive illustration of the effects of factors b and c on the Weibulldistribution is useful and is shown in Fig. 7(a). As indicated in thisfigure, higher c can increase the general discharge, whereas anincrease in b causes a decrease in the amount of large instantaneousdischarge and an increase in the amount of small instantaneousdischarge.
The scale factor c controls the general distribution of thecombined wave and surge overtopping, which can be describedwith average combined wave and surge overtopping discharge(qws) via relative freeboard (Rc=Hm,0), and thus, the scale factor cis not discussed in this paper. In fact, c has the same unit and orderas the average combined wave and surge overtopping discharge(qws). The shape factor b versus the overtopping parameterqws=ðgHm,0TpÞ, for the three levee-strengthening systems, is plottedin Fig. 7(b).
As shown inTable 2, theWeibull shape factor b for the combinedwave and surge overtopping discharge of RCC, ACB, and HPTRMtests are in the sequence of RCC , ACB , HPTRM for the samehydraulic condition. The differences between the distributions ofinstantaneous discharge in the three levee-strengthening systems arecaused by the frictional roughness of the strengthening surface.Thus, according to the effect of Weibull factor b on the Weibulldistribution, as illustrated in Fig. 7(b), HPTRM tests have the lowestamount of large instantaneous discharge and the highest amount ofsmall instantaneous discharge, whereas RCC tests have the highestamount of large instantaneous discharge and the lowest amount ofsmall instantaneous discharge among the three systems. The highestdischarge peaks are less frequent in the HPTRM-strengtheningsystem than in the ACB-strengthening system and the RCC-strengthening system, because HPTRM has high frictional rough-ness and a flexible surface. These characteristics are beneficial forwave-energy dissipation.
Fig. 5. Steady surge-only overflow discharge (qs) versus the upstreamhead (h1)
Table 2. Weibull Distribution Parameters for Combined Wave and SurgeTests
Strengtheningsystem Trial number
Weibull distribution parameters
c (m3/s/m) bRoot-mean-
square error (31023)
RCC Trial 1 0.142 0.748 0.010RCC Trial 2 0.064 0.592 0.008RCC Trial 3 0.069 0.701 0.009RCC Trial 4 0.070 0.796 0.007RCC Trial 5 0.280 1.424 0.011RCC Trial 6 0.333 1.251 0.013RCC Trial 7 0.337 1.075 0.009RCC Trial 8 0.317 1.019 0.013RCC Trial 9 0.276 0.849 0.013RCC Trial 10 0.252 0.854 0.011RCC Trial 11 0.165 0.680 0.007ACB Trial 1 0.175 0.867 0.005ACB Trial 2 0.148 0.705 0.004ACB Trial 3 0.144 0.749 0.004ACB Trial 4 0.124 0.715 0.004HPTRM Trial 1 0.121 0.790 0.298HPTRM Trial 2 0.204 0.879 5.009HPTRM Trial 3 0.242 0.955 1.818HPTRM Trial 4 0.091 0.677 1.513HPTRM Trial 5 0.147 0.706 1.911HPTRM Trial 6 0.105 0.595 6.751HPTRM Trial 7 0.180 0.763 1.672HPTRM Trial 8 0.163 0.741 1.725HPTRM Trial 9 0.163 0.741 1.766
Fig. 6. Dimensionless average overtopping discharge versus relativefreeboard (Rc=Hm,0) for all the combined wave and surge tests andexisting estimation methods
260 / JOURNAL OF WATERWAY, PORT, COASTAL, AND OCEAN ENGINEERING © ASCE / JULY/AUGUST 2013
J. Waterway, Port, Coastal, Ocean Eng. 2013.139:256-266.
Dow
nloa
ded
from
asc
elib
rary
.org
by
Hoh
ai U
nive
rsity
Lib
rary
on
07/0
7/13
. Cop
yrig
ht A
SCE
. For
per
sona
l use
onl
y; a
ll ri
ghts
res
erve
d.
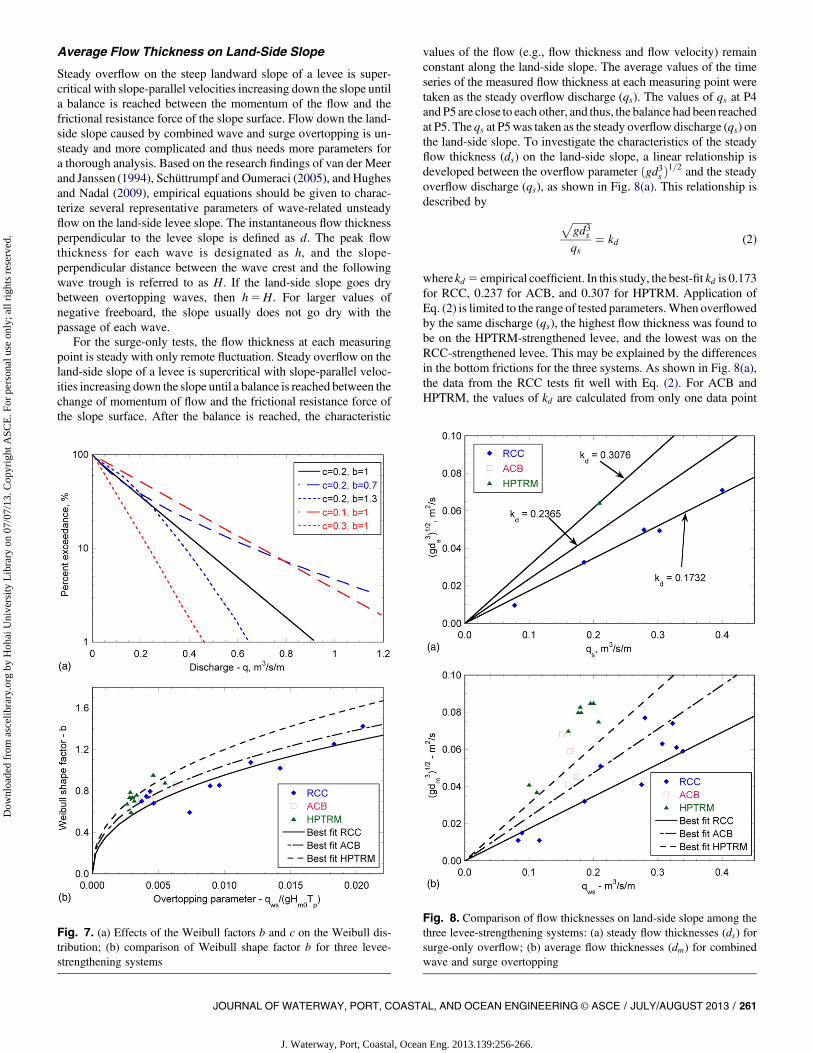
Average Flow Thickness on Land-Side Slope
Steady overflow on the steep landward slope of a levee is super-critical with slope-parallel velocities increasing down the slope untila balance is reached between the momentum of the flow and thefrictional resistance force of the slope surface. Flow down the land-side slope caused by combined wave and surge overtopping is un-steady and more complicated and thus needs more parameters fora thorough analysis. Based on the research findings of van der Meerand Janssen (1994), Schüttrumpf and Oumeraci (2005), and Hughesand Nadal (2009), empirical equations should be given to charac-terize several representative parameters of wave-related unsteadyflow on the land-side levee slope. The instantaneous flow thicknessperpendicular to the levee slope is defined as d. The peak flowthickness for each wave is designated as h, and the slope-perpendicular distance between the wave crest and the followingwave trough is referred to as H. If the land-side slope goes drybetween overtopping waves, then h5H. For larger values ofnegative freeboard, the slope usually does not go dry with thepassage of each wave.
For the surge-only tests, the flow thickness at each measuringpoint is steady with only remote fluctuation. Steady overflow on theland-side slope of a levee is supercritical with slope-parallel veloc-ities increasing down the slope until a balance is reached between thechange of momentum of flow and the frictional resistance force ofthe slope surface. After the balance is reached, the characteristic
values of the flow (e.g., flow thickness and flow velocity) remainconstant along the land-side slope. The average values of the timeseries of the measured flow thickness at each measuring point weretaken as the steady overflow discharge (qs). The values of qs at P4and P5 are close to each other, and thus, the balance had been reachedat P5. The qs at P5was taken as the steady overflow discharge (qs) onthe land-side slope. To investigate the characteristics of the steadyflow thickness (ds) on the land-side slope, a linear relationship isdeveloped between the overflow parameter ðgd3s Þ1=2 and the steadyoverflow discharge (qs), as shown in Fig. 8(a). This relationship isdescribed by ffiffiffiffiffiffiffi
gd3spqs
¼ kd (2)
wherekd 5 empirical coefficient. In this study, the best-fit kd is 0.173for RCC, 0.237 for ACB, and 0.307 for HPTRM. Application ofEq. (2) is limited to the range of tested parameters.When overflowedby the same discharge (qs), the highest flow thickness was found tobe on the HPTRM-strengthened levee, and the lowest was on theRCC-strengthened levee. This may be explained by the differencesin the bottom frictions for the three systems. As shown in Fig. 8(a),the data from the RCC tests fit well with Eq. (2). For ACB andHPTRM, the values of kd are calculated from only one data point
Fig. 7. (a) Effects of the Weibull factors b and c on the Weibull dis-tribution; (b) comparison of Weibull shape factor b for three levee-strengthening systems
Fig. 8. Comparison of flow thicknesses on land-side slope among thethree levee-strengthening systems: (a) steady flow thicknesses (ds) forsurge-only overflow; (b) average flow thicknesses (dm) for combinedwave and surge overtopping
JOURNAL OF WATERWAY, PORT, COASTAL, AND OCEAN ENGINEERING © ASCE / JULY/AUGUST 2013 / 261
J. Waterway, Port, Coastal, Ocean Eng. 2013.139:256-266.
Dow
nloa
ded
from
asc
elib
rary
.org
by
Hoh
ai U
nive
rsity
Lib
rary
on
07/0
7/13
. Cop
yrig
ht A
SCE
. For
per
sona
l use
onl
y; a
ll ri
ghts
res
erve
d.

and thus may not be precise and need further verification. However,the general trends for the steady flow thicknesses (ds) on the land-side slope for the three levee-strengthening systems are indicatedclearly in Fig. 8(a).
For the combined wave and surge overtopping tests, the averageflow thickness (dm) was calculated at P5 starting with data point1,000 and continued to the end of the time series. The overflowparameter ðgd3mÞ1=2 versus the combined wave and surge over-topping discharge (qws) for all the combined wave and surge tests isshown in Fig. 8(b) together with the corresponding curves of surge-only overflow fromEq. (2). Similar to the surge-only overflow cases,the average flow thicknesses of the levees strengthened by RCC,ACB, and HPTRM are in the sequence of RCC,ACB,HPTRMfor the same average combined wave and surge discharge. It canalso be seen that the average flow thickness of combined wave andsurge cases is slightly larger than that of the surge-only cases underthe same average discharge in the same strengthening system, whichwill be discussed in the Equivalency Analysis and EstimationBased on Equivalency section.
Average Flow Velocity on Land-Side Slope
For surge-only overflow, the steady flow velocity (vs) on the land-side slope can be calculated by
vs ¼ qs=ds (3)
Substituting Eqs. (1) and (2) into Eq. (3) yields
vs ¼ kvffiffiffiffiffiffiffigh1
p(4)
where
kv ¼ Cf
k2d
!1=3
(5)
The values of kv are 2.63 for RCC, 2.00 for ACB, and 1.64 forHPTRM. These values indicate that the RCC-strengthened levee hasthe highest flow velocity on the land-side slope, whereas theHPTRM-strengthened levee has the lowest in surge-only overflowcases at the same upstream head.
The averageflowvelocity (vws) was calculated at P5 starting withdata point 1,000 and continued to the end of the time series. For allthe combined wave and surge overtopping tests, the average flowvelocity (vws) versus the overtopping parameter [ð2gRcÞ1=2 5ðgh1Þ1=2], which controls the steady flow velocity of surge-onlyovertopping, as indicated in Eq. (4), is plotted in Fig. 9 together withthe corresponding curves of surge-only overflow. Similar to thesurge-only overflow cases, the average flow velocity of the leveesstrengthened by RCC, ACB, and HPTRM are in the sequence ofHPTRM , ACB , RCC for the same freeboard in the combinedwave and surge overtopping conditions. However, there is no ob-vious correlation between the average flow velocity (vws) of com-bined wave and surge overtopping and the steady flow velocity (vs)of surge-only overflow at the same freeboard.
Characteristic Wave Heights on Land-Side Slope
The measured time series of flow thickness at P4 are chosen foranalysis, because they have less noise than the time series at P5. Thetime series of flow thickness were analyzed by the zero-upcrossingtechnique to identify the maximum and minimum flow thicknessesfor all waves contained. The minimum thickness was usually zero
when the levee slope became temporarily dry during the wavetrough. The individual wave heights were obtained as the maximumdifference between the peak and the following trough. The in-dividual waves were then rank-ordered, and the average of thehighest 1/3, 1/10, and 1/100waveswas determined to beH1=3,H1=10,and H1=100. In addition, the root-mean-square wave heights (Hrms)were calculated for each measured time series.
To test whether waves on the land-side slope could be repre-sented by the familiar Rayleigh distribution, estimates of the largercharacteristic wave heights were made using the measured value ofHrms in the Rayleigh distribution formulas
H1=3 ¼ 1:416 ×Hrms H1=10 ¼ 1:80 ×Hrms
H1=100 ¼ 2:36 ×Hrms (6)
Comparisons between measured characteristic wave heights andthose predicted by the Rayleigh distribution are shown in Fig. 10.An excellent prediction is found for H1=3, and the prediction forH1=10 is still good with just slight scatter and a tendency to over-predict slightly. However, the Rayleigh distribution overpredicts themeasured values of H1=100 in HPTRM cases and underpredicts themeasured values of H1=100 in RCC and ACB cases, indicating thatthe HPTRM has the effect of lowering the largest wave height onthe land-side slope.
Equivalency Analysis and Estimation Basedon Equivalency
The hydraulic parameters such as overtopping discharge, averageflow thickness on the land-side slope, and average flow velocity onthe land-side slope are compared between surge-only overflow andcombined wave and surge overtopping. General equivalency rela-tionships between the surge-only overflow and combined wave andsurge overtopping are developed for the three studied systems orother strengthening systems. The strengthening systems are foundto have no effect on the general equivalency relationships.
Overtopping Discharge
As indicated in Fig. 11, there are nice trends of dimensionless dis-charge with increasing negative relative freeboard (2Rc=Hm,0) when
Fig. 9. Comparison of the average flow velocity (vws) on land-sideslope for combined wave and surge overtopping among the three levee-strengthening systems
262 / JOURNAL OF WATERWAY, PORT, COASTAL, AND OCEAN ENGINEERING © ASCE / JULY/AUGUST 2013
J. Waterway, Port, Coastal, Ocean Eng. 2013.139:256-266.
Dow
nloa
ded
from
asc
elib
rary
.org
by
Hoh
ai U
nive
rsity
Lib
rary
on
07/0
7/13
. Cop
yrig
ht A
SCE
. For
per
sona
l use
onl
y; a
ll ri
ghts
res
erve
d.
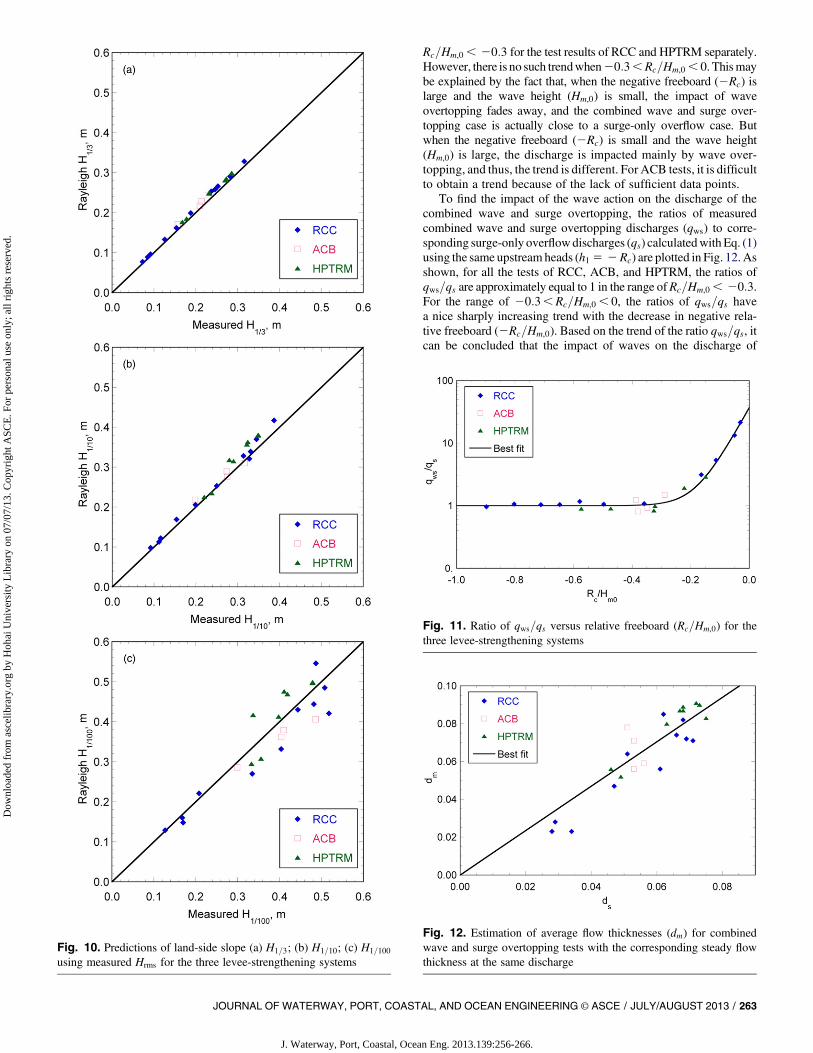
Rc=Hm,0 , 20:3 for the test results of RCC and HPTRM separately.However, there is no such trendwhen20:3,Rc=Hm,0 , 0. Thismaybe explained by the fact that, when the negative freeboard (2Rc) islarge and the wave height (Hm,0) is small, the impact of waveovertopping fades away, and the combined wave and surge over-topping case is actually close to a surge-only overflow case. Butwhen the negative freeboard (2Rc) is small and the wave height(Hm,0) is large, the discharge is impacted mainly by wave over-topping, and thus, the trend is different. For ACB tests, it is difficultto obtain a trend because of the lack of sufficient data points.
To find the impact of the wave action on the discharge of thecombined wave and surge overtopping, the ratios of measuredcombined wave and surge overtopping discharges (qws) to corre-sponding surge-only overflowdischarges (qs) calculatedwithEq. (1)using the same upstream heads (h1 5 2Rc) are plotted in Fig. 12. Asshown, for all the tests of RCC, ACB, and HPTRM, the ratios ofqws=qs are approximately equal to 1 in the range ofRc=Hm,0 , 20:3.For the range of 20:3,Rc=Hm,0 , 0, the ratios of qws=qs havea nice sharply increasing trend with the decrease in negative rela-tive freeboard (2Rc=Hm,0). Based on the trend of the ratio qws=qs, itcan be concluded that the impact of waves on the discharge of
Fig. 10. Predictions of land-side slope (a) H1=3; (b) H1=10; (c) H1=100
using measured Hrms for the three levee-strengthening systems
Fig. 11. Ratio of qws=qs versus relative freeboard (Rc=Hm,0) for thethree levee-strengthening systems
Fig. 12. Estimation of average flow thicknesses (dm) for combinedwave and surge overtopping tests with the corresponding steady flowthickness at the same discharge
JOURNAL OF WATERWAY, PORT, COASTAL, AND OCEAN ENGINEERING © ASCE / JULY/AUGUST 2013 / 263
J. Waterway, Port, Coastal, Ocean Eng. 2013.139:256-266.
Dow
nloa
ded
from
asc
elib
rary
.org
by
Hoh
ai U
nive
rsity
Lib
rary
on
07/0
7/13
. Cop
yrig
ht A
SCE
. For
per
sona
l use
onl
y; a
ll ri
ghts
res
erve
d.
combined wave and surge overtopping is negligible in the rangeof Rc=Hm,0 , 20:3. But in the range of 20:3,Rc=Hm,0 , 0,the discharge of combined wave and surge overtopping is mainlydominated by the wave overtopping. The best-fit curve for the ratiosof qws=qs in terms of the relative freeboard Rc=Hm,0 is given as
qws=qs ¼ 36:12 exp
�19:59 Rc
Hm,0
�þ 1 (7)
where qs is calculated by Eq. (1). It should be noted that, atRc=Hm,0 5 0, the ratios of qws=qs approach infinity rather than 37.12as given in Eq. (7). Therefore, the application of Eq. (7) is limited tothe range of tested parameters (Rc=Hm,0 , 20:03).
Average Flow Thickness on Land-Side Slope
Fig. 12 shows the measured average flow thicknesses (dm) forcombinedwave and surge overtopping tests versus calculated steadyflow thickness of the same discharge using Eq. (2). A general re-lationship between the average flow thicknesses (dm) of combinedwave and surge overtopping and the corresponding steady flowthickness (ds) of surge overtopping for the three systems was found(shown in Fig. 12). The straight line shown in Fig. 12 is the best-fitcurve given by the simple equation
dm ¼ 1:174ds (8)
which would be applicable to levees strengthened with RCC, ACB,or HPTRM. With the calculated ds by Eq. (8), dm can be easilyestimated using this relationship. Like any empirical equation,application of Eq. (8) is limited to the range of tested parameters.Because Eq. (8) fits well the data of all the tests including RCC,ACB, and HPTRM tests, it is suggested that Eq. (8) be extended tothe overtopping cases of levees strengthened with other strength-ening systems.
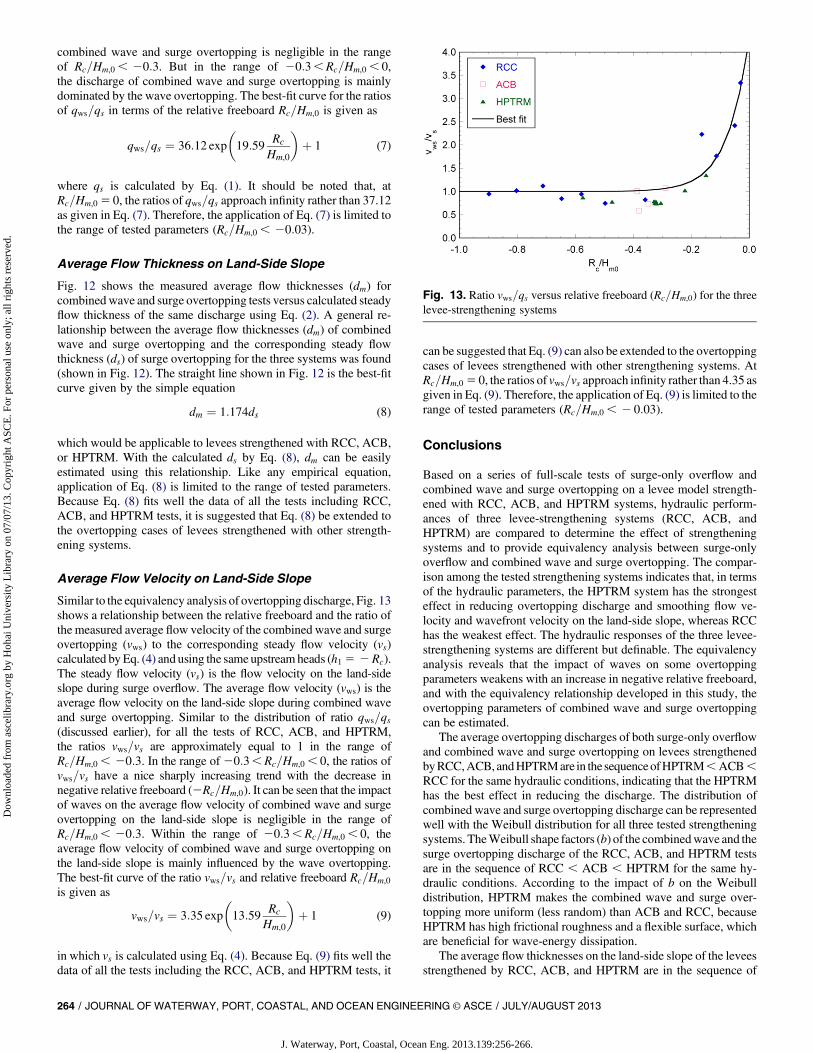
Average Flow Velocity on Land-Side Slope
Similar to the equivalency analysis of overtopping discharge, Fig. 13shows a relationship between the relative freeboard and the ratio ofthe measured average flow velocity of the combined wave and surgeovertopping (vws) to the corresponding steady flow velocity (vs)calculated byEq. (4) and using the same upstream heads (h1 5 2Rc).The steady flow velocity (vs) is the flow velocity on the land-sideslope during surge overflow. The average flow velocity (vws) is theaverage flow velocity on the land-side slope during combined waveand surge overtopping. Similar to the distribution of ratio qws=qs(discussed earlier), for all the tests of RCC, ACB, and HPTRM,the ratios vws=vs are approximately equal to 1 in the range ofRc=Hm,0 , 20:3. In the range of20:3,Rc=Hm,0 , 0, the ratios ofvws=vs have a nice sharply increasing trend with the decrease innegative relative freeboard (2Rc=Hm,0). It can be seen that the impactof waves on the average flow velocity of combined wave and surgeovertopping on the land-side slope is negligible in the range ofRc=Hm,0 , 20:3. Within the range of 20:3,Rc=Hm,0 , 0, theaverage flow velocity of combined wave and surge overtopping onthe land-side slope is mainly influenced by the wave overtopping.The best-fit curve of the ratio vws=vs and relative freeboard Rc=Hm,0
is given as
vws=vs ¼ 3:35 exp
�13:59 Rc
Hm,0
�þ 1 (9)
in which vs is calculated using Eq. (4). Because Eq. (9) fits well thedata of all the tests including the RCC, ACB, and HPTRM tests, it
can be suggested that Eq. (9) can also be extended to the overtoppingcases of levees strengthened with other strengthening systems. AtRc=Hm,0 5 0, the ratios of vws=vs approach infinity rather than 4.35 asgiven in Eq. (9). Therefore, the application of Eq. (9) is limited to therange of tested parameters (Rc=Hm,0 , 2 0:03).
Conclusions
Based on a series of full-scale tests of surge-only overflow andcombined wave and surge overtopping on a levee model strength-ened with RCC, ACB, and HPTRM systems, hydraulic perform-ances of three levee-strengthening systems (RCC, ACB, andHPTRM) are compared to determine the effect of strengtheningsystems and to provide equivalency analysis between surge-onlyoverflow and combined wave and surge overtopping. The compar-ison among the tested strengthening systems indicates that, in termsof the hydraulic parameters, the HPTRM system has the strongesteffect in reducing overtopping discharge and smoothing flow ve-locity and wavefront velocity on the land-side slope, whereas RCChas the weakest effect. The hydraulic responses of the three levee-strengthening systems are different but definable. The equivalencyanalysis reveals that the impact of waves on some overtoppingparameters weakens with an increase in negative relative freeboard,and with the equivalency relationship developed in this study, theovertopping parameters of combined wave and surge overtoppingcan be estimated.
The average overtopping discharges of both surge-only overflowand combined wave and surge overtopping on levees strengthenedbyRCC,ACB, andHPTRMare in the sequenceofHPTRM,ACB,RCC for the same hydraulic conditions, indicating that the HPTRMhas the best effect in reducing the discharge. The distribution ofcombined wave and surge overtopping discharge can be representedwell with the Weibull distribution for all three tested strengtheningsystems. TheWeibull shape factors (b) of the combinedwave and thesurge overtopping discharge of the RCC, ACB, and HPTRM testsare in the sequence of RCC , ACB , HPTRM for the same hy-draulic conditions. According to the impact of b on the Weibulldistribution, HPTRM makes the combined wave and surge over-topping more uniform (less random) than ACB and RCC, becauseHPTRM has high frictional roughness and a flexible surface, whichare beneficial for wave-energy dissipation.
The average flow thicknesses on the land-side slope of the leveesstrengthened by RCC, ACB, and HPTRM are in the sequence of
Fig. 13. Ratio vws=qs versus relative freeboard (Rc=Hm,0) for the threelevee-strengthening systems
264 / JOURNAL OF WATERWAY, PORT, COASTAL, AND OCEAN ENGINEERING © ASCE / JULY/AUGUST 2013
J. Waterway, Port, Coastal, Ocean Eng. 2013.139:256-266.
Dow
nloa
ded
from
asc
elib
rary
.org
by
Hoh
ai U
nive
rsity
Lib
rary
on
07/0
7/13
. Cop
yrig
ht A
SCE
. For
per
sona
l use
onl
y; a
ll ri
ghts
res
erve
d.

RCC , ACB , HPTRM for the same overtopping discharge inboth surge-only overflow cases and combined wave and surgeovertopping cases. The average flow velocities (vs for surge-onlyoverflow and vws for combined wave and surge overtopping) onthe land-side slope of levees strengthened by RCC, ACB, andHPTRM are in the sequence of HPTRM , ACB , RCC for thesame overtopping discharge in both surge-only overflow cases andcombined wave and surge overtopping cases. Both the average flowdepth and average flow velocity results indicate that the HPTRMcauses the flow to travel slowly on the land-side slope. The waveheight distribution on the land-side slope can be represented wellwith the Rayleigh distribution. The values of H1=3 and H1=10 can bepredicted very well with the Rayleigh distribution. The Rayleighdistribution overpredicts the measured values of H1=100 in HPTRMcases and underpredicts the measured values of H1=100 in RCC andACB cases, indicating that the HPTRM system has the effect oflowering the largest wave heights on the land-side slope.
The hydraulic parameters of the combined wave and surge casesare compared with those of the surge-only overflow cases to studythe equivalency relationship. In the range of Rc=Hm,0 , 2 0:3, theratio of measured combined wave and surge overtopping discharges(qws) to corresponding surge-only overflow discharges (qs) is closeto 1. In the range of20:3,Rc=Hm,0 , 0, the ratio increases sharplywith the decrease of negative relative freeboard, which can beexplained by the range of the impact of waves. The equivalency re-lationship of average overtopping discharge is given by Eq. (7). Onthe land-side slope, the average flow thickness of combined waveand surge overtopping (dm) is about 1.174 times that of the corre-sponding surge-only overflow (ds) with the same average over-topping discharge. On land-side slope, the distribution of the ratioof measured combined wave and surge overtopping flow velocity(vws) to the corresponding surge-only overflow flow velocity (vs) issimilar to the distribution of the ratio qws=qs: close to 1 in the range ofRc=Hm,0 , 20:3 while increasing sharply when Rc=Hm,0 approachesto 0. It is concluded that the range of the impact of waves on the aver-age flow velocity on the land-side slope is also 20:3,Rc=Hm,0 , 0.The equivalency relationship of average overtopping discharge isgiven by Eq. (9). The equivalency relationships developed in thispaper are proved to be applicable to all three tested strengtheningsystems (HPTRM, ACB, and RCC). It is suggested that theserelationships also be used for estimating the overtopping flowparameters on levees with other strengthening systems.
Acknowledgments
This research was funded by the Department of Homeland Security–sponsored Southeast Region Research Initiative (SERRI) at theDepartment of Energy’s Oak Ridge National Laboratory. Theopinions and conclusions described in this paper are solely thoseof the authors and do not necessarily reflect the opinions or policiesof the sponsors. The laboratory experiments were conducted at theO.H. Hinsdale Wave Research Laboratory at Oregon State Univer-sity. Thanks are also extended to Richard Goodrum, MichaelRobenson, Kevin Spittle, Jessie Clark, and Barrie King for theirsupport during the experiments. The authors are appreciative of thecomments and suggestions by five anonymous reviewers, whichcontributed to the quality of this final paper.
References
Abdo, F. Y., and Adaska, W. S. (2007). “Performance review of RCCspillways and overtopping protection.” Proc., 2008 Lawrence KansasDam Safety Conf., Portland Cement Association, Skokie, IL.
Akkerman, G. J., Bernardini, P., van der Meer, J., Verheij, H., and vanHoven, A. (2007). “Field tests on sea defenses subject to wave over-topping.” Proc., Costal Structures, World Scientific, Singapore, 1–13.
ASCE. (1994). Roller-compacted concrete, ASCE, New York.ASCE Hurricane Katrina External Review Panel. (2007). The New Orleans
hurricaneprotectionsystem:Whatwentwrongandwhy?,ASCE,Reston,VA.Ayres Associates. (2000). “Hydraulic stability of the Armorflex class 40-L
concrete block revetment system in steep-slope, high-velocity flow.”Aryes Project No. 34-0705.00, Fort Collins, CO.
Chen, Y. H., and Anderson, B. A. (1987). “Development of a methodologyfor estimating embankment damage due to flood overtopping.” Turner-Fairbank Highway Research Center Report No. FHWA/RD-86/126,Federal Highway Administration, Washington, DC.
Cox,A. L. (2010). “Moment stability analysismethod for determining safetyfactors for articulated concrete blocks.” Ph.D. thesis, Colorado StateUniv., Fort Collins, CO.
Dean, R. G., Rosati, J. D., Walton, T. L., and Edge, B. L. (2010). “Erosionalequivalences of levees: Steady and intermittent wave overtopping.”Ocean Eng., 37(1), 104–113.
Farhadzadeh, A., Kobayashi, N., and Melby, J. A. (2008). “Wave over-topping and overflow on inclined structures.” Proc., 31st CoastalEngineering Conf., World Scientific, Singapore, 2996–3008.
Goring, D. G., and Nikora, V. I. (2002). “Despiking acoustic Dopplervelocimeter data.” J. Hydraul. Eng., 128(1), 117–126.
Hansen, K. D. (2002). “Erosion and abrasion resistance of soil-cement androller-compacted concrete.” PCA Research and Development BulletinSerial No. 2436a, Portland Cement Association, Skokie, IL.
Hanson, G. J., Cook, K. R., Hahn, W., and Britton, S. L. (2003). “Observederosion processes during embankment overtopping tests.” Proc., 2003ASAE Annual Int. Meeting, American Society of Agricultural and Bi-ological Engineers, St. Joseph, MI.
Hanson, G. J., Cook, K. R., and Hunt, S. L. (2005). “Physical modeling ofovertopping erosion and breach formation of cohesive embankments.”Trans. ASAE, 48(5), 1783–1794.
Hedges, T. S., andReis,M. T. (1998). “Randomwave overtopping of simpleseawalls: A new regression model.” Proc. ICE Water Marit. Energy,130(1), 1–10.
Henderson, F. M. (1966). Open channel flow, MacMillian, New York.Hewlett, H. M., Boorman, L. A., and Bramley, M. E. (1987). “Guide to the
design of reinforced grass waterways.” CIRIA Rep. 116, ConstructionIndustry Research and Information Association, London.
Hughes, S. A., and Nadal, N. C. (2009). “Laboratory study of combinedwave overtopping and storm surge overflow of a levee.” Coast. Eng.,56(3), 244–259.
Hulitt, C. D. (2010). “Full-scale testing of three innovative leveestrengthening systems under overtopping condition.” M.S. thesis,Jackson State Univ., Jackson, MS.
Hunt, S. L., Hanson, G. J., Temple, D. M., and Kadavy, K. C. (2005).“Embankment overtopping and RCC stepped spillway research.” Proc.,2005 ASAE Annual Meeting.
Hunt, S. L., and Kadavy, K. C. (2007). “Physical model study of a RCCstepped spillway for Renwick Dam, North Dakota.” Proc., 2007 ASABEAnnual Int. Meeting, American Society of AmericanMilitary Engineers,St. Joseph, MI.
Kelley, D., and Thompson, R. (2008). “Comprehensive hurricane leveedesign: Development of the controlled overtopping levee design logic.”Proc., SAME Technology Transfer Conf. and Lower Mississippi Re-gional Conf., Society of American Military Engineers, Alexandria, VA,1–10.
Kindsvater, C. E. (1964). “Discharge characteristics of embankment-shapedweirs.” Water-Supply Paper 1617-A, U.S. Geological Survey, Wash-ington, DC.
Lancaster, T. (1996). “A three phase turf reinforcement system: A newmethod for developing geosynthetically reinforced vegetated linings forpermanent channel protection.” Proc., 27th Int. Erosion Control As-sociation Conf., International Erosion Control Association, Denver,345–354.
Lipscomb, C. M., Theisen, M., Thornton, C. I., and Abt, S. R. (2003).“Performance testing of vegetated systems and engineered vegetated
JOURNAL OF WATERWAY, PORT, COASTAL, AND OCEAN ENGINEERING © ASCE / JULY/AUGUST 2013 / 265
J. Waterway, Port, Coastal, Ocean Eng. 2013.139:256-266.
Dow
nloa
ded
from
asc
elib
rary
.org
by
Hoh
ai U
nive
rsity
Lib
rary
on
07/0
7/13
. Cop
yrig
ht A
SCE
. For
per
sona
l use
onl
y; a
ll ri
ghts
res
erve
d.

systems.” Proc., 34th Int. Erosion Control Association Conf., In-ternational Erosion Control Association, Denver.
Mansard, E. P. D., and Funke, E. R. (1980). “The measurement of incidentand reflected spectra using a least square method.”Coastal Engineering,ASCE, New York, 154–172.
McLean, F. G., and Hansen, K. D. (1993). “Roller compacted concrete forembankment overtopping protection.” Proc., Geotechnical Practicein Dam Rehabilitation, ASCE, Reston, VA, 188–209.
Nelson, R. J. (2005). “Research quantifies performance of TRM reinforcedvegetation.” Proc., Sessions of the Geo-Frontiers 2005 Congress,ASCE, Reston, VA.
Northcutt, P., and McFalls, J. (1998). “Performance testing of erosioncontrol products—What have we learned after five complete evaluationcycles.” Proc., 29th Int. Erosion Control Association Conf., Interna-tional Erosion Control Association, Denver, 199–218.
Owen, M. W. (1980). “Design of seawalls allowing for wave overtopping.”Technical Rep. EX-924, HR Wallingford, Wallingford, U.K.
Perry, E. P. (1998). “Innovative methods for levee rehabilitation.” TechnicalRep. REMR-GT-26, Waterways Experiment Station, U.S. Army Corpsof Engineers, Vicksburg, MS.
Pullen, T., Allsop,N.W.H., Bruce, T., Kortenhaus,A., Schüttrumpf, H., andvan der Meer, J. W. (2007). EurOtop: Wave overtopping of sea defensesand related structures: Assessment manual, Boyens Medien, Heide,Germany.
Reeve, D. E., Soliman, A., and Lin, P. Z. (2008). “Numerical study ofcombined overflow and wave overtopping over a smooth impermeableseawall.” Coast. Eng., 55(2), 155–166.
Schüttrumpf, H., and Oumeraci, H. (2005). “Layer thicknesses and ve-locities of wave overtopping flow at seadikes.” Coast. Eng., 52(6),473–495.
Sills, G. L., Vroman, N. D., Wahl, R. E., and Schwanz, N. T. (2008).“Overview of New Orleans levee failures: Lessons learned and theirimpact on national levee design and assessment.” J. Geotech. Geo-environ. Eng., 134(5), 556–565.
United States Army Corps of Engineers (USACE). (1980a). “Erosion testof roller-compacted concrete (RCC).” Design Memorandum, No. 3—Exhibit 15, Washington, DC.
United States Army Corps of Engineers (USACE). (1980b). “Summary oferosion study at Detroit Dam for Zintel Canyon Dam.” Design Mem-orandum, No. 3—Exhibit 16, Washington, DC.
van der Meer, J. W. (2002). “Wave run-up and wave overtopping at dikes.”Technical Rep., TechnicalAdvisoryCommittee onFloodDefense,Delft,Netherlands.
van derMeer, J.W., and Janssen, J. P. F.M. (1994). “Wave run-up andwaveovertopping at dikes and revetments.” Publication No. 485, Delft Hy-draulics, Delft, Netherlands.
van derMeer, J.W., and Janssen, J. P. F.M. (1995). “Wave run-up andwaveovertopping at dikes.” Wave forces on inclined and vertical wallstructures, N. Kobayashi and Z. Demirbilek, eds., ASCE, New York,1–27.
van der Meer, J. W., Pullen, T., Allsop, N. W. H., Bruce, T., Schlüttrumpf,H., and Kortenhaus, A. (2010). “Prediction of overtopping.”Chapter 14,Handbook of coastal and ocean engineering, Y. C. Kim, ed., WorldScientific, Singapore, 341–382.
van derMeer, J.W., Schrijver, R.,Hardeman, B., vanHoven,A.,Verheij, H.,and Steendam, G. J. (2009). “Guidance on erosion resistance of innerslopes of dikes from three years of testing with the Wave OvertoppingSimulator.” Proc., ICE, Coasts, Marine Structures and Breakwaters2009, van der Meer Consulting, Delft Univ. of Technology, SouthHolland, Netherlands.
Ward, D. L., andAhrens, J. P. (1992). “Overtopping rates for seawalls.”Rep.No. CERC-92-3, Waterways Experiment Station, U.S. Army Corps ofEngineers, Vicksburg, MS.
Woolbright, R. W., Hanson, G. J., and Hunt, S. L. (2008). “Model study ofRCC stepped spillways with sloped converging training walls.” Proc.,American Society of Agricultural and Biological Engineers Int.,American Society of Agricultural and Biological Engineers, St. Joseph,MI.
266 / JOURNAL OF WATERWAY, PORT, COASTAL, AND OCEAN ENGINEERING © ASCE / JULY/AUGUST 2013
J. Waterway, Port, Coastal, Ocean Eng. 2013.139:256-266.
Dow
nloa
ded
from
asc
elib
rary
.org
by
Hoh
ai U
nive
rsity
Lib
rary
on
07/0
7/13
. Cop
yrig
ht A
SCE
. For
per
sona
l use
onl
y; a
ll ri
ghts
res
erve
d.
Copyright © 2022 FDOKUMEN