Seventh Graders' Vocational Interest and Efficacy Expectation Patterns
Upload
khangminh22Category
view
0download
0
HAL Id: tel-01535554https://tel.archives-ouvertes.fr/tel-01535554
Submitted on 9 Jun 2017
HAL is a multi-disciplinary open accessarchive for the deposit and dissemination of sci-entific research documents, whether they are pub-lished or not. The documents may come fromteaching and research institutions in France orabroad, or from public or private research centers.
L’archive ouverte pluridisciplinaire HAL, estdestinée au dépôt et à la diffusion de documentsscientifiques de niveau recherche, publiés ou non,émanant des établissements d’enseignement et derecherche français ou étrangers, des laboratoirespublics ou privés.
Influence of the difference between expectation &perception on affective judgment : from consumers’
memory to product design : how to deal with variabilityamong individuals’ expectations?
Sabine Rizzo
To cite this version:Sabine Rizzo. Influence of the difference between expectation & perception on affective judgment :from consumers’ memory to product design : how to deal with variability among individuals’ expecta-tions?. Cognitive Sciences. Université de Lyon, 2016. English. �NNT : 2016LYSE1262�. �tel-01535554�

THESE de DOCTORAT DE L’UNIVERSITE DE LYONopérée au sein de
l’Université Claude Bernard Lyon 1
Ecole Doctorale N° 476(Ecole doctorale Neurosciences et Cognition)
Spécialité de doctorat :
Sciences Cognitives
Soutenue le 05/12/2016, par : Sabine RIZZO
Influence of the difference between expectation & perception
on affective judgment - From consumers’ memory to product design: how to deal with
variability among individuals’ expectations? -
Devant le jury composé de :
Pr Gervais, Rémy Président du juryDr Chollet, Sylvie, HDR RapporteurDr Schifferstein, N.J.Hendrik RapporteurDr Giboreau, Agnès , HDR Directrice de thèseDr Boesen-Mariani, Sabine Membre invité

Page 1
THESE DE DOCTORAT EN SCIENCES COGNITIVES
Ecole Doctorale N° 476 Neurosciences et Cognition
Influence of the difference between expectation & perception on affective judgment
- From consumers’ memory to product design: how to deal with variability among individuals’ expectations? -
Sabine RIZZO
Soutenue le 05 décembre 2016 devant le jury composé de :
Dr Chollet, Sylvie, HDR Rapporteur
Dr Schifferstein, N.J.Hendrik Rapporteur
Pr Gervais, Rémy Examinateur
Dr Giboreau, Agnès, HDR Directrice de thèse
Dr Boesen-Mariani, Sabine Membre invité

Page 2
UNIVERSITE CLAUDE BERNARD - LYON 1
Président de l’Université
Président du Conseil Académique
Vice-président du Conseil d’Administration
Vice-président du Conseil Formation et Vie Universitaire
Vice-président de la Commission Recherche
Directeur Général des Services
M. le Professeur Frédéric FLEURY
M. le Professeur Hamda BEN HADID
M. le Professeur Didier REVEL
M. le Professeur Philippe CHEVALIER
M. Fabrice VALLÉE
M. Alain HELLEU
COMPOSANTES SANTE
Faculté de Médecine Lyon Est – Claude Bernard
Faculté de Médecine et de Maïeutique Lyon Sud – Charles Mérieux
Faculté d’Odontologie
Institut des Sciences Pharmaceutiques et Biologiques
Institut des Sciences et Techniques de la Réadaptation
Département de formation et Centre de Recherche en Biologie Humaine
Directeur : M. le Professeur J. ETIENNE
Directeur : Mme la Professeure C. BURILLON
Directeur : M. le Professeur D. BOURGEOIS
Directeur : Mme la Professeure C. VINCIGUERRA
Directeur : M. le Professeur Y. MATILLON
Directeur : Mme la Professeure A-M. SCHOTT

Page 3
COMPOSANTES ET DEPARTEMENTS DE SCIENCES ET TECHNOLOGIE
Faculté des Sciences et Technologies
Département Biologie
Département Chimie Biochimie
Département GEP
Département Informatique
Département Mathématiques
Département Mécanique
Département Physique
UFR Sciences et Techniques des Activités Physiques et Sportives
Observatoire des Sciences de l’Univers de Lyon
Polytech Lyon
Ecole Supérieure de Chimie Physique Electronique
Institut Universitaire de Technologie de Lyon 1
Ecole Supérieure du Professorat et de l’Education
Institut de Science Financière et d'Assurances
Directeur : M. F. DE MARCHI
Directeur : M. le Professeur F. THEVENARD
Directeur : Mme C. FELIX
Directeur : M. Hassan HAMMOURI
Directeur : M. le Professeur S. AKKOUCHE
Directeur : M. le Professeur G. TOMANOV
Directeur : M. le Professeur H. BEN HADID
Directeur : M. le Professeur J-C PLENET
Directeur : M. Y.VANPOULLE
Directeur : M. B. GUIDERDONI
Directeur : M. le Professeur E.PERRIN
Directeur : M. G. PIGNAULT
Directeur : M. le Professeur C. VITON
Directeur : M. le Professeur A. MOUGNIOTTE
Directeur : M. N. LEBOISNE

Page 4
Summary One challenge when dealing with the launching of new products is to understand consumers’
expectations towards the product experience. Many innovations fail because they do not address the
right expectations, for the right consumers, and for the right product.
Theories in cognitive psychology allow us to improve current methodologies of consumer tests and to
design food products based on the knowledge of consumers. The objective of this research is to better
understand the influence of the discrepancy between consumers’ expectations and perceptions on the
affective judgment in the context of food consumption. Within the framework of Grounded and
Embodied cognition, we use theories developed on Perceptual Symbol System assuming a strong
relationship between concepts and sensory perceptions. Three studies were conducted on familiar and
non-familiar product ranges. Results allow us to conclude that consumers’ expectations are defined as
ad-hoc categories dependent on a situation of consumption, i.e. a motivation to consume the product
in a determined context of consumption. Properties of the category define cognitive expectations and
sensory expectations of the product. Thus, we provide evidence that concepts and sensory perceptions
are strongly related through retrieval of categories.
The results of this thesis also provide methodological improvements to elicit consumers’ expectations
through categorization tasks and to screen samples fitting the best with consumers’ expectations
through affective judgment.
Key words Categorization, Expectations, Food, Sensory Disconfirmation of Expectations, Affective
Judgment

Page 5
Résumé Le lancement d’un nouveau produit sur le marché est une étape à risque pour l’entreprise
qui peut se conclure par un échec. Une raison partielle de cet échec est que le produit ne
correspond pas aux attentes des consommateurs. L’enjeu consiste donc à mieux comprendre et
intégrer dans le design de produits les attentes des consommateurs.
Les théories contemporaines en psychologie cognitive nous permettent d'améliorer les
méthodologies actuelles de tests consommateurs et à concevoir les produits sur la base des
connaissances des consommateurs. L'objectif de cette recherche est de mieux comprendre
l'influence d’une adéquation entre les attentes des consommateurs et leurs perceptions sur leurs
jugements affectifs dans le contexte de consommation alimentaire. Dans le champ de la cognition
incarnée et située, nous avons utilisé la théorie du Perceptual Symbol System qui suppose une
forte relation entre les concepts et les propriétés sensorielles. Trois études ont été menées sur des
gammes de produits familiers et non familiers. Les résultats nous permettent de conclure que les
attentes des consommateurs sont des catégories ad-hoc dépendantes d'une situation de
consommation, c’est-à-dire une motivation à consommer le produit dans un contexte de
consommation donné. Les propriétés de la catégorie définissent les attentes de type concepts et
les propriétés sensorielles attendues du produit. Ainsi, nous avons mis en évidence que les
concepts et les propriétés sensorielles sont associées à travers les catégories réactivées en
mémoire.
Les résultats de cette thèse ont aussi permis de proposer des améliorations aux méthodologies de
tests consommateurs. Plus particulièrement, ces méthodologies permettent d’une part d’expliciter
les attentes des consommateurs à travers une tâche de catégorisation et d’autre part de
sélectionner les produits les plus adéquats aux attentes des consommateurs à travers l’évaluation
de leurs jugements affectifs.
Mots-clés Catégorisation, Attentes, Aliment, Disconfirmation sensorielle des attentes, Jugement Affectif

Page 6
Remerciements De nombreuses personnes ont participé à la réalisation de ce travail. La première raison
étant que durant mon parcours d’ingénieur je m’étais posé la question de savoir si je souhaitais faire une thèse par la suite. La réponse avait été aisée. Je ne le souhaitais pas. Si j’ai aujourd’hui terminé ce travail de plus de trois ans je le dois donc à la participation de mon entourage qui a su me donner goût à la recherche, me soutenir et me montrer l’intérêt de réaliser un doctorat. La seconde raison est que l’exercice est particulièrement difficile et requiert des compétences de rigueur scientifique, de remise en question, d’équilibre entre sa vie professionnelle et familiale. Ces compétences ne faisaient pas partie au début de cette thèse de mes principales qualités. Je suis donc encore plus redevable à ces personnes pour ce qu’elles m’ont apporté, leur soutien, et la foi qu’elles ont placée en moi.
Je tiens tout d’abord à remercier les membres du jury pour avoir accepté de remettre en question mes apports scientifiques, et l’éclairage qu’ils leur ont donné. Aux Docteur Chollet, Docteur Schifferstein et Professeur Gervais, je vous remercie d’avoir lu mes travaux, de m’avoir accordé du temps pour les questionner et m’écouter durant ma soutenance. Je remercierai aussi tout spécialement le docteur Schifferstein pour les discussions que nous avons pu avoir et qui m’ont permis de mûrir encore ma réflexion sur ma recherche.
Je tiens ensuite à remercier tout spécialement Agnès, ma directrice de thèse qui m’a permis de réaliser ma recherche au sein de l’Institut Paul Bocuse. A Agnès, je tiens à te faire part de toute ma reconnaissance pour ton soutien constant durant ces quatre années ensemble, depuis la préparation du dossier CIFRE jusqu’à la soutenance de cette thèse, et même encore aujourd’hui. Je pense que j’ai été extrêmement chanceuse de bénéficier de tes conseils. Tu m’as aidé à m’épanouir professionnellement, à être plus sûre de moi et à mieux comprendre ce que j’étais capable de réaliser. Tu es quelqu’un de très compréhensif, qui a toujours su prendre en compte et comprendre mes contraintes personnelles. Pour toutes ces raisons et bien d’autres pour lesquelles il me faudrait encore sûrement une page supplémentaire merci de tout cœur.
A Michel, expert en sciences du consommateur et sensorielles chez Danone, je tiens à exprimer toute ma gratitude. Tu es à l’origine de mon envie de faire une thèse. Merci d’avoir cru en moi quand je n’étais qu’une petite stagiaire au sein de SBS. Merci d’avoir pris de ton temps et énergie pour mettre au jour ce projet et pour le suivre durant toutes ces années. Tu as aussi continuellement challengé mes résultats et mes méthodes me permettant ainsi de m’améliorer. Merci donc de m’avoir permis de réaliser cette thèse. Si je suis docteur aujourd’hui je te le dois en grande partie.
A Sabine, sensory and consumer manager au sein de SBS chez Danone, qui a été mon manager durant ces trois années, je tiens à te remercier pour tout ce que tu m’as apporté. Ce fût quelque part une première pour nous deux en tant que doctorante et manager et je tiens à dire que tu as parfaitement remplie ton rôle. Tu m’as aidé à construire ce long projet, à le rendre d’intérêt pour Danone. Merci d’avoir été à l’écoute, d’avoir répondu à mes doutes et de m’avoir fait prendre du recul sur ce travail et son importance, ce qui est le plus dur quand on est en thèse. Pour tout cela, je te suis reconnaissante. Merci d’avoir été un manager présent. Tout simplement.

Page 7
A Cécile, group leader au sein de SBS chez Danone, tu as été une véritable « maman » pour moi. On pourrait entendre ce mot d’une manière péjorative, cependant il a une réelle importance pour moi et je le formule avec tout ce qu’il implique. Tu m’as véritablement aidée à me construire chez Danone, en me donnant toujours des retours très avisés sur ma place au sein de l’entreprise, ce que j’apportais, mes qualités et mes points à améliorer. Tu m’as aidé à mettre en valeur mon travail. Je tiens à te remercier pour tout ce que cette relation a impliqué pour moi. Toi seule sauras en comprendre toute l’importance.
Il serait difficile de continuer à remercier une par une toutes les personnes qui m’ont accompagné sans y consacrer des dizaines de pages, aussi vais-je devoir synthétiser.
Je souhaite remercier tout d’abord toute l’équipe de l’Institut Paul Bocuse et plus précisément le centre de recherche pour m’avoir accueilli durant ces longs mois de labeur. Dans ce cadre magnifique et grâce à l’équipe, le travail a tout de suite été plus agréable. Je tiens donc à remercier d’une part les grands, Laure, Jérémie, Chelo, Estelle, Anne-Cécile, Olga mais aussi les petits, merci à Camille, Gaétan, Anastasia, Jérémy, Sonia, Adriana pour la vie qu’ils mettent dans l’open space.
Merci tout spécialement aux anciennes de l’Institut, aujourd’hui docteurs, qui ont été une grande source d’inspiration, et de joie au quotidien ! Merci à celle qui est et restera toujours Yoda, celle qui est et restera toujours la compagne des grandes étapes, Laura, celle qui restera ma meilleure compagne de chambre étudiante, Céline, Carole et Julie. Merci de même à Rémy pour ton aide au quotidien quand à mes pauvres facultés en technologies diverses et variées. Merci enfin à Paul pour sa joyeuse compagnie !
Je souhaite remercier également toute l’équipe SBS chez Danone, qui m’a accueilli chaleureusement depuis ma sortie toute neuve de l’école et m’a soutenu durant toutes ces années. Je regrouperai dans cette section toute personne ayant eu un jour son bureau en D1 Nord. Merci donc tout spécialement aux membres du steering Sophie, Muriel, Marie-Agnès, Claire, Anne-Sophie, Jamie, et Nathalie. Merci de même aux membres très privatif du club des fumeurs, Sandrine, Cédric, Jérémie qui m’ont inlassablement écouté et conseillé durant ces temps de pauses nécessaires. Merci à mes précédentes managers, Nicole et Julie, pour votre gentillesse et vos conseils. Merci à mes compagnons de pâquerette, toujours disponibles et de bonne humeur, faisant ainsi de mon bureau un endroit privilégié pour travailler Denis, Louis, Pauline, Elodie, Carol-Anne. Merci à la personne qui a ensoleillé mes journées avec son sourire et sa patience à toute épreuve, Elodie. Merci également à Marthe pour ton extrême gentillesse et tous les instants passés à compter les voitures dans les bouchons. Merci à Alex, Laure, Florence, Priscila, Marion pour les sorties. Merci à Marie-Claude, Perrine, Isabelle, Emma, Marie, Laurence, Pierrick, Isabelle.B, Véronique pour m’avoir aidé depuis mon arrivée. Je tiens à remercier tout spécialement celle qui prend la relève avec brio et à qui je souhaite la plus belle des réussites, Julie.P.
Je tiens à remercier plus généralement toutes les personnes de l’aile D1 Nord que j’ai côtoyées au quotidien. Je citerai notamment Jean-Phi, merci pour ta bonne humeur/humour, ta gentillesse, ton soutien !
Je tiens à remercier aussi tout spécialement Docteur Bressoud, Professeur Versace et Professeur Dacremont pour leur aide et leur participation à mes comités de thèse.

Page 8
Je terminerai ces remerciements par ma famille, soutien à toute épreuve, vous avez été là sans relâche, vous m’avez encouragé, aidé. Merci tout spécialement à ma sœur, Ségolène, qui comprendra l’implication de ces mots: merci pour tout.
Je tiens finalement à dédier ce travail à ma fille, Sixtine, qui à 5 ans ne veut toujours pas faire une thèse. Un jour tu changeras peut-être d’avis. En attendant, ces derniers mots sont pour toi : le travail a été dur, j’ai fait beaucoup de sacrifices mais cela en valait la peine. Je n’ai jamais lâché grâce à toutes ces personnes et aujourd’hui j’y suis arrivée.

Page 9
Publications Peer-rewieved Journal
Rizzo S., Boesen-Mariani S., Rogeaux M., Giboreau A. What can consumers really do in a sorting task of strawberry fresh dairy products? Submitted to Food Quality and Preference.
Oral Communications
Rizzo S., Giboreau A. (2014). A study of free-sorting variability between and within subjects. In Summer school - Food &Hospitality research: From preparation to consumption, 3-4 juillet, Lyon, France.
Meiselman H.L., van Zyl H., Spinelli S., Cunha L.M., Giboreau A., Rizzo S., Lassallette C.P. (2014). Translation of emotion terms among (European) languages. In Eurosense- A Sense of life – 6th European conference, 7-10 september, Copenhagen, Denmark.
Proceedings
Rizzo S., Boesen-Mariani S., Rogeaux M., Giboreau A. (2014). Espace perceptif des yaourts à la fraise avec et sans information. In Journée du Sensolier, 14 octobre, Paris, France.
Rizzo S., Boesen-Mariani S., Rogeaux M., Giboreau A. (2015). From categorization to expectations: a study of individual variability. In Two days of cross disciplinary workshop Social Science, Cognitive Science, Economics, 21-22 September 2015, France.
Poster
Rizzo S., Boesen-Mariani S., Rogeaux M., Giboreau A. (2015). A study on perception and expectations variability among consumers. Poster presented In Journée de l’Ecole Doctorale Lyon 1, 29 April 2015, Lyon, France.
Rizzo S., Boesen-Mariani S., Rogeaux M., Giboreau A. (2015). Dealing with innovation: a new approach based on free sorting to evaluate expectations for an unfamiliar product. Poster presented In 11th Pangborn Sensory Science Symposium, 23-27 August 2015, Gothenburg, Sweden.

Page 10
Table of Contents Summary……………………………………………………………………………………………………………………..……4
Key words……………………………………………………………………………………………………………………..…..4
Résumé………………………………………………………………………………………………………………………..……5
Mots-clés……………………………………………………………………………………………………………………..……5
Remerciements……………………………………………………………………………………………………………..…..6
Publications……………………………………………………………………………………………………………………….9
Figures………………………………………………………………………………………………………………………..…..13
Chapter 1: Introduction……………………………………………………………………………………..………..15
Chapter 2: Bibliographical Review…………………………………………………………………..………..19
1. From perception to expectations, a categorization-based process……………………………….21
1.1. Perception……………………………………………………………………………………………………….21
1.2. Memory………………………………………………………………………………………………………....28
1.3. Expectations……………………………………………………………………………………………………34
2. From expectations to affective judgment…………………………………..…………………………….39
2.1. Cognitive dissonance and categorization……………………………………………………………40
2.2. Effect of sensory disconfirmation of expectations on hedonic judgment…………….….41
Chapter 3: Research question………………………………………………………………………..……………50
Chapter 4: From cognitive associations to sensory expectations through ad-hoc categories….……………………………………………………………………………………………………….……..55
Introduction………………………………………………………………..……………………………………………….56
1. Study 1A: Cognitive associations induce sensory expectations……………………………………57
1.1. Research question………………………………………………………………..………………………….57
1.2. Methodology………………………………………………………………..…………………………………57
1.3. Results………………………………………………………………..………………………………………….61
1.4. Main conclusions………………………………………………………………..…………………………..63
1.5. Methodological limits………………………………………………………………..…………………….63
1.6. New proposal of study based on insights……………………………………………………………65
2. Study 1B: Expectations are framed by ad-hoc categories depending on contexts and subjects………………………………………………………………..………………………………………………………66
2.1. Research question and hypothesis………………………………………………………………..…..66
2.2. Methodology………………………………………………………………..…………………………………67

Page 11
2.3. Results………………………………………………………………..…………………………………………..6
8
2.4. Main results ................................................................................................................. 70
2.5. Methodological limits .................................................................................................. 70
2.5.1. New proposal of study based on insights ................................................................. 72
3. Discussion ........................................................................................................................... 73
Chapter 5: From sensory perceptions to cognitive expectations; variability among subjects………………………………………………………………………………………………………………….….76
Introduction ............................................................................................................................... 77
1. Study 2A: influence of sensory perceptions on cognitive expectations .............................. 78
1.1. Research question ........................................................................................................ 78
1.2. Methodology ................................................................................................................ 78
1.3. Results.......................................................................................................................... 85
1.4. Main results ................................................................................................................. 97
1.5. Methodological limits .................................................................................................. 97
3.1. New proposal of study based on insights .................................................................... 99
2. Study 2B: diversity of cognitive expectations induced by sensory perception between subjects ..................................................................................................................................... 100
2.1. Research question ...................................................................................................... 100
2.2. Methodology .............................................................................................................. 101
2.3. Results........................................................................................................................ 103
2.4. Main conclusions ....................................................................................................... 108
2.5. Methodological limits ................................................................................................ 108
3. Discussion ......................................................................................................................... 110
Chapter 6: Influence of sensory disconfirmation of expectations on affective judgment………………….…………………………………………………………………………………….……….113
Introduction .............................................................................................................................. 114
1. Study 3A: understanding the link between ad-hoc categories and sensory disconfirmation of expectations ........................................................................................................................... 115
1.1. Research question ....................................................................................................... 115
1.2. Methodology ............................................................................................................... 115
1.3. Results......................................................................................................................... 117
1.4. Main conclusions ........................................................................................................ 119

Page 12
2. Study 3B: Influence of a sensory disconfirmation of expectations on affective judgments…………………………………………………………………………………………………………………...119
2.1. Research question ....................................................................................................... 119
2.2. Methodology .............................................................................................................. 120
2.3. Results........................................................................................................................ 126
2.4. Main conclusions ....................................................................................................... 137
2.5. Methodological limits ................................................................................................ 137
4. Discussion ......................................................................................................................... 140
Chapter 7: Conclusions……………………………………………….………………………..…………………….143
Chapter 8: General discussion...……………………...……………….….…………….………………………149
Going further with sorting task in a food product design ........................................................ 153
Inter-individual differences taken into account in methodologies .......................................... 155
Expectations: a dynamic process over time ..............................................................................157
Bibliography….……………………………….……………….……………….…………………………………………….....159
Appendices………………….……………….………………………………………..………………………………………..175

Page 13
Figures Figure 1: Scheme of modal symbol system from perceptual states (source: Barsalou, 1999) ................... 277 Figure 2: Theories of disconfirmation of expectations (source: Schifferstein et al, 1999) .......................... 422 Figure 3: Theoretical background of research ..................................................................................................... 52 Figure 4 : Experimental background of research ............................................................................................... 53 Figure 5 : Research scheme of Chapter 4 .............................................................................................................. 58 Figure 6: Photos of the range of strawberry fresh dairy products selected for the study ............................ 60 Figure 7 : Configuration of products without tasting obtained with the MDS and grouped with HAC ..... 64 Figure 8: Configuration obtained with MDS in “percept” condition ................................................................ 70 Figure 9 : Configuration obtained with MDS in concept condition.................................................................. 71 Figure 10: Research Scheme of Chapter 5 ............................................................................................................ 80 Figure 11: Cold tea drinks product presented for tasting ................................................................................... 82 Figure 12: Methodology for the comparative condition ..................................................................................... 83 Figure 13: Methodology for the monadic condition ............................................................................................ 84 Figure 14:Boards of cognitive expectations defined by the consumers through collages ............................. 85 Figure 15: Mappings representing products configuration and dendograms based on HAC ..................... 90 Figure 16: Repartition of the number of descriptors between the two conditions ......................................... 91 Figure 17: Verbatim elicited for the two conditions and grouped under 5 themes ........................................ 92 Figure 18: Percentages of elicitation for each thematic descriptor for standardized data .......................... 93 Figure 19: Frequency of elicitation for the two conditions for Little Miracles and Nestea........................... 95 Figure 20: The frequency of elicitation for the two conditions for Honest Tea and Volvic Mint Tea ......... 96 Figure 21: Research aims of studies 2A and 2B ................................................................................................. 101 Figure 22: Mapping obtained with MDS and projection of sensory descriptors for the four clusters ..... 105 Figure 23: Mapping obtained with MDS and projection of associated boards for clusters of subjects ... 109 Figure 24 : Research scheme of chapter 6 .......................................................................................................... 116 Figure 25: Procedure in two steps. Before consumption / After consumption ............................................. 115 Figure 26: 1/ Frequency of elicitation of verbatim before (concept) and after (tasting) consumption .... 121 Figure 27: Procedure of assessment (repeated for the 4 samples) ................................................................. 124 Figure 28: Boards of pictures illustrating the benefits fitting with the motivation and the context ......... 125 Figure 29: Boards of pictures illustrating two false negative benefits .......................................................... 126 Figure 30: Means of assessment of fitting with expectations for each product for each cluster ............... 129 Figure 31: Means of assessment of surprise for each product for each cluster ............................................ 129 Figure 32: Means of assessment of overall liking for each product for each cluster ................................... 131 Figure 33: Means of assessment of affective items for each product for cluster 1 ....................................... 132 Figure 34: Percentage of elicitations of the reasons why the product does not fit with expectations ...... 134 Figure 35: Means of assessment of fitting with benefits for each product for cluster 1 .............................. 135 Figure 36: Means of assessment of themes of characterization between clusters ....................................... 138 Figure 37 : Final theoretical model of the research ........................................................................................... 148 Figure 38: Overview of the research ................................................................................................................... 154 Figure 39: Configuration of products for group 1 of subjects (Kruskral’s stress = 0.045) ......................... 180 Figure 40: Configuration of products for group 2 of subjects (Kruskral’s stress = 0.045) ........................ 181

Page 14
Figure 41: Description of each EGD ..................................................................................................................... 182 Figure 42 : Ten products presented for the tasting session ............................................................................. 183 Figure 43 : Sensory perception of consumers for each product among three main sensory modalities . 185 Figure 44: Frequency of associations for each board of expectation and product ...................................... 191 Figure 45: Steps followed during the focus-group ............................................................................................ 196 Figure 46: Means of assessment of affective items for each product for cluster 2 ....................................... 211 Figure 47: Means of assessment of affective items for each product for cluster 3 ....................................... 213 Figure 48: Percentage of elicitations of the reasons why the product does not fit with expectations ...... 214 Figure 49: Percentage of elicitations of the reasons why the product does not fit with expectations ...... 215 Figure 50: Means of assessment of fitting with benefits for each product for cluster 2 ............................. 215 Figure 51: Means of assessment of fitting with benefits for each product for cluster 3 .............................. 216
Tables Table 1: Categorization of affective states _______________________________________________________ 46 Table 2 : The structure of verbatim in cognitive and sensoryassociations __________________________ 63 Table 3: Frequencies of elicitation of descriptors for the two conditions) ___________________________ 94 Table 4: Frequencies of elicitation of descriptors for the two conditions ____________________________ 96 Table 5: A summary of the descriptors most elicited and discriminating samples among the conditions 94 Table 6: Comparison of distribution between comparative and monadic conditions _________________ 98 Table 7: Significant associations with situation of consumption for each product in the two conditions 99 Table 8: Table of ARV coefficients ____________________________________________________________ 106 Table 9: tems significantly differentiating clusters of consumers (10%) ___________________________ 110 Table 10: Description of the assessment of the three items _______________________________________ 119 Table 11: Description of the assessment of the three sensory items ________________________________ 120 Table 12: Description of products _____________________________________________________________ 125 Table 13: Number of subjects per cluster obtained with HAC _____________________________________ 128 Table 14: Frequencies of check for each product and each context for cluster 1._____________________ 136 Table 15: Summary of the results for each cluster _______________________________________________ 137 Table 16: Table of ARV coefficients between configurations for each cluster and the whole set (global) 180 Table 17: Description of the nature of sensory disconfirmation of expectations _____________________ 198 Table 18: List of affective items induced by a sensory disconfirmation of expectations ______________ 201 Table 19 : Frequencies of check for each product and each context for cluster 2 _________________ 213216 Table 20: Frequencies of check for each product and each context for cluster 3. ____________________ 217

Page 15
Chapter 1: Introduction

Page 16
The main standard action used to pilot food design and take the decision to launch a
product on the market is consumers liking. However around 76% of FMCG (Fast Moving
Consumer Goods) innovations launched on the Western Europe market fail (Nielsen, 2014). This
data provides strong evidence that prediction tools based on liking assessment are no longer
sufficient. Indeed, these failures can partly be explained by the fact that the product does not meet
consumers’ expectations (Buck, 2007). In line with the current stream of research, companies
want to go beyond liking assessment and study how to improve consumer tests and measures in
order to get a better prediction of a successful product (Edwards et al., 2013; Gutjar et al., 2015;
Meiselman, 2013; Thomson, 2010; Thomson and Crocker, 2015).
To be successful, a product needs to be repeatedly purchased and integrated into consumers’
habits. This can be viewed as determined partly by consumers’ expectations. Indeed, the
confirmation or disconfirmation of his/her expectations toward the product induces either the
rejection of a product, or his/her potential repeated use of it (Anderson, 1973; Brunel and Gallen,
2012; Caporale and Monteleone, 2004; Deliza and MacFie, 1996). Therefore, the purchase of a
product is highly correlated to product experience and thus, dependent on many factors related to
the consumer, the product and the context of consumption (Jaeger, 2006; Meiselman, 2013; Rozin
and Tuorila, 1993).
One of the factors determining product experience is the consumer’s expectations. Before even
tasting the product, the consumer expects to experience several key product characteristics,
benefits, and feelings based on available information at the time of purchase (Olson and Jacob,
1972; Steenkamp, 1990). Our research is focused on better understanding the expectations as an
individual cognitive process impacting on food perception. This knowledge will then be integrated
into the food product design process of industries such as Danone.
Moreover, consumers’ expectations and perceptions are related to the whole product experience
and to the congruence between its components. In other words product characteristics, i.e. the
recipe, the brand and packaging combined, should ensure that the expectations and perceptions
of the consumers are met, leading to its repeated use and therefore to a successful launch of the
product (Thomson and Crocker, 2015).
Product renovation and innovation are mainly driven by the marketing or through technical
improvements proposed by research and development teams. In most cases, the consumer target
is already determined through sociodemographic criteria such as gender, age, and profession,
together with consumption habits. Prototypes, internally selected by the team, are then tested with

Page 17
consumers through laboratory trials with the objective of screening the proposed products based
on liking assessments. The prototype obtaining the highest score is then launched on the market.
As many research studies have shown (Boutrolle et al., 2007; Delarue and Boutrolle, 2010; Köster
et al., 2003), assessment of liking with a Central Location Test is not really predictive of the
consumers’ experience. Some improvements have already been proposed, namely:
to ensure more accurate predictability regarding the context of consumption,
methodologies such as Home-Use-Tests have been developed to assess the performance of
products at consumers’ homes in their “usual” situation of consumption (Boutrolle, 2007),
to assess the congruency between components of the full product experience, tests have
been realized in branded conditions and additional criteria, such as emotions or benefits,
complement the overall liking scores (Jaeger, 2006; Meiselman; Piqueras-Fiszman and
Jaeger; Thomson et al., 2010),
to take the variability of perception into account, inter-individual effects have been
integrated with predictive tools of Preference Mapping, basing the results on a
clusterisation of consumers on liking assessment (Rivière, 2007).
In the stream of improving consumer tests, we propose to better understand how expectations are
involved in consumer judgment and more specifically, to focus on one variable not so often taken
into account: the memory of consumers (Köster, 2009, 2006). Indeed, we consider memory as an
important factor inducing the definition of expectations, impacting perceptual process and
furthermore highlighting differences among individuals.
In the framework of the research, we therefore aim at better understanding memory as a cognitive
process influencing consumers’ expectations and perceptions and how this influences their
affective judgments. This understanding will be used to support an explanation of the potential
limits of current methodologies of consumers tests, and how to improve them with the final
objective of allowing food product design based on protocols integrating theories of cognitive
psychology.
In other words, our research aim is to study the influence of relations between expectations,
memory and perceptions on the affective judgments of consumers in a food context.
To reach this objective, our research is realized in connection between three domains:
Cognitive psychology allowing the use of theoretical models of memory and perception
processes. Knowledge on the structure of memory and interactions between perception

Page 18
and memory will be used to support the research and the design of studies. Knowledge
relating to alternative measures of feelings induced by the adequacy between expectations
and perception will be gathered to improve the standard hedonic protocols used in food
process design.
Marketing research allowing a deeper understanding of the effects of expectations on the
full product experience, especially in relation to the brand. Research conducted in this area
will not only provide much information on the affective states related to food consumption,
but also to the role of the memory in relation to expectations and food perception.
Food science allowing us to take into account the sensory properties of the product in the
methodologies of assessment of expectations and perceptions.
To sum-up, this research has a business issue: integrating consumers’ expectations as a key driver
in food product design. This issue will be solved based on research insights in cognitive psychology
and marketing and specific studies aimed at better understanding the role of memory in
expectation and perception processes. Finally, this work will be used to improve current
methodologies of consumer tests.

Page 19
Chapter 2: Bibliographical Review

Page 20
Our research objective focuses on the relation between expectation, memory, perception
and affective judgment. We aim at using theories in cognitive psychology to design consumer tests
integrating knowledge acquired during these cognitive processes. This bibliographical review is
based on a literature in cognitive psychology but also includes food sciences and marketing
research to define main concepts used in our studies.
Considering consumer expectations is necessary to ensure the success of a new product
launch on the market (Cardello, 2007). Indeed failings are partly due to a mismatch between what
consumers expect from the product before consuming it and once they have consumed it.
Therefore, designing a product based on what consumers really expect lowers the risk of product
failure on the market by diminishing the risk that the product will not be recognized by the
consumers (Tuorila et al., 1998) or not made it their own (Gallen and Pantin-Sohier, 2012; Gallen
and Sirieix, 2011).
It is difficult for food industries to foresee consumer expectations because they rely on the
relation between external information available on the product and internal information, i.e.
knowledge, built on previous experiences by the subject (Cardello, 1995). In other words,
consumers expectations are established during the integration of newly-presented cues about the
food regarding existing knowledge based on previous experiences (Piqueras-Fiszman and Spence,
2015). Some external information can be misleading for the consumers and result in a disparity
between expectation and perception. The phenomenon of mismatch relates to the fact that
consumers may have different perceptions, partly because of different knowledge acquired
through their experiences.
Moreover, variability among consumers has to be taken into account in product design as
well as in the evaluation of product expectation and experience. Indeed product experience takes
into account experiences referring to all human-product interactions (Hekkert and Schifferstein,
2008). It involves the characteristics of the user, those of the product and of the context framing
the interaction (physical, economic and social) (Desmet and Hekkert, 2007). Different factors are
involved in the variability of perception and choice of consumers: psychological, sociocultural,
physiological factors (Köster, 2009). Amongst these factors, psychological factors (especially
memory) are often omitted when studying consumers expectations and perceptions (Köster,
2003).
Therefore, we think that avoiding a mismatch between consumer expectation and
perception should be possible by ensuring that the right product has been proposed to meet to the

Page 21
consumers’ expectations. This is an essential condition to avoid a possible failure of a product on
the market.
Expectations have been studied a lot in food sciences by investigating the influence of external
information on consumer perception and judgment towards food (Caporale et al., 2006; Cardello,
2003; Cardello and Sawyer, 1992; Lenglet, 2014; Di Monaco et al., 2004; Siegrist and Cousin,
2009). These studies focused on the effect of mismatch between perception and expectations
mainly by comparing experimental factors such as brand, manufacturing process, origin of
products, or written information on sensory characteristics. They did not specifically assess the
role of consumer memory which is our purpose. Better understanding the relationship between
memory and expectation and how this link can affect perception and consumer judgment is our
main question in this research.
This bibliographical review aims at defining how the following main concepts relate to each other:
expectations, perception, memory and affective judgment. The first section is dedicated to
defining the cognitive processes underlying perception, memory and expectation. The second
section is dedicated to the analysis of existing knowledge on the relationship between expectation
and product experience, and to a better understanding of how perception and specifically the
congruence or mismatch between expectation and perception induce different affective judgments
for the consumers.
1. From perception to expectations, a categorization-based process
This chapter is dedicated to a review in cognitive psychology and is divided into three parts.
Firstly we define perception to better understand how a product is perceived by subjects. The
second part defines memory and leads to its description as a categorization-based process. The
third part is dedicated to the definition of expectation and its relationship with memory and
perception.
1.1. Perception
1.1.1. Perception: an interpretation of stimulus
Perception is defined as “the faculty by which an organism becomes aware of his
environment based on information collected by the senses” (Houdé et al., 2004). Subjects are

Page 22
confronted by many sources of information while they evolve in their environment. This
information helps them adapt their behavior.
Perception is activated through a stimulus that is apprehended by the subject, consciously
or not. This element of the environment arouses a response from the subject (Masmoudi, 2010).
Physico-chemical characteristics of the stimulus activate a stimulation pattern on the senses.
These characteristics include for example a pattern of light, a gradient of chemical molecules, or
the temperature. All sensory systems are involved in food perception: vision, audition, trigeminal,
touch, smell and taste (Depledt, 2009; Giboreau and Body, 2007). The physico-chemical
characteristics stimulate the senses through a conversion of physical or chemicals signals in
nervous influx translated by the cortex (Bertrand and Garnier, 2005).
Physical and chemical information collected by sensory receptors is various and perception is
multimodal, meaning that the pattern of activation of a given stimulus involves different sensory
systems (Auvray and Spence, 2008). One example is the McGurk effect: a subject is looking at a
video showing a man pronouncing the phoneme /ga/while the soundtrack is broadcasting the
phoneme /ba/. The subject will hear a third phoneme /da/(Mcgurk and Macdonald, 1976).
Regarding food perception, there are many examples which highlight this multimodality of
perception. Sensory integration does not only concern in-mouth perception. For example dining
in the dark with no visual cues, induces a decrease of taste and smell perception (Spence, 2012)
and the color of a food is a well-known factor influencing odor perception (Morrot et al., 2001), or
taste perception (Zampini et al., 2008). For instance: odors can elicit changes in perceived
sweetness (Stevenson et al., 1999); increasing the level of sucrose or citric acid decreases the
perceived viscosity of a solution (Christensen, 1980); increasing the level of sucrose in a chewing-
gum can increase the perception of mint-flavor (Davidson et al., 1999); olfactory compounds such
as butyl acetate induce a fruit odor and also activity in trigeminal nerve (Cain, 1974).
Sensory signals collected by the senses converge to a single meaning, giving congruent
information to identify the stimuli. This automatic process is the integration of all sources of
sensory information. It improves timeliness and efficiency of perception (Spence and Deroy,
2013).
At product level cross-modalities between senses are not only induced by the recipe itself,
but also by interactions with the packaging among other things. The surface texture (the roughness
or granulosity) of a container not only has an impact on the perceived texture (the crunchiness or
thickness) of the recipe by the subjects (Piqueras-Fiszman and Spence, 2012) but also has an

Page 23
impact on the taste (Becker et al., 2011). The color of the packaging has also been demonstrated
as an impact factor on taste perception (Piqueras-Fiszman and Spence, 2011). These crossmodal
correspondences are not only induced during recipe tasting but also through the experience
involving the environment, i.e. the context of consumption1.
Therefore the combination of sensory information through perception induces an
estimation of the properties of the object close to reality and also depends on the weight given to
each sensory variables by the subject (Driver and Spence, 2000).
Indeed, perception leads to a percept : “an accessible, subjective, reportable experience
that takes the form of an activation of a certain category in mind” (Brosch et al., 2010). This
percept is an individual representation of the perceived object at a given moment, not the general
concept but the combination of all available information at the considered instant of perception.
Physical characteristics are not translated and integrated in the same way by different subjects
and at different stages of perception.
To sum-up, perception is a cognitive process integrating multimodal sensory
sources leading to an individual percept. Therefore, we aim at integrating individual
differences of perception.
1.1.2. Grounded cognition: perception relates to previous experiences
Differences between subjects are not only noticeable at the physiological level but also through
associations between sensory modalities and knowledge. For example, a lemon drink is faster and
more easily identified if the color is yellow rather than green (Zampini et al., 2008). This
combination of sensory information induces the emergence of knowledge stored in the subject’s
memory depending on previous experiences (Versace et al., 2009). Two kinds of processes are
defined by the literature:
Bottom-up processes, driven by information from the environment, leading to a
code that is universal for all subjects. In other words, the output is the same
independently of the individual (Lemaire, 1999; Marr, 1982; Marr and Nishihara,
1978).
1 Contextual effects on perception are develop later through the categorization

Page 24
Top-down processes, driven by individual knowledge, giving an individual
interpretation, a meaning to perceptual information (Firestone and Scholl, 2015;
Lemaire, 1999; Versace et al., 2014).
Therefore individual mechanisms, such as attention or memory, are involved in perception
and influence the way an object is perceived through the integration of sensory information and
the interpretation of the physical characteristics.
In cognitive psychology, different theories of relation between memory and perception have
been defined in the literature. Research in food science has proved the importance of the context
on the product experience, i.e. the environment in which the product is consumed (Boutrolle et
al., 2005; Cardello, 1995; Meiselman, 2013; Piqueras-Fiszman and Jaeger, 2014; Rozin and
Tuorila, 1993a). Regarding theories in cognitive psychology, our approach will be based in the
background of Grounded Cognition. This theory stipulates that cognition relates to the previous
experiences of the subject and is situated (Barsalou, 2008). In other words, cognition is strongly
related to interactions between a subject and his environment (Wilson, 2002). Grounded
Cognition relates to Embodied Cognition which places the body at the center of the cognition
(Varela et al., 1992) and emphasizes the role of the situation in the relation with cognitive
processes (Pecher and Zwaan, 2005). It comes from the ecological theory of perception (Chemero,
2011) led by Gibson proposing that the environment plays a central role in a subject’s perception
(Gibson, 1979). In other words perception is action-oriented and guides behavior to adapt to the
environment. Understanding of sentences and texts need to be situated for example (Clark and
Marshall, 1981). Thus, Grounded Cognition postulates strong interactions between memory,
perception and action related to the situation
Three different principles underlie Grounded Cognition. The first one relates to the relation
between perception and memory. This theory moves away from the computational model
(Neisser, 1967). Perception is no longer seen as a sequential treatment where sensory information
is treated by perceptive mechanism (bottom-up process) and then influenced by a feedback of
long-term memory on the perceptive treatment of sensory information (top-down process)
(Versace et al., 2014). Embodied Cognition and Grounded Cognition argue that cognition is a
dynamical system defined as “a set of quantitative variables changing continually, concurrently,
and interdependently over time” (Chemero, 2011). In other words these processes are not fixed
entities but dynamic ones depending on the situation (Versace et al., 2009). In this way, prior
learning and action reduce the level of information integrated by the subject by selecting only the
pertinent one through the environment, brain or body (Glenberg et al., 2013; Wilson, 2002;

Page 25
Wilson and Golonka, 2013). Memory and perception and action are no longer considered as
separated systems (Barsalou, 2008).
The second one relates to the structure of cognitive processes. Standard theories of cognition
separate semantic memory from episodic memory (Tulving, 1985). It assumes that representation
built from bottom-up processes during subjects’ experiences are then transduced into amodal
conceptual knowledge in semantic memory (Barsalou et al., 2003). In Embodied and Grounded
Cognitions, long-term memory is a single system updated through the subjects’ experiences
(Versace et al., 2009). Knowledge is grounded, i.e. representations are integrated across the
sensory-motors modalities of the experience (Barsalou, 2008).
The third one relates to the knowledge retrieval during perceptive process. The theory stipulates
that subjects simulate possible interactions with the environment, therefore inducting a retrieval
of knowledge dependent of the situation (Barsalou et al., 2003). Due to the role of the interaction
with the body, re-enactment of knowledge during perception is based on sensory-motors
properties constrained by these possible interactions: the simulation recreates a partial experience
referring to the full experience that has been stored (Barsalou, 2008).
To sum-up, perception is a grounded (i.e. related to sensory –motor properties)
and situated (i.e. related to a context) cognitive process. Memory is integrated with
perception as a retrieval of knowledge related to previous experiences.
1.1.3. The Perceptual Symbol System
The theory of Embodied and Grounded Cognition gives a frame to the link between
memory and perception related to the interaction between the subjects and their environment, i.e.
the situation. This theory also redefines memory in its nature and the process of retrieval during
perceptive process. Thus, it has an impact on the definition of representation, knowledge and
concepts regarding perceptual storage.
Knowledge stored in memory is composed of units; i.e. concepts (Barsalou et al., 2003). In
classical theories of cognitive psychology, concepts are defined as mental states having semantic
properties and explaining behavior and cognitive processes of subjects. Concepts are also mental
representations (Machery, 2004).

Page 26
Perceptual Symbol System (PSS) is the main theory illustrating Grounded Cognition and
defining the nature of knowledge in this perspective. This theory has been defended by Barsalou
(Barsalou, 1999). Knowledge is retrieved from simulations of past experiences and grounded in
motor-sensory properties as defined in the Grounded Cognition model. Barsalou defines the
notion of the perceptive symbol as: perceptual knowledge arising during simulation of perceptive
states and constituting the representations retrieved during perception. In other words, these
perceptive symbols are concepts stored in the memory and related to perceptive (i.e. sensory-
motor) states.
Two principles underlie the definition of perceptive symbols: knowledge is modal and
analogical (Figure 1). The modal aspect is due to the fact that the simulation of each concept is
inducing the retrieval of the pattern of sensory-motor modalities encoded during past experiences
of this concept. The analogical aspect is defined by the activation of the same neuronal pattern and
the same regions of the brain as the one activated during related past experiences (Barsalou et al.,
2003; Wu and Barsalou, 2009). Thus the representation of one object is a combination of different
perceptive symbols. Concepts are then characterized by perceptual properties (Goldstone and
Barsalou, 1998); not only semantic ones.
For example many patterns of the sensory-motor information of a chair are stored in the
memory related to different past experiences. Each pattern relates a situation, a concept and
sensory-motor properties. Thus conceptualizing, for example, sitting in a living room chair feeling
relaxed, induces the simulation of settings, i.e. the living room, the action, i.e. sitting, and the
benefit, i.e. feeling relaxed. These concepts are components of an overall representation of the
chair related to specific sensory-motor modalities simulated for this situation (Yeh and Barsalou,
2006). This theory can also be applied to less detailed concepts, namely representations that are
not related to a specific context by activating a pattern of less specific sensory information. In other
words information can be coded by neurons in a more qualitative way without details (for example
a vertical edge without precision on the length) leading to the activation of a generic image
(Barsalou, 1999).

Page 27
Figure 1: Scheme of modal symbol system from perceptual states (source: Barsalou, 1999)
In other words, Perceptual Symbol Systems as an illustration of memory process in Grounded
Cognition considers a strong relation between the situation, the involved sensory-motors
modalities and the concepts. It is worth noting that this is a dynamical system updated on
experiences of the subject leading to an update of associations between perceptual states and
concepts.
Conceptualization is thus the process of creating a mental representation related to a
defined pattern of sensory-motor information named percept and inducing an affective reaction
(Carey, 2011).
To sum-up, Perceptual Symbol System defines knowledge as a simulation of a
perceptual state, i.e. sensory-motor properties related to a concept in a given
situation.

Page 28
1.1.4. Reminder: perception is multisensorial, situated and involves top-down processes
We consider the Perceptual Symbol System as a reference model for perceptive processes. To
develop the use of the symbolic side of the perception, we need to better understand memory and,
more precisely, how concepts are organized in the subjects’ knowledge.
1.2. Memory
Knowledge is organized in categories (Lemaire, 1999). “Categorization is a fundamental
process whereby variables perceptual inputs are reduced progressively to a small number of
equivalence classes, called “categories” whose memory representations called “concept” mediate
thinking and adaptive action” (Schyns, 1997). A category is defined as a group of objects sharing
similar criteria (Reed, 1972). A stimulus is therefore always categorized and identified on specific
modalities: “That thing is round and nubbly and orange in color… therefore it must be an orange”
(Bruner, 1957). Different theories of categorization have been proposed based on different
properties sharing the same two fundamental principles.
1.2.1. Theories of concept and categorization
Various theories of concepts related to different rules of categorization have been detailed
in the literature. By assuming the background of Grounded Cognition, the definition of concept
differs from the classical theories and rules used to categorize. More precisely, the logic applied to
group objects under the same category is not the same.
Perception is an integrative multimodal process influenced by attention and memory
leading from a grounded stimulus in a given situation to an individual percept. Integrating top-
down processes induces an interpretation of the stimulus according to the context of
perception. Attention is involved in the perceptive process by first selecting the sensory
information taken into account. Memory is solicited throughout the perceptive process by
ensuring a retrieval of knowledge related to concepts associated to this information; this
retrieval being strongly dependent of the context.

Page 29
The aim of this paragraph is to describe the specificity of the definition of concept in the
framework of Grounded Cognition compared to classical theories in cognitive psychology. Thus
we will not make a detailed review of theories of concepts and categorizations2.
In the classical theory a concept of a category of objects is a definition. In other words the
concept of the category is defined as the set of properties that are sufficient and necessary
for membership within the category (Machery, 2004; Margolis, 1994; Murphy, 2004).
Therefore, objects are grouped under the same category because they are the only ones to
share the whole same set of attributes (Margolis, 1994). Categories are defined by a set of
properties which values are discrete (Bruner, 1957). A specific hierarchisation of these
categories allows making inferences between categories (Collins and Quillian, 1969). For
example, according to Collins and Quillian, “canary” relates to “birds” that relates to
“animal”. The main criticism of this theory is that not all the members are equivalent in a
defined category depending on the situation of the subject.
In the probabilistic theories three main examples of concepts are defined: prototype,
exemplars and the explanation-based approach. The prototype and exemplars theories of
concepts are based on the assessment of the typicality of the members of the category.
Typicality measures the level of representativeness of an object as a member of the
category. The more typical the member is, the more representative it is (Rosch, 1978; Rosch
and Mervis, 1975). This theory also infers that categories are less structured and more
labile. Indeed, the more typical a member is, the more properties it shares with other
members, but it can also own some specific attributes not shared by the other members.
Typicality of a member relies on the measure of “family resemblance”, namely the number
of properties shared with other members of the group. One principle of this theory relates
to probability of associations between properties. Some associations are much rarer and
therefore are used less to build categories.
Prototypical theory: concepts are defined as prototypes, i.e. a concept of a category of
objects is a prototype (Hampton, 1979; Rosch and Mervis, 1975). In other words, a
concept is a set of statistical knowledge of properties that must be owned by
membership within a category (Machery, 2004). Objects grouped under the same
category are not equivalent, meaning that one member illustrates all the properties of
the category best and is therefore used as a referent of this category (Posner et al.,
1967; Reed, 1972). The prototype is a central and abstract object of the category. It is
2 For detailed reviews, refer to (Lelièvre, 2010; Machery, 2004; Murphy, 2004)

Page 30
the most typical member of the category (Rosch and Mervis, 1975). The categorization
process is therefore based on the closer similarities between the object and the
prototype of the category. In this case the properties considered to assess the
proximity between the two members are selected. This also infers that at some point
the properties do not have the same weight in the definition of the category. Reed has
shown that the predominant strategy to categorize new exemplars is based on the
distance between the object and the prototypes of the closest categories (Reed, 1972).
Differences of categorization are dependent on the previous experiences of the
subjects. In other words, how they are able to extract the more relevant information
and use it as criteria of categorization to identify an exemplar as a member of a
category. As not all the members are equivalent or organized by their proximity to the
prototype of the category, therefore, properties are no longer discrete values.
Exemplar theory, developed by Medin and Schaffer, refutes the organization of
categories around a central, ideal member of the category (Medin and Schaffer, 1978).
Categories are shaped by different exemplars stored in memory. Exemplars are defined
as objects following the rules defining the category. The process of categorization is
thus not the same, which means that the similarity is assessed by comparing objects to
the whole set of the category members rather than to the prototype. All the exemplars
are associated with points on a multidimensional space. The process is a calculation of
the proximity of the object to other points on the space (Reed, 1972). The contextual
effect is also taken into account as properties relating to all the members are stored
with all their own criteria. Thus analogical process is also related to the criteria stored
in memory based on previous experiences. Medin and Shafer gave the following
examples : if the size is more relevant than the domesticity criteria to distinguish a cat
from a dog, learning only about size would not be efficient for later experiences; indeed
learning about domesticity as a property of the dog category can help to distinguish it
from a wolf (Medin and Schaffer, 1978).
Explanation-based theory, developed by Murphy and Medin, defines a concept as a
group of objects sharing explanations about properties owned by the members
(Machery, 2004; Murphy and Medin, 1985). Concept is not only a description of
properties but knowledge about the function of each property shared by the members
of the category, for example the coat of dogs to protect them from the cold. Based on
these three main probabilistic theories, some hybrid models of concept have been
developed. As the concept of schemes that is a hybrid theory between exemplars and

Page 31
prototype. In other words, this theory of schemes assumes that organization in
categories is made around a central member, but it can also regroup specific members
less typical of, but still related to, this category because of past experiences (Smith et
al., 1988) Another model considers the prototype as an ideal. The ideal is not the
member owning most of the properties of the category, but the one owning the
properties that a perfect member of the category should have (Machery, 2004).
In the theory of perceptual states, based in the framework of the Grounded Cognition and
Perceptual Symbol System, the definition of concept changes. Concepts are defined as
perceptual states (Barsalou, 1999; Barsalou et al., 2003; Prinz, 2002). Retrieving a concept
from memory induces a simulation of the properties encoded during previous experiences
related to this concept. Sensory modalities are related to the concept encoded during
subject’s experience (Goldstone and Barsalou, 1998). For example, thinking about a
property owned by an object induces visualizing the object. Concepts are defined as the
representation of a category that is dynamic among contexts (Prinz, 2002). These
categories are called “ad-hoc categories” (Barsalou, 1983).
To sum-up, in the framework of Grounded Cognition concepts are defined as
perceptual states, meaning representations of dynamic categories depending on the
context. This theory differs from classical theories as the members share necessarily
goal-derived properties and do not refer to statistical inferences but to previous
experiences.
1.2.2. “Ad-hoc” categories in food consumption
Based on Grounded Cognition, perception is a cognitive process helping the subject to
identify and simulate hypothesis in order to interact with objects in the most efficient way with
the environment. A concept cannot be dissociated from its context, meaning that categories stored
in the memory are retrieved depending on the situation and therefore on the motivation of the
subject. Within this framework, Barsalou has developed “Ad-hoc” categories (Barsalou, 1983).
Members of the category share the main following properties: they all fit within a goal defined by
the subjects. One example given by Barsalou is the category of “objects to take in case of fire” that
will group together “children”, “photos”, “jewels” and “papers”. These members shared few
structural properties but all met the same motivation which defined the category.

Page 32
In common with any action, food consumption is associated with a context and also the motivation
to drink or eat a product. Motivation is an individual state aroused by a need and leading to
activities of consumption to the achievement of a specific goal (Arnould et al., 2004; Hanna,
1980)3. In a given context, this goal is achieved through the definition of the desired consequences
of the food consumption, i.e. the benefits4 (Gutman, 1982). The consequences can be defined as
functional (“food to support my immunity”, “drink to quench my thirst”), or as emotional (“food
to feel happy”, “food to feel serene”) (Thomson, 2007). Affective dimensions are taken into account
in goal definition because they shape the context of consumption (Niedenthal et al., 1999).
Previous experiences are better stored in memory when associated with a high affective arousal
(Baumgartner et al., 1992). Thus ad-hoc categories can relate to a motivation defined by affective
reaction. Niedenthal et al give as an example the following situations which can be categorized
together as fear-based reactions: “the sound of an air attack”, “a snake on the road” and
“admonition from a manager”.
These categories are dependent on the individual as they rely on shared motivational aspects.
Consumer implication for example is a function of the motivation associated with food
consumption (Arnould et al., 2004). Implication is mainly defined in marketing research related
to the brand, but it can also relate to the category of the product (Gutman, 1982; Thomson, 2007).
Involvement of consumers for specific benefits related to the product can influence their
perception (Ares et al., 2010). Implication is also defined through the usage of the product. A study
realized by Medin and Lynch showed that depending on the implication of the subjects with the
objects, categorization is not the same (Medin et al., 1997). Different types of tree experts
(taxonomists, maintenance workers and landscape workers) were asked to sort trees. Results
showed that sorting was different among experts. Indeed landscape workers sort trees among
goal-derived criteria, i.e. functional criteria, whereas taxonomists and maintenance workers
differed in using different morphological features. Expertise referring also to sensory abilities or
professional knowledge induces variability among subjects (Ballester et al., 2008; Chollet and
Valentin, 2000; Faye et al., 2013; Lelièvre, 2010). Faye compared the categorization of wine
glasses made by different groups of subjects with several levels of experiences in wine. Results
showed differences of categorization and description between naïve subjects and connoisseurs
(Faye et al., 2013). Furthermore in a product experience framework, expertise also relates to the
knowledge acquired about the brand as loyalty, familiarity, objective and perceived, i.e subjective,
3 The purpose is not to make a classification of individual needs but define motivation and its translation in a food consumption context 4 Benefits are defined in the section Expectations

Page 33
knowledge (Cho, 2011; Korchia, 2001). In studies related to brand category, categorization of a
novel product is also different among subjects depending on their implication to the brand
(Kreuzbauer and Malter, 2005). Thus, we consider that these various factors relate to familiarity.
It is define more broadly by “how much a person thinks she/he knows about the product” or “how
much a person knows about the product” (Park and Lessig, 1981). Taking into account all the
components of the product experiences: recipe, packaging, brand and context of consumption, we
extend familiarity to a reference to usage, conceptual knowledge and implication inducing a
variability in the construct of ad-hoc categories.
Furthermore, these categories are also context-dependent. Context is defined with all the
parameters that are noticeable in the environment to define an event (time, location, social etc)
(Cardello, 1995). In cognitive psychology, situation is defined initially by spatial and temporal
parameters (Yeh and Barsalou, 2006). More precisely, a situation can be defined from an entire
physical setting to an adjacent stimulus. In other words, by context, we do not only mean physical
environment, but also the level of sensory information available on the product through the
different objects next to the target object. Some studies have shown the impact of: environmental
parameters (Barsalou, 1982; Boutrolle, 2007; Joubert, 2008); information on brand or on the
packaging (Becker et al., 2011; Di Monaco et al., 2004; Varela et al., 2010); and on the diversity of
sensory information (Bech-Larsen and Nielsen, 1999; Breivik and Supphellen, 2003).
Ad-hoc categories follow the fundamental principles of categorization shared by classical theories.
For example, some members of the category can be more typical than others. Two fundamental
principles underlie categorization: “to provide maximum information with the least cognitive
effort” and assert through the categories that “the perceived world come as structured
information rather than as arbitrary” (Rosch, 1978). The first principle is about cognitive
economy, meaning that categorizing allows extracting more information with the least cognitive
effort. Indeed, identifying the stimulus is always related to a specific purpose. In this case, the level
of categorization, or the number of attributes taken into account in the mechanism, will be the
chosen function of the goal of the subject to adapt his behavior. The second principle is about
combining the attributes in order to be as close as possible to the reality of perception. The
structure of the world is an empirical link based on our senses. This congruency of associations
between attributes is dependent on many factors such as species, culture, context, etc.
Categorizing a stimulus is activating the inductive aspects that define the category, namely
the sufficient criteria to define the category. These attributes allow associating the stimulus to the
given category. For example, the sufficient or inductive criteria for the category of “birds” are

Page 34
“wings”. Categorizing is also activating deductive attributes, namely attributes of the category that
will be associated to the stimulus. For example, a deductive criterion of the category “birds” is
“flying”.
To sum-up, concepts are representation of knowledge stored in memory and
structured into ad-hoc categories. The latter are defined by a sharing of goal-derived
properties. In food consumption these properties are called situation of
consumption, i.e. a motivation to consume the product in a given context of
consumption.
1.2.3. Reminder: memory is organized in ad-hoc categories
1.3. Expectations
This section on expectations is mainly based on food science literature. The objective is to
highlight the discrepancy between actual theories developed in cognitive psychology regarding
perception and memory, and the state of food science regarding expectations.
In common with all actions, food consumption is always related to a motive. If the subject
choses to eat or drink some food, then he expects the precise attributes of the food experience to
fulfill his expectations. For example, if someone wants to drink because he feels thirsty, then he
will search for a product that he imagines is refreshing, liquid, transparent and not sweet. The
consumers’ expectations (before consumption) influence the way the product is perceived and
Categorization is a process of identification structuring memory into groups of objects
sharing similar criteria. Different theories have been proposed to explain how a subject can
identify an object and categorize it. The common theme to all these theories is the sharing of
properties between members and an inference of the properties of the category to the object.
When focusing on food consumption, motivation and the context of consumption play a
significant role, thus, “ad-hoc” categories seem to be the most efficient way to study the role of
memory in the perceptive process. Categorization is made under a specific situation of
consumption, i.e. a motivation to consume the product in a given context of consumption.

Page 35
then the judgment of the product. Therefore understanding what expectations are, and how they
are processed, is key to understand food perception.
1.3.1. Definition of expectations
Defining expectations depends on the domain of research (psychology, sociology, food
science, and marketing) and the factor of assessment (judgment, choice, quality assessment,
behavior).
Olson and Dover proposed to define expectations as “pretrial beliefs about the product […]
the subjective probability of association between two concepts such as a product and an
attribute” (Olson and Dover, 1979). Defining expectations as a believe is related to Anderson’s
definition of expectations as hypothesis formulated by the consumers on the product (Anderson,
1973). Therefore, expectations are viewed as a set of hypothetic attributes than can be associated
to the product the subject is going to consume. These definitions have no link with the future or
possible action after hypothesizing about the product. Deliza and MacFie proposed a definition of
expectations that completed previous definitions: “the action of mentally looking for something
to take place; anticipation” (Deliza and Macfie, 1996). Expectations are therefore not only viewed
as wishes or hopes about the product, but as hypothesis influencing the way the subject is going to
assess or use the product.
In cognitive psychology, expectations are defined as the prior knowledge that is integrated
into the perception process (Bruner, 1957). This knowledge is inferenced from previous
experiences and external cues gathered by the subjects. Thus, subject built hypothesis before
consumption on the product. This knowledge is quite large in nature and relates among others
things, to concepts, sensations, and emotions.
This diversity is also seen in various studies focused on expectations : expected quality of
a product (Cardello, 1995; Siret and Issanchou, 2000), expected sensations (Piqueras-Fiszman
and Spence, 2015; Puumalainen et al., 2002), expected pleasure (Schifferstein et al., 1999; Siegrist
and Cousin, 2009) or expected performance (Schifferstein et al., 1999). Expectations relate to a
high number of attributes that emerge from the subject’s memory before food consumption.
To sum-up, expectations are defined as hypothesis built by the subject
inferenced from previous experiences and external cues in a define situation of
consumption, i.e. a motivation to achieve by consuming the product and the context
of consumption associated.

Page 36
1.3.2. Conceptual and perceptual expectations
In food science expectations relate to different characteristics that can help identify the
product.
Expectations based on the sensory characteristics of the products are named perceptual
expectations (Lange et al., 1998; Schifferstein et al., 1999). In other words they are sensory
characteristics that the consumers expects to perceive while consuming the product (Deliza et al.,
2003): intensity of lemon aroma, texture in mouth, sweet lasting, strawberry smell etc. These
characteristics are immediately assessed during consumption by the consumers (Grunert, 2002).
Expectations related to the benefits associated with the products are named conceptual
expectations (Lange et al., 1998). A benefit is defined as a desired consequence relating to the food
consumption (Gutman, 1982). It addresses functional aspect, meaning it illustrates a specific
function of the product (easy to digest, diet food) or it is associated with a social representation
(ecological, environmentally friendly, ethical) (Grunert et al., 2001) or correlated to affective
aspects (pleasure, fun) (Thomson, 2007). Hypothesis on these characteristics cannot be assessed
during or just after consumption. They are based on external information such as publicity, labels
on packaging, social context, etc… They are therefore closely related to the confidence of the
consumers in the communication of this external information (Grunert et al., 2000). These
expectations are also based on previous experiences especially for familiar products because
consumers have already identified the consequences of the consumption (Grunert, 2002).
Even if conceptual and perceptual expectations have two different definitions, they are correlated.
Indeed, as previously stated with PSS theory, every concept is linked to a specific pattern of sensory
characteristics (see § 1.1.3.). Therefore, each conceptual expectation relates to a specific pattern of
sensory expectations depending on individuals. These associations relate to associations in
memory and are thus variable among subjects.
Another component of expectations refers to hedonic assessment and is defined as the hedonic
experience the consumer expects to have while consuming this food (Schifferstein et al., 1999).
This is the belief that the subject has that the product will be appreciated to a certain degree (Deliza
et al., 2003).

Page 37
To sum-up, expectations can be sorted into two groups: conceptual expectations
based on concept retrieved from subjects’ memory, and sensory expectations based
on sensory characteristics perceived by subjects. Taking into account the theory of
Perceptual Symbol System, conceptual and sensory expectations should be related.
1.3.3. Expectations are partly based on external information influencing knowledge retrieval
Consumers’ expectations are induced by a motivation. Expectations related to an object
are defined through a process involving searching for information about the object. Firstly
information is assimilated from previous experiences with the object or a similar one. If not
enough information is gathered by the subject, then information provided by the environment of
the product is integrated (Rozin and Tuorila, 1993a). The expectations of consumers are therefore
formed from two different sources of information: memory, namely internal information (see
§1.2.), and environment, namely external information (Cardello, 1995).
Regarding external information, three sources of information involved in the construction of
expectations are identified (Steenkamp, 1989):
• Descriptive: this is the most analytical source of information. Sensory characteristics of the
product are induced from direct observation before consumption. For example, the specification
of specific aroma “minty”, “strawberry” will induce expectations regarding the flavor of the
product. “Strong mint” or “added sugars” influence the intensity of the taste.
• Inferential: available indirectly about the product. It is derived from the deductions that the
subject draws based on descriptive information on the product. For example, the brand is a form
of insurance of the quality expected by many consumers (DelVecchio, 2001). This information not
only comes from labels but also from the visual characteristics of the packaging. Becker et al.
(2011) have shown that the shape and color of the packaging has an effect on the expectations of
the consumer (Becker et al., 2011). Thus, indirectly these characteristics guide the expectations of
the consumer: angular packaging for example will have the effect of creating a high expectation of
intensity of taste. Finally, nutrition or quality labels as 'GMO-free' or 'Red Label' influence the
expectations of the consumer vis a vis the benefits and quality of the product. Siret and Issanchou
(2000) have shown that information provided about a traditional process raised high expectations
of quality (Siret and Issanchou, 2000). Sabbe et al. (2009) have studied the impact of a health

Page 38
claim on the attitude of consumers towards unfamiliar fruit juices. The results show that the
information about the health aspect of the product engages increased appreciation, nutritional
and health value assessment (Sabbe et al., 2009). Finally, Cardello (2003) has shown the influence
of information about the technology used to develop the product on the expectations of the
consumer, specifically those who feel concerned by this effect (Cardello, 2003). This information
is mostly related to previous experiences and also induces association between concepts.
Steenkamp gives the example of “this car has been made in Germany” that may lead to “this car is
reliable” depending on the experience of the subjects.
• Informational: based on communications on the product. The source can be the media such as
advertising on the radio, the television, but also the subject’s environment such as friends,
colleagues or family, the Government, the producer, and consumer organizations (Schifferstein et
al., 1999). In this case, a cue provides direct information about a property of the product, which is
accepted or not by the consumer. This type of information is very delicate because it is dependent
on the confidence the subject has in the information sourcing (Grunert et al., 2000). Specificity of
this type of information is also that it will be never ascertained during or just after consumption
of the product (Grunert et al., 2000). For example, many health effects primed by brands on the
packaging of a product can’t be immediately ascertained. The subject should therefore trust the
informant (Grunert et al, 2000). Siegrist et al. (2009) showed that a person’s experience of a wine
and the expectations on product consumption could be modified by the opinions of experts in
oenology (Siegrist and Cousin, 2009).
To sum-up, expectations are based on internal information, i.e. knowledge
stored in memory but also on external information. The latter is defined by three
sources relating to all the components of the product (recipe, packaging and brand).
Depending on the nature of this information, knowledge retrieved from memory is
not the same.

Page 39
1.3.4. Reminder: expectations relate to categories retrieved before consumption
To sum-up, perception, memory and expectation are interdependent processes.
In the framework of Grounded Cognition, memory is integrated at the first step of
perception through the categorization process. Perceptual Symbol System assumes
that concepts and sensory properties are strongly related based on previous
experiences of the subjects. Concepts are representation of ad-hoc categories
defined based on motivation and context of consumption. Based on these theories
of cognitive psychology, we aim at studying expectations as ad-hoc categories
retrieved during perception based on external information available for the subject
and his/her previous experiences. Relation between these cognitive processes is
thus variable among subjects.
2. From expectations to affective judgment
Before food consumption, subjects build an expectation toward a product. Once the product is
tasted, expectations can be confirmed through perception or not. The subject’s judgment depends
partly on the fit between expectations and perception. Affective reactions can be induced by the
experience of consumption. The question of interest to us is to study of discrepancy between
expectation and perception. The first part is dedicated to describing the cognitive processes
involved in a disconfirmation of expectations. Then, a second part aims at defining the nature of
affective reactions induced by a disconfirmation of expectations.
Expectations are pretrial hypothesis on the product sensory expectation or conceptual
expectations, i.e. expected benefits and contexts of consumption associated with the product.
Consumers’ expectations are formed from internal information (i.e. memory) and external
information (i.e. external cues provided by different sourcing from packaging to social
communication). A balance between internal information and external information induces
the categorization of the product depending on the motivation of the subject and the context
of consumption. In the framework of Grounded Cognition, we will consider that conceptual
and sensory expectations are strongly related and build on the category retrieved before
consumption.

Page 40
2.1. Cognitive dissonance and categorization
2.1.1. Definition of cognitive dissonance
Food consumption can be considered through two major stages: before consumption with
expectations and after consumption with perception. Final acceptability or satisfaction of the
product depends on the discrepancy between expectations and perception (Anderson, 1973;
Cardello and Sawyer, 1992; Cardello et al., 1985). This comparison gives rise to two possible
outcomes: either the expectations of the subject are confirmed, and in this case the reaction of the
subject will be referred to as "neutral”, or the expectations of the subject are not confirmed by the
consumption of the product inducing a disconfirmation of expectations (Anderson, 1973; Cardello,
1995; Deliza and Macfie, 1996; Olson and Dover, 1979). The latter is based on a theory by Festinger
called cognitive dissonance, i.e an inconsistency between two cognitions, hereby expectations and
perception, inducing a state of tension (Festinger, 1962; Harmon-Jones et al., 2009). In other
words, an arousal state of the dissonance corresponding to discrepancy between expectations and
perception induces psychological discomfort. This discrepancy is then reduce making it less
uncomfortable through different effects on perception (Gallen and Brunel, 2014).
In summary, a disconfirmation of expectations is a specific case of cognitive
dissonance aroused by a discrepancy between expectations and perceptions.
2.1.2. Relationship between cognitive dissonance and categorization
Categories associated to a product can evolve and create a cognitive dissonance if the main
sensory properties are not similar to the expected ones, inducing then a sensory disconfirmation
of expectations. Studies have shown that extensions of brand can create such discrepancy if the
main properties of the category defining the brand are not retrieved in the extended product (Estes
et al., 2012; Wänke et al., 1998a). Further investigations are needed to understand the link
between expectations, categories in the mind and sensory disconfirmation of expectations.
Sensory disconfirmation of expectations is a discrepancy between expected and perceived
sensory properties (Schifferstein et al., 1999). Studies have been conducted to understand the link
between categories and sensory disconfirmation, especially in the case of brand extension. Indeed,
in innovation cases it is important for the subject to be able to recognize and associate the new
product as a brand extension, therefore recognizing the signature of the brand within the product

Page 41
(Wänke et al., 1998a). However, these studies focused their research on new products and brand
extensions by modifying external information (Fenko et al., 2015; Tuorila et al., 1998), looking at
the visual information taken into account by subjects (Kreuzbauer and Malter, 2005), or the
benefits carried by the brand (Wänke et al., 1998a).
In summary, sensory disconfirmation of expectations is defined as a discrepancy
between expected and perceived sensory properties. This discrepancy is induced by
a difference of categorization of the product before and after its consumption.
2.1.3. Reminder: sensory disconfirmation of expectations is a cognitive dissonance
2.2. Effect of sensory disconfirmation of expectations on hedonic judgment
Main studies on disconfirmation of expectations have focused the research on induced hedonic
judgment, i.e. to understand differences of hedonic assessment before and after food
consumption, when inducing expectations based on contextual information (Cardello and Sawyer,
1992; Lenglet, 2014; Di Monaco et al., 2004).
2.2.1. Effects of disconfirmation of expectations on hedonic judgment
Sensory disconfirmation of expectations is a specific case of cognitive dissonance, here
induced by a discrepancy between expected and perceived sensory properties of the product.
Associations between concepts and sensory properties are based on the categories retrieved
from subjects’ memory. A sensory disconfirmation of expectations is thus a cognitive
dissonance induced by a discrepancy of categories retrieved before and after food exposure.

Page 42
Early theories were developed in the marketing area. Three effects on hedonic judgment are
described (Anderson, 1973; Hovland et al., 1957) (Figure 2): assimilation, contrast and
assimilation-contrast.
Figure 2: Theories of disconfirmation of expectations (source: Schifferstein et al, 1999)
Three hedonic judgments are measured : the product tasted in blind without any information (B),
information alone before consumption (packaging information, information on the process, on
nutritional values, brand…) (E), and the product tasted with the information (P) (Schifferstein et
al., 1999). The three effects are described below based on these measures:
The effect of assimilation: the consumer adjusts his/her perception to decrease the gap
between expectations and percept. To reduce psychological discomfort, subjects tend to
adapt their percept to their expectations (Anderson, 1973; Hovland et al., 1957;
Schifferstein et al., 1999). If the subject is expecting a high performance of the product,
and after consumption the performance proves to be poor, the subject will tend, in a case

Page 43
of assimilation, to find the performance less poor. Regarding hedonic measures, the effect
of assimilation is checked if the measure P is close to measure E, in other words if the
measure of actual product is close to the expectations (Caporale and Monteleone, 2004;
Caporale et al., 2006; Cardello, 2003; Siret and Issanchou, 2000; Tuorila et al., 1998). If
the sign of the ratio (P - B) / (E-B) is positive then the conclusion is an assimilation effect.
Main studies in food science have shown that the strategy most often used is the
assimilation one (Caporale and Monteleone, 2004; Caporale et al., 2006; Cardello and
Sawyer, 1992; Siret and Issanchou, 2000). Cardello and Sawyer assessed pre-exposure
and post-exposure assessment of liking and bitterness intensity of products based on a
written description. The same product formulated to be assessed on the average on a liking
and bitterness assessment was tasted by four groups of consumers. Each of the group read
the product descriptions and assessed the liking score and the bitterness of the product
before tasting: average liking and bitterness (group 1), disliked and very bitter (group 2),
liked very much and not bitter (group 3) or no information (group 4). The results
highlighted that for group 2, the assessment of bitterness was lower for the tasted product
than expected and the liking was higher. In other words, the assimilation effect was
induced (Cardello and Sawyer, 1992). This theory, however, is questionable. Indeed,
instead of thinking that the subject learns from his mistakes, it increases the probability
of them repeating it by making efforts to reduce this disparity by streamlining choice
(Anderson, 1973). In fact, assimilation is not always complete (that is, the perceived
performance is equal to the performance expected after assimilation). Most of the cases
show a partial assimilation, that is, perceived performance tends to match the expected
performance but without achieving it completely. Subjects who have completely
assimilated the difference between their expectations and the performance of the product
will tend not to change their expectations (Langé, 2000).
The effect of contrast: the consumer exaggerates the gap between expectations and his
perception (Anderson, 1973). When the consumers do not find a congruency between the
product and the representations related to its category (Wänke et al., 1998b). The
consumer therefore anticipates the stimulation (Schifferstein et al., 1999). One way to
avoid a situation of contrast is to provide more information about the product through
communication (Anderson, 1973). Regarding hedonic measures, if the sign of the ratio (P
- B) / (E-B) is negative then the conclusion is a contrast effect. Deliza et al., 1996 showed
a contrast effect for a segment of subjects only (Deliza and MacFie, 1996). Similarly,

Page 44
Cardello and Sawyer (1992) showed in one of their experiments a contrast effect for one of
the groups of subjects.
The effect of assimilation-contrast: a disconfirmation of expectations can bring either a
rejection, i.e. a contrast effect, or acceptance, i.e. an assimilation effect (Hovland et al.,
1957; Sherif et al., 1958). This effect is fundamentally linked to an acceptance threshold.
Thus, if the mismatch between expectations and percept is sufficiently small and below
the threshold of acceptance then the subject will tend to reduce this disparity
(assimilation). Conversely, if the gap exceeds the threshold of acceptance, this effect
predicts a rejection (contrast) (Anderson, 1973).
Effects are symmetrical between the case where expectations are lower than the percept and the
case reversed. However, this symmetry is questioned by the "prospect theory" developed by
Kahneman and Tversky (Kahneman and Tversky, 1979). Indeed, when the perceived performance
of the product is higher than expected, this gap is associated with a gain in performance.
Conversely, if the expected performance exceeds the expectations then, in this case, a performance
gap is associated with a loss of performance (Kahneman and Tversky, 1979; Schifferstein et al.,
1999). The subjective value of a gain is smaller than a loss, there is an asymmetry of effects and
thus an effect of disconfirmations different depending on whether it is positive or negative.
Schifferstein et al. (1999) thus highlighted lower assimilation in the case of a negative
disconfirmation. However, this effect of asymmetry is very questionable since it is not observed
consistently in that order. It should be noted that this effect has been demonstrated on the
purchase intent in this study (Schifferstein et al., 1999). A study conducted by Caporale et al. (2004) highlights the opposite effect. By combining a variety
of information related to the manufacturing process with negative or positive connotations
(organic, GMOs, and traditional) with a well appreciated brand and different products (from a low
to high appreciation in blind), they have highlighted that for some combinations this symmetry
effect disappeared (Caporale and Monteleone, 2004). In fact, assimilation is most important in a
case of negative disconfirmation than a positive one. Specifically, and as pointed out by Deliza et
al. (1996), consumers are more likely to assimilate their expectations after a negative
disconfirmation of expectations (Deliza and MacFie, 1996).
These effects have been observed related to a discrepancy between expected and actual
performances, some other effects can be elicited related to expected and actual perceived
characteristics of the product.

Page 45
In summary, three effects of disconfirmation of expectations of hedonic judgment
are defined: assimilation, contrast and assimilation-contrast. Even if the
assimilation effect seems to be mostly demonstrated in food studies, the
assimilation-contrast should be a better option to understand effects of sensory
disconfirmation of expectations. Depending on a threshold of acceptance,
disconfirmation of expectations leads either to assimilation, i.e. a reduction of the
discrepancy, or a contrast effect, i.e. a rejection.
2.2.2. Limits of hedonic judgment and other affective states
Hedonic measure is widely used in the research focused on disconfirmation of expectations.
This is for most studies the baseline to understand how a subject has experienced food
consumption. Hedonic judgment as used in food science studies or marketing research is collected
through a conscious verbalization from « I like » to « I don’t like » (Caporale and Monteleone,
2004; Caporale et al., 2006; Cardello and Sawyer, 1992; Siret and Issanchou, 2000). Assessment
of hedonic measure is defined as “the satisfaction” induced by a stimulus, here the tasting of a
product. This component is breve and consciously expressed by the subject (Derbaix and Pham,
1991).
A cognitive dissonance induces affective states (Gallen and Brunel, 2014): satisfaction (Anderson,
1973; Bourgeon et al., 2007), frustration and anxiety (Festinger, 1962). Thus, defining sensory
disconfirmation of expectations as a case of cognitive dissonance means that hedonic judgment
provides only a part of the information regarding affective judgments of consumers. Some
research is already done around emotions, for example (Ferrarini et al., 2010; Labbe et al., 2015;
Schifferstein et al., 2013).
In food consumption, investigation of possible induced affective items have provided a list
including emotions, feelings, attitudes, moods, personality traits and appreciation (Derbaix and
Pham, 1991). Defining affective feelings is difficult for two main reasons: The first reason is to
differentiate the nature of affective states as feelings and emotions. The second is to differentiate
affective states induced by a sensory disconfirmation of expectations from affective states
influencing the food consumption.

Page 46
Differentiating the nature of affective states are difficult as there is no clear consensus on the
definition (Meiselman, 2015). However, several aspects are shared as dimensions differentiating
affective states (Derbaix and Pham, 1991) :
The degree of specificity of the stimulus
The intensity of the affective state perceived by the subject, depending on the arousal of
the affective reaction and its dominance on other reactions
The valency as negative or positive
The duration of the affective states
The content or nature of the affective reaction
The consciousness of the subject, i.e. the fact that the subject can identify consciously the
affective reaction and verbalize it.
Different affective states were characterized based on some of these dimensions (Table 1).
Table 1: Categorization of affective states
Affective
state Emotions Feelings Moods
Personality
traits Attitudes Appreciations
Degree of
specificity
of the
stimulus
Specific Specific Not specific Not specific Specific Specific
Intensity High Medium Weak to
Medium
Weak to
Medium Medium Medium
Duration Very short Medium Medium Long Medium Short
Regarding theories on cognitive dissonance, affective states induced by a sensory disconfirmation
of expectations are specific, short and highly intense.
In summary, the appreciation (or hedonic measure) is widely used in food sciences
but is not sufficient to characterize a sensory disconfirmation of expectations.
Extending the research to other affective states integrates emotions also.
2.2.3. Affective states induced by a Sensory Disconfirmation of Expectations

Page 47
Emotional assessment has been increasingly used in food science research and marketing
research as a component highlighting product experience congruency (Ferrarini et al., 2010;
Meiselman, 2015; Schifferstein et al., 2013; Thomson and Crocker, 2015). Thomson stresses the
importance of not only relying on a model of explanation based on hedonic measures, but on the
emotional measure to segment consumers (MacFie, 2007). Some researchers have showed that
emotional profiles induced by expectations need to be aligned with emotional profiles induced by
the recipe (Spinelli et al., 2014; Thomson et al., 2010). However, in many studies, benefits or
motivations to consume the product, moods or personality traits are assessed as emotions
consequently to a food consumption (King and Meiselman, 2010; Meiselman; Thomson et al.,
2010). Thus, the definition of emotions is not consensual among researchers. This debate is not
relevant to our research. We will speak here about affective states and base the analysis on the
same dimensions as for emotions.
Surprise An unexpected event creates a “surprise episode” (Ludden, 2008). The surprise is an important
component of emotional judgment resulting from a confirmation or disconfirmation of
expectations (Anderson, 1973). Some authors pointed out that surprise is a first step in affective
processes (Teigen and Keren, 2003), felt several times for the same product even if its intensity
decreases with time. Surprise draws the attention of the consumer (Ludden et al., 2012a). Surprise
is ambivalent, i.e. a subject can be surprised in a negative or positive way. The surprise intensifies
other perceived affective states and perceived pleasure (Mellers et al., 2013). However, surprise
alone is not sufficient to characterize a sensory disconfirmation of expectations. It is necessary to
link it to other components such as fun, confusion or appreciation. Indeed, any incongruity leads
necessarily to a surprise reaction. However, if this discontinuity is inappropriate, i.e. that the
subject cannot, or hardly, make the connections between this incongruity and other sensory
characteristics of the product, then the individual will be confused and will heavily depreciate the
product (Ludden et al., 2012b).
Therefore, there is a consensus on the importance of assessing surprise as a relevant item induced
by the discrepancy of two cognitions, hereby perceptions and expectations.
Affective states Affective states as emotions are brief, intense and applied to a specific reference, i.e. induced by
the product consumption (King and Meiselman, 2010). It is as well a being state as a feeling (to be
unhappy or feel unhappy). It is not defined by a physical state and can be controlled (to feel tired
is therefore not an emotion but a physical state (Derbaix and Pham, 1991). These affective states

Page 48
are organized in two dimensions: positive and negative (Desmet and Schifferstein, 2008; Laros
and Steenkamp, 2005).
Affective states are described on intensity, valency, nature and consciousness of subjects, but there
is a lack of knowledge regarding the exhaustive list that can be used in studies to understand the
effect of disconfirmation of expectations.
A sensory disconfirmation of expectations is induced by an incongruity with the category
activated in the mind of subjects before food consumption. Festinger has assumed that a part of
this cognitive dissonance can be for some people painful, inducing an emotional dimension
(Festinger, 1962). This affective part is namely the « dissonance » relating to emotional and
motivational states induced by the discrepancy (Harmon-Jones, 2000).
Some studies have therefore focused their attention on incongruity between senses which is
correlated with the sensory disconfirmation by the fact that some of the senses help build strong
expectations as visual and tactual senses (Ludden et al., 2007). Based on incongruities between
senses, some emotions have been assessed and correlated with different natures and levels of
incongruities (Ludden et al., 2012b). However, the list of affective items was not designed for a
food application but was determined from a qualitative study applied on objects of design.
In food product experiences, all axes of the product mix must be aligned to ensure a
confirmation of expectations (Ares and Deliza, 2010; Cardello, 1995; Thomson et al., 2010). As the
emotional profile felt by consumers evolved among the food experience (Schifferstein et al., 2013),
and as sensory properties of the product relate to a defined concept depending on the information
taken into account by the subject, therefore sensory disconfirmation of expectations can be of
different nature. This study will investigate affective feelings induced by different natures of
sensory disconfirmation of expectations.
In summary, surprise is directly induced by a sensory disconfirmation of
expectations. This is the first step of an affective chain of reactions. Consequent
affective states induced after surprise by the sensory disconfirmation of
expectations allows for better understanding of the incongruity felt by the subject.
However, there is no established list of affective states directly induced by a sensory
disconfirmation of expectations.

Page 49
2.2.4. Reminder: affective judgment is induced by a sensory disconfirmation of expectations without a consensus on its nature
In summary, expectations and perceptions can be different and induce a cognitive
dissonance, sensory disconfirmation of expectations, in a food context. This
discrepancy is due to a difference in categorization before and after consumption.
Several affective states can be aroused starting with a surprise event. Thus, we need
further investigation on the relationship between association of concepts and
sensory properties and sensory disconfirmation of expectations through the nature
of affective states induced.
Affective reactions are induced by a cognitive dissonance. Most studies focused their attention
on appreciation to understand strategies followed by the subjects to reduce the discrepancy.
Several affective states are involved in perception but most of them can’t fit to the research
because they are not induced directly by the discrepancy (mood, personality traits, and
feelings). Some affective states could fit but there is too much discussion around the nature of
these items (emotions). Thus, affective judgment induced by a disconfirmation of expectations
needs to be studied further and affective states, as we called them, need to be defined directly
from consumers’ perception and verbalization.

Page 50
Chapter 3: Research question

Page 51
On the one hand, contemporary theories of cognitive psychology state that cognition is
grounded and embodied highlighting that memory has an impact on perception depending on the
context and the subject. On the other hand, theories in food sciences have not yet focused on the
role of past experiences in the expectations of consumers toward his/her experience of the
product. Our research addresses links between expectations, categorization, perception and
affective judgment in a food consumption context.
Expectations have been studied regarding the effects of the contextual factors and product
information on perception through the assessment of product properties. Less information is
available regarding the relationship with ad-hoc categories retrieved from consumers’ memory
based on contextual information available on the product. Grounded and Embodied Cognition
postulate that memory is integrated to perception and that concepts relate to sensory perception.
In other words, there is much to learn about the relationship between expectations based on
concepts stored in memory and sensory perception. Using theories on ad-hoc categories induces
also taken into account variability between subjects regarding the motivation to consume a
product in a given context. Furthermore, effects of expectations on perception have been studied
through liking scores. However, based on theories regarding cognitive dissonance, it seems that
affective judgment induced by a disconfirmation of expectations cannot be reduced to a liking
score; other criteria could be induced such as affective states.
The objective of the research is to better understand the role of expectations using the
framework of Grounded and Embodied Cognition and ad-hoc categories and to study the
variability of expectations among subjects. In other word this research aims at providing better
understanding on the influence of the context and the motivation to consume the product on the
relationship between concepts, expectations, percepts, i.e sensory perception and affective
judgments (Figure 3). This research aims at using external information to induce various
categorization and thus various cognitive associations, sensory perceptions and affective
judgments.
Figure 3: Theoretical background of research
Contextualinformation
Concepts
Expectations Percepts Affective Judgments

Page 52
From the literature, the research is based on the following statements:
Expectations are partly framed from memory and depends on external
information available on the object. They are defined from the association of the
product to an ad-hoc category inferencing cognitive and sensory associations.
Cognitive associations are defined as the benefits associated to the product. Sensory
associations are defined as sensory perception of the product.
Concepts are defined as the representation of ad-hoc categories.
Perception is influenced by expectations, acting as hypothesis on the product.
These associations depends on external information available on the product.
Affective judgment is induced by cognitive dissonance, i.e here sensory
disconfirmation of expectations perceived by the subject.
The experimental framework of this research is to manipulate contextual information as
packaging information or sensory diversity and motivation to enhance different expectations,
different perceptions and then different affective judgments on the product (Figure 4). The
influence of contextual information is measured on one side on ad-hoc categorization of the
product and on the cognitive and sensory associations with the product. On the other side, these
effects are measured through sensory disconfirmation of expectations on affective judgments.
Figure 4 : Experimental background of research
ContextMotivation
Manipulated
Ad-hoc categories
Analyzed
Sensoryexpectations/perceptions
Cognitive expectations / associations
Measured Measured
Affective judgments

Page 53
In chapter 4, the research aims at studying the effect of external information, i.e
information on the packaging on the relation between expectations and perceptions through
categorization process. In other words, we aim at manipulating external information on the
packaging to induce different relationship between cognitive associations and sensory perceptions
through the measure of ad-hoc categories induced. The results will be then analyzed regarding the
theory of Grounded Cognition emphasis that concepts are connected to sensory perception
depending on ad-hoc categories.
In chapter 5, the research aims at exploring the effect of external information, i.e information on
situation of consumption and perceptive environment, on the association between cognitive
expectations and sensory perception through categorization process at an individual level. In other
words, we aim at manipulating information delivered on the situation of consumption and the
design of presentation of the products to induce different cognitive and sensory associations
through the diversity of categorization.
In chapter 6, the research aims at exploring the effect of external information on sensory
disconfirmation of expectations and thus on the measure of affective judgments. External
information is manipulated through a contextualization step, i.e the priming of a situation of
consumption.
The research is organized in three parts:
1. From cognitive associations induced by external information on packaging to
sensory expectations through ad-hoc categories. We aim at better understanding
the sensory expectations induced by the information available on packaging of
products without tasting through a categorization step. Chapter 4
2. From sensory perceptions to cognitive associations through individual variability.
We aim at better understanding the cognitive expectations associated to sensory
perceptions of the products. We aim more precisely at better understanding the
categorization of blind tasted products and the variability among subjects induced
by the design of presentation of products. . Chapter 5
3. Influence of the fit between expectations and perceptions on affective judgments.
We aim at better understanding how the relation between cognitive and sensory
associations influences the sensory disconfirmation of expectations among subjects
and induced affective judgments. Chapter 6

Page 54
The objective of the research is thus to provide a better understanding of the relation
between cognitive processes, namely expectation, categorization, perception and affective
judgment. This research is made in the context of industrial projects. In other words, by using
applications on business projects with real constrains, we aim at providing insights on the
understanding of these cognitive processes during product assessments in consumer tests, to
better understand results provided by common methodologies of consumer tests using the
framework of theories of cognitive psychology.
In addition, studies aim to provide methodological improvements on consumers’ tests to
integrate expectations in food product design and the inter-individual variability of their
relationship with categorization, perception and affective judgment.

Page 55
Chapter 4: From cognitive associations to sensory
expectations through ad-hoc categories
-The case of a familiar product range-

Page 56
Introduction
The first step of the research provides better understanding about the relation between
concepts stored in memory through cognitive associations and sensory expectations. In food
sciences, expectations are mainly inferenced by external information such as brand, packaging or
labels and measure through assessment of sensory perception. Knowledge is limited regarding the
understanding of this relationship through the measure of the categorization of a product related
to past experiences, i.e concepts stored in memory. The Perceptual Symbol System states that
concepts are correlated to sensory associations retrieved from a subject’s memory. Context
inferencing ad-hoc categories, is here manipulated through the information provided on the
packaging of the products.
The research objective is to give insights on the relation between cognitive
associations induced by packaging information and sensory expectations in a food
context through ad-hoc categorization (Figure 5).
Figure 5 : Research scheme of Chapter 4
We apply the theory to common questions on consumer test designs, hereby the blind
versus branded question and the question about the translation of cognitive associations with
packaging information on sensory expectations (for example “naturality” related to a given
situation of consumption). This part of the research is using an industrial project aiming at
understand perception of the strawberry fresh dairy market by French consumers and the sensory
perception defining the categories made by consumers.
Three studies are conducted using a familiar product range, i.e. strawberry fresh dairy
products, to understand the relation between cognitive associations induced by packaging
ContextMotivation
Manipulated
Ad-hoc categories
Analyzed
Sensoryexpectations/perceptions
Cognitive expectations / associations
Measured
Packaging Information Groups of products(sorting task)
Verbatim

Page 57
information and ad-hoc categories on the sensory expectations in a food context. We aim also at
showing that ad-hoc categorization is variable depending on external information and between
subjects.
In food sciences, sensory expectations are assessed before consumption by subjects
without clear relation to the concepts representing a category. Based on theories in Grounded
Cognition, concepts are related to a sensory pattern of properties relating to categories. We aim
at demonstrating that cognitive associations with packaging information induce
sensory expectations. Categorization based on cognitive associations should impact the nature
of sensory expectations toward the product. This question is explored in Study 1A.
Categorization depends on the nature of the information available for the subject and
relates to a situation of consumption as defined by ad-hoc categories. In a food context, the
situation of consumption is partly determined by information provided on the products, hereby
the information carried by the packaging. Furthermore, categorization has been proved to be
variable among subjects. We aim at demonstrating that the relationship between
memory and expectations relates to ad-hoc categories, i.e. it is influenced by
contextual information and is variable among subjects. This question is explored in Study
1B.
1. Study 1A: Cognitive associations induce sensory expectations
1.1. Research question
The objective of the research is to understand the translation of packaging information into
sensory expectations through the ad-hoc categorization. In other words, how the categorization of
a product range without tasting (i.e. based on cognitive associations) induces a different nature of
expectations and, more precisely, different sensory characteristics even before food consumption.
1.2. Methodology
“Manipulated” variable We ensure having packaging information carrying different cognitive associations: light
labels, satieting labels with fresh cheese, fresh cheese for children, organic label, healthy labels
and daily yoghurts. We ensure also having different usages of consumption (ensuring different ad-
hoc categories) associated with the products.

Page 58
Subjects 47 subjects are recruited. They are all above 18 years old and all consume at least one fresh dairy
strawberry product per month. Gender repartition is as follows: 70% of women; 30% male.
Products Nine flavored products from the French market are selected (Figure 6). The choice of products
is made to ensure as much diversity as possible and is based on the following sensory criteria: the
thickness of the texture; the different strawberry flavors; the presence or absence of pieces of fruit;
the level of sweetness; the creaminess; and the intensity of the aroma. The products chosen with
various sensory profiles are as follows:
•Yoghurts with pieces of fruit: Activia, Recette crémeuse, Les 2 Vaches
• Yoghurt without pieces of fruit: Velouté
• Low-fat products: Activia 0%, Taillefine
• White cheeses: Jockey, Activia Fromage Blanc
• Fresh cheese “Petit Suisse”: Gervais
Figure 6: Photos of the range of strawberry fresh dairy products selected for the study
Protocol A pre-test is performed on a dozen people to check that the task is not too difficult and that subjects
will be able to make up more than two groups. We also check the number of products is not too
high in order to avoid a saturation effect.
The methodology is based on a free sorting task. Products are presented in a comparative design,
namely all together but in a random order for each subject. Products are presented in their original
packaging and are not tasted by the subjects.

Page 59
The subjects are given the following instruction: "In front of you is a range of nine products. Look
at them, touch them. Group together products that you perceive as similar and that are at the
same time different from the others. You are free to make as many groups as you want. The
number of products in group is unlimited”.
The second step is a description of each group by the subjects: “Describe the characteristics of
each group”. The nature of description is free and they can provide as many descriptors common
to all the products of the group as they want.
Statistical analysis To validate the hypothesis, the results should show that:
The sensory characteristics are elicited by subjects to describe the overall range of
products without tasting (1);
For each group of products sensory cognitive associations with it are different from the
other groups (2).
Regarding statement (1), analysis is focused on the different nature of the descriptions given by
subjects. For the overall set of subjects, we group together synonyms and assumed that all the
products for each of the groups are described by commonly used terms. We keep the terms elicited
more than 4 times (10% of the whole set of subjects) (Faye et al., 2004). Two groups of verbatim
are made. The first group is composed of descriptors relating to cognitive associations, namely the
context of consumption or benefits, and visual descriptors; linked to information on the
packaging. The second group is composed of descriptors related to sensory perception, namely
descriptors of flavor or texture. These criteria are not directly available but are induced from
information on the packaging and inferences made by subjects based on what they associate with
this information. Elicitation of sensory description validates the hypothesis as subjects do not taste
the samples.
Regarding statement (2), analysis is provided per group of product on the overall set of subjects.
If results highlight different sensory and cognitive associations, then we can validate statement
(2). The following statistical analyses are applied (Faye et al., 2013). For each subject, a similarity
matrix is calculated. This matrix is a binary matrix product x product where a zero indicates that
the products are not in the same group. The individual matrices are aggregated to give an overall
similarity matrix.

Page 60
The overall matrix of similarities is analyzed by a Multi-dimensional Scaling (MDS) (Kruskal,
1964). Configurations are selected for optimal Kruskral’s stress i.e. less than 0.02 (Faye et al.,
2004). The coordinates of the best configuration on MDS dimensions are analyzed by a
Hierarchical Ascending Classification (HAC) with square Euclidian distance and Ward’s method
(Giboreau et al., 2001; Lawless, 1989). The histogram of the level index indicates the index
corresponding to the number of classes that have to be kept (Lebart, 1997).
Regarding the analysis of verbatim, a matrix of descriptors*products is displayed indicating, in
each cell, the frequency of association between one descriptor and one product. A coefficient of
correlation between the coordinates of the products on the selected dimensions and the
association between each verbatim and each product is calculated. Only descriptors with
coefficients of correlation above 0.7 and below -0.7 are kept (Faye et al., 2004). The coordinates
obtained for each verbatim are used as a projection on the mapping with the products. This result
allows a visual representation correlating the cognitive and sensory associations with each
product. A matrix is displayed sensory associations*cognitive associations. Each cell represents
the number of subjects describing one product by the corresponding sensory and cognitive
association. A statistical criterion is defined through analysis of Fisher’s test at 10% on the matrix.
We validate the hypothesis if the p-value is significant.

Page 61
1.3. Results
Descriptors are structured in two groups: cognitive and sensory associations (Table 2).
Table 2 : The structure of verbatim in cognitive (concept) and sensory (sensory properties) associations
Fifteen sensory descriptors are elicited by more than 10% of the subjects. These descriptors
characterize the texture of the product (thick, liquid, stirred), the basic taste (sweetness) and the
flavors (milky, fruity, and tasteless for example).
Thus, the first conclusion is that categorization of products without tasting induces
the elicitation of sensory expectations.
Results provided by the Fisher’s test are significant. In other words, associations between sensory
and cognitive expectations are significantly different. Crossing results from MDS and from HAC,
the configuration provides three groups of products (Figure 7):
Frequency of elicitation Sum MeanYoghurt 63 7.0O% fat 48 5.33
White cheese 41 4.55Mixed fruits 37 4.11
Natural 23 2.55Chimical 17 1.88
Appealing 16 1.77Good for health 14 1.55Not appealing 13 1.44
Daily 13 1.44Activia brand 12 1.33
Children 11 1.22Large pack 10 1.11
Organic 9 1.0Desert 9 1.0
Sweetener 9 1.0Creamy 48 5.33
With pieces 44 4.88Onctuous 26 2.88
Sweet 23 2.55Milky 22 2.44Velvet 22 2.44Thick 18 2.0
Liquid 17 1.88Low sweet 17 1.88
Fruity 12 1.33Stirred 11 1.22
Light 11 1.22Fat 11 1.22
Very sweet 10 1.11Tasteless 10 1.11
CO
NC
EP
TS
EN
SO
RY
PR
OP
ER
TIE
S

Page 62
Group 1: Les 2 Vaches, Gervais and Velouté;
Group 2: Recette Crémeuse, Jockey, Activia Fromage Blanc, and Activia;
Group 3: Taillefine and Activia 0%.
Figure 7 : Configuration of products without tasting obtained with the MDS and grouped with HAC (circles)
The first group gathers Les 2 Vaches, Gervais and Velouté. The products are characterized by the
contextual descriptor “daily”, by the benefit descriptors “organic” and “natural”, and the sensory
descriptors “light” and “milky”. Regarding group 2, the products are described as “children”,
“desert”, “large pack”, and “white cheese” relating to “very sweet”, “creamy”, “sweet”, “thick”,
“unctuous”, “fat”, and “velvet”. For group 3, Taillefine and Activia 0% are grouped together based
on “good for health”, “sweetener” and “0% fat” related to “tasteless”, and “loo sweet”.
Thus, the second conclusion is that the three groups of products are described
differently in terms of cognitive and sensory characteristics. In other words, even if
subjects had not tasted the products, they were able to associate sensory
expectations based on cognitive associations with the packaging of products.

Page 63
1.4. Main conclusions
Based on the results, the following statements are made:
criteria used to categorize the products are sensory expectations and
cognitive associations with the product;
packaging information is associated with different sensory expectations.
Thus these results show that external information, hereby the packaging, has
an influence on the relation between cognitive associations and sensory
expectations.
These results can be interpreted regarding the perceptual states theory as
cognitive associations inducing ad-hoc categorization of the products and thus
the association with sensory expectations.
1.5. Methodological limits
The results show that cognitive associations induce sensory expectations. These results were
based on the fact that subjects were able to elicit sensory description without tasting the product.
Assessment of products was thus based on two types of information. The first type of information
is provided by the cues on the packaging such as photos. This is thus a potential limitation of the
methodology defined by the fact that these sensory properties were directly induced by
multisensorial perception. Indeed, several studies have shown that sensory aspects of the
packaging have an influence on the perception of the product, i.e. the recipe itself (Becker et al.,
2011; Piqueras-Fiszman and Spence, 2012). Thus, the photos as can be seen on the Velouté, Jockey
or Recette Crémeuse packaging can induce, in some ways, elicitation of sensory description such
as unctuosity or thickness. In a way, the results should have concluded that there was a
multisensorial effect of the packaging on sensory expectations. However, the discrimination of the
samples with differences of association with sensory expectations show that this packaging effect
does not give the entire answer. Indeed, the elicitation of sensory characteristics such as tasteless,
very sweet, milky or velvety are also strongly correlated to the knowledge consumers had regarding
previous consumption of products having the same labels such as lightened products or products
for children. The second type of information is related to what the consumers know about the
products. Firstly, this knowledge is based on previous tasting and determines his/her sensory
expectations (Cardello, 1995). Secondly, this knowledge is based on tasting of other products

Page 64
having the same labels (such as lightened products) and on social communication (Steenkamp,
1989). Based on these experiences, consumers have already built strong associations between
lcognitive associations with these external information and sensory expectations (for example a
lightened product is considered tasteless). Thus, even if several sensory aspects of the pack can
directly induce the sensory expectations es of the recipe (photos, format), these results are also
based on existing associations between cognitive expectations formed by labels and brand, and
sensory expectations.
Another limitation of the methodology is due to the description step. Indeed, asking
consumers to describe each group of products is asking for the criteria shared by the members of
the group. In other words, this description step gives access to the properties defining the category.
However, some criteria that are not used to categorize per se the product can also be inferenced
from the category to the product (Barsalou, 1983; Rosch, 1978). Cognitive associations elicited by
the subjects are either information which is directly readable on the packaging or, for some,
induced by existing knowledge as consumers of the product. Descriptors are limited as only
describing criteria used to categorize the product range. However, attributes related to
categorization and expectations are much more varied. Some cognitive associations, e.g. those
relating to the brand, can be transferred to the product itself as a member of the category (Wänke
et al., 1998b). Therefore a methodological step to dig more deeply into cognitive associations with
the category is needed. Qualitative methodologies are often used to understand the emotional
aspects relating to an object or a usage (Anzieu and Chabert, 2004). Some other methodologies
based on memory retrieval can help understand the definition of consumers’ expectations toward
a product.
In this study the set of products was quite large allowing consumers to easily discriminate
samples. However, providing a smaller range with only one precise type of products (lightened
product for example) would induce a more specific categorization of the products. Thus, subjects
without experience of this type of product may have more difficulty associating sensory
expectations spontaneously.
Sensory expectations related to cognitive associations depends on previous experiences with
the product range. Information on the consumer target should be better controlled, more precisely
on the previous experiences they had with the product range. A further step could be to recruit
subject on their previous experiences, i.e the context of consumption they use to associate with
each of the product.

Page 65
Another limitation of the methodology is the relation with ad-hoc categories. External
information manipulated in the study was packaging information. So we do not ensure in the study
that product categories were different regarding food contexts of consumption. Thus, a further
study should integrate a step of contextualization. This step ensures that product categories made
in the sorting step are related to the context of consumption, and thus representative of ad-hoc
categories.
To sum-up, the following methodological limits are stated:
Some elements of the packaging can induce directly sensory
perceptions of the products.
The description step cannot give access to entire properties inferenced
by the categorization step, and more precisely cognitive associations.
Further studies needed to be implement on a smaller category of
products.
Improvement on the characterization of consumers is needed to ensure
that the categories of products are related to different situations of
consumption based on their previous experiences.
The context of consumption should be primed at first to ensure getting
access to ad-hoc categories.
1.6. New proposal of study based on insights
Based on the methodological limits of the study and without the constrains of industrial projects
we aim at proposing a new design of study to demonstrate that cognitive associations induce
sensory expectations through ad-hoc categorization.
First improvement is to ensure measuring ad-hoc categories by manipulating directly the context
of consumption. A contextualization of the task as a first step in the design ensures measuring a
sorting of the product integrating the context of consumption. Thus, we ensure measuring
different ad-hoc categories of the product range.
Second improvement is related to the packaging bias. We need to provide a detailed list of
cognitive associations not directly induced by some of the packaging elements. Thus, the free
description of each group should be then completed by a list of cognitive associations. This step

Page 66
ensures that differences between groups of products are made based on the same proposal of
cognitive associations and thus avoid partly the bias of some packaging elements.
The objective is to ensure having different categories of products with different cognitive
associations. We use the same product range. Thus, the methodology is the following:
First step: Sorting task of the products based on different contexts of consumption, i.e
consumers is asked to make the product sorting depending on the situation of
consumption associated.
Second step: a check-all-that-apply on cognitive associations is proposed. Consumers have
to associate with each group of products one cognitive expectation upon a list of proposed
words. This list being established from a upon qualitative step (same consumer target as
the quantitative step)
Third step: free description of each group of products to validate if consumers elicit
spontaneously sensory expectations.
Results should show that between each group of products cognitive and sensory associations
differ. A final questionnaire on their usages with fresh strawberry yoghurt is provided to be able
to better characterize the panel of subjects.
2. Study 1B: Expectations are framed by ad-hoc categories depending on contexts and subjects
2.1. Research question and hypothesis
The objective of the research is to show the effect of external information, i.e
provided by the packaging on the ad-hoc categorization of a product range. More
precisely, the ad-hoc categories are variable among information available for the subject and
consumers.
Regarding the context of presentation, the objective is to compare a categorization on a branded
without tasting and on a blinded with tasting product space. Regarding the subjects’ variability,
the objective is to show that for a familiar range of products, categorization is different between
subjects5.
5 This step is available in the appendix 1

Page 67
2.2. Methodology
“Manipulated” variable
The variability of external information is provided by two different nature of information: a blind
and a branded without tasting designs. The study aims at testing these two conditions of
information on the categorization of a product space through a sorting task. Two levels of
information available on the product for the subjects are proposed. We define the condition as the
nature of information available on the products. The first condition is based only on sensory
perception through the tasting of samples in blind conditions, called “percept condition”. The
second condition is based only on the information provided by the packaging, i.e cognitive
associations without tasting, called “concept condition”.
Subjects 47 consumers of strawberry dairy products are recruited. These subjects consume at least one
fresh, strawberry dairy product per month and are therefore familiar with these products.
Products Nine trade products have been selected and pre-tested to ensure the saturation level and the
difficulty of the task. These products do not belong to the same brand. They differ in terms of
sensory attributes (texture, color, presence/absence of pieces of fruit, and aromas) but also in
terms of cognitive associations with the products through labels (lightened products, brand, etc.).
These products are the same as for study 1A.
Condition Two conditions are tested:
a “percept condition”: in blind, anonymous and standardized, with tasting. The products
are served in transparent glasses of 4 ml capacity encoded with a three-digit code;
a “concept condition”: branded, with all information available on the packaging, without
tasting encoded with a three-digit code.
Protocol The subjects have first to sort products into perceived similarities. Instructions are the same as for
study 1A. Products sorted together are perceived as similar and at the same time different from
the products in other groups. Once the subjects have formed the groups, they have to describe each
group. The tasks for the two conditions are carried out on the same day. To avoid subjects
recognizing the products in different sessions, the tasks are carried out in the following order: first

Page 68
in percept conditions and then sorting in concept conditions, with a pause of several minutes
between the two.
Statistical analysis To validate the hypothesis of the variability of ad-hoc categorization, results should show that the
categorization induced by two levels of information should be different. Analysis is run on data
exclusively from the sorting task. We follow the same procedure as for study 1A. The two obtained
configurations are compared using the Adjusted RV coefficient (El Ghaziri and Qannari, 2015;
Escoufier, 1973; Faye et al., 2004) as the number of subjects is low. For an Adjusted RV coefficient
above 0.7 we can conclude a similarity of configurations exists. Analysis is run with XLStat 2014.
A second criterion is the nature of associations between products. We check that between
conditions, associations between products are not the same.
2.3. Results
Comparing the two configurations, the Adjusted RV coefficient does not allow finding a
similarity (ARV = 0.312). Regarding the configuration of the products in percept condition
(k=0.014), three groups are formed. Differentiation is made between a highly textured product,
Gervais, and low textured products, Velouté and Les 2 Vaches. A larger group is formed grouping
together all the products left in the range (Taillefine, Activia, Recette Crémeuse, Activia 0%, Activia
Fromage Blanc, and Jockey). These products all contain fruit pieces (Figure 8).
Figure 8: Configuration obtained with MDS in “percept” condition

Page 69
The configuration obtained under the concept condition shows a different categorization of the
product range (Figure 9). Five different groups are provided by HAC. Low-fat products are
grouped together (Taillefine and Activia 0%) and differentiated from fresh cheese products such
as Jockey and Activia fromage blanc. Gervais is categorized apart from the others as is Les 2
vaches. The last cluster is Activia, Recette Crémeuse and Velouté.
Figure 9 : Configuration obtained with MDS in concept condition
Thus, the common feature between configurations is the discrimination of Gervais in one
separated group. Samples grouped together are not the same under percept and concept
conditions. For example, Velouté is grouped with Les 2 Vaches in percept conditions and with
Activia and Recette Crémeuse in concept conditions. Discrimination between samples is higher in
concept conditions than in percept conditions.
In addition, a comparison of the words used by subjects also show a difference between the
categorization criteria. The concept condition gives access to descriptive criteria readable on the
packaging (“125g”, “0%”), but also to broader criteria relating both to the benefits associated with
the product ("to lose weight", “good for health”), to sensory characteristics ("thick", "presence of
pieces of strawberry") or consumption contexts ("for women", "to taste"). Under the percept
condition the subjects used exclusively various sensory descriptors (“creamy”, “thick”, “with pieces
of fruit", "sweet", "fruity", 'pink').
Thus, the results show a difference in categorization of the range between the two
conditions.

Page 70
2.4. Main results
The study provides several conclusions:
The same range of product is categorized differently among condition of
information;
the same range of products is categorized differently among subjects (study
in the Appendix).
Regarding theoretical background, ad-hoc categorization is a cognitive process variable among
subjects (related to different characteristics as familiarity for example) and depending on the
context. Thus, food categorization is depending on subjects but also on the nature of the
information available to the subject. Sensory perception depends on the ad-hoc category
inferenced by the nature of information available on the product.
2.5. Methodological limits
The results showed differences among the level of information given to the consumers. This is
close to studies usually conducted to understand the influences of context on expectations by
providing different types of information (Caporale et al., 2006; Siret and Issanchou, 2000). If
context of consumption widely used is that of manipulating environmental factors, such as time,
place, etc. by integrating ad-hoc theories in the research, it can provide another way of thinking.
Indeed, with the same level of information, consumers provide different ways of categorizing the
same product space. This suggests that the criteria used to sort the products are different. Then,
the importance given by the individual subjects to each of the sensory characteristics is not the
same. This can then be related to the motivational aspect. If motivation is different among people,
then criteria used to categorize product space should be different whenever the nature of the cues
provided. This output highlights the fact that much discussion is provided around the effect of
context, and semi-ecological factors needed to be presented to reproduce real-life conditions, but
little attention has been given to the motivational aspect. So one criticism is the lack of
contextualization regarding motivation. We have no clue regarding why subjects have sort the
products in this way. Thus, one improvement could be to provide, prior to presenting the products
(whatever the condition) a contextualization task regarding not only the context of consumption,
but also the motivation.

Page 71
Another limitation of the study relates also to the definition of ad-hoc category. The study
provides understanding on the comparison between two different contexts, hereby branded and
blinded designs. However, the context of consumption defining ad-hoc category is not used per se
here but retrieved spontaneously through cognitive associations after the sorting task. Thus, we
need further research to demonstrate that ad-hoc categories are variable among contexts. In other
words, the context of consumption is a condition that should vary in order to induce different ad-
hoc categorization of the products.
Main studies of expectations in food sciences compared assessment of product perception in
three different conditions: branded without tasting, branded with tasting and blinded. In this
study, the second condition was not integrated to the study. Thus, the difference of configurations
obtained between the two conditions “concept” and “percept” is not only due to the influence of
the packaging but also to the tasting of the samples. The second condition is thus needed if we
want to conclude on the effect of packaging information on the categorization of products.
Regarding variability of associations between cognitive and sensory expectations, the study
needs an additional step of verbalization to be able to make the link with the variability of
categorization. This step of verbalization should help to better understand the variability of
cognitive associations and sensory expectations induce by two different contexts depending on the
product categorization.
As we would expect, consumers categorize the product range in different ways. This is aligned
with previous results provided by Faye et al (Faye et al., 2013). Perception is impacted by many
factors and we cannot take them all into account. Thus, clustering on perception allows to get
direct access to the structures in the memory retrieved during perception and to understand the
association between each category and sensory and non-sensory associated. One factor that could
contribute to this variability is the relation with familiarity. The entire product range is familiar to
consumers because at some point or other they would have had prior exposure to them (previous
tastings, social information, publicity, purchase contexts) (Grunert, 2002). However, familiarity
should be related to the goal used to categorize samples. This information has not be provided by
the study, but other studies have shown the impact of expertise on categorization task (Medin et
al., 1997). Therefore, clustering the subjects’ categorization allows firstly access to a segment of
subjects having the same criteria of categorization, and secondly having the same sensory
properties answering to the motivation to consume the product. Further investigation is needed
to understand differences of perception by looking at different levels of familiarity in food
consumption.

Page 72
To sum-up, the following methodological limits are stated:
Contextualization should integrate motivational aspect of food
consumption related to the definition of ad-hoc category
Another study is needed to demonstrate the variability of ad-hoc
categorization by priming on different contexts of consumption
Condition branded with tasting is missing to the study to be conclusive
on the impact of packaging information on the product categorization
A step of verbalization should be integrated to better understand the
relationship between variability of categorization and variability of
cognitive and sensory associations
Another investigation is needed to understand relation between
familiarity of consumers toward the overall product experience and
their perception.
2.5.1. New proposal of study based on insights
Based on the insights provided by the study, two proposals of study can be made.
The first one is focused on the variability of ad-hoc categorization depending on the context. As
previously discussed, the study cannot demonstrate the variability of ad-hoc categorization
because we did not define the context of consumption as a controlled condition. The objective of
the proposal is to show that ad-hoc categorization and thus cognitive and sensory associations
with the product are variable among contexts. The context is a situation of consumption defining
the ad-hoc category. The following methodology is proposed: compare two conditions of ad-hoc
categorization of the same product range.
First step: contextualization of one situation of consumption (two contexts of consumption
should be chosen: “a desert at home”, “a snack in the mid-afternoon to feel s” for
examples).
Second step: sorting task of the products among perceived similarities according to the
context
Third step: free description of each group of products.

Page 73
Results should show that the grouping of products differ among conditions and that the
description associated to each product differ among conditions.
The second proposal is focused on the context defined as the nature of information taken into by
the subject in its perceptive process. More precisely, it aims at demonstrating that cognitive
associations with packaging information influence the sensory perception through a variability of
ad-hoc categorization. As discussed previously the condition branded with tasting is missing to
demonstrate the influence of the packaging information on product perception. The following
methodology is proposed on the same product range in three conditions; i.e blinded with tasting,
branded with and without tasting. The design of the study follows two steps: sorting task on the
products then free description.
Results should show that the grouping of products and the description per product differ among
conditions. These results should bring also better understanding on the differences of associations
regarding expectations and then regarding perception.
In both studies, a final step of characterization of consumers on their familiarity with the situation
of consumption and the product range should be made. A final clusterisation based on their
familiarity would be made to show an inter-individual variability of categorization.
3. Discussion
Expectations are framed by associations between concepts and sensory expectations. These
associations are related to criteria structuring categories, but also inferenced by these categories.
In the framework of Grounded Cognition, expectations relate to ad-hoc categories, i.e. the
categories of a product induced by a situation of consumption. These results are aligned with
previous research made on the impact of context of consumption on the perception of food
products (Boutrolle and Delarue, 2009; Piqueras-Fiszman and Jaeger, 2014; Rozin and Tuorila,
1993b). Considering that the expectations and perceptions of a product are influenced by ad-hoc
categorization, then the context is a determinant factor to take into account in food products tests.
However, ad-hoc categories are not only determined by the context, but also by a specific goal that
the subject wants to achieve (Barsalou, 1983). In a food context, motivation to consume the
product is thus as important as the context in which the product is consumed. This motivation is
related to specific cognitive associations. In the framework of Grounded Cognition, concepts
representing ad-hoc categories are retrieved through a particular sensory pattern of information

Page 74
(Barsalou, 1999). Thus, defining expectations, (i.e. associations between concepts and the sensory
perceptions of the product) needs to be contextualized through two variables: the context of
consumption (i.e. the environment) and the motivation, (i.e. the reason to consume the product).
Few studies have focused their interest on studying expectations by providing a clear motivation
with the context of consumption. Most of them are made through the delivery of precise
information prior to food consumption, such as the origin (Caporale et al., 2006), the process of
manufacturing (Cardello, 2003) or the packaging (Ares and Deliza, 2010) to give a few examples.
This information is assessed as a possible motivation to consume the product, thus to categorize
it. However, this is also dependent on the implication of the subject to the specific motivation, and
can be translated into different possible associations between the concept and sensory
perceptions. The situation of consumption is thus important to better understand expectations
toward a product. Indeed, the same product can be assessed differently depending on the situation
of consumption. Subjects will not focus their attention on the same product properties translating
the need they want to fill by consuming the product.
Contextualizing a situation of consumption is also related to the familiarity of the product
range. Indeed, a familiar product infers a frequent usage by the subject with strong associations
in his memory based on previous experiences. Thus, information provided additionally about the
product should have a lower weighting than the common usage of the product. This influence of
the context on associations between concepts and sensory perceptions is related to the nature of
the products (Puumalainen et al., 2002; Wänke et al., 1998b) and the concept conveyed through
the motivation to consume the product (Barsalou, 1982). Further studies should focus more on
motivation as a key factor of contextualization to understand food expectations and perceptions.
Main conclusions of this chapter are:
Cognitive associations convey by packaging information induce sensory
expectations.
Expectations are formed from “ad-hoc” categories, i.e. induced by a situation
of consumption, and vary among subjects.
The next step of the research focuses on the study of the relation between expectations and
perception through ad-hoc categories. We aimed at studying the reverse link between sensory
perceptions and cognitive expectations through ad-hoc categories.

Page 75

Page 76
Chapter 5: From sensory perceptions to cognitive
expectations; variability among subjects
-The case of a non-familiar product range-
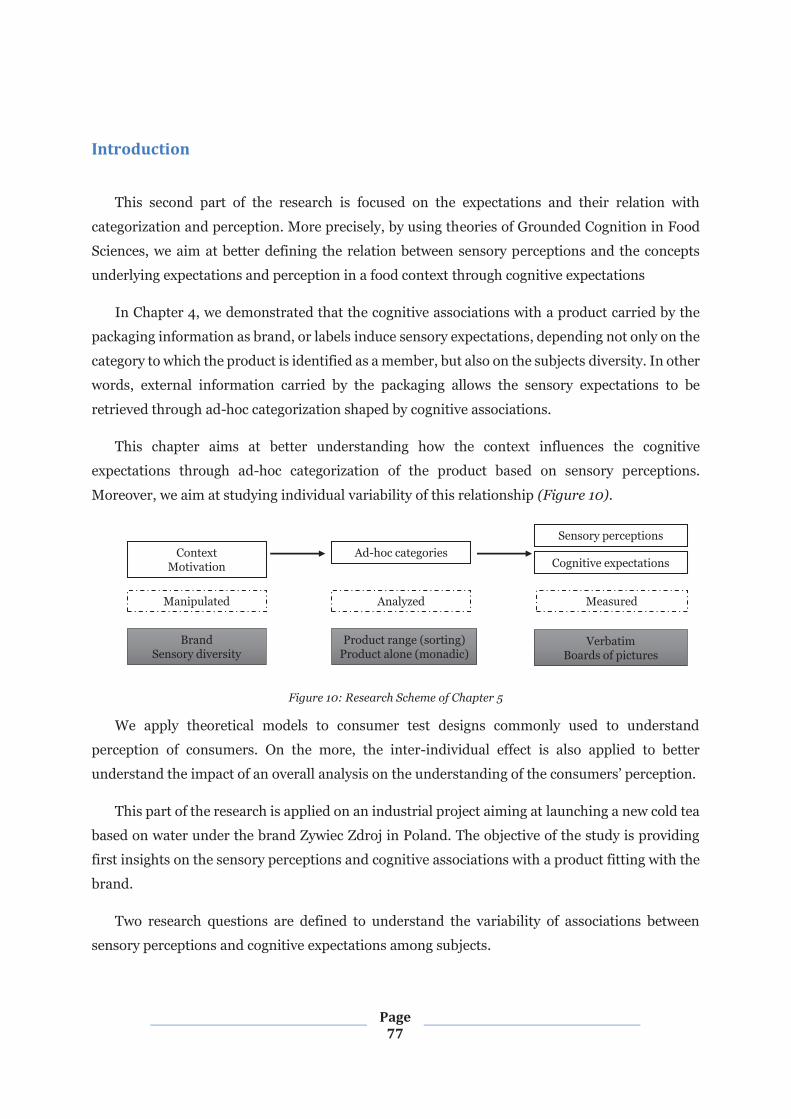
Page 77
Introduction
This second part of the research is focused on the expectations and their relation with
categorization and perception. More precisely, by using theories of Grounded Cognition in Food
Sciences, we aim at better defining the relation between sensory perceptions and the concepts
underlying expectations and perception in a food context through cognitive expectations
In Chapter 4, we demonstrated that the cognitive associations with a product carried by the
packaging information as brand, or labels induce sensory expectations, depending not only on the
category to which the product is identified as a member, but also on the subjects diversity. In other
words, external information carried by the packaging allows the sensory expectations to be
retrieved through ad-hoc categorization shaped by cognitive associations.
This chapter aims at better understanding how the context influences the cognitive
expectations through ad-hoc categorization of the product based on sensory perceptions.
Moreover, we aim at studying individual variability of this relationship (Figure 10).
Figure 10: Research Scheme of Chapter 5
We apply theoretical models to consumer test designs commonly used to understand
perception of consumers. On the more, the inter-individual effect is also applied to better
understand the impact of an overall analysis on the understanding of the consumers’ perception.
This part of the research is applied on an industrial project aiming at launching a new cold tea
based on water under the brand Zywiec Zdroj in Poland. The objective of the study is providing
first insights on the sensory perceptions and cognitive associations with a product fitting with the
brand.
Two research questions are defined to understand the variability of associations between
sensory perceptions and cognitive expectations among subjects.
ContextMotivation
Manipulated
Ad-hoc categories
Analyzed
Sensory perceptions
Cognitive expectations
Measured
BrandSensory diversity
Product range (sorting) Product alone (monadic)
VerbatimBoards of pictures

Page 78
In Grounded Cognition concepts are shaped by sensory perceptions. In Food Sciences
expectations are mainly studied through sensory expectations. There is no clear evidence showing
the impact of sensory perceptions on cognitive expectations related to ad-hoc categories. We aim
at studying the impact of the sensory perceptions of the subject on cognitive expectations
associated with them. The question is to understand the relation between the sensory
perceptions and the cognitive expectations in two common tasks of consumer test.
This question is explored in Study 2A.
Product properties are criteria shaping ad-hoc categories in a food context. Categorization is
variable between subjects. Furthermore the motivation and the context define ad-hoc categories.
Thus, the relation between sensory perceptions and cognitive expectations should also vary among
subjects. We aim at studying the variability of this relationship between subjects. The question
is to study the influence of the diversity of sensory perception between subjects on
the diversity of cognitive expectations. This question is explored in Study 2B.
1. Study 2A: influence of sensory perceptions on cognitive expectations
1.1. Research question
The research aims at studying the influence of the sensory diversity, i.e variability of
elements next to the target product (Yeh and Barsalou, 2006) on cognitive associations with the
product. It aims more precisely at comparing two tasks used in consumer tests inducing two
different sensory contexts around the product.
1.2. Methodology
”Manipulated” variable Variability of sensory elements is induced through two methodologies. Indeed, for the
same product range, we aim at focusing the attention of the subjects on different sensory
characteristics of the product. Two protocols of assessment are used to induce a variety of sensory
information: in monadic the product is presented alone, and in comparative condition, the
products are presented together. Based on previous studies, results showed that the sorting task
focuses the attention of the subject on the shared product properties of the product range, while
the monadic condition emphasizes the sensory characteristics specific to the product (Bech-
Larsen and Nielsen, 1999; Breivik and Supphellen, 2003; Dubois, 2009). Thus, by modifying the

Page 79
task and the condition of presentation, the sensory information available for the subject for the
same product is different.
Products Eleven cold tea drink products are tasted by the consumers (based on a pre-study6) for
both conditions (Figure 11).
Figure 11: Cold tea drinks product presented for tasting
The product range is differentiated on the main sensory properties: the aroma from tea
(green, black, rooibos, and white), the fruit aromatization (pear, lemon, white grape, and
strawberry), and the level of perceived sweetness.
All the products are tasted in blind conditions and in transparent glasses of 12ml.
Procedure Two different methodologies of assessment are tested reflecting the two conditions of contexts.
The “comparative condition” is based on a free sorting task. Five steps are followed by the
consumers (Figure 12).
6 The qualitative pre-study is developed in Appendix 2
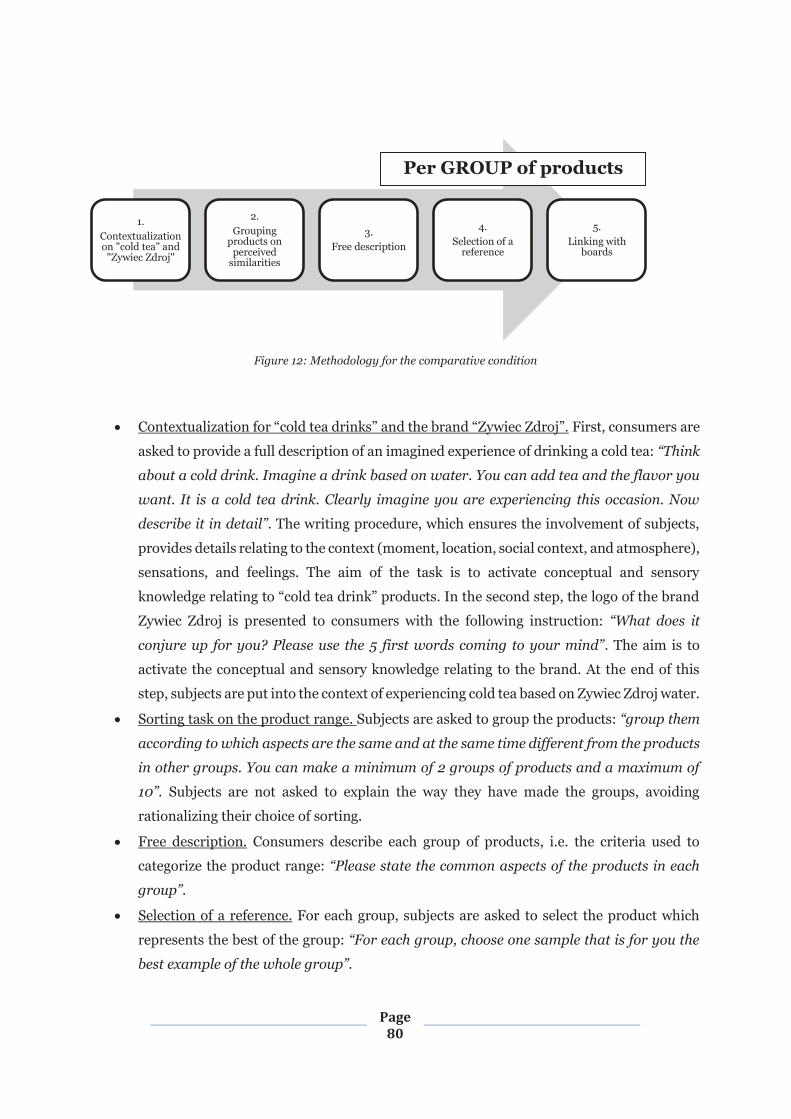
Page 80
Figure 12: Methodology for the comparative condition
Contextualization for “cold tea drinks” and the brand “Zywiec Zdroj”. First, consumers are
asked to provide a full description of an imagined experience of drinking a cold tea: “Think
about a cold drink. Imagine a drink based on water. You can add tea and the flavor you
want. It is a cold tea drink. Clearly imagine you are experiencing this occasion. Now
describe it in detail”. The writing procedure, which ensures the involvement of subjects,
provides details relating to the context (moment, location, social context, and atmosphere),
sensations, and feelings. The aim of the task is to activate conceptual and sensory
knowledge relating to “cold tea drink” products. In the second step, the logo of the brand
Zywiec Zdroj is presented to consumers with the following instruction: “What does it
conjure up for you? Please use the 5 first words coming to your mind”. The aim is to
activate the conceptual and sensory knowledge relating to the brand. At the end of this
step, subjects are put into the context of experiencing cold tea based on Zywiec Zdroj water.
Sorting task on the product range. Subjects are asked to group the products: “group them
according to which aspects are the same and at the same time different from the products
in other groups. You can make a minimum of 2 groups of products and a maximum of
10”. Subjects are not asked to explain the way they have made the groups, avoiding
rationalizing their choice of sorting.
Free description. Consumers describe each group of products, i.e. the criteria used to
categorize the product range: “Please state the common aspects of the products in each
group”.
Selection of a reference. For each group, subjects are asked to select the product which
represents the best of the group: “For each group, choose one sample that is for you the
best example of the whole group”.
1.Contextualization on "cold tea" and
"Zywiec Zdroj"
2.Grouping
products on perceived
similarities
3.Free description
4.Selection of a
reference
5.Linking with
boards
Per GROUP of products

Page 81
Linking with boards. Six boards of conceptual expectations are presented in a random
order at the same time to the consumers. Each board is printed in color on an A4 sheet of
paper. For each group of products, subjects choose the board that, in their opinion, best
fits the product; or none, if no board matches: “Now, look at all the boards in front of you.
For each group of products select the board that is the best fit. Indicate the number of the
board for each group. If none of the boards fit with the groups then indicate zero”.
The “monadic condition” is based on a monadic methodology: “one by one” assessment of
samples. Three steps are followed by consumers (Figure 13):
Figure 13: Methodology for the monadic condition
The contextualization step is similar to the one for the comparative condition.
Free description: consumers taste and assess the products one by one. Consumers describe
each product: “Look, smell and taste the sample. Then write down all that is important in
this sample for you”.
Linking with boards: the same instructions are given to consumers as for the comparisons,
but related to one product at a time.
In monadic conditions, a five minute-break for the consumption of a cracker to neutralize any
lasting aroma in mouth, is imposed between products.
The questionnaires were back translated in polish language.
Boards of cognitivel expectations Six boards depicting the expectations relating to six situations of consumption are built
from collages which were made during the pre-study7 by consumers (Figure 14).
7 The pre-study is in Appendix 2
1.Contextualization on
"cold tea" and "Zywiec Zdroj"
2.Free description
3.Linking with boards
Per product

Page 82
Figure 14:Boards of cognitive expectations defined by the consumers through collages
“On the go”: this is an impulsive situation where the subject is walking in the street, and
gets thirsty.
“Exotic”: this context is during the summer, or holidays, when the subject wants to relax.
“Energy”: this situation where the subject is going out with friends to a party or a barbecue,
for example. The subject drinks the product to get some energy.
“Physical activities”: the motivation is hydration and to replenish in minerals after physical
activity.
“Family”: the context of consumption is during a meal with t family and the children
present so there is the motivation to drink a healthy and natural product.
“My moment”: this situation is to have a moment alone to relax, for example after work.
Subjects For each condition, 110 subjects are recruited. The subjects are Polish people from two
cities: Warsaw and Poznan. There is a 50/50% division of gender and age (age is grouped into
groups: 20-35 years old and 36-56 years old). The same profile of consumers is kept for both
conditions:
For the brand: subjects have to be consumers of the brand Zywiec Zdroj (a brand of Polish
water).
For the “cold tea” category: subjects have to be non rejectors of tea, cold drinks and
flavored waters.

Page 83
Statistical analysis To confirm that a difference of perceptions induces a difference of associated cognitive
expectations, the study aims at validating the following:
Between the two conditions of presentation, product properties, i.e sensory
perceptions are different (1)
Between the two conditions of presentation, associations with cognitive
expectations are different (2)
Regarding the first statement (1), a two-step validation is needed. Firstly, it aims at comparing the
description at the level of the product range based on the similarity of the description between
products (1.1). Secondly, it aims at comparing the description per product between conditions
(1.2).
(1.1) The overall assessment of the product range should highlight a difference of
associations between products based on the descriptors elicited for each condition. In
other words, configurations of products between the two conditions should be different
regarding Adjusted RV coefficient.
Data from sorting is organized in an individual matrix of dissimilarities. The matrix for
each subject is a product x product matrix; with 0 when the two products are in the same
group and 1 when they are not. The aggregated matrix of dissimilarities is analyzed by a
Multidimensional Scaling (MDS) (Faye et al., 2004; Kruskal, 1964). Coordinates of the best
configuration are then analyzed by a Hierarchical Ascendant Classification (HAC).
Selected configurations are selected for optimal Kruskral’s stress i.e. less than 0.02 (Faye
et al., 2004).
Data from a monadic assessment is analyzed through frequencies of use. For each
descriptor, the frequency of use is defined by the number of subjects using the term to
describe the products (Ares and Jaeger, 2013). For each subject a matrix product *
descriptor is obtained with 1 if the product is associated with the descriptor and 1 if not.
The configuration of products is obtained with a Multiple Factor Analysis (MFA) run on
the overall set of individual matrices.
A comparison of configurations is made with the calculation of an Adjusted RV coefficient
between monadic and sorting conditions (Escoufier, 1973). Good agreement between
configurations is considered for a RV coefficient above 0.7 (Faye et al., 2004).

Page 84
Another step of the validation is to assess the differences regarding the description between
conditions based on two criteria: the number and nature of properties elicited by subjects.
Distribution of the number of descriptors elicited by the whole panel is calculated for both
conditions.
Descriptors are sorted in 5 groups: visual (visual characteristics such as color or
transparency), flavors (basic tastes such as sweetness or bitterness, aromas and odor as it
is not possible to dissociate flavors from odors by the retronasal process), hedonic
(evaluative judgment), perceived benefits (benefit or context), and finally, drink identified
(identification of a food taxonomic category). A chi-square analysis is run for each group
of descriptors elicited on the whole range of products by all the consumers between the two
conditions (Ares and Deliza, 2010).
(1.2) The assessment per product should highlight the differences of product properties
elicited between conditions. For each product, descriptors elicited by more than 10% of the
set of subjects are kept (Ares and Deliza, 2010). Then data from the monadic condition is
standardized in order to compare the two sets of data (comparative and monadic) on
percentages. A Chi-square analyses is run for each product and each attribute between the
two conditions (Ares et al., 2010). The frequency of elicitation of the sensory descriptors
should be significantly different at 5% between conditions for each product. The analysis
is then focused on the products owning the themes “visual” and “flavors” referring to
sensory perception. To validate the hypothesis (1) these product properties should be
different between the two conditions. Significant differences are classified in four cases.
Case 1: descriptors with a significantly higher frequency of elicitation in comparative
conditions than in monadic conditions (used more to describe the product in
comparative conditions, but used also in monadic conditions).
Case 2: descriptors with a significantly higher elicitation in monadic conditions than in
comparative conditions (used more to describe the product in monadic conditions, but
used also in comparative conditions).
Case 3: descriptors only elicited in comparative conditions.
Case 4: descriptors only elicited in monadic conditions.
Regarding the second statement (2), the following criteria are needed to validate the hypothesis:
(between conditions; each product; and the board(s)): if a board is chosen more in one condition,
it should differ from the other condition. An analysis is conducted for each product. A matrix of
conditions*board is displayed with each cell providing the number of subjects associating with
each condition on the board with the product. A chi-square analysis is run on the matrix at 5% to

Page 85
compare distribution of boards between conditions for each product. Then for each product the
significance level Ps (1) is used to determine the boards that are more elicited for each product and
each condition. The significance level is the minimum value that the frequency should equal in
order to be significantly more elicited than if it was chosen by chance at a 5% risk (Pineau et al.,
2009).
(1)
is the chance level equal to 1/p with p being the number of variables.
n is the number of subjects
This confidence level is recommended for with p the probability of success (Rosner,
2011). Here the probability of success is = 1/7 = 0.14 (six boards or no association).Thus the
minimum number of observations should be n= 5/ (0.14 x (1-0.14)) = 41. Then considering that
we have 114 subjects we can use the Ps as a criterion of decision.
= 0.2. Thus the significance level is considered at 20%.
Graphical representation of the distribution of boards for each product and each condition is
displayed with standardized frequencies (obtained on 100% basis).
Hypothesis is validated if boards which frequencies of use are above the significance level differ
between conditions for the same product.
1.3. Results
Differences of sensory perceptions between conditions First of all, looking at the two mappings obtained on the basis of product range perception
(Figure 15), configurations are different. The Adjusted RV coefficient calculated between the
dimensions of configuration of each condition is equal to 0.428 concluding a dissimilarity between
the mappings. The difference observed between the mappings is the first evidence to point to a
difference of categorization between the two conditions.
By looking deeper into the results obtained with the HAC for the two conditions, and by
looking at the mappings, some products that are quite close in regards to the sensory
characteristics remaining together whatever the conditions: WP31 and WP1, P31 and P21, Nestea

Page 86
and Little Miracles. However, products that are quite heterogeneous to the whole range, such as
Volvic Mint Tea or Honest Tea, are much more differentiated from the full range in monadic
conditions.
Furthermore, by looking at the positioning of each product in the two conditions, following
results are provided:
Seven products are associated with the same products whatever the condition: Nestea,
Little Miracles, Tymbark, P31, P21, WP31 and WP1.
Three products are grouped together in comparative conditions, but stand alone in
monadic conditions: Honest Tea, Volvic Mint Tea and Elisabethen Quelle Lime.
One product is associated with different products in comparative and monadic conditions:
Elisabethen Quelle Rooibos.
Thus, configurations of products are not similar and four products have different positioning
between configurations.

Page 87
Figure 15: Mappings representing products configuration and dendograms based on HAC
Monadic condition: mapping based on an AFC on individual matrices of products*descriptors
Comparative condition: mapping based on an MDS on individual sorting matrices product*product
The number of descriptors elicited in the comparative condition is lower than in the monadic
condition (Figure 16). These results show that comparative presentation induces a restriction of
the properties taken into account to describe the product range. In the monadic presentation,
description is more spontaneous and numerous.
Configuration in monadic condition
Configuration in comparative condition (k= 0,037)

Page 88
Figure 16: Repartition of the number of descriptors between the two conditions
Regarding the nature of descriptors elicited in both conditions (Figure 17), more descriptors relate
to hedonism or benefits are used in the monadic condition to describe the products. Properties
used to categorize the samples in the comparative condition are mostly sensory-driven, i.e. visual
or related to taste or flavor, whereas in monadic, properties relate to the five different type of
properties.

Page
89
Figu
re 1
7: V
erba
tim
elic
ited
for
the
two
cond
itio
ns a
nd g
roup
ed u
nder
5 th
emes
N
umbe
rs o
f elic
itati
on a
re g
iven
for
each
con
diti
on fo
r th
e w
hole
ran
ge o
f pro
duct
s

Page 90
For standardized data, the frequency of words describing flavor is significantly higher than for
monadic conditions (Figure 18). On the other hand, the frequency of elicitation of descriptors
relating to hedonic themes is significantly higher for monadic conditions than for comparative
conditions.
Figure 18: Percentages of elicitation for each thematic descriptor for standardized data
* = significant differences calculated with a chi-square analysis for a p-value < 0.005
Thus, the number and nature of descriptors elicited by subjects for the whole product set are
different between conditions.
The first conclusions for the overall assessment of description show that:
Configurations of products and associations between products based on
description differ according to the conditions.
The nature and number of descriptors elicited for the whole set of
products differs according to the conditions
The second step of the analysis is focused on each product. Analyses of Nestea, Little Miracles,
Honest Tea and Volvic Mint Tea are presented as examples. For a detailed analysis provided
on other products of the set, refer to the Appendices
Nestea and Little Miracles are grouped together in the comparative condition and differentiate
from the other products in the set. They are described as: “very sweet”, “fruity”, and “strong”.
The same descriptors are used to describe the two products. In monadic conditions, commonly
used elicited descriptors are “fruity” and “good flavor”. Different descriptors are highly elicited
among the two products. Nestea is mainly described as: “based on tea”, “tea”, “golden color”
and “refreshing taste” Little Miracles is mainly described as: “cloudy” (Table 3).
Drink product

Page 91
Table 3: Frequencies of elicitation of descriptors for the two conditions for Nestea and Little Miracle products (superior to 10% of the set)
For Nestea, regarding the four cases of analysis of verbatim, the results show six significant
differences among the two conditions (Figure 19):
Case 1: “strong”, “other flavor”, “very sweet”
Case 2: “transparency”
Case 3: “colored”
Case 4: “golden color”
For Little Miracles, five significant differences can be seen among the two conditions:
Case 1: “strong”, “very sweet”
Case 2: “cloudy”, “mild”
Case 3: “colored”
Nestea Comparative condition
Monadic condition
Very sweet 37 23Fruity 20 56Strong 18 16
Tea 15 43Colored 13 0
Other flavour 11 0Based on tea 11 46Good flavour 0 54Golden color 0 39
Refreshing taste 0 34Nice colour 0 31Nice smell 0 20Too sweet 0 14
Slightly sweet 0 13Dark 0 12
Transparency 0 12
Little Miracles Comparative condition
Monadic condition
Cloudy 4 62Colored 13 0
Other colour 4 13Fruity 27 80Strong 18 12
Mild 1 13Slightly sweet 3 22
Very sweet 39 24Tea 5 12
Too sweet 3 16Good flavour 7 60
Nice smell 1 30Nice colour 1 28
Refreshing taste 7 25Flavoured drinks 3 15
Other product 0 12

Page 92
Figure 19: Frequency of elicitation on standardized data for the two conditions for Little Miracles and Nestea
= significant differences with a chi-square analysis at 5%
Thus, for the comparative condition, the sensory description for both products are the “strong”
intensity of aroma and the intensity of sweetness, whereas for the monadic condition, it relates
to visual aspects such as the color: “golden color” and “transparency” for Nestea and “cloudy”
for Little Miracles.
Furthermore, for monadic conditions, descriptors relating to evaluative judgment such as
“nice” and “good” are more frequently elicited. For the comparative condition, descriptors are
used with adverbial forms, or with adjectives positioning the product in a scale for a given
attribute: “very sweet”, “dark”, “and strong”.
For the comparative condition for Honest Tea and Volvic Mint Tea, there is no high consensual
elicitation of a particular descriptor (maximum frequency is 18 for Honest Tea and 14 for
Volvic) (Table 4). For the monadic condition, frequencies are higher for “cloudy” for Honest
Tea (120) and for “minty” for Volvic (72). This result can be explained by the fact that these
products are clearly differentiated from the product range because of specific aromatization
(honey aroma and mint aroma).

Page 93
Table 4: Frequencies of elicitation of descriptors for the two conditions for Honest Tea and Volvic Mint Tea products (superior to 10% of the set)
Regarding the analysis for each product between conditions, significant differences are
highlighted (Figure 20).
Figure 20: The frequency of elicitation on standardized data for the two conditions for Honest Tea and Volvic Mint Tea
= significant differences with a chi-square analysis at 5%
Honest Tea Comparative condition
Monadic condition
Cloudy 6 120Colored 15 0
Golden color 0 16Unpleasant smell 3 14
Bitter 7 16Fruity 11 33
No smell or aroma 0 21Not sweet 9 12
Not very intense 8 22Slightly sweet 12 14
Tart 11 7Tea 12 19
Unpleasant color 0 35Bad product 0 13Good flavour 3 24
Bad taste 18 41Based on tea 12 17
Flavoured drinks 3 15
Volvic Mint Tea Comparative condition
Monadic condition
Colored 11 0Golden color 0 22
Fruity 9 12Minty 13 72
Not very intense 5 20Other aftertaste 5 13
Other flavour 14 2Slightly sweet 6 21
Very sweet 11 3Bad product 0 11Good flavour 5 37
Nice smell 1 23Nice colour 2 27
Bad taste 14 26Chemical 5 16
Refreshing taste 12 30Flavoured drinks 4 14

Page 94
Regarding Honest Tea, six significant differences can be elicited for sensory properties:
Case 1: “slightly sweet”, “tart”,
Case 2: “cloudy”
Case 3: “colored”
Case 4: “golden color”, “no smell or aroma”
Regarding Volvic Mint Tea, five significant differences can be elicited:
Case 1: “other flavor”, “very sweet”
Case 2: “Minty”
Case 3: “colored”
Case 4: “golden color”
For comparative conditions, “strong”, “very”, “slightly” show that products are positioned on a
scale for each attribute. For monadic condition, subjects elicited more hedonic descriptors
(“good”, “nice”). The specificities of the product are also more frequently elicited: “minty”,
“cloudy” than for the comparative condition. For the comparative condition, descriptors that
are more frequently elicited are shared by the whole set of products.
For the overall range of products, descriptors are summed-up in Table 58. For all the samples,
the descriptors used in Cases 1 and 3 are different from the descriptors used in Cases 2 and 4.
Thus, the description used by consumers for the same product for both conditions is different.
Table 5: A summary of the descriptors most elicited and discriminating samples among the conditions (chi-square analysis at 5%)
8 Detailed analysis for the whole product range is in the appendix 3
Products Case 1 Case 3 Case 2 Case 4
WP1 “very sweet”, "other flavor" “colored” “no smell or aroma”, “not very intense”, “light smell”
WP31 “very sweet” “colored”, “flavoured” “too sweet”Tymbark “very sweet” “colored” "Bitter" "No smell or aroma"
P21 “very sweet” "Colored" "No smell or aroma"P31 “very sweet” "strange scent" "Flavoured"
Elisabethen Quelle Lime
"colored" "No smell or aroma"
Volvic Mint Tea "very sweet", "other flavour" "Colored" "minty " "Golden color"
Honest Tea "Slightly sweet", "tart" "Colored" "cloudy" "No smell or aroma", "golden color"
Elisabethen Quelle Rooibos
"Not sweet", "very sweet" "Colored" "Fruity"
Nestea "strong", "other flavour", "very sweet"
"colored" "transparency" "Golden color"
Little Miracles "very sweet", "strong" "colored" "cloudy"
Comparative condition Monadic condition

Page 95
The second conclusion that can be drawn on the assessment per product is that
the descriptions of the sensory perceptions between the two conditions are
significantly different.
The results show that product properties elicited by the subjects are different
depending on the context through the following assessments:
the configuration of the whole product range, nature and number of
sensory descriptors are significantly different between the two contexts of
presentation
for each product description related to sensory perceptions, there are
significant differences in nature between the two contexts of presentation.
Differences of cognitive expectations between conditions The results show that distribution of frequencies of elicitation of boards is different among
conditions for six products out of eleven (Table 6). Thus, for these six products, associations
with boards are different between comparative and monadic conditions: Elisabethen Quelle
Rooibos, Elisabethen Quelle Lime, Tymbark, Little Miracles, WP1 and P31.
Table 6: Comparison of distribution of boards’ frequencies between comparative and monadic conditions
Product χ² p-value Elisabethen Quelle Rooibos 13.612 0.034
Elisabethen Quelle Lime 16.384 0.012 Tymbark 13.635 0.034
Nestea 4.078 0.666 Volvic Mint Tea 7.230 0.300 Little Miracles 13.670 0.034
WP1 13.405 0.037 WP31 9.148 0.165
P31 17.957 0.006 P21 3.563 0.736
Honest Tea 6.951 0.325
The first conclusion for the results is therefore that for a majority of the samples distributions
of boards between conditions are not the same.
For each product, the frequencies of association with the boards are compared for both
conditions. Results are summed up in Table 69.
9 For detailed results of each product refer to the Appendix 4

Page 96
Table 7: Significant associations with situation of consumption for each product in the two conditions
Product Comparative
condition
Monadic condition Conclusion
Little Miracle Exotic Exotic / Family Slight difference
Nestea Exotic / Family Exotic/ Family No differences
Elisabethen Quelle
Rooibos
Physical Exotic Differences
Elisabethen Quelle
Lime
Physical No association Differences
Honest Tea Family/Nothing Family / Nothing No differences
Volvic Mint Tea On the go Energy Differences
Tymbark Physical/ Exotic On the go/ Exotic Slight differences
P21 Exotic Exotic / Family Slight differences
P31 Exotic No association Differences
WP1 Physical / Exotic No association Differences
WP31 Physical / Exotic Exotic Slight differences
Conclusions for each product are provided in the right-hand column of the table. Three cases
can be observed. Firstly, five products show a complete difference of associations with the
boards between conditions. This is the case for example of Volvic Mint Tea when it is associated
with On the go situation in a comparative condition and to the Energy situation in a monadic
condition. Regarding WP1, none of the boards are clearly associated with the product in a
monadic condition. In a comparative condition WP1 is associated with the Physical and Exotic
situations.
Secondly, four products show slight differences, i.e. only one board is common to both
conditions. This is the case for Little Miracles and P21 when associated with the Exotic
situation in both conditions, but also to the Family situation in a monadic condition. Tymbark
is associated with the Exotic situation in both conditions. In the comparative condition it is
also associated with the Physical situation and On the go situation in a monadic condition.
Thirdly, two products show no differences of associations between the conditions. Honest Tea
is associated with the Family situation in both conditions. Nestea is associated with Family and
Exotic situations in both conditions.

Page 97
Thus, for nine products out of eleven, the boards associated with them are different between
conditions.
The results show that cognitive expectations associated with the product are
different between conditions, i.e. contexts of presentations.
1.4. Main results
Study 2A allows us to conclude that:
The description of the products is different among conditions
Different cognitive expectations are associated with the products
depending on the context
The context described here as sensory diversity has thus an influence on
the sensory description and cognitive associations with the products.
These results give also insights on the influence of the categorization on
the association with concepts and product properties. Indeed, depending
on the ad-hoc category to which the product is associated, the product is
perceived differently by the subject as stated by literature in cognitive
psychology. Addressing then different ad-hoc categories by manipulating
the sensory environment of the product should then induce a difference of
sensory perception and then a difference in cognitive associations.
1.5. Methodological limits
Some methodological limitations due to the product range and the subjects can be
elicited. First, the high number of products (eleven) can induce a saturation effect especially in
a monadic case as the subject tastes the products one after the other. This effect can partly
explain the lack of consensus in the monadic condition. However, looking at the
configurations, consumers were able to find differences in the categorization task between
products. In monadic conditions, consumers were also able to associate different descriptors
between products. Another limitation relates to the order effect in the monadic condition. We
tested products in monadic sequential, thus there is a possible effect of bias from one product
to another. As the products were non familiar, the first product tasted can be seen as a warm-
up and thus influencing the perception of the following samples. Bias can be also be due to the
order of samples, as some samples that have more a intense fruit or tea flavor, can saturate in-

Page 98
mouth perception. However, this effect can also be induced in a comparative task as the
samples are also tasted one after the other by subjects (Lelièvre et al., 2008). Thus, this
limitation can’t explain the differences among conditions. Another limitation is that the
subjects from both conditions are different. This choice is made in the context of non-
familiarity of samples to avoid inducing possible bias from one session to another.
The difference among the two conditions is not only the diversity of sensory
information, but also the task given to the subjects. In comparative conditions, a categorization
task is asked of the participants inducing a description based on the whole set of products. In
the monadic condition, the product is assessed through a comparison with an internal referent
in the subjects’ minds, which is in line with conclusions provided by other studies focusing on
the comparison of the products’ assessment methodologies (Bech-Larsen and Nielsen, 1999;
Breivik and Supphellen, 2003). Based on the Perceptual Symbol System, attention is a crucial
process in perception for selectively extracting information that is stored in the subjects’
memory (Barsalou, 1999). Categorization in the sorting task is relative to the whole product
range and based on main shared criteria ranked in intensity, while in the monadic condition
only specific sensory features of the product are elicited. This can be explained by the fact that
the sorting task induces the focus of subjects’ attention on the shared criteria of the product
range, erasing in this way the main features that are product-specific. Therefore, the task has
an influence on the way subjects perceive the product by orienting their attention on specific
sensory modalities. However, the sorting task is not per se a bias, because if we had compared
both conditions using the same protocol, the same processes would have been followed by
consumers positioning the products to each other. Therefore, the addition a sorting task allows
a closer proximity to the reality of perception, namely the categorization task that determinates
the identification of the products and therefore the perception.
Additionally, the contextualization we chose to prime in the study relates to the brand
and the product range. The results show that subjects were able to associate with each product
or products group a situation of consumption. However, we have not induce directly a
variability of ad-hoc categorization because we do not contextualize on different contexts of
consumptions and compare the categorization in each case. Further study should integrate the
context of consumption as a variable to be compared, primed at the beginning of the study and
not as a final association to products.
The boards of cognitive associations are also a potential limitation of the study. We
chose to present the benefits related to each situation of consumption through collages made
by consumers. The objective is to avoid potential bias related to words and their interpretation
without contextual cues. However we have no guarantee that the boards were interpreted in

Page 99
the same way than in the pre-qualitative study. This is not per se an important bias as we
wanted to focus on the discrimination of the boards between products and not on their nature,
i.e the benefits associated to each of them. A pre-step in the study should have been added to
ensure that each board was differentiated from the other by the subjects.
The results have been analyzed taking into account the entire set of subjects. However,
differences can be noticed among products and conditions which are only slight. Moreover the
lack of consensus for two products on conceptual associations can be discussed as a high
individual variability of perception. Barsalou explains that concepts are based on sensory
modalities referring to previous experiences (Barsalou, 1999). Therefore, depending on the
previous experiences of the subjects, associations between percept and concept will be
different. Therefore, the differences of perception can induce differences in expectations
between subjects toward the same product. This observation will be the focus of the next study.
To sum-up, the following methodological limits are stated:
Some biases are related to the product range and the subjects panel:
saturation of in-mouth perception, order effect, two different
samples of consumers between conditions.
Attention of subjects is not focused on the same properties of the
product range due to the task in each condition.
Contextualization should integrate the context of consumption and
vary among conditions.
Boards of cognitive associations can be interpreted differently
between subjects
A lack of consensus between subjects due to an interindividual effect
on their perception.
3.1. New proposal of study based on insights
Objective of the study is to show that a difference of sensory perception due to a difference of
ad-hoc categorization has an influence on cognitive associations with the product.
As previously discussed we first want to avoid a potential bias due to the difference of tasks.
However the study needs to ensure having two conditions inducing two different perceptions.
Thus, selecting a sorting task allows having access to categories based on different product
properties.

Page 100
Secondly, only the brand and the product range were part of the contextualization in the
previous study. To ensure giving access to a diversity of ad-hoc categorization, the context of
consumption should be primed and the condition we want to compare.
The following methodology is proposed on the same product range with two different sets of
subjects. Two conditions of presentations of the products are tested to induce two different
sensory perceptions. These two conditions are a contextualization on two different situations
of consumption for each panel of subjects on the same product range.
First step : contextualization of the tasting
Second step: sorting task
Third step : free description of each group
Fourth step : association with boards of cognitive associations
By contextualizing on two different situations of consumption, we should induce two
different categorization of the product range, i.e two different sensory perceptions. The
results should then show a difference of categorization of the product range between the
two sets of subjects, a difference of sensory characteristics used to describe the product
range and to cluster the products, and then a difference of association with boards of
cognitive associations.
For this study the recruitment step should integrate a questionnaire on familiarity to have
the same target of consumers. In other words, we need to ensure that the subjects have no
previous experiences with the product range.
2. Study 2B: diversity of cognitive expectations induced by sensory perception between subjects
2.1. Research question

Page 101
The relation between cognitive expectations and sensory perception is shaped by ad-
hoc categories. Categorization is an individual process. The aim of the research is to
understand if the concepts representing ad-hoc categories induced by sensory perceptions are
variable among subjects based on a variability of categorization (Figure 21).
Figure 21: Research aims of studies 2A and 2B
Familiarity is a factor influencing perception through categorization. We aim also at
understanding if some aspects of the familiarity toward the product experience is related to a
variability of associations between sensory perceptions and cognitive expectations.
2.2. Methodology
Subjects 214 consumers are recruited using the following criteria10 : 50% of the consumers are
women with a partition of 50% between 20-35 y.o and 36-56 y.o. All the subjects are consumers
of the Zywiec Zdroj brand and non rejectors of tea, cold drinks and flavored waters.
Products The products are the same as for Study 2A.
Modality of presentation All the samples are served in plastic and transparent glasses of 12mL, under the Zywiec
Zdroj brand. All the products are presented in a comparative way, i.e. at the same time, in a
random order on the table.
Protocol The protocol is described in Study 2A for the comparative condition.
At the end of the study a step of characterization is added. The questionnaire11 provided
covers different themes related to familiarity:
10 Criteria used for recruitment are similar to the one used in the pre-study 11 Questionnaire is detailed in the appendix 5
Sensory perceptions Cognitive expectationsStudy 2A
Inter-individual approach
Global approach
Sensory perceptions Cognitive expectationsStudy 2B

Page 102
o Frequency of the consumption of flavored drinks, tea and soda.
o Distance to tea, a sociological index regrouping three axes: knowledge
(subjective and objective), implication and usages (Boussoco, 2015; Dany and
Abric, 2007) . This index takes into account the relation between one social
object (hereby the tea) and the subject.
o Familiarity with the brand focused on two aspects: loyalty and implication (Cho,
2011).
o Food Neophobia scale (Pliner and Hobden, 1992).
The questionnaire was back translated in Polish language.
Statistical analysis A diversity of categorization on product properties should induce a variability of
associations with cognitive expectations between subjects. In other words, clusters of subjects
obtained on sensory perceptions should make different associations between groups of
products and cognitive expectations.
Thus, to validate the hypothesis a two-fold assessment is made:
Checking that subjects have a significantly different way of categorizing the
same product range. Data from sorting is organized in an individual matrix of
dissimilarities. The matrix for each subject is a product x product matrix; with
zero when the two products are in the same group and 1 when not. The Adjusted
Rand Index (ARI) is calculated between two subjects and assess the proximity
between the two partitions, i.e the way each of the two subjects categorized the
product range (Faye et al., 2004; Hubert and Arabie, 1985). The index lies
between -1 and 1. For negative values, partitions are completely dissimilar. The
index equals to 1 when the two partitions are exactly the same. Next step is to
build an overall matrix subject*subject for which each cell corresponds to the
ARI between the two considered subjects. Then, a Hierarchical Ascendant
Classification (HAC) is done on the matrix in order to cluster consumers based
on their categorization of the product range. For each cluster, the same analysis
is performed. All the individual matrices for one cluster of subjects are added
together to give an aggregated matrix. A Multi-Dimensional Scaling (MDS) is
performed with XLStat 2014 on the aggregated matrix. Dimensions for the best
configuration of products are selected for a Kruskral’s stress inferior to 0.05
(Faye et al., 2004). A comparison between the configurations of the clusters of

Page 103
subjects is made with adjusted RV coefficient (Escoufier, 1973; Faye et al.,
2004) and assessed as similar to a RV above 0.7. This criterion allows checking
that the categorization between the clusters of subjects in order to validate the
hypothesis, descriptors associated with the same product between clusters of
subjects should be different. To analyze data provided by the description, a
matrix of products*descriptors is displayed. For each subject, a correlation
coefficient is calculated between the coordinates of each sample on the mapping
and the descriptors associated with it. We assume that synonyms close on the
mapping describing the same group of products have the same signification. We
only select descriptors elicited by more than 10% of the subjects for each cluster
(Faye et al., 2004). A projection on the mapping of the verbatim allows us to
associate samples to specific descriptors and boards.
Demonstrating that for each cluster, associations between the product and the
board of cognitive expectations are different. The same analysis is made as the
one for the descriptors. The hypothesis is validated if the same product is
associated with different boards among clusters of subjects. In addition for each
product a matrix clusters*boards was displayed. Each cell corresponded to the
number of subjects of each cluster associating the product with the
corresponding board. A F Fisher’s test was run on each matrix. The hypothesis
is validated if the p-value is significant for a majority of samples.
Additional analysis is made to explore the relation between familiarity
characterization of consumers and variability of perception. An ANOVA on
familiarity items to test significant differences between clusters of consumers is
applied.
2.3. Results
Variability of categorization on sensory perceptions between subjects Four different categorizations are provided by the clusterisation of consumers on the
ARI matrix (Figure 22). Analyses provided by ARV coefficients cannot conclude that there is a
similarity between the configurations of clusters expect for the comparison between the whole
set and clusters 1, 3 and 4 (Table 8).

Page 104
Table 8: Table of ARV coefficients
ARV coefficients
Cluster 1
Cluster 2
Cluster 3
Cluster 4 Global
Cluster 1 1.00 Cluster 2 0.37 1.00 Cluster 3 0.58 0.44 1.00 Cluster 4 0.48 0.37 0.59 1.00
Global 0.76 0.61 0.74 0.79 1.00

Page 105
Figure 22: Mapping obtained with MDS and projection of sensory descriptors for the four clusters
The numbers of groups are not the same among clusters of consumers. For clusters 1, 2 and 3,
three groups of products are obtained and for the cluster 4, five groups. Thus, the
discrimination of the sample range among the clusters of subjects is not the same.
The nature of association between samples is also different depending on the cluster of
consumers. Most of the products are not grouped with the same samples by the four clusters
of consumers except for P2-1 with P3-1, and WP3-1 with WP2-1.
Regarding the sensory characteristics elicited by subjects to describe groups of products, the
numbers of sensory descriptors are higher after clustering the set of subjects. This result
highlights a higher consensus among subjects. Indeed, we only kept the descriptors that are
close to each other on the mapping and elicited by more than 10% of the subjects. The sensory
descriptors most frequently stated by the clusters are: sweetness intensity, fruity intensity, tea
intensity and color. Nevertheless, associations between the sensory descriptors and the
products differ depending on the clusters of subjects.
Sensory descriptor cannot be elicited by the subjects to describe the product. For example,
clusters 1 and 2 describe Elisabethen Quelle Rooibos as “Low sweetness” or “Slightly sweet”,
and clusters 3 and 4 do not use sweetness to describe the product. The same results are

Page 106
observed for Elisabethen Quelle Lime described as low sweet by cluster 1 or slightly sweet by
clusters 2 and 3, while cluster 4 does not use sweetness to differentiate the product. This is also
the case regarding specific aroma as minty is associated with Volvic by clusters 3 and 4, but not
by clusters 1 and 2; and tea aroma is used by clusters 2, 3 and 4, but not by cluster 1. The second
case relates to the use of the same descriptor to differentiate the products, but not with the
same intensity. For example, WP3-1 and WP1 are described as highly sweet by cluster 1 and as
not very sweet by cluster 3.
Thus, results allow us to conclude that a variability of categorization on sensory
perceptions exists between subjects highlighted through:
the non-similarity of configurations between clusters of consumers
the number and nature of groups of products different between clusters
the variability of associations between sensory descriptors and products.
Variability between subjects of cognitive expectations The results provided by the Fischer F test show that for X products the p-value is
significant. Thus, distribution of boards among clusters is different for X products. Comparison
between the results obtained with the whole set of subjects and after clustering show a highest
consensus in association between groups of products and boards (Figure 23).
Figure 23: Mapping obtained with MDS and projection of associated boards for clusters of subjects

Page 107
For the whole set of subjects, only two different boards of expectations are associated with the
product range. Clusters 1, 2 and 3 associate four different boards with the groups of products.
Looking at cluster 4, all the boards are associated with the product range. Thus, the
clusterisation of the subjects based on the categorization on sensory perceptions, induces a
higher consensus among the subjects in the association between cognitive expectations and
the products and a better discrimination of the products among the boards.
A variability of association between products and boards of expectations is observed. For
example :
Volvic and Elisabethen Quelle Rooibos are associated with the energy situation and the
family context for cluster 4, while for cluster 1 they are associated with physical
activities, and with the family context for cluster 3.
Tymbark is associated with the exotic situation by cluster 4, with the energy and exotic
situations by cluster 3, with the exotic and on the go situations by cluster 1, and with
the physical activities and on the go situations by cluster 2.
Little Miracles is associated with the exotic situation by all the clusters, to energy
situation by clusters 3 and 4 and family situation by cluster 2.
Except for Nestea, which has the same association with the exotic situation whatever the
cluster, all the samples have different associations with the boards among clusters.
Therefore, we can conclude that a variability of associations exists between
groups of products, i.e. the categorization and cognitive expectations between
subjects.
Characterization of clusters of subjects on familiarity The results on familiarity allow differentiating clusters of consumers regarding their familiarity to the products (Table 9).
Table 9: items significantly differentiating clusters of consumers (10%)
Clusters Mean p-value
Implication for tea C1 8.371
0.088 C3 7.629
Objective Knowledge about tea
C2 5.868 0.083
C3 6.418 C4 5.787 0.050
Perceived Knowledge about tea
C1 6.790
C2 5.967 0.069 C3 5.916 0.053 C4 5.846 0.044
000

Page 108
Reading books on tea C3 0.259 C4 0.583 0.069
Shopping C2 2.219 C4 2.583 0.014
Cluster 1 has the highest significant scores for the Implication for tea and the Perceived
Knowledge about tea. Regarding Objective Knowledge about tea, cluster 3 has a significantly
higher score than clusters 2 and 4. On usage, cluster 4 read more on tea and did more shopping
than clusters 3 and 2.
These results lead to conclude that there is a relation between ad-hoc
categorization and familiarity of subjects. In other words, relation between
cognitive expectations and sensory perceptions is correlated with the different
aspects of familiarity such as knowledge, implication or usage.
2.4. Main conclusions
The results highlights that there is a variability between subjects of the relation
between sensory perceptions and cognitive expectations:
subjects categorize the same product range differently, using different
natures of sensory descriptors
cognitive expectations associated with the groups of products are different
between clusters of subjects.
Furthermore, familiarity of consumers regarding the product range is correlated
to the relation between sensory perceptions and cognitive expectations.
2.5. Methodological limits
This study is designed to demonstrate that sensory perceptions induce the activation of
concepts through the categorization process in a food context. Ad-hoc categories as defined by
Barsalou relate to a goal, in this case the situation of consumption (Barsalou, 1983).
Contextualization in the study is the brand and the definition of the product “cold tea”. The

Page 109
situation of consumption is then not explicitly given to the subjects, but associated with it after
the categorization task; this then allows a conclusion to be drawn on the induction of cognitive
expectations from sensory perceptions. These results then give access to various ad-hoc
categories relating to a group of products with a specific pattern of sensory information within
the situation of consumption.
The sorting task is a methodology frequently used in cognitive psychology to
understand the categories in the mind of subjects. A limitation of this protocol is that the
categorization task is dependent on the range of products. The association between sensory
perceptions and cognitive expectations could have been different if one or more product
owning a specific sensory criterion had been added. This is why a preliminary qualitative study
is needed to define the product range and understand which main sensory modalities should
be explored and are activated in the mind of the subjects.
Regarding the statistical analysis, some limitations can be explicated. The results are
provided through analysis in line with previous research on inter-individual studies in sorting
tasks (Faye et al., 2013; Lelièvre, 2010). However, we provide results partly on a qualitative
analysis of associations between groups of products and associations with boards. Further
quantitative analysis could be made by better defining the statistical criteria highlighting the
significant differences of associations between one product and several boards among clusters
of subjects.
Familiarity is correlated to the difference of perception and then to the difference of
expectations. It could be interesting to cluster people among familiarity and then highlight a
difference of perception and then expectations. Indeed, Faye has proven that the level of
expertise, meaning the level of knowledge on the product, can influence the way the product
range is categorized. The nature and graded structure of category can be different among
different levels of knowledge. In the same way, the implication of the brand and the cognitive
associations to it, are different among subjects and therefore can influence expectations toward
a product. Therefore, a complementary study, following the same procedures, could show the
effect of familiarity on expectations by recruiting subjects with a different level of familiarity
(for the brand, the product, or the category).
To sum-up, the following methodological statements are made:
Contextualization made in consumers tests should integrate the
definition of the product category
A limit relates to the product range defining the sensory perceptions
taken into account by the subjects.

Page 110
Improvement on statistical analysis could be made to build a
stronger statistical criteria highlighting differences between
clusters of consumers.
A complementary study is needed to show the effect of familiarity
on expectations of consumers.
3. Discussion
The studies presented in this chapter are focused on the perception of a non-familiar
product range. In this case, that the relation between sensory perceptions and concepts is not
deducted from previous experiences with the product. The results showed that subjects are
able to make associations with concepts even with products they had never tasted. Identifying
a new product is thus associating it to an existent category in the mind and inferencing
associations with the properties of this category. Ad-hoc categories are built on shared
properties answering to a specific goal, thus not necessarily structural properties (Barsalou,
1983). In the case of new products, understanding how subjects make these associations is not
demonstrated through our studies. However, some research directions can be discussed.
Results provided by Study 2A showed that for some products there is no discrepancy of
association among conditions. They keep the same cognitive expectations independently of the
conditions and therefore of the pattern of sensory modalities. These results could be discussed
in relation to the prototypical theory of categorization (Reed, 1972; Smith et al., 1988). The
sensory features of the referent prototype could be associated with all the members of the
category. Products that are more representative of the category tend to have the same
conceptual expectations whatever the conditions, because the pattern of sensory modalities
taken into account by the subject remains the same. This strongly correlates to results
demonstrating that helping the subject identifying a new stimulus based on sensory properties
induces a better acceptance : indicating “tastes like food X” (Pelchat and Pliner, 1995),
providing information on the sensory characteristics and resemblance with familiar food
(Tuorila et al., 1998) or information on a familiar process of fabrication (Deegan et al., 2015).
Thus, giving sensory information on a new product should help subjects categorizing it and
inferencing cognitive associations. Providing shared properties between the new product and
the most typical example of the category, induces a higher adhesion of the new product to the
category (Ladwein, 1995).
Considering that food products are perceived as members of ad-hoc categories structured
among the situation of consumption, thus sensory characteristics are not the only information

Page 111
helping the subject categorizing the product. Indeed, product properties are less discriminative
than cognitive associations (Masson et al., 2009). Thus, information on the proper use of
context enhances hedonic responses to novel food (Cardello et al., 1985) and could help the
subject inferencing ad-hoc categories. Furthermore visual criteria, such as the color or the
transparency of the products, are also strongly connected to other sensory modalities. Indeed,
perception is cross-modal, thus these visual aspects can induce specific expectations for the
subjects (Driver and Spence, 2000; Karjalainen, 2007; Schifferstein et al., 2013), and thus
induce a way of categorization.
Results of Study 2B showed that associations between cognitive expectations and sensory
perceptions are different among subjects. Thus, factors helping the categorizing of a novel food
are dependent of the subjects. A further research direction could be then more focused on the
influence of the familiarity of the subjects on the categorization of the novel food. Indeed,
factors taken into account in the familiarity scores relate not only to specific ingredients of the
product (such as the tea), but also to context (drinking it cold), or to the brand. Depending on
subjects, some factors weigh more strongly than others, and are then translated into key
product properties that the novel food should have in order to be included as a member of a
particular category. Indeed, a subject that is more familiar with tea drinks can be assumed to
make associations of this novel drink based on tea, with previous experiences of tea drinks.
This variability is also verified with the familiarity with the brand. Depending on the
importance of the brand for the subject and the cognitive expectations associated with it, the
attention of the subjects will be focused on different product properties. Giving the name of
the brand (as we did in the study) induced an ad-hoc categorization taking into account
properties related to the brand (Wänke et al., 1998b). Product affordance should then integrate
a brand-sign properties, i.e. specific sensory characteristics associated with the brand
(Kreuzbauer and Malter, 2007)
Finally, it is worth noting that in the framework of Grounded Cognition, experiences with novel
foods induce a change in associations between sensory perceptions and cognitive expectations.
This is already used in brand extension. Adding a novel object as a member of the category
related to the brand could thus change some of the sensory characteristics shared by the
members (Kreuzbauer and Malter, 2005). This is the case with Zywiec Zdroj brand launching
a new product based on tea. This new product has to keep the “signature” of the brand and will
also change the category of brands related to the brand.

Page 112
A main conclusion of the chapter is that contextual information, hereby sensory
diversity and brand, induce different relationship between sensory perceptions
and cognitive expectations among subjects.
The next steps of the studies are focused on the influence of a cognitive dissonance based on a
difference of categorization to define expectations and perception of the product. Depending
on the properties of the category retrieved during expectations that do not fit with the tasted
product, the affective judgment of the subjects could be different.

Page 113
Chapter 6: Influence of sensory disconfirmation of
expectations on affective judgment
-The case of a familiar product range-

Page 114
Introduction
The aim of this chapter is to study the influence of a disconfirmation of expectations on
affective judgment. As concepts are directly related to sensory patterns of information, the
research will be focused on sensory disconfirmation of expectations. We aim at better
understand the interactions between expectations, perception and affective judgment. In other
words how the nature of the discrepancy between categories activated during the perceptive
process can influence affective judgment at an individual level.
Figure 24 : Research scheme of chapter 6
This part of the research is using an industrial project aiming at selecting the product
sample fitting the best with the positioning of Actimel brand. In other words, the situation of
consumption associated with Actimel brand has changed. The objective of the project is to
propose the prototype with product properties that are fitting the best with the new benefits
carried by the brand. The consumer test is made in Germany and limited in number of subjects
due to business constrains.
Three research questions are defined in order to understand which affective items are
induced by a sensory disconfirmation of expectations, and the variability of these items
depending on the nature and the level of sensory disconfirmation of expectations taking into
account the familiarity of subjects.
Expectations are related to ad-hoc categories as previously seen in Chapter 4. However, in
food science, sensory disconfirmations of expectations are mainly studied through the
influence of external information on the sensory perceptions of the product. We aim therefore
at highlighting the relation between ad-hoc categories retrieved during perception and sensory
disconfirmation of expectations. Thus, the question is to understand the link between a
discrepancy of ad-hoc categories retrieved during food perception and a sensory
disconfirmation of expectations. This question is explored in Study 3A.
Ad-hoc categories relate to strong associations between sensory perceptions and cognitive
expectations inherent to subjects as previously concluded in Chapter 5. As sensory
ContextMotivation
Manipulated
Ad-hoc categories
Sensoryexpectations/perceptions
Cognitive expectations / associations
Measured Measured
Affective judgments
Situation of consumption
Brand
Verbatims
Boards of pictures
Overall likingSurprise
Affective states

Page 115
disconfirmation of expectations should relate to a discrepancy of ad-hoc categories retrieved
during perception, thus depending on the nature of the properties, affective judgment induced
should differ. Therefore, how do the nature and the degree of sensory disconfirmation of
expectations influence affective states? This question is explored in Study 3B.
1. Study 3A: understanding the link between ad-hoc categories and sensory disconfirmation of expectations
1.1. Research question
The purpose of the study is to dig more into the link between categories activated before
consumption, or namely expectations and sensory disconfirmation of expectations. We aim to
show that activating a concept can therefore create a sensory disconfirmation of expectations
without explicitly priming on sensory specific characteristics.
The research hypothesis is: as long as a concept is translated into sensory
perception related to the category, activating a concept can induce a sensory
disconfirmation of expectations.
1.2. Methodology
Procedure The procedure is a two-steps methodology (Figure 25).
Figure 25: Procedure in two steps. Before consumption / After consumption
The first step is dedicated to activating the ad-hoc category around the concept “drinkable
yoghurt” with a first assessment based only on conceptual expectations. Subjects are asked to
think about drinkable yoghurt that they take from the refrigerator and answer to the following
questions while thinking about this product. Then subjects are asked to state the first words
that come to mind while they are thinking about the product. Then they assess the overall liking

Page 116
and three global sensory modalities: texture, sweetness, and creaminess on a 9 points scale
(Cardello and Sawyer, 1992; Tuorila et al., 1998). The last questions required the subject to tick
answers on the context of consumption (moment and location) of the “drinkable yoghurt”.
The second step begins by a blind tasting of a plain Actimel i.e. without telling the participants
the brand, i.e. in a plastic glass. Following this tasting, subjects give the first words that spring
to mind, and then assess the product using the same questions as the first step on a 9 points
scale. After assessing the overall liking, subjects state the positive and negative characteristics
of the product. The last question is an assessment of how the product fits expectations on a 7-
pts scale.
This procedure is conducted in hall
Subjects We used a convenience sample of adults (more than 18 years old). A questionnaire was
provided at the end of the test to get information on the consumers. 40 subjects took the test:
15 men and 25 women. It was found that 50% of them used to drink drinkable yoghurt less
than once a month. 20% of them had never drunk it and12% of them consumed drinking
yoghurt it more than once a week. Out of all of those who consumed drinking yoghurt, half of
them consumed the brand YOP and only 15 % of them consumed Actimel.
Product We decided to choose Actimel as a non-fitting product within the category “drinkable
yoghurt”. Previous market research by DANONE has shown Actimel is less thick than drinking
yoghurts. Therefore, by selecting Actimel, we should induce a sensory disconfirmation of
expectations.
Statistical analysis To validate the hypothesis we need to ensure having:
a disconfirmation of expectations through: calculation of the mean score of fitting to
expectations below 4 (average score) and a delta of overall liking that is significantly
different from zero between concept and percept conditions.
a disconfirmation of sensory properties indicated by a delta of at least one of the
sensory characteristics being significantly different from zero between concept and
percept conditions.
To compare the two conditions, before and after consumption, a t-test at 5% is run for the
liking, the texture, the sweetness and the creaminess.

Page 117
To confirm the results of sensory disconfirmation of expectations, analyses are provided on the
reasons of dislike, and spontaneous elicitations of words through a qualitative observation.
CATA questions are defined as manipulation checks, only provided to ensure the activation of
the concept for the respondents.
1.3. Results
Disconfirmation of expectations? First results are provided by the analysis of the overall liking score and the fitting to
expectations (Table 10).
Table 10: Description of the assessment of the three items OL before (concept) and after consumption (tasting) and fitting to expectations
Variable Mean Standard deviation
Overall liking concept 6.7 1.5
Overall liking tasting 5.0 2.0
Fitting to expectations 3.7 1.8
The analysis of fitting to expectations shows a disconfirmation of expectations with a
low score for this item. Furthermore, looking at the assessment of the overall liking, the
difference between the two scores is about 1.7 less. A t-test run on the data highlights a
significant difference between the quotations (p-value < 0.001). The overall liking assessed
after tasting is lower than the overall liking assessed before. Therefore the valence of the
discrepancy is negative because the expected product is better assessed than the actual one.
Thus, the results show that the tasting of Actimel induces a negative
disconfirmation of expectations when activating expectations relating to a
drinkable yoghurt.
Sensory disconfirmation of expectations? The analyses of the three items related to sensory characteristics provide the nature of the
disconfirmation (Table 11).
Table 11: Description of the assessment of the three sensory items before (concept) and after consumption (tasting)
Variable Mean Standard deviation
* p<0.001

Page 118
Texture concept 4.8 1.9
Texture tasting 2.9 1.8
Sweetness concept 5.2 2.2
Sweetness tasting 6.0 1.8
Creaminess concept 4.6 2.1
Creaminess tasting 4.4 2.2
Of the three sensory items assessed by the subjects only one highlights a significant
difference between expected (concept) and actual (tasting) assessments (p-value<0.001). The
texture is assessed as significantly more liquid after consumption. This result shows then, that
the expected texture is thicker than the texture perceived during the tasting. Therefore, this is
a sensory disconfirmation of expectations. These results are enhanced by the analyses of the
verbatim provided spontaneously before and after tasting and by the reasons given for dislikes
(Figure 26).
1
* p<0.001

Page 119
Figure 26: 1/ Frequency of elicitation of verbatim before (concept) and after (tasting) consumption (elicited by more than 5% of the subjects)
2/ Frequency of elicitation of dislikes (elicited by more than 5% of the subjects)
The analysis of the Figure 24:1 focused on the verbatim provided spontaneously by
consumers showing that the expected product was mainly described as fresh, soft and smooth.
Regarding the tasted product, spontaneous verbatim provided was fresh, liquid, sweet and
milky. Therefore the spontaneous verbatim for the tasting part is focused on the product
properties that are not congruent with properties expected relating to “drinkable yoghurt”.
This is aligned with the analysis of the dislikes. The highest frequency of elicitation is “too
liquid” followed by “too sweet”.
Therefore, we induce a sensory disconfirmation of expectations mainly
due to a lack of texture.
1.4. Main conclusions
To sum-up, activating a category in the mind of subjects through a specific
concept (here “drinkable yoghurts”) induces sensory expectations. Incongruency
between the ad-hoc categories activated before and after consumption induces a
sensory disconfirmation of expectations.
2. Study 3B: Influence of a sensory disconfirmation of expectations on affective judgments
2.1. Research question
Sensory disconfirmation of expectations relates to the activation of discrepant properties
relating to ad-hoc categories during the perceptive process. The aim of the study is to
understand the influence of the nature and the degree of the sensory
2

Page 120
disconfirmation of expectations on the affective judgments of consumers. In other
words we aim at studying the role of the relation between cognitive and sensory expectations
on the affective judgments of consumers.
Several hypotheses underlay this objective:
H1: Affective states induced by a sensory disconfirmation of expectations are different among
subjects because of an inter-individual variability of categorization.
H2: Affective states are dependent on the degree of sensory disconfirmation of expectations.
In other words, affective judgment is different depending on the level of discrepancy between
ad-hoc categories activated at the beginning and during perception.
H3: Affective states are dependent of the nature of the sensory disconfirmation of expectations,
and more precisely the relation between cognitive associations and sensory perceptions of ad-
hoc categories activated during perception.
H4: Affective states induced by a sensory disconfirmation of expectations are related to the
familiarity of consumers.
2.2. Methodology
Protocole The following procedure is followed by participants (Figure 27):
Contextualization step: the purpose is to help the subjects to define expectations, i.e.
ad-hoc category, relating to a given situation of consumption: “Now, think about an
occasion, when you are eating your breakfast, in the morning and you want a drink
that makes you feel stronger, that is better for your immune system and makes you
feel better prepared to get through your day. Think clearly about what you were
experiencing during this occasion. Now describe this experience in detail. Please take
your time and provide a description that is as complete as possible”. The task is carried
out on a sheet of paper in order to improve contextualization through the writing.
Details are provided by consumers about the circumstances, the reason why and how
they consume the product, and the sensations, i.e. the properties the ad-hoc category
activated. Once they finish the task, subjects are informed that they will taste several
versions of a strawberry Actimel.
Once they have tasted the product, they are given a questionnaire about the product on
a computer. The questionnaire has two steps:

Page 121
o Affective states are first assessed following the decision-making process of the
subjects as closely as possible: from the most spontaneous to the least.
Consumers start by filling in the questionnaire which is the list from the
qualitative study. The list of affective states was double-checked based on
results provided by the literature (Ludden et al., 2007, 2012b). Each item was
assessed on a 7-points scale in a random order; this is followed by the
assessment of the fit to their expectations on a 7-points scale and their overall
liking on a 10-points scale.
o The properties of the disconfirmation are then assessed (diagnosis part). This
part is dedicated to highlighting the nature of the sensory disconfirmation of
expectations, i.e. properties that are inconsistent:
Open question on sensations perceived: “Imagine that you are
experiencing the experience you have described earlier, write why you
like or dislike drinking this product”. Open questions avoid steering the
attention of consumers towards specific sensations from one product to
another; open questions also improve the spontaneity of the answers by
only eliciting sensations related to the disconfirmation. Relating the
questions to the overall liking makes it easier for a consumer to
understand them.
Assessment of the cognitive expectations (benefits and the context of
consumption). Six boards of pictures, based on a previous qualitative
study focused on the context, are presented to the participants. The
match with each of the six boards is assessed on a 5-points scale. An
assessment of the matching different moments of consumption for
customers is carried out by a Check-All-That-Apply methodology.
Finally a questionnaire on the familiarity of the subjects with the product range and the
brand is given12. Several items were assessed:
o Frequency of consumption of strawberry Actimel
o Implication related to food healthiness (Gomez, 2009).
o Distance to probiotics, a sociological index regrouping three axes: knowledge
(subjective and objective), implication and usages (Boussoco, 2015; Dany and
Abric, 2007).
o Knowledge and implication of Actimel product.
o Familiarity with the brand focused on two aspects: loyalty and implication (Cho,
2011).
12 Detailed questionnaire is provided on Appendix 7

Page 122
Figure 27: Procedure of assessment (repeated for the 4 samples)
Subjects 114 subjects were recruited in Germany based on criteria defined by the marketing team.
Targeted consumers are characterized as 80% of women from 25 – 60 years old, heavy users
of strawberry Actimel (at least once every two weeks) for breakfast. All the consumers were
recruited because they believe consuming Actimel helps to strengthen immunity or increase
vitality.
Products Four products are presented (Table 12) and designed to obtain different degrees of sensory
disconfirmation, by modifying sensory properties of the product. Based on a previous
qualitative study with heavy users of Actimel, sensory guidelines have been elicited by
consumers ensuring the fit of the product with the following benefit “Feel strong and prepared
for the day”.

Page 123
Table 12: Description of products
Hypothesized fit with
expectations
Sensory properties ensuring
disconfirmation
Product
High degree of
disconfirmation
(Contrast)
Thicker YOP
Light degree of
disconfirmation
(Assimilation)
More watery
Warm notes
1/3 Yakult
2/3 Strawberry Actimel
Light degree of
disconfirmation
(Assimilation)
More watery
Too sweet
Strawberry Actimel
Confirmation ½ Strawberry Actimel
½ Plain Actimel
Assessment of cognitive expectations Cognitive expectations are proposed through six boards of pictures (Figure 28). These
boards are based on collages made by consumers during a previous qualitative study. Starting
from “Feel strong and prepared for the day”, subjects expressed four different benefits and
made collages to illustrate each of them.
a b
c d

Page 124
Figure 28: Boards of pictures illustrating each of the four benefits fitting with the motivation « Feel strong and prepared for the day » and the context of the morning breakfast.
The four different benefits are the following:
“I start to feel energized in my body and mind” (a) :
“I feel mentally supported and protected in my body” (b) :
“I’m conscious of myself in the present time” (c):
“I’m physically and mentally ready for the day” (d) :
Each of the boards is completed with a sentence elicited from subjects taken from the
qualitative study in order to complete the interpretation of pictures. Indeed the benefits primed
for each of the boards are quite close and therefore complete pictures with a sentence ensure a
better understanding by the consumers.
Two other boards are added as false negative (Figure 29).
Figure 29: Boards of pictures illustrating two false negative benefits
The two false boards are the following:
“I feel energized and ready to party with friends” (a): this benefit is not congruent with
the brand Actimel, so must not be matched with any of the products.
“I’m ready for physical activity” (b): this benefit fits with Actimel, but not with the
motivation and the context primed at the beginning of the test. Therefore, this board
does not fit with any of the products confirming expectations.
Boards are presented to consumers in a balanced order.
Statistical analysis H1: To validate the first hypothesis of research, we need to ensure we have different
clusters of consumers among fitting to expectations. More precisely, we need having:
a difference of ranking of products among the three items: fit with expectations,
surprise, and overall liking between clusters
a b

Page 125
a significant difference of scoring between clusters on the three items assessing a
disconfirmation of expectations : fit with expectations, surprise, and overall liking.
In other words, the effect of cluster*product in the ANOVA should be significant for
these three items at 10%.
The following statistical analyses are run: CAH on fitting with expectations, and an ANOVA
including product*cluster effect. For each cluster, an ANOVA with a Bonferroni test at 10% is
run on every affective item to test significant differences among products.
H2: To validate the second hypothesis of the research, we need to ensure that for each
cluster of consumers, depending on the level of fit, the affective states induced are different.
Action standards are as follows:
Between clusters, ranking of products among affective states are different
For each cluster perceiving a disconfirmation of expectations, at least one of the
affective items shows a significant difference between products at 10%.
The following statistical analyses are run: for each cluster, an ANOVA with a Bonferroni
test at 10% is run on every affective state to test significant differences among products.
H3: To validate the third hypothesis of research, we need to ensure that relations between
cognitive and sensory expectations inducing affective judgment are different among clusters of
consumers. Action standards are as follows:
Between clusters, sensory descriptors elicited are different
For each cluster perceiving a disconfirmation of expectations, at least one sensory
property is more mentioned for the disconfirmant product.
Between clusters, either on benefit or on context, the significant differences are
similar to the ranking among the fit to expectations.
The following statistical analyses are run for each cluster of consumers:
an analysis on frequencies of elicitation per product of sensory items
an ANOVA with a Bonferroni test at 10% on each board of benefits to test
significant differences among products
a Cochran Q analysis to check significant differences of association with context of
consumption among products.
H4: To validate the fourth hypothesis on the familiarity, we need to ensure having
significant differences on at least one score of a familiarity item between clusters of consumers
at 10%.

Page 126
The following statistical analyses are run: an ANOVA on familiarity items to test significant
differences between clusters of consumers.
2.3. Results
Is there a consensus on perceived disconfirmation of expectations (H1)? Based on fitting with expectations, CAH shows three clusters of subjects (Table 13).
Table 13: Number of subjects per cluster obtained with HAC
Cluster 1 N = 43 subjects
Cluster 2 N= 39 subjects
Cluster 3 N= 30 subjects
The first analysis is provided per clusters of subjects and focused on the fitting with
expectations, the level of surprise and the overall liking. These three items allow identifying a
disconfirmation of expectations, assessing the degree of disconfirmation and understanding
the valence of the disconfirmation.
The three clusters of subjects show differences in the assessment of products of fitting with
expectations (Figure 30).

Page 127
Figure 30: Means of assessment of fitting with expectations for each product for each cluster. Letters in bold show significant differences among products at α = 10%
For cluster 1, there is a significant difference of scoring between the standard and the YOP. The
standard fits the best with the combination of standard and plain. The product that fits the
least is YOP. Cluster 1 almost follows the hypothesis proposed for the products.
For cluster 2, the mix with Yakult scores significantly higher than the standard and the mix
with plain. The combination of Yakult and YOP fits the best with their expectations. The
standard and the mix with the plain fit the least well with the expectations.
For cluster 3, there are significant differences of scores between YOP, the group standard and
the mix with standard, and the mix with Yakult. YOP is the product fitting the best with
expectations and the mix with Yakult fits the least well.
Thus, ranking of products on “fitting with expectations” is different among the
three clusters showing a difference of disconfirmation perceived between
subjects.
Regarding the results provides by the ANOVA, the effect of a cluster*product is significant with
a p-value<2e-16. Thus, the assessment scale is not the same among clusters. For clusters 1 and
3, the product fitting the least well is assessed at around 3 on a 7-points scale, and the product
fitting the best is assessed at around 6. There is a clear difference of 3 points between the first
and the last products. For cluster 2, the discrimination between samples is lower. Indeed, the
last product has been assessed at around 5 and the first at around 6.2 meaning a difference of
1.2 points.
Thus, the three clusters are not equally discriminant, as the scoring of the
products on the fit to expectations is significantly different among clusters.
The second analysis focuses on the “surprise” item that reveals a disconfirmation of the
expectations (Figure 31).

Page 128
Figure 31: Means of assessment of surprise for each product for each cluster. Letters in bold show significant differences among products at α = 10%
Only cluster 1 discriminates between the products on the surprise: YOP has a significantly
higher score than the standard. YOP has the highest number of quotations on surprise and fits
the least well with expectations. The standard fits the best with expectations and has the lowest
number of quotations on surprise. For cluster 1, the assessment of surprise has a ranking that
is opposite to the fitting with expectations.
For the other clusters, this correlation is not the same. The product that fits the best with
expectations is not always the one with the lower quotation on surprise. Furthermore, the
assessment of the item is quite similar among clusters regarding the effect product*cluster of
the ANOVA (p-value=0.743).
Thus, ranking of products on surprise are almost the same between clusters.
Differences are only significant for cluster 1. There are no significant differences
of scoring between clusters.
The third step of the analysis is focused on the overall liking to understand the valence of the
disconfirmation (Figure 32).

Page 129
Figure 32: Means of assessment of overall liking for each product for each cluster. Letters in bold show significant differences among products at α = 10%
Looking at the results, the ranking of products for overall liking is the same as fitting to
expectations. Therefore for each cluster of consumers, the product fitting the best with the
expectations has the highest overall liking. The product having the lowest quotation on fitting
to expectations has the lowest liking. Effect of the product*cluster factor is significant for the
ANOVA (p-value < 2e-16).
Thus we can validate both action standards as well for overall liking.
We can validate H1 and conclude an individual perception of adequacy to
expectations. From a set of subjects recruited with specific characteristics related
to gender, age and use of standard Actimel, different clusters can be obtained
based on the fitting to expectations. The first study highlighted individual
differences of perception and therefore adequacy between expectations and
perception of products. Three profiles of consumers can be described:
• Cluster 1: consumers discriminating all the product range
• Cluster 2: consumers that are low discriminators
• Cluster 3: consumers discriminating one product through a strategy
of contrast, namely rejecting this product as completely
disconfirming expectations
Is the affective judgment influenced by the degree of disconfirmation (H2)? An analysis of the affective items will be made for each cluster, as the ranking of products is
different depending on the cluster of subjects.
Looking at the results provided by cluster 1, all the items show significant differences of
assessment among products (Figure 33).

Page 130
Figure 33: Means of assessment of affective items for each product for cluster 1. Letters in bold show significant differences among products at α = 10%
For positive items (serenity, satisfaction, pleasure), the ranking of products is the same as
fitting to expectations. For negative items, the ranking of products is reversed. Regarding
serenity assessment, two significant different groups of products are formed separating YOP
from the rest of the group. Regarding satisfaction and pleasure, three significant, distinct
groups are made separating YOP from the mix with Yakult, from the standard and the mix with

Page 131
plain. Thus, among the three positive items, satisfaction and pleasure are more discriminative
than serenity when it comes to the number of significant different groups.
Looking at the results obtained on the four negative items, they present three different cases.
Regarding frustration, three significant, distinct groups are made separating YOP (the higher
score) from the mix with Yakult, from the standard and the mix with plain (lower score).
Regarding deception and confusion, there are only significant differences between YOP with
the highest score (YOP) and the rest of the group having the lowest score. Regarding
perturbation, YOP and the mix with Yakult have a significantly higher quotation than the rest
of the product range.
Looking at the last item, it differentiates significantly three groups of product: YOP and the
mix with Yakult having the highest score and being not differentiated.
Thus, for cluster 1, all affective states allow discriminating samples, but not at the
same level. Some of the items discriminate only a high disconfirmation as
serenity, deception and confusion. Some others allow discriminating closer
products with a lighter discrimination as satisfaction, pleasure, frustration,
perturbation and indifference.
Detailed analysis for clusters 2and 3 are provided in appendix 8.
Therefore, we can validate H2 as results highlight a difference of affective
judgment among the three clusters. Indeed, depending on the degree of
disconfirmation of expectations affective states discriminating the products are
not the same.
A cross-analysis between clusters 1 and 3 shows some consensual results on
affective items:
• Serenity only allows discrimination for the more disconfirmant
product for a high degree of disconfirmation
• Satisfaction and pleasure allow discrimination of the close
disconfirmant products, for a high and low degree of
disconfirmation
• Deception allows to discriminate only the most disconfirmant
products for a high and low degree of disconfirmation
• Perturbation allows discriminating disconfirmant products.

Page 132
The influence of the nature of the disconfirmation on the affective judgment (H3) Results will be organized per cluster by analyzing sensations, benefits and context of
consumption that can explain the disconfirmation.
Analysis of sensory characteristics The first analysis for cluster 1 can be shown in Figure 34 explaining sensory perception
inducing the disconfirmation.
Figure 34: Percentage of elicitations of the reasons why the product does not fit with expectations. The percentage of descriptors elicited by more than 5% of the subjects is retained.
The description elicited by consumers relates to the visual characteristic (white color), to the
flavor (sweetness, acidity, strawberry intensity and yoghurt intensity), to the texture
(thickness). The highest percentage of elicitation relates to “too thick” for YOP product for 48%
of the subjects. “Too sweet” is evocated by 30% of the subjects for YOP and the mix with Yakult.
Therefore, sensory disconfirmation relates to the thickness for YOP, as hypothesized, and with
too much sweetness. For the mix with Yakult, sensory disconfirmation relates partly to too
much sweetness.
Detailed analysis for clusters 2 and 3 are provided in appendix 8.
To sum-up, for each cluster, sensory perceptions inducing a sensory
disconfirmation of expectations are not the same:
For cluster 1, YOP does not fit with their expectations due to its thickness.
For cluster 2, there is no specific highest elicitation as there is no case of
disconfirmation.

Page 133
For cluster 3, the mix with Yakult does not fit with their expectations
because it is too sweet, liquid and artificial.
Analysis of benefits The first analysis of data provided by the subjects of cluster 1 show differences among products
for all the benefits illustrated by the boards (Figure 35).
Figure 35: Means of assessment of fitting with benefits for each product for cluster 1. Significant differences at 10% are illustrated by circles
For cluster 1, YOP has the lowest quotations for all the boards; it is significantly
different from the mix with plain and the standard. The standard has the highest assessments
for best fit with all the boards; it is significantly different from the mix with Yakult and the
YOP. Therefore this results show that the standard fits the best with all the benefits associated
to Actimel in the primed situation of consumption, namely “Energized”, “Ready for my day”,
“Supported and protected” and “Conscious of myself”. YOP is the product that fits the least
well with all these benefits. This aligns with the results provided by the fitting with
expectations, the more the product disconfirms the expectations, the less it fits with the
benefits.
Moreover, looking at the board “Party” which does not fit at all with the product
Actimel, results show that this boards has the lowest number of quotations among all the
boards for every product. This shows that checking the priming has been well done on Actimel.
However, for “Physical activities”, the assessment of this board is almost the same as the four
other boards fitting with the situation of consumption. This board was designed to fit with
Actimel but not with the situation of consumption, therefore our hypothesis is not conclusive.

Page 134
Detailed analysis for clusters 2 and 3 are provided in appendix 8.
To sum-up, except for cluster 2, the results highlight significant differences
among products on all the boards fitting with the primed situation. However,
cluster 1 differentiates more the products than cluster 3.
Contexts of consumption For cluster 1, analysis shows significantly higher frequencies of elicitation of the two contexts
for all the products (Table 14).
Table 14: Frequencies of check for each product and each context for cluster 1. Coloration: significant higher frequencies per product between contexts.
Bold letter: significant differences per context between products.
“Usage for breakfast” has the highest frequency for every product; therefore, the context
breakfast is significantly more associated with all the products. These results provide evidence
that the contextualization made at the beginning of the test has been a success. However, there
is no incongruent context associated to products that are not fitting with expectations;
therefore there is no clear evidence of a relation between the sensory disconfirmation of
expectations and a non-fitting with the context
Regarding the comparison among products, two contexts show significant differences of
frequencies of association: “Usage for breakfast” and “during the morning”. The standard is
significantly more associated to the « Usage for breakfast » and « during the morning » than
YOP. In other words, these results are aligned with the ranking among « fitting to
expectations». The product fitting the least with expectations has a significantly lower
association with the context enhanced at the beginning of the test.
Detailed analysis for clusters 2 and 3 are provided in appendix 8.
To sum-up, there are no clear differences of results on contexts between clusters.
Summary of the relation between the nature and degree of sensory disconfirmation of expectations and affective judgments
In order to better define the relation between affective judgments and sensory
disconfirmation of expectations, a synthesis is provided (Table 15).
Table 15: Summary of the results for each cluster
Cluster 1Usage just
after getting up
Usage for breakfast
Usage on the go before work
Usage during
the m orning
Usage at lunch
Usage after
sports
Usage in the
afternoon
Usage during dinner
Usage after
dinner
Usage other
Standard 23 42 24 29 3 17 10 3 4 4Standard + plain 23 39 25 26 4 19 12 1 2 3
Standard + Yakult 18 35 21 20 7 12 8 1 5 2Yop 13 24 16 15 8 6 12 1 5 1

Page 135
Cluster Degree Nature Affective judgments
1 Discrimination of the whole set
High degree (YOP)
Low degree (Std+Y)
Sensations (thickness : YOP & sweetness : YOP &Yak)
Benefits (YOP & Yak)
Surprise (YOP)
Serenity (YOP)
Satisfaction & Pleasure (YOP&Yak)
Frustration (YOP&Yak )
Perturbation (YOP+Yak)
Deception & Confusion (YOP)
Indifference (set)
2 No disconfirmation
Confusion (YOP+Yak)
3 Discrimination of one sample
High degree (Std+Y)
Sensations (sweetness / Liquid/ Artificial) : Yak)
Benefits (Yak)
Serenity & Satisfaction &Pleasure (Yak)
Frustration & Confusion (Yak vs YOP)
Deception (Yak)
Regarding results H3 is validated. Indeed product properties related to sensory
disconfirmations of expectations are different among clusters and the
differences among products on the fit to benefits are different among clusters.
The third conclusion on the relation between the nature of sensory
disconfirmation of expectations and affective feelings is:
Differences of perceived sensory disconfirmation of expectations can be
explained by the nature of the criteria that do not fit with expectations
• All clusters show elicitation on sensory characteristics concluding that a
sensory disconfirmation of expectations is perceived by all the consumers
• Clusters 1 and 3 have perceived a lower fit with benefits for the most
disconfirmant product allowing us to conclude a link between concept and
sensations
• No clear evidence has been provided on the relations between specific
affective judgments and the nature of criteria providing the sensory

Page 136
disconfirmation of expectations. All items allow differentiating the
product that fits least well with expectations
Characterization of consumers on familiarity An analysis of the characterization of consumers has been made among the three clusters
through each theme of familiarity proposed in the questionnaire and related to different part
of the product. A chart summarizes results provided on familiarity between clusters (Figure
36).
Figure 36: Means of assessment of themes of characterization between clusters. Significant differences at 10% are illustrated by circles
A first glance at the chart it seems there are no significant differences among the clusters.
Among the ten variables of familiarity, only two are discriminating the clusters of consumers.
“Objective knowledge about probiotics” and “Knowledge about Actimel” are the two variables
showing significant differences among the clusters. “Objective knowledge” grouped together
questions relating to expertise on probiotics. This is an objective assessment of the level of
expertise of the subjects on probiotics category.
Looking at the differences among the clusters for these two variables, cluster 2 has a
significantly higher number of quotations on objective knowledge on probiotics than cluster 1.
Cluster 1 shows a significantly higher assessment on “Knowledge about Actimel” than cluster
3. This result is correlated to the ranking of product made on the fit with expectations as the
standard for this cluster fits the best with expectations and YOP the less.

Page 137
To sum up, H4 is validated as two items allow discriminating clusters of
consumers.
2.4. Main conclusions
The main results provided by the study are as follows:
A difference of perception of sensory disconfirmation induces a difference
in affective judgments (H1).
The degree of perceived sensory disconfirmation induces differences of
affective judgments (H2).
The nature of sensory disconfirmation of expectations influences affective
judgments (H3). However no clear evidence has been revealed of the
relation between the nature of sensory disconfirmation of expectations
and affective judgments.
The perception of the discrepancy between expectations and the actual
product is different among the subjects, even amongst those recruited
specifically because of the situation of consumption and their heavy usage
of the actual product. One factor correlates to this variability is familiarity
(H4).
2.5. Methodological limits
One purpose of the study is to validate the hypothesis made through the qualitative
study on affective judgments. Instead of a two-step methodology asking the consumers to
assess the properties and affective states related to the product twice both before and after
consumption (Cardello and Sawyer, 1992; Thomson and Crocker, 2015), the objective is to
propose a list of affective judgments after consumption, ensuring an understanding of the
degree and origin of sensory disconfirmation of expectations. Indeed, affective states are more
spontaneous than a “fitting to expectations” assessment. The results provided by the study
allow a conclusion to be drawn on the relation between the degree of the discrepancy and
affective judgments induced, but not on the nature of the discrepancy. These results are aligned
with those provided by Ludden et al (Ludden et al., 2012b) correlating the degree of
discrepancy with emotions in an object design process. Therefore, the results are similar in
food design. The role of the relation between sensory perceptions and cognitive associations
inducing a sensory disconfirmation of expectations and thus an affective judgment is not
proved in this study. One methodological issue may induce these results: the next set of
proposals should be better designed in order to have a higher fit with expectations. Results

Page 138
should be more discriminant in every aspect of the sensory disconfirmation of expectations:
sensory characteristics, benefits and contexts of consumption.
Surprise is only felt by the consumers in cluster 1 and the results from this group are aligned
with the hypothesis built on the products. Regarding results provided by cluster 2, differences
among the products are close and all the quotations are high, meaning that even if this group
of consumers differentiates the product on the level of fit, all the products are good proposals
for them responding to their expectations. This is aligned with the fact that there are no
differences perceived in sensory characteristics, benefits and contexts of consumption for this
cluster. Therefore, surprise should be a more discriminative item than the level of fit to
expectations. Indeed, as emphasized by Mellers et al (Mellers et al., 2013), surprise should be
induced each time the subject felt a cognitive dissonance, namely a discrepancy between what
s/he expected and what s/he actually perceived. The correlation between surprise and sensory
incongruency was also proved whatever the degree of disconfirmation (Ludden et al., 2012b)
Therefore, for the two last clusters, the discrepancy between expectations and perception was
not so successful. Recommendations in consumers test design to screen samples among their
fit to expectations should add the level of surprise as a first item. A further recommendation
should be clustering subjects on surprise to check the correlation with the fit to expectations
and the overall liking.
The sentences at the bottom of the boards may have induced a bias in the assessment because
they are close to the words used for the priming; therefore a product that was fitting well with
expectations was naturally associated with all the boards presenting the same words. An
improvement of the methodology would be to remove the sentences and only keep the images.
Regarding the lack of differences in the context, these results could be due to the priming effect,
as the contextualization was made for “breakfast”, all the participants have spontaneously
ticked the congruent context. One proposal to avoid the bias could be to have an open question
related to context as was done for sensory characteristics. Indeed the results show that
providing an open question for sensory characteristics was successful as the participants
focused their attention on the sensory properties that were not congruent. The results are
aligned with the hypothesis made about the product. If we had provided questions on a scale
for a defined list of sensory properties, the risk would have been to bias the focus of the subjects
from one product to the next, and bias, therefore, the spontaneity of the answer. Therefore in
the same way by providing an open question on context rather than an exhaustive list, may
induce participants to choose the most appropriate context for each product and therefore
highlights the differences among products.

Page 139
The hypothesis built by the qualitative pre-study on the benefits relating to the new
positioning of the brand Actimel, “Feel strong and prepared for the day” and the link with
sensory characteristics, needs to be more strongly validated through a quantitative step.
Another study with closer proposals to the sensory guidelines could induce different results.
This point can also be discussed as a question on the role of qualitative methodologies in the
development of product. Hypotheses made through these methodologies on lower number of
people, even with a precise target specific on several criteria related to a define situation of
consumption, need to be validated by a quantitative step. Indeed, based on the qualitative pre-
study, the sensory guidelines and benefits provided by the consumers were consensual.
However, with the same target of people, the results of the quantitative study show that there
is a lack of consensus between consumers.
The results show that even for a target group (recruited based on criteria of high frequency of
consumption) the specific motivation to consume the product in a given context, perception of
sensory disconfirmation of expectations are not consensual. Only cluster 1 show results aligned
with the hypothesis made on samples. Therefore, the number of recruits should have been
greater and with less selection criteria. Clusterisation provided through the analysis thus
allows us to characterize the target that best show the opportunity for the business, or find
consensus between clusters in order to address more consumers through a sensory expert
characterization of the best proposals for each cluster.
Familiarity has been proved to be a factor influencing the categorization process (Faye et al.,
2004; Medin et al., 1997). Results have shown that knowledge differentiate two clusters.
However the differences are not so great inducing two points of discussion. Firstly, some
factors may have been forgotten; secondly, clusterisation is made on perception and not on
familiarity. The next step should be then to cluster consumers on familiarity in order to assess
if the differences of perceived sensory disconfirmation of expectations are induced. This could
also be related to the product range, and may be confirmed through a further study with closer
products. Results are anyway aligned with the correlation between the level of expertise and
the perception.
Due to practical constrain, the panel of subjects was limited. Further investigation is needed
with at least 200 subjects (as made for study 2B) ensuring having a sufficient number of subject
in each final cluster. Indeed, 40 subjects at least are needed in each cluster to ensure a good
statistical criterion.

Page 140
To sum-up, the following statements are made:
Next study should be made on proposals more different on the fit to
expectations, with a proposal designed to be closer to consumers
expectations.
Surprise should be integrated in consumers tests as a criterion to
check if the product is dissonant with consumers expectations.
Sentences on the board of pictures should be removed.
Targets of consumers should be designed based on perception and
familiarity.
Clustering subjects on familiarity should be a next step of
investigation to understand the relation with the properties
inducing a sensory disconfirmation of expectations.
A higher number of subjects is needed to cluster the panel of subjects
on their perception.
4. Discussion
The sensory disconfirmation of expectations is not only a matter of the sensations perceived in
the recipe, but also of the translation between the benefits and context, as the concepts into
sensory characteristics of the recipe relate to an ad-hoc category.
The design of the test for study 3B is organized in order to activate firstly the knowledge
relating to the situation of consumption, and then knowledge relating to Actimel. Looking at
the results of the three clusters, it shows that the way of categorization was different. Indeed,
cluster 1 has clearly differentiated the standard from the YOP on the fit to expectations and the
surprise, meaning that the categorization primed should have related to Actimel in this specific
situation of consumption. For cluster 2, the low discrimination of the samples and the lack of
discrimination on the level of surprise, could be a matter of categorization. Indeed, these
consumers have a defined category in mind relating to food for the breakfast (to feel strong
and prepared for the day) but both the proposals, either Actimel or YOP, could fit to this.
Therefore, they have no clear category, i.e. Actimel, in mind. These results can be discussed as
evidence of the influence of the level of categorization on perceived sensory disconfirmation of
expectations. This study does not result in a conclusion on the categorization explaining these
results. Adding an assessment of the fit to the brand Actimel after the fit to expectations would
have helped. Indeed, if the consumers of cluster 2 had given a lower quotation on YOP than on

Page 141
the standard, then it would have meant that they could differentiate between an Actimel and a
YOP, and therefore had the clear category of Actimel in mind. On the contrary, as there was no
difference among this quotation, this cluster didn’t have a specific category (i.e. Actimel) in
mind. Therefore, a questionnaire which aims at screening the products among the fit to
expectations should also contain a question on the fit to the brand.
The relation between concept and sensory pattern in a subject’s memory depends on the
individual as previously shown on study 2B. The results are aligned with these conclusions
through the clusterisation on perception of sensory disconfirmation of expectations. Each
subject has a different focus on sensory characteristics and therefore associates with different
concept in mind. It is why, by priming a situation of consumption, it induces different
perceptions and thus different sensory disconfirmation of expectations. As explained by
Barsalou, perception relies on the sensory pattern of information taken in by the subject
through selective attention (Barsalou, 1999). This process of attention is different among
subjects and depends also on the strategy used by the subjects to reduce cognitive dissonance.
Studies focusing on the impact of the disconfirmation of expectations of hedonic judgment
have mainly concluded an assimilation-contrast strategy (Lange et al., 1998; Schifferstein et
al., 1999; Siret and Issanchou, 2000). The results provided do not allow for a conclusion on the
strategy as we don’t have the discrepancy between liking before and after consumption.
However, regarding cluster 3 of the study 3C, results show that the mix with Yakult is rejected
by subjects as not fitting with their expectations. We may hypothesize that subjects have used
a strategy of contrast for this product assessment. In other words, by relating this hypothesis
to categorization, this product has been rejected as a member of “ad-hoc category” primed with
the contextualization. Therefore, depending on the attentional process and the size of the
category, the strategy (Faye et al., 2004; Medin et al., 1997) used by the subjects should change
with perception and have an impact on affective judgment. Another study would be needed to
relate categorization with strategy to reduce cognitive dissonance.
If the criteria used to define the level of categorization change among subjects, then a key step
is to understand, before the screening test, how consumers organize their knowledge of
products for a given situation of consumption. Sorting tasks allows revealing structures of
categories in mind related to a specific context. Therefore, one recommendation could be to
ask consumers to sort products according to the situation of consumption which could induce
a direct access to categories and their association with sensory characteristics. This is a way to
get access to sub-categories for a specific situation of consumption.
The results have shown that sensory disconfirmation of expectations can address sensory
characteristics of the product but also the benefits and context of consumption. These results

Page 142
are aligned with previous conclusions drawn from studies 3A and 3B on the relation between
concept and sensory characteristics depending on the category which the product is recognized
as a member. If results show sensory characteristics elicited as inducing the sensory
disconfirmation of expectations are different among products, the benefits assessment is quite
linear. Indeed, a product that does not fit expectations is going to be ranked lower on the
assessment of all the benefits. The nature of sensory disconfirmation of expectations addresses,
therefore, almost all the axis of the product-experience in this study: the recipe through
sensory assessment, the benefits and contexts fitting with the brand. The packaging part is
missing. As many studies have already shown, packaging also induces sensory and cognitive
expectations (Ares and Deliza, 2010; Piqueras-Fiszman and Spence, 2012; Schifferstein et al.,
2013). Indeed, each of the parts of the product-experience needs to be congruent in order to
avoid consumers feeling a discrepancy. Therefore, adding a packaging part with a two-step
methodology: firstly screening packaging; and secondly recipes in the best packaging, could be
the best way to define the most adequate product experience.
Mains conclusions on the chapter are:
A sensory disconfirmation of expectations is a discrepancy of ad-hoc
categorization during the perceptive process induced by a criteria related
to either sensory or cognitive associations
A sensory disconfirmation of expectations induces a different nature of
affective judgments depending on the degree of disconfirmation and the
nature of criteria inducing the discrepancy
Perception of sensory disconfirmation of expectations is variable among
individuals and induces various affective judgments because of different
cognitive and sensory associations.

Page 143
Chapter 7: Conclusions
This PhD research aims at better understanding relationships between expectations,
memory, perception processes and affective judgments. More precisely, we aimed at
Page 144
demonstrating that these relationships are formed by a two-way association between cognitive
associations on one side and sensory perceptions on the other side. Three different pieces of
fieldwork were conducted based on categorization tasks and affective judgments of familiar
and non-familiar product ranges.
The first part (chapter 4) was dedicated to studying the relationship between memory
and expectations. Two studies were conducted (1A and 1B) on a familiar product range:
strawberry fresh dairy products with French consumers. The objective of the research was to
demonstrate that expectations are defined by labile ad-hoc categories and that cognitive
associations with these categories induce sensory expectations.
Study 1A concludes that cognitive associations with packaging information induce
sensory expectations. The study was a free sorting task followed by participants giving
a description of nine packagings of strawberry yoghurts without tasting them. The
results showed that the categories are described by contexts of consumption, functional
benefits, AND sensory characteristics.
Study 1B concludes that the categorization of a product is dependent of the context, and
is variable among subjects. It compared on the one hand a free sorting task carried out
under two different conditions with the same range of products: a free sorting task on
packaging without tasting and a free sorting task with a blind tasting. On the other
hand, the individual variability of free sorting on the blind tasting was investigated. The
results showed first two different configurations of products between conditions. They
also showed different configurations between the clusters of subjects.
This first part allows us to conclude that contextual information, hereby
packaging information with different cognitive associations induce sensory
expectations through the retrieval of “ad-hoc” categories which depend on the
contexts and the subjects.
The second part (chapter 5) was dedicated to the investigation of the relationship between
the expectations based on “ad-hoc” categories and perceptions. Two studies were
conducted (2A and 2B) with Polish consumers and applied to a non-familiar range of products:
cold teas. The objective of the research was to understand if contextual information,
hereby sensory diversity and brand, influence the sensory perceptions elicited by
subjects and association with different cognitive expectations depending on
individuals.
Study 2A concludes that a sensory diversity of presentation induces a variability of
sensory perceptions and a diversity of cognitive expectations. The study compared two

Page 145
contexts of presentation inducing two different sensory perceptions of the same
product range: monadic (product presented alone) and comparative (the whole set of
products presented together). In both conditions participants were asked to undertake
a descriptive exercise, followed by a task of association with one situation of
consumption. Results showed that for most of the products, the nature of cognitive
expectations is different depending on the sensory perceptions elicited by the subjects.
Study 2B concludes that associations between sensory perceptions and cognitive
expectations are different among subjects and are correlated to familiarity of
consumers of their product experience. The methodology was based on a free sorting
task with a description exercise and an association to a situation of consumption.
Results showed four clusters of subjects as having different associations between
sensory perceptions and the situation of consumption for the set of products. These
clusters were also diverse in terms of familiarity.
This second part allows us to conclude that contextual information, hereby
sensory diversity and brand induces different relationships between sensory
perceptions and cognitive expectations depending on the subjects. This is
correlated to the familiarity.
The third part (Chapter 6) studied the interaction between expectations and perception
adequacy and affective judgments through ad-hoc categories retrieved before
and after consumption. Three studies were conducted with German and French consumers
(3A, 3B) and applied to familiar fresh dairy products and drinks. The objective of the
research was to study the influence of sensory disconfirmation of expectations
on affective judgments.
Study 3A concludes that priming a concept associated to a different category than the
one associated with the tasted product, induces a sensory disconfirmation of
expectations. It aimed at studying the influence of a discrepancy between categories
activated before and after consumption on the assessment of the sensory characteristics
and hedonic judgment of a product. The methodology was applied to a particular
fermented yoghurt drink: Actimel. Results showed that texture and hedonic
assessments were different before and after consumption.
Study 3B concludes that a difference of perceived sensory disconfirmation of
expectations induces a different nature of affective judgments. It studied the effect of
sensory disconfirmation of expectations on affective judgment applied to a set of
fermented drinkable yoghurts. The methodology is based on a two-fold assessment of

Page 146
the products (affective items first, then sensory and conceptual properties) in
sequential monadic. Results showed three different clusters of consumers assessing
differently the product range among the fit to expectations and the fit to cognitive and
sensory associations leading to different affective judgments.
This third part shows that a sensory disconfirmation of expectations: relates to a
discrepancy of cognitive associations and sensory perceptions related to
different categories activated before and after consumption; is diverse among
subjects depending on the cognitive and sensory associations; and induces
different affective reactions depending on its nature and degree
The main conclusions of the research aim at providing a theoretical model of perception that
relates categorization to expectations to affective judgment (Figure 37).
Figure 37 : Final theoretical model of the research
Expectations are based on “ad-hoc” categories primed at the first step of perception.
Expectations can be defined therefore as a categorization step at the beginning of
perception. From external cues taken into account by the subjects, strong relations are
made with expected benefits and with expected sensations.
Expectations are diverse between individuals because of a diversity of cognitive and
sensory associations. This diversity is framed by a diversity of categorization between
subjects related to their familiarity and the nature of the sensory information taken into

Page 147
account by the subjects. Sensory disconfirmation of expectations is induced by a
discrepancy between categories retrieved before and after consumption. All the
properties defining the category (contexts of consumption, benefits, and sensory
characteristics) can then induce a sensory disconfirmation of expectations. Depending
on the number and the nature of the criteria inducing the discrepancy between
categories, i.e. the degree of disconfirmation, the induced affective judgments are
different and could be correlated to the familiarity of consumers with the product.

Page 148

Page 149
Chapter 8: General discussion

Page 150
The general discussion is organized in two sections, the first one is dedicated to the
methodological questions and the second to theoretical ones.
Beyond providing insights as to the relationship between expectations and perceptions,
this PhD aims at integrating consumers expectations as a key driver in food product design.
Thus, by better understanding the cognitive processes supporting the consumers’ perceptions
and their final judgments, we aim at improving current methodologies behind consumer tests.
The following methodologies were implemented in other DANONE business projects with our
support:
Elicit expectations of consumers through a qualitative study (applied on pre-study
Chapter 5). Starting from a broad concept, this study reached different types of
knowledge: benefits, contexts of consumption and sensory characteristic based on
subjects’ memory. It includes a last tasting part to readjust sensations with tangible
stimuli.
Translate consumers’ expectations into sensory characteristics (applied on study 2B).
This is a quantitative methodology based on a free sorting task with description and an
association to cognitive expectations. This methodology allows us to gather the
association made by subjects between sensory perceptions and cognitive expectations.
In parallel, sensory expert panels described the products. Cross-analysis allows us to
give recommendations on sensory guidelines to the R&D team and communication
guidelines to the Marketing team.
Characterize consumers on familiarity (applied on studies 2B and 3B). The
questionnaire allows us to describe consumers based on different aspects of familiarity:
knowledge, usage and attitudes, implication with different components of the product
experience (recipe, brand, and category) and not only on social criteria. These criteria
help marketing teams better recruit the target of consumers fitting with the concept.
Clustering subjects on perception (applied on study 2B). This allows for the definition
of consumers’ targets having the same association between sensory perceptions and
cognitive expectations. Results obtained through this analysis help the marketing
teams by giving a characterization for each target and the cognitive associations.
Additionally, the development team gains precise sensory guidelines for each target.
Clustering subjects according to perceived disconfirmation of expectations for
screening test (applied on study 3B). Based on the individual variability of relation
between sensory and cognitive expectations, the analysis must be made at an individual
level. Therefore, clustering subjects according to the perceived disconfirmation of
expectations allows to access for each cluster to the best prototype and associations
provided.

Page 151
Affective questionnaire (applied on study 3B). It allows for an understanding, through
spontaneous reactions, of the degree of sensory disconfirmation of expectations.
Beyond liking, these affective judgments provide more information as to the perception
of consumers.
Main limit of this work is related to the relationship between contextual information provided
on the product and the familiarity of consumers, i.e their previous experiences with the
products. Familiarity of consumers was only measured and contextual information were only
manipulated through a contextualization step. Thus improvement of the design research
should be through tests in context and by recruiting subjects on their familiarity to the product
range. One way is by using new products range, i.e prototypes unknown for the subjects
designed for the purpose of the research and making a step-by step familiarization in different
real situations of consumption. One set of subjects recruited at the beginning of the research
work is exposed during the studies to one precise situation of consumption associated to the
range of products. For each study a standard panel “non familiar” is recruited as a neutral
sample. The design of the research follows the one we used for our research (Figure 38)
Figure 38: Overview of the research
Panel of subjects A« Familiar panel »
Context 1Sorting task and association with sensory and conceptual
properties
Step 1:Concepts induce
sensory expectations
Exposure step in context 1 without
tasting
Panel of subjects B« Non Familiar
panel »
Step 2:Sensory perception induce conceptual
expectations
Exposure step in context 1 with tasting
Without contextualizationSorting task and association with sensory and conceptual
properties
Step 3:Sensory
disconfirmation and affective judgment
Context 1 and 2Affective judgment

Page 152
First part of the research aims at demonstrating that cognitive associations with a situation of
consumption influence the sensory expectations. The familiar panel is exposed during a pre-
step to one concept during several days in one real situation of consumption. Then the same
product range is assessed by the two panels of subjects. Design of the methodology is based on
a free sorting task with a description step and an association with boards of cognitive
expectations. A comparison of the results obtained by the two panels should demonstrate a
variability of ad-hoc categorization and thus a variability of sensory expectations depending on
the familiarity of subjects to the association between the context and the concept associated.
Second part of the research aims at demonstrating that a variability of sensory perceptions
through ad-hoc categorization should induce a variability of cognitive expectations. An
exposure step should be plan during several days. Subjects of panel A have to taste the products
in context 1. Then, as for the first part, the product range is assessed by two panels of
consumers.
Third part of research aims at demonstrating the influence of sensory disconfirmation of
expectations on affective judgment. This influence depends on the cognitive and sensory
associations of the ad-hoc category to which the product is identified as a member. The
variability of ad-hoc categorization is induced by proposing two different contexts: context 1
adequate to the product range as learned by panel A of subjects and the context 2 which is not
fitting with the product range. The comparison is also made between panels to assess the
influence of the familiarity on the perception of sensory disconfirmation of expectations and
the affective judgments of subjects.
Some methodological points are still being decided upon. These methodological points have
not yet been validated through our fieldwork. Thus, more studies must be implemented to
apply the methodologies and accumulate data to ensure clear conclusions on the following
hypotheses:
Regarding familiarity, items were selected based on the literature. However, according
to the results provided by chapters 5 and 6, we still need to implement the
questionnaire on different product ranges and different consumer targets to make
strong associations between the variability of categorization between subjects and
familiarity.
Regarding affective judgments, the study 3B does not allow validating the hypothesis
made during the qualitative group interviews on the relationship between the origin of
sensory disconfirmation of expectations and the nature of affective judgments elicited
by the subjects. Further studies are needed to validate these hypotheses on different
product ranges and different consumer targets with a higher number of consumers

Page 153
Regarding surprise items, we also need further investigations on a product range with
closer sensory perceptions to ensure that this item is always correlated to a sensory
disconfirmation of expectations.
Based on the results, several perspectives are proposed regarding the improvement of
classical consumer tests using liking in laboratory assessment as a standard. We focus our main
recommendations around two axes: using the sorting task in the design of a product to
understand consumers’ expectations and perceptions; and taking into account individual
differences in the key performance indicators (KPI).
Going further with sorting task in a food product design The sorting task has proved to be an efficient methodology to reveal consumers’
expectations and perceptions by defining ad-hoc categories and cognitive and sensory
associations. Thus, by modifying some of the information given to the consumers during the
test, more recommendations should be given as to the food product design and we should
increase applications of the free sorting task. Results provided by a free sorting task can help
designing food products at different stages of the process and give different information about
the categorization process and the criteria taken into account by the subject depending on the
various stimuli proposed. Several objectives are hereby proposed in line with the use of the free
sorting task. These objectives have been derived from results derived from this research.
Gaining access to full product experience expectations Our results on “cold tea based on water” products show that this new methodology based
on the free-sorting task allows us access to information regarding the three pillars of the full
product experience. By clustering subjects according to their categorization and characterizing
them on familiarity we gain information regarding the target based on their perception and
their usage. Through a cross-analysis between groups of products selected by consumers and
the sensory descriptions made by experts we learned information about the recipe, i.e the
product itself. Then, by adding a step of association with boards, we provided information
relating cognitive associations with the product and the brand, namely the situation of
consumption. Based on this free sorting task, through the access to categories retrieved, we
were able to understand the criteria of sensory categorization but also the cognitive
associations inferenced from the category. In a full product experience design, results provide
clear information for the development team to formulate the recipe but also to marketing
teams for the target and the positioning of the product in terms of its communication. One
further step should have been to add the packaging part to design the product entirely from
the recipe to the holistic experience. Indeed, sensory cues on packaging design influence the
perception of the recipe itself. Thus, by proposing a further step with the same methodology

Page 154
applied to packaging, we should be able to propose guidelines to design the full product
experience.
Gaining access to consumers’ perception of the market and competitors Food consumption is oriented by a motivation to consume the product and a context of
consumption associated. A product, composed by a recipe, a pack and a brand, is always
positioned in the market to ensure it delivers to the consumer a specific benefit. It also must
through advertisement, for example, give information on how, when and where to consume
the product. However, sometimes it is clearly difficult for the consumers to understand this
positioning and for the marketing teams to understand which products or brands the product
is in competition with. It is even more true for products identified as members of a specific
category. This positioning made by the subject is depending in the market, on the place of the
product on the shelves, or on the experience which has been built around the product if it is a
familiar one. However, as categorization is induced by a motivation, how can a brand identify
the broader range of products which are their main competitors? For example, a benefit such
as “makes me strong” or “energized” in the morning can fit with a various range of products:
coffee, orange juice, granola bar, fresh dairy products. This range of products is clearly different
in sensory characteristics and the choice of the consumers will be then influenced by its own
translation of the benefit. For a brand that would position its products within this situation of
consumption, it could be difficult to understand competitors’ products and therefore the
specificities the product needs to have to be identified as a member of this category and thus
to be chosen. Therefore, the sorting task, as we used it in our research, can help marketing and
development teams to understand how the market is perceived by the consumer and to
understand the close competitors of the brand. One key part will be to choose the products
through internet stage by asking to a massive set of people the associations related to the
specific situation of consumption or based on ethnographical observations made by a
marketing team.
Gaining access to criteria for defining the uniqueness of the product As food perception and thus identification of the product is based on the categorization
process, the sorting task can help to understand key criteria for defining the specificity of the
subcategory which a product is a member of. Delivering a superior product experience relates
to the congruency of the experience of the product between all of its components. In other
words, finding the criteria that define the specificity of the product regarding the brand,
packaging and recipe vs other competitors is a way to access a higher purchase rate from the
consumer. These criteria of categorization can also be cognitive or sensory associations.
However, perception of these criteria should be present in either or each of the components of
the product: brand, packaging and recipe. As the brand is already well categorized in

Page 155
consumers’ mind most of time, it is key to assure that specificities related to the category are
clearly emphasized in the pack and the recipe. Delivering a superior experience and making
the product as unique is also correlated to the renovation of each component of the product.
These are also results that can be provided by the sorting task through an association with fit
to the situation of consumption, brand, liking assessment and purchase intent. Thus, defining
properties that are unique for the product category is defining the properties needed to
differentiate the ad-hoc category integrating the brand according to a given situation of
consumption.
Gaining access to disconfirmation categories Results provided by the studies in chapter 6 show that priming a benefit is priming
expectations associated to an ad-hoc category. Cognitive dissonance is induced by a different
association between categorization before consumption and after consumption. We had used
a classical presentation in sequential monadic to screen affective items. However, once
affective items are defined and related to nature and degree of sensory disconfirmation, the
next step is to propose all the samples at the same time and to use a sorting task under different
conditions and provide the categorization among the benefit primed. Thus, by adding a fit to
expectations and brand it is possible then to screen the category with the best fit to the
expectations and based on the protocol with a sensory description and association toboards of
cognitive expectations.
Inter-individual differences taken into account in methodologies Results of the research show a variability of expectations and perceptions between
subjects for different cases. We apply the clusterisation of consumers on a large target allowing
us to give more precision for further recruitments. We apply also the clusterisation on a more
precise target, i.e. with more factors of screening. In this case we show that even for heavy users
with precise motivations of consumption toward the brand, perceptions of sensory
disconfirmations of expectations are different between subjects. Thus, this clusterisation
aspect of the analysis is a key point to integrate in a food product design to better understand
differences between consumers. Indeed, results provided in industries are based on an overall
assessment of the panel. The main recommendations are then based on the mean of
assessments of subjects recruited according to their age, profession and frequency of
consumption, for examples. Our approach is to cluster subjects based on their perception to
provide recommendations closer to the real-life experience of consumption. Giving
recommendations as to the clusters of subjects does not mean necessarily to design one
product for each cluster of consumers but, rather, to design them being aware of the variability

Page 156
of perception and to give recommendations on consensus between clusters. Two steps are
proposed as improvements for future application studies.
Extend criteria of recruitment The first improvement regards the recruitment aspect. Indeed, integrating factors influencing
perception should allow having access to consumers having almost the same perception of the
product. From our results, considering ad-hoc categories as framing expectations and
perceptions, it is thus of interest to recruit consumers having the same motivation to consume
the product in the same context of consumption. By recruiting on the situation of consumption
we can partly ensure that consumers have closer expectations and perceptions. The second
aspect is regarding familiarity. As we show that some aspects of familiarity are correlated to a
diversity of perceptions, recruitment screeners should integrate questions regarding usage,
implication to the brand or specific components of the recipe (tea, probiotics), or knowledge.
Indeed, before integrating these questions, it is worth noting that a previous step is important
to deepen understanding on the factors correlated to the variability of perception among
subjects.
Cluster consumers according to perception The second improvement regards guidelines given for consumer tests. Our findings
from the Actimel fieldwork, for example, show that it is clear that even for a target of consumers
that are heavy users of the product, having the same motivation to consume the brand; and
perception of sensory disconfirmation of expectations is different among subjects. Therefore it
shows that the results provided by consumer studies should be analyzed on an individual level.
We need to consider that the differences between clusters allow the industry to understand the
associations between sensory and conceptual properties made by each cluster of consumers for
the same situation of consumption. Only then can the best compromise regarding product
screening be found. Thus, this is not a matter of providing one product per cluster of consumers
but much more to adapt the communication of the same product to different clusters of
consumers by focusing on the associations they made.
Furthermore, the main conclusions of this research are that cognitive and sensory
associations, induced through ad-hoc categories, define expectations, perceptions and affective
judgments of consumers in a given food context. Several points for discussion have already
been highlighted:
Taking into account ad-hoc categories in studies of consumers’’ expectations
and perceptions induces contextualization not only on environmental factors,

Page 157
like time, place or social context, but also on the motivation of the consumers to
eat a specific food (Chapter 4).
Associations between cognitive expectations and sensory perceptions are
dependent on the familiarity of the consumer with the product. In the case of a
new product, providing information as to its similarity with a familiar product,
the context of consumption, or the brand helps subjects categorize the product
(Chapter 5).
Expectations defined as ad-hoc categories make the strategies to reduce a
sensory disconfirmation of expectations related to the graded nature of the
category (Chapter 6)
These associations are variable among individuals and, more precisely, they are
correlated with the characterization of familiarity. Different items defining familiarity were
explored but they were not integrated as factors explaining differences in categorization (Faye
et al., 2013). Thus, future perspectives should be to integrate familiarity according to other top-
down processes influencing subjects’ perceptions. A perspective concerns the time-related
categorization process which depends on the level of familiarity as it evolves over time.
Expectations: a dynamic process over time Expectations are a dynamic process. In other words, expected properties of the product
are constantly reassessed by the subjects depending on previous experiences. For Goering, this
reassessment depends on the familiarity of the consumer with the product (Goering, 1985).
Results of this PhD allow for the conclusion that expectations are defined from the cognitive
and sensory associations depending on the situation of consumption through ad-hoc
categories. Thus, studying the dynamic of expectations is studying the dynamic of
categorization among time. Dynamic of expectations can be studied on two levels.
The first level is during the assessment of the product. Our research is based on the
hypothesis that expectations are constant from the first to the last sip or mouthful of the
product consumed by the subject. However, expectations are reassessed during the perceptive
process. Indeed, the first sip or mouthful of the product induces an assessment of the difference
between expected and perceived properties of the product. This assessment will then affect the
perception of the product through the categorization process integrating sensory perceptions
as well as affective judgments.
The second level is considering the dynamism of expectations from the first
confrontation on the market, based on the packaging information and brand, to expectations

Page 158
based on a heavy usage of the product. The more the subject is familiar with the product the
more he will be able to predict his/her perceived properties (Crandall, 1967). The effect of
exposure of the product on expectations is first studied through the assessment of
disconfirmation of expectations on appreciation. The confirmation or disconfirmation of
expectations during the first exposure changes the confidence of the consumer in the product
and even the brand (Deliza and MacFie, 1996). If expectations are confirmed, his/her
confidence will increase as its satisfaction and therefore its future hedonic expectations will be
higher. The mechanism underlying this effect relates to the definition proposed for
expectations, i.e. cognitive and sensory associations through ad-hoc categories. Indeed, any
new experience, especially those with a new product, changes the subject’s knowledge and
therefore the categories structured in the memory. By confronting the subject to a product that
could be integrated as a new member of the category, the structure of the category and the
associations with this category can change. Indeed, even if ad-hoc categories are created
spontaneously for use in specialized contexts, they still have a well-established representation
in the memory if they are frequently used (Barsalou, 1983). This representation can thus evolve
by adding new exemplar. The reverse action effect is a good exemplar. It is defined as a transfer
of the properties of a product extension to the category of the brand (Wänke et al., 1998b). In
other words, adding a new exemplar to a well-established category induces the attribution of
cognitive and sensory associations with the brand category to the extension and vice versa.
Thus, studying expectations over time is studying ad-hoc categorization of the product over
time and cognitive and sensory associations inferenced by the subject. Familiarity with
products acquired over time has an influence on the balance between the integration of
external information given on the product and the knowledge stored in the memory.
Perspectives in this research should make clear, for each stage of the product usage, the ad-hoc
category to which it is associated and how the associations are influenced. A study by
Shifferstein et al showed that sensory modalities and emotions induced at different stages of
the product experience (purchase, opening, preparation, consumption and repeated purchase)
are different (Schifferstein et al., 2013). An extended approach should be to consider the
cognitive and sensory associations across these different stages to define how dynamic the
expectations of the subject are according to his/her increasing familiarity with the product.

Page 159
Bibliography

Page 160
Anderson, R.E. (1973). Consumer Dissatisfaction: The Effect of Disconfirmed Expectancy on Perceived Product Performance. Journal of Marketing Research 10, 38–44.
Anzieu, D., and Chabert, C. (2004). Les méthodes projectives (Presses universitaires de France).
Ares, G., and Deliza, R. (2010). Studying the influence of package shape and colour on consumer expectations of milk desserts using word association and conjoint analysis. Food Quality and Preference 21, 930–937.
Ares, G., and Jaeger, S.R. (2013). Check-all-that-apply questions: Influence of attribute order on sensory product characterization. Food Quality and Preference 28, 141–153.
Ares, G., Besio, M., Giménez, A., and Deliza, R. (2010). Relationship between involvement and functional milk desserts intention to purchase. Influence on attitude towards packaging characteristics. Appetite 55, 298–304.
Arnould, E.J., Price, L., and Zinkhan, G.M. (2004). Consumers (McGraw-Hill/Irwin).
Auvray, M., and Spence, C. (2008). The multisensory perception of flavor. Consciousness and Cognition 17, 1016–1031.
Ballester, J., Patris, B., Symoneaux, R., and Valentin, D. (2008). Conceptual vs. perceptual wine spaces: Does expertise matter? Food Quality and Preference 19, 267–276.
Barsalou, L.W. (1982). Context-independent and context-dependent information in concepts. Mem Cognit 10, 82–93.
Barsalou, L.W. (1983). Ad hoc categories. Memory & Cognition 11, 211–227.
Barsalou, L.W. (1999). Perceptual symbol systems. Behav Brain Sci 22, 577–609; discussion 610–660.
Barsalou, L.W. (2010). Grounded Cognition: Past, Present, and Future. Topics in Cognitive Science 2, 716–724.
Barsalou, L.W. (2008). Grounded Cognition. Annual Review of Psychology 59, 617–645.

Page 161
Barsalou, L.W., Kyle Simmons, W., Barbey, A.K., and Wilson, C.D. (2003). Grounding conceptual knowledge in modality-specific systems. Trends in Cognitive Sciences 7, 84–91.
Baumgartner, H., Sujan, M., and Bettman, J.R. (1992). Autobiographical Memories, Affect, and Consumer Information Processing. Journal of Consumer Psychology 1, 53–82.
Bech-Larsen, T., and Nielsen, N.A. (1999). A comparison of five elicitation techniques for elicitation of attributes of low involvement products. Journal of Economic Psychology 20, 315–341.
Becker, L., van Rompay, T.J.L., Schifferstein, H.N.J., and Galetzka, M. (2011). Tough package, strong taste: The influence of packaging design on taste impressions and product evaluations. Food Quality and Preference 22, 17–23.
Bertrand, A., and Garnier, P.-H. (2005). Psychologie cognitive (Studyrama).
Bourgeon, D., Cova, B., Evrard, Y., and Petr, C. (2007). Au-delà du Paradigme de “Disconfirmation” des Attentes: Quand le Lien Remplace le Bien (HAL).
Boussoco, J. (2015). Représentations alimentaires mises en jeu lors des choix dans la préparation culinaire.
Boutrolle, I. (2007). Mesure de l’appréciation des aliments par les consommateurs : état des pratiques et propositions méthodologiques (Paris, AgroParisTech).
Boutrolle, I., and Delarue, J. (2009). Studying meals in the home and in the laboratory A2 - Meiselman, Herbert L. In Meals in Science and Practice, (Woodhead Publishing), pp. 128–165.
Boutrolle, I., Arranz, D., Rogeaux, M., and Delarue, J. (2005). Comparing central location test and home use test results: Application of a new criterion. Food Quality and Preference 16, 704–713.
Boutrolle, I., Delarue, J., Arranz, D., Rogeaux, M., and Köster, E.P. (2007). Central location test vs. home use test: Contrasting results depending on product type. Food Quality and Preference 18, 490–499.
Breivik, E., and Supphellen, M. (2003). Elicitation of product attributes in an evaluation context: A comparison of three elicitation techniques. Journal of Economic Psychology 24, 77–98.
Brosch, T., Pourtois, G., and Sander, D. (2010). The perception and categorisation of emotional stimuli: A review. Cognition and Emotion 24, 377–400.

Page 162
Brunel, O., and Gallen, C. (2012). “ C’est bizarre ! Ca se mange ? ” Les effets de la dissonance cognitive en consommation alimentaire. p. 27.
Bruner, J.S. (1957). On perceptual readiness. Psychological Review 64, 123–152.
Buck, D. (2007). 7 - Methods to understand consumer attitudes and motivations in food product development A2 - MacFie, Hal. In Consumer-Led Food Product Development, (Woodhead Publishing), pp. 141–157.
Cain, W.S. (1974). Contribution of the Trigeminal Nerve to Perceived Odor Magnitude*. Annals of the New York Academy of Sciences 237, 28–34.
Caporale, G., and Monteleone, E. (2004). Influence of information about manufacturing process on beer acceptability. Food Quality and Preference 15, 271–278.
Caporale, G., Policastro, S., Carlucci, A., and Monteleone, E. (2006). Consumer expectations for sensory properties in virgin olive oils. Food Quality and Preference 17, 116–125.
Cardello, A.V. (1995). Food quality: relativity, context and consumer expectations. Food Quality and Preference 6, 163–170.
Cardello, A.V. (2003). Consumer concerns and expectations about novel food processing technologies: effects on product liking. Appetite 40, 217–233.
Cardello, A.V. (2007). 10 - Measuring consumer expectations to improve food product development A2 - MacFie, Hal. In Consumer-Led Food Product Development, (Woodhead Publishing), pp. 223–261.
Cardello, A.V., and Sawyer, F.M. (1992). Effects of disconfirmed consumer expectations on food acceptability. Journal of Sensory Studies 7, 253–277.
Cardello, A.V., Maller, O., Masor, H.B., Dubose, C., and Edelman, B. (1985). Role of Consumer Expectancies in the Acceptance of Novel Foods. Journal of Food Science 50, 1707–1714.
Carey, S. (2011). The Origin of Concepts: A Precis. Behav Brain Sci 34, 113–162.
Chemero, A. (2011). Radical Embodied Cognitive Science (MIT Press).
Cho, E. (2011). Development of a brand image scale and the impact of lovemarks on brand equity. Graduate Theses and Dissertations.

Page 163
Chollet, S., and Valentin, D. (2000). Le degré d’expertise a-t-il une influence sur la perception olfactive ? Quelques éléments de réponse dans le domaine du vin. L’année psychologique 100, 11–36.
Christensen, C. (1980). Effects of solution viscosity on perceived saltiness and sweetness. Perception & Psychophysics 28, 347.
Clark, H.H., and Marshall, C.R. (1981). Definite Reference and Mutual Knowledge In Aravind K. Joshi, Bonnie L. Webber, and Ivan A. Sag, Editors. In Elements of Discourse Understanding, A. Joshi, B.H. Weber, and I.A. Sag, eds. (Cambridge University Press),.
Collins, A.M., and Quillian, M.R. (1969). Retrieval time from semantic memory. Journal of Verbal Learning and Verbal Behavior 8, 240–247.
Crandall, J.E. (1967). Familiarity, Preference, and Expectancy Arousal. Journal of Experimental Psychology 73, 374–381.
Dany, L., and Abric, J.-C. (2007). Distance à l’objet et représentations du cannabis. Revue internationale de psychologie sociale Tome 20, 77–104.
Davidson, J.M., Linforth, R.S.T., Hollowood, T.A., and Taylor, A.J. (1999). Effect of Sucrose on the Perceived Flavor Intensity of Chewing Gum. J. Agric. Food Chem. 47, 4336–4340.
Deegan, K.C., Palmujoki, I., Isotalo, J., and Tuorila, H. (2015). Effective communication of novelty: The case of ripened cheese. Food Quality and Preference 40, Part A, 68–76.
Delarue, J., and Boutrolle, I. (2010). 8 - The effects of context on liking: implications for hedonic measurements in new product development A2 - Jaeger, Sara R. In Consumer-Driven Innovation in Food and Personal Care Products, H. MacFie, ed. (Woodhead Publishing), pp. 175–218.
Deliza, R., and MacFie, H.J.H. (1996). The Generation of Sensory Expectation by External Cues and Its Effect on Sensory Perception and Hedonic Ratings: A Review. Journal of Sensory Studies 11, 103–128.
Deliza, R., Macfie, H., and Hedderley, D. (2003). Use of Computer-Generated Images and Conjoint Analysis to Investigate Sensory Expectations. Journal of Sensory Studies 18, 465–486.
DelVecchio, D. (2001). Consumer perceptions of private label quality: the role of product category characteristics and consumer use of heuristics. Journal of Retailing and Consumer Services 8, 239–249.

Page 164
Depledt (2009). Évaluation sensorielle – Manuel méthodologique (3e éd.) (Lavoisier).
Derbaix, C., and Pham, M.T. (1991). Affective reactions to consumption situations: A pilot investigation. Journal of Economic Psychology 12, 325–355.
Desmet, P.M.A., and Hekkert, P. (2007). Framework of Product Experience. International Journal of Dsign 1, 57–66.
Desmet, P.M.A., and Schifferstein, H.N.J. (2008). Sources of positive and negative emotions in food experience. Appetite 50, 290–301.
Driver, J., and Spence, C. (2000). Multisensory perception: beyond modularity and convergence.
Dubois, D. (2009). Le sentir et le dire: Concepts et méthodes en psychologie et linguistique cognitives (Editions L’Harmattan).
Edwards, J.S.A., Hartwell, H.J., and Brown, L. (2013). The relationship between emotions, food consumption and meal acceptability when eating out of the home. Food Quality and Preference 30, 22–32.
El Ghaziri, A., and Qannari, E.M. (2015). Measures of association between two datasets; Application to sensory data. Food Quality and Preference 40, Part A, 116–124.
Escoufier, Y. (1973). Le Traitement des Variables Vectorielles. Biometrics 29, 751–760.
Estes, Z., Gibbert, M., Guest, D., and Mazursky, D. (2012). A dual-process model of brand extension: Taxonomic feature-based and thematic relation-based similarity independently drive brand extension evaluation. Journal of Consumer Psychology 22, 86–101.
Faye, P., Brémaud, D., Durand Daubin, M., Courcoux, P., Giboreau, A., and Nicod, H. (2004). Perceptive free sorting and verbalization tasks with naive subjects: an alternative to descriptive mappings. Food Quality and Preference 15, 781–791.
Faye, P., Courcoux, P., Giboreau, A., and Qannari, E.M. (2013). Assessing and taking into account the subjects’ experience and knowledge in consumer studies. Application to the free sorting of wine glasses. Food Quality and Preference 28, 317–327.

Page 165
Fenko, A., Leufkens, J.-M., and van Hoof, J.J. (2015). New product, familiar taste: Effects of slogans on cognitive and affective responses to an unknown food product among food neophobics and neophilics. Food Quality and Preference 39, 268–276.
Ferrarini, R., Carbognin, C., Casarotti, E.M., Nicolis, E., Nencini, A., and Meneghini, A.M. (2010). The emotional response to wine consumption. Food Quality and Preference 21, 720–725.
Festinger, L. (1962). A Theory of Cognitive Dissonance (Stanford University Press).
Firestone, C., and Scholl, B.J. (2015). Cognition does not affect perception: Evaluating the evidence for “top-down” effects. Behav Brain Sci 1–77.
Gallen, C. , and Sirieix, L. (2011). Design culinaire et consommateurs: Entre rapprochement et distance perçue (French). Décisions Marketing (Bruxelles) 35–48.
Gallen, C., and Brunel, O. (2014). La théorie de la dissonance cognitive : un cadre unificateur pour la recherche en marketing sur les conflits.
Gallen, C., and Pantin-Sohier, G. (2012). Design et marketing des produits alimentaires : quelles sont les perspectives d’innovation ?
Giboreau, A., and Body, L. (2007). Le marketing sensoriel: de la stratégie à la mise en oeuvre (Vuibert).
Giboreau, A., Navarro, S., Faye, P., and Dumortier, J. (2001). Sensory evaluation of automotive fabrics: the contribution of categorization tasks and non verbal information to set-up a descriptive method of tactile properties. Food Quality and Preference 12, 311–322.
Gibson, J.J. (1979). The ecological approach to visual perception / (Boston: Houghton Mifflin).
Glenberg, A.M., Witt, J.K., and Metcalfe, J. (2013). From the Revolution to Embodiment: 25 Years of Cognitive Psychology. Perspectives on Psychological Science 8, 573–585.
Goering, P.A. (1985). Effects of Product Trial on Consumer Expectations, Demand, and Prices. Journal of Consumer Research 12, 74–82.
Goldstone, R.L., and Barsalou, L.W. (1998). Reuniting perception and conception. Cognition 65, 231–262.
Page 166
Gomez, P. (2009). L’orientation régulatrice de santé : déterminants, mesure et conséquences sur les comportements de santé et le traitement de l’information de santé (Institut d’Économie et de Management de Nantes - IAE).
Grunert, K.G. (2002). Current issues in the understanding of consumer food choice. Trends in Food Science & Technology 13, 275–285.
Grunert, K.G., Bech-Larsen, T., and Bredahl, L. (2000). Three issues in consumer quality perception and acceptance of dairy products. International Dairy Journal 10, 575–584.
Grunert, K.G., Beckmann, S.C., and Sørensen, E. (2001). Means-end chains and laddering: an inventory of problems and an agenda for research. In Understanding Consumer Decision-Making: The Means-End Approach to Marketing and Advertising Strategy, (Lawrence Erlbaum Associates, Incorporated),.
Gutjar, S., Dalenberg, J.R., de Graaf, C., de Wijk, R.A., Palascha, A., Renken, R.J., and Jager, G. (2015). What reported food-evoked emotions may add: A model to predict consumer food choice. Food Quality and Preference 45, 140–148.
Gutman, J. (1982). A Means-End Chain Model Based on Consumer Categorization Processes. Journal of Marketing 46, 60.
Hampton, J.A. (1979). Polymorphous concepts in semantic memory. Journal of Verbal Learning & Verbal Behavior 18, 441–461.
Hanna, J.G. (1980). A Typology of Consumer Needs. Research in Marketing 3, 83.
Harmon-Jones, E. (2000). A cognitive dissonance theory perspective on the role of emotion in the maintenance and change of beliefs and attitudes. In Emotions and Belief: How Feelings Influence Thoughts, N.H. Frijda, A.S.R. Manstead, and S. Bem, eds. (New York, NY, US: Cambridge University Press), pp. 185–211.
Harmon-Jones, Harmon-Jones, E., and Amodio (2009). Action-Based Model of Dissonance: A Review, Integration, and Expansion of Conceptions of Cognitive Conflict.
Hekkert, P., and Schifferstein, H.N.J. (2008). Introducing product experience. In Product Experience, H.N.J. Schifferstein, and P. Hekkert, eds. (San Diego: Elsevier), pp. 1–8.
Houdé, O., Kayser, D., Koenig, O., Proust, D. of R. at F.P.-G. de G.P.L.R.J., Proust, J., and Rastier, F. (2004). Dictionary of Cognitive Science: Neuroscience, Psychology, Artificial Intelligence, Linguistics, and Philosophy (Routledge).

Page 167
Hovland, C.I., Harvey, O.J., and Sherif, M. (1957). Assimilation and contrast effects in reactions to communication and attitude change. The Journal of Abnormal and Social Psychology 55, 244–252.
Hubert, L., and Arabie, P. (1985). Comparing partitions. Journal of Classification 2, 193–218.
Jaeger, S.R. (2006). Non-sensory factors in sensory science research. Food Quality and Preference 17, 132–144.
Joubert, O.R. (2008). Catégorisation rapide des scènes naturelles : L’objet, le contexte, et leurs interactions. phdthesis. Université Paul Sabatier - Toulouse III.
Kahneman, D., and Tversky, A. (1979). Prospect Theory: an analysis of decision under risk. Econometrica 47, 263–292.
Karjalainen, T.-M. (2007). It Looks Like a Toyota: Educational Approaches to Designing for Visual Brand Recognition. International Journal of Design 1, 67–81.
King, S.C., and Meiselman, H.L. (2010). Development of a method to measure consumer emotions associated with foods. Food Quality and Preference 21, 168–177.
Korchia, M. (2001). Connaissances des marques stockées en mémoire par les consommateurs: modèle théorique et test empirique.
Köster, E. (2009). Diversity in the determinants of food choice: A psychological perspective. Food Quality and Preference 20, 70–82.
Köster, E.P. (2003). The psychology of food choice: some often encountered fallacies. Food Quality and Preference 14, 359–373.
Köster, E.P. (2006). Memory for food and food expectations: A special case? Food Quality and Preference 17, 3–5.
Köster, E.., Couronne, T., Léon, F., Lévy, C., and Marcelino, A.. (2003). Repeatability in hedonic sensory measurement: a conceptual exploration. Food Quality and Preference 14, 165–176.
Kreuzbauer, R., and Malter, A.J. (2005). Embodied cognition and new product design: changing product form to influence brand categorization. Journal of Product Innovation Management 165.

Page 168
Kreuzbauer, R., and Malter, A.J. (2007). Product Design Perception and Brand Categorization. Advances in Consumer Research 34, 240–246.
Kruskal, J.B. (1964). Nonmetric multidimensional scaling: A numerical method. Psychometrika 29, 115–129.
Labbe, D., Ferrage, A., Rytz, A., Pace, J., and Martin, N. (2015). Pleasantness, emotions and perceptions induced by coffee beverage experience depend on the consumption motivation (hedonic or utilitarian). Food Quality and Preference 44, 56–61.
Ladwein, R. (1995). Catégories cognitives et jugement de typicalité en comportement du consommateur. Recherche et Applications En Marketing 89.
Lange, C. (2000). Etude de l’effet des caracteristiques sensorielles, des attentes induites par l’information et du prix sur l’acceptabilite et le comportement d’achat du consommateur (Dijon).
Lange, C., Rousseau, F., and Issanchou, S. (1998). Expectation, liking and purchase behaviour under economical constraint. Food Quality and Preference 10, 31–39.
Laros, F.J.M., and Steenkamp, J.-B.E.M. (2005). Emotions in consumer behavior: a hierarchical approach. Journal of Business Research 58, 1437–1445.
Lawless, H.T. (1989). Exploration of fragrance categories and ambiguous odors using multidimensional scaling and cluster analysis. Chem. Senses 14, 349–360.
Lebart, L., Morineau, A., Piron, M. (1997). Statistique exploratoire multidimensionnelle.
Lelièvre, M. (2010). De la première gorgée de bière au concept : le même processus pour tous ? Effet de l’expertise sur la catégorisation et la représentation des bières (Dijon).
Lelièvre, M., Chollet, S., Abdi, H., and Valentin, D. (2008). What is the validity of the sorting task for describing beers? A study using trained and untrained assessors. Food Quality and Preference 19, 697–703.
Lemaire, P. (1999). Psychologie cognitive (De Boeck Supérieur).
Lenglet, F. (2014). Influence of terroir products meaning on consumer’s expectations and likings. Food Quality and Preference 32, Part C, 264–270.
Ludden, G.D.S. (2008). Sensory incongruity and surprise in product design. Dissertation. TU Delft, Delft University of Technology.

Page 169
Ludden, G.D.S., Schifferstein, H.N.J., and Hekkert, P. (2007). Surprising the Senses. Senses & Society 2, 353–359.
Ludden, G.D.S., Kudrowitz, B.M., Schifferstein, H.N.J., and Hekkert, P. (2012a). Surprise and humor in product design: Designing sensory metaphors in multiple modalities. Humor: International Journal of Humor Research 25, 285–309.
Ludden, G.D.S., Schifferstein, H.N.J., and Hekkert, P. (2012b). Beyond surprise: a longitudinal study on the experience of visual-tactual incongruities in products. International Journal of Design 1.
MacFie, H. (2007). Consumer-Led Food Product Development (Elsevier).
Machery, É. (2004). Les concepts ne sont pas une espèce naturelle : la notion de concept en psychologie cognitive (Paris 4).
Margolis, E. (analytic) (1994). A reassessment of the shift from the classical theory of concepts to prototype theory (English). Cognition 51, 73–89.
Marr, D. (1982). Vision : a computational investigation into the human representation and processing of visual information (Freeman).
Marr, D., and Nishihara, H.K. (1978). Visual information processing: artificial intelligence and the sensorium of sight. Technology Review 28.
Masmoudi, S. (2010). Percept – Concept – Décision : les secrets d’un cheminement émotif et motivé. In Neurosciences & cognition, pp. 51–98.
Masson, J., Aurier, P., and D’Hauteville, F. (2009). Faut-il le dire ou le faire déguster ? Effet de l’information sensorielle et non-sensorielle sur la catégorisation d’un nouveau produit alimentaire. (Londres, Angleterre),.
Mcgurk, H., and Macdonald, J. (1976). Hearing lips and seeing voices. Nature 264, 746.
Medin, D.L., and Schaffer, M.M. (1978). Context theory of classification learning. Psychological Review 85, 207–238.
Medin, D.L., Lynch, E.B., Coley, J.D., and Atran, S. (1997). Categorization and reasoning among tree experts: do all roads lead to Rome? Cogn Psychol 32, 49–96.
Meiselman, H.L. (2013). The future in sensory/consumer research: ……….....evolving to a better science. Food Quality and Preference 27, 208–214.
Meiselman, H.L. (2015). A review of the current state of emotion research in product development. Food Research International 76, Part 2, 192–199.

Page 170
Mellers, B., Fincher, K., Drummond, C., and Bigony, M. (2013). Chapter 1: Surprise. A belief or an emotion? Progress in Brain Research 202, 3–19.
Di Monaco, R., Cavella, S., Di Marzo, S., and Masi, P. (2004). The effect of expectations generated by brand name on the acceptability of dried semolina pasta. Food Quality and Preference 15, 429–437.
Morrot, G., Brochet, F., and Dubourdieu, D. (2001). The color of odors. Brain Lang 79, 309–320.
Murphy, G. (2004). The Big Book of Concepts (MIT Press).
Murphy, G.L., and Medin, D.L. (1985). The role of theories in conceptual coherence. Psychological Review 92, 289–316.
Neisser, U. (1967). Cognitive Psychology (Englewood Cliffs, N.J: Prentice Hall).
Olson, J.C., and Dover, P.A. (1979). Disconfirmation of consumer expectations through product trial. Journal of Applied Psychology 64, 179–189.
Olson, J.C., and Jacob, J. (1972). Cue Utilization in the Quality Perception Process.
Park, C.W., and Lessig, V.P. (1981). Familiarity and Its Impact on Consumer Decision Biases and Heuristics. Journal of Consumer Research 8, 223–230.
Pecher, D., and Zwaan, R.A. (2005). Introduction to Grounding Cognition: The Role of Perception and Action in Memory, Language, and Thinking. In Grounding Cognition, (Cambridge University Press),.
Pelchat, M.L., and Pliner, P. (1995). “Try it. You’ll like it.” Effects of information on willingness to try novel foods. Appetite 24, 153–165.
Pineau, N., Schlich, P., Cordelle, S., Mathonnière, C., Issanchou, S., Imbert, A., Rogeaux, M., Etiévant, P., and Köster, E. (2009). Temporal Dominance of Sensations: Construction of the TDS curves and comparison with time–intensity. Food Quality and Preference 20, 450–455.
Piqueras-Fiszman, B., and Jaeger, S.R. (2014). The impact of the means of context evocation on consumers’ emotion associations towards eating occasions. Food Quality and Preference 37, 61–70.

Page 171
Piqueras-Fiszman, B., and Jaeger, S.R. Emotions associated to mealtimes: Memorable meals and typical evening meals. Food Research International.
Piqueras-Fiszman, B., and Spence, C. (2011). Crossmodal correspondences in product packaging. Assessing color–flavor correspondences for potato chips (crisps). Appetite 57, 753–757.
Piqueras-Fiszman, B., and Spence, C. (2012). The influence of the feel of product packaging on the perception of the oral-somatosensory texture of food. Food Quality and Preference 26, 67–73.
Piqueras-Fiszman, B., and Spence, C. (2015). Sensory expectations based on product-extrinsic food cues: An interdisciplinary review of the empirical evidence and theoretical accounts. Food Quality and Preference 40, 165–179.
Pliner, P., and Hobden, K. (1992). Development of a scale to measure the trait of food neophobia in humans. Appetite 19, 105–120.
Posner, M.I., Goldsmith, R., and Welton, K.E.J. (1967). Perceived Distance and the Classification of Distorted Patterns. Journal of Experimental Psychology 73, 28–38.
Prinz, J.J. (2002). Furnishing the Mind: Concepts and their perceptual basis (Cambridge).
Puumalainen, T., Nykopp, H., and Tuorila, H. (2002). Old product in a new context: Importance of the type of dish for the acceptance of Grünkern, a spelt-based traditional cereal. Lebensmittel - Wissenschaft + Technologie 35, 549–553.
Reed, S.K. (1972). Pattern recognition and categorization. Cognitive Psychology 3, 382–407.
Rivière, P. (2007). Satisfaction et insatisfaction: Contribution asymétriques des caractéristiques sensorielles à la formation du jugement hédonique des produits alimentaires. Thèse de doctorat. Agrocampus Rennes.
Rosch, E. (1978). Principles of Categorization [ ]/Eleonora Rosch. In Cognition and Categorization, E. Rosch, and B. Lloyd, eds. (Lawrence Elbaum Associates),.
Rosch, E., and Mervis, C.B. (1975). Family resemblances: Studies in the internal structure of categories. Cognitive Psychology 7, 573–605.
Rosner, B. (2011). Fundamentals of biostatistics / Bernard Rosner (Boston, Mass. : Brooks/Cole CENGAGE Learning, c2011.).

Page 172
Rozin, P., and Tuorila, H. (1993a). Simultaneous and temporal contextual influences on food acceptance. Food Quality and Preference 4, 11–20.
Rozin, P., and Tuorila, H. (1993b). Simultaneous and temporal contextual influences on food acceptance. Food Quality and Preference 4, 11–20.
Sabbe, S., Verbeke, W., Deliza, R., Matta, V., and Van Damme, P. (2009). Effect of a health claim and personal characteristics on consumer acceptance of fruit juices with different concentrations of açaí (Euterpe oleracea Mart.). Appetite 53, 84–92.
Schifferstein, H.N., Kole, A.P., and Mojet, J. (1999). Asymmetry in the disconfirmation of expectations for natural yogurt. Appetite 32, 307–329.
Schifferstein, H.N.J., Fenko, A., Desmet, P.M.A., Labbe, D., and Martin, N. (2013). Influence of package design on the dynamics of multisensory and emotional food experience. Food Quality and Preference 27, 18–25.
Schyns, P.G. (1997). Categories and percepts: a bi-directionnal framework for categorization. Trends in Cognitive Sciences 1, 183–189.
Sherif, M., Taub, D., and Hovland, C.I. (1958). Assimilation and contrast effects of anchoring stimuli on judgments. Journal of Experimental Psychology 55, 150–155.
Siegrist, M., and Cousin, M.-E. (2009). Expectations influence sensory experience in a wine tasting. Appetite 52, 762–765.
Siret, F., and Issanchou, S. (2000). Traditional process: influence on sensory properties and on consumers’ expectation and liking Application to “pâté de campagne.” Food Quality and Preference 11, 217–228.
Smith, E.E., Osherson, D.N., Rips, L.J., and Keane, M. (1988). Combining Prototypes: A Selective Modification Model. Cognitive Science 12, 485–527.
Spence, C. (2002). Multisensory attention and tactile information-processing. Behav. Brain Res. 135, 57–64.
Spence, C.-F., Betina (2012). Dining in the dark. Psychologist 25, 888–891.
Spence, C., and Deroy, O. (2013). How automatic are crossmodal correspondences?. Consciousness and Cognition 22, 245–260.
Steenkamp, J.-B.E.M. (1989). Product quality : an investigation into the concept and how it is perceived by consumers / Jan-Benedict E.K. Steenkamp (Assen/Maastricht, The Netherlands: Van Gorcum).

Page 173
Steenkamp, J.-B.E.M. (1990). Conceptual model of the quality perception process. Journal of Business Research 21, 309–333.
Stevenson, R.J., Prescott, J., and Boakes, R.A. (1999). Confusing Tastes and Smells: How Odours can Influence the Perception of Sweet and Sour Tastes. Chem. Senses 24, 627–635.
Teigen, K.H., and Keren, G. (2003). Surprises: low probabilities or high contrasts? Cognition 87, 55–71.
Thomson, D. (2007). SensoEmotional optimisation of food products and brands. In Consumer-Led Food Product Development, (MacFie H.), pp. 281–303.
Thomson, D. (2010). 9 - Going beyond liking: measuring emotional and conceptual profiles to make better new products A2 - Jaeger, Sara R. In Consumer-Driven Innovation in Food and Personal Care Products, H. MacFie, ed. (Woodhead Publishing), pp. 219–274.
Thomson, D.M.H., and Crocker, C. (2015). Application of conceptual profiling in brand, packaging and product development. Food Quality and Preference 40, 343–353.
Thomson, D.M.H., Crocker, C., and Marketo, C.G. (2010). Linking sensory characteristics to emotions: An example using dark chocolate. Food Quality and Preference 21, 1117–1125.
Tulving, E. (1985). How many memory systems are there? American Psychologist 40, 385–398.
Tuorila, H.M., Meiselman, H.L., Cardello, A.V., and Lesher, L.L. (1998). Effect of expectations and the definition of product category on the acceptance of unfamiliar foods12. Food Quality and Preference 9, 421–430.
Varela, F.J., Rosch, E., and Thompson, E. (1992). The Embodied Mind: Cognitive Science and Human Experience (MIT Press).
Varela, P., Ares, G., Giménez, A., and Gámbaro, A. (2010). Influence of brand information on consumers’ expectations and liking of powdered drinks in central location tests. Food Quality and Preference 21, 873–880.

Page 174
Versace, R., Labeye, E., Badard, G., and Rose, M. (2009). The contents of long-term memory and the emergence of knowledge. European Journal of Cognitive Psychology 21, 522–560.
Versace, R., Vallet, G.T., Riou, B., Lesourd, M., Labeye, É., and Brunel, L. (2014). Act-In: An integrated view of memory mechanisms. Journal of Cognitive Psychology 26, 280–306.
Wänke, M., Bless, H., and Schwarz, N. (1998). Context Effects in Product Line Extensions: Context Is Not Destiny. Journal of Consumer Psychology 7, 299–322.
Wilson, M. (2002). Six views of embodied cognition. Psychonomic Bulletin & Review 9, 625–636.
Wilson, A.D., and Golonka, S. (2013). Embodied Cognition is Not What you Think it is. Front Psychol 4.
Wu, L., and Barsalou, L.W. (2009). Perceptual simulation in conceptual combination: Evidence from property generation. Acta Psychologica 132, 173–189.
Yeh, W., and Barsalou, L.W. (2006). The Situated Nature of Concepts. The American Journal of Psychology 349.
Zampini, M., Wantling, E., Phillips, N., and Spence, C. (2008). Multisensory flavor perception: Assessing the influence of fruit acids and color cues on the perception of fruit-flavored beverages. Food Quality and Preference.

Appendices

Page 176
Appendix 1: study 1B, differences of categorization between subjects
Methodology The methodology is the same as for study 1b focused on the differences between contexts in
the concept condition.
Statistical analysis run are the same than for study 2B.
Results Analysis on Adjusted Rand Index matrices leads to 5 groups of subjects. We will take into
account only the first two groups of 30 and 8 subjects, the other groups being too
small. Configuration obtained for each of the two groups was compared with the configuration
of all the range of subjects. The ARV coefficient allow concluding on a dissimilarity between
the Group 2 and the overall panel (ARV = 0.488) and the Group 1 (ARV = 0.372) (Table 16).
Table 16: Table of ARV coefficients between configurations for each cluster and the whole set (global)
The configuration obtained from combinations of the first segment of subject shows four
distinct groups of products (Figure 39).
Figure 39: Configuration of products for group 1 of subjects (Kruskral’s stress = 0.045)
The first group of subjects made a difference between low-fat products (lower sugar and fat
content), white cheeses (thicker, fatty and sweet) and yoghurts.
Group 1 / Products’ configuration

Page 177
Group 2 of subjects made three distinct groups of products (Figure 40) differentiating
Activia brand from other products of the range. However, Gervais and Les 2 Vaches were
categorized apart.
Figure 40: Configuration of products for group 2 of subjects (Kruskral’s stress = 0.045)
Associations between products are different between the two clusters of subjects. Only Gervais
and Les 2 Vaches were grouped together by both clusters of subjects.
Group 2 / Products’ configuration

Page 178
Appendix 2: pre-study to define sensory and conceptual expectations of “a cold tea based on Zywiec Zdroj water”
Methodology The methodology used is extended focus-groups (EGD). Four focus-groups were
planned with 5 polish participants each. Each interview was a 3h-discussion. The consumers
were grouped among the age and the drink they were used to consume (flavored water and
cold tea) (Figure 41).
Figure 41: Description of each EGD
The interview was planned in two steps:
The first part was dedicated to investigate expectations toward “cold tea” category and based on
memory of consumers without tangible stimuli. First, general associations were collected,
meaning top associations with “cold tea”. Then each aspect of expectations was detailed by
consumers: context of consumptions, product characteristics and sensations expected and then
benefits. During the session, consumers could explain associations between conceptual and
sensory expectations.
The second part was dedicated to a blind tasting session. Ten products were selected from an
expert tasting session of 80 products (Figure 42). The aim was to propose a variety of sensorial
stimuli in a few numbers of samples in order to avoid saturation of consumers. Sensory
modalities explored were the following: visual (colors), flavor and basic tastes, somesthesia
(texture), and odor. For each product and for each sensory modality subjects had to assess the
fit with the cold tea category discussed in the first part. The aim of this part was to select real
stimuli for the following studies that fit with consumers expectations.

Page 179
Figure 42 : Ten products presented for the tasting session (Name of the sample on the left, sensory description made by expert on the key sensory modalities on the right)
Results
First associations collected from “cold tea” category were various in nature of knowledge: from
contextual information as “hot countries, summer, friends’ party”, to functional benefits as “quenches
thirst, freshness”, to emotional benefits “joy”, to sensations “peach flavor, sweet taste, amber”. The name
of a food category activates different kind of knowledge spontaneously.
Six situations of consumption have been elicited by consumers. For each situation they have associated
one motivation to consume the product to a specific context of consumption. Based on memory, they
also have associated sensations that emphasis the perception of the benefits in the products. The six
situations are the following:
“On the go”: it’s an on-the-go situation, an impulsive situation while the subject is walking in
the street, and get thirsty. The related benefits are the sense of freshness, the refreshment, and
the cooling down. “Buying ice tea is a quite spontaneous thing… I’m walking down the street,

Page 180
suddenly feel thirsty, so I go to the store and buy a small ice tea…”. The product need to be not
too sweet to emphasis this cooling down effect with lime, lemon or mint aromas.
“Exotic”: the context is during the summer, or holidays, when the subject wants to relax. Benefits
related to the products are the pleasure of taste, the relaxation and the summer laziness and the
motivation to try something new or exotic. “When you drink ice tea you feel more refreshed.
You just grab an ice tea from the fridge in the summer and you’re good…”. Therefore, key
sensations associated to the situation are the sweeter flavor, the intensive taste of fruit and also
unusual fruit aromas as mango, acerola or acai berry.
“Energy”: the situation is focused on the social context, meaning going out with friends on a
party or on barbecues for example. The main motivation is to get some energy, stimulation. The
product has also a specific role of image-related benefits because the subject is in a specific social
context. “I’m in a club, it’s really hot, there’s music playing. It’s a non-alcoholic party. People
just have tea with lots of ice and lemon in their glasses and are having fun.” Expected
sensations are an intensive taste of tea associated to energy with “invigorating” flavors as lemon
or mint.
“Physical activities”: the motivation for the subject is to hydrate itself and replenish in minerals
after a physical activity. This situation is focused on the quality of the product and the mineral
content. “More refreshment from the water, there are more minerals – it’s something you
drink e.g. after bicycle riding”. Therefore, the water is important in the product because it
brings all the minerals and electrolytes to the subject. The product is, so, expected to be less
intensive in color, taste and sweetness to emphasis the presence of the water.
“Family”: the context of consumption is during a meal, with the family and the children.
Conceptual associations are related to healthiness and naturality because the targeted
consumers are the family members. “For me it’s a tea that’s good for a meal… because how
much Coca-Cola can one drink? At home, I drink ice tea, with fries, with dinner in general…”
As the product is more natural, then the sweetness comes from the fruit and it is cloudier with
“real” fruit fragments and with polish fruit aromas namely homely flavor.
“My moment”: the aim of this situation is to have a moment just for ourselves, to relax, after
work. The situation is associated to the pleasure of taste (and more specifically of the fruit) and
to the relaxation, chilling out benefits. “I'm on the porch and I'm happy. I'm sitting in a chair,
and there is all of this heat around, crickets buzzing, and I'm sitting with cold tea and I’ąm
relishing with taste. You can see green, garden, shrubs, trees…” The product attributes
expected by the subject to emphasis this pleasure of taste are the rich flavor and the slight
sweetness added and the homely fruit taste.
From the first part, understand sensory expectations are more difficult. For each subject, expectations
are based on an individual reference in memory. Therefore, understand what could be a “slight
sweetness”, or what could be acceptable as “cloudy” for the consumers is difficult. This is why the second
part based on real stimuli is helping us providing a referential for each sensory modality.

Page 181
Results based on memory for expected sensations have shown that a “cold tea” is a product based on tea
and fruit and structured by three main sensory dimensions: the sweetness, the intensity of fruit and the
intensity of tea (Figure 43). Based on the tasting, results have highlighted that some specific sensory
modalities are rejected and don’t fit with the category: non-sweet product, sparkling product, herbal
aroma as chamomile. These kinds of rejections can be discussed as the influence of the memory in the
product perception even for non familiar products. Therefore, a stimulus is never perceived as new, but
always associated to an existent stimulus. Products with an intensive taste of fruit without tea are also
rejected. Furthermore, even if the slight sweetness has been mentioned in the first part as a criterion
that fits with the category, in the tasting part the sweetest product have been elicited by the consumers
as fitting the best on the sweetness modality with the “cold tea category”. This result highlight the role
of the memory and more precisely of the referential inducing a bias in the perception of consumer. Some
other modalities have shown this gap between the first and second part as the visual criterion: the
intensive color and cloudiness elicited in the first part, are not fitting in real with the category even if the
product is based on fruit juice.
Figure 43 : Sensory perception of consumers for each product among three main sensory modalities (sweetness, tea intensity and fruit intensity)

Page 182
Appendix 3: study 3A, analysis of verbatim

Page 183
For WP1:
Case 1: “”strong”, “light”, “other flavor”, “very sweet”, “refreshing taste”
Case 2: “no smell or aroma”, “not very intense”, “too sweet”
Case 3: “colored”
For WP31:
Case 1: “light”, “other flavor”, “very sweet”
Case 2: “too sweet”, “ good flavor”, “nice smell”
Case 3: “colored”, “flavoured”
For Tymbark:
Case 1: “other flavor”, “very sweet”
Case 2: “nice smell”, “nice color”
Case 3: “colored”, “flavored”
For P2-1:
Case 1: “colored”, “strong”, “very sweet”
Case 2: “nice smell”, “nice color”
For P3-1:
Case 1: “colored”, “very sweet”
Case 2: “nice color”
Case 3: “flavoured”
For Elisabethen Quelle Lime:
Case 1: “colored”
Case 3: “flavored”
Case 4: “No smell or aroma”

Page 184
For Volvic Mint Tea:
Case 1: “strong”, “other flavor”, “very sweet”, “tea”
Case 2: “Minty”, “good flavor”, “nice smell”, “nice color”
Case 3: “colored”
Case 4: “golden color”
For Honest Tea:
Case 1: “strong”, “other flavor”, slightly sweet”, “tart”,
Case 2: “cloudy”, “good flavor”
Case 3: “colored”
Case 4: “unpleasant color”
For Elizabethen Quelle Rooibos:
Case 1: “very sweet”
Case 2: “ fruity”, “good flavor”, “nice flavor”, “nice color”
Case 3: “colored”

Page 185
Appendix 4: study 3A, analysis of conceptual expectations

Page 186

Page 187
Figure 44: Frequency of associations for each board of expectation and product. The red straight line indicates the significance level.

Page 188
Appendix 5: Study 2B – Questionnaire of familiarity
Q1. Distance to tea range
Q1.1. Knowledge of tea range
Q1.1.1. Perceived knowledge (scale from 0 (I strongly disagree) to 4 (I strongly agree))
I feel competent about in my knowledge of tea Among my friends, I am the one who is the tea expert Compared to others, I know less about the subject of tea I don’t understand much about tea
Q1.1.2. Objective knowledge (codage 0 (wrong answer or I don’t know)/1(right answer))
Which country is the largest producer of tea in the world?
□ Bazil □ China □ Colombia □ Vietnam □ I don’t know
Before consumption, tea is :
□ Spice □ Leave □ Herb □ Root □ I don’t know
Main kind of tea (black, white, green) come from different :
□ Botanical varieties □ Geographic origins
□ Processes of transformation □ I don’t know
Tea is coming from the botanical variety Camellia…. :
□ Japonica □ Sasanquas □ Sinensis □ I don’t know
Do you know the difference between Green Tea, Black Tea and White Tea?
□ Not at all □ Yes, a little
If you do, check for each descriptor which kind of tea fit the best :
The most oxydised: □ Green Tea □ Black Tea □ I don’t know The richer in antioxydants: □ Green Tea □ Black Tea □ I don’t know The most consumed in the word: □ Green Tea □ Black Tea □ I don’t know English Tea: □ Green Tea □ Black Tea □ I don’t know Q1.2. Implication to tea range
(scale from 0 (I strongly disagree) to 4 (I strongly agree))
For me, tea is something really important Tea concerns me personally I am able to make tea drinks by myself
Q1.3. Consumption habits
Q1.3.1. Frequency of consumption of tea

Page 189
How often do you consume tea drinks?
How often do you consume homemade tea drinks?
How often do you buy tea drinks?
Q1.3.2. Consumption Usage and Habits for tea range
(scale from 0 (Never) to 4 (Daily))
Do you discuss about tea with your friends? Do you go for tea shopping yourself? Have you take lessons on tea? Do you read books on tea? Do you go on website or blogs on tea?
In which proportion do you drink tea alone or with other people?
Do you use to consume infusion prepared at home, with friends or family, with the following things:
Never Rarely Sometime Often
Tea or herbal bag □ □ □ □
Tea or herbal leaves □ □ □ □
Instant tea □ □ □ □
Electric kettle □ □ □ □
Casserole □ □ □ □
Teapot with a filter □ □ □ □
Tea filter in ball or teaspoon □ □ □ □
□ Never or rarely
□ Several times a month
□ Several times a week
□ Once a day
□ Two to three times a day
□ Four to five times a day
□ More than five times a day
□ Never or rarely
□ Several times a month
□ Several times a week
□ Once a day
□ Two to three times a day
□ Four to five times a day
□ More than five times a day
□ Never or rarely
□ Several times a month
□ Several times a week
□ Once a day
□ Two to three times a day
□ Four to five times a day
□ More than five times a day
Mostly alone
□
□
□ □
□ Mostly with other people

Page 190
□ Other : ……………………………………………………………………………………………………….. At home, you have: Tea bags □ Yes □ No Tea leaves □ Yes □ No Herbal tea bags □ Yes □ No Herbal tea leaves □ Yes □ No
Have you already buy tea for your own consumption in:
A supermarket: □ Yes □ No A tea shop: □ Yes □ No A delicatessen: □ Yes □ No A fair trade or organic specialised shop: □ Yes □ No Which are your criterias to select tea in a shop for your own consumption? - ……………………….. Give some brands of tea you know: - ………………………..
Which brand do you consume most often? - ……………………………….
Q1.3.3. Consumption Usage and Habits for cold tea range
In which proportion do you drink cold tea alone or with other people?
Do you use to consume cold infusion prepared at home, with friends or family, with the following things:
Never Rarely Sometime Often
Tea or herbal bag □ □ □ □
Tea or herbal leaves □ □ □ □
Instant tea □ □ □ □
Teapot with a filter □ □ □ □
Tea filter in ball or teaspoon □ □ □ □
□ Other : ……………………………………………………………………………………………………….. Have you already buy cold tea for your own consumption in:
A supermarket: □ Yes □ No A tea shop: □ Yes □ No A delicatessen: □ Yes □ No A fair trade or organic specialised shop: □ Yes □ No
Mostly alone
□
□
□ □
□ Mostly with other people

Page 191
Which are your criterias to select a cold tea drink in a shop for your own consumption? - ……………………….. Give some brands of cold tea drink you know: - ………………………..
Which brand do you consume most often? - ……………………………….
Q2. Brand implication
(scale from 0 (I strongly disagree) to 4 (I strongly agree))
Brand involvement
This brand is important to me This brand is relevant to me This brand means a lot to me This brand is useless to me This brand is trivial This brand is beneficial This brand is valuable This brand is uninterested This brand is exciting This brand is undesirable This brand is appealing
Brand loyalty
I consider myself loyal to this brand I consider this is the only brand of water drinks I need I buy this brand whenever I can I buy as much of this brand as I can This is the one brand I would prefer to buy or use I would go out of my way to use this brand If this brand was not available, it would make little difference to me
Q3. Food Neophobia Scale (scale from 0 (I strongly disagree) to 6 (I strongly agree))
I am constantly sampling new and different foods I don’t trust new foods If I don’t know what is in a food, I won’t try it. I like foods from different countries Ethnic food looks too weird to eat At dinner parties, I will try a new food I am afraid to eat things I have never had before I am very particular about the foods I will eat I will eat almost anything I like to try new ethnic restaurants

Page 192
Appendix 6: Qualitative pre-study defining affective judgment relating to sensory disconfirmation of expectations
Research question The purpose of the study is to investigate the affective states induced by a sensory
disconfirmation of expectations in a food consumption context. This exploratory
study is defined to:
Check that sensory disconfirmation of expectations relating to food consumption
induces the same affective states as those found in the literature.
List the affective states induced by the different nature and degree of sensory
disconfirmation of expectations (sensory characteristic, benefit, and brand).
List the affective states integrating the variability of subjects regarding the usage of
the product.
Methodology
Procedure of interviews Interviews are focus-groups of two-hours duration following three steps (Figure 45).
Figure 45: Steps followed during the focus-group
The first step is dedicated to activate expectations. The moderator reads a sentence
inducing activation of a define ad-hoc category. No visual stimuli are given at this step. Subjects
have to then explain the characteristics that they imagine about the product. The description
is focused on the expected sensations. No consensus between subjects is required.

Page 193
In the second step, two products are tasted, one after the other, in the same order of
presentation for all the subjects. The first product is intended to illustrate a disconfirmation of
expectations. The second product is closer to expectations. The purpose of this order is to
reinforce affective states relating to confirmation. For each sample, following the tasting,
subjects have to fill in a self-administrated questionnaire with the affective states they felt after
consuming the product compared to what they had imagined. The aim is to collect individual
spontaneous reactions just after consumption without the bias of discussion and social
influence. Then a round table is organized to collect reactions and induce discussion about
affective states. The purpose is to understand differences of descriptions of affective states
among subjects. Then projective techniques are used to get access more easily to affective
aspects that could be difficult for subjects to explain. The first projective technique is to
describe the product through a creature that is not real (description and interaction with the
subject, what he thinks about it, what it inspires, etc.).
The third step is dedicated to identifying the most intense feelings each subject experienced
through the projective technique of the planets. The purpose is to imagine that each of the three
products (expected, first and second tasted) is a planet. Subjects have to describe the planet,
the environment, and the people that live there and how they feel about living there. At the end
of the exercise subjects are asked to choose the planet that is closest to the planet of the
expected product.
The nature of sensory disconfirmation and products Different parameters are taken into account to induce the different natures of sensory
disconfirmations of expectations: the source of the disconfirmation, the kind of stimulus (to
cover all the different ranges of products, the given information to activate the category and
the degree of disconfirmation (Table 17).

Page 194
Table 17: Description of the nature of sensory disconfirmation of expectations for each group of subjects
Focus-groups Group 1 Group 2 Group 3
Source of the
sensory
disconfirmation
Generic category Benefit Brand
Contextualization White cheese
category
Actimel to prepare
his/her day
Concept of the
brand “light drink”
Tasted products Product 1: stirred
yoghurt
Product 2 : white
cheese
Product 1: Actimel
Product 2 : Diluted
YOP under brand
Actimel
Product 1: Taillefine
Fiz
Product 2: Coca-
Cola 0%
Hypothesis of
degree of
disconfirmation
Product1 : High
Product 2: None
Product 1: Low
Product 2: High
Product 1: None
Product 2: Low
Hypothesis of sensory disconfirmation of expectations:
For group 1: the nature of sensory disconfirmation of expectations is induced by a lack
of texture of the stirred yoghurt.
For group 2: the benefit “be stronger and prepare for his/her day at breakfast” is
translated into sensory properties: an intense strawberry aroma with lemon notes.
Therefore the sensory disconfirmation is induced by proposing a product which has a
less intense in strawberry aroma and without lemon notes, e.g. a diluted YOP. Previous
marketing studies also have shown that actual Actimel is not exactly fitting with this
benefit.
For group 3: the concept associated with the brand Taillefine is a light, sparkling drink
portraying the image of pleasure and well-being; a natural product that provides
hydration. This concept is translated into a product: Taillefine Fiz , a drink with a fruit
aroma with an intense taste of water. Therefore based on the knowledge provided by
the marketing team, Coca Cola 0% was proposed as an alternative inducing a
disconfirmation.
Subjects The recruitment of subjects was made following these criterions:
For group 1: 50% were frequent consumers of white cheese, namely twice a week, of
any brand.

Page 195
For group 2: 50% of the subjects were consumers of Actimel for the motivation and the
context of consumption presented at the beginning of the study ,i.e. to be stronger and
be prepared for the day ahead at breakfast. The remainders of the subjects consumed a
similar drink to Actimel, but a different brand, but for the same reasons and context.
For group 3: 100% of the subjects were consumers of light drinks, and 50% of them
were consumers of Taillefine Fiz, the other 50% were consumers of Coca Cola 0%. The
frequency of consumption was at least twice a week.
Contextualization The first part of the focus-group is dedicated to contextualizing the tasting, namely to
activate expectations in consumers’ mind related to the category we want to address.
For group 1, contextualization is made with the sentence « White Cheese » without
a specific context associated.
For group 2, contextualization is made by evoking the situation of consumption
through the following sentence: « Think about a product that you consume in the
morning at home after getting up, a product that strengthen your immunity and
better prepares you for your day. Now imagine that you are consuming an
Actimel for this purpose.”
For group 3, contextualization is made by evoking the concept attached to the brand
Taillefine Fiz through the following sentence: “Imagine that you are drinking a
light, sparkling beverage. This drink contains 0% calories to mix pleasure and
well-being. This beverage is based on mineral water with thousands of fine
bubbles, adapted to the pleasure of the moment without sacrificing its nutritional
balance. This is a natural beverage, ensuring hydration and facilitating the
consumption of 1.5 liter of water per day while maintaining its nutritional
balance”.
Products For each group, two cases of sensory disconfirmation are proposed through the tasting of
two different products.
For the first group, the product selected for the disconfirmation case is stirred
yoghurt and the product selected for the confirmation case is white cheese. The
products were presented for tasting in white plastic cups without brand names or
markings.
For the second group, the two products were selected for the tasting and were
assessed before the session by sensory experts. The light disconfirmation case was
illustrated by using the actual strawberry Actimel. The high disconfirmation case

Page 196
was illustrated by using a Yop diluted with full-cream milk. This mix is described
by sensory experts as less strawberry intense without lemon notes and sweeter.
There were no differences in the texture between the samples. The two samples
were served in white plastic cups under the same brand Actimel.
For the third group, the first product illustrating the confirmation case was
Taillefine Fiz, fruitier and more watery. The second product illustrating a
disconfirmation case was Coca Cola 0%. Both have the same lemon aromatization.
The two samples were served in clear glass bottles with the brands marked on them.
Moderation and analysis Moderation and analysis were done by external professionals in qualitative research.
As the purpose of the study was to provide an exhaustive list of affective reactions, no
quantification of elicitations was made. A transcription of each group’s interview was made,
allowing us to understand each affective item elicited by consumers and also relating them to
a defined context.
For each feeling, a description based on criteria of categorization of emotions was made:
intensity of the feeling, intensity of the stimulus (or degree of disconfirmation) and valency.
Results
Main affective states induced by sensory disconfirmation of expectations The initial outcome of these interviews is an exhaustive list of affective items explaining the
nature of sensory disconfirmation of expectations. The final list is compared and homogenized
with literature. From the whole set of affective items elicited by subjects, the following are
selected:
surprise : allows to detect a sensory disconfirmation of expectations
serenity : translating a confirmation of expectations
satisfaction: translating a confirmation of expectations related to the whole product
experience
pleasure translating a confirmation of expectations related to an organoleptic
aspect of the product
frustration translating a negative disconfirmation of expectations related to
previous experiences of the product, and more precisely to the benefit or the
motivation to consume the product
deception translating a negative disconfirmation of expectations related to an
organoleptic aspect of the product

Page 197
confusion translating a negative disconfirmation of expectations related to a non-
recognition of the product
perturbation translating a negative disconfirmation of expectations related to the
motivation to consume the product, i.e. the ad-hoc category.
Indifference translating boredom, more precisely a negative disconfirmation of
expectations for subjects that don’t recognize the benefit in the product.
‘Sadness’ is suppressed from the list. Indeed interviews are a more effective way of accessing
more intense affective states compared to an auto-administrated questionnaire. ‘Oppression’
and ‘apprehension’ are renamed ‘confusion’ because of the closeness of these two items.
As affective states are related to context, the list is set out in sentences (Table 18).
Table 18: list of affective items induced by a sensory disconfirmation of expectations
Surprise
I’m disappointed by this product
I feel confused because I can’t recognize the product
I feel perturbed by this product
I feel frustrated after eating this product
I took pleasure eating this product
I am indifferent to this product
This product makes me feel serene
I feel satisfied with this experience
Variability of affective items among the nature of disconfirmation
Different categories of affective feelings are elicited by consumers.
For the first group of subjects, disconfirmation of expectations is induced only by one
sensory property necessary to define category « White cheese »: the thick texture. Therefore,
affective items specific to this group are induced by a sensory disconfirmation of expectation
without the influence of other information and directly related to the recipe.
The first product, stirred yoghurt, induces deception in subjects as a first affective state.
This feeling is related systematically to the taste of the product by consumers and more

Page 198
precisely to the texture of the product: “I’m disappointed, this product is not likeable and lacks
of texture”. Subjects emphasize the large gap between what they expected and the actual
product proposed for the tasting. This result shows that deception is associated with a
difference between expectations and perception focused on sensory information only.
Deception has a negative valence: “When I taste the white cheese, it’s a con, a deception. We
don’t deserve that ». This item is elicited by 5 subjects out of 6 in the group and perceived as
the most intense. To sum-up on deception: deception is a negative item perceived as intense
and induced by a high degree of sensory disconfirmation and focuses on the sensory
characteristic of the recipe.
The second product, white cheese, induces pleasure for subjects and is perceived as
being closer to what they were expecting than the first product. Among subjects, depending on
their usage this product, it matches their expectations, or is a light disconfirmation to their
expectations. The valence of this item is positive: « it’s a pleasure; it’s perfect, as thick as I like
it”. In the same way as for deception, it relates to the organoleptic aspect of the product “I want
to put my finger in it because it is smooth […] it’s a pleasure, the greediness”. This feeling is
stated as the most intense, as a positive one, by the entire group of consumers. Pleasure is also
associated with the context of the consumption of the product, as the subjects elicit this
verbatim by referring to the specific context of consumption. Indeed, the link with the sensory
dimension, the thick texture, influences the moment of consumption more generically which
becomes a moment of plenitude « atmosphere of relaxation », « it makes me serene ». To
sum-up, pleasure is a positive item perceived as intense and induced by a high degree of
confirmation of expectations focused on the sensory characteristics of the recipe.
Recognition of the taste is also elicited by a large number of subjects. However, this aspect is
not taken into account because this is less a feeling than the expression of a discomfort that the
product is not congruent with the expectations, namely the category activated in the minds of
subjects before consumption. Nonetheless this item allows us to check the fact that the
disconfirmation we wanted to induce by presenting the stirred yoghurt was a success.
Moreover, it also ensures the nature of the disconfirmation focused only on the sensory
characteristic of the recipe: the texture.
For the second group sensory disconfirmation relates to the association between sensory
properties perceived in the recipe and the situation of the consumption of the Actimel brand.
The first product tasted is Actimel inducing among subjects, depending on their usage, either
a confirmation of their expectations or a light positive or negative disconfirmation of their
expectations. The mix with YOP induces for all the subjects a high negative disconfirmation of
expectations. Several affective items are specific to this group.

Page 199
The first feeling is perturbation induced by the discrepancy between the expectations related
to previous experiences with the product in the situation primed at the beginning of the
session: “I think that this is because I was thinking about my usual Actimel, and maybe
unconsciously I expected to feel the same sensation”. This is a negative item translating to the
non-recognition of the primed benefit in the recipe « I’m disoriented », « This is contradictory
with the taste and the freshness I have imagined », « I feel disturbed because I can’t recognize
the taste », « It is difficult to identify the brand ». This feeling is the most intense that 4
subjects out of 6 related to the mix with YOP. To sum-up, perturbation is an affective state
induced by a sensory disconfirmation of expectations related to association between
conceptual (benefit) and sensory property. It is the most intense negative state.
The second feeling is satisfaction: “this is hollow, tasteless, it leaves us unsatisfied”, “a feeling
of satisfaction because I really enjoy the taste and the freshness”, “I’m satisfied with the taste”.
This item is related by the subjects to the whole product experience, mixing the brand, context,
benefit and the taste, but it is expressed as a sensory satisfaction. Satisfaction is the positive
feeling that is the most elicited by subjects.
The third feeling is frustration elicited mostly by users of the product (3 subjects out of 6).
Furthermore, these consumers have a strong ritual associated with the consumption of the
product : “it’s a change compared to my eating habits and as it is a bit like a ritual in my
work”, “I feel frustrated”, “I feel like withdrawn”. This is a negative item induced by a
discrepancy between the brand Actimel that is recognized and the non-recognition of the
sensory pattern related to the primed situation of consumption. In other words, the category
Actimel is well identified by the subject, but sensory information perceived is not congruent
with the usual situation of consumption.
The fourth feeling is sadness which has a negative valence and is induced by a high
disconfirmation of expectations related to a discrepancy of sensation translating to the benefit.
In other words, the benefit is not recognized in the recipe through the sensory characteristics.
Intensity of feeling is high: “I feel sad with this product”, “inhabitants of this planet are all sad
people, forced to live”. This item is not consensual (1 subject out of 6) and is only induced for
subjects that have strong expectations related to the product.
Deception is also evoked in this group but is still related to a sensory characteristic defining
the generic category: « deception for me […] the strawberry aroma is a too big change
compared to my habits ». Here the sensory disconfirmation of expectations relates to the
presence of the strawberry aroma and not to the situation of consumption. Deception has the
same effect as described above for the first group, as a negative item relating to an organoleptic
aspect of the product.

Page 200
Indifference is mentioned through the verbatim « boredom , “indifferent» by 4 subjects out of
6 that don’t recognize the expected benefit in the product “I don’t understand it and I don’t
care, I’m indifferent”, “this product lack of intensity […] it makes me bored”. This feeling is
negative and translates to a sensory disconfirmation of expectations.
The comparison with the usual eating habits of several subjects and the expression in the first
step of strong expectations toward the benefits energizing and good for health, allow checking
that feelings elicited after the consumption of the product are related to non-recognition of the
benefit in the product during the consumption.
For the third group, sensory disconfirmation of expectations is related to the concept
associated to the brand and translated through the sensory pattern of the recipe. Affective
feelings are induced by this nature of sensory disconfirmation, namely related to the benefit
associated with the brand and associated with sensory characteristics. Taking into account the
contextualization made in the first step, the analysis was more complex to dissociate feelings
induced by the benefits themselves “pleasure and well-being” from the feelings induced by the
consumption of each sample. This group was a specific one because it was the the only one to
be consensual on the case of confirmation. Therefore, feelings induced by the tasting of the
sample Taillefine Fiz remain as reflecting a confirmation of expectations.
Serenity is evoked by all the subjects and described as a positive item induced by a state of
appeasement and rest for the subject which correlates with the absence of cognitive dissonance
after consuming the product. Several words are used to describe this state; “serenity”,
“zenitude” “relax”.
Apprehension or oppression are also elicited but as negative items induced by the presentation
of the sample Coca Cola to the subjects. This product is not fitting with the category of sparkling
water and therefore is induced by non-recognition of the category “it’s unpredictable because
this is not a sparkling water”, “it’s a moment of apprehension”, and “I feel attacked,
oppressed”. This item is felt intense by the subjects.
Surprise as a common item Surprise is induced by all the subjects from the three groups and elicited whatever the
nature or the degree of the sensory disconfirmation. Each time this item is evoked by a subject,
they then provide a more detailed and precise explanation as to whether the reaction is
negative or positive. Indeed surprise is without valence and therefore needs an association to
another affective item: “I am pleasantly surprised ». This feeling has been evoked by different
words such as ‘astonishment’. During the interviews, surprise was the first feeling elicited by

Page 201
the subjects after the tasting of products. This is visible through facial expression on video
camera, but also with verbal expression such as « surprising compared to others ».
Variability of affective items among subjects The small number of subjects does not allow for a more general conclusion on the process of
affective feelings and on subjects’ variability. However, the analysis of results provided
between consumers allows for a hypothesis on the link between expectations and categories
activated in mind, and also on the influence of sensory disconfirmation on affective judgment.
Looking at the first group, two processes are described depending on the familiarity of the
subjects. For non-familiar subjects, sensory expectations related to the category remain
generic and based on a criterion that is necessary to define the structure of the category: the
thick texture. Activation of previous and old experiences (from the childhood for example) is
mentioned and acts as an aid to building expectations. For familiar subjects, the definition of
the category is related to a precise context. Mentioning the concept “white cheese” refers to a
precise category in mind based on a ritual experience of consumption in a defined context (for
example at breakfast or for dessert), with a given benefit (eating something pleasant without
feeling guilty) and completed by an affective dimension (my moment of pleasure). From this
result it is possible to make a hypothesis on an individual variability of associations between
the pattern of sensory information and the concept activated in mind inducing different
affective judgment. In addition, further results allow making a hypothesis on the fact that a
sensory disconfirmation can also address a disconfirmation of concept related to context,
benefit or affective dimension, because of the structural inferences of the categories.
Regarding the brand, a distinction is made between familiar and non-familiar subjects. A
familiar subject has many experiences relating to the same situation of consumption stored in
the memory which induces strong expectations because the category defined in mind is specific
and not generic. A non-familiar subject builds their expectations on the image associated with
the brand (Actimel is a good product for strengthen their immunity, so this is an alicament and
therefore, it has an unpleasant taste). In these cases, associations are made depending on the
understanding of the benefit carried by the brand for the subject.
To sum-up, results provided by the first hypothesis on an individual variability of affective
judgment, related to differences of structures of categories activated in the mind of consumers
before consumption, based on association between concepts and sensory patterns.
Methodological discussion The main difficulty of the study is to capture the emotions felt by the subjects. Indeed,
feelings are submitted by a process of normative assessment inducing a bias when the axis of
study is focused on declarative expression. Studies emphasize the behavioral component of

Page 202
emotions through several methods such as the study of facial expressions and physiological
variables (e.g. skin conduction measure or heartbeat frequency). Moreover discussing feelings
with a consumer may be difficult because of the main definition of the term. Feelings can be
understood to be an emotion, but also to be a sensation or a functional benefit (I feel freshness,
acidity). Therefore, working with projective techniques helps the subject to express emotional
feelings through the projection of an image he has built (Anzieu and Chabert, 2004). This
methodology can nonetheless be criticized as subjects can elicit emotional feelings during the
interview that they wouldn’t express in an everyday situation. Therefore the results provided
by this kind of methodology should be used carefully.
Finally, the difficulty defining the nature of the affective item felt by the subjects can be a
possible bias. Indeed it is necessary to distinguish the emotions that relate to the primed
expectations and the related benefits, from the emotions induced by the tasting of the product
and therefore the sensory disconfirmation. Indeed conceptual expectations can retrieve a set
of emotions (Thomson et al., 2010). Therefore feelings elicited by the consumers should be also
carefully analyzed to ensure that they are induced by the sensory disconfirmation and not by
the benefit itself.

Page 203
Appendix 7: Study 3B / Questionnaire of familiarity
Q1. Health-related promotion and prevention measure
(scale from 1 (I strongly disagree) to 7 (I strongly agree))
I often take pleasure to try improving my health Being successful in achieving my healthy objectives drives me to do more (ex: lose weight, reach a
fitness level) I don’t hesitate to make new experiences (ex: buying a new product) if I think that it can improve
my health I have an opportunity to improve my health, I take the advantage of it right away I see myself as somebody that don’t hesitate to do his best to improve his health I often think about health issues that could happen to me in the future I am often worried thinking about doing the wrong thing about my health When I am acting for my health, it’s often because I am seeking to avoid risk of disease
Q2. Distance to food with probiotics
Q2.1. Knowledge of food with probiotics
Q2.1.1. Perceived knowledge (scale from 0 (I strongly disagree) to 4 (I strongly agree))
I feel competent about in my knowledge of food with probiotics Among my friends, I am the one who know the best of food with probiotics Compared to others, I know less about the subject of food with probiotics I don’t understand much about food with probiotics
Q2.1.2. Objective knowledge (codage 0 (wrong answer or I don’t know)/1(right answer))
All good bacteria are probiotics □ Yes □ No □ I don’t know
Probiotics are living bacteria □ Yes □ No □ I don’t know
All of the dairy products contain probiotics □ Yes □ No □ I don’t know
Most of our immune cells are : □ In the brain □ In the wall of the intestine □ In the blood □ I don’t know
Probiotics are only used in the intestine □ Yes □ No □ I don’t know
Some probiotics can alleviate effectively diarrhea □ Yes □ No □ I don’t know
Everybody can consume probiotics, there is no contraindication □ Yes □ No □ Yes with one exception □ I don’t know

Page 204
A regular and adequate consumption of probiotics is enough to remain healthy □ Yes □ No □ I don’t know
Q2.2. Implication to food with probiotics
(scale from 0 (I strongly disagree) to 4 (I strongly agree))
For me, food with probiotics is something really important Choosing food with probiotics concerns me personally I am able to choose food with probiotics by myself
Q2.3. Consumption habits of food with probioticss
Q2.3.1. Frequency of consumption of food with probioticss
How often do you consume food with probioticss?
How often do you buy food with probioticss?
Q2.3.2. Consumption U&A for food with probioticss
(scale from 0 (Never) to 4 (Daily))
Do you discuss about food with probioticss with your friends? Do you go for food with probioticss shopping yourself? Have you take lessons on food with probioticss? Do you read books on food with probioticss? Do you go on website or blogs on food with probioticss?
In which proportion do you consume food with probiotics alone or with other people?
Q3. Familiarity with Actimel product (ATM)
Q3.1. Objective knowledge of Actimel product (codage 0 (wrong answer or I don’t know)/1(right answer))
Actimel is made from fresh milk :
□ Yes □ No □ I don’t know
Actimel is a fermented yoghurt :
□ Never or rarely
□ Several times a month
□ Several times a week
□ Once a day
□ Two to three times a day
□ Four to five times a day
□ More than five times a day
□ Never or rarely
□ Several times a month
□ Several times a week
□ Once a day
□ Two to three times a day
□ Four to five times a day
□ More than five times a day
Mostly alone □
□
□ □
□ Mostly with other people

Page 205
□ Yes □ No □ I don’t know
Which specific Lactobacillus is contained in Actimel?
□Ramnhosus □Acidophilus □ Casei □ I don’t know
How many of these specific ferments are contained in Actimel?
□ 10 thousands □ 10 millions □ 10 billions □ I don’t know
Q3.2. Frequency of consumption of Actimel
How often do you consume ATM?
How often do you consume Strawberry ATM?
Q3.3. Consumption U&A for Actimel
(scale from 0 (Never) to 4 (Daily))
Do you go on website or blogs on ATM?
In which proportion do you drink Actimel alone or with other people?
When do you drink ATM?(cf screener)
Where do you drink ATM?(cf screener)
Why do you drink Actimel ? (cf screener) --------------------------------------------------------------------------------- Q4. Brand implication (put here ATM logo + ATM name)
□ Never or rarely
□ Several times a month
□ Several times a week
□ Once a day
□ Two to three times a day
□ Four to five times a day
□ More than five times a day
□ Never or rarely
□ Several times a month
□ Several times a week
□ Once a day
□ Two to three times a day
□ Four to five times a day
□ More than five times a day
Mostly alone □
□ □ □
□ Mostly with other people
□ When I get up □ Other :________
□ At breakfast □ On the go to wortk
□ In the morning before lunch
□ At lunch □ In the afternoon
□ At diner or after
□ At home
□ In public transport
□ In my car □ At work □ At the cafeteria
□ Other :_____

Page 206
(scale from 0 (I strongly disagree) to 4 (I strongly agree))
Brand involvement
This brand is important to me This brand is relevant to me This brand means a lot to me This brand is useless to me This brand is trivial This brand is beneficial This brand is valuable This brand is uninterested This brand is exciting This brand is undesirable This brand is appealing
Brand loyalty
I consider myself loyal to this brand I consider this is the only brand of water drinks I need I buy this brand whenever I can I buy as much of this brand as I can This is the one brand I would prefer to buy or use I would go out of my way to use this brand If this brand was not available, it would make little difference to me

Page 207
Appendix 8: Detailed analysis of study 3C
A second step is to analyze affective items for the cluster 2 (Figure 46Erreur ! Source du
renvoi introuvable.).
Figure 46: Means of assessment of affective items for each product for cluster 2. Letters in bold show significant differences among products at α = 10%

Page 208
An analysis of the quotations for affective items provided by cluster 2 show no significant
differences between products, except for confusion. For this negative item, ranking of the
products is not equivalent to the fitting with expectations. YOP and the mix Yakult have
significantly higher quotations for the confusion item, but also for the fitting with expectations.
In conclusion, this cluster of subjects is not discriminative for affective items. Regarding the
few differences between products for the fit with expectations, almost all the products are close
and fit with expectations, this could explain the fact that only one affective item, confusion, is
discriminative among products.
Thus, for cluster 2, as there is no disconfirmation of expectations, so there is no
discrimination among products by affective states.
Third step is the analysis of affective items for the cluster 3 (Figure 47Erreur ! Source du
renvoi introuvable.).

Page 209
Figure 47: Means of assessment of affective items for each product for cluster 3. Letters in bold show significant differences among products at α = 10%
Regarding cluster 3, results show significant differences among the products for 6 items out of
8. For the three positive items: serenity, satisfaction, and pleasure, significant differences can
be shown between the three products: standard, mix with plain and YOP having the highest
quotations and the mix with Yakult having the lowest quotation. This is aligned with the results
from the analysis of fitting with expectations. The same order of products has been highlighted.
However, these three items are less discriminative for the three products (YOP, standard and
mix with plain). This can be explained by the low gap between these products on the fit with
expectations. Regarding the negative items, only the item deception follows a reverse pattern
of quotation compared to positive items, namely the mix with Yakult which has the highest
quotation on deception and the lowest fit with expectations. Regarding frustration and
confusion, the ranking of products does not reflect a reverse pattern of the fit with expectations.
The chart on confusion highlights significant differences between the mix with Yakult and YOP,
namely the product fitting the best and the product fitting the least well with the expectations.
Frustration is a more discriminative item showing the same significant differences for
confusion, but also between standard and the mix with Yakult and also mix with plain and
YOP. The ranking of the products is not identical, but is almost the same. Therefore, frustration
is better to discriminate samples and more sensitive to the degree of disconfirmation of
expectations. Regarding perturbation and indifference, there are no significant differences
among products.

Page 210
To sum-up on cluster 3, most of affective states allow discriminating samples
aligned with analysis from fitting to expectations.
The influence of the nature of the disconfirmation on the affective judgment (H3)
Analysis of sensory characteristics The second analysis for cluster 2 is shown in Figure 48 and explains the sensory perception
inducing the disconfirmation.
Figure 48: Percentage of elicitations of the reasons why the product does not fit with expectations. Percentage of descriptors superior to 5% have been retained.
For cluster 2, there is no higher percentage of elicitation than 20% for one specific product.
There is no sensory disconfirmation of expectations for all the product set. Therefore, results
provided by the description are aligned with these conclusions.
The third analysis for cluster 3 can be shown in Figure 49 and it explains the sensory
perception inducing the disconfirmation.

Page 211
Figure 49: Percentage of elicitations of the reasons why the product does not fit with expectations. Percentage of descriptors superior to 5% have been kept.
The mix with Yakult is described as too sweet (44%), too liquid (30%) and artificial (30%).
Moreover, the standard is described by 27% of the subjects as low strawberry intense. The mix
with Yakult has the highest degree of sensory disconfirmation of expectations explained by a
high sweetness perceived in the product, the texture and the artificial property. The standard
has a lower degree of disconfirmation explained by a too low strawberry intensity perceived in
the product. However there is no clear higher frequency of elicitation for YOP and the mix with
the plain.
Analysis of benefits

Page 212
Figure 50: Means of assessment of fitting with benefits for each product for cluster 2. Significant differences at 10% are illustrated by circles
For cluster 2, significant differences on assessment are only visible for the board “Physical
activities”. These results are aligned with the absence of the disconfirmation of expectations
for these consumers.
Figure 51: Means of assessment of fitting with benefits for each product for cluster 3. Significant differences at 10% are illustrated by circles

Page 213
For cluster 3, the results show a significantly lower assessment for the match with the five first
benefits for the mix with Yakult. This aligns with the results provided by the analysis of the
fitting with expectations.
Analysis of contexts
For cluster 2, analyses provide the same answer as for cluster 1.
Table 19 : Frequencies of check for each product and each context for cluster 2 Coloration: significant higher frequencies per product between contexts.
Bold letter: significant differences per context between products.
“Usage for breakfast” is the only context showing a significantly higher frequency of
association. The same conclusion can be made about the priming. There are no differences
among the products on context fitting which aligns with the fact there are no clear
disconfirmant product for this cluster of consumers.
For cluster 3, the same conclusion can be made based on the significant differences among
contexts (Table 20).
Table 20: Frequencies of check for each product and each context for cluster 3. Coloration: significant higher frequencies per product between contexts.
Bold letter: significant differences per context between products.
« Usage for breakfast » has a significantly higher association to all the products highlighting
the success of the contextualization. Regarding differences among products, the mix with
Yakult has the lowest frequency for « Usage for breakfast » which is aligned with the ranking
of products on the fit with expectations. Indeed, as cluster 3 is a group of consumers rejecting
the mix with Yakult as a clear disconfirmant product, this explains why this product has been
significantly less associated with the primed context. Another point is that even if YOP and the
standard have been significantly discriminated on the fit with expectations, they have the same
frequencies of association with the right context.
Cluster 2Usage just
after getting up
Usage for breakfast
Usage on the go before work
Usage during
the m orning
Usage at lunch
Usage after
sports
Usage in the
afternoon
Usage during dinner
Usage after
dinner
Usage other
Standard 14 32 13 13 6 10 7 1 5 3Standard + plain 12 37 17 16 2 9 6 1 3 2
Standard + Yakult 15 37 16 16 4 9 5 0 5 2Yop 13 35 10 18 5 8 4 1 5 5
Cluster 2Usage just
after getting up
Usage for breakfast
Usage on the go before work
Usage during
the m orning
Usage at lunch
Usage after
sports
Usage in the
afternoon
Usage during dinner
Usage after
dinner
Usage other
Standard 13 27 11 14 2 10 6 2 5 2Standard + plain 11 23 10 10 2 9 3 0 3 0
Standard + Yakult 7 18 5 8 0 8 3 1 2 4Yop 10 27 12 15 2 12 5 2 6 4

Page 214
Appendix 9: Article submitted in Food Quality and Preference
What can consumers really do in a sorting task of strawberry fresh dairy products?
Rizzo-Ivanoff Sabine1,2,3, Rogeaux Michel1, Boesen-Mariani Sabine1, Giboreau Agnès2,3
1. Sensory and Behavior Science
Danone Research
RD 128, 91767 Palaiseau Cedex
France
2. Research Center for Food and Hospitality Research
Institut Paul Bocuse
69130 Ecully
France
3. Université Lyon 1, CRNL
Page 215
Abstract
Industries currently run tests with consumers in order to get their insights on the perceptions
of a product range. Asking the consumer to follow a complete procedure has implications on
their attention span. When the consumer is dealing with different kinds of tasks, this attention
is somewhat flexible. Thus, the reliability of the information obtained by these consumer tests
can be challenged. The Free sorting task is frequently used in sensory evaluation of products
in industry in order to understand consumers’ perception of a product space. The aim of this
research is to assess the reliability of results when dealing with repetitive procedures applied
to the sorting task. The relevancy will be assessed through the study of the repeatability of the
sorting task by naïve subjects in blinded presentation. 36 subjects were recruited to sort 9
different strawberry yoghurts. Three sorting tasks were realized on intervals of 30 minutes and
one week. Results show a good repeatability on long term delay. On the contrary, repeatability
on short term interval is not conclusive. To conclude, the results allow us to provide
recommendations on what we can ask of consumers in respect to their time of required
attention, the difficulty of the task and the lapses of time between sessions.
Key-words
Sorting; Repeatability; Consumer; Yoghurts; Description
Highlights
We discuss the ability of consumers to follow three sorting tasks on fresh dairy products at different delays
We highlight the poor repeatability of subjects especially on a short-term delay We provide recommendations on consumer test designs to avoid attentional bias
1. Introduction

Page 216
Consumer tests are applied in order to better understand perception and predict future choices
in real life (Köster, 2009). Consumers have to taste products and assess at the same time
several sensory and conceptual aspects. In other words, naïve subjects have to follow a
procedure that they are not used to. This induces an expense of cognitive effort and time for
them. More and more methods are involving consumers with the ultimate objective of getting
clear recommendations on their sensory perceptions (Ares et al., 2014; Delarue and
Sieffermann, 2004; Meyners, 2016; Moussaoui and Varela, 2010; Vidal et al., 2014). These
studies show that naïve subjects are able to provide almost the same results as experts.
However, experts are highly trained on description and on specific product ranges, meaning
that they are used to staying concentrated for a specific length of time while tasting and
assessing the products simultaneously. Asking the consumer to follow the whole procedure
requires their selective attention, meaning that the subject has to focus on specific attributes
of the stimulus (Masmoudi et al., 2010). This sustained attention is described as the
concentration needed for the subjects to accomplish the task (Spence, 2002). This type of
attention is quite consuming of cognitive resources.
Thus, a possible bias due to a lack of consumers’ attention (Jaeger, 2014) is the
induction of wrong predictive answers. Jaeger presented at the end of the 6th Eurosense
conference (2014) a study showing the poor commitment of consumers at the end of a test
(Jaeger, 2014). Simple instructions were given to subjects: a scale was presented with a square
below. Consumers were asked to not write on the scale but to tick the square. Results showed
that most of them still wrote on the scale. Therefore, even for a simple task and taking into
account the length of the procedure and the attention subjects have to pay to the assessment,
it seems necessary to challenge what can be asked of consumers to keep the results closer to
their real perception.
To illustrate this idea, we uses as an example one of the easiest tasks: free sorting. The
reliability of the results was assessed through the study of the repeatability of the sorting task
with naïve subjects under blinded presentation.

Page 217
The Sorting task is a methodology frequently used in consumer studies (Faye et al., 2004;
Mielby et al., 2014), having psychological foundations (Pothos et al., 2011). It reveals the
categories in subjects’ minds in a quick way. This methodology is intuitive and easy to apply,
even with children (Varela and Salvador, 2014). Many studies show that consumers, naïve
subjects not trained in description, can follow the procedure quite easily and we can see the
same results as expert panelists (Valentin and Chollet, 2000). Subjects are asked to group
products according to their perceived similarities and dissimilarities. The method has been
applied on odors (MacRae et al., 1992), beers (Chollet et al., 2011), water (Falahee and MacRae,
1997), virgin oil (Santosa et al., 2010), solid foods such as cereals (Cartier et al., 2006), or
yoghurts (Cruz et al., 2013). It has also been applied to non-food products such as tissues (Faye
et al., 2004).
The repeatability of the sorting task with consumers has already been studied on 17 odors with
eight naïve subjects (MacRae et al., 1992). Participants went through four repetitions in one
week. Results highlighted a consistent grouping of the molecules and an easiness to achieve
the task. It was also studied on waters (Falahee and MacRae, 1997): mineral, tap water and
distilled proposed with blended samples. Twenty subjects assessed nine blinded products.
Results showed a grouping of duplicates and a good repeatability between the five sessions
done by the subjects. Regarding the results on the consistency of assessors, only three assessors
showed at least a fair agreement on the five sessions. Another study was realized on beer
(Chollet et al., 2011). Sixty-eight naïve subjects did two repetitions with a 15 minute interval
where products were presented blindly. The results showed good repeatability and a stability
of assessors’ categorization among sessions.
Therefore, sorting task seems to be repeatable with naïve subjects for drinks but without
consensual results on agreement between sessions. However, drinks or odors are perceived
less satiating than solid food (Hogenkamp et al., 2012). In fact for the same amount of calories,
a drink is consumed more quickly and bypasses the association between sensory signals sent

Page 218
to the brain and the satiety effect. Moreover, expectations linked to satiety are higher for a solid
food than a drink related to sensory cues (Hogenkamp et al., 2012). The implication for the
sorting task with solid food can be a difficulty tasting and discriminating all of the samples
because of saturation. Another repeatability study on cereal products (Cartier et al., 2006)
features 24 consumers who sorted 14 kinds of cereals. They ate them dry in blind. Five
repetitions were planned during the course of one week. Results proved the repeatability of the
sorting task on solid dry food. However, as texture is an important driver of satiety, it can
impact the results of repeatability on more textured whet food.
The repeatability of the sorting task on solid food taking into account individual reliability
among sessions is still under investigation. Moreover, the addition of fruit specific aromas can
also have an impact on the results. As Chollet et al highlighted in their study (Chollet et al.,
2011), contamination between products can impact the results. For example, drinking a
stronger beer before a lighter one can explain the limited grouping of duplicates. In other
words, strong aroma notes coming from the first sample can be a source of saturation and may
distort the perception of the second sample.
We aimed at studying the repeatability of free sorting task with naïve consumers on strawberry
dairy products. In addition, we studied consumers’ ability to manage the procedure in a more
difficult situation. Repeatability was assessed at two different intervals: long-term (one week)
and a short term (half an hour). The short-term interval is a way to assess the relevance of the
results obtained after one hour of concentration.
2. Method

Page 219
2.1. Procedure
The experiment was divided into three sessions (figure 1). Between the first and the second
sessions, 30 a minute delay was imposed. Between the second and the third sessions, a one
week delay was implemented.
Figure 1. Global Scheme of the study
2.2. Sorting task procedure
In each session, subjects performed a free sorting task according to the following instructions:
“Look at all the products in front of you, smell and taste all of them. Then sort them according
to the similarities you perceive. You are free to make between 2 and 9 groups of products”.
The products were presented all together in a random order between subjects.
2.3. Sample selection
A pre-test was run on eleven products to select the product range. We first verified that the
product space was not too difficult to assess. In other words, we checked to make sure the
consumers were able to make more than two groups of products. We also checked to make sure
some of the products were not too easy to discriminate. To do this, we removed two products
Session 1 (day 1)
Session 2 (day 1)
Session 3 (day 2)
30 minutes
1 week

Page 220
that were systematically grouped alone by all the consumers in the pre-test. Nine strawberry
dairy products were selected out of eleven. In parallel, a sensory descriptive profile was made
by an expert panel of assessors. The following products were selected:
Three fresh cheeses called “fromage blanc” in French market, highly textured: Jockey
and Activia Fromage Blanc containing fruit pieces, and Gervais with a specific pink
color and without pieces.
Four yoghurts with not as thick of a texture texture: Activia, Recette Crémeuse with
fruit pieces, Les 2 Vaches with little fruit fibers, almost like puré and Velouté fruix
without fruit pieces.
Two low fat dairy products: Taillefine and Activia 0% with fruit pieces and low
sweetness.
A standard product was chosen to be duplicated: Activia. Ten products were tasted by
consumers.
2.4. Subjects
36 naïve consumers were recruited from the database of the Research Center of the Paul
Bocuse Institute. All the consumers were consumers of strawberry dairy products at least once
a month. The partition of gender was 70% women and 30% men. About 34% of the participants
were between 18 and 30 years of age, 30% between 31 and 50 years old and 36% were more
than 51 years old.
2.5. Statistical analysis

Page 221
Three criteria were assessed to check the validity of the repeatability of the free sorting task. is
the first criteria is the validity of the sorting replication, means the test of similarity between
the three configurations of the samples by the whole panel of assessors. The second criteria is
the validity of sorting replication at an individual level meaning the variability between
sessions for each assessor. The third criteria is the grouping of duplicates in order to check the
quality of discrimination of the assessors.
For each subject, a similarity matrix was calculated. This matrix was a binary matrix, product
x product where a 0 was indicated if the products were not in the same group. The individual
matrices are aggregated to give an overall similarity matrix.
The overall matrix of similarities was analyzed by Multidimensional Scaling (MDS) (Faye et
al., 2004; Kruskal, 1964). Configurations were selected for optimal Kruskral stress i.e. less than
0.02 (Faye et al., 2004). Coordinates of the best configuration on MDS dimensions were
analyzed by a Hierarchical Ascending Classification (HAC) with square Euclidian distance and
Ward’s method (Giboreau et al., 2001; Lawless, 1989). The histogram of the level index
indicated the index corresponding to the number of classes that must be kept (Lebart, 1997).
Analysis of global sorting repeatability: Computation of the three tables of dimensions
calculated by MDS from the three sessions were analyzed by Multifactorial Analysis in order
to obtain the average position of the samples for the three sessions and the distance for each
product between sessions. We also calculated Adjusted RV coefficients (ARV) in order to assess
the repeatability between the three sessions (Chollet et al., 2011; El Ghaziri and Qannari, 2015;
Escoufier, 1973; Faye et al., 2004). The coefficient had to be superior than 0.7 to conclude that
the configurations were close.
• Analysis of individual variability between sessions: Adjusted Rand Index (ARI) was
calculated for each subject between two sessions to assess the individual repeatability, i.e the
proximity between the two partitions (Faye et al., 2004; Hubert and Arabie, 1985). The index
ranged from -1 to 1. When ARI takes negative values partitions are completely different. When

Page 222
ARI equals to 0 the agreement between partitions is due to chance only. When the two
partitions are exactly the same, the index is equal to 1(Courcoux et al., 2014).
Analysis of duplicate: Percentages of subjects who grouped together the two identical
products for each session were calculated.
3. Results
3.1. Global sorting repeatability
Session 1 and session 3 provide close configurations of products (ARV coefficient = 0.772, p-
value<0,001). Regarding comparison between session 2 and sessions 1 and 3, RV coefficients
are below 0.7 preventing us from concluding on a similarity of products configurations (table
1).
Table 1. Adjusted RV coefficients calculated between each session of repetition on
coordinates of configurations obtained with MDS.
RV coefficient Session 1 Session 2 Session 3
Session 1 1,00
Session 2 0,343 1,00
Session 3 0,772 0,080 1,00
Therefore, based on these indices we can conclude that:
Subjects made almost the same sorting of products in sessions 1 and 3.
Sorting made by subjects in session 2 is different from the other sessions.
From MFA analysis (figure 2), the positioning of the products for the three sessions shows that
most of the samples have a preferential spreading of the session two opposite to sessions one

Page 223
and three. Only Gervais and Velouté have a closer positioning of sessions two and three
opposite to session one.
Figure 2. Average configuration calculated by FMA. For each product, the position of each
session is specified on the mapping.
These results allow us to conclude that, for most of the samples, consumers seem to show
strong repeatability on the sorting task with blind samples between sessions one1 and three.
Opposition of the sample positioning in session two allows us to conclude that subjects show
limited repeatability on the sorting task in session two. Thus, after one hour of procedure (30
minutes for the first session plus 30 minutes of wait until the second), assessors are not
anymore able to provide a stable categorization of the product range even with a pause. We can
ACTIVIA 0%.S1ACTIVIA 0%.S2
ACTIVIA 0%.S3
ACTIVIA F1.S1
ACTIVIA F1.S2
ACTIVIA F1.S3
ACTIVIA F2.S1
ACTIVIA F2.S2
ACTIVIA F2.S3
TAILLEFINE.S1
TAILLEFINE.S2
TAILLEFINE.S3
RECETTE CREMEUSE.S1
RECETTE CREMEUSE.S2
RECETTE CREMEUSE.S3
LES 2 VACHES.S1
LES 2 VACHES.S2
LES 2 VACHES.S3
JOCKEY.S1
JOCKEY.S2 JOCKEY.S3
ACTIVIA FB.S1
ACTIVIA FB.S2
ACTIVIA FB.S3
GERVAIS.S1
GERVAIS.S2
GERVAIS.S3
VELOUTE.S1
VELOUTE.S2
VELOUTE.S3
-3
-2
-1
0
1
2
3
-4 -3 -2 -1 0 1 2 3 4
F2 (2
1,73
%)
F1 (40,20 %)
Axis F1 and F2 : 61,93 %

Page 224
also observe that the range of products tasted during the sessions is highly homogeneous and
therefore the product space was quite difficult to differentiate.
3.2. Individual sorting repeatability
Individual repeatability accross the three sessions was assessed by calculating ARI. In the
figure 3, results show that the percentage of ARI superior to 0 is significantly much higher in
session one versus session three (p<0,05). This observation demonstrates that assessors are
more repeatable between session one and session three at an individual level, confirming the
first results obtained through the global analysis.
Figure 3. Percentage of subjects that grouped together the two duplicated samples.
However, less than 10% of the subjects obtained an ARI superior to 0,5, meaning that there is
not a high percentage of almost identical partitions. Thus, observation on a good repeatability
between sessions one and three made through a global analysis cannot be confirmed on an
individual level. In other words, even if comparison between percentages of ARI allows us to
conclude that subjects were more repeatable on a long-term delay than in the short term, we
cannot conclude on the good repeatability of the free sorting task among the three sessions.
0%
20%
40%
60%
80%
100%
S1 v S2 S1 vs S3 S2 vs S3
Repartition of Adjusted Rand Index between sessions
IRA > 0
IRA =< 0*
* significative differences
(p<0,05)

Page 225
3.3. Sorting of duplicate samples
The percentage of subjects that grouped together identical samples for each session can be seen
in figure 4.
There are no significant differences between the three sessions. Nevertheless, the lowest
percentage (below 50%) is performed on session two which is congruent with previous results.
In the three sessions the percentage is quite low showing that consumers had some difficulties
discriminating the samples.
Figure 4. Percentage of ARI in function of their value for all the subjects.
4. Discussion
The purpose of this research was to challenge the quality of responses provided by subjects
regarding attentional biases through the assessment of the repeatability of a free sorting task
over three sessions. By comparing the first session with the second session, the results proved
the poor relevancy of results obtained after one hour and a half of sustained attention (session
0%
10%
20%
30%
40%
50%
60%
70%
Session 1 Session 2 Session 3
Grouped duplicata over the three sessions

Page 226
one and session two). Looking at the long-term repeatability, i.e comparison between sessions
one and three, results are closer to session one. However, the results prevent us from
concluding on a good repeatability between sessions one and three.
4.1. Saturating effect due to the short delay
The lower quality of repeatability between sessions one and two can be explained by the short
interval between them. In the study on beer (Chollet et al., 2011), only 15 minutes separated
the two sessions. The products tested were liquid and could be spat out by consumers, limiting
the satiating effect compared to tasting yoghurts. In fact, the range of products tasted by the
consumers in our study can have two saturating effects. Firstly, the strong lasting component
in the strawberry aroma may have impacted the tasting, even 30 minutes after. Secondly, some
of the samples were highly textured inducing a covering effect after swallowing. This
interpretation is supported by the conclusions given through duplication analysis. The low
percentage of subjects that grouped together duplicate samples can be interpreted as Chollet
et al (Chollet et al., 2011) : the strong aroma of a product and the texture in the mouth may
have impacted the tasting. Indeed, Chollet et al conclude in their study on a possible
contamination between the beers (around 40% of subjects categorized together the identical
samples). When a strong beer was tasted before a lighter one, it became difficult for the
consumer to categorize them because the intensity of the aroma of the first beer can saturate
the receptors in the mouth and modify the perception of the second one. In the same way for
the strawberry aroma, some products may have contaminated the full range. Moreover, this
reinforces the idea that the range of products was quite close in terms of texture and taste and
so quite hard to discriminate. This is congruent with the fact that we didn’t find any link
between frequencies of consumption and individual repeatability or regrouping of duplicate
samples. The first hypothesis was that if subjects are used to consuming the products, they may
differentiate them more easily. This hypothesis is not confirmed here. However, these
physiological effects that induce tiredness have already been quite thoroughly studied,
especially in expert subject cases (Depledt, 2009).

Page 227
4.2. Difficulties related to the length of product range
Ten products were tasted by the consumers. This can be considered as too difficult for a
consumer and inducing early saturation. However, sorting results show that for the three
sessions, consumers were able to discriminate samples in three or four groups. Moreover,
results provided on the duplicate positioning on the first sessions show that 60% of the subjects
were able to group together the two duplicates. Thus, the length of the product range is not per
se a limit in the quality of responses provided by subjects but more related to a saturation effect
for sessions two and three.
4.3. Number of consumers
The size of the consumer panel can be a limit. Indeed, most of the studies on consumer
perceptions are made on large panels of subjects in order to have good quality of statistical
criteria. Rather, the test was conducted with 36 naïve subjects. In comparison to previous
research on repeatability of free sorting task, the number of subjects is higher than most of the
studies. In addition, for the global assessment of the product range, use of the Adjusted RV
coefficient counteract the effects of small numbers of individuals (El Ghaziri and Qannari,
2015).
4.4. Using a warm-up
Differences between sessions one and two can be explained through the warm-up effect.
Indeed, our consumers had never done a sorting task before. Thus, session one acted as a
warm-up for them to understand the methodology. Consumers should therefore have been
more skilled in the methodology during sessions two and three. However, the closer proximity
of results provided by sessions one and three than by sessions two and three dismisses this
hypothesis. Nevertheless, providing a first example of the task on tissues, for example, to better
understand the methodology could improve the quality of the results. This could also induce a
higher use of attentional resources spent by the consumers.

Page 228
4.5. Memorization effect
Looking at the results obtained for the comparison of repeatability between sessions three and
two and sessions one and two, the RV coefficient is not sufficient to investigate the stability of
the sorting map. Taking a deeper look at individual results can give other insights into the
results. In other words, the results on individual repeatability for the comparison of sessions
two and one and sessions two and three can be explained by the memorization of the samples
by the consumers. As Mojet and Koster show, thickness and creaminess, two important criteria
in texture assessment, are well remembered by consumers for the yoghurt category (Mojet et
al, 2005). Results from session one show a grouping of products among fruit pieces with a clear
distinction between Les 2 Vaches, Gervais, Velouté (without big fruit pieces) and the others.
Results from session three show a clear distinction among texture first and then among fruit
pieces. These results can be interpreted as an example of memorization by the consumers of
the range of samples among the criteria enhanced by Mojet et al (Mojet et al, 2005).
4.6. Warnings for the design of consumer tests
This result can be also taken as a warning for the design of consumer tests. Indeed, when some
are dealing with consumer insights, precautions are necessary when deciding on the number
of tasks, range of products to be tasted or the delay imposed on the assessors. In this study,
even with the same cognitive task, results through short intervals are poor. The more the tasks
asked to the consumers are different, the more flexible they needed to be. In the next few years
of sensory research, using consumers as sensory assessors will be an advancement (Meiselman,
2013). More and more sensory studies are being explored with consumers in order to save in
training time. This gain should not decrease the quality of results. Key points of control should
be observed to design the procedure:
Clear instructions must be given to consumers. Pre-tests on the sorting task for the
study have been implemented and showed that clear objective details on the procedure

Page 229
consumers have to follow should be given. Even with a rework of the instruction, one
consumer was removed from the set because of a lack of understanding of the task
required. Additionally, quitting is an important adaptive behavior when the task is
judged as too complex for the subject (Silvia et al., 2014).
Time spent by the subjects is key. The more that is asked of the consumers, even with
a pause, the higher the risk to have a bias in the results. Results on short-term interval
emphasize this aspect. A recommendation is therefore to alert the consumer to the
multiple tasks that they will have to follow. Their expectations of the task demand will
influence the attentional allocations they will follow and also increase the efficiency of
memory retrieval during the task (Rummel and Meiser, 2013).
The difficulty and variability of cognitive tasks. Attention is a top-down process
influencing the perception of consumers. Inducing a bias by reducing their level of
attention will bias their perception and therefore impact the results.
On the other hand, this study provides also a warning when we want to know more about
consumers’ perception. To manage the saturation issue, easiness of the methodology or
timeliness can ensure avoiding biases on the results and can lead the results closer to the reality
of perception.
4.7. Providing results based on individuals
The conclusions provided based on the overall panel of subjects and based on the
interindividual analysis are not completely similar. Indeed, the analysis made on ARI
highlighted the fact that subjects were not repeatable compared to the overall analysis showing
that configurations of both sessions were closed. This is also a warning regarding the analysis
of the consumer test displayed on the overall panel without taking into account the differences
of assessment between subjects.
To conclude, the results allow us to provide recommendations on what we can ask of
consumers. This research should be continued. For example, adding a session four at a 30

Page 230
minute delay after session three should be a way to validate the poor level of quality of session
two. Some questions could also be added during the test to provide more information on the
level of concentration of the consumers.
Results obtained in this study could be expanded to a wider range of methodologies. Even if
sorting task is an easy methodology to be used with consumers because it’s time-efficient and
quite robust, the comparative way of presenting the samples is more difficult than for monadic.
Acknowledgments
The authors would like to thanks Rachida, Ivanna, Marie, and Elodie students in Lyon 3
university, for their support in the field. We would like to thanks also for the support on English
translation Dr. Carol-Anne Hartwick.
References
Ares, G., Antúnez, L., Giménez, A., Roigard, C.M., Pineau, B., Hunter, D.C., and Jaeger, S.R. (2014). Further investigations into the reproducibility of check-all-that-apply (CATA) questions for sensory product characterization elicited by consumers. Food Qual. Prefer. 36, 111–121.
Cartier, R., Rytz, A., Lecomte, A., Poblete, F., Krystlik, J., Belin, E., and Martin, N. (2006). Sorting procedure as an alternative to quantitative descriptive analysis to obtain a product sensory map. Food Qual. Prefer. 17, 562–571.
Chollet, S., Lelièvre, M., Abdi, H., and Valentin, D. (2011). Sort and beer: Everything you wanted to know about the sorting task but did not dare to ask. Food Qual. Prefer. 22, 507–520.
Courcoux, P., Faye, P., and Qannari, E.M. (2014). Determination of the consensus partition and cluster analysis of subjects in a free sorting task experiment. Food Qual. Prefer. 32, Part A, 107–112.
Cruz, A.G., Cadena, R.S., Castro, W.F., Esmerino, E.A., Rodrigues, J.B., Gaze, L., Faria, J.A.F., Freitas, M.Q., DELIZA, R., and Bolini, H.M.A. (2013). Consumer perception of probiotic yogurt: Performance of check all that apply (CATA), projective mapping, sorting and intensity scale. Food Res. Int. 54, 601–610.
Delarue, J., and Sieffermann, J.-M. (2004). Sensory mapping using Flash profile. Comparison with a conventional descriptive method for the evaluation of the flavour of fruit dairy products. Food Qual. Prefer. 15, 383–392.

Page 231
Depledt (2009). Évaluation sensorielle – Manuel méthodologique (3e éd.) (Lavoisier).
El Ghaziri, A., and Qannari, E.M. (2015). Measures of association between two datasets; Application to sensory data. Food Qual. Prefer. 40, Part A, 116–124.
Escoufier, Y. (1973). Le Traitement des Variables Vectorielles. Biometrics 29, 751–760.
Falahee, M., and MacRae, A.W. (1997). Perceptual variation among drinking waters: The reliability of sorting and ranking data for multidimensional scaling. Food Qual. Prefer. 8, 389–394.
Faye, P., Brémaud, D., Durand Daubin, M., Courcoux, P., Giboreau, A., and Nicod, H. (2004). Perceptive free sorting and verbalization tasks with naive subjects: an alternative to descriptive mappings. Food Qual. Prefer. 15, 781–791.
Hogenkamp, P.S., Mars, M., Stafleu, A., and de Graaf, C. (2012). Repeated consumption of a large volume of liquid and semi-solid foods increases ad libitum intake, but does not change expected satiety. Appetite 59, 419–424.
Hubert, L., and Arabie, P. (1985). Comparing partitions. J. Classif. 2, 193–218.
Jaeger, S.R. (2014). Sensory & Consumer Research anno 2014: What’s next? (Copenhagen, Denmark).
Köster, E. (2009). Diversity in the determinants of food choice: A psychological perspective. Food Qual. Prefer. 20, 70–82.
MacRae, A.W., Rawcliffe, T., Howgate, P., and Geelhoed, E.N. (1992). Patterns of odour similarity among carbonyls and their mixtures. Chem. Senses 17, 119–125.
Masmoudi, S., Rim+©, B., Naceur, A., Baddeley, A., Lafortune, L., and Reeve, J. (2010). Du percept à la décision: Intégration de la cognition, l’émotion et la motivation (De Boeck Sup+©rieur).
Meyners, M. (2016). Temporal liking and CATA analysis of TDS data on flavored fresh cheese. Food Qual. Prefer. 47, Part A, 101–108.
Mielby, L.H., Hopfer, H., Jensen, S., Thybo, A.K., and Heymann, H. (2014). Comparison of descriptive analysis, projective mapping and sorting performed on pictures of fruit and vegetable mixes. Food Qual. Prefer. 35, 86–94.
Moussaoui, K.A., and Varela, P. (2010). Exploring consumer product profiling techniques and their linkage to a quantitative descriptive analysis. Food Qual. Prefer. 21, 1088–1099.
Pothos, E.M., Perlman, A., Bailey, T.M., Kurtz, K., Edwards, D.J., Hines, P., and McDonnell, J.V. (2011). Measuring category intuitiveness in unconstrained categorization tasks. Cognition 121, 83–100.

Page 232
Rummel, J., and Meiser, T. (2013). The role of metacognition in prospective memory: Anticipated task demands influence attention allocation strategies. Conscious. Cogn. 22, 931–943.
Santosa, M., Abdi, H., and Guinard, J.-X. (2010). A modified sorting task to investigate consumer perceptions of extra virgin olive oils. Food Qual. Prefer. 21, 881–892.
Silvia, P.J., Moore, L.C., and Nardello, J.L. (2014). Trying and Quitting: How Self-focused Attention Influences Effort During Difficult and Impossible Tasks. Self Identity 13, 231–242.
Spence, C. (2002). Multisensory attention and tactile information-processing. Behav. Brain Res. 135, 57–64.
Valentin, D., and Chollet, S. (2000). Le degré d’expertise a-t-il une influence sur la perception olfactive ? Quelques éléments de réponse dans le domaine du vin. Année Psychol. 100, 11–36.
Varela, P., and Salvador, A. (2014). Structured sorting using pictures as a way to study nutritional and hedonic perception in children. Food Qual. Prefer. 37, 27–34.
Vidal, L., Silva Cadena, R., Correa, S., Ábalos, R.A., Gómez, B., Giménez, A., Varela, P., and Ares, G. (2014). Assessment of Global and Individual Reproducibility of Projective Mapping with Consumers. J. Sens. Stud. 29, 74–87.

Page 233
Résumé
Le lancement d’un nouveau produit sur le marché est une étape à risque pour l’entreprise qui peut se conclure par un échec. Une raison partielle de cet échec est que le produit ne correspond pas aux attentes des consommateurs. L’enjeu consiste donc à mieux comprendre et intégrer dans le design de produits les attentes des consommateurs.
Les théories contemporaines en psychologie cognitive nous permettent d'améliorer les méthodologies actuelles de tests consommateurs et à concevoir les produits sur la base des connaissances des consommateurs. L'objectif de cette recherche est de mieux comprendre l'influence d’une adéquation entre les attentes des consommateurs et leurs perceptions sur leurs jugements affectifs dans le contexte de consommation alimentaire. Dans le champ de la cognition incarnée et située, nous avons utilisé la théorie du Perceptual Symbol System qui suppose une forte relation entre les concepts et les propriétés sensorielles. Trois études ont été menées sur des gammes de produits familiers et non familiers. Les résultats nous permettent de conclure que les attentes des consommateurs sont des catégories ad-hoc dépendantes d'une situation de consommation, c’est-à-dire une motivation à consommer le produit dans un contexte de consommation donné. Les propriétés de la catégorie définissent les attentes de type concepts et les propriétés sensorielles attendues du produit. Ainsi, nous avons mis en évidence que les concepts et les propriétés sensorielles sont associées à travers les catégories réactivées en mémoire.
Les résultats de cette thèse ont aussi permis de proposer des améliorations aux méthodologies de tests consommateurs. Plus particulièrement, ces méthodologies permettent d’une part d’expliciter les attentes des consommateurs à travers une tâche de catégorisation et d’autre part de sélectionner les produits les plus adéquats aux attentes des consommateurs à travers l’évaluation de leurs jugements affectifs.
Mots-clés : Catégorisation, Attentes, Aliment, Disconfirmation sensorielle des attentes, Jugement Affectif
Abstract One challenge when dealing with the launching of new products is to understand consumers’
expectations towards the product experience. Many innovations fail because they do not address the right expectations, for the right consumers, and for the right product.
Theories in cognitive psychology allow us to improve current methodologies of consumer tests and to design food products based on the knowledge of consumers. The objective of this research is to better understand the influence of the discrepancy between consumers’ expectations and perceptions on the affective judgment in the context of food consumption. Within the framework of Grounded and Embodied cognition, we use theories developed on Perceptual Symbol System assuming a strong relationship between concepts and sensory perceptions. Three studies were conducted on familiar and non-familiar product ranges. Results allow us to conclude that consumers’ expectations are defined as ad-hoc categories dependent on a situation of consumption, i.e. a motivation to consume the product in a determined context of consumption. Properties of the category define cognitive expectations and sensory expectations of the product. Thus, we provide evidence that concepts and sensory perceptions are strongly related through retrieval of categories.
The results of this thesis also provide methodological improvements to elicit consumers’ expectations through categorization tasks and to screen samples fitting the best with consumers’ expectations through affective judgment.
Keywords: Categorization, Expectations, Food, Sensory Disconfirmation of Expectations, Affective Judgment
Édition janvier 2017
Copyright © 2022 FDOKUMEN