
customer based brand equity measurement: a case study of ...
Upload
khangminh22Category
view
3download
0
Design of the customer expectation measurement model in dynamic service experience delivery / Hsieh and Yuan
Pacific Asia Journal of the Association for Information Systems Vol. 2 No. 3, pp.1-19 / September 2010 1
Design of the Customer Expectation Measurement Model in Dynamic Service Experience Delivery
Yen-Hao Hsieh Department of Information Management
Chia Nan University of Pharmacy and Science Tainan, Taiwan
Soe-Tsyr Yuan Department of Management Information Systems
National Chengchi University Taipei, Taiwan
Abstract Customer-focused service design and innovation is critical in enabling service firms to deliver what customers want. Although numerous studies have emphasized the importance of custom-er expectations in numerous disciplines, previous empirical research has only captured non real-time data. Furthermore, previous research contains no mathematical mechanism for cor-rectly catching customer expectations. Service firms therefore must make additional efforts to analyze and predict customer needs according to previous empirical research, yet their predic-tions and customer expectations continue to exhibit a significant gap. Accordingly, this study proposes a systematical and quantitative customer expectation measurement model based on Fechner’s Law and the concepts of operation risk that service firms can use to measure real time customer expectations during service experience delivery.
Keywords: Customer expectation measurement, Service experiences delivery, Fechner’s law, Service innovation.
1
Hsieh and Yuan: Design of the Customer Expectation Measurement Model in Dynamic S
Published by AIS Electronic Library (AISeL), 2010

Design of the customer expectation measurement model in dynamic service experience delivery / Hsieh and Yuan
Pacific Asia Journal of the Association for Information Systems Vol. 2 No. 3, pp.1-19 / September 2010 2
Introduction Services increasingly dominate the economic activity and GDP of developed countries around the world. To strengthen their eco-nomic competitiveness, many countries are gradually increasing their investment in the service industry. However, the innovative services that customers desire and the means of delivering those services are impor-tant and complex issues. Sundbo (1997) mentioned that innovations can be consi-dered a search-and-learning process that enables service firms to generate and gather unique ideas. Voss (2004) noted that the key innovation in service design is incorporating good experiences into services to increase customer repeat business. Despite lots of re-searchers from different disciplines, especial-ly marketing, who have focused on several customer issues related to service innovation, including customer satisfaction, customer re-lationship management, customer expecta-tion or customer loyalty, the problem of man-aging customer expectations is core issue influencing other customer issues.
Parasuraman et al. (1985) identified service quality as an area where a gap exists be-tween customer expectations and percep-tions of provided services. The theory of dis-confirmation has also been applied to explain that customer satisfaction represents how closely services provided match customer expectations. Service firms attempt to elimi-nate the gap in the market for quality services by matching customer expectations to max-imize customer satisfaction. High customer satisfaction results in customer loyalty and repeat custom for service firms (Heskett et al., 1994). That is, service firms can increase their profitability by maintaining long-term customer loyalty through achieving high cus-tomer satisfaction with provided services. Furthermore, customer expectations not only directly influence post-purposing behaviors and consumption evaluation but also influ-ence customer beliefs regarding services (Gupta and Stewart, 1996; Spreng et al., 1996; Tam, 2007). Successfully providing customers with suitable services depends on how effectively service firms understand and
manage customer expectations. Managing customer expectations is critical to achieving customer satisfaction (Pitt and Barbara, 1994). Parasuraman et al. (1991) also no-ticed that understanding customer expecta-tions is necessary for service companies to deliver superior services and achieve com-petitive advantage and customer franchise. Accordingly, defining and implementing ser-vices that meet customer expectations in-crease the probability of enterprise success (Schurter and Towers, 2006). Designing good service experiences requires paying attention to managing customer expectations.
For service innovation, building good service operations can increase the opportunities for successful management of customer expec-tations. Good service experiences can be achieved through several high quality opera-tional processes. Implementing these opera-tional processes can ensure customers expe-rience good and enjoyable service. Accor-dingly, service operation design attempts to create a good service environment and plea-sant atmosphere for customers. Voss et al. (2008) proposed using service operations management architecture to clearly define four key strategic components of service ex-perience delivery system (including stage-ware, orgware, customerware and linkware). The customerware strategy refers to manag-ing customer encounters by using technology or employees to meet customer expectations. Managing customer expectations remains necessary for providing a good service expe-rience.
Although issues related to customer expecta-tions have long been discussed, few studies have applied the determinants of customer expectations. Service firms use the familiar empirical approaches (such as market survey, customer investigation or historical reports) to examine customer needs. Peppers et al. (1999) proposed that service firms can em-ploy interactive and customized activities to understand real customer needs. However, these approaches are costly and time con-suming, and the investigative results may not
2
Pacific Asia Journal of the Association for Information Systems, Vol. 2, Iss. 3 [2010], Art. 3
https://aisel.aisnet.org/pajais/vol2/iss3/3DOI: 10.17705/1pais.02302

Design of the customer expectation measurement model in dynamic service experience delivery / Hsieh and Yuan
Pacific Asia Journal of the Association for Information Systems Vol. 2 No. 3, pp.1-19 / September 2010 3
be sufficient to represent real customer needs during service experience delivery because previous research on operation design pri-marily employed non real-time data (such as questionnaire surveys or case study). Fur-thermore, previous research identified no sys-tematic mechanisms for effectively measuring customer expectations (which are influenced by expectation determinants within service experience delivery) to manage the delivered service experience.
This investigation argues that measuring cus-tomer expectations is necessary to implement customer expectation management and op-erations service strategies designed to achieve good service experiences during ser-vice experience delivery. Accordingly, this study examines the following research ques-tion: How can service firms effectively and accurately measure customer expectations during service experience delivery?
This study proposes a theoretical customer expectation measurement model (so-called CEMM) for measuring real time customer ex-pectations to understand actual customer ex-pectations and behaviors, which considers several important concepts, including cus-tomer expectation, operation design, and so on, in fulfilling the service experience innova-tion. The traditional method of identifying cus-tomer expectations is through direct inquiries to customers either before or after service experience delivery. Service firms have diffi-culty flexibly deciding to dispatch suitable services during service experience delivery. In contrast, since service firms understand customer expectations and influence those expectations through providing appropriate services in real time, they can dynamically adjust the process of service experience deli-very (for example, improving failure rates or improving service levels) to help ensure satis-factory customer service experience.
However, customer expectations, which are difficult to measure in terms of manipulation biases, cannot be numerically represented and calculated using customer external be-haviors. Fechner’s Law (Thurstone, 1929) is thus adopted to provide the psychological
theory to underlie CEMM for quantifying cus-tomer expectations during service experience delivery. The concept of operation risk (which is based on the probability concept) is used to portray the effect of external stimuli (namely, expectation tactics and service operations) on customer expectations. The main contribution of this study thus is to integrate the theories of Fechner’s Law and operation risk into a computable and quantitative customer expec-tation measurement model. Not only can re-searchers apply this theoretical expectation measurement model to investigate and rec-ognize customer psychological status for the further academic research, but service firms can also use the results of the measurement model to deliver innovative service expe-riences.
Background Service experience Since customers are increasingly able to ex-press their desires, enterprises face extreme-ly variable customer needs. According to Pullman and Gross (2004), “an experience occurs when a customer has a sensation or knowledge acquisition resulting from interac-tion with different elements of a context created by a service firm.” For instance, Dis-neyland proposes experiential and entertain-ing journeys for families that allow them to enjoy time together and imagine being in a fairy tale story. Service firms have to design appropriate service experiences for custom-ers to achieve high customer satisfaction in the era of the experience economy (Pine and Gillmore, 1998). Voss et al. (2004) also noted the importance of experience-centric services and developed a series of service encounters and interactive activities for customers. Deli-vering and designing appropriate service ex-periences thus become a major trend for ser-vice firms seeking to enhance their competi-tiveness and fulfill customer needs by coop-eration with customers to create value.
Customer expectations The customer factor is crucial for service firms in achieving service innovation and en-suring business value and profits during ser-
3
Hsieh and Yuan: Design of the Customer Expectation Measurement Model in Dynamic S
Published by AIS Electronic Library (AISeL), 2010
Design of the customer expectation measurement model in dynamic service experience delivery / Hsieh and Yuan
Pacific Asia Journal of the Association for Information Systems Vol. 2 No. 3, pp.1-19 / September 2010 4
vice experience delivery. Customer expecta-tions are considered to be customer wants, i.e., what customers feel service firms should offer over and above what they actually do offer. Hence, customer expectations regard-ing what they can acquire from service firms can define their expectations. Parasuraman et al. (1991) proposed that customer expecta-tions comprise two levels: desired and ade-quate. Desired expectations represent the level of service a customer hopes to receive, defined as the level of service performance that the customer expects. Adequate expec-tations, a lower level of expectation, consi-dered to be customer’s acceptable level of performance (Zeithaml et al., 1993).
Parasuraman et al. (1991) argued that under-standing customer expectations of service was important in delivering good service. Ac-cordingly, customer expectation management is an important issue across different discip-lines. For example, Calvert (2001) applied the survey method to analyze the relationship between customer expectations in different countries and cultures and library services. Lo et al. (2005) proposed a customer-based supply chain management framework based on customer expectations by the Delphi and interview methods. Kurtz et al. (1993) ana-lyzed the influence of restaurant services on customer expectations using the survey me-thod. Furthermore, Clow et al. (1997) applied the survey method to examine the relation-ship between service quality and customer expectations across diverse industries. How-ever, these investigations were mostly based on using empirical methods to analyze cus-tomer expectations. Although these research methods employ systematical and discreet approaches to obtain the proper results, cus-tomer data is never real-time. Consequently, these non real-time social science studies suffer two limitations. First, human memories can become biased and vague over time. The reliability of these studies is decreased in terms of the accuracy of human memory. Second, it is difficult to understand and ana-lyze actual customer behaviors based on static data obtained empirically, because such behaviors are extremely dynamic and
complex due to different timings, situations or contexts.
Successfully managing customer expecta-tions requires that service firms first under-stand customer expectations. Customer ex-pectation measurement is an approach for estimating customer mental state. According to Parasuraman et al. (1991) and Zeithaml et al. (1993), the determinants and variations of expectations (namely, the zone of tolerance) are the key factors in measuring customer expectations. This study develops CEMM based on two factors.
Fechner’s Law Fechner’s Law is then adopted to represent the relationship between external stimuli and human sensations. According to Fechner’s Law, if the magnitude and type of the external stimulus are known, the magnitude of sensa-tions can be calculated using the mathemati-cal formula. Consequently, service firms thus can employ the expectation determinants to influence customer expectations. The expec-tation determinants can be considered the external stimuli and the customer expecta-tions are likened to the sensations. This study applies Fechner’s Law to customer expecta-tion management within the services delivery to build an appropriate quantitative mea-surement model that can analyze and meet real customer needs to achieve business ob-jectives.
In 1834 Ernst Heinrich Weber, a German physicist, presented a mathematical ap-proach (Weber’s Law) to measure the varia-tion between two different stimuli (so-called Just Noticeable Difference, JND) which hu-mans could be appropriately conscious of.
The equation of Weber’s law is as follows,
/K I I= Δ (Constant),
where △I denotes the difference threshold between two stimuli, I represents the initial stimulus intensity of a human and K is the constant of the specific sense that is the We-ber proportion. For example, a human lifting 5 kg will notice that this requires some effort. However, if the lifter adds 0.01kg and lifts
4
Pacific Asia Journal of the Association for Information Systems, Vol. 2, Iss. 3 [2010], Art. 3
https://aisel.aisnet.org/pajais/vol2/iss3/3DOI: 10.17705/1pais.02302

Design of the customer expectation measurement model in dynamic service experience delivery / Hsieh and Yuan
Pacific Asia Journal of the Association for Information Systems Vol. 2 No. 3, pp.1-19 / September 2010 5
again, they may not notice any difference be-tween 5kg and 5.01kg. If the lifter then con-tinues to add weight, they will find the differ-ence becomes noticeable at is 0.5kg. Moreo-ver, a lifter lifting 10kg on their first lift will find the just noticeable difference is 1kg. Notably, the ratio of △I/I (0.5/5 = 1/10 = 0.1) is the same in both these examples. However, We-ber’s Law does not explain how the subjec-tive consciousness of a human changes with the variation of external stimulus intensity.
Consequently, Fechner proposed that using the just noticeable difference as the basic sensation unit is a feasible method of mea-suring the mental status of humans based on Web’s Law. That is, summarizing each just noticeable difference segment can be consi-dered the mental perception of humans. Fechner integrated the above equation to ob-tain another equation (so-called Fechner’s Law or Weber-Fechner’s Law) as follows (Thurstone, 1929),
logS K R= ∗
where S denotes the intensity of human men-tal perception, R represents the intensity of the external stimulus and K is a constant. This equation of Fechner’s Law indicates a logarithmic relationship between mental per-ception and external stimulus (as shown in Figure 1). The logarithmic relationship de-scribes that if the variation of the stimulus ex-hibits a geometric progression, the related mental perception of humans exhibits an arithmetic progression.
To summarize, the concept of Fechner’s Law involves finding a method of describing the human mental state via external physical in-centives. As mentioned earlier, it is difficult for service firms to understand customer expec-tations, which represent human psychological status. This study thus attempts to employ Fechner’s Law to describe customer expecta-tions mathematically. This study uses exter-nal stimuli (i.e., expectation tactics and ser-vice operations) to identify the representative value of customer expectations based on Fechner’s Law.
The capital requirements of operation risk According to Fechner’s Law, stimuli are the critical influence on human perceptions. However, how to determine a representative stimulus value (that is, the combinations of the expectation determinants) for influencing customer expectations is extremely difficult given the limited past research. Operation risk thus can provide theoretical support to transform the expectation determinants into a representative stimulus value.
Operation risk has long been an important issue in traditional manufacturing. However, numerous industries gradually realized that operation risk would significantly influence their performance and profit, particularly in the banking industry. Banks are becoming increasingly complex and changeable owing to a highly competitive environment, diverse customer needs and advanced technology, potentially leading them to face higher risks. Consequently, the Basel Committee defined standard rules and norms for banks to reduce their operation risk. Furthermore, the New Basel Capital Accord (Basel Committee on Banking Supervision, 2001) defines operation risk as “the risk of direct or indirect loss re-sulting from inadequate or failed internal processes, people and systems or from ex-ternal events.” Operation risk is mainly based on the concept that banks must prepare addi-tional capital to prevent such a risk. Accor-dingly, bank capital charges are essential for risk measurement and management.
According to the New Basel Capital Accord (Basel Committee on Banking Supervision, 2001), the equation of the Internal Models Approach is as follows,
Required Capital =
[ ( , ) ( , ) ( , ) ( , ) ( , )]i j y i j EI i j PE i j LGE i j RPI i j∗ ∗ ∗ ∗∑ ∑
Where γ represents each business line or loss type combination of banks, Exposure Indicator (EI) represents the operation risk exposure of a particular business line, Proba-bility of loss Event (PE) represents the likelih-ood of losses, Loss Given Event (LGE)
5
Hsieh and Yuan: Design of the Customer Expectation Measurement Model in Dynamic S
Published by AIS Electronic Library (AISeL), 2010

Design of the customer expectation measurement model in dynamic service experience delivery / Hsieh and Yuan
Pacific Asia Journal of the Association for Information Systems Vol. 2 No. 3, pp.1-19 / September 2010 6
represents the ratio of transaction or expo-sure disbursed as loss, given that the event and Risk Profile Index (RPI) represents the bank specific risk profile which illustrates bank capability to solve the risk problem. Fur-thermore, i denotes business line and j represents risk type.
Briefly, operation risk is determined using the concept of required capital (that is, probability) which includes several indicators for calculat-ing and representing the risk value. The con-cept of operation risk can provide a clue for forming a representative value of stimulus intensity resulting from the expectation de-terminants. Hence, this approach can achieve enhanced integrity and rationality by using Fechner’s Law of customer expectation man-agement.
Service operation design within service experience Delivering good service experiences to cus-tomers is necessary but difficult for service firms, especially in dynamic environments (Haeckel et al., 2003; Voss et al., 2008). Pullman et al. (2004) noted that service firms can increase customer loyalty and thus achieve high profits through developing their abilities in experience design. Consequently, how to provide customers with good service experiences is vital in academia and business. However, numerous key issues exist related to service experiences. Customer expectation management is a major factor influence on customer service experiences, as is service operation, which has long been discussed in different disciplines (Johnston, 1999; Roth and Menor, 2003; Rust et al., 1999; Voss et al., 2008). Service operations can be re-garded as real service providers that custom-ers can contact directly. Consequently, ser-vice firms deliver proper services to their cus-tomers by managing service operations. Ser-vice firms can successfully manage customer expectations by providing support in the form of good service operation settings.
Environment issue Physical environment design has been conti-nuously discussed in previous research on
operations management. Bitner (1992) pro-posed three main environment dimensions (such as ambient conditions, space/function and signs, symbols and artifacts) which ser-vice organizations should consider while de-signing their physical purchase surroundings. Environmental design thus can influence not only service firm performance (Bitner, 1990) but also customer perceptions of service quality (Reimer and Kuehn, 2005). Further-more, the main objective of environment de-sign is to create atmospheric purchase sur-roundings for customers (Donovan and Ros-siter, 1982; Kotler, 1973), and thus atmos-phere is crucial in environmental design. Nu-merous empirical results clearly show that customers like to spend considerable time and money on purchasing and staying in the cordial, warm or comfortable surroundings (Bitner, 1990; Bitner, 1992; Donovan and Rossiter, 1982). Accordingly, service firms should prioritize basic service operation is-sues related to environmental design. Fur-thermore, environmental design should be extended to place boundaries on places en-countered by customers.
Employee issue Heskett et al. (1994) described that service firms should establish their own service-profit chains to increase customer numbers and potential benefits. Service-profit chains initial-ly attempt to define service firm internal ser-vice quality which represents the importance relationship between frontline employees and external customers. Accordingly, employees are important in contacting customers directly in service encounters. External behaviors (such as warm talks, smiles or friendly treat-ment) of employees can influence customer perceptions (Lewis and Entwistle, 1990). Fur-thermore, service firms must also consider employee training, employee empowerment and service cultures in developing employ-ment strategies (Bitner et al., 1994; Lewis and Entwistle, 1990). Service industries have procured the main economic activities in the Twenty-first Century, yet both virtual products (e.g., services) and physical products of a business still need employees to contact cus-tomers. That is, employees can be consi-
6
Pacific Asia Journal of the Association for Information Systems, Vol. 2, Iss. 3 [2010], Art. 3
https://aisel.aisnet.org/pajais/vol2/iss3/3DOI: 10.17705/1pais.02302

Design of the customer expectation measurement model in dynamic service experience delivery / Hsieh and Yuan
Pacific Asia Journal of the Association for Information Systems Vol. 2 No. 3, pp.1-19 / September 2010 7
dered a service experience delivery mode that enables customers to understand re-ceived value. Consequently, this study con-siders that employee external behaviors di-rectly affect customer feelings and purchase behaviors.
Technology issue To increase the abilities of matching custom-er needs, producing or delivering services, service firms can implement Information Technology to boost their competitive advan-tage. Service firms can not only raise and im-prove service performance (Meuter et al., 2000; Johnson et al., 2008) but can also en-hance service quality (Meuter et al., 2000) through applying IT to service processes. Furthermore, employing IT within service en-counters can enable customers to achieve higher satisfaction and thus help providers achieve their business objectives (Meuter et al., 2000; Johnson et al., 2008). Some re-search has indicated that it is essential for service firms to consider the reliability and adoption of IT-based services to increase customer usage and trust (Lee et al., 2003; Johnson et al., 2008). Information Technolo-gy supports service firms in performing their jobs accurately and effectively, thus increas-ing service quality and minimizing costs. Hence, service firms must deliver IT-based services within service encounters. Advanced technology can be considered a stimulus to enable customers to remain in an exciting and memorable experience.
To summarize, good management of cus-tomer expectations can help service firms achieve gains in the experience economy. However, previous research maintains that customer expectations are extremely difficult for service firms to understand. Correctly managing customer expectations is critical during service experience delivery. This study attempts to create a strong foundation of ser-vice operations to effectively and efficiently manage customer expectations. Service firms can utilize proper service operation strategies to maximize customer value during service experience delivery based on their capabili-ties, business goals, situations etc. Mean-
while, this study can increase the relationship between service experiences and service op-erations to support the perspective of cus-tomer expectation management.
Conceptual framework for designing excellent service experiences The conceptual framework used to design customer service experiences (as depicted in Figure 1) is built as described by Voss et al. (2008) and based on service operations. This conceptual framework represents the rela-tionships among service operation design, expectation tactics and customer expecta-tions during service experience delivery.
The objective for service firms is to deliver customers high quality service experiences. Consequently, service firms must consider two things. First, they must consider service functions. Service functionalities, such as time saving, convenience or problem solving, are basically prerequisites that must be pro-vided to customers. Good quality services can boost customer satisfaction and thus in-crease repurchase likelihood. Hence, numer-ous previous articles have discussed the na-ture of services. For example, service quality is a key benchmark for evaluating service functionalities (Parasuraman et al. 1985). Service firms must also consider customer mentality, including customer expectations and emotions. Customer expectations indi-cate what customers expect to obtain from service firms (Parasuraman et al., 1991; Pit et al., 1994; Zeithaml et al., 1993). Hence, ac-cording to service firm capabilities and busi-ness goals, such firms can actively influence customer feelings (namely, the zone of toler-ance) to accommodate existing services by utilizing expectation determinants that can be realized by expectation tactics. For example, when service firms have higher capabilities (such as capital, resources, or reputations), they narrow the zone of tolerance to increase the entry threshold for competitors. In con-trast, the tolerance zone widens with reducing service firm capabilities.
Second, service firms must consider custom-er emotion. Customers respond positively to proper service stimuli when they exhibit plea-
7
Hsieh and Yuan: Design of the Customer Expectation Measurement Model in Dynamic S
Published by AIS Electronic Library (AISeL), 2010

Design of the customer expectation measurement model in dynamic service experience delivery / Hsieh and Yuan
Pacific Asia Journal of the Association for Information Systems Vol. 2 No. 3, pp.1-19 / September 2010 8
sure. For example, customers experiencing positive emotions (such as happiness, joy, excitement etc.) will spend more time and money in service surroundings (Donovan and Rossiter, 1982). Accordingly, both customer expectation management and emotions create concepts with service experience de-sign to enhance service experience functions. Service operations and specific expectation tactics must be implemented by the environ-ment, technology, and frontline designs to create a pleasant atmosphere and accom-plish service functions related to certain attributes of service excellence. Consequent-ly, since service experiences can comprise multiple segments, high-quality service expe-riences require an integral approach to effec-tively design the services and operation processes.
Design of the Customer Expecta-tion Measurement Model This section delineates the design logic of CEMM grounded on the theoretical basis of Fechner’s Law and operation risk.
Applying Fechner’s Law to CEMM According to Zeithaml et al. (1993), the ex-pectation determinants can influence two cus-
tomer expectation levels (desired and ade-quate expectation). This study details two customer expectation measurement models using Fechner’s Law.
Desired expectation measurement model Desired services are the high level expecta-tion of customers which denotes the service customers hope to receive (Zeithaml et al., 1993). Furthermore, the desired expectation is highly stable. For example, some custom-ers are concerned with high quality service or lower prices, and thus their basic needs can-not change. Consequently, the desired ex-pectation measurement model can be applied by Fechner’s Law. The equation of the de-sired expectation measurement model can be modified as follows,
logDE K SIα= ∗
where ED denotes the desired expectation value of the customer affected by the external stimuli, and SI represents the stimulus magni-tude of the expectation determinants that is calculated via the concept of operation risk. Additionally, K is the constant representing customer type, which influences the model slope. This study employs five factors (for
Figure 1 - The conceptual framework of designing excellent service experiences
Environment Technology Frontline
Service Operations Expectation Tactics
Atmosphere
Emotions
Expectations
Functions
Excellent Service Experiences
8
Pacific Asia Journal of the Association for Information Systems, Vol. 2, Iss. 3 [2010], Art. 3
https://aisel.aisnet.org/pajais/vol2/iss3/3DOI: 10.17705/1pais.02302

Design of the customer expectation measurement model in dynamic service experience delivery / Hsieh and Yuan
Pacific Asia Journal of the Association for Information Systems Vol. 2 No. 3, pp.1-19 / September 2010 9
example, arrival, capability, effort, request, and subjective preference) to define different customer types (Frei, 2006). The mental per-ceptions of different customer types differ. For example, since customers with high scores in all five factors are considered cus-tomers who are easily affected by less exter-nal stimuli, these customers have larger K. α is a label referring to the shape of the desired expectation measurement model.
Figure 2 clearly illustrates the curve of the desired expectation measurement model. When the stimuli intensity gradually increases, so too does customer desired expectation value. However, the desired expectation val-ue increases slowly, while the stimuli intensity increases considerably. For instance, if the stimuli intensity exceeds a certain magnitude (SI’), the desired expectation value becomes stable.
Adequate expectation measurement model Adequate services denote the lower end of customer expectations, and represent the minimum service level acceptable to custom-ers (Zeithaml et al., 1993). Adequate custom-er expectations are frequently changeable and unstable contrasting with desired cus-tomer expectations. That is, adequate cus-tomer expectations are easily influenced by the expectation determinants. Notably, cus-tomer mental effects increase with the num-
ber of determinants the service providers use. Consequently, this investigation defines the shape of the adequate expectation as nearly belonging to the S curve (as illustrated in Fig-ure 3).
The curve means that the adequate expecta-tion value increases with the external stimuli. After the stimuli intensity reaches a certain magnitude (SI’), even though the intensity exceeds this magnitude, the adequate expec-tation value would increase slowly and nearly be stable. The ultimate reason the adequate expectation steadies is that the adequate ex-pectation achieves the desired expectation based on the concept of the zone of tolerance (Zeithaml et al., 1993). Namely, the zone of tolerance narrows during this period in terms of the overlap between the adequate and de-sired expectations.
According to Fechner’s Law, the adequate expectation measurement model can be writ-ten in the form
logAE K SIβ= ∗
in which EA is the adequate expectation value of the customer influenced by the external stimuli, SI denotes the stimulus magnitude of the expectation determinants that are com-puted based on operation risk, and K represents customer type. β is a label refer-ring to the shape of the adequate expectation measurement model.
Figure 2 - Desired expectation measurement model
ED
SI SI’
9
Hsieh and Yuan: Design of the Customer Expectation Measurement Model in Dynamic S
Published by AIS Electronic Library (AISeL), 2010

Design of the customer expectation measurement model in dynamic service experience delivery / Hsieh and Yuan
Pacific Asia Journal of the Association for Information Systems Vol. 2 No. 3, pp.1-19 / September 2010 10
Figure 3 - Adequate expectation measurement model Applying operation risk to CEMM As mentioned earlier, the concept of required capital lies at the core of operation risk and is frequently implemented in the manufacturing and banking industries. To confront the huge capital losses resulting from operational risks, enterprises must prepare appropriate money (that is, required capital) in advance based on their capabilities, probabilities of loss events or risk exposure. Consequently, required cap-ital represents the operation risks that enter-prises face. This study applies operation risks to customer expectation measurement be-cause customer expectations are simulta-neously influenced by numerous stimuli from diverse sources. The stimuli within service experience delivery are combinations of ex-pectation determinants rather than a single stimulus as described in Fechner’s Law. How to aggregate the stimuli to represent a single stimulus in Fechner’s Law thus is an impor-tant issue. By relating to operation risks, the stimulus intensity represents the influence of customer expectations. The change in cus-tomer expectations increases with the stimu-lus intensities that customers receive. Hence, this study utilizes operation risk to support stimuli performance.
This study refers to the formula of required capital and modifies the elements to form a new formula for calculating the magnitude of
the stimuli intensity (SI). Accordingly, the for-mula of stimulus intensity can be written as follows,
SI UDI PSE AEV CPI= ∗ ∗ ∗
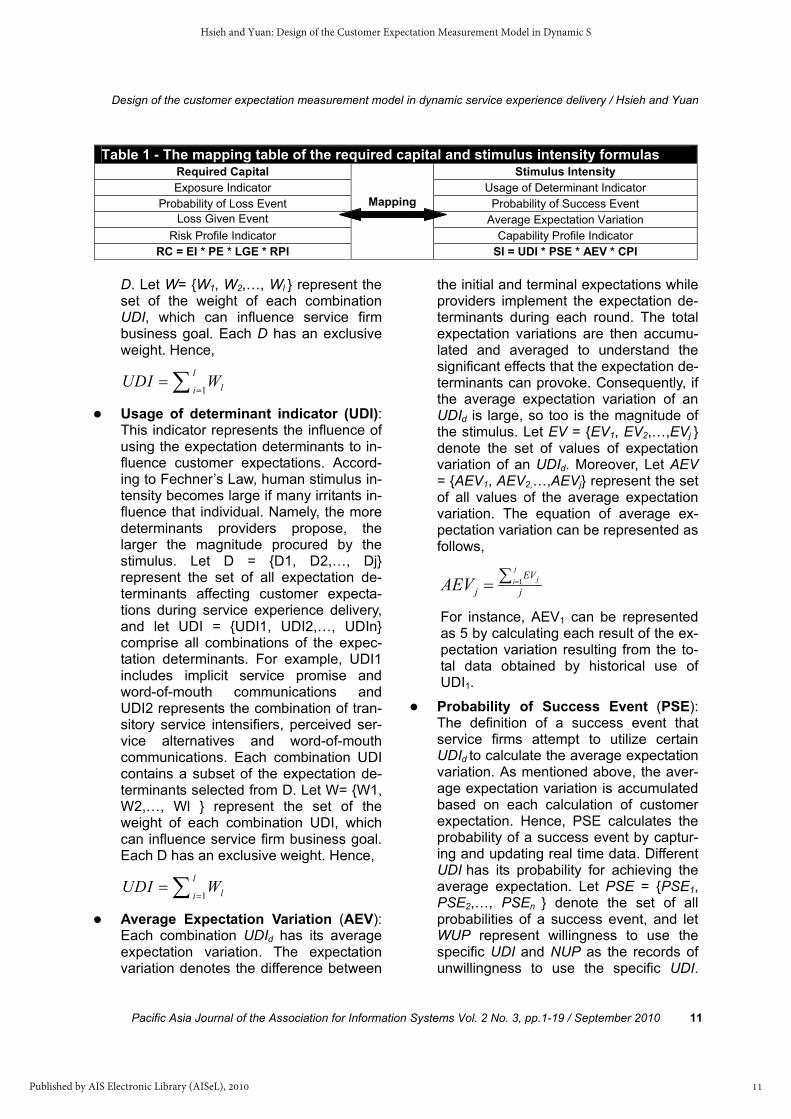
Table 1 lists the mapping relationship be-tween the required capital and stimulus inten-sity formulas. This equation contains four key elements, as follows.
Usage of determinant indicator (UDI): This indicator represents the influence of using the expectation determinants to in-fluence customer expectations. Accord-ing to Fechner’s Law, human stimulus in-tensity becomes large if many irritants in-fluence that individual. Namely, the more determinants providers propose, the larger the magnitude procured by the stimulus. Let D = {D1, D2,…, Dj} represent the set of all expectation determinants af-fecting customer expectations during service experience delivery, and let UDI = {UDI1, UDI2,…, UDIn} comprise all combinations of the expectation determi-nants. For example, UDI1 includes impli-cit service promise and word-of-mouth communications and UDI2 represents the combination of transitory service inten-sifiers, perceived service alternatives and word-of-mouth communications. Each combination UDI contains a subset of the expectation determinants selected from
EA
SI’ SI
10
Pacific Asia Journal of the Association for Information Systems, Vol. 2, Iss. 3 [2010], Art. 3
https://aisel.aisnet.org/pajais/vol2/iss3/3DOI: 10.17705/1pais.02302
Design of the customer expectation measurement model in dynamic service experience delivery / Hsieh and Yuan
Pacific Asia Journal of the Association for Information Systems Vol. 2 No. 3, pp.1-19 / September 2010 11
D. Let W= {W1, W2,…, Wl } represent the set of the weight of each combination UDI, which can influence service firm business goal. Each D has an exclusive weight. Hence,
1
lli
UDI W=
= ∑
Usage of determinant indicator (UDI): This indicator represents the influence of using the expectation determinants to in-fluence customer expectations. Accord-ing to Fechner’s Law, human stimulus in-tensity becomes large if many irritants in-fluence that individual. Namely, the more determinants providers propose, the larger the magnitude procured by the stimulus. Let D = {D1, D2,…, Dj} represent the set of all expectation de-terminants affecting customer expecta-tions during service experience delivery, and let UDI = {UDI1, UDI2,…, UDIn} comprise all combinations of the expec-tation determinants. For example, UDI1 includes implicit service promise and word-of-mouth communications and UDI2 represents the combination of tran-sitory service intensifiers, perceived ser-vice alternatives and word-of-mouth communications. Each combination UDI contains a subset of the expectation de-terminants selected from D. Let W= {W1, W2,…, Wl } represent the set of the weight of each combination UDI, which can influence service firm business goal. Each D has an exclusive weight. Hence,
1
lli
UDI W=
= ∑
Average Expectation Variation (AEV): Each combination UDId has its average expectation variation. The expectation variation denotes the difference between
the initial and terminal expectations while providers implement the expectation de-terminants during each round. The total expectation variations are then accumu-lated and averaged to understand the significant effects that the expectation de-terminants can provoke. Consequently, if the average expectation variation of an UDId is large, so too is the magnitude of the stimulus. Let EV = {EV1, EV2,…,EVj } denote the set of values of expectation variation of an UDId. Moreover, Let AEV = {AEV1, AEV2,…,AEVj} represent the set of all values of the average expectation variation. The equation of average ex-pectation variation can be represented as follows,
1
jji
EVj jAEV =∑=
For instance, AEV1 can be represented as 5 by calculating each result of the ex-pectation variation resulting from the to-tal data obtained by historical use of UDI1.
Probability of Success Event (PSE): The definition of a success event that service firms attempt to utilize certain UDId to calculate the average expectation variation. As mentioned above, the aver-age expectation variation is accumulated based on each calculation of customer expectation. Hence, PSE calculates the probability of a success event by captur-ing and updating real time data. Different UDI has its probability for achieving the average expectation. Let PSE = {PSE1, PSE2,…, PSEn } denote the set of all probabilities of a success event, and let WUP represent willingness to use the specific UDI and NUP as the records of unwillingness to use the specific UDI.
Table 1 - The mapping table of the required capital and stimulus intensity formulas Required Capital
Mapping
Stimulus Intensity Exposure Indicator Usage of Determinant Indicator
Probability of Loss Event Probability of Success Event Loss Given Event Average Expectation Variation
Risk Profile Indicator Capability Profile Indicator RC = EI * PE * LGE * RPI SI = UDI * PSE * AEV * CPI
11
Hsieh and Yuan: Design of the Customer Expectation Measurement Model in Dynamic S
Published by AIS Electronic Library (AISeL), 2010

Design of the customer expectation measurement model in dynamic service experience delivery / Hsieh and Yuan
Pacific Asia Journal of the Association for Information Systems Vol. 2 No. 3, pp.1-19 / September 2010 12
The probabilities of success events can be calculated as follows,
nn
n n
WUPPSEWUP NUP
=+
That is, if WUP1 is 80 records of using UDI1 and NUP1 is 20 records of unwil-lingness to use UDI1 then PSE1 can be represented as 0.8.
Capability Profile Indicator (CPI): Ac-cording to the operation risk, the risk pro-file indicator evaluates the ability of a bank to deal with the operation risks. CEMM uses the capability profile indica-tor to assess service firm competence. When service firms have high capabilities (such as numerous resources, high capi-tal or collaborative partnerships) the magnitude of the stimulus is increased. Additionally, the capability profile indica-tor should be defined according to the domain-specific applications. The equa-tion of the capability profile indicator can be written as follows
1
n
iCPI Wi Ci
== ∗∑
where Ci denotes the competence indi-cators of the provider and Wi represents the weights of each competence indica-tor. For example, the numbers of em-
ployees, partners and production lines can be defined as competence indica-tors, with weights of 0.2, 0.5 and 0.3, re-spectively. The competence indicators must first be normalized depending on the business goals and application do-mains, and are assigned scores of 85, 70 and 90. The CPI thus is 79 (0.2*85+0.5*70+0.3*90).
The above reveals a positive correlation be-tween the stimuli intensity and individual indi-cators. To our knowledge, the stimuli intensity increases with the number of indicators. To represent the influences of four indicators, the stimuli intensity can be regarded as the mul-tiplied results.
Customer Expectation Measurement Model Following applying Fechner’s Law and opera-tion risks, CEMM (as shown in Figure 4) can be represented as follows. SI’ and SI’’ re-spectively represent the magnitude threshold of the desired and adequate expectations. Furthermore, the design of α and β clearly differentiates the desired and adequate ex-pectation measurement models, since α and β influence curve shape. Furthermore, CEMM for desired expectation can be written as fol-lows (the dotted curve),
Figure 4 - Customer expectation measurement model
EA
ED Expectation
SSI’ SI’’
12
Pacific Asia Journal of the Association for Information Systems, Vol. 2, Iss. 3 [2010], Art. 3
https://aisel.aisnet.org/pajais/vol2/iss3/3DOI: 10.17705/1pais.02302

Design of the customer expectation measurement model in dynamic service experience delivery / Hsieh and Yuan
Pacific Asia Journal of the Association for Information Systems Vol. 2 No. 3, pp.1-19 / September 2010 13
logDE K SIα= ∗
SI UDI PSE AEV CPI= ∗ ∗ ∗
CEMM for adequate expectation can be writ-ten as follows (the solid curve),
logAE K SIβ= ∗ SI UDI PSE AEV CPI= ∗ ∗ ∗
The process of measuring customer expectations Figure 5 represents the process of measuring customer expectations, which comprises three separate stages, including the expecta-tion determinants, CEMM and customer ex-pectations. Furthermore, during the customer expectations stage, the results of measuring customer expectations can be continuously fed back to the expectation measurement da-tabase which stores the data of all CEMM indicators.
Expectation determinants stage The inputs of measuring customer expecta-tions are the combinations of the expectation determinants that service firms propose may influence customer expectations. According to Zeithaml et al. (1993), the expectation de-terminants include enduring service intensifi-ers, personal needs, transitory service inten-sifiers, perceived service alternatives, cus-tomer self-perceived service role, situational factors, predicted service, explicit service promises, implicit service promise and word-
of-mouth communications. Different combina-tions of expectation determinants exist and can be used as inputs to influence customer expectations in different situations (including time, customer expectation management ob-jectives or provider capabilities). For example, when a service firm has a strong reputation and customer satisfaction with its services, that firm wishes to set the customer expecta-tion management objective of increasing the adequate and desired expectations. Conse-quently, that firm can employ (i.e., explicit service promises) and a website recommen-dation service (namely, word-of-mouth com-munications) as a combination of the expec-tation determinants to influence and measure customer expectations.
Customer expectation measurement model stage This step attempts to calculate the values of the desired and adequate service level ex-pectations, when the customer contacts ex-ternal stimuli. First, this study defines the ob-jectives of managing customer expectations, including adequate increase in expectations, adequate reduction in expectations, desired increase in expectations, and desired reduc-tion in expectations by extending the model of Zeithaml et al. (1991). According to these ob-jectives and the combinations of the expecta-tion determinants (that is, the stimulus), ap-plying the stimulus intensity formula involves calculating the stimuli value using four indica-tors (i.e., UDI, PEV, EV and CPI) based on
Figure 5 - The process of measuring customer expectations
13
Hsieh and Yuan: Design of the Customer Expectation Measurement Model in Dynamic S
Published by AIS Electronic Library (AISeL), 2010

Design of the customer expectation measurement model in dynamic service experience delivery / Hsieh and Yuan
Pacific Asia Journal of the Association for Information Systems Vol. 2 No. 3, pp.1-19 / September 2010 14
the operation risk. Second, after obtaining the stimuli value, CEMM is applied to compute the adequate or desired expectation value based on Fechner’s Law.
Customer expectations stage Accordingly, the outputs used to measure customer expectations contain the adequate expectation value, desired expectation value and list of expectation tactics. Once service firms understand actual customer expecta-tions, they can use the outputs to propose suitable services and thus help customers achieve their business objectives. Additionally, the expectation tactics list, which is obtained from the database, provides service firms with a reference for proper service delivery. This study defines the expectation tactic as a service type that is mapped and related to an expectation determinant that directly or indi-rectly influences customer expectations. Ser-vice firms can employ appropriate expecta-tion tactics suggested by CEMM to influence customer expectations. After service firms implement the expectation tactics, they must store the values of expectation variation and their capabilities indicators in the expectation measurement database. Consequently, CEMM can reflect actual customer expecta-tions based on the feedback control.
Scenario demonstration Hevner et al. (2004) proposed five evaluation methods (for example, the observational, analytical, experimental, testing and descrip-tive approaches) to evaluate the utility and quality of information system research. Sce-nario demonstration is one descriptive ap-proach for conceptually delineating research. This study thus employs a B2C scenario of the exhibition service system to demonstrate the utility of CEMM.
Generally, highly capable exhibitors (such as SONY) must increase visitor expectation le-vels to achieve customer franchise, and can provide visitors with useful and appropriate services (such as exhibitor-recommendation service, advertisement information service, e-business card exchange service, or warranty service) to meet customer needs. SONY de-
livers services to a visitor within a single en-counter through the exhibition service system. Hence, the combination of delivered services (such as e-business card exchange service and warranty service) is represented in the form of the UDIt. Meanwhile, the exhibition service system can analyze data related to the successful probability of using delivered services and calculate the PSEt. According to these services, the exhibition service system can also compute the average expectation value AEVt of using specific services. The exhibition service system can also yield the value of exhibitor capability (CPIt) based on existent human resources, technology level, service category or capital. The exhibition service system immediately transforms the four values into stimulus intensity (SIt) value to calculate visitor expectations. Furthermore, visitors can generally be divided into diverse classifications representing K. Consequently, the service exhibition system can acquire the values of two expectation levels (i.e., ED and EA). When SONY realizes visitor expectation values, it can flexibly modulate proper servic-es to increase visitor expectations. That is, CEMM can enable exhibitors to deliver inno-vative service experience by closely grasping visitor wants in real time during service expe-rience delivery.
Discussion The usage and feasibility of CEMM The basic idea of this study involves how ser-vice firms understand customer expectations in real time while delivering and designing services. The solution proposed in this study is CEMM. Consequently, this study ad-dresses the following significant advantages of the application of CEMM. First, it is difficult for service firms to understand customer mental status during service experience deli-very. For instance, service firms cannot im-mediately ask customers to share their ex-pectations and perceptions via questionnaires after offering a service. That could increase business costs and hassle for customers. Consequently, the best solution is to trans-form customer expectations into computable numbers that service firms can easily under-
14
Pacific Asia Journal of the Association for Information Systems, Vol. 2, Iss. 3 [2010], Art. 3
https://aisel.aisnet.org/pajais/vol2/iss3/3DOI: 10.17705/1pais.02302

Design of the customer expectation measurement model in dynamic service experience delivery / Hsieh and Yuan
Pacific Asia Journal of the Association for Information Systems Vol. 2 No. 3, pp.1-19 / September 2010 15
stand. CEMM provides service firms with a quantitative mechanism for defining and un-derstanding customer expectations. Second, in terms of stability and precision, CEMM can be designed as a learning mechanism that is continuously trained and modified using the accumulated data (e.g., ED, EA, UDI, AVI, and PSE). That is, CEMM can dynamically adjust the existing values of the aforementioned in-dicators to calculate actual customer expecta-tions.
Furthermore, the practical considerations sur-rounding the application of CEMM are as fol-lows. First, the inputs and indicators of CEMM are designed for simplicity and need. For example, in Figure 2, the combination of the expectation determinants is the only input of CEMM which directly and significantly in-fluences customer expectations. Service firms need only define their existing services related to the expectation determinants as inputs. The same idea applies for other indi-cators. Second, the explanations of indicators can be extended or narrowed according to application domain. For instance, the CPI in-dicator in the hospital firms includes the num-bers of doctors and nurses or the reputation of the hospital, but the capital, production lines and numbers of customers can be represented as the CPI indicator in the manu-facturing firms. Finally, to gather real time da-ta from customers, a device (such as hand-helds) for immediately sensing and obtaining customer responses (e.g., accepting or re-jecting delivered services) is necessary dur-ing service experience delivery. Such devices can be considered a tool for communication between service firms and customers. Accor-dingly, service firms can easily apply CEMM in real time service contexts.
In previous research, service firms and aca-demic researchers mostly used survey and interview approaches to obtain customer ex-pectations. Table 2 compares three ap-
proaches for measuring customer expecta-tions. This study attempts to utilize four indi-cators to analyze the measurement perfor-mance of these three approaches. Timing represents when service firms can measure customer expectations. Survey and interview are only used following customers perceive service experiences, yet CEMM can be used to acquire real time customer expectations while service firms offer service experiences. Context presents environmental variations, including customer needs, provider strategies or competitors. CEMM is superior to the sur-vey and interview approaches in dealing with the dynamic service context given the short duration of a service experience. Given the advantages of timing and context, CEMM al-so has high flexibility in helping service firms select suitable services for immediately meet-ing customer needs. Survey and interview feedback is late in improving service expe-rience delivery given the need of customers to finish all service experiences. Finally, for the cost indicator, survey and interview offer a means of spending more time and money to collect and inquire customer expectations. However, CEMM is built once and used con-tinuously which can clearly reveal the high usage and feasibility of CEMM.
Implications for service experience de-livery Ojasalo (2001) noted that enterprises must effectively manage customer expectations to achieve their long-term business goals. Fur-thermore, service firms must meet customer expectations to satisfy their customers and increase their performance (Rust et al., 1999). CEMM is based on expectation theory, Fech-ner’ Law and the concept of operation risk, and aims to be an innovative and theoretical mechanism for precisely understanding cus-tomer expectations. Service firms not only have efficient service performance, but also reduce additional fees (such as including hu-
Table 2 - The comparison of measuring customer expectation approaches Timing Context Flexibility Cost
CEMM During service experience delivery Dynamic High Below Medium Survey After perceiving service experiences No Low High
Interview After perceiving service experiences No Low High
15
Hsieh and Yuan: Design of the Customer Expectation Measurement Model in Dynamic S
Published by AIS Electronic Library (AISeL), 2010

Design of the customer expectation measurement model in dynamic service experience delivery / Hsieh and Yuan
Pacific Asia Journal of the Association for Information Systems Vol. 2 No. 3, pp.1-19 / September 2010 16
man, time or operational costs). Consequent-ly, service firms focus on their services and business strategies.
Furthermore, the service experience delivery system is also needed to take account of ser-vice operations (Roth and Menor, 2003). Al-though customer expectation management is crucial for realizing customer wants during service experience delivery, there is insuffi-cient evidence that customers exhibit specific purchasing behaviors as a result of achieving suitable services. Increasing customer expec-tation management efficiency requires em-ploying service operation design. As men-tioned earlier, service operation elements in-clude the environment arrangement, ad-vanced technology and frontline treatment that can generate atmospheric surroundings that give customers a comfortable and plea-sant feeling. While service firms deliver prop-er services to influence customer expecta-tions, they can easily meet customer needs particularly in atmospheric surroundings. That is, one of the key business goals of service firms is to increase profits. Service firms should implement effective customer expec-tation management based on good service operations settings. Consequently, this study attempts to ensure the success of implement-ing customer expectation management through considering service operations.
Thus, empirical study, such as the survey method, is an important research method for investigating and understanding phenomenon formation. However, Homer (1993) described how respondent self-report surveys can ob-tain biases as a result of incorrect reports. Consequently, CEMM is a real time mechan-ism, which means customer data is conti-nuously updated and gathered during service experience delivery. Service firms can imme-diately obtain the latest information to decide on service strategies to propose for custom-ers. Undoubtedly service firms can deliver appropriate services to their customers in real time. Moreover, customer experience man-agement is the basic form of customer rela-tionship management (Meyer and Schwager, 2007). The real time measurement model can help service firms identify their target cus-
tomers and maintain their relationships to achieve their business and personal objec-tives.
Conclusions Service experience innovation is the key that can assist service firms in designing services customers want. Previous studies investi-gated how to deeply understand customer needs; however to date no effective and use-ful mechanism has been developed to solve this problem. Most previous research used empirical methods to analyze customer be-haviors, yet the processes involved in deliver-ing service experiences are dynamic render-ing customer needs or feelings unstable and changeable. Accordingly, this study proposes a systematical and quantitative model for measuring customer expectations during ser-vice experience delivery based on theoretical support (such as expectation theory, Fech-ner’s Law and operation risk). This study tries to employ this mechanism to examine cus-tomer expectations and behaviors in real time. Therefore, CEMM can be implemented as a creative service for service innovation that reveals customer mental state to providers.
This study makes the following contributions. First, customer expectation is difficult to quantify in terms of diverse human psycholo-gy. This study attempts to establish a com-putable model comprising key indicators and theories to provide a foundation for future re-search. Finally, CEMM can be applied in real time situations, enabling service firms to im-mediately understand customer expectations and also to adjust to deliver suitable services to customers to match customer needs and achieve high customer satisfaction during service experience delivery. However, CEMM still must be empirically evaluated and veri-fied, and a simulation method also provides a workable approach to test the validity and reliability of CEMM. CEMM is designed as a real service system for an application (such as the exhibition service system in the B2C scenario). Gathering field data from real cus-tomers who utilize the service system is ne-cessary to assess the reliability of CEMM and improve its shortcomings.
16
Pacific Asia Journal of the Association for Information Systems, Vol. 2, Iss. 3 [2010], Art. 3
https://aisel.aisnet.org/pajais/vol2/iss3/3DOI: 10.17705/1pais.02302

Design of the customer expectation measurement model in dynamic service experience delivery / Hsieh and Yuan
Pacific Asia Journal of the Association for Information Systems Vol. 2 No. 3, pp.1-19 / September 2010 17
ReferencesBasel Committee on Banking Supervision.
(2001). “Operational Risk,” Basel Report, January, 1-30.
Bitner, M.J. (1990). “Evaluating Service En-counters: The Effects of Physical Surroundings and Employee Re-sponses,” Journal of Marketing, 54, 69-82.
Bitner, M.J. (1992). “Servicescapes: The Impact of Physical Surroundings on Customers and Employees,” Journal of Marketing, 56(2), 57-71.
Bitner, M.J., Booms, B.H. and Mohr, L.A. (1994). “Critical Service Encounters: The Employee's Viewpoint,” Journal of Marketing, 58(4), 95-106.
Calvert, P.J. (2001). “International Varia-tions in Measuring Customer expec-tations,” Library Trends, 49(4), 732-757.
Clow, K.E., Kurtz, D.L., Ozment, J. and Ong, B.S. (1997). “The Antecedents of Consumer Expectations of Services: An Empirical Study across Four In-dustries,” Journal of Service Market-ing, 11(4), 30-248.
Donovan, R.J. and Rossiter, J.R. (1982). “Store Atmosphere: An Environ-mental Psychology Approach,” Jour-nal of Retailing, 58(1), 34-37.
Frei, F. (2006). “Breaking the trade-off be-tween efficiency and service”, Har-vard Business Review, 84(11), 92-101.
Gupta, K. and Stewart, D. (1996). “Cus-tomer satisfaction and customer be-havior: The differential role of brand and category expectations,” Market-ing Letters, 7(3), 249-263.
Haeckel, S.H., Carbone, L.P. and Berry, L.L. (2003). “How to Lead the Customer Experience,” Marketing Management, 12(1), 18-24.
Heskett, J.L., Jones, T.O., Loveman, G.W., Jr., Sasser, W.E. and Schlesinger, L.A. (1994). “Putting the Service-Profit Chain to Work,” Harvard Busi-ness Review, 72(2), 164-174.
Hevner, A.R., March, S.T., Park, J. and Ram, S. (2004), “Design science in information systems research,” MIS Quarterly, 28(1), 75-105.
Homer, J.B. (1993). “A System Dynamics Model of National Cocaine Preva-lence,” System Dynamics Review, 9(1), 49-78.
Johnston, R. (1999). “Service Operations Management: Return to Roots,” In-ternational Journal of Operations & Production Management, 19(2), 104-124.
Johnson, D., Bardhi, F. and Dunn, D. (2008). “Understanding How Technology Paradoxes Affect Customer Satisfac-tion with Self-Service Technology: The Role of Performance Ambiguity and Trust in Technology,” Journal of Psychology & Marketing, 25(5), 416-443.
Kotler, P. (1973). “Atmospherics as a Mar-keting Tool,” Journal of Retailing, 49(4), 48-64.
Kurtz, D.L. and Clow, K.E. (1993). “Manag-ing Consumer Expectations of Ser-vices,” The Journal of Marketing Management, 2(2), 19-25.
Lee, E., Lee, J. and Eastwood, D. (2003). “A Two-Step Estimation of Consumer Adoption of Technology-Based Ser-vice Innovations,” Journal of Con-sumer Affairs, 37(2), 256-82.
Lewis, B. and Entwistle, T. (1990). “Manag-ing the Service Encounter: A Focus on the Employee,” International Journal of Service Industry Man-agement, 1(3), 41-52.
17
Hsieh and Yuan: Design of the Customer Expectation Measurement Model in Dynamic S
Published by AIS Electronic Library (AISeL), 2010

Design of the customer expectation measurement model in dynamic service experience delivery / Hsieh and Yuan
Pacific Asia Journal of the Association for Information Systems Vol. 2 No. 3, pp.1-19 / September 2010 18
Lo, V.H.Y., Sculli, D., Yeung, A.H.W. and Yeung, A.C.L. (2005). “Integrating Customer Expectation into the De-velopment of Business Strategies in a Supply Chain Environment,” Inter-national Journal of Logistics: Re-search and Applications, 8(1), 37-50.
Meuter, M.L., Ostrom, A.L., Roundtree, R.I. and Bitner, M.J. (2000). “Self-Service Technologies: Understand-ing Customer Satisfaction with Technology-Based Service Encoun-ters,” Journal of Marketing, 64(3), 50-64.
Meyer, C. and Schwager, A. (2007). “Un-derstanding Customer Experience,” Harvard Business Review, 85(2), 117-126.
Ojasalo, J. (2001). “Managing Customer Expectations in Professional Ser-vices,” Managing Service Quality, 11(3), 200-212.
Schurter, T. and Towers, S. (2006). Cus-tomer Expectation Management: Success without Exception, Meghan-Kiffer Press, Florida, USA.
Spreng, R., MacKenzie, S. and Olshavsky, R. (1996). “A re-examination of the determinants of consumer satisfac-tion,” Journal of Marketing, 60, 15-32.
Tam., J.L.M. (2007). “Managing customer expectations in financial services: Opportunities and challenges,” Jour-nal of Financial Services Marketing, 11(4), 281-289.
Parasuraman, A., Berry, L.L. and Zeithaml, V.A. (1991). “Understanding Cus-tomer Expectations of Service,” Sloan Management Review, 32(3), 39-48.
Parasuraman, A., Zeithaml, V.A. & Berry, L.L. (1985). “A Conceptual Model of Service Quality and Its Implications for Future Research,” Journal of Marketing, Fall, 41-50.
Peppers, D., Rogers M., and Dorf, B. (1999). “Is Your Company Ready for One-To-One Marketing?” Harvard Busi-ness Review, 77(1), 151-160.
Pine, B.J. and Gilmore, J.H. (1998). “Wel-come to the experience economy”, Harvard Business Review, 76(4), 97-105.
Pitt, L.F. and Barbara, J. (1994). “Manage-ment of Customer Expectations in Service Firms: A Study and a Check-list,” The Service industries Journal, 14(2), 170-189.
Pullman, M.E., and Gross, M.A. (2004). “Ability of Experience Design Ele-ments to Elicit Emotions and Loyalty Behaviors,” Decision Science, 35(3), 531–576.
Reimer, A. and Kuehn, R. (2005). “The Im-pact of Servicescape on Quality Per-ception,” European Journal of Mar-keting, 39(7), 785-808.
Roth, A.V. & Menor, L. (2003). “Designing and Managing Service Operations: Introduction to the Special Issue,” Production and Operations Man-agement, 12(2), 141-145.
Rust, R.T., Inman, J.I., Zahorik, J. and Jia, A. (1999). “What You Don’t Know About Customer-perceived Quality: The Role of Customer Expectation Distributions,” Marketing Science, 18(1), 77–92.
Sundbo, J. (1997). “Management of Innova-tion in Services,” The Services In-dustries Journal, 17(3), 432-455.
Thurstone, L.L. (1929). “Fechner's Law and the Method of Equal Appearing In-tervals,” Journal of Experimental Psychological, 12, 214-224.
Voss, C.A. (2004). Trends in the Experience and Service Economy: The Experi-ence Profit Cycle, London Business School.
18
Pacific Asia Journal of the Association for Information Systems, Vol. 2, Iss. 3 [2010], Art. 3
https://aisel.aisnet.org/pajais/vol2/iss3/3DOI: 10.17705/1pais.02302

Design of the customer expectation measurement model in dynamic service experience delivery / Hsieh and Yuan
Pacific Asia Journal of the Association for Information Systems Vol. 2 No. 3, pp.1-19 / September 2010 19
Voss, C.A., Roth, A.V. and Chase, R.B. (2008). “Experience, Service Opera-tions Strategy, and Services as Des-tinations: Foundations and Explora-tory Investigation,” Production and Operations Management, 17(3), 147-266.
Zeithaml, V.A., Berry, L.L. and Parasura-man, A. (1993). “The Nature and De-terminants of Customer Expectations of Service,” Journal of the Academy of Marketing Science, 21(1), 1-12.
About the Authors
Yen-Hao Hsieh is an Assistant Professor in the Department of Information Management, College of Health and Information at Chia Nan University of Pharmacy and Science in Taiwan. He received his PhD in Manage-ment Information Systems from National Chengchi University. His research interests include service science, customer expecta-tion management and service experience design. Yen-Hao Hsieh is the corresponding author and can be contacted at: [email protected]
Soe-Tsyr Yuan is Director of the Service Science Research Center and a Professor in the Department of Management Informa-tion Systems, College of Commerce at Na-tional Chengchi University in Taiwan. She received her PhD in Computer Science from Oregon State University. Her research in-terests include service science, service de-sign, intelligent agents, data mining, and E/M-commerce. Soe-Tsyr Yuan can be con-tacted at: [email protected]
19
Hsieh and Yuan: Design of the Customer Expectation Measurement Model in Dynamic S
Published by AIS Electronic Library (AISeL), 2010
Copyright © 2022 FDOKUMEN