Influence of source vegetation and redox conditions on lignin-based decomposition proxies in...
12
(This is a sample cover image for this issue. The actual cover is not yet available at this time.) This article appeared in a journal published by Elsevier. The attached copy is furnished to the author for internal non-commercial research and education use, including for instruction at the authors institution and sharing with colleagues. Other uses, including reproduction and distribution, or selling or licensing copies, or posting to personal, institutional or third party websites are prohibited. In most cases authors are permitted to post their version of the article (e.g. in Word or Tex form) to their personal website or institutional repository. Authors requiring further information regarding Elsevier’s archiving and manuscript policies are encouraged to visit: http://www.elsevier.com/copyright
Transcript of Influence of source vegetation and redox conditions on lignin-based decomposition proxies in...

(This is a sample cover image for this issue. The actual cover is not yet available at this time.)
This article appeared in a journal published by Elsevier. The attachedcopy is furnished to the author for internal non-commercial researchand education use, including for instruction at the authors institution
and sharing with colleagues.
Other uses, including reproduction and distribution, or selling orlicensing copies, or posting to personal, institutional or third party
websites are prohibited.
In most cases authors are permitted to post their version of thearticle (e.g. in Word or Tex form) to their personal website orinstitutional repository. Authors requiring further information
regarding Elsevier’s archiving and manuscript policies areencouraged to visit:
http://www.elsevier.com/copyright

Author's personal copy
Source and transformations of lignin in Carex-dominated peat
Judith Schellekens a,*, Peter Buurman b, Thomas W. Kuyper c
aDepartamento de Edafoloxía e Química Agrícola, Universidade de Santiago de Compostela, Fac. de Bioloxía, Campus Universitario Sur, Santiago de Compostela,15782 A Coruña, Spainb Earth System Science Group, Wageningen University, P.O. Box 47, 6700 AA Wageningen, The NetherlandscDepartment of Soil Quality, Wageningen University, P.O. Box 47, 6700 AA Wageningen, The Netherlands
a r t i c l e i n f o
Article history:Received 12 October 2011Received in revised form21 April 2012Accepted 28 April 2012Available online 18 May 2012
Keywords:Penido VelloGaliciaPyrolysis-GC/MSNaOH-extractionFactor analysisLignin-carbohydrate complexDecompositionGraminoidsEricaceaeNon-lignin phenolic monomers
a b s t r a c t
We identified the effects of vegetation changes, and aerobic and anaerobic decay on the lignin compo-sition in the Penido Vello peat record (Galicia, Spain). The ombrotrophic part of this peat record wasdominated by graminoids and has significant contributions of ericoids at some depths. The organicmatter (OM) of different peat fractions (bulk, NaOH-extractable fraction, and non-extractable residues) of15 samples from the upper meter was analysed with pyrolysis-gas chromatography/mass spectrometry(pyrolysis-GC/MS). In addition, the dominant plant species were analysed, including Carex durieui,Agrostis curtisii, Molinia caerulea, Deschampsia flexuosa, Festuca rubra, Eriophorum angustifolium, Ericamackaiana and Calluna vulgaris, and their lignin composition compared to that of the peat OM. The highabundance of guaiacol and 4-formylguaiacol in fresh plant tissue compared to peat OM suggests that inaddition to p-coumaric and ferulic acid (which are abundant in graminoids), other non-lignin phenolicmonomers are contributed by graminoid species. For the non-lignin phenolics, graminoids differed fromericoids in the high abundance of ferulic acid (4-vinylguaiacol), while p-coumaric acid (4-vinylphenol)showed high and similar abundances in ericoids and graminoids. This result suggests that ratios betweenp-hydroxyphenyl (or p-coumaric acid) and other lignin moieties in (pyrolysates of) peat cannot be usedas source indicator. Comparison of plant and peat fractions using factor analysis allowed a distinctionbetween the effects of source (plant identity) and decay on the lignin composition of the Penido Vellopeat, and different stages of decomposition were identified. Preferential decay of guaiacyl over syringylmoieties was found for the first stage of decay. This preferential decay is probably related to the largeabundance of guaiacyl moieties in easily degradable non-lignin phenolics. Preferential decay of syringylmoieties occurred during subsequent aerobic decay.
� 2012 Elsevier Ltd. All rights reserved.
1. Introduction
In ombrotrophic peatlands, fluctuations in the water table aredetermined by variation in precipitation only. Bog hydrologystrongly influences the botanical composition and decompositionprocess. The molecular composition of OM in peatlands, soils andsediments supplies information on the botanical sources (plantidentity) and on the extent of decomposition during litter decay.Therefore, themolecular composition of OM is often used as a proxyfor past environmental conditions (e.g.McClymont et al., 2011), or toobtain information on the rate of carbon sequestration that isa crucial element in the global carbon cycle (Clymo et al., 1998).
Lignin is a significant component of OM in anaerobic ecosystemssuch as peatlands, as decomposition of lignin primarily depends on
the supply of oxygen (Williams and Yavitt, 2003). The knowledge oflignin transformations in soils and sediments, recently reviewed byThevenot et al. (2010), is mainly based on aerobic systems anduses the abundance of syringyl, guaiacyl and p-hydroxyphenylmoieties, oxygen functionality and chain length reduction of alkylside-chains, and demethoxylation. In anaerobic systems, however,the interpretation of these characteristics may be different. Inaddition, the lignin composition varies strongly between plantspecies, plant parts and elements of plant cells, and its resistance todecay may show similar differences (Machinet et al., 2011). Becausechanges in hydrology drive changes in both plant species compo-sition and degree of decomposition, the interpretation of chemicalchanges in peat in terms of decomposition is complex (Yeloff andMauquoy, 2006).
Many methods have been developed to study the lignincomposition in plant and soil OM (Lu and Ralph, 2010). Charac-terisation of lignin is difficult because it is not possible to isolate
* Corresponding author. Tel.: þ31 653832087.E-mail address: [email protected] (J. Schellekens).
Contents lists available at SciVerse ScienceDirect
Soil Biology & Biochemistry
journal homepage: www.elsevier .com/locate/soi lbio
0038-0717/$ e see front matter � 2012 Elsevier Ltd. All rights reserved.doi:10.1016/j.soilbio.2012.04.030
Soil Biology & Biochemistry 53 (2012) 32e42

Author's personal copy
lignin in its intact state. Distinguishing non-lignin phenolics alsofound in the cell wall from macromolecular lignin can be difficult.In soil OM studies, the lignin composition is usually analysed withthe CuO oxidation method (Thevenot et al., 2010), but alsopyrolysis-gas chromatography/mass spectrometry (pyrolysis-GC/MS) and tetramethylammonium hydroxide thermochemolysis(Filley et al., 2006; Nierop, 2001) are frequently applied. Althoughpyrolysis-GC/MS is a destructive method and rearrangements mayoccur during the pyrolysis process, most lignin fragments producedduring pyrolysis retain the substitution patterns of the ligninmacromolecule (Martín et al., 1979; Ralph and Hatfield, 1991; Stoutet al., 1988). In addition to the lignin composition, pyrolysis-GC/MSgives detailed information on the overall molecular composition,which benefits the interpretation. The method has been success-fully applied to characterise peat deposits and provides validinformation on both vegetation and decomposition characteristics(e.g. Kuder and Kruge, 1998; Schellekens et al., 2009).
The effects of decomposition on monocotyledon tissues havebeen studied by few authors (Kuder et al., 1998). The ombrotrophicpart of the Penido Vello peat recordwas dominated by Carex durieuiand grasses (Agrostis curtisii,Molinia caerulea, Deschampsia flexuosaand Festuca rubra) with significant contributions of Erica mackaianaand Calluna vulgaris, Eriophorum angustifolium and mosses at somedepths. M. caerulea, E. angustifolium and mosses indicate wetterconditions, the other plant species drier conditions (Fraga et al.,2005). The molecular composition of the high-resolution sampledombrotrophic Penido Vello bog (Galicia, Spain) has been previouslystudied with pyrolysis-GC/MS (Schellekens et al., 2011). Combinedinterpretation of vegetation markers, groups of pyrolysis productsand present-day vegetation composition enabled a reconstructionof bog hydrology. Wet and dry periods identified by molecularchemistry agreed well with other European studies. Thus, thePenido Vello bog, with its known changes in vegetation composi-tion and hydrology, is particularly suited to study the effects ofdecomposition on the lignin composition in peat.
The purpose of this study is to identify and separate the effectsof source and decomposition (aerobic and anaerobic) on the lignincomposition of the Penido Vello peat record. Because poly-saccharides and lignin-like phenolic monomers are associated withlignin (see Section 4.1), the effects of source and decomposition onpolysaccharides and phenolic monomers were also studied.
2. Material and methods
2.1. Location and sampling
ThePenidoVello peat is anombrotrophicbog located in theXistralmountains (Galicia, NW Spain). Location and bog are described indetail by Martínez-Cortizas et al. (1997, 2002). The 3 m thick peatrecord dates back to 6000 years BC. For the purpose of this study onlythe high-resolution sampled (slices of 2 cm thick) upper meter of thepeat record was used, as it showed better correlations betweenvegetation markers than the deeper part, which was sectioned into5 cm thick slices (Schellekens et al., 2011). The upper meter (51samples) represents around 2000 years of peat accumulation.
2.2. Samples
Bulk samples of plant species and peat were previously analysedwith pyrolysis-GC/MS (Schellekens et al., 2011). In addition,pyrolysates of NaOH-extractable and non-extractable OM ofa selection of 15 samples, previously analysed by Buurman et al.(2006) were used. The selection of these samples was based ondifferences in quantified 13C NMR data. The extractable fractionmore reflects decomposed OM and the non-extractable residue
more closely resembles intact plant material (Buurman et al., 2006;Schellekens et al., 2009; Schellekens and Buurman, 2011; Zacconeet al., 2008). Comparison of pyrolysates of fresh plant tissues andthe extractable and non-extractable peat fraction allows thedistinction between effects of source and those of decompositionon the lignin fraction.
2.3. Extraction
An aliquot (0.5 g) of each peat sample was extracted with NaOH(0.1 M, 20 mL), shaken for 24 h under N2 and centrifuged (1 h) at4000 g. The extract was decanted and the extraction repeateda second time. The extracts were combined, acidified to pH 1 withHCl, shaken for 24 h, dialysed against distilled water (cut off 10,000D) and freeze-dried. The residues were acidified, dialysed againstdistilled water and freeze-dried.
2.4. Pyrolysis-GC/MS
The samples were pyrolysed using a Horizon Curie-Point pyro-lyser (Curie temperature 600 �C) connected to a Carlo Erba GC8000gas chromatograph. The pyrolysis products were separated ona non-polar fused silica column (Chrompack 25 m, 0.25 mm i.d.)coated with CP-Sil 51 b (film thickness 0.40 mm), with He as carriergas. The initial oven temperature was 40 �C and the heating rate7 �C min�1. The final temperature, 320 �C, was maintained for15 min. The GC column was connected to a Fisons MD800 massspectrometer (m/z 45e650, cycle time 1 s).
2.5. Quantification
In addition to the 106 pyrolysis products quantified for the bulksamples (Schellekens et al., 2011), a number of less common ligninpyrolysis products were quantified. This resulted in a total of 120quantified pyrolysis products. These 120 pyrolysis products werealso quantified for the peat extracts and residues and for the plantsamples. Quantifications were based on the peak area of two majorfragment ions of each pyrolysis product (Appendix). All quantifi-cations were checked manually. For each sample, the sum of thepeak areas was set at 100% and relative proportions were calculatedwith respect to this sum. The resulting quantification gives theabundance of each pyrolysis product, expressed as percentage ofthe total ion current (TIC).
The pyrolysis products were grouped, according to probableorigin and chemical similarity, into a number of source groups:polysaccharides, aliphatic biopolymers, methylketones, lignins,phenols, catechols, (other) aromatics, polyaromatics, nitrogencompounds, fatty acids, steroids and triterpenoids. Factor analysiswas applied using Statistica� Version 6 (Statsoft Inc, Tulsa).
3. Results
The abundance of groups of pyrolysis products for plant and peatOM are given in Table 1. The abundance of lignin-derived pyrolysisproducts as percentage of the total quantified pyrolysis products aregiven in Table 2. Based on analysis of 18 plant species markers werefound for graminoids, ericoids, and woody species (includingericoids but not exclusively ericoids; Schellekens et al., 2011).
3.1. The composition of lignin-derived pyrolysis products in plantspecies
To interpret the chemical composition of the ligninecarbohydratecomplex (LCC), the ratio of lignin to polysaccharides is used in addi-tion to groups of pyrolysis products (Table 1). In graminoids the
J. Schellekens et al. / Soil Biology & Biochemistry 53 (2012) 32e42 33

Author's personal copy
abundance of lignin pyrolysis products was higher than that ofpolysaccharide pyrolysis products (lignin/polysaccharide ratiosbetween 1.1 and 1.8) except for F. rubrawith a slightly higher contri-butionofpolysaccharides (0.9),while in the ericoids theabundanceofpolysaccharides exceeded that of lignins (ratios of 0.7 and 0.8).
The contribution of pyrolysis products derived from the variouslignin-building blocks (Table 1) showed (i) large and unexpecteddifferences between graminoids that perform better under rela-tively dry and wet conditions, and (ii) considerable content of p-hydroxyphenyl pyrolysis products in ericoids.
3.2. Comparison of lignin-derived pyrolysis products in plant andpeat OM
Factor analysis was applied to quantified lignin-derived pyrol-ysis products in plant species and peat fractions (mean values ofextracts, residues and bulk samples). To this end, quantities oflignin pyrolysis products were expressed as a percentage of thesummed lignin pyrolysis products (not of TIC). Loadings and scoresof factors 1 and 2 (F1, F2) and factors 3 and 4 (F3, F4) are shown inFig.1. Loadings for the first four factors explain themajor part of thevariance (85.9%).
The clearly separated clusters of scores on the F1eF2 projection(Fig. 1a) show that graminoids, ericoids and peat fractions differ incomposition of lignin-derived pyrolysis products. The projection ofthe peat fractions, with the residues closest to the plant species,confirms that the residues reflect more intact plant material, whilethe extracts reflectdecomposedmaterial. The factor loadings (Fig.1b)indicate which lignin pyrolysis products are associated with grami-noids, ericoids andpeat OM. The variance of 4-vinylguaiacol (Lg12) ismainly determined by graminoids. Ericoids are characterised bya high abundance of C3-guaiacols (Lg13, Lg14, Lg16, Lg17), C3-syrin-gols (Lg31, Lg33), 4-formylsyringol (Lg34) and 4-(propan-3-ol)syringol (Lg43). While peat OM is associated with a relatively highabundance of lignin pyrolysis products with oxygenated alkyl side-chains (Fig. 1a and b). These are 4-formylphenol (Lg5), 4-hydroxybenzoic, vanillic and syringic acid methyl ester (Lg7, Lg21,Lg40), 4-hydroxybenzoic, vanillic and syringic acid (Lg8, Lg24, Lg42),4-acetylphenol, 4-acetylguaiacol and 4-acetylsyringol (Lg6, Lg18,Lg38), lignin pyrolysis products with an oxygenated C3 alkyl side-chain (Lg23, Lg39, Lg41), and syringyl pyrolysis products witha C3H3 side-chain (Lg35, Lg36).
In the F3eF4 projection (Fig. 1c), the graminoids are separatedinto two groups: those that perform better under relatively dryconditions have positive scores on F3, while those that prefer wetconditions have negative scores. The ericoids have low scores on F3.The factor loadings (Fig. 1d) show that F3 separates guaiacyl(positive loadings) from syringyl and p-hydroxyphenyl ligninpyrolysis products (negative loadings).
3.3. Differences in molecular composition between peat fractions
To further identify the effects of botanical source and decom-position on the lignin composition in peat OM, pyrolysates of thedifferent peat fractions are compared. Factor analysis was appliedto all 120 quantified pyrolysis products for extracts and residues(Appendix). Factor loadings for the first four factors explain themajor part of the variance for extracts (76.0%, Fig. 2) and residues(78.6%, Fig. 3).
Loadings in F1eF2 projection indicate major differences in thedistribution of lignin pyrolysis products between extracts (Fig. 2a)and residues (Fig. 3a). In the extracts, a clear separation appearsbetween guaiacyl and syringyl pyrolysis products, while in the resi-dues, guaiacyl and syringyl pyrolysis products are not separated. Thisdifferential pattern suggests that decomposition (reflected by theTa
ble
1Pe
rcen
tage
san
dratios
ofgrou
psof
quan
tified
pyrolysisprodu
ctsin
plantan
dpea
tOM.M
eanva
lues
(printedin
bold)aregive
nforgram
inoidsthat
perform
better
under
dry
conditions(A.curtisii,F.rubra,
C.du
rieu
i,D.fl
exuo
sa),
gram
inoidsthat
perform
better
under
relative
lywet
conditions(M
.cae
rulea,E.an
gustifo
lium)a
ndericoids(E.m
acka
iana
,C.vulga
ris),thepea
tfractionsaremea
nva
lues
of15
samplesforex
tracts
andresidues
andof
51samplesfor
thebu
lkOM.
Nam
eUnit
Graminoids
Ericoids
Peat
A.curtisiia,b
F.rubraa
,bC.
durieu
ia,b
D.fl
exuo
saa,c
Mea
n(dry)
M.cae
ruleaa
,b,c
E.an
gustifo
lium
aMea
n(w
et)
E.macka
iana
a,b,c
C.vu
lgarisa,b
Mea
n(erico
ids)
Residues
Bulk
Extracts
Polysaccharides
%TIC
40.1
43.0
33.2
32.0
37.1
31.0
32.9
32.0
41.5
37.1
39.3
73.0
61.8
31.0
Lign
ins
%TIC
47.8
40.0
47.5
47.7
45.8
54.8
34.9
44.8
29.5
30.4
29.9
9.8
17.4
33.3
Phen
ols
%TIC
4.0
3.3
4.4
3.8
3.9
5.0
4.4
4.7
6.9
6.1
6.5
1.9
5.4
14.9
Catechols
%TIC
2.7
2.1
2.7
1.7
2.3
3.3
2.5
2.9
8.9
17.0
13.0
0.9
1.8
4.8
Aromatics
%TIC
1.8
2.8
2.4
2.4
2.3
2.2
2.7
2.4
4.2
3.5
3.9
1.0
1.8
4.1
Other
%TIC
3.6
8.8
9.9
12.4
8.7
3.8
22.6
13.2
9.1
5.9
7.5
13.4
11.7
11.9
p-Hyd
roxy
phen
yl%lig
nin
17.8
18.4
16.4
9.6
15.6
36.1
33.2
34.6
27.5
14.1
20.8
15.6
21.9
19.8
Guaiacyl
%lig
nin
71.3
71.8
71.9
80.2
73.8
51.7
52.5
52.1
57.4
55.0
56.2
66.9
57.1
56.2
Syringy
l%lig
nin
10.9
9.8
11.7
10.2
10.6
12.2
14.3
13.3
15.1
30.9
23.0
17.5
21.0
24.0
Lign
ins/Po
lysaccharides
e1.19
0.93
1.43
1.49
1.26
1.76
1.06
1.41
0.71
0.82
0.76
0.13
0.28
1.07
p-Hyd
roxy
phen
yl/
Guaiacyl
þSy
ringy
l0.22
0.23
0.20
0.11
0.19
0.56
0.50
0.53
0.38
0.16
0.27
0.18
0.28
0.25
Syringy
l/Guaiacyl
0.15
0.14
016
0.13
0.14
0.24
0.26
0.25
0.26
0.56
0.41
0.26
0.37
0.43
%TIC¼
percentage
ofthetotalqu
antified
pyrolysis
products.
Pyrolysisproductsthat
contribute
toea
chgrou
paregive
nin
theAppen
dix,lignin
moietiesarelis
tedin
Table2.
aLe
aves/stem.
bRoo
ts.
cFlow
ers.
J. Schellekens et al. / Soil Biology & Biochemistry 53 (2012) 32e4234

Author's personal copy
Table 2Lignin pyrolysis products expressed as percentage of the total quantified pyrolysis products (see Appendix) in plant and peat OM. Mean values (printed in bold) are given for graminoids that perform better under dry conditions(A. curtisii, F. rubra, C. durieui, D. flexuosa), graminoids that perform better under relatively wet conditions (M. caerulea, E. angustifolium) and ericoids (E.mackaiana, C. vulgaris), the peat fractions are mean values of 15 samples forextracts and residues and of 51 samples for the bulk OM.
Code Name Graminoids Ericoids Peat
A. curtisii F. rubra C. durieui D. flexuosa Mean (dry) M. caerulea E. angustifolium Mean (wet) E. mackaiana C. vulgaris Mean (wood) Residues Bulk Extracts
Lg1 4-vinylphenol 8.2 7.0 7.3 4.4 6.7 19.3 11.4 15.3 7.9 4.0 6.0 1.2 3.1 5.1Lg2 4-(2-propenyl)phenol 0.0 0.0 0.0 0.0 0.0 0.0 0.0 0.0 0.0 0.1 0.0 0.0 0.0 0.0Lg3 4-(1-propenyl)phenol, cis 0.1 0.1 0.0 0.0 0.0 0.1 0.1 0.1 0.1 0.1 0.1 0.0 0.0 0.0Lg4 4-(1-propenyl)phenol, trans 0.1 0.1 0.2 0.1 0.1 0.2 0.1 0.1 0.1 0.1 0.1 0.1 0.1 0.2Lg5 4-formylphenol 0.1 0.1 0.2 0.1 0.1 0.2 0.1 0.1 0.0 0.0 0.0 0.1 0.1 0.3Lg6 4-acetylphenol 0.0 0.0 0.1 0.0 0.0 0.1 0.0 0.0 0.0 0.0 0.0 0.0 0.2 0.1Lg7 4-hydroxybenzoic acid methyl ester 0.0 0.0 0.0 0.0 0.0 0.0 0.0 0.0 0.0 0.0 0.0 0.0 0.0 0.1Lg8 4-hydroxybenzoic acid 0.0 0.0 0.0 0.0 0.0 0.0 0.0 0.0 0.0 0.0 0.0 0.0 0.3 0.7Lg9 guaiacol 4.5 3.8 5.1 6.1 4.9 3.9 1.9 2.9 3.3 2.9 3.1 0.8 1.2 3.9Lg10 4-methylguaiacol 2.2 1.2 1.4 1.2 1.5 1.1 0.6 0.8 2.3 2.3 2.3 0.9 1.2 1.7Lg11 4-ethylguaiacol 1.2 0.7 0.8 0.9 0.9 0.9 0.4 0.7 0.7 0.8 0.7 0.2 0.5 1.2Lg12 4-vinylguaiacol 18.4 17.5 20.4 23.3 19.9 17.6 13.5 15.6 4.7 4.7 4.7 2.3 3.5 5.7Lg13 4-(prop-2-enyl)guaiacol 0.4 0.3 0.3 0.4 0.3 0.3 0.1 0.2 0.5 0.5 0.5 0.1 0.1 0.1Lg14 4-propylguaiacol 0.2 0.1 0.1 0.2 0.1 0.1 0.0 0.1 0.3 0.2 0.2 0.0 0.0 0.0Lg15 4-formylguaiacol 2.5 1.9 1.7 2.1 2.0 1.5 1.2 1.4 0.8 1.1 1.0 0.5 0.7 0.8Lg16 4-(prop-1-enyl)guaiacol, cis 0.3 0.2 0.3 0.3 0.3 0.2 0.0 0.1 0.4 0.4 0.4 0.1 0.0 0.1Lg17 4-(prop-1-enyl)guaiacol, trans 1.7 1.1 1.4 1.7 1.5 1.1 0.3 0.7 2.1 2.1 2.1 0.3 0.3 0.3Lg18 4-acetylguaiacol 0.7 0.4 0.5 0.6 0.6 0.3 0.1 0.2 0.4 0.6 0.5 0.5 0.9 1.9Lg19 guaiacol derivative 0.2 0.2 0.3 0.2 0.2 0.2 0.0 0.1 0.1 0.2 0.1 0.1 0.1 0.1Lg20 guaiacol derivative 0.1 0.1 0.2 0.2 0.2 0.1 0.0 0.1 0.1 0.1 0.1 0.0 0.1 0.1Lg21 vanillic acid methyl ester 0.1 0.1 0.1 0.0 0.1 0.0 0.0 0.0 0.0 0.0 0.0 0.0 0.1 0.2Lg22 4-(propan-2-one)guaiacol 0.8 0.7 0.9 1.0 0.9 0.6 0.1 0.4 0.9 0.5 0.7 0.2 0.2 0.4Lg23 4-(propan-1-one)guaiacol 0.0 0.1 0.1 0.0 0.0 0.0 0.0 0.0 0.2 0.1 0.2 0.1 0.3 0.5Lg24 vanillic acid 0.5 0.3 0.3 0.0 0.3 0.2 0.0 0.1 0.1 0.1 0.1 0.4 0.6 1.4Lg25 ferulic acid methyl ester 0.2 0.1 0.1 0.0 0.1 0.1 0.0 0.1 0.0 0.0 0.0 0.0 0.0 0.0Lg27 syringol 1.0 0.8 1.2 1.0 1.0 1.8 1.2 1.5 0.8 1.3 1.0 0.2 0.4 1.5Lg28 4-methylsyringol 0.4 0.3 0.3 0.4 0.3 0.4 0.4 0.4 0.4 0.9 0.6 0.2 0.5 0.9Lg29 4-ethylsyringol 0.8 0.1 0.1 0.1 0.3 0.1 0.1 0.1 0.1 0.3 0.2 0.0 0.1 0.5Lg30 4-vinylsyringol 0.9 0.9 1.6 1.4 1.2 1.5 1.3 1.4 1.0 2.1 1.5 0.3 0.7 1.4Lg31 4-(prop-2-enyl)syringol 0.1 0.1 0.2 0.2 0.1 0.2 0.2 0.2 0.2 0.4 0.3 0.1 0.1 0.1Lg32 4-propylsyringol 0.0 0.0 0.0 0.0 0.0 0.1 0.0 0.0 0.0 0.1 0.1 0.0 0.0 0.1Lg33 4-(prop-1-enyl)syringol, cis 0.1 0.1 0.1 0.1 0.1 0.2 0.2 0.2 0.2 0.3 0.3 0.0 0.1 0.1Lg34 4-formylsyringol 0.4 0.3 0.3 0.2 0.3 0.4 0.3 0.4 0.3 1.0 0.7 0.1 0.2 0.2Lg35 syringol derivative 0.1 0.1 0.1 0.1 0.1 0.1 0.1 0.1 0.0 0.1 0.1 0.0 0.1 0.1Lg36 syringol derivative 0.0 0.0 0.1 0.1 0.0 0.0 0.0 0.0 0.0 0.1 0.1 0.0 0.1 0.1Lg37 4-(prop-1-enyl)syringol, trans 0.6 0.6 0.7 0.5 0.6 1.0 0.8 0.9 0.6 1.4 1.0 0.3 0.4 0.7Lg38 4-acetylsyringol 0.3 0.3 0.3 0.4 0.3 0.4 0.1 0.3 0.2 0.6 0.4 0.1 0.5 1.0Lg39 4-(propan-2-one)syringol 0.3 0.3 0.4 0.4 0.3 0.4 0.2 0.3 0.1 0.3 0.2 0.1 0.3 0.7Lg40 syringic acid methyl ester 0.0 0.0 0.0 0.0 0.0 0.0 0.0 0.0 0.0 0.0 0.0 0.0 0.0 0.1Lg41 4-(propan-3-one)syringol 0.1 0.1 0.1 0.0 0.0 0.1 0.1 0.1 0.1 0.2 0.1 0.1 0.1 0.4Lg42 syringic acid 0.1 0.0 0.0 0.0 0.0 0.0 0.0 0.0 0.0 0.1 0.0 0.0 0.1 0.2Lg43 4-(propan-3-ol)syringol 0.0 0.0 0.0 0.0 0.0 0.1 0.0 0.1 0.2 0.3 0.3 0.0 0.0 0.0
J.Schellekenset
al./Soil
Biology&
Biochemistry
53(2012)
32e42
35

Author's personal copy
extracts) rather than vegetation composition (reflected by the resi-dues) affects the guaiacyl-to-syringyl ratio in the peat OM.
4. Discussion
4.1. Structure and composition of lignin-carbohydrate complex
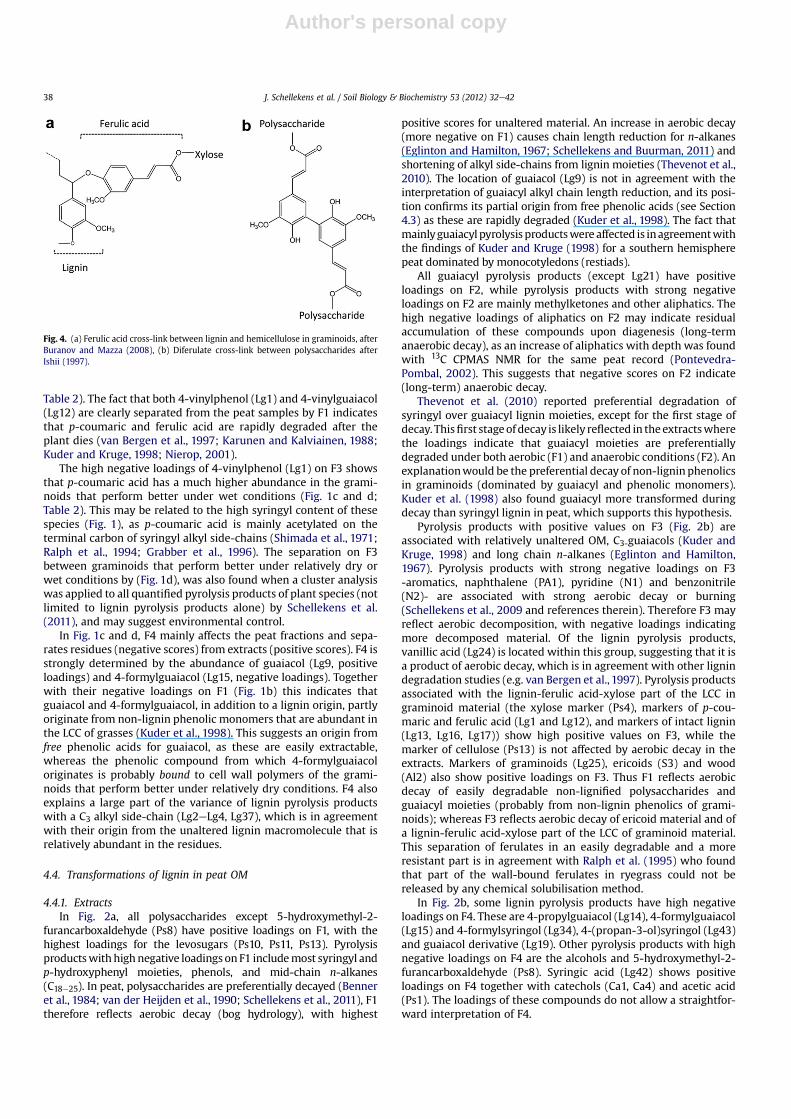
There is a notable difference in the composition of the LCCbetween the two dominant lignin sources in the Penido Vello peatrecord, namely ericoids (woody species) and graminoids (herba-ceous species). In addition to lignin, graminoids possess a highcontent of free and bound phenolics (Lewis and Yamamoto, 1990).p-Coumaric and ferulic acids are ester- and/or ether-linked to cellwall polymers. Ferulic acid is ether-linked to lignin and ester-linkedto hemicellulose and may form bridges between them, whilep-coumaric acid is mainly ester-linked to both lignin and hemi-cellulose (Kondo et al., 1989; Sun et al., 2011). In addition, manyxylans of grasses contain dimers of ester-linked p-coumaric andferulic acid that cross-link cell wall polysaccharides (Ishii, 1997;Lam et al., 1992). The structure of the LCC of graminoids is shown inFig. 4. In wood of dicotyledonous species (but not necessarily inleaves), lignin is more directly associated with polysaccharidesthrough the formation of benzyl-ether and other alkali-stablebonds (Watanabe et al., 1989).
The LCC can be recognised upon pyrolysis. The main pyrolysisproduct of cellulose is levoglucosan (Pouwels et al., 1989). Xylose,which has a high abundance in hemicelluloses of grasses (Smithand Harris, 1999; Wende and Fry, 1996) and sedges (Bourdon
et al., 2000), results in 4-hydroxy-5,6-dihydro-(2H)-pyran-2-oneupon pyrolysis (Pouwels et al., 1987). Typical pyrolysis productsof p-coumaric and ferulic acid are 4-vinylphenol and 4-vinylguaiacol, respectively (Boon et al., 1982; van der Hage et al.,1993). The b-O-4 bonds, which form the primary link betweenlignin monomers, are broken upon pyrolysis and, in unalteredlignin, result in lignin moieties with a C3 alkyl side-chain (van derHage et al., 1993).
4.2. The lignin composition of dominant plant species
The relatively high content of lignin-derived pyrolysis productsin graminoids (Table 1) is not conform expectations, as graminoidshave lower lignin content thanwoody species such as ericoids. Thisdiscrepancy is caused by the high abundance of non-ligninphenolics (p-coumaric and ferulic acid) in graminoids, which cancontribute to more than 50% to guaiacyl and p-hydroxyphenylmoieties (Martínez et al., 2001; Lu and Ralph, 2010), and pyrolysis-GC/MS does not allow differentiation between moieties derivedfrom macromolecular lignin and non-lignin phenolics.
The differences in guaiacyl content between graminoids thatperform better under relatively dry or wet conditions are mainlycaused by the contribution of 4-vinylguaiacol and 4-vinylphenol(Table 2). This does not reflect the contribution of guaiacyl andp-hydroxyphenyl moieties to the lignin macromolecule but theabundance of ferulic and p-coumaric acid. The difference betweenthe two graminoid groups will be further discussed in Section 4.3.
Fig. 1. F1eF2 projection of factor scores (a) and loadings (b), and F3eF4 projection of scores (c) and loadings (d) for lignin pyrolysis products of plant species and mean values of thepeat fractions. H ¼ p-hydroxyphenyl pyrolysis products; G ¼ guaiacyl pyrolysis products; S ¼ syringyl pyrolysis products. For codes see Table 2.
J. Schellekens et al. / Soil Biology & Biochemistry 53 (2012) 32e4236

Author's personal copy
Notwithstanding the woody character of ericoids, C. vulgaris andE.mackaiana show a relatively high abundance of p-hydroxyphenylpyrolysis products (Table 1), dominated by 4-vinylphenol (Table 2).4-Vinylphenol was also found a dominant pyrolysis product inC. vulgaris shoots by Huang et al. (1998) and only in non-woodytissue of C. vulgaris by Nierop et al. (2001). Other phenolic plantbiomacromolecules such as tannin and suberin may contribute top-hydroxyphenylmoieties in ericoids. Tannin is abundant in ericoids(e.g. Monschein et al., 2010). Suberin consists of aliphatic andphenolic components including p-coumaric and ferulic acid(Hatfield, 2009). However, thesemacromolecules generally produceother phenolic compounds (e.g. catechol and phenol, Table 1) inmuch higher amounts than those included in the p-hydroxyphenylgroup (Table 2). Knowledge of lignin of woody plants is generallyrestricted towoody tissue (e.g. Donaldson, 2001), while research onlignin in non-woody tissue has been concentrated on graminoids(Buranov and Mazza, 2008). In addition to monocotyledons, non-woody tissue from woody species may also contain p-coumaricand ferulic acids (Sarkanen and Ludwig, 1971; Hedges and Mann,1979). In soil OM, lignin from woody species originates froma mixture of tissues (wood, leaves, roots, etc.) that have differentlignin compositions, and thus knowledge of the paper industry e
whichdealswithwoodexclusivelyecannot directlybe translated tosoil OM studies. Thus, the high values of p-hydroxyphenyl pyrolysisproducts in ericoids (Table 1) originate from their leaves, and ratiosbetween p-hydroxyphenyl (or p-coumaric acid) and other ligninmoieties in (pyrolysates of) peat cannot be used as source indicator,not evenwhen it is assumed that decompositiondoes not affect suchratios. The lignin classification softwood-hardwood-grasses is thusinadequate (Boerjan et al., 2003; Lu and Ralph, 2010), which issupported by the results presented above.
4.3. Influence of source on lignin moieties in peat OM
The major differences in the composition of lignin pyrolysisproducts between plant families and peat OM are explained byF1eF2 (Fig. 1a and b). Most lignin pyrolysis products that wererelatively enriched upon degradation showed oxygenation of alkylside-chains while lignin moieties with a C3 alkyl side-chain areabundant in ericoids (Section 3.2). This is conform the knowndifferences between fresh plant material and peat OM, as degra-dation increases oxygenation of lignin alkyl side-chains (Kögel-Knabner, 2002). All graminoids were characterised by a highabundance of ferulic acid (reflected by 4-vinylguaiacol Fig.1a and b;
Fig. 2. Factor loadings of extracts (a) F1eF2 and (b) F3eF4. Al ¼ aliphatics;Ps ¼ polysaccharides; K ¼ methylketones; Ar ¼ aromatics; PA ¼ polyaromatics; LgH ¼ p-hydroxyphenyl lignin; Lg G ¼ guaiacyl lignin; Lg S ¼ syringyl lignin;N ¼ nitrogen compounds; Ph ¼ phenols; Ca ¼ catechols; S ¼ sterols;Ttp ¼ triterpenoids; F ¼ fatty acids. For codes see Appendix.
Fig. 3. Factor loadings of residues (a) F1eF2 and (b) F3eF4. Al ¼ aliphatics;Ps ¼ polysaccharides; K ¼ methylketones; Ar ¼ aromatics; PA ¼ polyaromatics; LgH ¼ p-hydroxyphenyl lignin; Lg G ¼ guaiacyl lignin; Lg S ¼ syringyl lignin;N ¼ nitrogen compounds; Ph ¼ phenols; Ca ¼ catechols; S ¼ sterols;Ttp ¼ triterpenoids; F ¼ fatty acids. For codes see Appendix.
J. Schellekens et al. / Soil Biology & Biochemistry 53 (2012) 32e42 37
Author's personal copy
Table 2). The fact that both 4-vinylphenol (Lg1) and 4-vinylguaiacol(Lg12) are clearly separated from the peat samples by F1 indicatesthat p-coumaric and ferulic acid are rapidly degraded after theplant dies (van Bergen et al., 1997; Karunen and Kalviainen, 1988;Kuder and Kruge, 1998; Nierop, 2001).
The high negative loadings of 4-vinylphenol (Lg1) on F3 showsthat p-coumaric acid has a much higher abundance in the grami-noids that perform better under wet conditions (Fig. 1c and d;Table 2). This may be related to the high syringyl content of thesespecies (Fig. 1), as p-coumaric acid is mainly acetylated on theterminal carbon of syringyl alkyl side-chains (Shimada et al., 1971;Ralph et al., 1994; Grabber et al., 1996). The separation on F3between graminoids that perform better under relatively dry orwet conditions by (Fig. 1d), was also found when a cluster analysiswas applied to all quantified pyrolysis products of plant species (notlimited to lignin pyrolysis products alone) by Schellekens et al.(2011), and may suggest environmental control.
In Fig. 1c and d, F4 mainly affects the peat fractions and sepa-rates residues (negative scores) from extracts (positive scores). F4 isstrongly determined by the abundance of guaiacol (Lg9, positiveloadings) and 4-formylguaiacol (Lg15, negative loadings). Togetherwith their negative loadings on F1 (Fig. 1b) this indicates thatguaiacol and 4-formylguaiacol, in addition to a lignin origin, partlyoriginate from non-lignin phenolic monomers that are abundant inthe LCC of grasses (Kuder et al., 1998). This suggests an origin fromfree phenolic acids for guaiacol, as these are easily extractable,whereas the phenolic compound from which 4-formylguaiacoloriginates is probably bound to cell wall polymers of the grami-noids that perform better under relatively dry conditions. F4 alsoexplains a large part of the variance of lignin pyrolysis productswith a C3 alkyl side-chain (Lg2eLg4, Lg37), which is in agreementwith their origin from the unaltered lignin macromolecule that isrelatively abundant in the residues.
4.4. Transformations of lignin in peat OM
4.4.1. ExtractsIn Fig. 2a, all polysaccharides except 5-hydroxymethyl-2-
furancarboxaldehyde (Ps8) have positive loadings on F1, with thehighest loadings for the levosugars (Ps10, Ps11, Ps13). Pyrolysisproductswithhighnegative loadings on F1 includemost syringyl andp-hydroxyphenyl moieties, phenols, and mid-chain n-alkanes(C18e25). In peat, polysaccharides are preferentially decayed (Benneret al., 1984; van der Heijden et al., 1990; Schellekens et al., 2011), F1therefore reflects aerobic decay (bog hydrology), with highest
positive scores for unaltered material. An increase in aerobic decay(more negative on F1) causes chain length reduction for n-alkanes(Eglinton and Hamilton, 1967; Schellekens and Buurman, 2011) andshortening of alkyl side-chains from lignin moieties (Thevenot et al.,2010). The location of guaiacol (Lg9) is not in agreement with theinterpretation of guaiacyl alkyl chain length reduction, and its posi-tion confirms its partial origin from free phenolic acids (see Section4.3) as these are rapidly degraded (Kuder et al., 1998). The fact thatmainlyguaiacyl pyrolysis productswere affected is inagreementwiththe findings of Kuder and Kruge (1998) for a southern hemispherepeat dominated by monocotyledons (restiads).
All guaiacyl pyrolysis products (except Lg21) have positiveloadings on F2, while pyrolysis products with strong negativeloadings on F2 are mainly methylketones and other aliphatics. Thehigh negative loadings of aliphatics on F2 may indicate residualaccumulation of these compounds upon diagenesis (long-termanaerobic decay), as an increase of aliphatics with depth was foundwith 13C CPMAS NMR for the same peat record (Pontevedra-Pombal, 2002). This suggests that negative scores on F2 indicate(long-term) anaerobic decay.
Thevenot et al. (2010) reported preferential degradation ofsyringyl over guaiacyl lignin moieties, except for the first stage ofdecay. Thisfirst stageof decay is likely reflected in theextractswherethe loadings indicate that guaiacyl moieties are preferentiallydegraded under both aerobic (F1) and anaerobic conditions (F2). Anexplanationwould be the preferential decay of non-lignin phenolicsin graminoids (dominated by guaiacyl and phenolic monomers).Kuder et al. (1998) also found guaiacyl more transformed duringdecay than syringyl lignin in peat, which supports this hypothesis.
Pyrolysis products with positive values on F3 (Fig. 2b) areassociated with relatively unaltered OM, C3-guaiacols (Kuder andKruge, 1998) and long chain n-alkanes (Eglinton and Hamilton,1967). Pyrolysis products with strong negative loadings on F3-aromatics, naphthalene (PA1), pyridine (N1) and benzonitrile(N2)- are associated with strong aerobic decay or burning(Schellekens et al., 2009 and references therein). Therefore F3 mayreflect aerobic decomposition, with negative loadings indicatingmore decomposed material. Of the lignin pyrolysis products,vanillic acid (Lg24) is located within this group, suggesting that it isa product of aerobic decay, which is in agreement with other lignindegradation studies (e.g. van Bergen et al., 1997). Pyrolysis productsassociated with the lignin-ferulic acid-xylose part of the LCC ingraminoid material (the xylose marker (Ps4), markers of p-cou-maric and ferulic acid (Lg1 and Lg12), and markers of intact lignin(Lg13, Lg16, Lg17)) show high positive values on F3, while themarker of cellulose (Ps13) is not affected by aerobic decay in theextracts. Markers of graminoids (Lg25), ericoids (S3) and wood(Al2) also show positive loadings on F3. Thus F1 reflects aerobicdecay of easily degradable non-lignified polysaccharides andguaiacyl moieties (probably from non-lignin phenolics of grami-noids); whereas F3 reflects aerobic decay of ericoid material and ofa lignin-ferulic acid-xylose part of the LCC of graminoid material.This separation of ferulates in an easily degradable and a moreresistant part is in agreement with Ralph et al. (1995) who foundthat part of the wall-bound ferulates in ryegrass could not bereleased by any chemical solubilisation method.
In Fig. 2b, some lignin pyrolysis products have high negativeloadings on F4. These are 4-propylguaiacol (Lg14), 4-formylguaiacol(Lg15) and 4-formylsyringol (Lg34), 4-(propan-3-ol)syringol (Lg43)and guaiacol derivative (Lg19). Other pyrolysis products with highnegative loadings on F4 are the alcohols and 5-hydroxymethyl-2-furancarboxaldehyde (Ps8). Syringic acid (Lg42) shows positiveloadings on F4 together with catechols (Ca1, Ca4) and acetic acid(Ps1). The loadings of these compounds do not allow a straightfor-ward interpretation of F4.
Fig. 4. (a) Ferulic acid cross-link between lignin and hemicellulose in graminoids, afterBuranov and Mazza (2008), (b) Diferulate cross-link between polysaccharides afterIshii (1997).
J. Schellekens et al. / Soil Biology & Biochemistry 53 (2012) 32e4238

Author's personal copy
4.4.2. ResiduesContrary to the extractable fraction, the residues contain rela-
tively large fragments and therefore more reflect plant characteris-tics. Pyrolysis products with positive loadings on F1 includecompounds indicativeofmosses (Ps5, Ps12, Ph4) and intact cellulose(Ps10, Ps11, Ps13) as well as markers of ericoids (S3) and wood (Al2,positive loadings; Fig. 3a). The corresponding samples originatefrom the Little Ice Age (Schellekens et al., 2011). The relatively highcontribution of both mosses and ericoids is caused by (i) the pre-vailing wet conditions during this period followed by recentdrainageduring roadandwind farmconstruction (Fraga et al., 2008)that may have caused roots of ericoid plants to enter to greaterdepths (Schellekens et al., 2011), and/or (ii) a better preservation ofericoid plant remains during wet periods (Buurman et al., 2006).
The distribution of pyrolysis products of residues on F2 resemblesthat in the extracts, and F2 in the residues is therefore also interpretedas (long-term) anaerobic decay (increasing towards positive load-ings). Pyrolysis products with high positive loadings on F1 show littlevariation on F2, which suggests that remains of mosses and ericoidsare less altered under anaerobic conditions. This is in agreementwithan excellent preservation of polysaccharides of wood of ericoidsunder anaerobic conditions in peat (van der Heijden and Boon,1994).Contrarily, anaerobic decay in the residues affects lignin (negative onF1). Most pyrolysis products with high negative loadings on F2 areindicative of intact lignin (C3-guaiacols (Lg13, Lg16, Lg17) and C3-syringols (Lg31, Lg33), 4-(propan-3-ol)syringol (Lg43) and 4-formylsyringol (Lg34)). Furthermore, the xylose marker 4-hydroxy-5,6-dihydro-(2H)-pyran-2-one (Ps4) clusters with the C3-guaiacolsand may thus indicate intact LCC from graminoids (Fig. 4). Themarkers of ferulic (4-vinylguaiacol, Lg12) and p-coumaric acid (4-vinylphenol, Lg1) are not within this cluster but predominantlydetermined by F1. This confirms that a major part of ferulic and p-coumaric acidwere degraded atfirst (Sections 4.3 and 4.4.1) and thusremoved from the LCC in the residues, and indicates that in the resi-dues degraded macromolecular lignin contributes more to theabundance of 4-vinylguaiacol and 4-vinylphenol. It further supportsthe interpretation of F1 as reflectingdifferent botanical contributions.p-Hydroxyphenyl pyrolysis products cluster together, with positiveloadings on F2, which points towards demethoxylation underanaerobic conditions. This is in agreement with other decompositionstudies in peat (Kuder and Kruge, 1998; Zaccone et al., 2008).
In the F3eF4 projection (Fig. 3b), the residues show low loadingsfor most lignin pyrolysis products. However, a clear separation ofsyringyl and guaiacyl moieties appears. Levoglucosan (Ps13) showshigh positive loading on F3; while pyrolysis products indicative ofaerobic decay such as vanillic acid (Lg24) and pyridine (N1) havenegative loadings on F3. Therefore, negative scores on F3 mayreflect aerobic decay of remaining material. The preferential decayof syringyl (more positive on F3) over guaiacyl pyrolysis products(more negative on F3) then also corresponds to the generalknowledge on lignin decay (Thevenot et al., 2010).
4.4.3. The influence of extraction on the molecular composition ofpeat OM
In order to correctly interpret the effects of decomposition onthe LCC it is important to understand the side-effects of extraction.
4.4.3.1. Lignin and cellulose. Unaltered ligninandcellulosepolymersare not extractable with the mild alkaline extractant used here.However, a major difference in the abundance of lignin and poly-saccharide pyrolysis products is found between the peat fractions:residues have very high values for polysaccharides, while extractshave higher lignin, phenol and aromatic contents. Except for thetopmost sample, the relatively high abundance of lignin pyrolysisproducts in the extracted fractionwas not found for the C3-guaiacols
(Lg13, Lg16, Lg17). The high polysaccharide content in the residues isprimarily due to levoglucosan, a pyrolysis product of cellulose(between48and60%TIC in residues, compared to6e20% inextracts).This indicates that the major part of cellulose (that is still present inthe peat OM) is intact and remains in the residues, while a relativelylarge part of lignin is fragmented and rendered extractable.
4.4.3.2. Xylose. Most hemicelluloses are soluble in alkaline solu-tions so that they will be partly extracted by traditional methods(Kögel-Knabner, 2002). The xylose marker Ps4 showed high valuesin the topmost sample in both extract (7% TIC) and residue (3.5%TIC), while the deeper samples all showed low values and nodifference between both peat fractions (1.5% TIC mean). This indi-cates that a large part of Ps4 is rapidly degraded after the plant dies,and that this rapidly degradable part is affected by extraction.
4.4.3.3. Non-lignin phenolic acids. Alkaline extractions can break theester bonds of phenolic acids, while ether bonds remain intact (Ishii,1997; Terrón et al., 1993; Hartley and Morrison, 1991; Kondo et al.,1989). Microbial degradation also more easily disrupts ester bondsof ferulic and p-coumaric acids than ether bonds (Kondo et al., 1991;Akin et al., 1996). The ratio of 4-vinylguaiacol to 4-vinylphenol isclearly higher in the residues than in the extracts (1.9 versus 1.1),except in the topmost sample where both extract and residue haveahighvalue. Thismay indicate that ferulic acid (ether-linked to lignin)remains in the residues and p-coumaric acid (ester-linked to lignin) ismoreeasilyextracted. Thehighvalues inboth fractionsof the topmostsample (not shown) indicate thatextractiondidnotbreakesterbonds,and that the difference between extracts and residues is caused bydecomposition or vegetation characteristics.
From comparison of abundances of LCC-derived pyrolysisproducts between (i) residues and extracts and (ii) the topmostsample and deeper samples, it is concluded that the differences inOM composition between the fractions mainly reflect the effect ofdecomposition.
4.4.4. SynthesisDuring the first stage of decay non-lignin phenolics from grasses,
such as ferulic and p-coumaric acids (Section 4.3) and non-lignifiedpolysaccharides (Section 4.4.1) are rapidly degraded. This stage isgenerally aerobic. It showed alkyl side-chain reduction for guaiacylpyrolysis products, while syringyl pyrolysis products were notaffected (Section 4.4.1). During subsequent anaerobic decompositionlignin moieties showed demethoxylation, oxygenation of alkyl side-chains and alkyl side-chain reduction. Cellulose is barely degradedor transformed under anaerobic conditions (Sections 4.4.1 and 4.4.2).Persistent aerobicdecay furtherdegrades theLCCofwhich the ‘lignin-phenolic acid-xylose’ part is reflected in the extracts (Section 4.4.1)while the cellulose part is reflected in the residues (Section 4.4.2) andreflects the originally lignified cellulose. This interpretation isconfirmed by the high abundance of lignin pyrolysis products in theextracts andof levoglucosan (cellulose) in the residues (Section4.4.4).
Interpretation of the results obtained from pyrolysates of plantmaterial and the different peat fractions should be tested on thehigh-resolution sampled peat record (bulk samples); this will bedone in a forthcoming study.
Acknowledgements
This work was partially supported by the projects CGL2010-20672 (Spanish Ministerio de Ciencia e Innovación) and10PXIB200182PR (Dirección Xeral de I þ D, Xunta de Galicia). WethankBarendvan Lagen and Eef Velthorst ofWageningenUniversityfor their assistancewith the pyrolysis; Xabier Pontevedra-Pombal ofthe University of Santiago de Compostela and Juan Carlos Nóvoa-
J. Schellekens et al. / Soil Biology & Biochemistry 53 (2012) 32e42 39

Author's personal copy
Muñoz of the University of Vigo for their assistance with thesampling; and Klaas Nierop of the University of Utrecht, AntonioMartínez-Cortizas of the University of Santiago de Compostela andtwo anonymous reviewers for useful comments on the manuscript.
Appendix A. Quantified pyrolysis products. Grouped accordingto origin and thereafter retention time. m/z: typical mass; M:molecular weight; RT/RTG: retention time relative to guaiacol;Ave. % TIC ¼ mean values in the bulk samples relative to the sumof all quantified pyrolysis products (n ¼ 51); S.D. ¼ standarddeviation. Al: aliphatic; Ps: polysaccharide; K: methylketone; Lg:lignin; N: N-compound; Ph: phenol; Ca: catechol; S: sterol; Ttp:triterpene; FA: fatty acid; PA: polyaromatic. * The marker ofgraminoids, 4-(2-propenoic acid methyl ester)guaiacol(Schellekens et al., 2011) is here named with its synonym ferulicacid methyl ester.
Code Name m/z M RT/RTG Ave.% TIC
S.D.
10 n-C10 alkane 57 þ 71 142 0.858 0.09 0.0311 n-C11 alkane 57 þ 71 156 1.054 0.15 0.0412 n-C12 alkane 57 þ 71 170 1.268 0.16 0.0613 n-C13 alkane 57 þ 71 184 1.419 0.18 0.0714 n-C14 alkane 57 þ 71 198 1.587 0.21 0.0815 n-C15 alkane 57 þ 71 212 1.746 0.18 0.0716 n-C16 alkane 57 þ 71 226 1.896 0.23 0.0917 n-C17 alkane 57 þ 71 240 2.038 0.26 0.1118 n-C18 alkane 57 þ 71 254 2.173 0.26 0.1019 n-C19 alkane 57 þ 71 268 2.301 0.39 0.1720 n-C20 alkane 57 þ 71 282 2.423 0.40 0.1621 n-C21 alkane 57 þ 71 296 2.540 0.58 0.2822 n-C22 alkane 57 þ 71 310 2.653 0.56 0.2323 n-C23 alkane 57 þ 71 324 2.759 0.70 0.3624 n-C24 alkane 57 þ 71 338 2.862 0.36 0.1525 n-C25 alkane 57 þ 71 352 2.961 0.47 0.1826 n-C26 alkane 57 þ 71 366 3.055 0.19 0.0727 n-C27 alkane 57 þ 71 380 3.147 0.21 0.0728 n-C28 alkane 57 þ 71 394 3.235 0.10 0.0429 n-C29 alkane 57 þ 71 408 3.321 0.22 0.1431 n-C31 alkane 57 þ 71 436 3.481 0.51 0.4533 n-C33 alkane 57 þ 71 464 3.640 0.39 0.43Al1 prist-1-ene 56 þ 57 266 2.082 0.44 0.12Al2 aliphatic compound 67 þ 81 2.277 0.03 0.02Al3 n-C18 alcohol 55 þ 57 270 2.512 0.06 0.02Al4 n-C20 alcohol 55 þ 57 298 2.738 0.15 0.04Al5 branched alkene 83 280 2.788 0.31 0.15Al6 n-C22 alcohol 55 þ 57 326 2.946 0.20 0.09Al7 n-C24 alcohol 55 þ 57 354 3.138 0.10 0.06Ps1 acetic acid 60 60 0.264 1.71 0.55Ps2 2-furaldehyde 95 þ 96 96 0.496 4.06 1.32Ps3 5-methyl-2-furaldehyde 109 þ 110 110 0.736 1.38 0.44Ps4 4-hydroxy-5,
6-dihydro-(2H)-pyran-2-one58 þ 114 114 0.807 1.78 0.48
Ps5 dianhydrorhamnose 113 þ 128 128 0.877 0.24 0.09Ps6 levoglucosenone 68 þ 98 126 1.016 2.35 1.12Ps7 1,4:3,6-dianhydro-
alpha-D-glucose57 þ 69 144 1.239 1.08 0.34
Ps8 5-hydroxymethyl-2-furancarboxaldehyde
97 þ 126 126 1.265 0.52 0.24
Ps9 1,4-dideoxy-D-glycero-hex-1-enopyranose-3-ulose
87 þ 144 144 1.431 1.57 0.23
Ps10 levogalactosan 60 þ 73 162 1.608 3.76 1.23Ps11 levomannosan 60 þ 73 162 1.739 2.95 1.23Ps12 sugar compound 101 þ 116 1.743 0.79 0.50Ps13 levoglucosan 60 þ 73 162 1.966 37.22 5.34Ps14 1,6-anhydro-
beta-D-glucofuranose73 þ 85 162 2.062 2.51 0.56
K19 n-C19 methylketone 58 þ 59 282 2.533 0.17 0.10K21 n-C21 methylketone 58 þ 59 310 2.818 0.11 0.05K23 n-C23 methylketone 58 þ 59 338 2.963 0.20 0.06K24 n-C24 methylketone 58 þ 59 352 3.058 0.09 0.02K25 n-C25 methylketone 58 þ 59 366 3.153 0.58 0.18K26 n-C26 methylketone 58 þ 59 380 3.241 0.11 0.04
(continued)
Code Name m/z M RT/RTG Ave.% TIC
S.D.
K27 n-C27 methylketone 58 þ 59 394 3.329 0.54 0.24K28 n-C28 methylketone 58 þ 59 408 3.412 0.05 0.03K29 n-C29 methylketone 58 þ 59 422 3.493 0.27 0.20K31 n-C31 methylketone 58 þ 59 450 3.655 0.11 0.11K33 n-C33 methylketone 58 þ 59 478 3.863 0.07 0.12Ar1 benzene 77 þ 78 78 0.293 0.40 0.09Ar2 toluene 91 þ 92 92 0.419 1.18 0.28Ar3 styrene 78 þ 104 104 0.626 0.17 0.04Ar4 benzoic acid 105 þ 122 122 1.191 0.10 0.04Lg1 4-vinylphenol 91 þ 120 120 1.256 3.08 0.99Lg2 4-(prop-2-enyl)phenol 133 þ 134 134 1.316 0.02 0.01Lg3 4-(prop-1-enyl)phenol, cis 133 þ 134 134 1.381 0.02 0.01Lg4 4-(prop-1-enyl)phenol, trans 133 þ 134 134 1.469 0.09 0.02Lg5 4-formylphenol 121 þ 122 122 1.527 0.15 0.10Lg6 4-acetylphenol 121 þ 136 136 1.650 0.18 0.08Lg7 4-hydroxybenzoic
acid methyl ester121 þ 152 152 1.662 0.01 0.01
Lg8 4-hydroxybenzoic acid 121 þ 138 138 1.858 0.29 0.19Lg9 guaiacol 109 þ 124 124 1.000 1.22 0.34Lg10 4-methylguaiacol 123 þ 138 138 1.201 1.19 0.32Lg11 4-ethylguaiacol 137 þ 152 152 1.356 0.46 0.19Lg12 4-vinylguaiacol 135 þ 150 150 1.418 3.52 0.98Lg13 4-(prop-1-enyl)guaiacol 77 þ 164 164 1.491 0.07 0.02Lg14 4-propylguaiacol 137 þ 166 166 1.510 0.04 0.01Lg15 4-formylguaiacol 151 þ 152 152 1.549 0.67 0.16Lg16 4-(prop-2-enyl)guaiacol, cis 77 þ 164 164 1.576 0.05 0.01Lg17 4-(prop-2-enyl)guaiacol, trans 77 þ 164 164 1.644 0.28 0.09Lg18 4-acetylguaiacol 151 þ 166 166 1.692 0.95 0.20Lg19 guaiacol derivative (C3H3) 147 þ 162 1.693 0.09 0.02Lg20 guaiacol derivative (C3H3) 147 þ 162 1.702 0.06 0.01Lg21 vanillic acid methyl ester 151 þ 182 182 1.740 0.06 0.02Lg22 4-(propan-2-one)guaiacol 137 þ 180 180 1.758 0.20 0.04Lg23 4-(propan-1-one)guaiacol 151 þ 180 180 1.841 0.29 0.07Lg24 vanillic acid 153 þ 168 168 1.873 0.64 0.21Lg25 ferulic acid methyl ester* 177 þ 208 208 2.194 0.02 0.01Lg27 syringol 139 þ 154 154 1.468 0.39 0.14Lg28 4-methylsyringol 153 þ 168 168 1.630 0.49 0.20Lg29 4-ethylsyringol 167 þ 182 182 1.755 0.11 0.05Lg30 4-vinylsyringol 165 þ 180 180 1.813 0.74 0.30Lg31 4-(prop-1-enyl)syringol 91 þ 194 194 1.869 0.08 0.03Lg32 4-propylsyringol 167 þ 196 196 1.882 0.02 0.01Lg33 4-(prop-2-enyl)syringol, cis 91 þ 194 194 1.941 0.07 0.03Lg34 4-formylsyringol 181 þ 182 182 1.948 0.17 0.07Lg35 syringyl derivative (C3H3) 131 þ 192 1.989 0.12 0.05Lg36 syringyl derivative (C3H3) 131 þ 192 1.999 0.06 0.03Lg37 4-(prop-2-enyl)syringol, trans 91 þ 194 194 2.012 0.43 0.19Lg38 4-acetylsyringol 181 þ 196 196 2.053 0.48 0.14Lg39 4-(propan-2-one)syringol 167 þ 210 210 2.099 0.33 0.14Lg40 syringic acid methyl ester 181 þ 212 212 2.100 0.01 0.00Lg41 4-(propan-3-one)syringol 181 þ 210 210 2.175 0.13 0.06Lg42 syringic acid 183 þ 198 198 2.218 0.11 0.06Lg43 4-(propan-3-ol)syringol 168 þ 212 212 2.249 0.01 0.00N1 pyridine 52 þ 79 79 0.383 0.50 0.10N2 benzonitrile 76 þ 103 103 0.772 0.01 0.00N3 4-hydroxy-
benzeneacetonitrile78 þ 133 133 1.554 0.04 0.02
N4 diketodipyrrole 93 þ 186 186 2.024 0.11 0.05Ph1 phenol 66 þ 94 94 0.805 3.17 1.53Ph2 4-methylphenol 107 þ 108 108 0.989 1.84 0.60Ph3 4-ethylphenol 107 þ 122 122 1.159 0.36 0.16Ph4 4-isopropenylphenol 119 þ 134 134 1.404 0.02 0.01Ph5 3-methoxy-
5-methylphenol107 þ 138 138 1.431 0.08 0.03
Ca1 catechol 64 þ 110 110 1.253 1.33 0.66Ca2 4-methylcatechol 78 þ 124 124 1.347 0.23 0.18Ca3 5-methyl
3-methoxycatechol139 þ 154 154 1.509 0.15 0.06
Ca4 4-ethylcatechol 123 þ 138 138 1.564 0.11 0.07S1 sterol 1 191 þ 231 3.384 0.05 0.02S2 gamma-tocopherol 151 þ 416 416 3.449 0.11 0.07S3 sterol 2 189 þ 218 3.533 0.02 0.01Ttp squalene 69 þ 81 410 3.256 0.27 0.35F16 C16 fatty acid 60 þ 73 256 2.370 0.22 0.12PA1 naphthalene 128 128 1.196 0.04 0.01PA2 x-methylphenanthrene 191 þ 192 192 2.321 0.00 0.00
J. Schellekens et al. / Soil Biology & Biochemistry 53 (2012) 32e4240

Author's personal copy
References
Akin, D.E., Morrison, W.H., Rigsby, L.L., Gamble, G.R., Sethuraman, A.,Eriksson, K.E.L., 1996. Biological delignification of plant components by thewhite rot fungi Ceriporiopsis subvermispora and Cyathus stercoreus. Animal FeedScience and Technology 63, 305e321.
Benner, R., MacCubbin, A.E., Hodson, R.E., 1984. Anaerobic biodegradation of thelignin and polysaccharide components of lignocellulose and synthetic lignin bysediment microflora. Applied and Environmental Microbiology 47, 998e1004.
Boerjan, W., Ralph, J., Baucher, M., 2003. Lignin biosynthesis. Annual Review ofPlant Biology 54, 519e546.
Boon, J.J., Wetzel, R.G., Godshalk, G.L., 1982. Pyrolysis mass spectrometry of someScirpus species and their decomposition products. Limnology and Oceanog-raphy 27, 839e848.
Bourdon, S., Laggoun-Défarge, F., Disnar, J., Maman, O., Guillet, B., Derenne, S.,Largeau, C., 2000. Organic matter sources and early diagenetic degradation ina tropical peatymarsh (Tritrivakely,Madagascar). Implications for environmentalreconstruction during the Sub-Atlantic. Organic Geochemistry 31, 421e438.
Buranov, A.U., Mazza, G., 2008. Lignin in straw of herbaceous crops. Industrial Cropsand Products 28, 237e259.
Buurman, P., Nierop, K.G.J., Pontevedra-Pombal, X., Martínez-Cortizas, A., 2006.Molecular chemistry by pyrolysiseGC/MS of selected samples of the PenidoVello peat deposit, NW Spain. In: Martini, I.P., Martínez-Cortizas, A.,Chesworth, W. (Eds.), Peatlands. Evolution and Records of Environmental andClimate Changes. Elsevier, Amsterdam, pp. 217e240.
Clymo, R.S., Turunen, J., Tolonen, K., 1998. Carbon accumulation in peatland. Oikos81, 368e388.
Donaldson, L.A., 2001. Lignification and lignin topochemistry e an ultrastructuralview. Phytochemistry 57, 859e873.
Eglinton, G., Hamilton, R.J., 1967. Leaf epicuticular waxes. Science 156, 1322e1325.Filley, T.R., Nierop, K.G.J., Wang, Y., 2006. The contribution of polyhydroxyl aromatic
compounds to tetramethylammonium hydroxide lignin-based proxies. OrganicGeochemistry 37, 711e727.
Fraga, I., Romero-Pedreira, D., Sahuquillo, E., 2005. Patterns of vegetation in relationto environmental conditions in Northwestern Spanish mires. IMCG Mires andPeatlands Field Symposium, Tierra del Fuego 2005, Argentina, pp. 35e36.
Fraga, I., Romero-Pedreira, D., Souto, M., Castro, D., Sahuquillo, E., 2008. Assessingthe impact of wind farms on the plant diversity of blanket bogs in the Xistralmountains (NW Spain). Mires and Peat 4, 1e10.
Grabber, J.H., Quideau, S., Ralph, J., 1996. p-Coumaroylated syringyl units in maizelignin; implications for b-ether cleavage by thioacidolysis. Phytochemistry 43,1189e1194.
Hartley, R.D., Morrison, W.H., 1991. Monomeric and dimeric phenolic acids releasedfrom cell walls of grasses by sequential treatment with sodium hydroxide.Journal of the Science of Food and Agriculture 55, 365.
Hatfield, R.D., 2009. Comparing corn types for differences in cell wall characteristicsand p-coumaroylation of lignin. Journal of Agricultural and Food Chemistry 57,4243e4249.
Hedges, J.I., Mann, D.C., 1979. The characterization of plant tissues by their ligninoxidation products. Geochimica et Cosmochimica Acta 43, 1803e1807.
Huang, W., Stankiewicz, B.A., Eglinton, G., Snape, C.E., Evans, B., Latter, P.M.,Ineson, P., 1998. Monitoring biomacromolecular degradation of Calluna vulgarisin a 23 year field experiment using solid state 13C-NMR and pyrolysis-GC/MS.Soil Biology and Biochemistry 30, 1517e1528.
Ishii, T., 1997. Structure and functions of feruloyated polysaccharides. Plant Science127, 111e127.
Karunen, P., Kalviainen, E., 1988. Lipids and hydroxycinnamic acids in cell walls ofEriophorum vaginatum. Phytochemistry 27, 2045e2048.
Kögel-Knabner, I., 2002. The macromolecular organic composition of plant andmicrobial residues as inputs to soil organic matter. Soil Biology and Biochem-istry 34, 139e162.
Kondo, T., Mizuno, K., Kato, T., 1989. Cell wall-bound p-coumaric and ferulic acids inItalian ryegrass. Canadian Journal of Botany 71, 495e499.
Kondo, T., Ohshita, T., Kyuma, T., 1991. Ester- and ether-linked phenolic acids inorchardgrass (Dactylis glomerata L.) and their digestion from cell walls when fedto sheep. Canadian Journal of Botany 71, 1179e1182.
Kuder, T., Kruge, M.A., 1998. Preservation of biomolecules in sub-fossil plants fromraised peat bogs e a potential paleoenvironmental proxy. Organic Geochem-istry 29, 1355e1368.
Kuder, T., Kruge, M.A., Shearer, J.C., Miller, S.L., 1998. Environmental and botanicalcontrols on peatification e a comparative study of two New Zealand restiadbogs using Py-GC/MS, petrography and fungal analysis. International Journal ofCoal Geology 37, 3e27.
Lam, T.B.T., Iiyama, K., Stone, B.A., 1992. Changes in phenolic acids from internodewalls of wheat and phalaris during maturation. Phytochemistry 31, 2655e2658.
Lewis, N.G., Yamamoto, E., 1990. Lignin: occurrence, biogenesis and biodegradation.Annual Review of Plant Physiology and Plant Molecular Biology 41, 455e496.
Lu, F., Ralph, J., 2010. Lignin. Cereal Straw as a Resource for Sustainable Biomaterialsand Biofuels, pp. 169e207, (Chapter 6). In: Chemistry, Extractives, Lignins,Hemicelluloses and Cellulose.
Machinet, G.E., Bertrand, I., Barrière, Y., Chabbert, B., Recous, S., 2011. Impact of plantcell wall network on biodegradation in soil: role of lignin composition andphenolic acids in roots from 16 maize genotypes. Soil Biology and Biochemistry43, 1544e1552.
Martín, F., Saiz-Jimenez, C., González-Vila, F.J., 1979. Pyrolysis e gaschromatography-mass spectrometry of lignins. Holzforschung 33, 210e212.
Martínez, A.T., Camarero, S., Gutiérrez, A., Bocchini, P., Galletti, G.C., 2001. Studies inwheat lignin degradation by Pleurotus species using analytical pyrolysis. Journalof Analytical and Applied Pyrolysis 58e59, 401e411.
Martínez-Cortizas, A., Pontevedra-Pombal, X., Nóvoa-Muñoz, J.C., García-Rodeja, E.,1997. Four thousand years of atmospheric Pb, Cd and Zn deposition recorded bythe ombrotrophic peat bog of Penido Vello (Northwestern Spain). Water, Airand Soil Pollution 100, 387e403.
Martínez-Cortizas, A., García-Rodeja, E., Pontevedra-Pombal, X., Nóvoa-Muñoz, J.C.,Weiss, D., Cheburkin, A., 2002. Atmospheric Pb deposition in Spain during thelast 4600 years recorded by two ombrotrophic peat bogs and implications forthe use of peat as archive. Science of the Total Environment 292, 33e44.
McClymont, E.L., Bingham, E.M., Nott, C.J., Chambers, F.M., Pancost, R.D.,Evershed, R.P., 2011. Pyrolysis GC-MS as a rapid screening tool for determinationof peat-forming plant composition in cores from ombrotrophic peat. OrganicGeochemistry 42, 1420e1435.
Monschein, M., Iglesias Neira, J., Kunert, O., Bucar, F., 2010. Phytochemistry ofheather (Calluna vulgaris (L.) Hull) and its altitudinal alteration. PhytochemistryReviews 9, 205e215.
Nierop, K.G.J., 2001. Temporal and vertical organic matter differentiation alonga vegetation succession as revealed by pyrolysis and thermally assistedhydrolysis and methylation. Journal of Analytical and Applied Pyrolysis 61,111e132.
Nierop, K.G.J., van Lagen, B., Buurman, P., 2001. Composition of plant tissues and soilorganic matter in the first stages of a vegetation succession. Geoderma 10, 1e24.
Pontevedra-Pombal, X., 2002. Mountain Mires of Galicia. Genesis, Properties and itsUse as Geochemical Environmental Records. Ph.D. thesis. University of Santiago,Spain, pp. 215 (in Spanish).
Pouwels, A.D., Tom, A., Eijkel, G.B., Boon, J.J., 1987. Characterisation of beech woodand its holocellulose and xylan fractions by pyrolysis-gas chromatography-mass spectrometry. Journal of Analytical and xApplied Pyrolysis 11, 417e436.
Pouwels, A.D., Eijkel, G.B., Boon, J.J., 1989. Curie-point pyrolysis high-resolution gaschromatographyemass spectrometry of microcrystalline cellulose. Journal ofAnalytical and Applied Pyrolysis 14, 237e280.
Ralph, J., Hatfield, R.D., 1991. Pyrolysis-GCeMS characterization of forage materials.Journal of Agricultural and Food Chemistry 39, 1426e1437.
Ralph, J., Hatfield, R.D., Quideau, S., Helm, R.F., Grabber, J.H., Jung, H.G., 1994.Pathway of p-coumaric acid incorporation into maize lignin as revealed byNMR. Journal of the American Chemical Society 116, 9448e9456.
Ralph, J., Grabber, J.H., Hatfield, R.D., 1995. Lignin-ferulate cross-links in grasses:active incorporation of ferulate polysaccharide esters into ryegrass lignins.Carbohydrate Research 275, 167e178.
Sarkanen, K.V., Ludwig, C.H., 1971. Lignins: Occurrence, Formation, Structure andReactions. Wiley-Interscience, New York.
Schellekens, J., Buurman, P., 2011. n-Alkane distributions as palaeoclimatic proxiesin ombrotrophic peat: the role of decomposition and dominant vegetation.Geoderma 164, 112e121.
Schellekens, J., Buurman, P., Pontevedra-Pombal, X., 2009. Selecting parameters forthe environmental interpretation of peat molecular chemistry e a pyrolysis-GC/MS study. Organic Geochemistry 40, 678e691.
Schellekens, J., Buurman, P., Fraga, I., Martínez-Cortizas, A., 2011. Holocene hydro-logic changes inferred from molecular vegetation markers in peat, Penido Vello(Galicia, Spain). Palaeogeography, Palaeoclimatology, Palaeoecology 299,56e69.
Shimada, M., Fukuzuka, T., Higuchi, T., 1971. Ester linkages of p-coumaric acid inbamboo and grass lignins. Tappi Journal 54, 72e77.
Smith, B.G., Harris, P.J., 1999. The polysaccharide composition of Poales cell walls:poaceae cellwalls are not unique. Biochemical Systematics and Ecology 27, 33e53.
Stout, S.A., Boon, J.J., Spackman, W., 1988. Molecular aspects of the peatification andearly coalification of angiosperm and gymnosperm woods. Geochimica etCosmochimica Acta 52, 405e414.
Sun, X.F., Jing, Z., Fawler, P., Wu, T., Rajaratnam, M., 2011. Structural characterizationand isolation of lignin and hemicelluloses from barley straw. Industrial Cropsand Products 33, 588e598.
Terrón, M.C., Fidalgo, M.L., González, A.E., Almendros, G., Galletti, G.C., 1993.Pyrolysis-gas chromatography/mass spectrometry of wheat straw fractionsobtained by alkaline treatments used in pulping processes. Journal of Analyticaland Applied Pyrolysis 27, 57e71.
Thevenot, M., Dignac, M.F., Rumpel, C., 2010. Fate of lignins in soils: a review. SoilBiology and Biochemistry 42, 1200e1211.
van Bergen, P.F., Bland, H.A., Horton, M.C., Evershed, R.P., 1997. Chemical andmorphological changes in archaeological seeds and fruits during preservationby desiccation. Geochimica et Cosmochimica Acta 61, 1919e1930.
van der Hage, E.R.E., Mulder, M.M., Boon, J.J., 1993. Structural characterization oflignin polymers by temperature-resolved in-source pyrolysis-mass spectrom-etry and Curie-point pyrolysis-gas chromatography/mass spectrometry. Journalof Analytical and Applied Pyrolysis 25, 149e183.
van der Heijden, E., Boon, J.J., 1994. A combined pyrolysis mass spectrometric andlight microscopic study of peatified Calluna wood isolated from raised bog peatdeposits. Organic Geochemistry 22, 903e919.
van der Heijden, E., Boon, J.J., Scheijen, M.A., 1990. Chemical characterisation of peatand peatified plant tissues by temperature resolved pyrolysis mass spectrom-etry and high temperature gas chromatography mass spectrometry. In: Sopo, R.(Ed.), Peat 90; International Conference of Finnish Peat Industries, pp. 148e163.
J. Schellekens et al. / Soil Biology & Biochemistry 53 (2012) 32e42 41

Author's personal copy
Watanabe, T.J., Ohnishi, J., Yamasaki, Y., Kaizu, S., Koshijima, T., 1989. Binding-siteanalysis of the ether linkage between lignin and hemicelluloses in lignin-carbohydrate complexes by DDQ oxidation. Agricultural and Biological Chem-istry 53, 2233e2252.
Wende, G., Fry, S.T., 1996. 2-O-b-D-xylopyranosyl-(5-O-Feruloyl)-L-arabinose,a widespread component of grass cell walls. Phytochemistry 44,1019e1030.
Williams, C.J., Yavitt, J.B., 2003. Botanical composition of peat and degree of peatdecomposition in three temperate peatlands. Ecoscience 10, 85e95.
Yeloff, D., Mauquoy, D., 2006. The influence of vegetation composition on peathumification: implications for palaeoclimatic studies. Boreas 35, 662e673.
Zaccone, C., Said-Pullicino, D., Gigliotti, G., Miano, T.M., 2008. Diagenetic trends inthe phenolic constituents of Sphagnum-dominated peat and its correspondinghumic acid fraction. Organic Geochemistry 39, 830e838.
J. Schellekens et al. / Soil Biology & Biochemistry 53 (2012) 32e4242