Influence of monovalent cations on yeast cytoplasmic and vacuolar pH
15
. 14: 501–515 (1998) Influence of Monovalent Cations on Yeast Cytoplasmic and Vacuolar pH MARTHA CALAHORRA*, GLORIA A. MARTI u NEZ, ARTURO HERNA u NDEZ-CRUZ AND ANTONIO PEN x A Department of Microbiology, Instituto de Fisiologı ´a Celular, Universidad Nacional Auto ´noma de Me ´xico, Apartado 70–600, 04510 Me ´xico D.F., Me ´xico Received 28 January 1997; accepted 17 October 1997 The effects of monovalent cations on the internal pH of yeast were studied. Our former procedure was modified, inducing maximal alkalinization of the cells with 100 m-NH 4 OH instead of Tris base. The pH values were lower than reported before (Pen ˜a et al., J. Bacteriol. 1995 177, 1017–1022). With glucose as substrate, the internal cytoplasmic pH reached higher values when incubating at an external pH of 6·0, as compared to pH 4·0. Monovalent cations added approximately 5 min after glucose produced a further increase in the internal pH, which was higher at a previous incubation pH of 4·0 than that observed at pH 6·0. The selectivity of the changes followed a similar order to that of the transport system for monovalent cations. When incubating cells with glucose for more than 30 min, the initial changes of the internal pH appeared to be regulated by the cell. However, under the fluorescence microscope, it was observed that pyranine, which was confined to the cytoplasm during the first 15 min, was progressively concentrated in the vacuole. By studying the fluorescence changes of cells electroporated and then incubated with glucose or glucose plus potassium, we could follow the internal pH of this organelle, obtaining values within the range reported by other authors. Also, in cells preincubated with glucose for 60 min, and electroporated afterwards, the fluorescence of pyranine, which only entered the cytoplasm, allowed us to measure the pH of this compartment, showing that it was more alkaline than the vacuole. Moreover, the cytoplasmic pH increased upon addition of glucose or potassium. The vacuolar pH, on the other hand, increased upon addition of potassium after glucose, but decreased upon addition of glucose. In addition, incubation of the cells with glucose with or without pyranine produced vesiculation of the vacuole. ? 1998 John Wiley & Sons, Ltd. Yeast 14: 501–515, 1998. — Saccharomyces cerevisiae; bakers’ yeast; pH homeostasis; cytoplasmic pH; vacuolar pH INTRODUCTION Yeast cells have a plasma membrane H + -ATPase acting as a proton pump involved in generating a membrane electrochemical potential difference, negative and alkaline inside the cell (Pen ˜a et al., 1969; Pen ˜ a, 1975). This H + -ATPase and its general role in the transport systems of yeast cells have been demonstrated in many other fungi and plants (Goffeau and Slayman, 1981). For both mono- valent and divalent cations, their transport responds to selectivity patterns, which result in different rates of uptake and accumulation (Armstrong and Rothstein, 1964; Niewenhuis et al., 1981; Roomans et al., 1979), and it should be expected that they produce different rates of stimu- lation of proton extrusion, because the transport system for monovalent cations is mediated by a uniporter carrier system, which in Saccharomyces cerevisiae appears to be duplicated (Ramos et al., *Correspondence to: M. Calahorra, Department of Microbiol- ogy, Instituto de Fisiologı ´a Celular, Universidad Nacional Auto ´noma de Me ´xico, Apartado 70–600, 04510 Me ´xico D.F., Me ´xico. Tel: (+52) 5 622 5633; fax: (+52) 5 622 5630; e-mail: [email protected]fisiol.unam.mx Contract/grant sponsor: Direccio ´ n General de Asuntos del Personal Acade ´mico, Universidad Nacional Auto ´ noma de Me ´xico. Contract/grant number: IN-202193 and IN-206395. Contract/grant sponsor: Consejo Nacional de Ciencia y Tecno- logı ´a de Me ´xico. Contract/grant number: 3188N-N9307. CCC 0749–503X/98/060501–15 $17.50 ? 1998 John Wiley & Sons, Ltd.
Transcript of Influence of monovalent cations on yeast cytoplasmic and vacuolar pH
. 14: 501–515 (1998)
Influence of Monovalent Cations on Yeast Cytoplasmicand Vacuolar pH
MARTHA CALAHORRA*, GLORIA A. MARTIuNEZ, ARTURO HERNAuNDEZ-CRUZ AND
ANTONIO PENxADepartment of Microbiology, Instituto de Fisiologıa Celular, Universidad Nacional Autonoma de Mexico,Apartado 70–600, 04510 Mexico D.F., Mexico
Received 28 January 1997; accepted 17 October 1997
The effects of monovalent cations on the internal pH of yeast were studied. Our former procedure was modified,inducing maximal alkalinization of the cells with 100 m-NH4OH instead of Tris base. The pH values were lowerthan reported before (Pena et al., J. Bacteriol. 1995 177, 1017–1022). With glucose as substrate, the internalcytoplasmic pH reached higher values when incubating at an external pH of 6·0, as compared to pH 4·0. Monovalentcations added approximately 5 min after glucose produced a further increase in the internal pH, which was higherat a previous incubation pH of 4·0 than that observed at pH 6·0. The selectivity of the changes followed a similarorder to that of the transport system for monovalent cations.When incubating cells with glucose for more than 30 min, the initial changes of the internal pH appeared to be
regulated by the cell. However, under the fluorescence microscope, it was observed that pyranine, which wasconfined to the cytoplasm during the first 15 min, was progressively concentrated in the vacuole. By studying thefluorescence changes of cells electroporated and then incubated with glucose or glucose plus potassium, we couldfollow the internal pH of this organelle, obtaining values within the range reported by other authors. Also, in cellspreincubated with glucose for 60 min, and electroporated afterwards, the fluorescence of pyranine, which onlyentered the cytoplasm, allowed us to measure the pH of this compartment, showing that it was more alkaline thanthe vacuole. Moreover, the cytoplasmic pH increased upon addition of glucose or potassium. The vacuolar pH, onthe other hand, increased upon addition of potassium after glucose, but decreased upon addition of glucose. Inaddition, incubation of the cells with glucose with or without pyranine produced vesiculation of the vacuole.? 1998John Wiley & Sons, Ltd.
Yeast 14: 501–515, 1998.
— Saccharomyces cerevisiae; bakers’ yeast; pH homeostasis; cytoplasmic pH; vacuolar pH
INTRODUCTION
Yeast cells have a plasma membrane H+-ATPaseacting as a proton pump involved in generating amembrane electrochemical potential difference,
negative and alkaline inside the cell (Pena et al.,1969; Pena, 1975). This H+-ATPase and its generalrole in the transport systems of yeast cells havebeen demonstrated in many other fungi and plants
(Goffeau and Slayman, 1981). For both mono-valent and divalent cations, their transport*Correspondence to: M. Calahorra, Department of Microbiol-Contract/grant number: IN-202193 and IN-206395.Contract/grant sponsor: Consejo Nacional de Ciencia y Tecno-logıa de Mexico.Contract/grant number: 3188N-N9307.
CCC 0749–503X/98/060501–15 $17.50? 1998 John Wiley & Sons, Ltd.
ogy, Instituto de Fisiologıa Celular, Universidad NacionalAutonoma de Mexico, Apartado 70–600, 04510 Mexico D.F.,Mexico. Tel: (+52) 5 622 5633; fax: (+52) 5 622 5630; e-mail:[email protected]/grant sponsor: Direccion General de Asuntos delPersonal Academico, Universidad Nacional Autonoma deMexico.
responds to selectivity patterns, which resultin different rates of uptake and accumulation(Armstrong and Rothstein, 1964; Niewenhuiset al., 1981; Roomans et al., 1979), and it should beexpected that they produce different rates of stimu-lation of proton extrusion, because the transportsystem for monovalent cations is mediated by auniporter carrier system, which in Saccharomycescerevisiae appears to be duplicated (Ramos et al.,

1994; Rodrıguez-Navarro and Ramos, 1984; Pena,1975), driven by the membrane potential generatedby the H+-ATPase.The idea that the internal pH of yeast is constant
was modified long ago (Conway and Downey,1950; Pena et al., 1972; Pena, 1975), and has
on ice for use the same day, although some resultswere found to be unaffected by at least 1 day’sstorage of the suspension at 4)C.
ElectroporationElectroporation was performed as previously
pyranine were placed in a cell with a 0·4 mm gap,
chloride salt, in a final volume of 2·0 ml. Other
502 . .
been confirmed recently (Cimprich et al., 1995;Haworth and Fliegel, 1993; Pena et al., 1995).Some authors have also considered ATPase as oneof the regulators of the internal pH of the cell(Haworth and Fliegel, 1993), but this matter hasbeen questioned (Sanders and Slayman, 1982).Recent methods allow measurement of the cyto-plasmic pH of the yeast cell, exclusive of thevacuole (Haworth and Fliegel, 1993; Pena et al.,1995), and indicate that several factors producerather large changes of the internal pH of the cell,some of them by stimulating the pumping ofprotons by the membrane H+-ATPase. Two ofthese factors are the transport of potassium ionsand the high values of the external pH, whichfavor the pumping of protons toward the outsideof the cell (Pena et al., 1995).Since the transport of monovalent cations is
indirectly linked to that of H+, through the H+-ATPase of the plasma membrane and the electro-chemical membrane potential difference itgenerates (Pena, 1975), it is to be expected thatsuch cations will produce changes of the internalpH of the cells during transport. This study wasstarted in an attempt to define the changes pro-duced by the addition of different cations to yeastcells. We took advantage of the methods that havebeen devised to measure the internal pH ofthe vacuole of yeast cells (Legerton et al., 1983;Preston et al., 1989; Pringle et al., 1989); it may bepossible to define the role of this organelle in theregulation of the cytoplasmic pH of the cell.
MATERIALS AND METHODS
Strain and culture conditionsCells from an isolated colony of commercial
yeast (La Azteca, SA) were grown in 500 ml of themedium described by De Kloet et al. (1961), or in
YPD medium (2% glucose, 1% yeast extract, 1% bactopeptone) for 24 h at 30)C, collected by cen-adjusted to pH 6·0 with triethanolamine (TEA), or
trifugation, washed with distilled water by cen-trifugation, resuspended in 250 ml of distilledwater, and shaken for 12 to 14 h at 30)C. The cellswere collected and washed again, resuspended inwater at a ratio of 0·5 g of yeast per ml, and kept
? 1998 John Wiley & Sons, Ltd.
reported (Pena et al., 1995), using a BioRad GenePulser, with the pulse controller attachment. Thecell suspension (0·7 ml) and 20 ìl of 100 m-
and one pulse of 1500 V, 25 ìF and 200 Ù wasapplied, with a duration around 3·0 ms. Then thecells were centrifuged and washed three times withwater by centrifugation in a Beckman Microfugefor 10 s, resuspended in the original ratio of 0·5 gper ml of water, and used as described for theindividual experiments.
Fluorescence measurementsFor the fluorescence experiments, 25 mg of cells
were incubated in 10 m of the indicated buffer,with or without the addition of 10 m-glucose,and/or usually 10 m of the monovalent cation
substances were added in several experiments asindicated. The fluorescence changes of pyraninewere followed at 460–520 nm, with a slit width of4 nm, in a DMX-1000 spectrofluorometer with acell compartment thermostated at 30)C and amagnetic stirrer, connected to an acquisition sys-tem (SLM Instruments; Urbana, IL, USA). ThepH values were calculated as described before, buta modification was introduced: instead of Trisbase, 100 m-NH4OH (final concentration) wasadded to attain the maximum fluorescence values.100 m-propionic acid was added as before toachieve the minimum fluorescence. Correctionswere applied for the fluorescence persisting afterthe addition of propionic acid and for that of asmall amount of pyranine remaining or leaking outof the cells after washing, as described before(Pena et al., 1995). This same procedure was usedto calculate the internal pH of the vacuole afterlong (40 min) incubation times.
External pH measurementsChanges in the pH of the incubation medium of
the cells were followed by means of a pH meterand an attached recorder. Cells were incubated in3 m-2-[N-morpholino]ethanesulfonic acid (MES)
3 m-tartaric acid adjusted to pH 4·0 with TEA.
. 14: 501–515 (1998)

Cells (125 mg wet weight) were added in a finalvolume of 10 ml. To follow the effects of substrateor monovalent cations, glucose to 10 m and/ormonovalent cations as the chloride salt to 10 mwere added where indicated. Calibration curveswere obtained by the addition of known amounts
were centrifuged and washed once with the samebuffer without the fixatives; postfixation wascarried out with 1% osmium tetroxide in 0·05 -cacodylate buffer, pH 7·2.The cells were dehydrated by successive 30-min
incubations with two changes of 30% ethanol, and
503
of HCl or KCl to the incubation mixture.
Microscopic observationsFluorescence photographs of the cells were
obtained by using a Nikon Diaphot microscope,with a UV-F 100X glycerol immersion, or a 40Xnormal objective and 10X ocular lenses,
with an epifluorescence accessory and a camera(tartrate-TEA), or 100 m-MES adjusted topH 6·0 with TEA (MES-TEA), or TEA adjusted
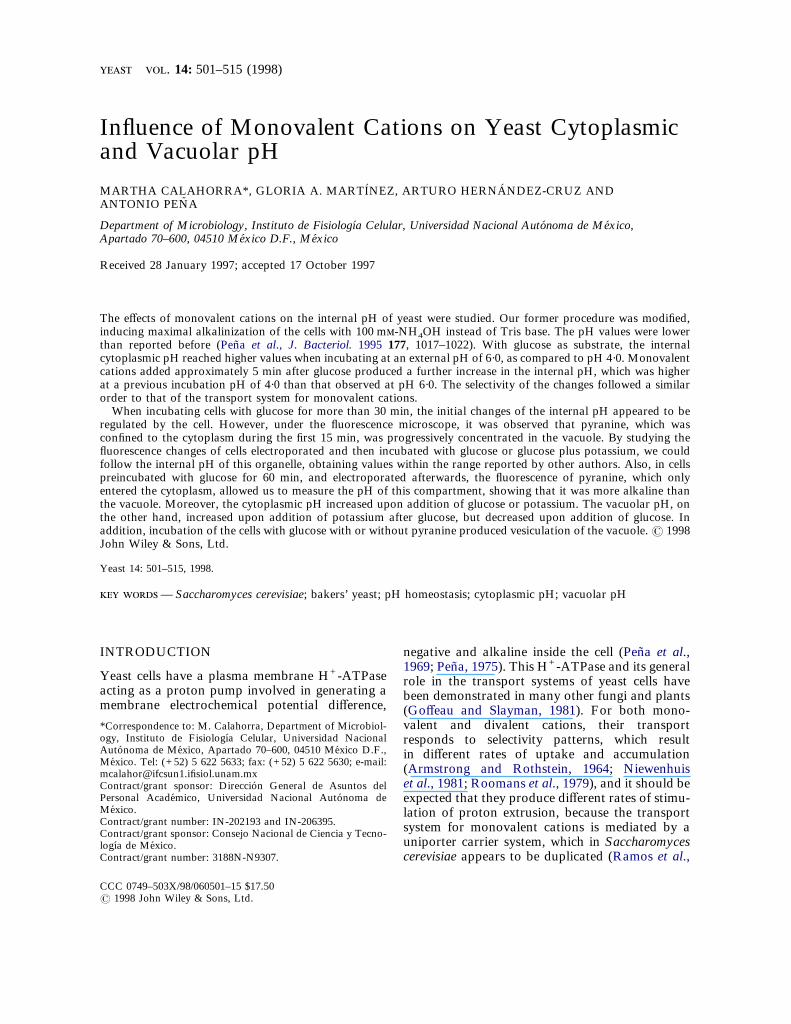
in the presence or absence of KCl (K ) are shownin Figure 1. As indicated, either no substrate,10 m-glucose or glucose plus 10 m-KCl were
attached.Observations of the fluorescence and morpho-
logical changes of a single cell were carried out byattaching the cells first to a cover glass coated withCell-Track (Becton Dickinson, Bedford, MA),placed in the bottom of a perfusion chamber filledwith 10 m-MES adjusted to pH 6·0 with TEA.After the cells attached to the slide, they weresuperfused with 10 m-MES–TEA buffer, andthen with the same buffer containing 10 m-glucose. For epi-illumination, light from a mercurylamp was directed to the cells through an 485–505 nm excitation filter (XF23, Omega Optical,Brattleboro, VT). Fluorescence images were ob-tained with a 16-bit cooled CCD digital camera(MCD-1000, SpectraSource Inst., CA), attached tothe side port of the microscope. An electronicshutter (Uniblitz, Vincent Associates, Rochester,NY) was used to illuminate the cells only duringthe period required for image collection (0·2–2 s),to prevent photobleaching. Camera exposure,shutter operation and image digitalization werecontrolled with SpectraSource’s HPC-1 softwarerunning on a 486/66 MHz PC/AT computer, whichstored the images in rewritable optic disks forfurther analysis and reproduction with dedicatedimage processing software (Image-Pro Plus).
Electron microscopyFor electron micrographs, sections of cell sus-
pensions were obtained as follows: the cells werefixed using the medium described by Karnowski(1965), consisting of 2% glutaraldehyde, 2% for-
maldehyde in cacodylate buffer, 0·05 , pH 7·2. Usually, 200 ìl of the mixture described for Figure1, containing 50 mg of yeast cells and incubated at30)C, were mixed with 2·0 ml of the fixing buffer,and left to stand for 4–5 days. Afterwards, the cells? 1998 John Wiley & Sons, Ltd.
two changes of absolute ethanol. They were theninfiltrated by placing them in gelatin capsules withLR White resin (London Resin Co., Berkshire,UK) for 24 h at 60)C. Sections of approximately800 A were obtained and stained on a glassexcavated plate with uranyl acetate for 30 min,then washed with water and incubated in leadcitrate for 10 min in the presence of NaOH pellets.Then the sections were washed with water andobserved under the electron microscope.
BuffersThe buffers used for the different pH values
were prepared as 100 m solutions of tartaricacid adjusted to pH 4·0 or 5·0 with TEA
to pH 7·0 with MES (TEA-MES), or Trishydroxymethylamino-methane (Tris) adjusted topH 8·0 with HCl.
RESULTS
The values obtained for the internal pH of the cellsafter incubation at different values of external pH,
+
added. The values shown were calculated from thefluorescence values obtained after an incubationtime of 150 s. Without a substrate, and at high pHvalues, the internal pH showed a small increase,due probably to the pumping of protons by theutilization of endogenous substrates. In the pres-ence of glucose alone, it has been shown that yeastcells increase pumping at high pH values (Penaet al., 1972) because of the release of the H+-ATPase activity from the external pressure ofprotons exerted by the low pH values of themedium. In the presence of glucose plus potas-sium, it has also been shown that yeast cells canincrease proton pumping when the membranepotential is decreased by the addition of mono-valent cations, particularly K+, even at low pHvalues (Pena et al., 1972; Pena et al., 1995).
. 14: 501–515 (1998)
504 . .
As mentioned in Methods, in this work, the totalalkalinization of pyranine was achieved by theaddition of 100 m-NH4OH, instead of the Trisbase used before. This procedure produced ahigher alkalinization (Hofer et al., 1996), the total
If the observed change of the internal pH wasdue to the activity of the H+-ATPase of the yeastplasma membrane, as suggested by Kotyk andGeorghiou (1994), it was expected that therewould be similar changes in the pH of the medium
Figure 1. Values obtained for the internal pH of the cells by measuring fluorescenceof electroporated pyranine after 150-s incubation under various conditions. Cells(25 mg wet weight) were incubated at different external pH values, without substrate,with 10 m-glucose or with 10 m-glucose plus 10 m-KCl. Final volume was 2·0 ml,and the temperature of the cell holder was maintained at 30)C. Fluorescence wasfollowed at 460–520 nm, and the pH was calculated as described previously (Penaet al., 1995). Alkalinization to obtain maximal fluorescence of pyranine was achievedby the addition of 100 m-NH4OH. Acidification to obtain minimal fluorescence wasachieved by the addition of 100 m-propionic acid to the cell suspension.
fluorescence values for the indicator were higher, surrounding the cells. In the absence of cations,
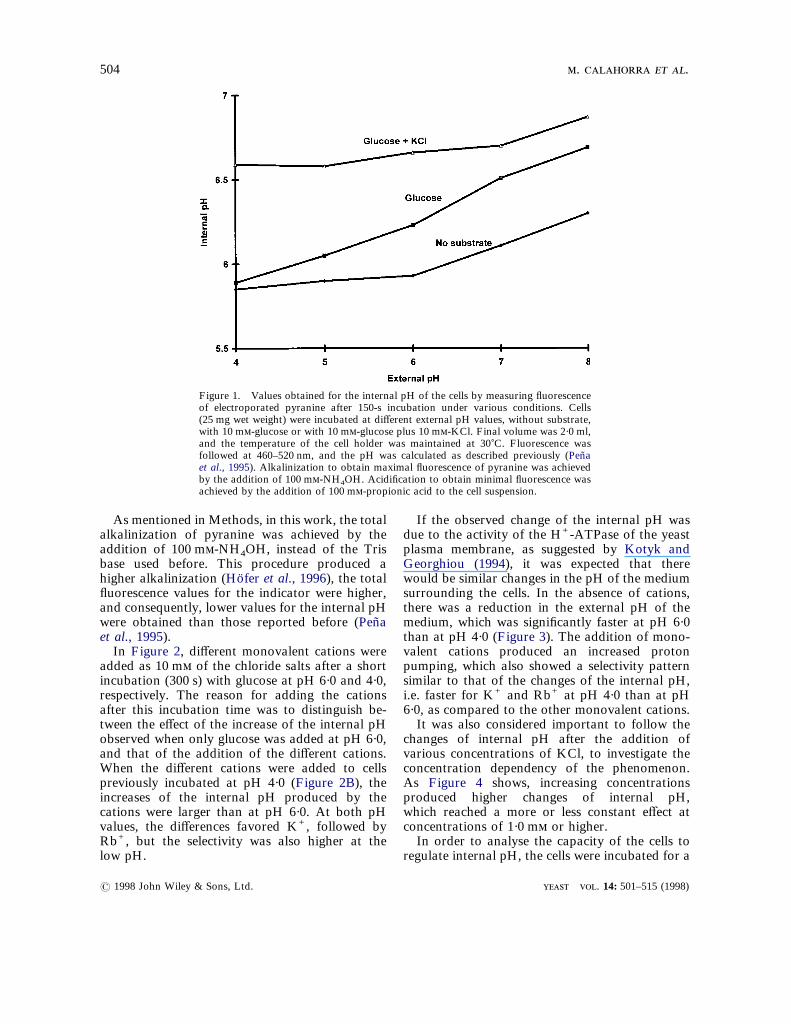
and consequently, lower values for the internal pHwere obtained than those reported before (Penaet al., 1995).In Figure 2, different monovalent cations wereadded as 10 m of the chloride salts after a shortincubation (300 s) with glucose at pH 6·0 and 4·0,respectively. The reason for adding the cationsafter this incubation time was to distinguish be-tween the effect of the increase of the internal pHobserved when only glucose was added at pH 6·0,and that of the addition of the different cations.When the different cations were added to cellspreviously incubated at pH 4·0 (Figure 2B), theincreases of the internal pH produced by thecations were larger than at pH 6·0. At both pHvalues, the differences favored K+, followed byRb+, but the selectivity was also higher at thelow pH.
? 1998 John Wiley & Sons, Ltd.
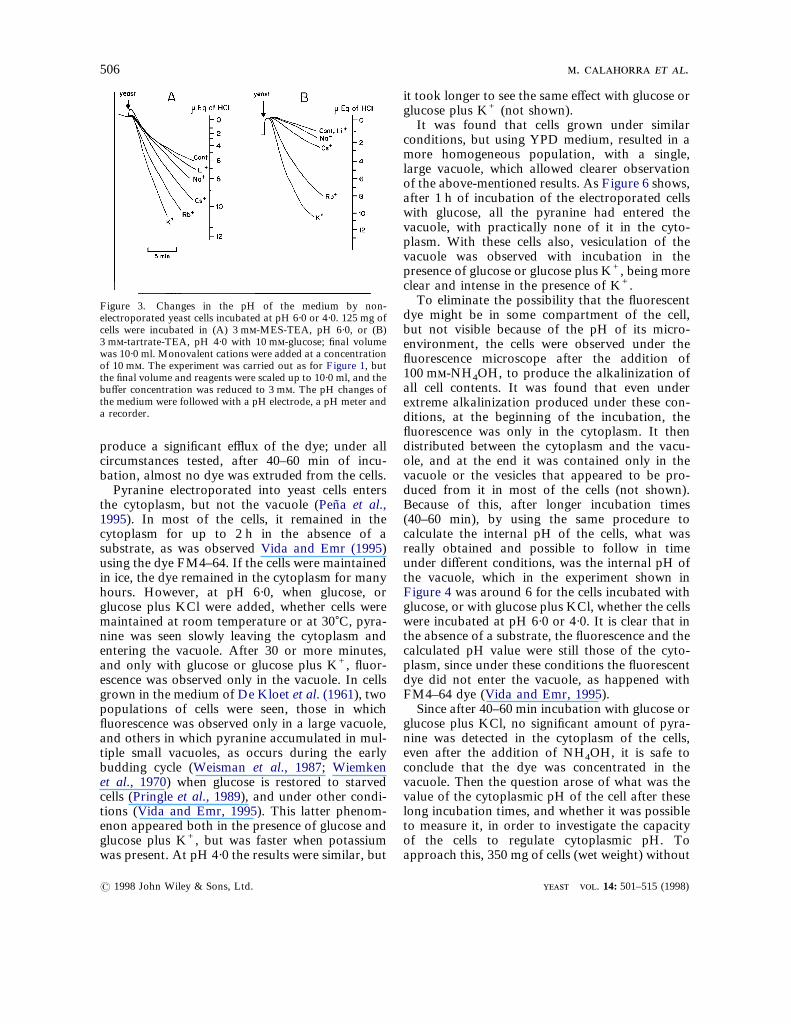
there was a reduction in the external pH of themedium, which was significantly faster at pH 6·0than at pH 4·0 (Figure 3). The addition of mono-valent cations produced an increased protonpumping, which also showed a selectivity patternsimilar to that of the changes of the internal pH,i.e. faster for K+ and Rb+ at pH 4·0 than at pH6·0, as compared to the other monovalent cations.It was also considered important to follow the
changes of internal pH after the addition ofvarious concentrations of KCl, to investigate theconcentration dependency of the phenomenon.As Figure 4 shows, increasing concentrationsproduced higher changes of internal pH,which reached a more or less constant effect atconcentrations of 1·0 m or higher.In order to analyse the capacity of the cells to
regulate internal pH, the cells were incubated for a
. 14: 501–515 (1998)
505
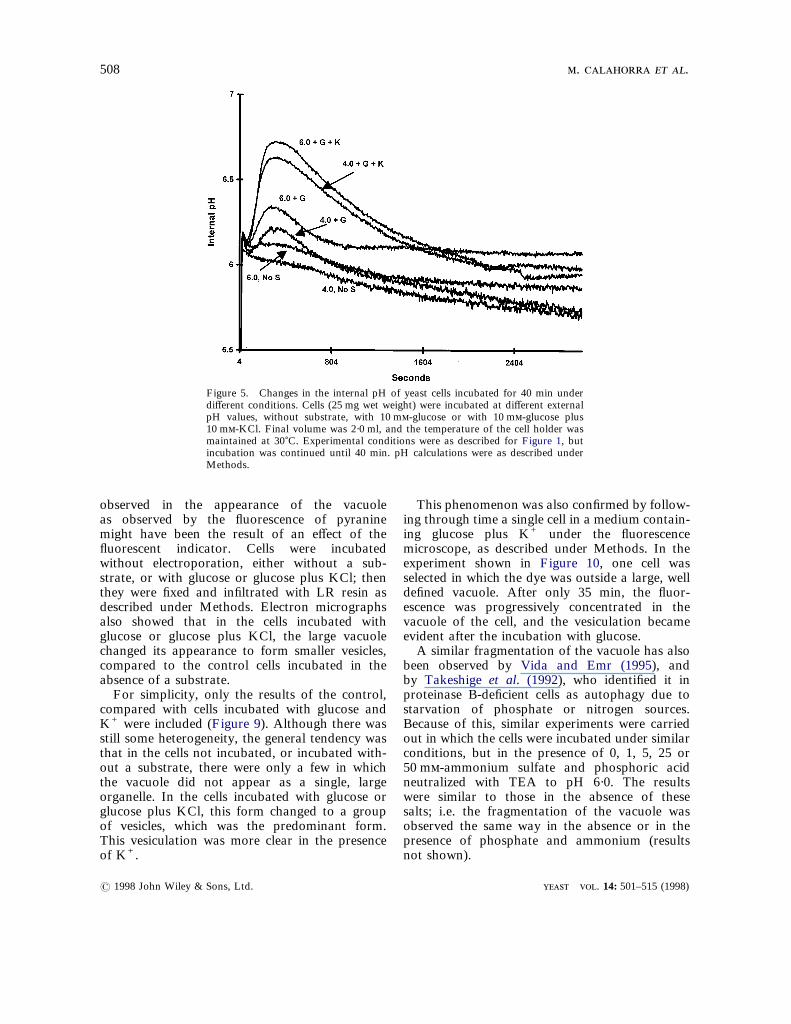
longer time, using a narrower slit opening of thespectrofluorometer (2 nm) to avoid bleaching thepyranine, and the results shown in Figure 5 wereobtained. Both with glucose alone and with
bation in the presence of KCl, either at pH 6·0 or4·0, always gave a significantly lower pH value atthe end of 40 min than the initial pH. The additionof 100 m-NH4OH to the cell suspension, either
Figure 2. Effect of different monovalent cations on the internal pH of yeast, as measured bypyranine, introduced by electroporation, in cells preincubated at two external pH values.25 mg of cells were incubated in (A) 10 m-MES-TEA, pH 6·0, or (B) 10 m-tartrate-TEA,pH 4·0 with 10 m-glucose; final volume was 2·0 ml. Where indicated (after 300 s), 10 m ofeach monovalent cation as the chloride salt was added. Experimental conditions were as inFigure 1.
glucose plus KCl, after an initial increase, the before or after the 40 min incubation, gave the
fluorescence of pyranine returned practically to theinitial or even lower values, whether the externalpH was 4·0 or 6·0, indicating an apparent completeregulation of the internal pH of the cell. Incu-? 1998 John Wiley & Sons, Ltd.
same values in total fluorescence under thedifferent conditions. By centrifuging the cells andmeasuring the fluorescence of the supernatant, itwas also found that the long incubation did not
. 14: 501–515 (1998)
it took longer to see the same effect with glucose orglucose plus K+ (not shown).It was found that cells grown under similar
conditions, but using YPD medium, resulted in amore homogeneous population, with a single,large vacuole, which allowed clearer observation
506 . .
produce a significant efflux of the dye; under allcircumstances tested, after 40–60 min of incu-bation, almost no dye was extruded from the cells.Pyranine electroporated into yeast cells enters
the cytoplasm, but not the vacuole (Pena et al.,
Figure 3. Changes in the pH of the medium by non-electroporated yeast cells incubated at pH 6·0 or 4·0. 125 mg ofcells were incubated in (A) 3 m-MES-TEA, pH 6·0, or (B)3 m-tartrate-TEA, pH 4·0 with 10 m-glucose; final volumewas 10·0 ml. Monovalent cations were added at a concentrationof 10 m. The experiment was carried out as for Figure 1, butthe final volume and reagents were scaled up to 10·0 ml, and thebuffer concentration was reduced to 3 m. The pH changes ofthe medium were followed with a pH electrode, a pH meter anda recorder.
1995). In most of the cells, it remained in the
cytoplasm for up to 2 h in the absence of asubstrate, as was observed Vida and Emr (1995)using the dye FM4–64. If the cells were maintainedin ice, the dye remained in the cytoplasm for manyhours. However, at pH 6·0, when glucose, orglucose plus KCl were added, whether cells weremaintained at room temperature or at 30)C, pyra-nine was seen slowly leaving the cytoplasm andentering the vacuole. After 30 or more minutes,and only with glucose or glucose plus K+, fluor-escence was observed only in the vacuole. In cellsgrown in the medium of De Kloet et al. (1961), twopopulations of cells were seen, those in whichfluorescence was observed only in a large vacuole,and others in which pyranine accumulated in mul-tiple small vacuoles, as occurs during the earlybudding cycle (Weisman et al., 1987; Wiemkenet al., 1970) when glucose is restored to starvedcells (Pringle et al., 1989), and under other condi-tions (Vida and Emr, 1995). This latter phenom-enon appeared both in the presence of glucose andglucose plus K+, but was faster when potassiumwas present. At pH 4·0 the results were similar, but? 1998 John Wiley & Sons, Ltd.
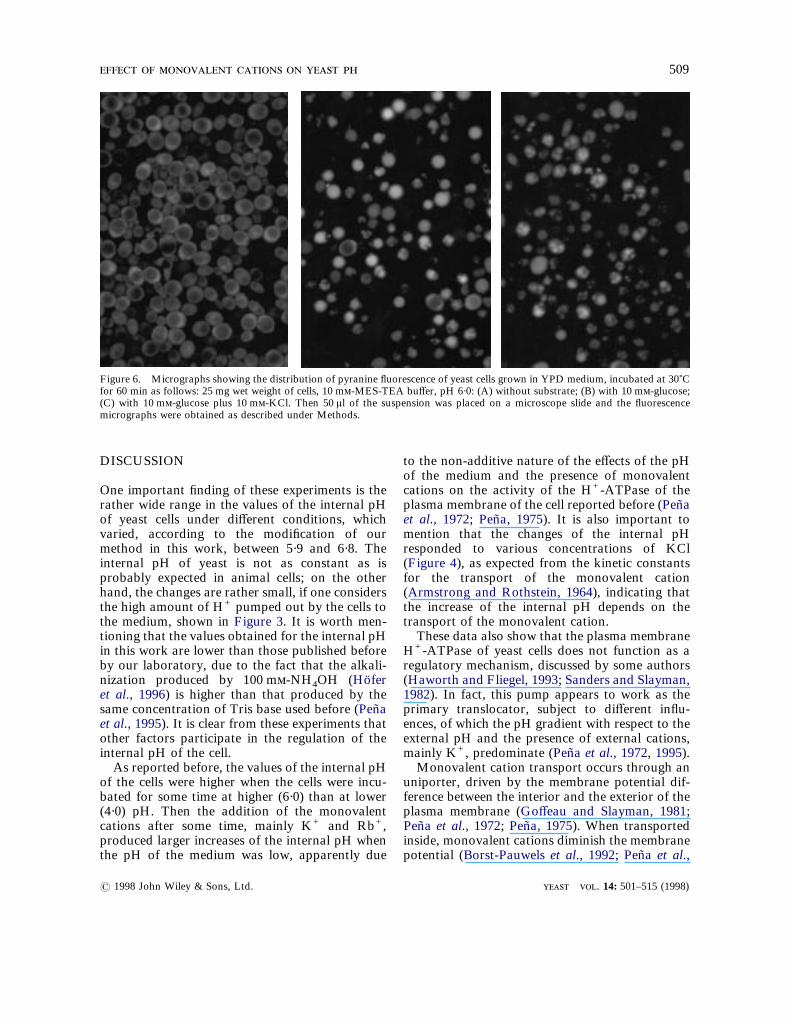
of the above-mentioned results. As Figure 6 shows,after 1 h of incubation of the electroporated cellswith glucose, all the pyranine had entered thevacuole, with practically none of it in the cyto-plasm. With these cells also, vesiculation of thevacuole was observed with incubation in thepresence of glucose or glucose plus K+, being moreclear and intense in the presence of K+.To eliminate the possibility that the fluorescent
dye might be in some compartment of the cell,but not visible because of the pH of its micro-environment, the cells were observed under thefluorescence microscope after the addition of100 m-NH4OH, to produce the alkalinization ofall cell contents. It was found that even underextreme alkalinization produced under these con-ditions, at the beginning of the incubation, thefluorescence was only in the cytoplasm. It thendistributed between the cytoplasm and the vacu-ole, and at the end it was contained only in thevacuole or the vesicles that appeared to be pro-duced from it in most of the cells (not shown).Because of this, after longer incubation times(40–60 min), by using the same procedure tocalculate the internal pH of the cells, what wasreally obtained and possible to follow in timeunder different conditions, was the internal pH ofthe vacuole, which in the experiment shown inFigure 4 was around 6 for the cells incubated withglucose, or with glucose plus KCl, whether the cellswere incubated at pH 6·0 or 4·0. It is clear that inthe absence of a substrate, the fluorescence and thecalculated pH value were still those of the cyto-plasm, since under these conditions the fluorescentdye did not enter the vacuole, as happened withFM4–64 dye (Vida and Emr, 1995).Since after 40–60 min incubation with glucose or
glucose plus KCl, no significant amount of pyra-nine was detected in the cytoplasm of the cells,even after the addition of NH4OH, it is safe toconclude that the dye was concentrated in thevacuole. Then the question arose of what was thevalue of the cytoplasmic pH of the cell after theselong incubation times, and whether it was possibleto measure it, in order to investigate the capacityof the cells to regulate cytoplasmic pH. Toapproach this, 350 mg of cells (wet weight) without
. 14: 501–515 (1998)

507
electroporation were incubated for 60 min, eitherin the absence or in the presence of glucose alone,or glucose plus 10 m-KCl. After washing andresuspending the cells in 0·7 ml of water, they wereelectroporated with pyranine as described under
decrease of the internal pH, which was followed bya very small, if any, increase of the internal pH inthe cells preincubated with glucose or glucose pluspotassium, and much larger in those which werenot preincubated, or preincubated in the absence
Figure 4. Effects of different concentrations of KCl on the internal pH of yeast cellsincubated at pH 6·0, measured with pyranine introduced by electroporation. Cells (25 mgwet weight) were incubated for 5 min at pH 6·0 with 10 m-glucose. Final volume was2·0 ml, and the temperature of the cell holder was maintained at 30)C. Then, the indicatedconcentrations of KCl were added, fluorescence was followed at 460–520 nm, and the pHwas calculated from the data.
Methods. By observing the cells under the fluor- of a substrate. In both preincubated and not
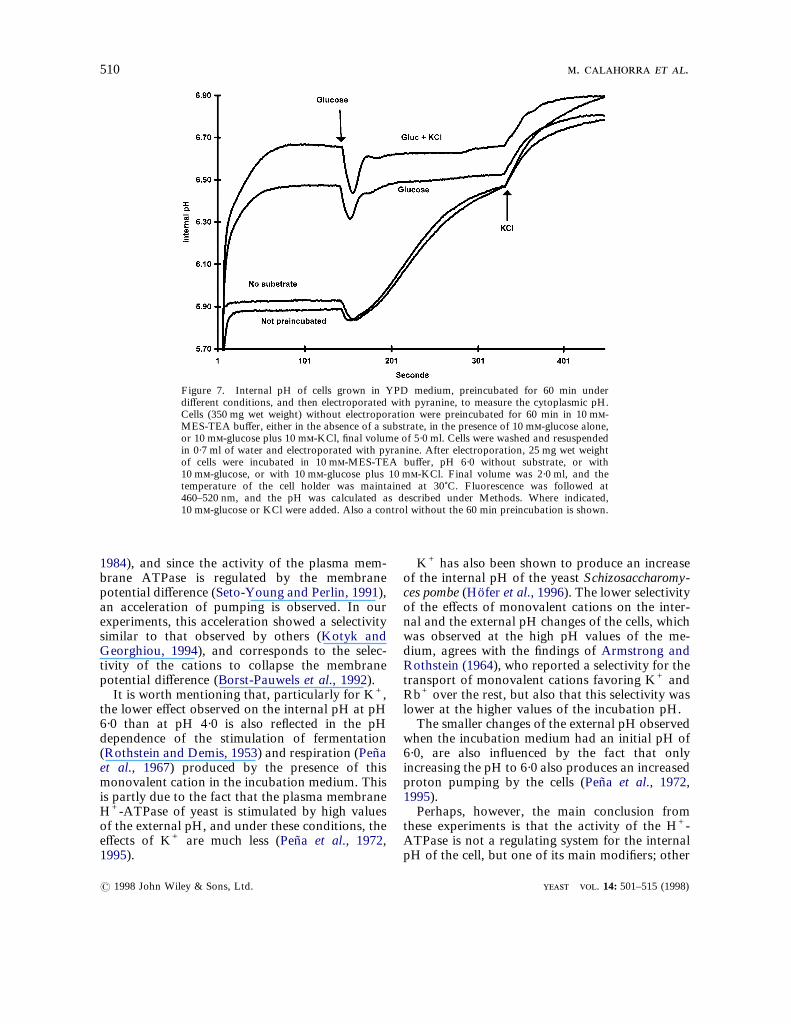
escence microscope, it was found that pyraninewas located in the cytoplasm, as expected from theprevious experience with electroporation. It wasalso found that after preincubation with glucose orglucose plus potassium, pyranine increased itsfluorescence, indicating a high pH value of thecytoplasm under these conditions. Then, the exper-iment shown in Figure 7 was performed in thespectrofluorometer, incubating these preincubatedand then electroporated cells in the absence of asubstrate, and then successively adding glucoseand KCl. From the data, values for the cytoplas-mic pH could be calculated as in the other exper-iments. As this Figure shows, the cytoplasmic pHwas around 5·9 when the cells had been preincu-bated without a substrate, and it reached valuesaround 6·5 and 6·7 when preincubation was car-ried out with glucose or with glucose plus KCl,respectively. In these cells, it was observed that theaddition of glucose produced a rapid and transient? 1998 John Wiley & Sons, Ltd.
preincubated cells, the pH values after the additionof glucose reached similar values. The furtheraddition of K+ produced a further increase of thepH in all cases.On the other hand, when pyranine electropo-
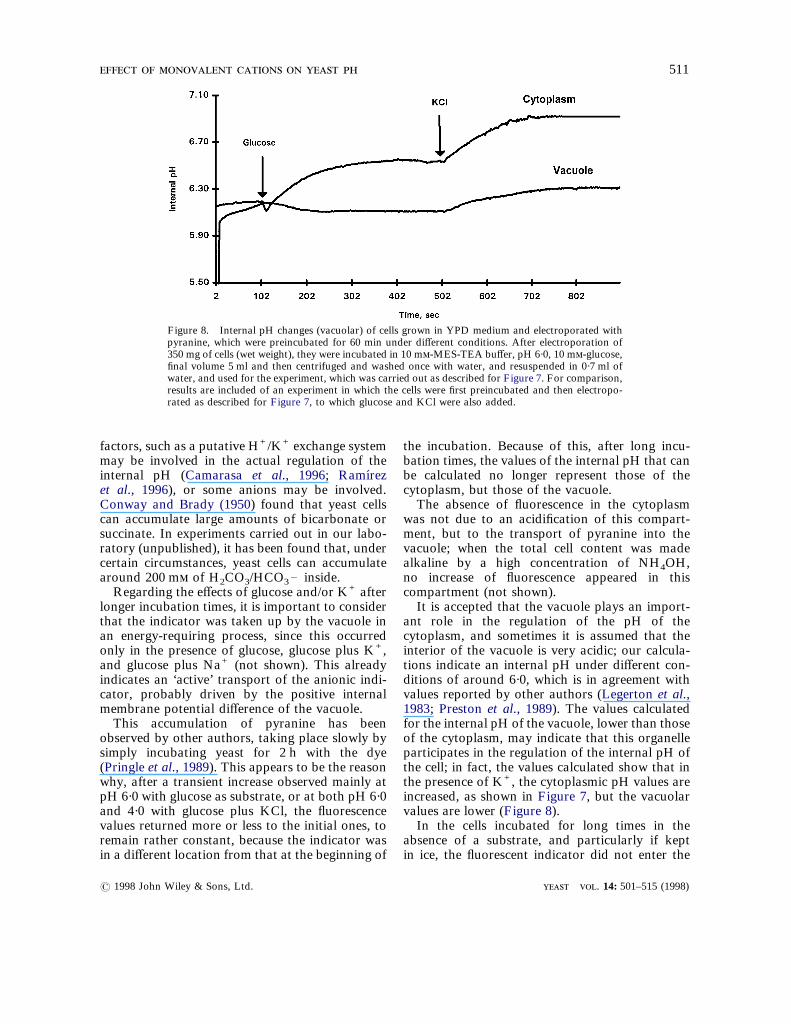
rated cells were preincubated for 60 min in thepresence of a limiting amount of glucose (2·5 m)and washed to eliminate the substrate, the dyewas concentrated in the vacuole. In these cells, itwas found that glucose produced a delayed smalldecrease of the fluorescence, followed by eitherno change or a small increase of the measured(vacuolar) pH (Figure 8). The addition of potas-sium, however, did produce a small increase ofthe fluorescence, similar but smaller than thatobserved in the cytoplasm. For comparison, theresults of the addition of glucose and KCl on thecytoplasmic pH are shown in the same Figure.With the cells grown in the YPD medium, it was
considered important to see whether the changes
. 14: 501–515 (1998)
508 . .
observed in the appearance of the vacuoleas observed by the fluorescence of pyraninemight have been the result of an effect of thefluorescent indicator. Cells were incubatedwithout electroporation, either without a sub-
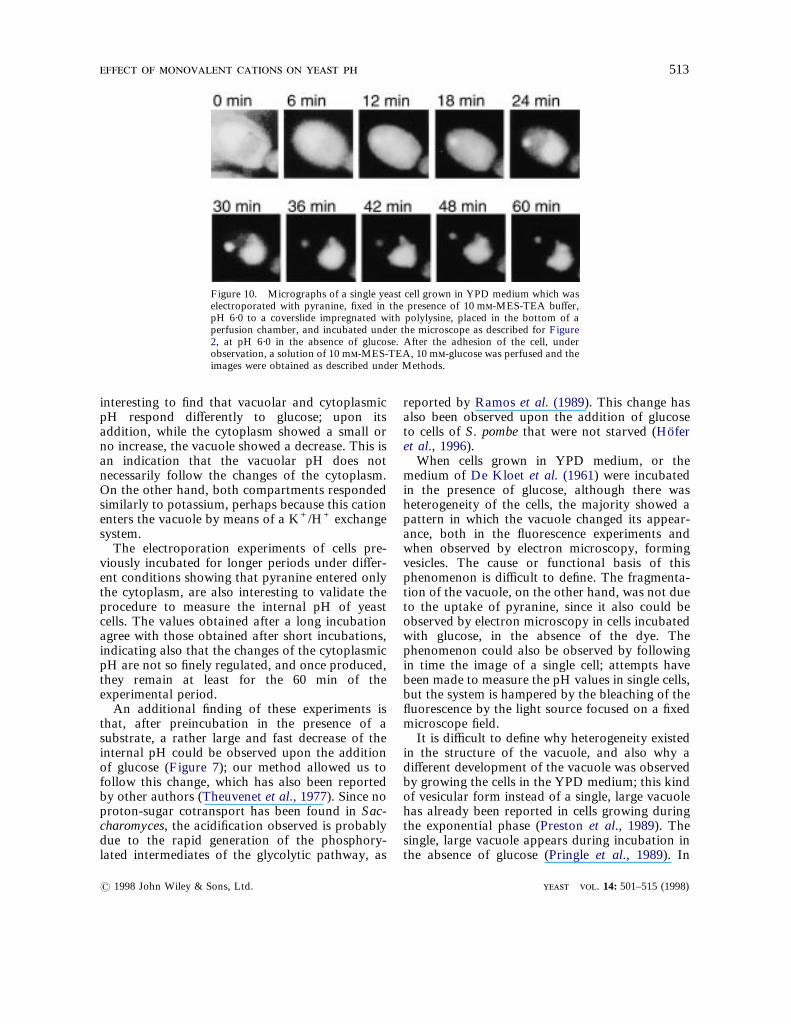
This phenomenon was also confirmed by follow-ing through time a single cell in a medium contain-ing glucose plus K+ under the fluorescencemicroscope, as described under Methods. In theexperiment shown in Figure 10, one cell was
Figure 5. Changes in the internal pH of yeast cells incubated for 40 min underdifferent conditions. Cells (25 mg wet weight) were incubated at different externalpH values, without substrate, with 10 m-glucose or with 10 m-glucose plus10 m-KCl. Final volume was 2·0 ml, and the temperature of the cell holder wasmaintained at 30)C. Experimental conditions were as described for Figure 1, butincubation was continued until 40 min. pH calculations were as described underMethods.
strate, or with glucose or glucose plus KCl; then selected in which the dye was outside a large, well
they were fixed and infiltrated with LR resin asdescribed under Methods. Electron micrographsalso showed that in the cells incubated withglucose or glucose plus KCl, the large vacuolechanged its appearance to form smaller vesicles,compared to the control cells incubated in theabsence of a substrate.For simplicity, only the results of the control,compared with cells incubated with glucose andK+ were included (Figure 9). Although there wasstill some heterogeneity, the general tendency wasthat in the cells not incubated, or incubated with-out a substrate, there were only a few in whichthe vacuole did not appear as a single, largeorganelle. In the cells incubated with glucose orglucose plus KCl, this form changed to a groupof vesicles, which was the predominant form.This vesiculation was more clear in the presenceof K+.
? 1998 John Wiley & Sons, Ltd.
defined vacuole. After only 35 min, the fluor-escence was progressively concentrated in thevacuole of the cell, and the vesiculation becameevident after the incubation with glucose.A similar fragmentation of the vacuole has also
been observed by Vida and Emr (1995), andby Takeshige et al. (1992), who identified it inproteinase B-deficient cells as autophagy due tostarvation of phosphate or nitrogen sources.Because of this, similar experiments were carriedout in which the cells were incubated under similarconditions, but in the presence of 0, 1, 5, 25 or50 m-ammonium sulfate and phosphoric acidneutralized with TEA to pH 6·0. The resultswere similar to those in the absence of thesesalts; i.e. the fragmentation of the vacuole wasobserved the same way in the absence or in thepresence of phosphate and ammonium (resultsnot shown).
. 14: 501–515 (1998)
509
DISCUSSION
One important finding of these experiments is therather wide range in the values of the internal pH
to the non-additive nature of the effects of the pHof the medium and the presence of monovalentcations on the activity of the H+-ATPase of theplasma membrane of the cell reported before (Pena
Figure 6. Micrographs showing the distribution of pyranine fluorescence of yeast cells grown in YPD medium, incubated at 30)Cfor 60 min as follows: 25 mg wet weight of cells, 10 m-MES-TEA buffer, pH 6·0: (A) without substrate; (B) with 10 m-glucose;(C) with 10 m-glucose plus 10 m-KCl. Then 50 ìl of the suspension was placed on a microscope slide and the fluorescencemicrographs were obtained as described under Methods.
of yeast cells under different conditions, whichvaried, according to the modification of our
et al., 1972; Pena, 1975). It is also important to
method in this work, between 5·9 and 6·8. Theinternal pH of yeast is not as constant as isprobably expected in animal cells; on the otherhand, the changes are rather small, if one considersthe high amount of H+ pumped out by the cells tothe medium, shown in Figure 3. It is worth men-tioning that the values obtained for the internal pHin this work are lower than those published beforeby our laboratory, due to the fact that the alkali-nization produced by 100 m-NH4OH (Hoferet al., 1996) is higher than that produced by thesame concentration of Tris base used before (Penaet al., 1995). It is clear from these experiments thatother factors participate in the regulation of theinternal pH of the cell.As reported before, the values of the internal pH
of the cells were higher when the cells were incu-bated for some time at higher (6·0) than at lower(4·0) pH. Then the addition of the monovalentcations after some time, mainly K+ and Rb+,produced larger increases of the internal pH whenthe pH of the medium was low, apparently due
? 1998 John Wiley & Sons, Ltd.
mention that the changes of the internal pHresponded to various concentrations of KCl(Figure 4), as expected from the kinetic constantsfor the transport of the monovalent cation(Armstrong and Rothstein, 1964), indicating thatthe increase of the internal pH depends on thetransport of the monovalent cation.These data also show that the plasma membrane
H+-ATPase of yeast cells does not function as aregulatory mechanism, discussed by some authors(Haworth and Fliegel, 1993; Sanders and Slayman,1982). In fact, this pump appears to work as theprimary translocator, subject to different influ-ences, of which the pH gradient with respect to theexternal pH and the presence of external cations,mainly K+, predominate (Pena et al., 1972, 1995).Monovalent cation transport occurs through an
uniporter, driven by the membrane potential dif-ference between the interior and the exterior of theplasma membrane (Goffeau and Slayman, 1981;Pena et al., 1972; Pena, 1975). When transportedinside, monovalent cations diminish the membranepotential (Borst-Pauwels et al., 1992; Pena et al.,
. 14: 501–515 (1998)
510 . .
1984), and since the activity of the plasma mem-brane ATPase is regulated by the membranepotential difference (Seto-Young and Perlin, 1991),an acceleration of pumping is observed. In our
K+ has also been shown to produce an increaseof the internal pH of the yeast Schizosaccharomy-ces pombe (Hofer et al., 1996). The lower selectivityof the effects of monovalent cations on the inter-
Figure 7. Internal pH of cells grown in YPD medium, preincubated for 60 min underdifferent conditions, and then electroporated with pyranine, to measure the cytoplasmic pH.Cells (350 mg wet weight) without electroporation were preincubated for 60 min in 10 m-MES-TEA buffer, either in the absence of a substrate, in the presence of 10 m-glucose alone,or 10 m-glucose plus 10 m-KCl, final volume of 5·0 ml. Cells were washed and resuspendedin 0·7 ml of water and electroporated with pyranine. After electroporation, 25 mg wet weightof cells were incubated in 10 m-MES-TEA buffer, pH 6·0 without substrate, or with10 m-glucose, or with 10 m-glucose plus 10 m-KCl. Final volume was 2·0 ml, and thetemperature of the cell holder was maintained at 30)C. Fluorescence was followed at460–520 nm, and the pH was calculated as described under Methods. Where indicated,10 m-glucose or KCl were added. Also a control without the 60 min preincubation is shown.
experiments, this acceleration showed a selectivity nal and the external pH changes of the cells, which
similar to that observed by others (Kotyk andGeorghiou, 1994), and corresponds to the selec-tivity of the cations to collapse the membranepotential difference (Borst-Pauwels et al., 1992).It is worth mentioning that, particularly for K+,the lower effect observed on the internal pH at pH6·0 than at pH 4·0 is also reflected in the pHdependence of the stimulation of fermentation(Rothstein and Demis, 1953) and respiration (Penaet al., 1967) produced by the presence of thismonovalent cation in the incubation medium. Thisis partly due to the fact that the plasma membraneH+-ATPase of yeast is stimulated by high valuesof the external pH, and under these conditions, theeffects of K+ are much less (Pena et al., 1972,1995).
? 1998 John Wiley & Sons, Ltd.
was observed at the high pH values of the me-dium, agrees with the findings of Armstrong andRothstein (1964), who reported a selectivity for thetransport of monovalent cations favoring K+ andRb+ over the rest, but also that this selectivity waslower at the higher values of the incubation pH.The smaller changes of the external pH observed
when the incubation medium had an initial pH of6·0, are also influenced by the fact that onlyincreasing the pH to 6·0 also produces an increasedproton pumping by the cells (Pena et al., 1972,1995).Perhaps, however, the main conclusion from
these experiments is that the activity of the H+-ATPase is not a regulating system for the internalpH of the cell, but one of its main modifiers; other
. 14: 501–515 (1998)
511
factors, such as a putative H+/K+ exchange systemmay be involved in the actual regulation of theinternal pH (Camarasa et al., 1996; Ramırezet al., 1996), or some anions may be involved.
the incubation. Because of this, after long incu-bation times, the values of the internal pH that canbe calculated no longer represent those of thecytoplasm, but those of the vacuole.
Figure 8. Internal pH changes (vacuolar) of cells grown in YPD medium and electroporated withpyranine, which were preincubated for 60 min under different conditions. After electroporation of350 mg of cells (wet weight), they were incubated in 10 m-MES-TEA buffer, pH 6·0, 10 m-glucose,final volume 5 ml and then centrifuged and washed once with water, and resuspended in 0·7 ml ofwater, and used for the experiment, which was carried out as described for Figure 7. For comparison,results are included of an experiment in which the cells were first preincubated and then electropo-rated as described for Figure 7, to which glucose and KCl were also added.
Conway and Brady (1950) found that yeast cells The absence of fluorescence in the cytoplasm
can accumulate large amounts of bicarbonate orsuccinate. In experiments carried out in our labo-ratory (unpublished), it has been found that, undercertain circumstances, yeast cells can accumulatearound 200 m of H2CO3/HCO3" inside.Regarding the effects of glucose and/or K+ afterlonger incubation times, it is important to considerthat the indicator was taken up by the vacuole inan energy-requiring process, since this occurredonly in the presence of glucose, glucose plus K+,and glucose plus Na+ (not shown). This alreadyindicates an ‘active’ transport of the anionic indi-cator, probably driven by the positive internalmembrane potential difference of the vacuole.This accumulation of pyranine has been
observed by other authors, taking place slowly bysimply incubating yeast for 2 h with the dye(Pringle et al., 1989). This appears to be the reasonwhy, after a transient increase observed mainly atpH 6·0 with glucose as substrate, or at both pH 6·0and 4·0 with glucose plus KCl, the fluorescencevalues returned more or less to the initial ones, toremain rather constant, because the indicator wasin a different location from that at the beginning of
? 1998 John Wiley & Sons, Ltd.
was not due to an acidification of this compart-ment, but to the transport of pyranine into thevacuole; when the total cell content was madealkaline by a high concentration of NH4OH,no increase of fluorescence appeared in thiscompartment (not shown).It is accepted that the vacuole plays an import-
ant role in the regulation of the pH of thecytoplasm, and sometimes it is assumed that theinterior of the vacuole is very acidic; our calcula-tions indicate an internal pH under different con-ditions of around 6·0, which is in agreement withvalues reported by other authors (Legerton et al.,1983; Preston et al., 1989). The values calculatedfor the internal pH of the vacuole, lower than thoseof the cytoplasm, may indicate that this organelleparticipates in the regulation of the internal pH ofthe cell; in fact, the values calculated show that inthe presence of K+, the cytoplasmic pH values areincreased, as shown in Figure 7, but the vacuolarvalues are lower (Figure 8).In the cells incubated for long times in the
absence of a substrate, and particularly if keptin ice, the fluorescent indicator did not enter the
. 14: 501–515 (1998)

512 . .
vacuole, and it is not possible to determine theinternal pH of this organelle under these con-ditions, although it is possible to observe the dyeentering the vacuole with long incubations withoutsubstrate at room temperature, probably because
follow the changes of the cytoplasmic pH, andto define that this compartment already had asignificantly higher pH value; it only respondedslightly and transiently to the addition of glucose,but still responded as expected to the addition of
Figure 9. Electron micrographs of cells grown in YPD medium, incubated at30)C for 60 min as follows: 25 mg wet weight of cells, 10 m-MES-TEAbuffer, pH 6·0: (A) without substrate, (B) with 10 m-glucose plus 10 m-KCl, final volume 2·0 ml. After incubation, the cells were fixed, processed andobserved as described under Methods.
of the existence of endogenous substrates (not potassium.
shown). However, if the cells were preincubatedbefore, and then electroporated, it was possible to? 1998 John Wiley & Sons, Ltd.
By electroporating the cells either before orafter preincubating them with glucose, it was also
. 14: 501–515 (1998)
513
interesting to find that vacuolar and cytoplasmicpH respond differently to glucose; upon itsaddition, while the cytoplasm showed a small orno increase, the vacuole showed a decrease. This isan indication that the vacuolar pH does not
reported by Ramos et al. (1989). This change hasalso been observed upon the addition of glucoseto cells of S. pombe that were not starved (Hoferet al., 1996).When cells grown in YPD medium, or the
Figure 10. Micrographs of a single yeast cell grown in YPD medium which waselectroporated with pyranine, fixed in the presence of 10 m-MES-TEA buffer,pH 6·0 to a coverslide impregnated with polylysine, placed in the bottom of aperfusion chamber, and incubated under the microscope as described for Figure2, at pH 6·0 in the absence of glucose. After the adhesion of the cell, underobservation, a solution of 10 m-MES-TEA, 10 m-glucose was perfused and theimages were obtained as described under Methods.
necessarily follow the changes of the cytoplasm. medium of De Kloet et al. (1961) were incubated
On the other hand, both compartments respondedsimilarly to potassium, perhaps because this cationenters the vacuole by means of a K+/H+ exchangesystem.The electroporation experiments of cells pre-viously incubated for longer periods under differ-ent conditions showing that pyranine entered onlythe cytoplasm, are also interesting to validate theprocedure to measure the internal pH of yeastcells. The values obtained after a long incubationagree with those obtained after short incubations,indicating also that the changes of the cytoplasmicpH are not so finely regulated, and once produced,they remain at least for the 60 min of theexperimental period.An additional finding of these experiments is
that, after preincubation in the presence of asubstrate, a rather large and fast decrease of theinternal pH could be observed upon the additionof glucose (Figure 7); our method allowed us tofollow this change, which has also been reportedby other authors (Theuvenet et al., 1977). Since noproton-sugar cotransport has been found in Sac-charomyces, the acidification observed is probablydue to the rapid generation of the phosphory-lated intermediates of the glycolytic pathway, as
? 1998 John Wiley & Sons, Ltd.
in the presence of glucose, although there washeterogeneity of the cells, the majority showed apattern in which the vacuole changed its appear-ance, both in the fluorescence experiments andwhen observed by electron microscopy, formingvesicles. The cause or functional basis of thisphenomenon is difficult to define. The fragmenta-tion of the vacuole, on the other hand, was not dueto the uptake of pyranine, since it also could beobserved by electron microscopy in cells incubatedwith glucose, in the absence of the dye. Thephenomenon could also be observed by followingin time the image of a single cell; attempts havebeen made to measure the pH values in single cells,but the system is hampered by the bleaching of thefluorescence by the light source focused on a fixedmicroscope field.It is difficult to define why heterogeneity existed
in the structure of the vacuole, and also why adifferent development of the vacuole was observedby growing the cells in the YPD medium; this kindof vesicular form instead of a single, large vacuolehas already been reported in cells growing duringthe exponential phase (Preston et al., 1989). Thesingle, large vacuole appears during incubation inthe absence of glucose (Pringle et al., 1989). In
. 14: 501–515 (1998)
this phenomenon, the cytoskeleton seems to beinvolved (Guthrie and Wickner, 1988).The possibility that this is a mechanism to
eliminate the indicator was explored; however,when the external concentration of pyranine wasmeasured in the supernatant after centrifuging the
different conditions were not different from thosereached during short incubation periods.
ACKNOWLEDGEMENTS
This work was partially supported by grants no.
no. 3188N-N9307 from the Consejo Nacional
Theuvenet, A. P. R. (1992). The concentration depen-
514 . .
cells, no changes were observed under the differentincubation conditions during 4 h (not shown).This fragmentation of the vacuole has been alsoobserved by Vida and Emr (1995), and might alsobe related to the changes observed by Takeshigeet al. (1992) during starvation of carbon or nitro-gen sources to the cells, in proteinase B-deficientcells. However, the images of the electron micro-graphs presented in this work are different fromthose obtained by the latter authors, who carriedout an excellent study and found both by electronmicroscopy and biochemical methods the inclusionof cytoplasmic components in the vacuole.Perhaps the main difference is that they found
these autophagic bodies appearing inside the mem-brane of the vacuole, while the images presented inthis paper show no indication of a membranesurrounding the vesicles, but the fragmentation ofthe vacuole. Also, the images presented by themwere obtained only in cells genetically deficient inproteinase B. Besides, the cells used in this exper-iment, which were starved for around 18 h, do notseem to go into the process of autophagy, asrevealed by experiments in which we havemeasured viability after starvation and evenelectroporation (Pena et al., 1995), showingmore than 90% viability of the cells, which is notsignificantly different from that of control cells.Also, the experiments in which the cells were
incubated under similar conditions, but in thepresence of 0–50 m of both ammonium sulfateand phosphate, still allowed us to observe thefragmentation of the vacuole the same way as inthe absence or presence of phosphate and ammo-nium (results not shown). This appears to be acomplex phenomenon deserving further study,since it has been found during budding ofyeast, and it was observed (Weisman et al., 1987;Wiemken et al., 1970) that the morphology of thevacuole throughout the cell division cycle isessentially independent of the phase in which thecells are.Another interesting fact is that, even if the
vacuole participates in the regulation of the cellpH, the regulation of the cytoplasmic pH did notappear to be so efficient; the values observed forthis parameter after preincubating the cells under
? 1998 John Wiley & Sons, Ltd.
IN-202193 and IN-206395 from the DireccionGeneral de Asuntos del Personal Academico,Universidad Nacional Autonoma de Mexico, and
de Ciencia y Tecnologıa de Mexico. We alsoacknowledge the processing of the samples for theelectron micrographs by Jorge Sepulveda.
REFERENCES
Armstrong, W. McD. and Rothstein, A. (1964).Discrimination between alkali metal cations by yeast.I. Effect of pH on uptake. J. Gen. Physiol. 48, 61–71.
Borst-Pauwels, G. W. F. H., van de Mortel, J. and
dence of the polarization of yeast by monovalentcations. Biochim. Biophys. Acta 1107, 207–212.
Camarasa, C., Prieto, S., Ros, R., Salmon, J.-M. andBarre, P. (1996). Evidence for a selective electro-neutral K+/H+-exchange in Saccharomyces cerevisiaeusing plasma membrane vesicles. Yeast 12, 1301–1313.
Cimprich, P., Slavık, J. and Kotyk, A. (1995). Distribu-tion of individual cytoplasmic pH values in a popula-tion of the yeast Saccharomyces cerevisiae. FEMSMicrobiol. Lett. 130, 245–252.
Conway, E. J. and Brady, T. G. (1950). Biologicalproduction of acid and alkali. I. Quantitative relationsof succinic and carbonic acids to the potassium andhydrogen ion exchange in fermenting yeast. Biochem.J. 47, 360–369.
Conway, E. J. and Downey, M. (1950). pH values of theyeast cell. Biochem. J. 47, 355–360.
De Kloet, S. R., Van Wermeskerken, R. K. A. andKonigsberger, V. V. (1961). Studies of protein syn-thesis by protoplasts of Saccharomyces cerevisiae.Biochim. Biophys. Acta 47, 138–143.
Goffeau, A. and Slayman, C. W. (1981). The protontranslocating ATPase of the fungal plasma mem-brane. Biochim. Biophys. Acta 639, 197–223.
Guthrie, B. A. and Wickner, W. (1988). Yeast vacuolesfragment when microtubules are disrupted. J. CellBiol. 107, 115–120.
Haworth, R. S. and Fliegel, L. (1993). Intracellular pHin Schizosaccharomyces pombe—comparison withSaccharomyces cerevisiae. Mol. Cell. Biochem. 124,131–140.
Hofer, M., Calahorra, M., Klein, B. and Pena, A.(1996). Assessment of ÄìH+ in Schizosaccharomycespombe; intracellular inclusion of impermeable agentsby electroporation. Folia Microbiol. 41, 98–100.
. 14: 501–515 (1998)
Karnowski, M. J. (1965). Formaldehyde-glutaraldehydefixative at high osmolality for use in electronmicroscopy. J. Cell Biol. 27, 137–142.
Kotyk, A. and Georghiou, G. (1994). Univalent cation-elicited acidification by yeasts. Biochem. Mol. Biol.Int. 33, 1145–1149.
Legerton, T. L., Kanamori, K., Weiss, R. L. and
Ramos, J., Alijo, R., Haro, R. and RodrıguezNavarro, A. (1994). TRK2 is not a low affinitypotassium transporter in Saccharomyces cerevisiae. J.Bacteriol. 176, 249–252.
Ramos, S., Balbın, M., Raposo, M., Valle, E. andPardo, L. A. (1989). The mechanism of intracellularacidification induced by glucose in Saccharomyces
515
Roberts, J. D. (1983). Measurement of cytoplasmicand vacuolar pH in Neurospora using nitrogen-15nuclear magnetic resonance spectroscopy. Biochemis-try 22, 899–903.
Niewenhuis, B. J. W. M., Weijers, C. A. G. M. andBorst-Pauwels, G. W. F. H. (1981). Uptake andaccumulation of Mn2+ and Sr2+ in Saccharomycescerevisiae. Biochim. Biophys. Acta 649, 83–88.
Pena, A., Cinco, G., Garcıa, A., Gomez-Puyou, A. andTuena, M. (1967). Effect of externally added sodiumand potassium ions on the glycolytic sequence ofSaccharomyces cerevisiae. Biochim. Biophys. Acta 148,673–682.
Pena, A., Cinco, G., Gomez-Puyou, A. and Tuena, M.(1969). Studies on the mechanism of stimulation ofglycolysis and respiration in Saccharomyces cerevisiae.Biochim. Biophys. Acta 180, 1–8.
Pena, A., Cinco, G., Gomez-Puyou, A. and Tuena, M.(1972). Effects of the pH of the incubation medium onglycolysis and respiration in Saccharomyces cerevisiae.Arch. Biochem. Biophys. 153, 413–425.
Pena, A. (1975). Studies on the mechanism of K+
transport in yeast. Arch. Biochem. Biophys. 167,397–407.
Pena, A., Uribe, S., Pardo, J. P. and Borbolla, M.(1984). The use of a cyanine dye in measuring mem-brane potential in yeast. Arch. Biochem. Biophys. 231,217–225.
Pena, A., Ramırez, J., Rosas, G. and Calahorra, M.(1995). Proton pumping and the internal pH of yeastcells, measured with pyranine introduced by electro-poration. J. Bacteriol. 177, 1017–1022.
Preston, R. A., Murphy, R. F. and Jones, E. W. (1989).Assay of vacuolar pH in yeast and identification ofacidification-defective mutants. Proc. Natl. Acad. Sci.USA 86, 7027–7031.
Pringle, J. R., Preston, R. A., Adams, A. E. M., et al.(1989). Fluorescence microscopy methods for yeast.Methods in Cell Biology 31, 357–437.
Ramırez, J., Pena, A. and Montero-Lomelı, M. (1996).K+/H+ exchange in reconstituted yeast plasma mem-brane vesicles. Biochim. Biophys. Acta 1285, 175–182.
? 1998 John Wiley & Sons, Ltd.
cerevisiae. J. Gen. Microbiol. 135, 2413–2422.Rodrıguez-Navarro, A. and Ramos, J. (1984). Dualsystem for potassium transport in Saccharomycescerevisiae. J. Bacteriol. 199, 940–945.
Roomans, G. H., Theuvenet, A. P. R., Van den Berg,Th. P. R. and Borst Pauwels, G. W. F. H. (1979).Kinetics of Ca2+ and Sr 2+ uptake by yeast. Biochim.Biophys. Acta 551, 187–196.
Rothstein, A. and Demis, C. (1953). The relationship ofthe cell surface to metabolism. The stimulationof fermentation by extracellular potassium. Arch.Biochem. Biophys. 44, 18–28.
Sanders, D. and Slayman, C. L. (1982). Control ofintracellular pH. Predominant role of oxidativemetabolism, not proton transport, in the eukarioticmicroorganism Neurospora. J. Gen. Physiol. 80, 377–402.
Seto-Young, D. and Perlin, D. S. (1991). Effect ofmembrane voltage on the plasma membrane H+-ATPase of Saccharomyces cerevisiae. J. Biol. Chem.266, 1383–1389.
Takeshige, K., Baba, M., Tsuboi, S., Noda, T. andOhsumi, Y. (1992). Autophagy in yeast demonstratedwith proteinase-deficient mutants and conditions forits induction. J. Cell Biol. 119, 301–311.
Theuvenet, A. P. R., Roomans, G. M. andBorst-Pauwels, G. W. F. H. (1977). Intracellular pHand the kinetics of Rb+ uptake by yeast non-carrierversus mobile carrier-mediated uptake. Biochim.Biophys. Acta 469, 272–280.
Vida, T. A. and Emr, S. D. (1995). A new vital stainfor visualizing vacuolar membrane dynamics andendocytosis in yeast. J. Cell Biol. 128, 779–792.
Weisman, L. S., Bacallao, R. and Wickner, W. (1987).Multiple methods of visualizing the yeast vacuolepermit evaluation of its morphology and inheritanceduring cell cycle. J. Cell. Biol. 105, 1539–1547.
Wiemken, A., Matile, P. and Moor, H (1970). Vacuolardynamics in synchronously budding yeast. Arch.Microbiol. 70, 89–103.
. 14: 501–515 (1998)