Doping magnesiumiontotuneelectricalanddielectric properties ofBaCo2 hexaferrites
1 23
Journal of Materials Science:Materials in Electronics ISSN 0957-4522 J Mater Sci: Mater ElectronDOI 10.1007/s10854-014-1859-5
Influence of Mn doping on structural,electrical and magnetic properties of(0.90)BiFeO3–(0.10)BaTiO3 composite
Mohit Sahni, Naresh Kumar, SushantSingh, Aashish Jha, S. Chaubey, ManojKumar & M. K. Sharma

1 23
Your article is protected by copyright and all
rights are held exclusively by Springer Science
+Business Media New York. This e-offprint is
for personal use only and shall not be self-
archived in electronic repositories. If you wish
to self-archive your article, please use the
accepted manuscript version for posting on
your own website. You may further deposit
the accepted manuscript version in any
repository, provided it is only made publicly
available 12 months after official publication
or later and provided acknowledgement is
given to the original source of publication
and a link is inserted to the published article
on Springer's website. The link must be
accompanied by the following text: "The final
publication is available at link.springer.com”.

Influence of Mn doping on structural, electrical and magneticproperties of (0.90)BiFeO3–(0.10)BaTiO3 composite
Mohit Sahni • Naresh Kumar • Sushant Singh •
Aashish Jha • S. Chaubey • Manoj Kumar •
M. K. Sharma
Received: 19 January 2014 / Accepted: 1 March 2014
� Springer Science+Business Media New York 2014
Abstract Structural, electrical and magnetic properties of
chemically synthesized polycrystalline Mn doped (0.90)Bi-
FeO3–(0.10)BaTiO3 composites [(0.90)BiFe1-xMnxO3–
(0.10)BaTiO3 (x = 0.0, 0.03, 0.05 and 0.10)] were studied.
The dielectric constant was observed to decrease when fre-
quency was increased from 20 Hz to 1 MHz and increased
with the increase in temperature from 313 to 773 K. An
interesting correlation between the antiferromagnetic Neel
temperature (TN) of bismuth ferrite and temperature
dependent dielectric constant was observed. The calculated
values of activation energies were in the order of
0.25–0.74 eV (\1.0 eV) and decreases with an increase of
Mn concentration. The variation of a.c. conductivity obeyed
the Jonscher’s power law (rac � xs). The observed value of
exponent‘s’ were in the range 0.09 \ ‘s’ \ 0.78 (\1.0) for
all the sample at temperature ranging from 473 to 598 K.
There was a systematic increase in the value of spontaneous
magnetization on increasing Mn concentration.
1 Introduction
Multiferroics, the materials which show simultaneous
existence of two or more ferroic properties such as ferro-
magnetic, ferroelectric and/or ferroelastic, are of growing
interest because of their applications in multiple state
memory elements, electronic field controlled ferromagnetic
resonance devices and transducers [1–7]. Most magnetic
ferroelectrics materials tend to have low magnetic ordering
temperatures and are often antiferromagnets, in which the
magnetoelectric effect is intrinsically small.
The perovskite like BiFeO3 compound, in which the ste-
reochemical activity of the Bi lone electron pair gives rise to
ferroelectric polarization, while the partially filled 3d orbi-
tals of the Fe3? ions cause G-type antiferromagnetic order,
seems to be one of the most suitable objects for multiferroic
research in view of its high magnetic and ferroelectric
ordering temperatures (TN * 640 K, Tc * 1100 K). Bi-
FeO3 has rhombohedrally distorted perovskite structure
(R3c space group) with lattice parameters: a = 3.958 A, and
a = 89.30� [8]. G-type antiferromagnetic spin ordering in
addition to a spiral spin structure with a wavelength of
62 nm, cancels the macroscopic magnetization in bulk Bi-
FeO3 [9]. In nanoparticles and thin films, the magnetization
value is high mainly due to the limitation of size, which
destroys the long range spin structure [10–13].
Recently, several groups reported on the synthesis and
characterization of multiferroic perovskite systems such as
[BiFeO3–BaTiO3] and [PrFeO3–PbTiO3] systems [14, 15].
These solid solutions of BiFeO3–ABO3 have attracted great
attention as a means to increase structural stability,
M. Sahni (&) � N. Kumar � S. Singh � A. Jha � S. Chaubey
Department of Physics, Motilal Nehru National Institute of
Technology Allahabad, Allahabad, U.P., India
e-mail: [email protected]
N. Kumar
e-mail: [email protected]; [email protected]
M. Sahni
Department of Physics, Sharda University, Greater Noida, U.P.,
India
M. Kumar
Department of Physics and Materials Science and Engineering,
Jaypee Institute of InformationTechnology, Noida 201307, India
M. K. Sharma
Department of Applied Sciences, Amity University, Noida, U.P.,
India
123
J Mater Sci: Mater Electron
DOI 10.1007/s10854-014-1859-5
Author's personal copy

sinterability, electric and magnetic properties. In order to
improve the electrical properties while preserving the
magnetic ordering the strategy of doping BiFeO3 with
different ?3 valence ions on A, B or both A and B sites has
been adopted in recent past [16–18]. It has been observed
that such doping has resulted in the reduction of the leak-
age current density and in the improvement of the ferro-
electric properties to some extent. These doping were also
expected to shift the transition temperature towards the
room temperature [19]. According to the Shannon et al.
[20], the Mn3? (ionic radius = 0.645 A) ions can occupy
the Fe3? sites in BiFeO3 materials, because both ions have
same valence state and similar ionic size to that of Fe3?
(0.645 A). Even if there are different oxidation states of
Mn (3? , 4?) in Mn-doped BiFeO3 materials, the ionic
radii of the different oxidation states of Mn are comparable
to that of Fe3?. Consequently, the Mn ions occupy Fe sites
only. Similar types of observations have been reported by
Chung et al. [21]. The reduction in leakage current and
increase in ferromagnetic properties is expected by the
substitution of Mn in BiFeO3- based compounds. An
enhancement in magnetization in Mn-doped BiFeO3 was
20 30 40 50 60
*
(a)
2θ (degree)
Inte
nsity
(A
.U)
*
(b)
* *
(c)*
(d)
(300
)
(122
)
(018
) (214
)
(116
)
(024
)
(006
)(012
) (104
)
(202
)
*
(e)(110
)
( *Bi2 Fe4 O9 )
Fig. 1 XRD pattern for a BiFeO3, b (0.90)BiFeO3–(0.10)BaTiO3
(BFO–BTO), c (0.90)BiFe0.97Mn0.03O3–(0.10)BaTiO3 (Mn-3),
d (0.90)BiFe0.95Mn0.05O3–(0.10)BaTiO3 (Mn-5), e (0.90)BiFe0.90-
Mn0.10O3–(0.10)BaTiO3 (Mn-10) (* represents Bi2Fe4O9 phase)
Fig. 2 a-c SEM images for a (0.90)BiFe0.97Mn0.03O3–(0.10)BaTiO3, b (0.90)BiFe0.95Mn0.05O3–(0.10)BaTiO3 and c (0.90)BiFe0.90Mn0.10O3–
(0.10)BaTiO3
J Mater Sci: Mater Electron
123
Author's personal copy

also reported as result of the modification of the oxidation
state of Fe ion [22].
In the present work, the effect of Mn substitution on the
functional properties of the (0.90)BiFeO3–(0.10)BaTiO3
composites were investigated.
2 Experimental details
The BiFeO3 and Mn-doped (0.90)BiFe1-xMnxO3–
(0.10)BaTiO3 (x = 0.03, 0.05 and 0.10) nanocomposites
were synthesized by using chemical method. The precur-
sors used were 99.99 % pure (Merck) bismuth nitrate,
ferric nitrate, manganese nitrate and citric acid. Each pre-
cursor was dissolved in water separately in stoichiometric
ratio. Citric acid was used as complexing agent. The
solution of ferric nitrate and manganese nitrate were added
in bismuth nitrate solution slowly under optimized constant
stirring on a magnetic stirrer at 50 �C. After ensuring no
precipitate, the mixtures were put on a stirrer at 50 �C until
the clear solution converted to a floppy gel. The obtained
gel was placed in an oven for 8 h at 100 �C for drying. The
obtained powder was crushed and placed in furnace at
600 �C for 2 h to form a well-crystallized phase of BiFeO3.
10000 100000 10000000
50
100
150
200
250
300
350
Frequency (Hz)
BiFeO3 BFO-BTO
Mn-3 Mn-5 Mn-10
Die
letr
ic C
onst
ant
(ε)
(a)
10000 100000 10000000
1
2
3
4
5
6
tan
(δ)
Frequency (Hz)
BiFeO3 Mn-3
Mn-5 Mn-10(b)
Fig. 3 a Dielectric constant (e) as a function of frequency range from
20 Hz to 1 MHz at room temperature (315 K) for BiFeO3, (0.90)BiFeO3–
(0.10)BaTiO3, (0.90)BiFe0.97Mn0.03O3–(0.10)BaTiO3, (0.90)BiFe0.95
Mn0.05O3–(0.10)BaTiO3 and (0.90)BiFe0.90Mn0.10O3–(0.10)BaTiO3
b Dielectric loss (tand) as a function of frequency range from 20 Hz to
1 MHz at room temperature (313 K) for BiFeO3, (0.90)BiFe0.97Mn0.03-
O3–(0.10)BaTiO3 (Mn-3), (0.90)BiFe0.95Mn0.05O3–(0.10)BaTiO3(Mn-
5), (0.90)BiFe0.90Mn0.10O3–(0.10)BaTiO3 (Mn-10)
300 400 500 600 700 800
100
150
200
250
300
350
400
Die
letr
ic c
onst
ant
(ε)
Temeperature(K)
100KHz 75 KHz 50KHz 25 KHz(a)
300 400 500 600 700 800100
150
200
250
300
350
400
450
Die
letr
ic C
onst
ant
(ε)
Temperature(K)
100KHz 75KHz 50KHz 25KHz(b)
300 400 500 600 700 800
100
150
200
250
300
350
400
450
Die
letr
ic C
onst
ant
(ε)
Temperature (K)
100KHz 75KHz 50KHz 25KHz(c)
Fig. 4 Dielectric constant as a function of temperature range from
313 to 773 K at frequencies of 25, 50, 75, 100 kHz for
a (0.90)BiFe0.97Mn0.03O3–(0.10)BaTiO3 (Mn-3) b (0.90)BiFe0.95-
Mn0.05O3–(0.10)BaTiO3 (Mn-5) c (0.90)BiFe0.90Mn0.10O3–(0.10)
BaTiO3 (Mn-10)
J Mater Sci: Mater Electron
123
Author's personal copy
The BaTiO3 has been added in pure and Mn-doped BiFeO3
in stoichiometric ratio and ball-milled for 5 h. The mixture
was kept in furnace at 600 �C for 1 h in air. After calci-
nations, the pellets were prepared with organic binder
polyvinyl acetate and sintered at 700 �C for 1 h.
The structural properties of thus synthesized composites
were studied using X-ray diffraction (XRD). The XRD
patterns of the compounds were recorded at room tem-
perature using X-ray powder diffractometer with CuKaradiation (k = 1.5405 A). A ZEISS scanning electron
microscope (SEM) was used to analyze the ceramics
microstructure. For dielectric measurements the prepared
pellets were polished and their flat surfaces were coated
with silver paste and then dried at 100 �C for 30 min for
electrical measurements. The dielectric measurements of
the samples were performed by using Wayne Kerr LCR
meter (model 4300) in a wide frequency range of 20 Hz to
1 MHz and temperature range from 313 to 773 K, also the
dielectric measurements were carried out as a function of
temperature at frequencies 10, 25, 50, 75, 100 kHz and
1 MHz for all the samples. The a.c. electrical conductivity
measurements were carried out as a function of frequency
and temperature using Wayne Kerr LCR metre (model
4300). The magnetic measurements were performed by
using a magnetic property measurement system Quantum
Design SQUID Magnetometer MPMSXL-7.
3 Results and discussions
3.1 Structural analysis
BiFeO3 belongs to the family of pervovskite ABO3 type
structures. BiFeO3 has rhombohedrally distorted perovskite
structure described by the space group R3c [a = 3.95 A
and a = 89.41]. Figure 1 shows the XRD patterns of Bi-
FeO3 and Mn-doped (0.90)BiFe1-xMnxO3–(0.10)BaTiO3
(x = 0.03, 0.05 and 0.10) nanocomposites. All the peaks
were indexed by Joint Committee on Powder Diffraction
Standards card No. 861518. In case of BiFeO3, it is difficult
to synthesize in a single phase because of the low structural
stability of perovskite BiFeO3 due to volatile nature of
Bismuth [23]. In our case, we also observed weak traces of
10000 100000 10000000
50000
100000
150000
200000
-Z''(
ohm
s)
Frequency (Hz)
323K 373K 423K 473K 523K 573 K
(b)
10000 100000 10000000
50000
100000
150000
200000
-Z''(
ohm
s)
Frequency(Hz)
323K 373K 423K 473K 523K 573K
(d)
10000 100000 10000000
50000
100000
150000
200000 323K 373K 423K 473K 523K 573K
-Z''(
ohm
s)Z(ohms)
(a)
10000 100000 10000000
50000
100000
150000
200000 323K 373K 423K 473K 523K 573K
-Z''(
ohm
s)
Z(ohms)
(c)
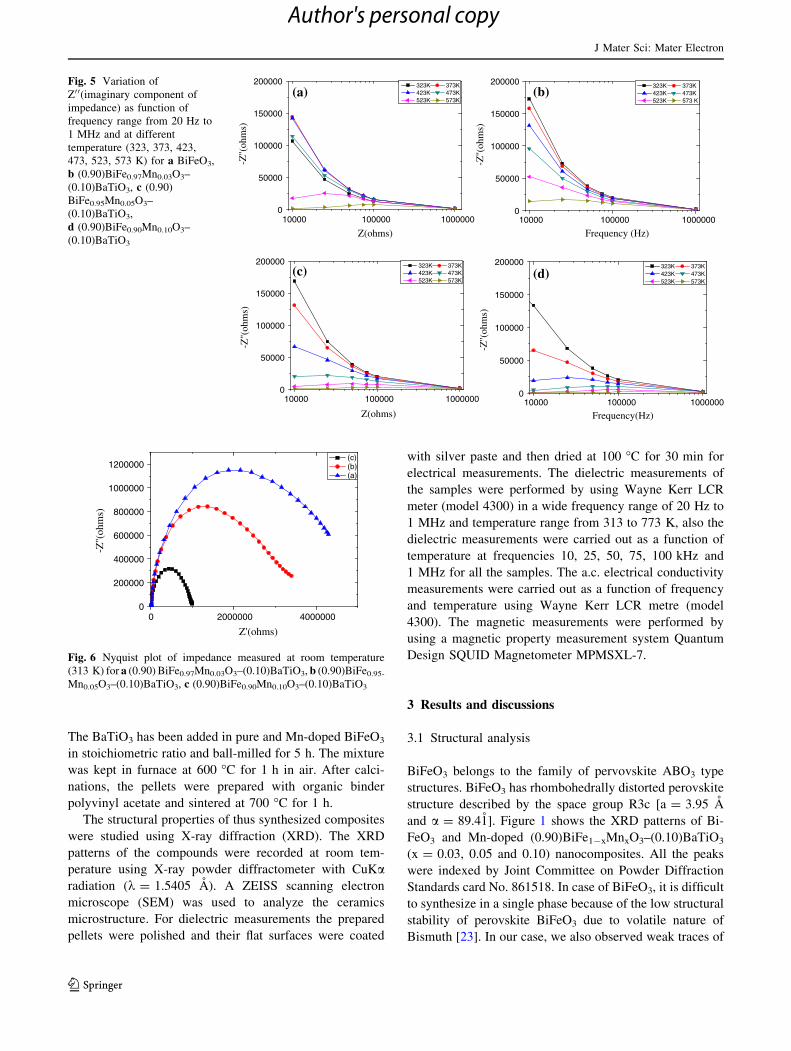
Fig. 5 Variation of
Z0 0(imaginary component of
impedance) as function of
frequency range from 20 Hz to
1 MHz and at different
temperature (323, 373, 423,
473, 523, 573 K) for a BiFeO3,
b (0.90)BiFe0.97Mn0.03O3–
(0.10)BaTiO3, c (0.90)
BiFe0.95Mn0.05O3–
(0.10)BaTiO3,
d (0.90)BiFe0.90Mn0.10O3–
(0.10)BaTiO3
0 2000000 40000000
200000
400000
600000
800000
1000000
1200000
-Z''(
ohm
s)
Z'(ohms)
(c) (b) (a)
Fig. 6 Nyquist plot of impedance measured at room temperature
(313 K) for a (0.90) BiFe0.97Mn0.03O3–(0.10)BaTiO3, b (0.90)BiFe0.95-
Mn0.05O3–(0.10)BaTiO3, c (0.90)BiFe0.90Mn0.10O3–(0.10)BaTiO3
J Mater Sci: Mater Electron
123
Author's personal copy

impurities of Bi2Fe4O9 [marked by * in XRD plot in Fig. 1]
in data of pure BiFeO3. The diffraction lines of this
impurity phase disappeared with 10 % doping of BaTiO3 in
BiFeO3. Lin et al. [19] have also been reported similar
traces of impurities in pure BiFeO3 and this impurity peak
disappears with the 15 % doping of La in BiFeO3. This
means that doping of BaTiO3 and some other rare earths
hinders the formation of second phase, as reported by
several authors [24]. The doping of Mn (x = 0.03, 0.05 and
0.10) in (0.90)BiFeO3–(0.10)BaTiO3 results in reappearing
of impurity phase. Zhenga et al. [25] have also been
reported similar impurity peaks with the doping of Mn and
Co in BiFeO3. The observed dhkl values of all diffraction
lines of BiFeO3 and Mn-doped (0.90)BiFeO3–(0.10)Ba-
TiO3 (x = 0.03, 0.05 and 0.10) suggest that the structure is
maintained to be rhombohedral and in space group R3c.
Figure 2a–c shows SEM images of (0.90)BiFe(1-x)-
MnxO3–(0.10)BaTiO3 (x = 0.03, 0.05 and 0.10) compos-
ites. The grain sizes of all the composites are nonuniform
but with the increase in Mn concentration, the grain size
decreases and the samples become denser.
3.2 Dielectric relaxation
Figure 3a and b illustrate the frequency dependence of
dielectric constant (e) and dielectric loss (tand) respectively
for BiFeO3 and (0.90)BiFe1-xMnxO3–(0.10)BaTiO3
(x = 0.0,0.03,0.05 and 0.10) composites at 313 K. All
samples display decreasing trend in dielectric constant (e)and dielectric loss (tand) with increasing frequency from
20 Hz to 1 kHz. The observation has been explained by the
phenomenon of dipole relaxation wherein at low
0 10000 20000 30000 40000 500000
50000
100000
150000
200000
-Z''(
ohm
s)
Z'(ohms)
323K 373K 398K 423K 448K 473K 498 523K
(a)
0 20000 40000 600000
50000
100000
150000
200000
-Z''(
ohm
s)
Z'(ohms)
323K 373K 398K 423K 448K 473K 498K 523K
(b)
0 20000 40000 60000 800000
50000
100000
150000-Z
''(oh
ms)
Z'(ohms)
323K 373K 398K 423K 448K 473K 498K 523K
(c)
Fig. 7 a–c Nyquist plot of impedance measured at different temperature (323, 373, 398, 423, 448 , 473, 498, 523 K) for a (0.90)BiFe0.97-
Mn0.03O3–(0.10)BaTiO3, b (0.90)BiFe0.95Mn0.05O3–(0.10)BaTiO3, c (0.90)BiFe0.90Mn0.10O3–(0.10)BaTiO3
Fig. 8 equivalent circuits that represent the electrical properties of
grains and grain boundaries
Table 1 Various calculated parameters for the Pure BiFeO3 and
(0.90)BiFe1-xMnxO3–(0.10)BaTiO3 (x = 0.03, x = 0.05 and
x = 0.10) at 313 K
Sample Rg (KX cm) Cg (pF cm-1)
(0.90) BiFe0.97Mn0.03O3–(0.10)
BaTiO3
5,030 221.4
(0.90) BiFe0.95Mn0.05O3–(0.10)
BaTiO3
3,520 156.5
(0.90) BiFe0.90Mn0.10O3–(0.10)
BaTiO3
1,000 133.8
J Mater Sci: Mater Electron
123
Author's personal copy

frequencies the dipoles are able to follow the frequency of
the applied field. In frequency region from 1 kHz to 1 MHz
the dielectric constant becomes independent of frequency,
resulting end of relaxation and is well explained by the
Maxwell–Wagner type relaxation [26, 27], often occurring
in the heterogeneous systems. The Koop’s phenomeno-
logical theory [28] postulates that the contributions of grain
and grain boundaries are effective at high and low fre-
quencies respectively. The polarization decreases with the
increase in frequency resulting decrease in dielectric con-
stant. At low frequency more energy is required for the
motion of charge carriers, thereby a higher resistance is
offered by the grain boundaries, causing higher value of
dielectric loss (tand). Similarly at high frequency low
resistance is offered by grains, resulted in lower value of
dielectric loss (tand). It has also been observed that the
dielectric loss in Mn doped (0.90)BiFeO3–(0.10)BaTiO3
samples in low frequency region is lower than BiFeO3
sample.
Figure 4a–c depict the temperature dependence of
dielectric constant at the frequencies of 25, 50, 75 and
100 kHz. It has been observed from the data that the value
of dielectric constant increases with the increase in tem-
perature for all the samples. One can also notice an
anomalous peak in dielectric constant around 600 K for all
the samples in Fig. 3a–c, which is very close to the
magnetic transition temperature (643 K) of BiFeO3. It has
also been observed this peak shift towards the lower tem-
perature side with the decrease in frequency. Singh et al.
[29] had also reported the similar kind of anomalies and
shift in (0.90)BiFeO3–(0.10)BaTiO3 composite and con-
cluded with the possibility of magnetoelectric coupling and
ferroelectric relaxor behaviour. The Landau-Devonshire
theory of phase transition predicts such types of dielectric
anomaly in magnetoelectrically ordered systems as an
influence of vanishing magnetic order on the electric order
[30]. Since there is a possibility of coupling in electric and
magnetic orderings in these materials, a change in mag-
netic ordering clearly affects the dielectric (e) constant
value.
3.3 Impedance spectroscopy
Impedance spectroscopy is a very well known technique to
study the electrical properties of polycrystalline compos-
ites. The electrical behavior of the system was studied over
a range of frequency from 10 to 1,000 kHz and temperature
from 323 to 573 K. Fig. 4a–d shows the variation of the
imaginary part of impedance -Z00 with frequency at tem-
peratures ranging from 323 to 573 K in BiFeO3 and Mn-
doped (0.90)BiFe1–MnxO3–(0.10)BaTiO3 (x = 0.03, 0.05
1.0 1.5 2.0 2.5 3.0 3.5
-10
-9
-8
-7
-6
-5
-4
-3
Ln(
σ dc)
(ohm
-1cm
-1)
10KHz 25KHz 50KHz 75KHz 100KHz 1000KHz
(b)
region I
region II
1.0 1.5 2.0 2.5 3.0 3.5-10
-9
-8
-7
-6
-5
-4
-3
Ln(
σ dc)
(ohm
-1cm
-1)
Ln(
σ dc)
(ohm
-1cm
-1)
10KHz 25KHz 50KHz 75KHz 100KHz 1000KHz
(c)
region I
region II
1.0 1.5 2.0 2.5 3.0 3.5-8
-7
-6
-5
-4
-3
-2
Ln(
σ dc)
(ohm
-1cm
-1)
1000/T(K-1) 1000/T(K-1)
1000/T(K-1)1000/T(K-1)
1000KHz 100KHz 75KHz 50KHz 25KHz 10KHz
(a)
region I
region II
1.0 1.5 2.0 2.5 3.0 3.5-10
-9
-8
-7
-6
-5
-4
-3 1000KHz 100KHz 75KHz 50KHz 25KHz 10kHz
region I
region II
(d)
Fig. 9 a–d ac conductivity
versus 1,000/T (K-1) at
different frequencies (1, 10, 25,
50, 75, 100, 1,000 kHz)
a BiFeO3,
b (0.90)BiFe0.97Mn0.03O3–
(0.10)BaTiO3,
c (0.90)BiFe0.95Mn0.05O3–
(0.10)BaTiO3,
d (0.90)BiFe0.90Mn0.10O3–
(0.10)BaTiO3
J Mater Sci: Mater Electron
123
Author's personal copy

and 0.10) composites. It has been noted from the Fig. 5a–d
that there is asymmetric variation in the lower frequency
side and becomes symmetric for higher frequency side in
entire temperatures range, revealing dominant contribution
of grain at higher frequencies It also implies the absences
of space charge effect in higher frequency region. It has
also been observed from the data that the increase in
doping concentration of Mn, decreases the magnitude of Z00
in lower frequency region, showing the effect of Mn dop-
ing on the electrical behavior of the samples. Tirupathi
et al. [31] have also found similar results in their Ca doped
BiFeO3 system and attributed to dominating the contribu-
tion of grains in high frequencies region.
It was also interesting to investigate the behavior of
grain and grain boundary effects in Mn-doped
(0.90)BiFe1–MnxO3–(0.10)BaTiO3 (x = 0.03, 0.05 and
0.10) composites. Figures 6 and 7a–c shows the plots Z0 vs
-Z00 (Nyquist plots) at room temperature (313 K) and as
function of temperature (323 to 523 K) in all Mn doped
samples. The semicircles obtained in Figs. 6 and 7a–c for
the present system may explain the contribution of grains,
grain boundaries and electrodes in electrical properties. An
equivalent circuit as shown in Fig. 8 may be used to
understand the contribution of grains, grain boundaries and
electrodes in electrical properties. In this equivalent circuit
model the distribution of electrodes is represented by the
series array of Rs and Ls and that of grains and grain
boundaries by parallel circuits of Rg, Rgb and Cg, Cgb
respectively. It has been proposed that the electrode
polarization dominates at very low frequencies and their
contribution is negligible small. The relaxation frequency
for grain and grain boundaries are inversely proportional to
their resistances and capacitances, therefore high frequency
semicircle can be identified as a bulk property from the fact
that it passes through the origin and the grain boundary
effect seems to be eliminated. The intercept of the corre-
sponding semicircle with the x axis will be used for finding
the value of the resistance for the grains (Rg). The capac-
itance (Cg) related to grain can be calculated by substitut-
ing the value of resistance of the grain (Rg) and the
frequency of maxima (fmax) in the following equation.
xs ¼ 2pfmaxRC ¼ 1 ð1Þ
The value of Cg calculated at 313 K for all the samples
is of the order of pF and decreases with the increase in Mn
concentration (Table 1). It has been observed from the
Figs. 6 and 7a–c that the diameter of the arc decreases with
the increase in Mn concentration and the temperature,
which implies decrease in resistance with increase in Mn
concentration and the temperature. Das et al. [37] also
reported similar results in Ba?2 and Gd?3 doped BiFeO3
system. According to them it may be due to thermal acti-
vated change in conductivity of the samples.Ta
ble
2A
ctiv
atio
nen
erg
y(E
a)
val
ue
for
the
Mn
do
ped
(0.9
0)B
iFe 1
-xM
nxO
3–
(0.1
0)B
aTiO
3(x
=0
.0,
0.0
3,
0.0
5,
0.1
0)
com
po
site
s
Reg
ion
1R
egio
n2
Fre
quen
cy/s
ample
s1.0
0E
?04
2.5
0E
?04
5.0
0E
?04
7.5
0E
?04
1.0
0E
?05
1.0
0E
?06
1.0
0E
?04
2.5
0E
?04
5.0
0E
?04
7.5
0E
?04
1.0
0E
?05
1.0
0E
?06
BiF
eO3
0.5
90.5
70.5
60.5
50.5
40.3
50.0
98
0.0
60.0
35
0.0
25
0.0
21
0.0
15
(0.9
0)
BiF
e 0.9
7M
n0.0
3O
3
–(0
.10)
BaT
iO3
0.7
40.6
80.6
20.5
80.5
50.2
60.0
89
0.0
58
0.0
49
0.0
41
0.0
37
0.0
1
(0.9
0)
BiF
e 0.9
5M
n0.0
5O
3
–(0
.10)
BaT
iO3
0.6
0.5
80.5
50.5
30.5
10.2
90.0
38
0.0
29
0.0
21
0.0
17
0.0
15
0.0
06
(0.9
0)
BiF
e 0.9
0M
n0.1
0O
3
–(0
.10)
BaT
iO3
0.5
40.5
30.5
10.5
0.4
90.2
50.2
40.2
30.1
20.0
84
0.0
50.0
44
J Mater Sci: Mater Electron
123
Author's personal copy

3.4 Temperature dependent conductivity
To relate the macroscopic measurement to the microscopic
movement of the ions, the conductivity measurement is
most prominent. The total conductivity in solids is gener-
ally analyzed using Jonsher power law [26] and is repre-
sented as.
r xð Þ ¼ rdc þ Axs ð2Þ
where rdc is the d.c. conductivity, ‘A’ is pre-exponential
factor and ‘s’ is the frequency component, both ‘A’ and ‘s’
are temperature and material dependent [32] .
The d.c. conductivity corresponds to the drift of charge
carriers and is well defined by Arrhenius relation [33, 34]
given below.
LnðrdcÞ ¼ Lnðr0Þ �Ea
KBTð3Þ
Where r0: pre-exponential factor and Ea: activation
energy for charge conduction.
Ln(rdc) was plotted against 1,000/T (on K scale) at
different frequencies from 10 to 1,000 kHz and the plots
are presented in Fig. 9a–d. Each plot in figures may be
divided into two regions. Region I show that the d.c.
conductivity depends on temperature but almost indepen-
dent of frequency, whereas region II shows strong depen-
dence of d.c. conductivity on frequency as compared to
temperature. The activation energy of the samples can be
calculated from the slope of the curves in both the regions
and is tabulated in Table 2. It has been observed that
activation energy decreases with increase in frequency. The
value of activation energy of the samples in region I vary
from 0.25 to 0.74 eV, and in region II the variation in
activation energy vary from 0.006 to 0.24 eV, which is
7 8 9 10 11 12-8.5
-8.0
-7.5
-7.0
-6.5
-6.0
-5.5
Ln(
σ ac)
Ln(f)
473K 498K 523K 548K 573K 598K
(b)
7 8 9 10 11 12
-9.0
-8.5
-8.0
-7.5
-7.0
-6.5
Ln (
σ ac)
Ln(f)
473K 498K 523K 548K 573K 598K
(a)
7 8 9 10 11 12
-7.5
-7.0
-6.5
-6.0
-5.5
Ln(
σ ac)
Ln(f)
473K 498K523K 548K573K 598K
(c)
Fig. 10 a–b Frequency
dependence of ac conductivity
(rac) at various temperatures
(473, 498, 523, 548, 573,
598 K) for
a (0.90)BiFe0.97Mn0.03O3–
(0.10)BaTiO3,
b (0.90)BiFe0.95Mn0.05O3–
(0.10)BaTiO3
c (0.90)BiFe0.90Mn0.10O3–
(0.10)BaTiO3
Table 3 Values of exponent ‘s’
at different temperature for
(0.90)BiFe1-xMnxO3–
(0.10)BaTiO3 (x = 0.03, 0.05
and 0.10)
Sample/
temperature
(0.90)BiFe0.97Mn0.03O3–
(0.10)BaTiO3
(0.90)BiFe0.95Mn0.05O3–
(0.10)BaTiO3
(0.90)BiFe0.90Mn0.10O3–
(0.10)BaTiO3
473 0.78 0.5 0.36
498 0.74 0.43 0.3
523 0.69 0.36 0.24
548 0.63 0.29 0.19
573 0.53 0.22 0.14
598 0.43 0.16 0.09
J Mater Sci: Mater Electron
123
Author's personal copy

very small. Mukherjee et al. [35] reported that the value of
activation energy lies between 0.35 to 0.50 eV in Y doped
BiFeO3 system. Pradhan at el. [36] has reported that the
activation energy decreases from 0.4 to 0.2 eV with the
doping of Mn in Bi0.90La0.10FeO3 system. It has been
explained that the conduction mechanism in region I may
be due to long range motion in oxygen vacancies and in
region II it may be due to short range hopping motion of
oxygen vacancies. It has also been observed that the acti-
vation energy decreases with the increase in Mn concen-
tration. Pradhan et al. [36] has reported that the electron
hoping between Mn?3 and Mn?4 ions is possible in high
permittivity perovskite ceramics. So it may be possible that
the electron hopping between Mn?3 and Mn?4 ions is one
of the explanations for this decrease in activation energy.
3.5 Frequency dependent conductivity
The frequency dependent contribution can be calculated by
subtracting the d.c. contribution from the total conductivity
represented in Eq. 2. Natural Logarithm of ac conductivity
(rac) [Ln(rac)] was plotted against natural logarithm of
frequency [Ln(f)] for all samples at temperature range from
473 to 598 K, and shown in Fig. 10a–c. It can be seen from
the figures that the conductivity remains almost constant at
lower frequencies but exhibits dispersion for higher
frequencies, this behavior is in accordance with Eq. 2. It
has also been observed that the frequency at which dis-
persion takes place shift toward higher (hopping frequency)
value with increase in temperature. The value of frequency
exponent ‘s’ was calculated from the slope of Ln(rac) vs
Ln (f) curves and is presented in Table 3. One may notice
here that this value of ‘s’ is less than unity
(0.09 \ ‘s’ \ 0.78) and decreases with increase in Mn
doping and temperature. Das et el. [37] have reported that
the value of exponent‘s’ lies between 0 \ ‘s’ \ 1 for Ba?2
and Gd?3 doped BiFeO3 systems. The electron transport
mechanism can usually be observed by the nature of var-
iation of ‘s’ and can be explained on the basis of correlated
barrier height (CBH) [38]. In CBH model, the conduction
occurs via polaron hopping process where two polarons
simultaneously hop over the potential barrier between two
charged defect states and the barrier height is correlated
-30000-20000-10000 0 10000 20000 30000
-4
-3
-2
-1
0
1
2
3
4
M (
emu/
gm)
H(Oe)
(c)
-2000 -1000 0 1000 2000
-3
-2
-1
0
1
2
3
-30000-20000-10000 0 10000 20000 30000
-3
-2
-1
0
1
2
3
M (
emu/
gm)
H(Oe)
(b)
-2000 -1000 0 1000 2000
-2
-1
0
1
2
-40000 -20000 0 20000 40000
-2.0
-1.5
-1.0
-0.5
0.0
0.5
1.0
1.5
2.0
M(e
mu/
gm)
H(Oe)
(a)
-2000 -1000 0 1000 2000
-1.5
-1.0
-0.5
0.0
0.5
1.0
1.5
Fig. 11 a–c Magnetic hysteresis loops (M–H) at 5 K for a (0.90)BiFeO3–(0.10)BaTiO3 b (0.90)BiFe0.97Mn0.03O3–(0.10)BaTiO3
c (0.90)BiFe0.90Mn0.10O3–(0.10)BaTiO3 [Inset shows the M–H loop with the maximum applied field of 1,000 Oe.]
Table 4 Spontanous magnetization and magnetic coercivity for
(0.90)BiFeO3–(0.10)BaTiO3, (0.90)BiFe1-xMnxO3–(0.10)BaTiO3
(x = 0.03, 0.10)
Samples Ms (emu/gm) Hc (Oe)
(0.90)BiFeO3–(0.10)BaTiO3 1.30 870
(0.90)BiFe0.97Mn0.03O3–(0.10)BaTiO3 2.44 980
(0.90)BiFe0.90Mn0.10O3–(0.10)BaTiO3 3.40 1,383
J Mater Sci: Mater Electron
123
Author's personal copy

with the inter-site separation via a Coulombic interaction
resulting gradually decrease of ‘s’ The conduction in Mn
doped (0.90)BiFeO3–(0.10)BaTiO3, may be attributed to
the translational type hopping of charge carriers.
3.6 Magnetic properties
The magnetization behavior of (0.90)BiFe1-xMnxO3–
(0.10)BaTiO3 (x = 0.0. 0.03. 0.10) were evaluated using a
SQUID magnetometer. M-H hysteresis loops of
(0.90)BiFe1-xMnxO3–(0.10)BaTiO3 (x = 0.0. 0.03. 0.10)
crystalline powders measured at 5 K and is shown in
Fig. 11a–c. The value of spontaneous magnetization (Ms)
has been obtained by linear extrapolation of high magne-
tization to zero field and its intercepts on the magnetization
axis. The value of spontaneous magnetization (Ms) and
coercivity (Hc) for the samples (0.90)BiFe1-xMnxO3–
(0.10)BaTiO3 (x = 0.0. 0.03. 0.10) are tabulated in
Table 4. The samples showed typical M-H hysteresis loops
for samples Mn (x = 0.0, 0.03 and 0.10). The Ms and Hc
increases with the increase in doping percentage of Mn
(x = 0.0, 0.03, 0.10). The pure BiFeO3 have antiferro-
magnetic ordering [39], whereas the ferromagnetism in
BaTiO3- rich compositions may be due to structural dis-
tortion [40] and statistical distributions of Fe3? and Ti4?
ions in the octahedral sites of BiFeO3–BaTiO3 [41]. Sos-
nowska et al. [42] have also reported increase in magne-
tization in BiFe1-xMnxO3 polycrystalline samples, by
claiming that the spiral G-type antiferromagnetic spin
structure of BiFeO3 shifts towards a collinear G-type
antiferromagnetic structure with increasing Mn concentra-
tion. Such suppression of the spiral spin structure will
subsequently result in weak ferromagnetism in such com-
posites [36].
4 Conclusion
A polycrystalline BiFeO3 and Mn doped (0.90)BiFe1-x-
MnxO3–(0.10)BaTiO3 (x = 0.0, 0.03 and 0.10) were suc-
cessfully synthesized. X-ray structural analysis shows the
phase formation of the materials. SEM images shows
decrease of grain size with the increase in Mn concentra-
tion. Both dielectric constant and dielectric loss decreases
with frequency following Maxwell–Wagner type relaxa-
tion. The anomaly in dielectric constant versus temperature
plot at around 600 K shows magnetodielectric coupling.
The calculated value of activation energy were found to
decrease with Mn doping, and may attribute due to electron
hopping between Mn?3 and Mn?4 ions. The grain resis-
tance and capacitance observed to decreases with the
increase in temperature for all the composites and an
equivalent circuit was used to explain the phenomena. The
value of frequency exponent ‘s’ decreased with increase in
temperature for all Mn doped samples which corresponds
to a large polaron hopping type conduction mechanism. Mn
(x = 0.0, 0.03, 0,10) doped samples show magnetization
and the value of spontaneous magnetization increases with
the increase in Mn concentration. This may be due to the
further suppression of spin cycloid in BiFeO3 and different
superexchange pathways owing to the occupation of both
Mn ion and Fe ion at the same lattice sites.
Acknowledgments M.S is greatful to the Sharda University of India
for providing financial support and leave for carrying out this work at
Motilal Nehru National Institute of Technology Allahabad. N.K is
thankful to Department of Science and Technology, Government of
India for funding (SR/FTP/PS-04/2008) and director MNNIT for the
support. N.K also acknowledges consistent support provided by the
Director MNNIT Allahabad and Centre for Interdisciplinary Research
(CIR) MNNIT Allahabad for the access of centered research facilities.
M.K is thankful to National Facility installed in Magnetics &
Advanced Ceramics Laboratory at IIT Delhi for magnetic
measurements.
References
1. S.W. Cheong, M. Mostovoy, Nat. Mater. 6, 13 (2007)
2. W. Eerenstein, N.D. Mathur, J.F. Scott, Nature 442, 759 (2006)
3. J.W. Kim, D.C. Yoon, M.S. Jeon, D.W. Kang, J.W. Kim, H.S.
Lee, Curr. Appl. Phys. 10, 1297 (2010)
4. N. Nuraje, X. Dang, J. Qi, M.A. Alen, Y. Lei, A.M. Belcher, Adv.
Mater. 24, 2885 (2012)
5. J. Wang, J.B. Neaton, H. Zheng, V. Nagarajan, S.B. Ogale, B.
Liu, D. Viehland, V. Vaithyanathan, D.G. Schlom, U.V. Wagh-
mare, N.A. Spaldin, K.M. Rabe, M. Wuttig, R. Ramesh, Science
299, 1719 (2003)
6. G. J. Mac Dougall, H. M. Christen, W. Siemons, M. D. Biegalski,
J. L. Zarestky, S. Liang, E. Dagotto, S. E. Nagler, Phys. Rev. B
85, 100406 (R) (2012)
7. J. Dho, X. Qi, H. Kim, J.L. MacManus-Driscoll, M.G. Blamire,
Adv. Mater. 18, 1445 (2006)
8. F. Kubel, H. Schmid, Acta Crystallogr. B 46, 698 (1990)
9. P. Fischer, M. Polomska, I. Sosnowska, M. Szymanski, J. Phys.
Solid State Phys. 13, 1931 (1980)
10. F. Gao, Y. Yuan, F.K. Wang, Y.X. Chen, F. Chen, J.-M. Liu, F.Z.
Ren, Appl. Phys. Lett. 89, 102506 (2006)
11. Y. Du, X.Z. Cheng, X.S. Dou, J.D. Attard, L.X. Wang, J. Appl.
Phys. 109, 073903 (2011)
12. R. Mazumder, S.P. Devi, D. Bhattacharya, P. Choudhary, A. Sen,
M. Raja, Appl. Phys. Lett. 91, 062510 (2007)
13. L. Fang, J. Lui, S. Ju, F. Zheng, W. Dong, M. Shen, Appl. Phys.
Lett. 242501 (2010)
14. J.S. Kim, C.I. Cheon, H.S. Shim, P.W. Jang, Jpn. J. Appl. Phys.
40, 5653 (2001)
15. J.S. Kim, C.I. Cheon, C.H. Lee, P.W. Jang, J. Appl. Phys. 96, 468
(2004)
16. F. Chang, N. Zhang, F. Yang, S. Wang, G. Song, J. Phys. D Appl.
Phys. 40, 7799–7803 (2007)
17. V.A. Khomchenko, D.A. Kiselev, J.M. Vieira, L. Jian, A.L.
Kholkin, A.M.L. Lopes, Y.G. Pogorelov, J.P. Araujo, M. Ma-
glione, J. Appl. Phys. 103, 024105 (2008)
18. M. Kumar, K.L. Yadav, Appl. Phys. Lett. 91, 112911 (2007)
19. Y.H. Lin, Q. Jiang, Y. Wang, C.W. Nan, L. Chen, J. Yu, Appl.
Phys. Lett. 90, 172507 (2007)
J Mater Sci: Mater Electron
123
Author's personal copy

20. R.D. Shannon, Acta Crystallogr. Sect. A: Cryst. Phys. Diffr.
Theor. Gen. Crystallogr. 32, 751 (1976)
21. C.F. Chung, J.P. Lin, J.M. Wu, Appl. Phys. Lett. 88, 242909
(2006)
22. V.R. Palkar, C. Darshan, C. Kundaliya, S.K. Malik, J. Appl. Phys.
93, 4337–4339 (2003)
23. Y.P. Wang, L. Zhou, M.F. Zhang, X.Y. Chen, J.M. Liu, Z.G. Liu,
Appl. Phys. Lett. 84, 1731 (2004)
24. Z.X. Cheng, A.H. Li, X.L. Wang, S.X. Dou, K. Ozawa, H.
Kimura, S.J. Zhang, T.R. Shrout, J. Appl. Phys. 103, 07E507
(2008)
25. X. Zhenga, Q. Xua, Z. Wenb, X. Langa, D. Wub, T. Qiua, M.X.
Xua, J. Alloys Compd. 499, 108–112 (2010)
26. X.J. Zhang, Y.J. Dai, W. Lu, W.L.H. Chan, B. Wu, X.D. Li, J.
Phys. D Appl. Phys. 41, 235405 (2008)
27. X.J. Zhang, Y.J. Dai, W.L.H. Chan, J. Appl. Phys. 107, 104105
(2010)
28. C.G. Koops, Phys. Rev. 83(1), 121–124 (1951)
29. A. Singh, V. Pandey, R.K. Kotnala, D. Pandey, Phys. Rev. Lett.
101, 247602 (2008)
30. L. Benguigui, Solid State Commun. 11, 825 (1972)
31. P. Tirupathi, A Chandra. Phys. Status Solidi. B 249(8),
1639–1645 (2012)
32. A.K. Jonscher, Nature (London) 264, 673 (1977)
33. K.H. Kim, J.Y. Gu, H.S. Choi, G.W. Park, T.W. Noh, Phys. Rev.
Lett. 77, 1877 (1996)
34. A. Molak, M. Paluch, S. Pawlus, J. Klimontko, Z. Ujma, I.
Gruszka, J. Phys. D Appl. Phys. 38, 1450 (2005)
35. A. Mukherjee, S. Basu, G. Chakraborty, M. Pal, J. Appl. Phys.
112, 014321 (2012)
36. Dilip K. Pradhan, R.N.P. Choudhary, C. Rinaldi, R.S. Katiyar, J.
Appl. Phys. 106, 024102 (2009)
37. Rajasree Das, Tanushree Sarkar, K Mandal. J. Phys. D Appl.
Phys. 45, 455002 (2012)
38. K. Prasad, S. Bhagat, K. Amarnath, S.N. Choudhary, K.L. Yadav,
Mater. Sci. Poland 28, 317 (2010)
39. A.K. Pradhan, K. Zhang, D. Hunter, J.B. Dadson, G.B. Loutts, P.
Bhattacharya, R. Katiyar, J. Zhang, D.J. Sellmyer, U.N. Roy, Y.
Cui, A. Burger, J. Appl. Phys. 97, 093903 (2005)
40. M.H. Kumar, S. Srinath, G.S. Kumar, S.V. Suryanarayana, J.
Magn. Magn. Mater. 188, 203 (1998)
41. G.A. Gehring, Ferroelectrics 61, 275 (1994)
42. I. Sosnowska, W. Schafer, W. Kockelmann, K. H. Anderson, I.
O. Troyanchuk, Appl. Phys. A: Mater. Sci. Process. A 74, S1040
(2002)
J Mater Sci: Mater Electron
123
Author's personal copy
Copyright © 2022 FDOKUMEN