Effect of structural transition on magnetic and optical properties of Ca and Ti co-substituted...
10
Effect of structural transition on magnetic and dielectric properties of La and Mn co-substituted BiFeO 3 ceramics Pawan Kumar, Manoranjan Kar * Department of Physics, Indian Institute of Technology Patna, Patna 800013, India highlights graphical abstract Secondary phase formation has been suppressed for x > 0.025 of Bi 1x La x Fe 1x Mn x O 3 . Crystallographic phase transition from rhombohedral symmetry to orthorhombic. 5% co-substituted sample exhibit enhanced M r as 15 times than that of BiFeO 3 . Frequency independent dielectric constant and loss for 5% of co- substitution. article info Article history: Received 17 April 2014 Received in revised form 25 August 2014 Accepted 6 September 2014 Available online 1 October 2014 Keywords: Ceramics Solegel growth Magnetic properties Dielectric properties abstract Bi 1x La x Fe 1x Mn x O 3 (x ¼ 0.000e0.300) ceramics prepared by the tartaric acid modified solegel tech- nique have been studied to analyze the effect of composition driven structural transition on the magnetic properties of bismuth ferrite (BiFeO 3 ). It was found that the co-substitution of La & Mn at Bi & Fe sites leads to suppression of impurity phases (Bi 2 Fe 4 O 9 and Bi 25 FeO 40 ) which generally appear in BiFeO 3 . The quantitative crystallographic phase analysis has been carried out by double phase Rietveld analysis of all the XRD patterns which indicates the existence of compositional driven crystal structure transformation from rhombohederal (space group R3c) to the orthorhombic (space group Pbnm) with the increase in substitution concentration. The 5% co-substituted sample exhibit high remnant magnetization i.e. about 15 times that of BiFeO 3 which is due to the suppression of cycloid spin structure and enhanced canting angle of antiferromagnetically ordered spins caused by the crystal lattice distortion. However, further increase in substitution results in the reduction of remnant magnetization and coercivity due to the appearance of complete antiferromagnetic ordering in the orthorhombic structure because of the sig- nificant contribution from the crystallographic phase of Pbnm space group (as obtained from double phase Rietveld analysis). The frequency independent higher dielectric constant and lower dielectric loss were observed for 5% co-substitution. Hence, this particular composition may be interesting for device applications. © 2014 Elsevier B.V. All rights reserved. 1. Introduction Magnetoelectric Multiferroic materials showing both electric as well as magnetic ordering within a single crystallographic phase are attracting much attention due to their promising technological applications, such as multistate memory devices, spintronic de- vices, magnetically modulated transducers, ultrafast optoelectronic * Corresponding author. E-mail addresses: [email protected], [email protected] (M. Kar). Contents lists available at ScienceDirect Materials Chemistry and Physics journal homepage: www.elsevier.com/locate/matchemphys http://dx.doi.org/10.1016/j.matchemphys.2014.09.007 0254-0584/© 2014 Elsevier B.V. All rights reserved. Materials Chemistry and Physics 148 (2014) 968e977
-
Upload
independent -
Category
Documents
-
view
2 -
download
0
Transcript of Effect of structural transition on magnetic and optical properties of Ca and Ti co-substituted...

lable at ScienceDirect
Materials Chemistry and Physics 148 (2014) 968e977
Contents lists avai
Materials Chemistry and Physics
journal homepage: www.elsevier .com/locate/matchemphys
Effect of structural transition on magnetic and dielectric properties ofLa and Mn co-substituted BiFeO3 ceramics
Pawan Kumar, Manoranjan Kar*
Department of Physics, Indian Institute of Technology Patna, Patna 800013, India
h i g h l i g h t s
* Corresponding author.E-mail addresses: [email protected], mano_iitg@yah
http://dx.doi.org/10.1016/j.matchemphys.2014.09.0070254-0584/© 2014 Elsevier B.V. All rights reserved.
g r a p h i c a l a b s t r a c t
� Secondary phase formation has beensuppressed for x > 0.025 ofBi1�xLaxFe1�xMnxO3.
� Crystallographic phase transitionfrom rhombohedral symmetry toorthorhombic.
� 5% co-substituted sample exhibitenhanced Mr as 15 times than that ofBiFeO3.
� Frequency independent dielectricconstant and loss for 5% of co-substitution.
a r t i c l e i n f o
Article history:Received 17 April 2014Received in revised form25 August 2014Accepted 6 September 2014Available online 1 October 2014
Keywords:CeramicsSolegel growthMagnetic propertiesDielectric properties
a b s t r a c t
Bi1�xLaxFe1�xMnxO3 (x ¼ 0.000e0.300) ceramics prepared by the tartaric acid modified solegel tech-nique have been studied to analyze the effect of composition driven structural transition on the magneticproperties of bismuth ferrite (BiFeO3). It was found that the co-substitution of La & Mn at Bi & Fe sitesleads to suppression of impurity phases (Bi2Fe4O9 and Bi25FeO40) which generally appear in BiFeO3. Thequantitative crystallographic phase analysis has been carried out by double phase Rietveld analysis of allthe XRD patterns which indicates the existence of compositional driven crystal structure transformationfrom rhombohederal (space group R3c) to the orthorhombic (space group Pbnm) with the increase insubstitution concentration. The 5% co-substituted sample exhibit high remnant magnetization i.e. about15 times that of BiFeO3 which is due to the suppression of cycloid spin structure and enhanced cantingangle of antiferromagnetically ordered spins caused by the crystal lattice distortion. However, furtherincrease in substitution results in the reduction of remnant magnetization and coercivity due to theappearance of complete antiferromagnetic ordering in the orthorhombic structure because of the sig-nificant contribution from the crystallographic phase of Pbnm space group (as obtained from doublephase Rietveld analysis). The frequency independent higher dielectric constant and lower dielectric losswere observed for 5% co-substitution. Hence, this particular composition may be interesting for deviceapplications.
© 2014 Elsevier B.V. All rights reserved.
oo.com (M. Kar).
1. Introduction
Magnetoelectric Multiferroic materials showing both electric aswell as magnetic ordering within a single crystallographic phaseare attracting much attention due to their promising technologicalapplications, such as multistate memory devices, spintronic de-vices, magnetically modulated transducers, ultrafast optoelectronic

20 30 40 50 60 70
*
* = Bi Fe O
X= 0.000
*
(300
)(2
14)
(018
)
(122
)(1
16)
(024
)
(202
)(0
06)
(113
)
(110
)(1
04)
(012
)
*
X= 0.015
X= 0.025
X= 0.050
X= 0.075
X= 0.100
X= 0.150
X= 0.200
X= 0.250
Bi1-xLaxFe1-xMnxO3
2 (Degree)
Inte
nsity
(A.U
.)
X= 0.300
Fig. 1. XRD patterns of Bi1�xLaxFe1�xMnxO3 ceramics for x ¼ 0.000e0.300. The BiFeO3
has been indexed to R3c space group.
P. Kumar, M. Kar / Materials Chemistry and Physics 148 (2014) 968e977 969
devices and sensors [1e4]. However, these kinds of materials arerare because ferroelectric ordering in ABO3 perovskite needs tran-sition metal ions with d0 electronic configuration, whereas mag-netic ordering needs transition metals with partially filledd orbitals, but these two conditions within single crystal phase aremutually exclusive. Among all the identified single-phase magne-toelectric materials, BiFeO3 (BFO) is most promising one because itshows both electric and G-type canted antiferromagnetic orderingwell above room temperature (Tc ¼ 1103 K and TN ¼ 643 K) [5]. Thecrystal structure for polar phase of BFO (at room temperature) isrhombohederally distorted perovskite structure with R3c spacegroup. The R3c symmetry allows the existence of weak ferromag-netic moment due to DzyaloshinkyeMoriya interaction but thecycloid spin structure with the periodicity of ~62 nm prevents netmagnetization which leads to net zero magnetization [6e9].However, BFO is very difficult to be prepared in phase pure ce-ramics or thin film because of its narrow temperature range ofphase stabilization. It results in oxygen vacancies, multiple valencestate of Fe ions and synthesis of impurity phase as Bi2Fe4O9 andBi25FeO40 which increases the leakage currents and make it un-suitable for the device applications. From the literature survey, ithas been observed that the A-site and/or B-site substitution in BFOhas been reported as the most effective way to reduce the impurityphases and enhance magnetoelectric coupling constant by creatingthe lattice strain due the ionic size mismatch between host andsubstituting cations [10e15]. Several attempts have also beenmadeto prepare phase pure BFO by chemical route and the solid stateroutes followed by leaching with nitric acid normally used toeliminate above impurity phases which leads to the formation ofcoarser powders and its poor reproducibility [16,17]. Hence, wehave adopted the chemical route of synthesis for uniform particlesize and better reproducibility.
The cycloid suppression in Lanthanum (La) substituted BFOceramics has been shown using nuclear magnetic resonance (NMR)measurements which was correlated with the structural transitionfrom rhombohedral to orthorhombic crystal structure [10,14,15].Weak ferromagnetic ordering induced due to La substitution at A-site in BFO has been observed by Y. Du et al. [18]. The Mn substi-tution at Fe site of BFO is reported to inhibit the grain growthwhichresulted in reduced particle size [19] and improve the magnetic aswell as electric properties [20,21]. S. Chauhan et al. has reported thestructural phase transition in 15% Mn doped BFO ceramics due tothe distortion in the rhombohedral structure with increasing Mnsubstitution which resulted in significant enhancement inmagnetization [22]. B. Li et al. have reported the weak ferromag-netism in Bi0.9La0.1Fe0.95Mn0.05O3 nanofibers which exhibited alarger Ms value owing to the canting of antiferromagnetically or-dered spins and an increase in ferromagnetic ordering [23]. A.Lahmar et al. have reported the structural transition and improveddielectric as well as ferroelectricity in BiFeO3eLaMnO3 solid solu-tion thin films grown on Pt-terminated silicon substrates up to 10%substitution concentration [24] which induces structural changesto orthorhombic structures.
However, a detailed study of the influence of crystal structuraltransition on physical properties is yet to be explained on La andMn co-substituted BFO ceramics. Hence, we have undertaken astudy on La and Mn co-substituted BFO prepared by the tartaricacid modified solegel method and carry out double phase Rietveldanalysis to study the crystallographic phases and its correlationwith the physical properties.
2. Methods
Bi1�xLaxFe1�xMnxO3 with x ¼ 0.000, 0.015, 0.025, 0.050, 0.100,0.150, 0.200, 0.250 and 0.300 (named as BFO, BLFM-015, BLFM-025,
BLFM-05, BLFM-10, BLFM-15, BLFM-20, BLFM-25 and BLFM-30respectively) were prepared by a tartaric acid modified solegeltechnique [25]. Here, the starting materials as bismuth nitrate, ironnitrate, lanthanum acetate, manganese acetate and tartaric acid(purity � 99.0%) were carefully weighted in stoichiometric pro-portion. The molar ratio of metal nitrates to tartaric acid of 1:2 wastaken because there were two cations in BFO. The tartaric acid playsan important role in the process of forming pure and co-substitutedBiFeO3 nanoparticles and carboxyl in tartaric acid makes bondswith all metal cations present in the solvent. Hence, the obtainedpowder exists as amorphous precursors before calcinations. Whenthey are heated, a driving force for the nucleation is related toreduction of free energy due to transformation from the metastableamorphous to the crystalline state in equilibrium and tartaric acidvaporizes in the annealing process and the M�O bonds are brokenfollowing by the nucleation and crystal growth of small and uni-form nanoparticles [26]. The resulting material was thoroughlygrinded and annealed at 700 �C for 3 h.
The crystallographic phases of all the ceramics were studied bythe powder X-ray diffraction (XRD) using 18 kW Cu-rotating anodebased Rigaku TTRX III diffractometer, Japan) with CuKa radiation(l ¼ 1.5418 Å) operating in the BraggeBrentano geometry in a 2qrange of 10�e120� at a scan step of 0.01� (counting time for eachstep was 2.0 s). The microstructural properties and elementalanalysis were investigated by using Field Emission Scanning Elec-tron Microscopy (FE-SEM) (Hitachi S-4800, Japan) operating at anaccelerating voltage of 10 kV and equipped with energy-dispersiveX-ray spectroscopic capability. Room temperature Raman spectrawere studied in the backscattering geometry using confocal micro-Raman spectrometer (Seki Technotron Corp., Japan) with the514.5 nm laser line as excitation source by STR 750 RAMAN Spec-trograph using a 100� microscope. Fourier Transform InfraredSpectra (FT-IR) were recorded at room temperature using the Per-kin Elmer (model 400) in the range from 350 to 1200 cm�1. Thediffuse reflectance spectroscopy has been carried out by usingLAMBDA 35 UVevisible spectrophotometer in the range from 200to 1100 nm. Room temperature magnetization e magnetic field(MeH) measurement for all the ceramics were carried out bymagnetic properties measurement system (MPMS), QuantumDesign Inc., USA in the applied magnetic field of maximum±80 kOe. The parallel plane surfaces of pellets were coatedwith thesilver paste for dielectric measurement. The dielectric constant and

Inte
nsity
(A.U
.)
Bi1-xLaxFe1-xMnxO3
X= 0.250
X= 0.300
X= 0.200
X= 0.100
X= 0.150
X= 0.075
X= 0.050
P. Kumar, M. Kar / Materials Chemistry and Physics 148 (2014) 968e977970
loss measurement were performed using the impedance analyzer(N4L PSM 1735) in the frequency range of 500 Hze5 MHz at theroom temperature (30 �C).
All XRD patterns were analyzed employing Rietveld refinementtechnique with the help of Fullprof suite program [27]. The pat-terns for all the ceramics could be refined using the R3c and/orPbnm space groups. The parameters such as, Zero correction, scalefactor, half width parameters, lattice parameters, atomic fractionalposition coordinates, thermal parameters were varied duringrefinement process. Background and peak shape were refined bythe sixth order polynomial and pseudo-voigt functionrespectively.
29 30 31 32 33 34 35 362 (Degree)
X= 0.015
X= 0.025
X= 0.000(110
)
(104
)
Fig. 2. Shift in the XRD patterns of Bi1�xLaxFe1�xMnxO3 ceramics for x ¼ 0.000e0.300.
3. Results and discussion
Fig. 1 shows the XRD patterns of the present ceramics. It isimportant to note that small amount of Bi2Fe4O9 and Bi25FeO40impurities were observed along with the BFO phase for co-substituted ceramics with co-substitutions up to 2.5%. It indicatesthat the co-substitution of La & Mn has suppressed the impurityphase formation in the BLFM ceramics which is the main concernfor single phase BFO because Bi and/or Fe vacancies lead to for-mation of these impurity phases [28]. The distinct peaks corre-sponding to the planes (104) and (110); (006) and (202); (116) and(122); (018) and (300) around 32�, 39�, 51� and 57� respectivelymerge into single peak with the increase in the La and Mn con-centration, which is clearly visible higher co-substitutions (�5%).Also, the intensity of a peak corresponding to the planes (006) ataround 39� which originates from the rhombohedral structurebecame weaker with the increase in co-substitution. These resultsindicate the compositional driven crystallographic phase transitionfrom rhombohedral to orthorhombic which is consistent with theRietveld analysis as discussed below. The Goldschmidt tolerancefactor (t) is used to quantify the structural stability of ABO3 (BiFeO3)structure (perovskites) which is defined as.
t ¼ ð< rA > þ roÞffiffiffi2
p �< rB > þ ro
� (1)
The <rA> and <rB> in equation (1) are the average radius of A siteand B site cations respectively and ro is the ionic radius of oxygen.When the value of “t” is smaller than one (mentioned in Table 1),the compressive strain acts on the FeeO bonds and hence on BieObondswhich infers that the oxygen octahedral must buckle in orderto have minimum lattice strain. This induced lattice distortionsuppresses the rhombohedral phase and leads to the evolution ofmodified crystallographic phases. The particle size has beencalculated using Scherrer's formula [29] which is defined as,
Table 1Structural parameters of Bi1�xLaxFe1�xMnxO3 (for x ¼ 0.000e0.300) ceramicsannealed at 700 �C. Where, x ¼ substitution value, D ¼ crystallite size, t ¼ tolerancefactor, c2 ¼ Chi-square (goodness of fit).
X D FeeOeFe angle (R3c) V (Å3) (R3c) t c2
0.000 82.49 154.487 372.470 0.8888 1.490.015 76.52 154.820 371.050 0.8886 1.470.025 50.78 155.215 370.034 0.8885 1.420.050 45.90 156.626 369.003 0.8884 1.310.100 33.50 161.906 367.140 0.8883 1.370.150 31.02 167.402 363.430 0.8881 1.220.200 35.82 166.852 370.851 0.8879 1.340.250 37.32 165.220 371.004 0.8877 1.220.300 39.14 160.001 372.410 0.8875 1.30
D ¼ klb cos q
(2)
Where constant k depends upon the shape of the crystallite size(¼0.89, assuming the spherical particles), b ¼ Full width at HalfMaximum (FWHM) of Intensity (a.u.) vs. 2q profile, l is the wave-length of the Cu Ka radiation (¼ 0.1542 nm), q is the Bragg'sdiffraction angle and D is the crystallite size. Here, the value ofFWHM has been used from Rietveld refinement of correspondingXRD patterns. The observed FWHM has been corrected by consid-ering the instrumental broadening (b ¼
ffiffiffiffiffiffiffiffiffiffiffiffiffiffiffiffiffiffiffiffiffiffiffib2obs � b2ins
q,
bobs ¼ Observed FWHM and bins¼ Instrumental FWHM). Accordingto Rietveld method [30], the individual contributions to thebroadening of reflections can be expressed as,
FWHM2 ¼�U þ D2
ST
�tan2 q
��þ Vðtan qÞ þW þ IG
cos2 q(3)
where U, V and W are the usual peak shape parameters, IG is ameasure of the isotropic size effect, DST ¼ coefficient related tostrain. As shown in Table 1, the crystallite size decreases with theincrease of substituent ion concentration up to co-substitution of15%. This implies the development of lattice strain inside the lat-tice due to ionic size mismatch between host and substituentcations which lead to local structural disorder and reduces the rateof nucleation resulting in decrease of crystallite size. However, thecrystallite size increases when substitution concentration in-creases beyond 15% of co-substitution due to decrease in overalllattice strain decreases. The lattice constants and correspondingunit cell volume decreases with the increase in the substituentconcentration due to smaller radius of substituents than that ofhost cations, which can be inferred from the shift of the XRD peaktowards higher 2q value as shown in Fig. 2. However, their valuesincreases when co-substitution concentration increases beyond15% (near MPB) because the orthorhombic phase becomes domi-nant and overall lattice strain decrease. The gradual shift in XRDpeak indicates that the substituents get substituted in the BFOlattice.
The rhombohedral phase was considered for the Rietveldrefinement of BFO XRD pattern because it has the characteristicdoublet of highest intensity peaks but it merges for the co-

Table 2Fractional atomic coordinates for the Rietveld refinement of XRD patterns ofBi0.950La0.050Fe0.950Mn0.050O3.
Spacegroup
R3c Pbnm
Bi/Ca 6a (0, 0, 0) 4c (0.9976(7), 0.0232(5),0.2500(3))
Fe/Mn 6a (0, 0, 0.2172(5) 4b (0.5000(2), 0.0000(5),0.0000(1))
O(1) 18b (0.4579(3), 0.0264(7)0.9497(0))
4c (0.0661(4), 0.4799(7),0.2500(3))
O(2) 8d (0.7271(5), 0.2826(4),0.0313(7))
P. Kumar, M. Kar / Materials Chemistry and Physics 148 (2014) 968e977 971
substituted BFO which suggests the presence of modified crystal-lographic symmetry. Rigorous fitting with the different structuralmodels (R3c, R3c þ Pbnm, R3c þ P4mm, R3c þ Pm3m, R-3c þ Pbnm,etc.) showed that the observed XRD patterns of co-substituted ce-ramics are a result of the superposition of two spectral contribu-tions (R3c þ Pbnm). It is worth noting that we have not gotsatisfactory results by taking a single space group in Rietveldrefinement of XRD patterns of co-substituted ceramics. The typicalRietveld refined XRD patterns for BLFM-05 and BLFM-10 has beenshown in Fig. 3(a) and (b) respectively. The fractional atomic co-ordinates for the Rietveld refinement of XRD patterns of BLFM-05and respective contribution of both crystallographic phases hasbeen given in Tables 2 and 3 respectively. The crystallographicphase contribution of Pbnm space group increases with the increasein the co-substitution percentage.
Typical FE-SEM images are shown in Fig. 4(a) and (b) for BLFM-025 and BLFM-05 respectively. Average crystallite sizes are found tobe 52 and 45 nm (close to the values obtained from XRD patterns)for BLFM-025 and BLFM-05 respectively. The elemental analysis forall the samples were carried out using the EDS analysis. Typical EDSpattern of ceramics BLFM-025 and BLFM-05 have been shown inFig. 4(c) and (d). The EDS analysis suggests the presence of Bi, Fe, La,Mn and O elements in the co-substituted ceramics and it showedthe atomic ratio of A site (Bi/La) and B site (Fe/Mn) cations isapproximately 1:1. No extra peaks have been traced which indicatethat there is no contamination in the ceramics. However, ratio of A
Fig. 3. Rietveld refined XRD patterns of Bi1�xLaxFe1�xM
site/B site and O site ions is found to be around 1:2.94 instead of 1:3.It suggests the presence of oxygen vacancies in the sample whichhas been reflected in our dielectric measurement as discussed inthe later section.
Since Raman Spectroscopy is sensitive to the atomic displace-ments, we have carried out Raman spectroscopy in order to furtherinvestigate the structural transition. Eighteen (18) optical phononmodes: 4A1þ5A2þ9E for BiFeO3 at room temperature have beenpredicted using theoretical group analysis [31]. The A1 and E modesare both Raman and IR-active modes, whereas the A2 modes areRaman and IR inactivemodes.Where, A1modes are polarized alongz-axis and E modes in xey plane. By fitting the measured spectra
nxO3 ceramics for (a) x ¼ 0.050 and (b) x ¼ 0.100.
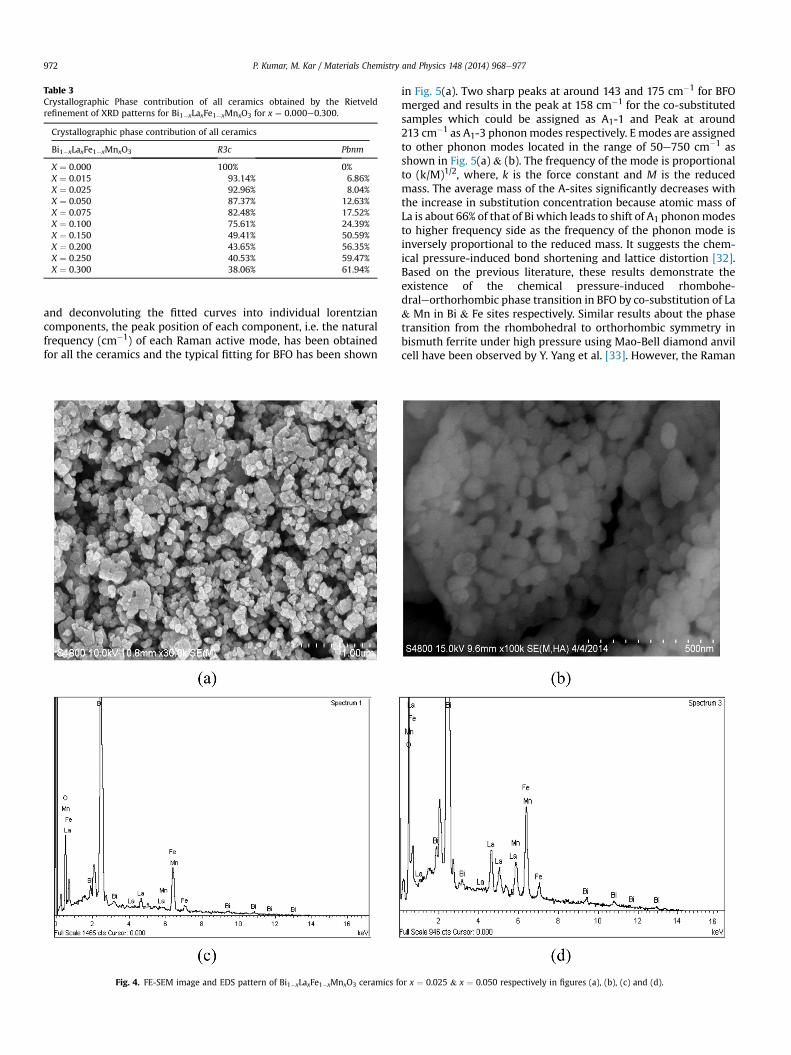
Table 3Crystallographic Phase contribution of all ceramics obtained by the Rietveldrefinement of XRD patterns for Bi1�xLaxFe1�xMnxO3 for x ¼ 0.000e0.300.
Crystallographic phase contribution of all ceramics
Bi1�xLaxFe1�xMnxO3 R3c Pbnm
X ¼ 0.000 100% 0%X ¼ 0.015 93.14% 6.86%X ¼ 0.025 92.96% 8.04%X ¼ 0.050 87.37% 12.63%X ¼ 0.075 82.48% 17.52%X ¼ 0.100 75.61% 24.39%X ¼ 0.150 49.41% 50.59%X ¼ 0.200 43.65% 56.35%X ¼ 0.250 40.53% 59.47%X ¼ 0.300 38.06% 61.94%
P. Kumar, M. Kar / Materials Chemistry and Physics 148 (2014) 968e977972
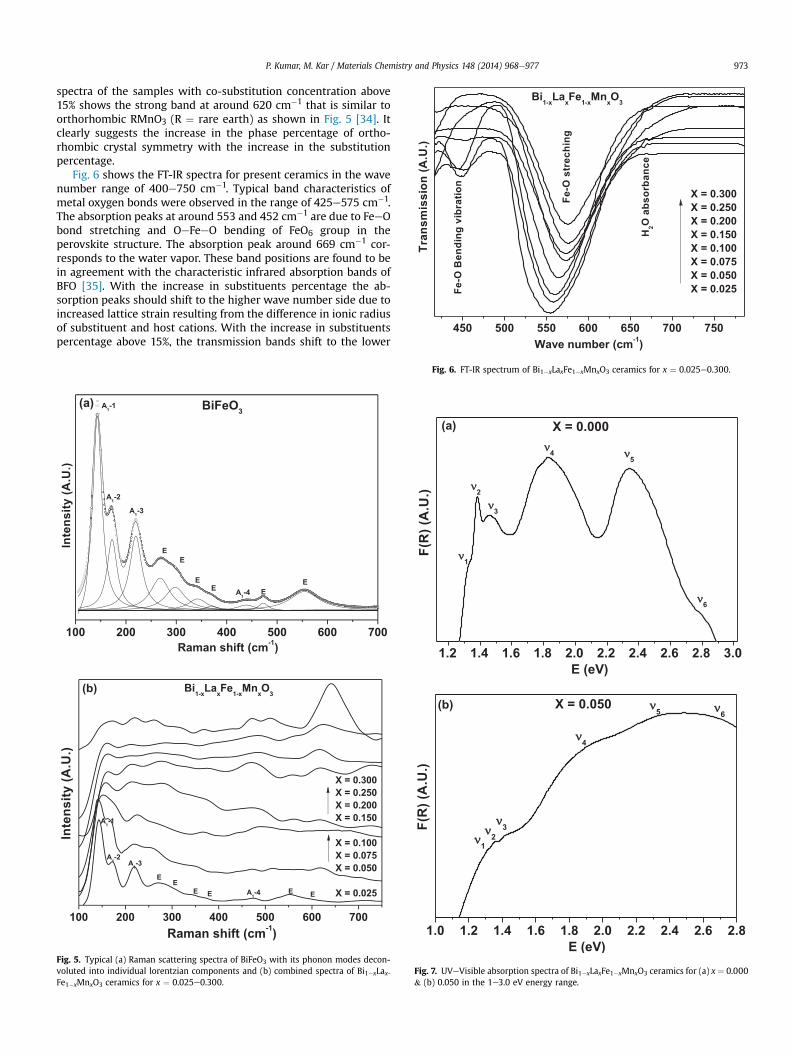
and deconvoluting the fitted curves into individual lorentziancomponents, the peak position of each component, i.e. the naturalfrequency (cm�1) of each Raman active mode, has been obtainedfor all the ceramics and the typical fitting for BFO has been shown
Fig. 4. FE-SEM image and EDS pattern of Bi1�xLaxFe1�xMnxO3 ceramics f
in Fig. 5(a). Two sharp peaks at around 143 and 175 cm�1 for BFOmerged and results in the peak at 158 cm�1 for the co-substitutedsamples which could be assigned as A1-1 and Peak at around213 cm�1 as A1-3 phononmodes respectively. E modes are assignedto other phonon modes located in the range of 50e750 cm�1 asshown in Fig. 5(a) & (b). The frequency of the mode is proportionalto (k/M)1/2, where, k is the force constant and M is the reducedmass. The average mass of the A-sites significantly decreases withthe increase in substitution concentration because atomic mass ofLa is about 66% of that of Bi which leads to shift of A1 phononmodesto higher frequency side as the frequency of the phonon mode isinversely proportional to the reduced mass. It suggests the chem-ical pressure-induced bond shortening and lattice distortion [32].Based on the previous literature, these results demonstrate theexistence of the chemical pressure-induced rhombohe-draleorthorhombic phase transition in BFO by co-substitution of La& Mn in Bi & Fe sites respectively. Similar results about the phasetransition from the rhombohedral to orthorhombic symmetry inbismuth ferrite under high pressure using Mao-Bell diamond anvilcell have been observed by Y. Yang et al. [33]. However, the Raman
or x ¼ 0.025 & x ¼ 0.050 respectively in figures (a), (b), (c) and (d).
450 500 550 600 650 700 750
Bi1-xLaxFe1-xMnxO3
H2O
abs
orba
nce
Fe-O
Ben
ding
vib
ratio
n
Fe-O
str
echi
ng
Wave number (cm-1)
Tran
smis
sion
(A.U
.)
X = 0.300X = 0.250X = 0.200X = 0.150X = 0.100X = 0.075X = 0.050X = 0.025
P. Kumar, M. Kar / Materials Chemistry and Physics 148 (2014) 968e977 973
spectra of the samples with co-substitution concentration above15% shows the strong band at around 620 cm�1 that is similar toorthorhombic RMnO3 (R ¼ rare earth) as shown in Fig. 5 [34]. Itclearly suggests the increase in the phase percentage of ortho-rhombic crystal symmetry with the increase in the substitutionpercentage.
Fig. 6 shows the FT-IR spectra for present ceramics in the wavenumber range of 400e750 cm�1. Typical band characteristics ofmetal oxygen bonds were observed in the range of 425e575 cm�1.The absorption peaks at around 553 and 452 cm�1 are due to FeeObond stretching and OeFeeO bending of FeO6 group in theperovskite structure. The absorption peak around 669 cm�1 cor-responds to the water vapor. These band positions are found to bein agreement with the characteristic infrared absorption bands ofBFO [35]. With the increase in substituents percentage the ab-sorption peaks should shift to the higher wave number side due toincreased lattice strain resulting from the difference in ionic radiusof substituent and host cations. With the increase in substituentspercentage above 15%, the transmission bands shift to the lower
Fig. 5. Typical (a) Raman scattering spectra of BiFeO3 with its phonon modes decon-voluted into individual lorentzian components and (b) combined spectra of Bi1�xLax-Fe1�xMnxO3 ceramics for x ¼ 0.025e0.300.
Fig. 6. FT-IR spectrum of Bi1�xLaxFe1�xMnxO3 ceramics for x ¼ 0.025e0.300.
Fig. 7. UVeVisible absorption spectra of Bi1�xLaxFe1�xMnxO3 ceramics for (a) x ¼ 0.000& (b) 0.050 in the 1e3.0 eV energy range.

-80 -60 -40 -20 0 20 40 60 80-0.6
-0.3
0.0
0.3
0.6 X = 0.000
Magnetic Field (KOe)
)g/ume(
noitazitengaM
-80 -60 -40 -20 0 20 40 60 80-0.8-0.6-0.4-0.20.00.20.40.60.8
Magnetic Field (KOe)
X = 0.015
Mag
netiz
atio
n (e
mu/
g)
-80 -60 -40 -20 0 20 40 60 80-0.9
-0.6
-0.3
0.0
0.3
0.6
0.9X = 0.025
Magnetic Field (KOe)
Mag
netiz
atio
n (e
mu/
g)
-80 -60 -40 -20 0 20 40 60 80-0.9
-0.6
-0.3
0.0
0.3
0.6
0.9 X = 0.050
)g/ume(
noitazi ten gaM
Magnetic Field (KOe)
-80 -60 -40 -20 0 20 40 60 80-0.9
-0.6
-0.3
0.0
0.3
0.6
0.9 X = 0.100)g/ume(
noitazitengaM
Magnetic Field (KOe)-80 -60 -40 -20 0 20 40 60 80
-0.9
-0.6
-0.3
0.0
0.3
0.6
0.9)g/ume(
noitaz it en gaM
Magnetic Field (KOe)
X = 0.150
-80 -60 -40 -20 0 20 40 60 80-1.2-0.9-0.6-0.30.00.30.60.91.2
X = 0.200
Magnetic Field (KOe)
)g/ume(
noitazitengaM
Fig. 8. MeH loops of Bi1�xLaxFe1�xMnxO3 ceramics for x ¼ 0.000e0.200.
P. Kumar, M. Kar / Materials Chemistry and Physics 148 (2014) 968e977974
wave number because the lattice strain relaxes with the dominanceof orthorhombic crystal symmetry fraction.
In order to find out the effect of chemical pressure on the bandgap of BFO, we have recorded the diffuse reflectance spectra of allthe ceramics. UVeVis diffuse reflectance spectra were convertedinto absorption readings according to the KubelkaeMunk (KeM)method [36]. The absorption spectrum of the ceramics transformedfrom the diffuse reflection spectra using KubelkaeMunk function.
FðRÞ ¼ ð1� RÞ22R
(4)
where, R is diffuse reflectance. Since BFO has a distorted cubicperovskite structure, there is a point group symmetry breakingfrom Oh to C3v [37,38]. There are expected six transitions between0 and 3 eV by considering C3v local symmetry of Fe3þ ions (High

103 104 105 106100
200
300
400
500Bi1-xLaxFe1-xMnxO3 X = 0.000
X = 0.050 X = 0.100 X = 0.150 X = 0.200
Log f (Hz)
'
(a)
2
3 X = 0.000 X = 0.050 X = 0.100 X = 0.150 X = 0.200
Bi1-xLaxFe1-xMnxO3(b)
P. Kumar, M. Kar / Materials Chemistry and Physics 148 (2014) 968e977 975
spin configuration t32ge2g ) in BFO and using the correlation group
and subgroup analysis for the symmetry breaking from Oh to C3v[39]. In our case all six transitions were observed which lie in therange between 1.3 and 3 eV for BFO as shown in Fig. 7(a). However,these peaks vanish with the increase in the substitution concen-tration and have low relative intensity in BLFM-05 (Fig. 7(b)). Thisindicates the structural transition from the distorted cubic perov-skite structure to orthorhombic symmetry due to internal chemicalpressure which arises as a result of size mismatch between sub-stitution and host cations which corresponds to the modification inFeO6 local environment. The analysis of XRD patterns, Ramanspectra, FTIR spectra as discussed above also support well in thiscontext.
The magnetization versus magnetic field (MeH) plots at roomtemperature of all ceramics with a maximum applied magneticfield of ±80 kOe have been shown in Fig. 8 and magnetic param-eters have been enlisted in Table 4. The magnetic moment of Fe3þ
cations in BFO, are ferromagnetically coupled in pseudo cubic (111)planes but antiferromagnetically between adjacent planes and it issurrounded by six O2� ions in the common vertex of two adjacentFeO6 octahedra. Magnetic hysteresis loop shows the linear mag-netic field dependence of magnetization for BFO which indicatesthat it is antiferromagnetic material. However, the co-substitutionof La and Mn induces weak ferromagnetism. The unsaturatedhysteresis loops and presence of small remnant magnetization re-veals the presence of antiferromagnetic with weakferromagnetism.
The tolerance factor of the substituted ceramics decreases withthe increase in concentration of substituted elements because ionicsize of La3þ is smaller than that of Bi3þ. This leads to the increase inthe octahedral tilt and the FeeOeFe bond angles which, in turnincreases the canting angle of the antiferromagnetically orderedadjacent planes with the suppression of cycloid spin structure [40].The evolution of weak ferromagnetism in substituted ceramics isaccounted due to the canting of antiferromagnetically orderedspins because of structural distortion as the there is no contributionof magnetization from the impurity phase as Bi2Fe4O9 andBi25FeO40 because it is paramagnetic at room temperature [41]. Themaximum magnetization increases with increasing the substitu-tion concentration due to gradual increase in local lattice distortion.The remnant magnetization increases with the increase in thesubstitution concentration and reaches a maximum at x ¼ 0.050,which indicates almost broken spin cycloid structure. The furtherincrease in substitution concentration results in the reduction ofremnant magnetization due to the appearance of complete anti-ferromagnetic ordering in the orthorhombic structure because ofthe significant contribution from the crystallographic phase ofPbnm space group (as obtained from the quantitative crystallo-graphic phase contribution by double phase Rietveld analysis).
The substitution and other effects can break the cycloids in BFO,which has been reported to affect the magnetic properties of the
Table 4Magnetic parameters of Bi1�xLaxFe1�xMnxO3 (for x ¼ 0.000e0.200) ceramicsannealed at 700 �C. Where, MS ¼ magnetization at maximum applied field, HC ¼Coercive field, emu/g ¼ emu/gram at applied magnetic field of 80 kOe.
Bi1�xLaxFe1�xMnxO3 MS at 80 kOe (emu/g) Mr (emu/g) HC (kOe)
X ¼ 0.000 0.6420 0.0086 0.1692X ¼ 0.015 0.7827 0.0514 5.8524X ¼ 0.025 0.8312 0.0916 9.0252X ¼ 0.050 0.8598 0.1282 9.3701X ¼ 0.100 0.8635 0.0554 4.8739X ¼ 0.150 1.0105 0.0311 1.8006X ¼ 0.200 1.0922 0.0128 0.7475
ceramics, but presence of magnetic impurities (Fe2O3 or Fe3O4) maybe the cause for the same. In our case, the presence of Fe2O3magnetic impurity has not been detected form Rietveld analysis ofXRD patterns. Moreover, we have not observed ferromagnetichysteresis loop for BFO which has largest amount of impurityphases among all ceramics. Also, the area of ferromagnetic hys-teresis loop and coercivity increases with the increase in substitu-tion percentage upto 5% and then decreases due to appearance ofcomplete antiferromagnetic ordering in the orthorhombic struc-ture. It also support the crystallographic phase percentage obtainedfrom Rietveld analysis of XRD patterns which shows that the per-centage of the orthorhombic crystal symmetry (Pbnm space group)is significant in the 5% of co-substitution. This result can beattributed to the fact that the weak ferromagnetism in thesubstituted ceramics might be due to broken cycloid spin structurewhich leads to canting of the antiferromagnetic spin structure.
The limited device applications of BFO are due to high leakagecurrent, which can be reduced by compensating the oxygen va-cancies using appropriate substituents. Hence, the effect of co-substitution by La and Mn in BFO on the room temperaturedielectric constant as well as loss versus frequency measurementsof all ceramics has been studied in the frequency range of500 Hze5 MHz (shown in Fig. 9(a) & (b)). The dielectric constantdecreases rapidly with the frequency in lower frequency range
103 104 105 106
0
1
Tan
Log f (Hz)
Fig. 9. Room temperature (a) dielectric constant (b) dielectric loss versus frequency(plotted at log scale) plot of Bi1�xLaxFe1�xMnxO3 for x ¼ 0.000e0.200.

P. Kumar, M. Kar / Materials Chemistry and Physics 148 (2014) 968e977976
(<104 Hz) which is due to significant oxygen vacancies and sec-ondary phases. It is independent in higher frequency range(>105 Hz) because dipoles with large effective masses (e.g., oxygenvacancies, segregated impurities phases) are able to respond at lowfrequency of the applied field but, not at higher frequencies. Thedecrease of dielectric constant with the increase in frequency canbe explained by dipole relaxation phenomenon which is due toMaxwelleWagner type of interfacial polarization contribution.
The low frequency dielectric constant (Fig. 9(a)) increases withthe co-substitution percentage which suggests that although theimpurity phases decrease with the substitution, but oxygen va-cancies may be increasing which has been observed from EDSanalysis. The dielectric constant at high frequency region (>105 Hz)increases with the increase in substitution percentage and attainsmaximum for BLFM-05 ceramics, then decreases for the highersubstitution. At the same time, dielectric loss for this particularcomposition was observed to be minimum which could be due toreduction of impurity phase and smaller grain size for thesubstituted BFO which results in the increase of grain boundariesacting as scattering centre for the moving electrons.
4. Conclusions
The co-substitution of La and Mn has resulted in structuraltransition from rhombohedral symmetry (space group R3c) toorthorhombic (Pbnm) as indicated by the XRD as well as Ramanspectra analysis. The crystallographic phase contribution has beenquantified by double phase Rietveld analysis of XRD patterns. Itshows that the orthorhombic crystal symmetry (Pbnm space group)is significant beyond 5% of co-substitution which results in thesharp decrease of the Mr and HC in this case due to appearance ofcomplete antiferromagnetic ordering (in the orthorhombic crystalstructure). The ceramics with 5% of co-substitution have enhancedremnant magnetization about 15 times that of pure one due to thesuppression of cycloid spin structure and enhanced canting angle ofantiferromagnetically ordered spins caused by the crystal latticedistortion. The improved dielectric properties with very low valueof dielectric loss have been observed for the BLFM-05. Raman, FTIRand UVeVisible spectra analysis also supports the modification inlocal FeO6 environment and structural transition. The enhanceddielectric and magnetic properties may be interesting for deviceapplications.
Acknowledgment
The authors gratefully acknowledge Dr. Dhanvir Singh Rana andhis research group at IISER Bhopal for extending the MPMS facility.
References
[1] J. Wang, J.B. Neaton, H. Zheng, V. Nagarajan, S.B. Ogale, B. Liu, D. Viehland,V. Vaithyanathan, D.G. Schlom, U.V. Waghmare, N.A. Spaldin, K.M. Rabe,M. Wuttig, R. Ramesh, Epitaxial BiFeO3 multiferroic thin film heterostructures,Science 299 (2003) 1719e1722.
[2] W. Eerenstein, N.D. Mathur, J.F. Scott, Multiferroic and magnetoelectric ma-terials, Nature 442 (2006) 759e765.
[3] S.W. Cheong, M. Mostovoy, Multiferroics: a magnetic twist for ferroelectricity,Nat. Mater. 6 (2007) 13e20.
[4] R. Ramesh, N.A. Spaldin, Multiferroics: progress and prospects in thin films,Nat. Mater. 6 (2007) 21e29.
[5] A. Singh, V. Pandey, R.K. Kotnala, D. Pandey, Direct evidence for multiferroicmagnetoelectric coupling in 0.9BiFeO3e0.1BaTiO3, Phys. Rev. Lett. 101 (2008)247602e247606.
[6] C. Ederer, N.A. Spaldin, Weak ferromagnetism and magnetoelectric couplingin bismuth ferrite, Phys. Rev. B 71 (2005) 060401e060405.
[7] I. Dzyaloshinsky, A thermodynamic theory of “weak” ferromagnetism of an-tiferromagnetics, J. Phys. Chem. Solids 4 (1958) 241e255.
[8] T. Moriya, Anisotropic superexchange interaction and weak ferromagnetism,Phys. Rev. 120 (1960) 91e98.
[9] I. Sosnowska, T. Peterlin-Neumaier, E. Steichele, Spiral magnetic ordering inbismuth ferrite, J. Phys. C 15 (1982) 4835e4846.
[10] A.V. Zalesskii, A.A. Frolov, T.A. Khimich, A.A. Bush, Composition-inducedtransition of spin-modulated structure into a uniform antiferromagnetic statein a Bi1�xLaxFeO3 system studied using 57Fe NMR, Phys. Solid State 45 (2003)141e145.
[11] V.R. Palkar, D.C. Kundaliya, S.K. Malik, S. Bhattacharya, Magnetoelectricity atroom temperature in the Bi0.9-xTbxLa0.1FeO3 system, Phys. Rev. B 69 (2004)212102e212105.
[12] Q. Xu, H. Zai, D. Wu, Y.K. Tanga, M.X. Xu, The magnetic properties of BiFeO3and Bi(Fe0.95Zn0.05)O3, J. Alloys Compd. 485 (2009) 13e16.
[13] J. Wei, D. Xue, C. Wu, Z. Li, Enhanced ferromagnetic properties of multiferroicBi1�xSrxMn0.2Fe0.8O3 synthesized by solegel process, J. Alloys Compd. 453(2008) 20e23.
[14] Z.X. Cheng, A.H. Li, X.L. Wang, S.X. Dou, K. Ozawa, H. Kimura, S.J. Zhang,T.R. Shrout, Structure, ferroelectric properties, and magnetic properties of theLa-doped bismuth ferrite, J. Appl. Phys. 103 (2008), 07E507e3.
[15] G. Le Bras, D. Colson, A. Forget, N. Genand-Riondet, R. Tourbot, P. Bonville,Magnetization and magnetoelectric effect in Bi1�xLaxFeO3 (0 � x � 0.15), Phys.Rev. B 80 (2009) 134417e134423.
[16] S. Ghosh, S. Dasgupta, A. Sen, H.S. Maiti, Low-temperature synthesis ofnanosized bismuth ferrite by soft chemical route, J. Am. Ceram. Soc. 88 (2005)1349e1352.
[17] M.M. Kumar, V.R. palkar, K. Srinivas, S.V. Suryanarayana, Ferroelectricity in apure BiFeO3 ceramic, Appl. Phys. Lett. 76 (2000) 2764e2766.
[18] Y. Dua, Z.X. Chenga, M. Shahbazia, E.W. Collingsb, S.X. Doua, X.L. Wanga,Enhancement of ferromagnetic and dielectric properties in lanthanum dopedBiFeO3 by hydrothermal synthesis, J. Alloys Compd. 490 (1e2) (2010)637e641.
[19] A. Ianculescu, F.P. Gheorghiu, P. Postolache, O. Oprea, L. Mitoseriu, The role ofdoping on the structural and functional properties of BiFe1�xMnxO3 magne-toelectric ceramics, J. Alloys Compd. 504e420 (2010).
[20] Z.X. Cheng, X.L. Wang, Y. Du, S.X. Dou, A way to enhance the magneticmoment of multiferroic bismuth ferrite, J. Phys. D Appl. Phys. 43 (2010)242001e242006.
[21] V.R. Palkar, Darshan C. Kundaliya, S.K. Malik, Effect of Mn substitution onmagnetoelectric properties of bismuth ferrite system, J. Appl. Phys. 93 (2003)4337e4339.
[22] S. Chauhan, M. Kumara, S. Chhokera, S.C. Katyal, H. Singh, M. Jewariya,K.L. Yadav, Multiferroic, magnetoelectric and optical properties of Mn dopedBiFeO3 nanoparticles, Solid State Comm. 152 (2012) 525e529.
[23] B. Li, C. Wang, W. Liu, M. Ye, N. Wang, Multiferroic properties of La and Mn co-doped BiFeO3 nanofibers by solegel and electrospinning technique, Mater.Lett. 90 (2013) 45e48.
[24] A. Lahmar, S. Habouti, C.H. Solterbeck, M. Es-Souni, B. Elouadi, Correlationbetween structure, dielectric, and ferroelectric properties in BiFeO3eLaMnO3solid solution thin films, J. Appl. Phys. 105 (2009) 014111e014118.
[25] P. Kumar, M. Kar, Effect of structural transition on magnetic and opticalproperties of Ca and Ti co-substituted BiFeO3 ceramics, J. Alloys. Compd. 584(2014) 566e572.
[26] Y. Mao, T.-J. Park, S.S. Wong, Synthesis of classes of ternary metal oxidenanostructures, Chem. Commun. 46 (2005) 5721e5735.
[27] J. Rodriguez-Carvajal, Laboratory, FULLPROF, a Rietveld and Pattern Matchingand Analysis Programs Version, Laboratoire Leon Brillouin, CEA-CNRS, France,2010.
[28] R. Palai, R.S. Katiyar, H. Schmid, P. Tissot, S.J. Clark, J. Robertson, S.A.T. Redfern,G. Catalan, J.F. Scott, b phase and g- bmetal-insulator transition in multiferroicBiFeO3, Phys. Rev. B 77 (2008) 014110e014111.
[29] B.D. Cullity, Elements of X-ray Diffraction, second ed., Addison-Wesley Series,1978.
[30] R.Y. Young, The Rietveld Method, third ed., Oxford University Press, 1996.[31] D. Kothari, V.R. Reddy, V.G. Sathe, A. Gupta, A. Banerjee, A.M. Awasthi, Raman
scattering study of polycrystalline magnetoelectric BiFeO3, J. Magn. Magn.Mater. 320 (2008) 548e552.
[32] G.L. Yuan, S. Wing, H.L.W. Chan, Reduced ferroelectric coercivity inmultiferroic Bi0.825Nd0.175FeO3 thin film, J. Appl. Phys. 101 (2007)024106e024106-4.
[33] Y. Yang, L.G. Bai, K. Zhu, Y.L. Liu, S. Jiang, J. Liu, J. Chen, X.R. Xing, High pressureeffects on BiFeO3 studied by micro-Raman scattering, J. Phys. Condens. Mat. 21(2009) 385901e385905.
[34] L. Martín-Carr�on, A. de Andr�es, M.J. Martínez-Lope, M.T. Casais, J.A. Alonso,Raman phonons as a probe of disorder, fluctuations, and local structure indoped and undoped orthorhombic and rhombohedral manganites, Phys. Rev.B 66 (2002) 174303-1e174303-8.
[35] R.K. Mishra, D.K. Pradhan, R.N.P. Choudhary, A. Banerjee, Effect of yttrium onimprovement of dielectric properties and magnetic switching behavior inBiFeO3, J. Phys. Condens. Matter 20 (2008) 045218e045223.
[36] P. Kubelka, F. Munk, Ein Beitrag zur Optik derFarbanstriche, Tech. Phys. 12(1931) 593e601.
[37] K. Takahashi, N. Kida, M. Tonouchi, Terahertz radiation by an ultrafast spon-taneous polarization modulation of multiferroic BiFeO3 thin films, Phys. Rev.Lett. 96 (11) (2006) 117402e117405.
[38] M.O. Ramirez, A. Kumar, S.A. Denev, N.J. Podraza, X.S. Xu, R.C. Rai, Y.H. Chu,J. Seide, L.W. Martin, S.Y. Yang, E. Saiz, J.F. Ihlefeld, S. Lee, J. Klug, S.W. Cheong,M.J. Bedzyk, O. Auciello, D.G. Schlom, R. Ramesh, J. Orenstein, J.L. Musfeldt,

P. Kumar, M. Kar / Materials Chemistry and Physics 148 (2014) 968e977 977
V. Gopalan, Magnon sidebands and spin-charge coupling in bismuth ferriteprobed by nonlinear optical spectroscopy, Phys. Rev. B 79 (2009)224106e224114.
[39] B. Ramachanran, A. Dixit, R. Naik, G. Lawes, M.S.R. Rao, Charge transfer andelectronic transitions in polycrystalline BiFeO3, Phys. Rev. B 82 (2010)012102e012105.
[40] C.H. Yang, D. Kan, I. Takeeuchi, V. Nagarajan, J. Seidel, Phys. Chem. Chem. Phys.14 (2012) 15953e15962.
[41] N. Shamir, E. Gurewitz, H. Shaked, The magnetic structure of Bi2Fe4O9 e
analysis of neutron diffraction measurements, Acta Cryst. A 34 (1978)662e666.