Influence of high gravity process conditions on the environmental impact of ethanol production from...
31
Influence of high gravity process conditions on the environmental impact of ethanol production from wheat straw Matty Janssen a,* , Anne-Marie Tillman a , David Cannella b , Henning Jørgensen b,1 a Environmental Systems Analysis, Department of Energy and Environment, Chalmers University of Technology, SE-412 96 G ¨ oteborg, Sweden b Forest and Landscape, University of Copenhagen, Frederiksberg C, DK-1958, Denmark Abstract Biofuel production processes at high gravity are currently under development. Most of these processes however use sugars or first generation feedstocks as substrate. This paper presents the results of a life cycle assessment (LCA) of the production of bio-ethanol at high gravity conditions from a second generation feedstock, namely, wheat straw. The LCA used lab results of a set of 36 process configurations in which dry matter content, enzyme preparation and loading, and process strategy were varied. The LCA results show that higher dry matter content leads to a higher environmental impact of the ethanol production, but this can be compensated by reducing the impact of enzyme production and use, and by polyethylene glycol addition at high dry matter content. The results also show that the renewable and non-renewable energy use resulting from the different process configurations ultimately determine their environmental impact. Keywords: high gravity hydrolysis and fermentation, wheat straw, life cycle assessment, energy analysis 1. Introduction 1 The development of sustainable processes for the production of biofuels is an ongoing effort. The bio- 2 ethanol industry has taken initiatives to improve the energy and material efficiency of the existing bio-ethanol 3 production technologies with the goal to make these more cost competitive. One way to reach this goal is to 4 run the hydrolysis and fermentation processes at high gravity conditions, that is, at high concentrations of 5 substrate. This results in a reduction of water use in the process and a higher concentration of ethanol in the 6 fermentation broth. Consequently, a reduction in the energy needed during the downstream processing of the 7 broth is achieved (Jørgensen et al., 2007). However, the development of such high gravity processes has mostly 8 been done using sugars derived from starch or sucrose containing crops such as grains, corn, sugar cane or 9 * Corresponding author Email address: [email protected] (Matty Janssen) 1 Current address: Center for Bioprocess Engineering, Department of Chemical and Biochemical Engineering, Building 229, Technical University of Denmark, DK-2800 Kgs. Lyngby, Denmark Preprint submitted to Bioresource Technology November 22, 2014
Transcript of Influence of high gravity process conditions on the environmental impact of ethanol production from...

Influence of high gravity process conditions on the environmental impactof ethanol production from wheat straw
Matty Janssena,∗, Anne-Marie Tillmana, David Cannellab, Henning Jørgensenb,1
aEnvironmental Systems Analysis, Department of Energy and Environment, Chalmers University of Technology, SE-412 96 Goteborg,Sweden
bForest and Landscape, University of Copenhagen, Frederiksberg C, DK-1958, Denmark
Abstract
Biofuel production processes at high gravity are currently under development. Most of these processes however
use sugars or first generation feedstocks as substrate. This paper presents the results of a life cycle assessment
(LCA) of the production of bio-ethanol at high gravity conditions from a second generation feedstock, namely,
wheat straw. The LCA used lab results of a set of 36 process configurations in which dry matter content,
enzyme preparation and loading, and process strategy were varied. The LCA results show that higher dry
matter content leads to a higher environmental impact of the ethanol production, but this can be compensated
by reducing the impact of enzyme production and use, and by polyethylene glycol addition at high dry matter
content. The results also show that the renewable and non-renewable energy use resulting from the different
process configurations ultimately determine their environmental impact.
Keywords: high gravity hydrolysis and fermentation, wheat straw, life cycle assessment, energy analysis
1. Introduction1
The development of sustainable processes for the production of biofuels is an ongoing effort. The bio-2
ethanol industry has taken initiatives to improve the energy and material efficiency of the existing bio-ethanol3
production technologies with the goal to make these more cost competitive. One way to reach this goal is to4
run the hydrolysis and fermentation processes at high gravity conditions, that is, at high concentrations of5
substrate. This results in a reduction of water use in the process and a higher concentration of ethanol in the6
fermentation broth. Consequently, a reduction in the energy needed during the downstream processing of the7
broth is achieved (Jørgensen et al., 2007). However, the development of such high gravity processes has mostly8
been done using sugars derived from starch or sucrose containing crops such as grains, corn, sugar cane or9
∗Corresponding authorEmail address: [email protected] (Matty Janssen)
1Current address: Center for Bioprocess Engineering, Department of Chemical and Biochemical Engineering, Building 229,Technical University of Denmark, DK-2800 Kgs. Lyngby, Denmark
Preprint submitted to Bioresource Technology November 22, 2014

sugar beet (Puligundla et al., 2011). Due to concerns about the possible competition with food production, a10
hydrolysis and fermentation process using a second generation feedstock is a possible technology development11
pathway. Koppram et al. (2014) reviewed the challenges and perspectives regarding ligno-cellulosic ethanol12
production at high gravity conditions. The main challenges that need to be dealt with are a) high concentrations13
of inhibitory substances that are released during the pretreatment of the feedstock, b) high concentrations of14
sugars and ethanol which in themselves are inhibitory, and c) the high viscosity of the pretreated material in15
the hydrolysis and fermentation step which results in mixing and mass transfer limitations. These challenges16
are currently investigated for the production of ethanol from wheat straw (Cannella et al., 2012; Cannella and17
Jørgensen, 2014) and the results of this research form the basis of the work presented in this paper.18
One country that has pioneered the use of straw is Denmark. Besides its use for bedding and forage, approx.19
1.3 Mt of straw per year was used in Denmark on average for energy purposes during the period 2004-200820
(which is approx. 25% of the available straw). Its resource potential has not yet been fully exploited (on21
average 38% was not used over that same period), due to economic restrictions such as the cost of handling22
and transportation of the straw (Skøtt, 2011). Furthermore, in the European Union agricultural residues such23
as wheat straw are readily available, but are not projected to either become more or less abundant until 205024
(Bentsen and Felby, 2012). This may lead to an increase in the price of straw if demand increases. Another25
factor that limits the use of straw is the common practice to leave a certain amount of harvestable straw in the26
field. This is done in order to maintain the soil carbon pool, and to prevent greenhouse gas emissions from the27
soil (Cherubini and Ulgiati, 2010).28
Life cycle assessment (LCA) is a technique for assessing the environmental aspects and potential impacts29
associated with a product throughout its life cycle (International Organization of Standardization, 2006).30
LCA has been applied extensively to assess second generation bio-ethanol production from different kinds of31
feedstocks. These assessments have generally been done using data that describe industrial-scale operations32
(for instance from the well-known NREL studies (Aden et al., 2002; Humbird et al., 2011)) and thus assess the33
bio-ethanol life cycle at a mature development stage. LCA can however also be used to assess the environmental34
impacts of a new process technology along its development path. Shibasaki et al. (2007) developed a method35
to employ LCA for the assessment of technologies that are at an early stage of development, and pointed out36
that scale-up effects cannot be neglected when such a technology is compared to a technology that already runs37
at an industrial scale. Besides scale issues, Hillman and Sanden (2008) also considered time aspects when38
performing an LCA of large-scale technical systems. They identified the shifting time frame and changes in39
the background system as issues that are given little attention. Considering the shifting time frame in LCA40
2

through doing several assessments during a period of time instead of doing one assessment as a snapshot in41
time, for instance at the end of the projected development period, would give room for modelling technical42
development such as improved performance, and perhaps even a changed function of the product. For instance,43
bio-ethanol may over time be used as a building block chemical for the production of bio-polyethylene (Liptow44
and Tillman, 2012; Liptow et al., 2013) instead of as a fuel which would change the function of the ethanol45
production system, and may thus change the functional unit. Additionally, the background system may change46
over time due to changes in e.g. a country’s energy mix, but may also change due to the scale at which a new47
technology is applied, e.g. increased land use due to increased biofuel production. Cherubini and Strømman48
(2011) pointed out in their review of LCA studies of bioenergy systems that most of them included global49
warming potential and energy use in the impact assessment. These energy analyses evaluated all energy inputs50
along the life cycle resulting in the cumulative primary energy demand of a product. Little mention was made51
of a more detailed view on these energy flows to evaluate, for instance, how much energy is contained in the52
main product and by-products. A minority of the reviewed studies included categories like acidification and53
eutrophication. As well, only few studies considered land use and land use change in their impact assessment54
due to the lack of a widely accepted impact assessment methodology.55
The purpose of the life cycle assessment described in this paper was to assess the environmental impact of high56
gravity conditions during the hydrolysis and fermentation steps in an ethanol production process with wheat57
straw as the feedstock, at a very early development stage. Furthermore, the LCA was used to test the hypothesis58
that the production of second generation bio-ethanol at high gravity conditions is more environmentally friendly59
than at non-high gravity conditions. The results of the LCA are intended to help guide the development of the60
technology for high gravity hydrolysis and fermentation by providing technology developers, researchers and61
industry decision makers the environmental hotspots from an environmental life cycle point-of-view.62
2. Materials and methods63
2.1. Description of the analyzed system64
A cradle-to-gate system, from the cultivation and harvesting of wheat straw (resource extraction) to the65
gate of the ethanol production plant, was defined for the analysis of a set of process configurations (see 2.2)66
(Fig. 1). The system was assumed to be situated in Kalundborg, Denmark.67
It was assumed that enough straw is available nearby the plant and that it is cultivated and harvested at an68
average distance of 25 km from the plant. Also included in the upstream activities were the production of69
the enzymes, sodium hydroxide (needed to adjust the pH to 5.0) and polyethylene glycol (PEG), and the70
3

production of fuel and electricity that are needed in all parts of the studied system. The model of the production71
of ethanol and co-products was based on the IBUS process technology developed by Inbicon (Fig. 2) (Larsen72
et al., 2012). In this continuous process the wheat straw is first prepared and then hydrothermally pretreated.73
The pretreated straw is then washed to separate the solubilized hemicellulose from the fibres. The solubilized74
hemicellulose is concentrated and leaves the process as the by-product C5 molasses. Next, the pretreated fibres,75
now mainly consisting of cellulose and lignin, are enzymatically hydrolyzed and fermented to produce ethanol.76
During the downstream processing, ethanol is separated and purified up to 99.5%(v/v) using distillation and77
molecular sieves, and the solids in the bottom product of the distillation are dried. These solids consist mainly78
of lignin and are made into lignin pellets. These pellets were assumed to provide the energy demands of the79
process, and were exported if a surplus was generated. It should be noted that the non-digested cellulose was80
treated as a material loss (it is neither recycled nor incinerated). This was done in order to produce lignin81
pellets by-product with a high purity. The distribution of the produced ethanol to the pump and the use phase82
was excluded from the assessment because the focus is on the development of the new high gravity technology83
for ethanol production.84
2.2. Set-up of the LCA85
The LCA was based on the results of a set of 33 laboratory experiments in which the key process variables86
(dry matter content, enzyme preparation and load, and process strategy) were varied. The rationale of the design87
of these experiments was to compare how the performance of the process (i.e. final ethanol yield) is affected by88
the introduction of novel commercial enzyme preparations. The two preparations that were compared were the89
novel Cellic CTec2 product and its predecessor, a 5:1 (weight) mix of Celluclast and Novozym 188 (henceforth90
called Celluclast), all from Novozymes A/S. The experimental design further involved:91
• testing the influence of dry matter content (DM) of the process. Previous studies have shown that initial92
dry matter content has a significant impact on the process performance. The design involved testing two93
conditions, 20 and 30% DM, which both are high dry matter conditions compared to most other studies,94
but cover the range which is regarded as industrially relevant.95
• running the experiments at 30% DM with the addition of polyethylene glycol (PEG, with an average96
molecular weight of 3000), with the goal to further increase the yield. It was expected that PEG addition97
would increase the yield because it lowers the interaction between lignin and enzyme, thereby reducing98
non-productive binding of the enzyme (Cannella and Jørgensen, 2014).99
• testing two different enzyme loads. Enzyme load is an important process variable that determines the100
commercial feasibility of cellulosic ethanol production. The loads of the two enzyme preparations were101
4

5 and 7.5 FPU/g DM in order to compare the impact of enzyme load on the yield. These are reasonable102
loads from an industrial perspective.103
• testing the two common process strategies applied in ethanol production from lignocellulose, separate104
hydrolysis and fermentation (SHF) and simultaneous saccharification and fermentation (SSF), along105
with the hybrid pre-saccharification and simultaneous fermentation (PSSF) strategy.106
For a more detailed description of these experiments and their results, see Cannella and Jørgensen (2014).107
Additionally, for the sake of the LCA, a base case process configuration was defined for comparison purposes108
and lab experiments were run for it. In this configuration, the hydrolysis and fermentation were run at a more109
conventional dry matter content of 10%, while the enzyme preparation used was Cellic CTec2 at a load of 7.5110
FPU/g DM. All three process strategies (SHF, PSSF, SSF) were tested.111
The functional unit in this assessment was 1 liter of ethanol produced from wheat straw by a process system112
that uses the high gravity hydrolysis and fermentation technology. An attributional approach was followed113
to carry out this LCA, because the purpose was to identify improvement possibilities in the technologies in114
development (and to compare those to a defined base case), and thus on what to focus in the development.115
The life cycle impact assessment (LCIA) was carried out using the CML characterization method (Guinee116
et al., 2002). The following impact categories were selected for the evaluation of the high gravity process117
configurations:118
• climate change/global warming potential (GWP)119
The main goal of the use of biofuels is to reduce the use of fossil-based fuels and thus reducing their120
potential impact on global warming. In this assessment, biogenic greenhouse gas (GHG) emissions were121
assumed to be climate neutral, and thus only the environmental impact of fossil GHG emissions of the122
analyzed system were taken into account.123
• eutrophication potential (EP)124
The use of fertilizers during the cultivation of wheat can lead to increased eutrophication due to the125
emission of phosphorus and nitrogen.126
• acidification potential (AP)127
Combustion of fossil fuels and lignin pellets can lead to increased acidification due to the emission of128
SO2, NH3 and NOx.129
• photochemical ozone creation potential (POCP)130
Combustion of fossil fuels and lignin pellets can lead to increased photochemical ozone creation due to131
the emission of volatile organic compounds (VOCs), CO and NOx.132
5
As part of the assessment, an energy analysis of the product system was also carried out in order to assess energy133
use, both renewable (REU) and non-renewable (NREU). For the energy analysis, the ecoinvent cumulative134
energy demand method was used (Frischknecht et al., 2007). The environmental impact of the ethanol135
production may change significantly, for instance if the electricity fuel mix is (partly) based on renewable136
energy or if the energy needed in the production of the biofuel can be delivered by renewable resources.137
Sensitivity analyses were carried out to investigate changes in environmental impacts due to potential enzyme138
recycling (Fig. 2) and due to changes in the Danish energy mix over time.139
A partitioning of the environmental burden based on the economic value of the main product (ethanol) and140
the by-products (C5 molasses, lignin) was used (see Table 1) (Tillman, 2000). This was done according to the141
flow diagram of the Inbicon process includes two allocation points: one (allocation point A in Fig. 2) at the142
separation and wash stage where the C5 molasses is separated from the fibres, and one (allocation point B in143
Fig. 2) where the ethanol and lignin pellets are separated from the remaining liquid. In the case of allocation144
point A, it was assumed that the price of the fibre flow out of the separation and wash stage was 50 e/tonne.145
Furthermore, straw is a by-product of wheat cultivation, which requires a partitioning of the environmental146
burden. Therefore, a third allocation point is at the wheat cultivation and harvesting process (allocation point C147
in Fig. 2). The ecoinvent process that is used used to model this process, ‘wheat straw IP, at farm’, already148
allocated this burden based on the straw’s economic value: 7.5% of the environmental burden of the wheat149
cultivation and harvesting is allocated to the straw production (Nemecek and Kagi, 2007). A sensitivity analysis150
was carried out to investigate changes in the environmental impact allocated to ethanol due to varying product151
prices. In another analysis, the influence of applying system enlargement instead of economic allocation was152
investigated. When applying system enlargement, allocation is avoided, and the system under study is credited153
with the avoided emissions had its by-products been produced by an alternative process. In this analysis it154
was assumed that the lignin by-product is used to produce heat and replaced the production of an equivalent155
amount of heat from coal, and that the C5 molasses replaced the production of molasses from sugar beet. The156
ecoinvent processes ‘heat, at hard coal industrial furnace 1-10MW’ and ‘molasses, from sugar beet, at sugar157
refinery’ (Nemecek and Kagi, 2007) were used to model these alternative processes, respectively.158
2.3. Mass and energy balances and other data sources159
The mass and energy balances for the process configurations (the foreground system, see Figs. 1 and160
2) were calculated based on the results of the lab experiments (see section 2.2), using a spreadsheet model.161
The main result of the experiments that tested the process configurations was the final ethanol yield after 168162
hours, expressed as a percentage of the maximum theoretical ethanol yield (Cannella and Jørgensen, 2014).163
6

Furthermore, data on the usage of chemicals and enzyme in the experiments were gathered. It was assumed164
that these experimental lab data also apply to the industrial scale, i.e. the same yields and usage of enzyme and165
chemicals are assumed to apply. Next, the system was modeled at an industrial scale.166
The yield was used to calculate the amount of ethanol produced based on the amount of cellulose available.167
Several assumptions were made as well in order to calculate the mass and energy flows in the foreground168
system. With regards to the resource extraction, and production of auxiliary material and energy: 1) the169
material loss from the field until the wheat straw is prepared to enter the pretreatment process was 15%. This170
includes losses due to transportation, storage and preparation (Hurter, 2007); and 2) the water content of the171
harvested straw was 8%. With regards to the ethanol production process: 1) the hydrothermal pretreatment of172
the straw took place at p=15 bar and T=195◦C with a residence time of 18.5 minutes; 2) the pretreated straw173
consisted of 55%(m/m) cellulose, 34%(m/m) lignin and 11%(m/m) other solid material; 3) the heat input for174
distillation was taken from Galbe et al. (2007) (see p. 319, Fig. 6); 4) the solids after distillation (Fig. 2) were175
assumed to be dried by pressing up to a dry matter content of 50%. These solids were then further dried up176
to 90% DM; and 5) it was assumed that lignin is burned with a 75% efficiency and the additional fossil fuel177
mix, if needed in the process configuration, with a 90% efficiency. The combustion of the lignin pellets was178
modeled using the ‘Combustion, dry wood residue, AP-42’ process from the US LCI database (NREL, 2012).179
This process was adjusted in order to account for the heating value of lignin (assumed to be 24 MJ/kg) and the180
combustion efficiency of lignin. The additional fossil fuel mix was assumed to be the Danish energy fossil fuel181
mix (Danish Energy Agency, 2011).182
Besides the assumptions used and modeling choices made to calculate the mass and energy balances for the183
foreground system, several choices had to be made for modeling the background system (Fig. 1):184
1) the cultivation and harvesting of the straw was modeled using the ecoinvent process ‘wheat straw IP, at185
farm’ (Nemecek and Kagi, 2007)). This model assumes that 25% of the harvestable straw is left in the186
field, and this is accounted for in the allocation (see section 2.2).187
2) the production of NaOH was modeled using the ecoinvent process ‘sodium hydroxide, 50% in H2O,188
production mix, at plant’. The environmental impact of this process is allocated according to the masses189
of the different products (52.3% NaOH, 46.4% Cl2 and 1.3% H2). Mass allocation was applied in this190
process because the amounts produced of the three chemicals can be clearly determined (Althaus et al.,191
2007). 7 g NaOH/kg DM of pretreated wheat straw was added in the experiments in order to adjust the192
pH to a level that is favorable to the hydrolysis and fermentation of the pretreated wheat straw.193
3) the production of the Cellic CTec2 enzyme preparation was modeled using the life cycle inventory data194
7

published by Liptow et al. (2013) (see p. 1077, Table 5). In the case of a load of 5 FPU/g DM of195
pretreated wheat straw, this was equal to 50 g enzyme preparation/kg DM of pretreated wheat straw.196
In the case of a load of 7.5 FPU/g DM of pretreated wheat straw, this was equal to 75 g enzyme197
preparation/kg DM of pretreated wheat straw.198
4) the production of the Celluclast/Novozym 188 enzyme preparation was modeled by considering the199
production of Celluclast for both types of enzyme in this mix. It was modeled using the ‘Enzyme,200
Cellulase, Novozyme Celluclast’ process from the US LCI database (NREL, 2012). In the case of a201
load of 5 FPU/g DM of pretreated wheat straw, this was equal to 78 g enzyme preparation/kg DM of202
pretreated wheat straw. In the case of a load of 7.5 FPU/g DM of pretreated wheat straw, this was equal203
to 103 g enzyme preparation/kg DM of pretreated wheat straw.204
5) the production of polyethylene glycol (PEG, average molecular weight of 3000 g/mol) was modeled205
by assuming it was produced from ethylene oxide via its interaction with water. The ecoinvent process206
‘ethylene oxide, at plant’ was used to model this process (assuming that the impact of the polymerization207
of ethylene oxide to PEG is negligible) (Althaus et al., 2007). 10 g PEG/kg DM of pretreated wheat208
straw was added in the experiments that used PEG.209
6) the fossil fuel mix used as additional fuel for the ethanol production process was assumed to be the210
Danish mix from 2009 and consists of 29% coal, 50% oil and 21% natural gas (Danish Energy Agency,211
2011). This fuel is used for steam production. Changes in the fossil fuel mix over time were taken into212
account using sensitivity analysis.213
7) the electricity used by the ethanol production process was produced in Denmark, and was modeled with214
the ecoinvent process ‘electricity mix (DK)’.215
The LCA software openLCA version 1.3 was used to model the complete ethanol production systems according216
to Fig. 1 (both the foreground and background systems) for the different process configurations, and to217
calculate their environmental impacts. The mass and energy balance results for the process configurations and218
the models used for describing the background system were thus integrated in this software.219
3. Results and discussion220
All process configurations run at high dry matter content (20 and 30% DM, respectively) and the base221
case configurations (at 10% DM) were analyzed in order to determine their environmental impact and energy222
use. The results are summarized in Fig. 3. This figure depicts the results for the four environmental impact223
categories analyzed, at the two different dry matter contents at which experiments were carried out and with224
8
the two different enzyme preparations. Furthermore, the experiments at 30% DM content with an addition of225
PEG are shown in their own separate bar charts. Each bar chart contains the results for the different process226
strategies at the two different enzyme loads used and the base case experiments run at 10% DM. The yields of227
all experiments are shown above the bars in the charts showing the global warming potentials (GWP), and it is228
also depicted to what extent different stages in the life cycle contribute to the result. It should be noted that the229
three base case experiments (run with SHF, PSSF and SSF process strategies) all resulted in the same yield,230
and consequently had the same environmental impact. Therefore, in Fig. 3 only one bar is shown to represent231
these experiments. Most of the results discussion will revolve around Fig. 3.232
There is no simple answer to the question whether high gravity hydrolysis and fermentation is environmentally233
preferable to hydrolysis and fermentation at the more conventional 10% DM conditions (Fig. 3). It is however234
clear that the configurations running at 30% DM without the addition of PEG are not preferable options.235
Furthermore, it is not directly obvious which process strategy (SSF, PSSF or SHF) is the better one. What can236
be seen at first glance is that the environmental impact is dominated by enzyme production, at all investigated237
process configurations and for both types of enzyme preparations. It is also clear that the acidification (AP)238
and photo-chemical ozone creation (POCP) potentials co-vary with the GWP. This is according to expectations239
because all these types of impacts are mostly a result of the significant use of non-renewable energy during240
the enzyme production and its resulting emissions of CO2 (GWP), SO2 (AP), and NOx and volatile organic241
compounds (POCP). Eutrophication potential (EP) on the other hand is caused by NOx emissions from242
combustion but also by leakage of fertilizers during the wheat cultivation phase.243
In order to structure the analysis that follows, the causal diagrams depicted in Fig. 4 were constructed. Yield244
seems to be the factor which explains most of the results, and is hence given a central role in the diagrams.245
Yield is affected by the studied process variables, and yield consequently affects the non-renewable energy246
use (NREU) of the process configuration and its related emissions (Fig. 4a). Yield also affects wheat straw247
consumption (which consequently affects the renewable energy use (REU)) and hence eutrophication due to248
the cultivation of wheat (Fig. 4b). It should be noted that the ‘process strategy’ variable (see section 2.2) is not249
part of the constructed causal diagrams. When varying the process strategy (SHF, PSSF or SSF), keeping all250
other process variables constant, none of them is clearly preferable. Cannella and Jørgensen (2014) observed251
nevertheless that there is a difference in the preferred choice of process strategy between the two enzyme252
preparations (Cellic CTec2 or Celluclast) at 30% DM when considering yield: the use of Cellic CTec2 resulted253
in a higher yield when using SHF or PSSF, whereas the use of Celluclast resulted in a higher yield when using254
SSF or PSSF. For a more in-depth discussion on the influence of the process strategy on the yield, see Cannella255
9

and Jørgensen (2014).256
3.1. Yield of process configuration257
The yield is the main determinant of the environmental impact of a configuration. Keeping all process258
variables constant (see section 2.2), except for the process strategy, all environmental impacts studied will259
decrease with an increasing yield (Fig. 3).260
Also, the renewable and non-renewable energy use (REU and NREU, respectively) vary with the yield. This261
results in a decreasing trend of the total extracted energy, as defined by Arvidsson et al. (2012) and calculated262
here as the sum of REU and NREU. The yield of the process configurations has a significant influence on263
the REU which indicates that the amount of wheat straw needed varies widely among the tested process264
configurations (from 5.5 kg up to 18.6 kg for the production of 1 liter of ethanol). The NREU varies to a lesser265
extent with the yields (from 25 MJ to 63 MJ per liter of ethanol) when compared to the REU, and depends266
mostly on the amount of added enzyme and polyethylene glycol (PEG). These two process variables (see267
section 2.2) greatly affect the yield and therefore the REU. It can be stated that generally the REU (straw use)268
decreases with increased NREU (enzyme load and PEG addition), which is in accordance with the analysis269
based on the causal diagram for eutrophication potential (Fig. 4b).270
The yield of the base case configurations (10% DM, Cellic CTec2 at 7.5 FPU/g DM) is the highest of all271
configurations at 92% for each of the three process strategies tested (SHF, PSSF and SSF). However, for none272
of the impact categories does the base case configuration outperform all other configurations. This is explained273
by the use of additional fossil fuel by the base case configuration that is required for satisfying its energy274
demand (Figs. 3 and 5a). In other words, the energy contained in the lignin pellets produced by the base case275
configuration itself is not enough to meet its total energy needs which are higher because of its higher energy276
use during the distillation of the more dilute fermentation broth.277
Of the process configurations running at high dry matter content (20 or 30% DM), those with the highest and278
lowest yields are both run at 30% DM. When comparing the base case configuration and the configuration with279
the highest yield (30% DM, PEG addition, Cellic CTec2, 7.5 FPU, PSSF with a yield of 89%) from an energy280
perspective, it becomes clear that these configurations differ due to the extra fossil fuel that is needed in the281
base case, and the addition of PEG and the small amount of lignin product in the highest yield configuration282
(Fig. 5b). When doing this comparison between the base case and the lowest yield configuration (30% DM,283
Celluclast, 5 FPU, SHF with a yield of 27%), the main difference is the renewable energy input needed to284
produce 1 l of ethanol (Fig. 5c). The product flow that contains most energy is the hemi-cellulose that is285
used to produce the C5 molasses in the lowest yield configuration, whereas in the base case (and the highest286
10

yield configuration) this energy flow is similar to the energy contained in 1 l of ethanol. As well, the energy287
contained in the lignin product is larger than in the highest yield configuration: 14% of the lignin that enters288
the downstream processing step leaves the system as lignin product, whereas in the highest yield configuration289
this is 3%.290
It should be noted that the non-digested cellulose was treated as a material loss (see 2.1). If this cellulose was291
burned, it would replace a part of the extra fossil fuel that is needed in the base case configurations (Fig. 5a).292
In the case of the lowest yield configuration (Fig. 5c), an excess of energy would be produced if this cellulose293
was burned (assuming a combustion efficiency of 75%). This energy would then be another by-product of294
the process, and this would consequently change the environmental impact allocated to the ethanol that is295
produced.296
3.2. Enzyme load and preparation297
Another important determinant of the environmental impact of a configuration is the enzyme load. An298
increased enzyme load increases the yield for all process configurations (keeping all other process variables299
constant). However, this does not lead to a lower environmental impact: a higher enzyme load generally300
leads to higher global warming (GWP), acidification (AP) and photo-chemical ozone creation potentials301
(POCP) because of a higher non-renewable energy use (Fig. 4a). This is due to the large amount of fossil302
energy that is used during enzyme production (120 MJ and 52.1 MJ per kg of Cellic CTec2 and Celluclast303
enzyme preparations, respectively). There are two exceptions to this generalization: 1) the configurations304
running at 30% DM with PEG addition using Cellic CTec2 (Fig. 3c); and 2) the acidification potential of the305
configurations using Celluclast (Figs. 3d and 3e). In these cases, the impact of the increase in yield outweighs306
(or compensates) the impact of increased enzyme load and leads to a decreased (or equal) environmental307
impact. This demonstrates a trade-off between a reduced environmental impact due to increased yield, which308
is due to the increased enzyme load, and an increased environmental impact due to enzyme production. The309
causal link between enzyme load and eutrophication potential (EP) shows a different behavior (Fig. 4b). In310
this case, the impact of the increase in yield either compensates or, in some cases, outweighs the impact of311
increased enzyme load, thus leading to an equal or lower EP. Reasons for this different behavior are that 1) the312
enzyme production has a lower relative contribution to EP when compared to the other impact categories; and313
2) the increased enzyme load leads to decreased straw use, which consequently leads to a lower contribution314
of straw cultivation and harvesting to EP (Fig. 3). There is one exception to this behavior, the configuration315
running at 30% DM using Celluclast and the SHF process strategy (Fig. 3e), where the increase in yield is not316
great enough to compensate the impact of increased enzyme load.317
11

Changing the type of enzyme preparation, from the Cellic CTec2 preparation to the Celluclast preparation,318
lowers the yield of all process configurations (keeping all other process variables constant). However, this does319
in general not lead to a higher GWP, AP and POCP (Fig. 4a). This is due to the lower fossil energy use during320
the Celluclast production when compared to the Cellic CTec2 production. The configurations running at an321
enzyme load of 5 and 7.5 FPU/g DM, both at 30% DM and using the SHF process strategy are two notable322
exceptions to this generalization. For these configurations all environmental impacts are higher because the323
decrease in yield is too great for the lower fossil energy use for Celluclast production to compensate. In the324
case of eutrophication potential, the causal links are the same as for the enzyme load (Fig. 4b).325
3.3. Dry matter content and PEG addition326
The dry matter content has a direct influence on the yield of a configuration: the higher the dry matter327
content, the lower the yield which consequently leads to a higher energy use (both REU and NREU) and thus328
to a higher environmental impact (keeping all other process variables equal) (Figs. 3 and 4). The addition of329
polyethylene glycol (PEG) has a direct positive influence on the yield and thus on the total energy use and the330
environmental impact of a configuration (compare Figs. 3b and 3c).331
It should be noted that the production of PEG contributes little to all impact categories (Figs. 3c and 3f). The332
expected increase in the yield due to PEG addition is thus achieved without causing a significant environmental333
burden due to PEG production which is fossil-based. This is due to the small amount of PEG, 10 g per kg of334
dry matter, that was added to the experiments at 30% DM (Cannella and Jørgensen, 2014).335
3.4. Sensitivity and uncertainty analyses336
3.4.1. Mass and energy balances337
The additional use of fossil fuel by the base case configuration depends on the combustion efficiency of338
the fossil fuel and lignin combustion (assumed to be 90% and 75%, respectively). For instance, if the lignin339
combustion efficiency could be increased to 87%, then the base case configuration would not need additional340
fossil fuel. Avoiding additional fossil fuel use could also be achieved by increasing the energy efficiency of the341
pretreatment process step which needs a significant amount of energy (Fig. 5a). In this case, the pretreatment342
would need to be 29% more energy efficient in order to avoid additional fuel use in the base case configuration.343
These measures would lead to a reduction of approximately 14% of the GWP of the base case configuration.344
Such efficiency improvements would also change the environmental impact of the ethanol produced with345
the process configurations run at higher dry matter content. For instance, increasing the lignin combustion346
efficiency of the high gravity process configuration with the highest yield (Fig. 5b) to 87% would lead to an347
12

increase in the amount of lignin by-product from 0.74 MJ to 4.3 MJ. Consequently, the GWP allocated to the348
produced ethanol would decrease by approx. 8%. For the high gravity process configuration with the lowest349
yield (Fig. 5c) the amount of lignin by-product would increase from 13.6 MJ to 23.6 MJ, and reduce the GWP350
allocated to ethanol by approx. 15%.351
3.4.2. Allocation choices and system enlargement352
The impact results do not show a large sensitivity due to changes in the price of ethanol (allocation point353
B) or the pretreated fibre stream (allocation point A) (Fig. 2). Increasing the ethanol price from 600 e/tonne to354
825 e/tonne results in an increase of 0 to 6.5% in the impact results. Increasing the price of the pretreated355
fibre stream from 50 e/tonne to 86 e/tonne results in an increase of 0.4 to 10% in the impact results. The356
configurations with the lowest yields show the greatest sensitivity.357
Wheat straw may be considered as a waste product. This implies that the environmental burdens of the358
cultivation and harvesting operations (see Fig. 1) are all allocated to the production of the wheat grain because359
the straw will have no economic value under such a consideration. In the case of GWP, AP and POCP, this360
leads to a reduction of the environmental impact of 11 to 22%, 12 to 23% and 2 to 4%, respectively. In the361
case of EP, the reduction is more significant and is 43 to 52% (see also Fig. 3). The configurations using the362
Celluclast enzyme cocktail show the greatest sensitivity.363
System enlargement leads to different results for the environmental impact of a process configuration. To364
illustrate this, system enlargement was applied to the process configurations that are depicted in Fig. 5, and the365
results are shown in Fig. 6. The results show that, especially in the case of the process configurations with a366
lower yield, the amounts of the by-products that are produced have a significant influence on the environmental367
impact of a process configuration. However, for these three process configurations, the numerical results for368
GWP, AP and POCP are similar to those when applying economic allocation. The numerical results for EP369
show a larger discrepancy, where applying system enlargement results in a higher impact. It should be noted370
that these results strongly depend on the choice of alternative processes for the production of C5 molasses and371
heat produced by lignin combustion when modeling the system enlargement.372
3.4.3. Biogenic greenhouse gas emissions373
As stated in section 2.2, the impact that is caused by emissions of biogenic greenhouse gases (GHGs) was374
not included in the assessment. Hence, the benefits from CO2 uptake during growth were not included either.375
However, had this been done it would change the results for the GWP of the analyzed process configurations to376
a certain extent. What follows is a short discussion of where the main biogenic GHG emissions occur in the377
13

analyzed system from a cradle-to-gate and a cradle-to-grave perspective, and how the impact of these would378
manifest themselves.379
From a cradle-to-gate perspective, biogenic CO2 emission takes place during the fermentation: for every liter of380
ethanol that is produced from a C6 sugar via fermentation, 0.75 kg of CO2 is produced. Furthermore, biogenic381
CO2 is emitted when burning lignin pellets to meet the process energy demands (approx. 0.1 kg CO2 per MJ382
produced (AEA Technology, 2012)). When applying a cradle-to-grave perspective, by, for instance, using the383
produced ethanol as a transportation fuel and the C5 molasses in cow feed production, biogenic CO2 is also384
emitted during the combustion of the ethanol (1.5 kg of CO2 per liter of ethanol, assuming perfect combustion),385
and emissions of biogenic CH4 occur after consumption and digestion by cows of feed containing the C5386
molasses due to enteric fermentation (approx. 21 g CH4 per kg of dry matter feed intake (Flysjo et al., 2011);387
C5 molasses makes up a small percentage of this dry matter feed). Furthermore, excess lignin pellets that are388
produced and exported may be burned and thus emit biogenic CO2. All these emissions take place not long389
after the straw has been harvested.390
The GWP of all these emissions is counteracted by the uptake of CO2 due to the growth of wheat. Nevertheless,391
a certain amount of radiative forcing due to these emissions will occur because this uptake is not instantaneous.392
Therefore, incorporating the impact of biogenic CO2 in the assessment would increase the GWP for all process393
configurations from both the cradle-to-gate and cradle-to-grave perspective. However, this will only be a394
marginal increase due to the fast growth rate of wheat when compared to, for instance, trees (Liptow et al.395
(2014), unpublished results). It should be noted that the impact of biogenic GHGs depends on the end-of-life396
stage of the ethanol and the by-products. For instance, if the produced ethanol were used as a precursor for397
bio-polyethylene (bio-PE) production, the carbon may be sequestered for a longer time compared to using398
ethanol as a transportation fuel, depending on what type of product the bio-PE is applied in. Furthermore, the399
methods used to assess the impact of biogenic greenhouse gas emissions are still in development, and may400
currently introduce additional uncertainty in the assessment results.401
3.4.4. Enzyme recycling402
Because of the significant influence of the enzyme production and use, an analysis was done of the situation403
in which 25% of the activity of the enzyme is recycled. This value was chosen after consulting with an404
industrial project partner if this would be a feasible target. This was done for the base case configurations, and405
for the configurations running at high dry matter content with the highest and lowest yields. The analysis shows406
that improvements can be made in the environmental impact of the process configurations due to a reduction of407
the use of fresh enzyme preparation (Table 2). Other work already showed that an increase of enzyme activity408
14

will also improve the environmental impact of the process in which the enzyme is used (Liptow et al., 2013).409
3.4.5. Changes in energy mix410
The influence of the anticipated share of fossil fuel in the Danish energy mix over time (Lund and Mathiesen,411
2009; Danish Energy Agency, 2011) on the GWP of the enzyme production, and of the fossil fuel use for412
process energy, was analyzed. This was done for the base case configuration, and for the configurations413
running at high dry matter content with the highest and lowest yields (Table 3). The fossil fuel mix itself is414
also projected to change over time (largely replacing coal with natural gas, but maintaining oil use) and this415
was also taken into account. The results show that the total GWP of the configurations significantly decreases.416
Furthermore, the impact of the use of fossil fuel for process energy in the base case configuration does not417
change drastically (13%), while the impact of enzyme production decreases significantly (ca. 40%) (not shown418
in Table 3). Combining this result with the result of enzyme recycling (see section 3.4.4) indicates that the419
environmental impact of the process configurations can be improved significantly by having a more efficient420
enzyme use and a cleaner enzyme production.421
3.5. Comparison with other relevant studies422
The environmental impact of the tested process configurations were compared with those published in two423
other studies (Wang et al., 2013; Borrion et al., 2012). These studies were chosen because they also evaluated424
bioethanol production from wheat straw. Both studies were based on a plant design with a capacity of 2000425
metric tonnes per day of wheat straw, whereas the current study used raw lab data to perform the LCA of the426
experimental process configurations without scale-up considerations. It should be noted that no other studies427
were found that evaluated the influence of high gravity conditions on the environmental impact of second428
generation bioethanol production.429
Wang et al. (2013) studied the environmental sustainability of bioethanol production from wheat straw in the430
UK using, among others, liquid hot water pretreatment. This study was set up as a ’well-to-wheel’ LCA and the431
functional unit was ’to drive 1 km in a flexible-fuel vehicle’. The ethanol production process was based on the432
NREL corn stover-to-ethanol model (Humbird et al., 2011). The enzyme preparation for hydrolysis was Cellic433
CTec at a loading of 10 FPU/g glucan (approx. 3.3 FPU/g DM). The fermentation process was carried out using434
Zymomonas mobilis capable of fermenting both C5 and C6 monomer sugars. There was thus no C5 by-product435
stream. Instead, surplus electricity was the by-product which was credited with avoided emissions of average436
electricity generation. They found that enzyme production is a main contributor due to its energy-intensive437
nature. Furthermore, the ethanol production process (not including straw cultivation and harvesting) emitted438
15

4.52 kg CO2 per l ethanol. This however included biogenic CO2 emissions of approximately 2.8 kg/l ethanol439
from burning the distillation bottom product (Wang et al. (2013), p. 721, Fig. 4b). Therefore, approximately 1.7440
kg CO2,eq per l ethanol were emitted, assuming climate neutrality of the biogenic carbon. This is comparable441
to the results for the base case and most of the process configurations running at 30% DM with PEG addition442
(Figs. 3c and 3f), as well as most of the process configurations running at 20% DM (Figs. 3a and 3d).443
Borrion et al. (2012) did a LCA of bio-ethanol production from wheat straw and used an older version of the444
NREL corn stover-to-ethanol model (Aden et al., 2002) to describe the ethanol production process. The wheat445
straw was pretreated using dilute sulfuric acid hydrolysis. This study did not specify the enzyme preparation446
that was used. This was also a ‘well-to-wheel’ LCA and the functional unit was the amount of fuel needed to447
drive 1 km with a small passenger car. This study found a GWP of 3.3 kg CO2,eq per l ethanol when considering448
the ‘well-to-gate’, and a GWP of 2.6 kg kg CO2,eq per l of ethanol without straw cultivation and harvesting449
(Borrion et al. (2012), see p. 14, Table 5). Like Wang et al. (2013), this study also pointed out the significant450
contribution of the enzyme production. Furthermore, the global warming potential of the ethanol production451
(not including straw cultivation and harvesting) is comparable to or slightly higher than most of the process452
configurations run at 30% DM (Figs. 3b and 3e).453
4. Conclusion454
Higher dry matter content leads to a higher environmental impact of ethanol production. Nevertheless, the455
results indicate that reduction of the impact of enzyme production and use, and the use of PEG at 30% DM can456
compensate this increase. The results also show that the renewable and non-renewable energy use resulting457
from the different process configurations ultimately determine their environmental impact. Future development458
work may focus on determining the process conditions at which the environmental impact is minimized by459
finding the optimal dry matter content for the hydrolysis and fermentation, and decreased enzyme use while460
maintaining a high yield.461
Supplementary material462
Supplementary material is available as an electronic annex.463
Acknowledgements464
This study was funded by the Nordic Energy Top-level Research Initiative, project TFI PK-bio 02, “HG465
Biofuels”. We thank the other project participants for fruitful discussions throughout this work. We also thank466
16

Eoin White and Tomasz Stec for contributing to building the LCA model including the system enlargement.467
References468
Aden, A., Ruth, M., Ibsen, K., Jechura, J., Neeves, K., Sheehan, J., Wallace, B., Montague, L., Slayton, A.,469
Lukas, J., 2002. Lignocellulosic biomass to ethanol process design and economics utilizing co-current dilute470
acid prehydrolysis and enzymatic hydrolysis for corn stover. Research Report TP-510-32438, NREL.471
URL http://www.nrel.gov/docs/fy02osti/32438.pdf472
AEA Technology, 2012. 2012 Guidelines to Defra / DECC’s GHG Conversion Factors for Company Reporting.473
Tech. rep., Department of Energy and Climate Change (DECC) and the Department for Environment, Food474
and Rural Affairs (Defra).475
URL https://www.gov.uk/government/uploads/system/uploads/attachment data/file/69568/476
pb13792-emission-factor-methodology-paper-120706.pdf477
Althaus, H.-J., Chudacoff, M., Hischier, R., Jungbluth, N., Osses, M., Primas, A., 2007. Life cycle inventories478
of chemicals. Tech. Rep. ecoinvent report No. 8, EMPA Dubendorf.479
URL http://db.ecoinvent.org/reports/08 Chemicals.pdf480
Arvidsson, R., Fransson, K., Froling, M., Svanstrom, M., Molander, S., 2012. Energy use indicators in energy481
and life cycle assessments of biofuels: review and recommendations. J. Clean. Prod. 31, 54–61.482
Bentsen, N., Felby, C., 2012. Biomass for energy in the European Union - a review of bioenergy resource483
assessments. Biotechnol. Biofuels 5, 25.484
Borrion, A. L., McManus, M. C., Hammond, G. P., 2012. Environmental life cycle assessment of bioethanol485
production from wheat straw. Biomass Bioenerg. 47, 9–19.486
Cannella, D., Hsieh, C. C., Felby, C., Jørgensen, H., 2012. Production and effect of aldonic acids during487
enzymatic hydrolysis of lignocellulose at high dry matter content. Biotechnol. Biofuels 5, 26.488
Cannella, D., Jørgensen, H., 2014. Do new cellulolytic enzyme preparations affect the industrial strategies for489
high solids lignocellulosic ethanol production? Biotechnol. Bioeng. 111, 59–68.490
Cherubini, F., Strømman, A. H., 2011. Life cycle assessment of bioenergy systems: State of the art and future491
challenges. Bioresource Technol. 102, 437–451.492
17

Cherubini, F., Ulgiati, S., 2010. Crop residues as raw materials for biorefinery systems - A LCA case study.493
Appl. Energ. 87, 47–57.494
Danish Energy Agency, 2011. Energy strategy 2050 - from coal, oil and gas to green energy. Tech. rep., Danish495
Energy Agency.496
URL http://www.ens.dk/sites/ens.dk/files/dokumenter/publikationer/downloads/energy strategy 2050.pdf497
Ekman, A., Wallberg, O., Joelsson, E., Borjesson, P., 2013. Possibilities for sustainable biorefineries based on498
agricultural residues – A case study of potential straw-based ethanol production in Sweden. Appl. Energ.499
102, 299–308.500
Flysjo, A., Henriksson, M., Cederberg, C., Ledgard, S., Englund, J.-E., 2011. The impact of various parameters501
on the carbon footprint of milk production in New Zealand and Sweden. Agr. Syst. 104, 459–469.502
Frischknecht, R., Jungbluth, N., Althaus, H.-J., Bauer, C., Doka, G., Dones, R., Hischier, R., Hellweg, S.,503
Humbert, S., Kollner, T., Loerincik, Y., Margni, M., Nemecek, T., 2007. Implementation of life cycle impact504
assessment methods. Tech. Rep. ecoinvent report No. 3, Swiss Centre for Life Cycle Inventories.505
URL http://www.ecoinvent.org/fileadmin/documents/en/03 LCIA-Implementation.pdf506
Galbe, M., Sassner, P., Wingren, A., Zacchi, G., 2007. Process engineering economics of bioethanol production.507
In: Olsson, L. (Ed.), Biofuels. Vol. 108 of Advances in Biochemical Engineering/Biotechnology. Springer508
Berlin Heidelberg, pp. 303–327.509
Guinee, J., Gorree, M., Heijungs, R., Huppes, G., Kleijn, R., de Koning, A., van Oers, L., Wegener Sleeswijk,510
A., Suh, S., Udo de Haes, H., de Bruijn, H., van Duin, R., Huijbregts, M., 2002. Handbook on life cycle511
assessment. Operational guide to the ISO standards. Kluwer Academic Publishers, Dordrecht.512
Hillman, K. M., Sanden, B. A., 2008. Time and scale in Life Cycle Assessment: the case of fuel choice in the513
transport sector. Int. J. Alternative Propulsion 2, 1–12.514
Humbird, D., Davis, R., Tao, L., Kinchin, C., Hsu, D., Aden, A., Schoen, P., Lukas, J., Olthof, B., Worley, M.,515
Sexton, D., Dudgeon, D., 2011. Process design and economics for biochemical conversion of lignocellulosic516
biomass to ethanol - dilute-acid pretreatment and enzymatic hydrolysis of corn stover. Tech. Rep. NREL/TP-517
5100-47764, NREL.518
URL http://www.nrel.gov/docs/fy11osti/47764.pdf519
18
Hurter, R. W., 2007. Nonwood fiber raw materials and the biorefinery. In: 2007 TAPPI Engineering, Pulping &520
Environmental Conference.521
International Organization of Standardization, 2006. Environmental management - Life cycle assessment -522
Principles and framework (ISO 14040).523
Jørgensen, H., Kristensen, J. B., Felby, C., 2007. Enzymatic conversion of lignocellulose into fermentable524
sugars: challenges and opportunities. Biofuel. Bioprod. Bior. 1, 119–134.525
Koppram, R., Tomas-Pejo, E., Xiros, C., Olsson, L., 2014. Lignocellulosic ethanol production at high-gravity:526
challenges and perspectives. Trends Biotechnol. 32, 46–53.527
Larsen, J., Østergaard Haven, M., Thirup, L., 2012. Inbicon makes lignocellulosic ethanol a commercial reality.528
Biomass Bioenerg. 46, 36–45.529
Liptow, C., Tillman, A.-M., 2012. A Comparative Life Cycle Assessment Study of Polyethylene Based on530
Sugarcane and Crude Oil. J. Ind. Ecol. 16, 420–435.531
Liptow, C., Tillman, A.-M., Janssen, M., Wallberg, O., Taylor, G., 2013. Ethylene based on woody biomass:532
what are environmental key issues of a possible future swedish production on industrial scale. Int. J. Life533
Cycle Ass. 18, 1071–1081.534
Lund, H., Mathiesen, B., 2009. Energy system analysis of 100% renewable energy systems - The case of535
Denmark in years 2030 and 2050. Energy 34, 524–531.536
Morgen, C., 2006. Integrated biomass utilisation system. Tech. Rep. no. 486762, DONG Energy.537
URL http://www.biorefinery-euroview.eu/biorefinery/private/documents/Integrated%20Biomass%538
20Utilisation%20System.pdf539
Nemecek, T., Kagi, T., 2007. Life cycle inventories of agricultural production systems. Tech. Rep. ecoinvent540
report No. 15, Agrosope Reckenholz-Tanikon Research Station ART.541
URL http://db.ecoinvent.org/reports/15 Agriculture.pdf542
NREL, 2012. U.S. life cycle inventory database. Accessed April 2013.543
URL https://www.lcacommons.gov/nrel/search544
Puligundla, P., Smogrovicova, D., Obulam, V., Ko, S., 2011. Very high gravity (VHG) ethanolic brewing and545
fermentation: a research update. J. Ind. Microbiol. Biot. 38, 1133–1144.546
19
Qin, C., 2009. Lignin as alternative renewable fuel.547
URL http://www.altenergymag.com/emagazine/2009/06/lignin-as-alternative-renewable-fuel/1384548
Shibasaki, M., Albrecht, S., Kupfer, T., 2007. Small scale and large scale plants - effect on life cycle assessment.549
In: 17th European Symposium on Computer Aided Process Engineering - ESCAPE17. p. 6.550
Skøtt, T., 2011. Straw to Energy. Status, Technologies and Innovation in Denmark 2011. Tech. rep., INBIOM.551
URL http://www.inbiom.dk/download/viden biomasse/halmpjeceuk 2011.pdf552
Tillman, A.-M., 2000. Significance of decision-making for LCA methodology. Environ. Impact Assess. 20,553
113–123.554
Wang, L., Littlewood, J., Murphy, R. J., 2013. Environmental sustainability of bioethanol production from555
wheat straw in the UK. Renew. Sust. Energ. Rev. 28, 715–725.556
20

Table captions557
Table 1Energy content and price for the feedstock (wheat straw) and the products (ethanol, C5 molasses and lignin) of theprocess
Table 2Reduction in the environmental impacts due to enzyme recycling for the: a. base case (10% DM, 7.5 FPU, all processstrategies, yield = 92%); b. high gravity process configuration with the highest yield (30% DM, PEG addition,Cellic CTec2, 7.5 FPU, PSSF, yield = 89%); c. high gravity process configuration with the lowest yield (30% DM,Celluclast, 5 FPU, SHF, yield = 27%).
Table 3Global warming potentials (GWP) (in kg CO2,eq per liter of ethanol produced) due to projected changes in the Danishenergy mix for the: a. base case (10% DM, 7.5 FPU, all process strategies, yield = 92%); b. high gravity processconfiguration with the highest yield (30% DM, PEG addition, Cellic CTec2, 7.5 FPU, PSSF, yield = 89%); c. highgravity process configuration with the lowest yield (30% DM, Celluclast, 5 FPU, SHF, yield = 27%).
1
Figure captions558
Fig. 1. Cradle-to-gate system for the evaluation of the high gravity process configurations. The parts of the flowchart with the dashed lines have not been included in the assessment.
Fig. 2. Flow diagram of the Inbicon process (adjusted from Larsen et al. (2012)). In bold, the products are indicated;in italics, several flows are specified. Three allocation points applied in the LCA are indicated.
Fig. 3. Life cycle impact assessment results for the process and the base case configurations. Figs. 3a to 3c showthe results for the Cellic CTec2 enzyme preparations; Figs. 3d to 3f show the results for the Celluclast enzymepreparations. The numbers above the bars in the GWP charts are the ethanol yields of the configurations.
Fig. 4. Effects of the process variables on: a. global warming potential (GWP), acidification potential (AP) andphoto-chemical ozone creation potential (POCP); b. eutrophication potential (EP). A ‘+’-sign declares a positivecausal link, e.g. if the enzyme load increases, then the yield increases. A ‘−’-sign declares a negative causal link, e.g.if DM content increases, then yield decreases. In red, the main differences between the diagrams are indicated.
Fig. 5. Sankey diagrams of the energy flows in the: a. base case (yield = 92%) (10% DM, 7.5 FPU, all processstrategies); b. high gravity process configuration with the highest yield (yield = 89%) (30% DM, PEG addition,Cellic CTec2, 7.5 FPU, PSSF); c. high gravity process configuration with the lowest yield (yield = 27%) (30% DM,Celluclast, 5 FPU, SHF). The flows through the main process, and the amounts of renewable and non-renewable fuelused are distinguished.
Fig. 6. Results of the LCA when applying system enlargement for the: a. base case (10% DM, 7.5 FPU, all processstrategies); b. high gravity process configuration with the highest yield (30% DM, PEG addition, Cellic CTec2, 7.5FPU, PSSF); c. high gravity process configuration with the lowest yield (30% DM, Celluclast, 5 FPU, SHF).
1

Tables559
Table 1
Energy content [MJ/kg] Price [e/tonne]
Wheat straw 17.2 401
Ethanol 29.7 6002
Lignin 24 3003
C5 molasses 18 864
1 Price of wheat straw fluctuates significantly; e40 per delivered
tonne is assumed (Ekman et al., 2013).2 http://www.nasdaq.com/markets/ethanol.aspx3 Assumed to be sold as an alternative renewable fuel (Qin, 2009).4 See Morgen (2006).
560
1
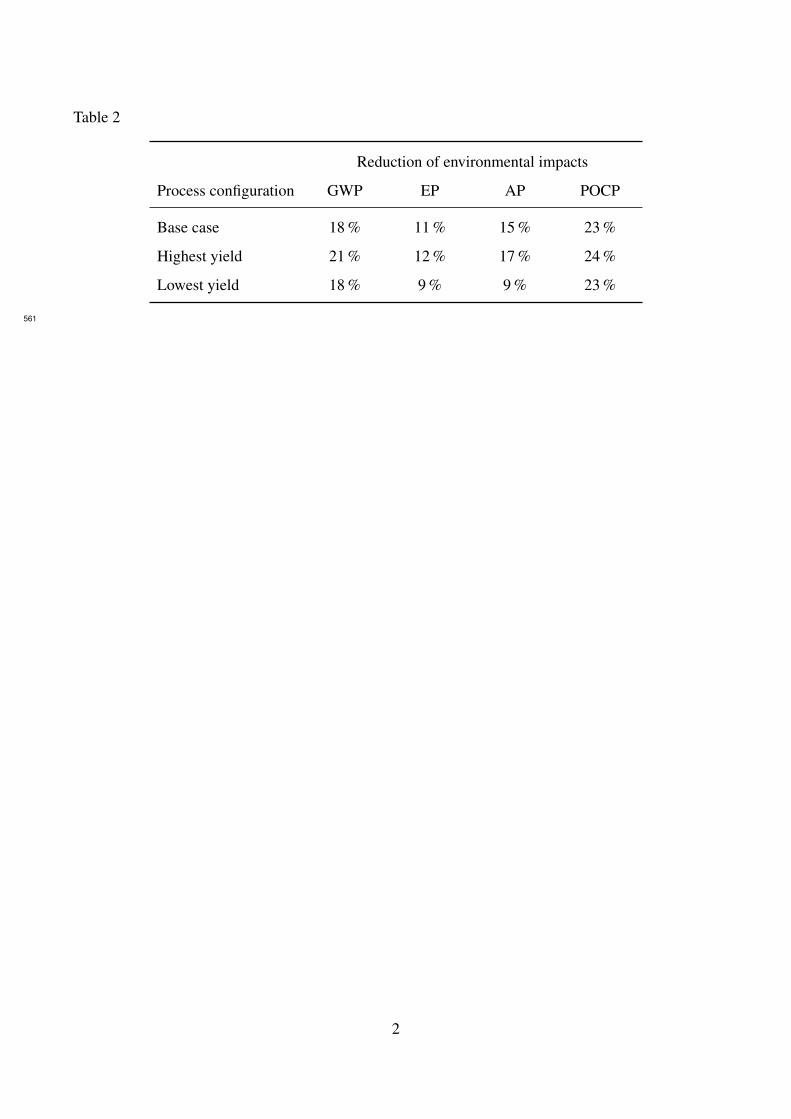
Table 2
Reduction of environmental impacts
Process configuration GWP EP AP POCP
Base case 18 % 11 % 15 % 23 %
Highest yield 21 % 12 % 17 % 24 %
Lowest yield 18 % 9 % 9 % 23 %
561
2

Table 3
Fossil share in energy mix
80 % 67 % 50 %
Process configuration GWP [kg CO2,eq/l of ethanol]
Base case 2.6 2.3 1.7
Highest yield 2.3 2.0 1.5
Lowest yield 3.1 2.6 2.0
562
3

Figures563
Figure 1
Resource extraction, production of auxiliary raw material and energy
Fuel and electricityproduction/use
Enzyme & chemicalsproduction
Cultivation and harvestingoperations (field)
T straw chemicalsT
Production of ethanol and co-products
Feedstockpretreatment
Ethanol formation(hydrolysis, fermentation)
Purification(distillation)
Supporting activitiesEnergy (steam, electricity) production, water use
Reference flow T distribution to the pump
Use phase
Backgroundsystem
Foregroundsystem
T = transport
564
1

Figure 2
Separation
Distillation Bioethanol
Hydrolysis andfermentation
Drying andpelletizing
Lignin pellets
Evaporation
C5 molasses
Separationand wash
Pretreatment
Preparation(cutting and DM
adjustment)
Wheat cultivationand harvestingGrain
Allocationpoint B
Allocationpoint A
Allocationpoint C
Solids
Liquid
Fibres
Liquid
Con
dens
ate
cont
aini
ngac
etic
acid
Pote
ntia
lenz
yme
recy
clin
g
Straw
565
2

Figure 3
0
1
2
3
4
5
GW
P [
kg C
O2-e
q]
0.0
5.0×10⁻³
1.0×10⁻²
1.5×10⁻²
2.0×10⁻²
EP
[kg N
Ox-e
q]
Bas
e ca
sePSSF 5
FPU
PSSF 7.5
FPU
SHF 5
FPU
SHF 7
.5 F
PUSSF 5
FPU
SSF 7.5
FPU
Process configurations
0.0
1.0×10⁻²
2.0×10⁻²
3.0×10⁻²
AP
[kg S
O2-e
q]
Bas
e ca
sePSSF 5
FPU
PSSF 7.5
FPU
SHF 5
FPU
SHF 7
.5 F
PUSSF 5
FPU
SSF 7.5
FPU
Process configurations
0.0
1.0×10⁻³
2.0×10⁻³
3.0×10⁻³
PO
CP
[kg e
thyle
ne-
eq]
70.3
84.1 59.173.1
73.7
86.392.0
(a) Cellic CTec 2, 20% DM
0
1
2
3
4
5
GW
P [
kg C
O2-e
q]
0.0
5.0×10⁻³
1.0×10⁻²
1.5×10⁻²
2.0×10⁻²
EP
[kg N
Ox-e
q]
Bas
e ca
sePSSF 5
FPU
PSSF 7.5
FPU
SHF 5
FPU
SHF 7
.5 F
PUSSF 5
FPU
SSF 7.5
FPU
Process configurations
0.0
1.0×10⁻²
2.0×10⁻²
3.0×10⁻²
AP
[kg S
O2-e
q]
Bas
e ca
sePSSF 5
FPU
PSSF 7.5
FPU
SHF 5
FPU
SHF 7
.5 F
PUSSF 5
FPU
SSF 7.5
FPU
Process configurations
0.0
1.0×10⁻³
2.0×10⁻³
3.0×10⁻³
PO
CP
[kg e
thyle
ne-
eq]
92.0 50.7
61.8
49.2
62.837.7
45.8
(b) Cellic CTec2, 30% DM
0
1
2
3
4
5
GW
P [
kg C
O2-e
q]
0.0
5.0×10⁻³
1.0×10⁻²
1.5×10⁻²
2.0×10⁻²
EP
[kg N
Ox-e
q]
Bas
e ca
sePSSF 5
FPU
PSSF 7.5
FPU
SHF 5
FPU
SHF 7
.5 F
PUSSF 5
FPU
SSF 7.5
FPU
Process configurations
0.0
1.0×10⁻²
2.0×10⁻²
3.0×10⁻²
AP
[kg S
O2-e
q]
Bas
e ca
sePSSF 5
FPU
PSSF 7.5
FPU
SHF 5
FPU
SHF 7
.5 F
PUSSF 5
FPU
SSF 7.5
FPU
Process configurations
0.0
1.0×10⁻³
2.0×10⁻³
3.0×10⁻³
PO
CP
[kg e
thyle
ne-
eq]
60.1 89.1 61.1 88.8
46.074.092.0
(c) Cellic CTec2, 30% DM with PEG addition
0
1
2
3
4
5
GW
P [
kg C
O2-e
q]
0.0
5.0×10⁻³
1.0×10⁻²
1.5×10⁻²
2.0×10⁻²
EP
[kg N
Ox-e
q]
Bas
e ca
sePSSF 5
FPU
PSSF 7.5
FPU
SHF 5
FPU
SHF 7
.5 F
PUSSF 5
FPU
SSF 7.5
FPU
Process configurations
0.0
1.0×10⁻²
2.0×10⁻²
3.0×10⁻²
AP
[kg S
O2-e
q]
Bas
e ca
sePSSF 5
FPU
PSSF 7.5
FPU
SHF 5
FPU
SHF 7
.5 F
PUSSF 5
FPU
SSF 7.5
FPU
Process configurations
0.0
1.0×10⁻³
2.0×10⁻³
3.0×10⁻³
PO
CP
[kg e
thyle
ne-
eq]
57.065.2
42.3 54.6
59.166.3
92.0
(d) Celluclast, 20% DM
0
1
2
3
4
5
GW
P [
kg C
O2-e
q]
0.0
5.0×10⁻³
1.0×10⁻²
1.5×10⁻²
2.0×10⁻²
EP
[kg N
Ox-e
q]
Bas
e ca
sePSSF 5
FPU
PSSF 7.5
FPU
SHF 5
FPU
SHF 7
.5 F
PUSSF 5
FPU
SSF 7.5
FPU
Process configurations
0.0
1.0×10⁻²
2.0×10⁻²
3.0×10⁻²
AP
[kg S
O2-e
q]
Bas
e ca
sePSSF 5
FPU
PSSF 7.5
FPU
SHF 5
FPU
SHF 7
.5 F
PUSSF 5
FPU
SSF 7.5
FPU
Process configurations
0.0
1.0×10⁻³
2.0×10⁻³
3.0×10⁻³
PO
CP
[kg e
thyle
ne-
eq]
30.638.4
27.3
28.9
30.0 38.2
92.0
(e) Celluclast, 30% DM
0
1
2
3
4
5
GW
P [
kg C
O2-e
q]
0.0
5.0×10⁻³
1.0×10⁻²
1.5×10⁻²
2.0×10⁻²
EP
[kg N
Ox-e
q]
Bas
e ca
se
PSSF 7.5
FPU
SHF 7
.5 F
PU
SSF 7.5
FPU
Process configurations
0.0
1.0×10⁻²
2.0×10⁻²
3.0×10⁻²
AP
[kg S
O2-e
q]
Bas
e ca
se
PSSF 7.5
FPU
SHF 7
.5 F
PU
SSF 7.5
FPU
Process configurations
0.0
1.0×10⁻³
2.0×10⁻³
3.0×10⁻³
PO
CP
[kg e
thyle
ne-
eq]
48.845.9
54.192.0
(f) Celluclast, 30% DM with PEG additionUse of fossil fuel for process energy
Combustion of lignin for process energy
Enzyme production
PEG production
Production of additional chemicalsStraw pretreatment
Straw preparation
Straw cultivation & harvesting
566
3

Figure 4
APGWPPOCP
NREU
+
Yield
-
PEG
+
DM content
-
Enzyme load
+
+
Type of enzymepreparation
-
-
from Cellic CTec2to Celluclast
(a) Causal diagram for GWP, AP and POCP
EP
REU
+
Yield
-
PEG
+
DM content
-
Enzyme load
+
Type of enzymepreparation
-
from Cellic CTec2to Celluclast
(b) Causal diagram for EP
567
4

Figure 5
568
5

Figure 6
-2
-1
0
1
2
3
4
5
GW
P [
kg
CO
2-e
q]
-1.0×10⁻²
0.0
1.0×10⁻²
2.0×10⁻²
3.0×10⁻²
EP
[k
g N
Ox-e
q]
Basecase
Highestyield
Lowestyield
Process configurations
-2.0×10⁻²
-1.0×10⁻²
0.0
1.0×10⁻²
2.0×10⁻²
3.0×10⁻²
4.0×10⁻²
AP
[k
g S
O2-e
q]
Basecase
Highestyield
Lowestyield
Process configurations
-1.0×10⁻³
0.0
1.0×10⁻³
2.0×10⁻³
3.0×10⁻³
PO
CP
[k
g e
thy
len
e-eq
]
Use of fossil fuel for process energy
Combustion of lignin for process energy
Enzyme production
PEG production
Production of additional chemicalsStraw pretreatment
Straw preparation
Straw cultivation & harvesting
Avoided emission due to C5 molasses production
Avoided emissions due to lignin production
Base case (yield = 92%) - 10% DM, Cellic CTec2,
7.5 FPU, all process strategies
Highest yield (yield = 89%) - 30% DM, Cellic CTec2
7.5 FPU, PSSF, PEG addition
Lowest yield (yield = 27%) - 30% DM, Celluclast
5 FPU, SHF
569
6