Validating the use of 137Cs measurements to estimate rates of soil redistribution by wind
Upload
independentCategory
view
0download
0
lable at ScienceDirect
Journal of Environmental Radioactivity 100 (2009) 489–496
Contents lists avai
Journal of Environmental Radioactivity
journal homepage: www.elsevier .com/locate/ jenvrad
Influence of fertilizing on the 137Cs soil–plant transfer in a spruce forestof Southern Germany
G. Zibold a,*, E. Klemt a, I. Konopleva a, A. Konoplev b
a Hochschule Ravensburg-Weingarten, University of Applied Sciences, 88250 Weingarten, Germanyb Scientific Production Association ‘‘TYPHOON’’, Obninsk, Russia
a r t i c l e i n f o
Article history:Received 6 August 2008Received in revised form4 March 2009Accepted 12 March 2009Available online 18 April 2009
Keywords:137Cs root uptakeFertilizationForest soilSelective sorption
* Corresponding author. Hochschule Ravensburg-D-88241 Weingarten, Germany. Tel.: þ49 751 94011;
E-mail address: [email protected] (G. Zibo
0265-931X/$ – see front matter � 2009 Elsevier Ltd.doi:10.1016/j.jenvrad.2009.03.011
a b s t r a c t
Fertilization with 2.5 t/ha limestone: (83% CaCO3, 8% MgO, 6% K2O, 3% P2O5) reduces the 137Cs transferfrom spruce forest soil into plants like fern (Dryopteris carthusiana) and blackberry (Rubus fruticosus) bya factor of 2–5 during at least 11 years as measured by the aggregated transfer factor Tag. In 1997 and2006 these results were confirmed by additional measurements of the 137Cs transfer factor TF, related tothe root zone (Oh horizon), which were explained by the selective sorption of 137Cs in the root zone bymeasurements of the Radiocaesium Interception Potential (RIP) in fertilized (RIP> 179 meq/kg) and non-fertilized soils (RIP< 74 meq/kg).
� 2009 Elsevier Ltd. All rights reserved.
1. Introduction
Forest liming has been used successfully in Europe for morethan 50 years to revitalize forests and reduce acid water runoff. InGermany since 1984 about 3 million ha have been limed which isnearly 1/3 of the total forest area (Bericht uber den Zustand desWaldes, 2006). Together with liming, improvement of the soilnutrient quality by additions of potassium (K2O) and phosphate(P2O5) fertilisers have been used as a standard practice in Baden-Wurttemberg (Forstliche Versuchs- und Forschungsanstalt BW,2000). In a radioactive fallout situation e.g. after the Chernobylaccident 1986, it is of interest to investigate the effects of fertil-ization on the 137Cs activity concentration in forest plants and toassess whether fertilization can be a possible countermeasure orrestoration technique (Fesenko et al., 2005). A one-time treatmentof a spruce forest site (Baden-Wurttemberg, Germany) in 1984 withfertiliser consisting mainly of CaCO3 has been found to reducesubstantially the 137Cs uptake. At this site the highest fraction of thetotal caesium inventory was found in the Oh horizon, rich in organicmatter (Lindner et al., 1994). After the treatment the effect of liminghas been measured in the years between 1991 and 1996 (Drissner
Weingarten, P.O. Box 1261,fax: þ49 751 501 9876.ld).
All rights reserved.
et al., 1996; Zibold et al., 1997, 2003). Konopleva et al. (1998)showed that results of liming are morphological changes of litterand changes of characteristics of the root soil layer, determining thebiological availability of 137Cs, the parameters of caesium selectivesorption, radiocaesium exchangeability and ion composition ofa soil solution. On the basis of a model of 137Cs transfer from soil toplants the prediction of 137Cs transfer factors for forest plants hasbeen made.
In central Finland Levula et al. (2000) reported the decrease ofthe 137Cs concentrations in lingonberry (Vaccinium vitis-idaea L.)berries in a 100-year-old Scots pine (Pinus sylvestris L.) stand due toash fertilization and prescribed burning. Kaunisto et al. (2002)discussed the effect of fertilization on the potassium and radio-caesium distribution in tree stands (P. sylvestris L.) and peat ona pine mire; fertilization with potassium-containing fertilisersdecreased the caesium uptake by pine trees considerably. Inwestern Finland fertilization experiments using potassium fertiliseron a scots pine stand were reported (Brechignac et al., 2006). The137Cs concentrations in bark, wood and needles of Scots pine, aswell as in many samples of branches of different ages, were foundto be lower in the fertilized plots than in the control plots, both onmineral soil and on peat-land. On the mineral soil site, the 137Csconcentration was lower in Deschampsia flexuosa and Vacciniummyrtillus on the fertilized plots as compared to the control plots. Inherbs, grasses, dead vegetation, Dryopteris carthusiana, and V. vitis-idaea the activity concentrations at fertilized plots were 38–68% of
G. Zibold et al. / Journal of Environmental Radioactivity 100 (2009) 489–496490
those at control plots, although the differences were not statisti-cally significant (Brechignac et al., 2006).
In agricultural soils the application of lime and fertilisers mayinfluence the concentration of major elements (such as K, Ca and Mg)in the plant root exchange complex and in the soil solution, thuschanging equilibrium parameters affecting the interaction betweenthe soil matrix and radiocaesium (Lembrechts, 1993; Konoplev et al.,1993; Rauret and Firsakova, 1996; Rauret et al., 1996). Camps et al.(2004) found that ploughing plus reseeding plus applying K-fertiliserled to a maximal decrease in radiocaesium transferat most sites. At thedoses applied, lime did not affect the Ca2þ and Mg2þ concentrations inthe exchange complex and soil solution of the ploughed soils. Withrespect to radiocaesium, anincrease inthe Kþand NH4
þ concentrationsin the exchange complex and soil solution was consistent with anincrease in soil–plant transfer.
The objective of this paper was to study the migration andbioavailability of 137Cs in non-fertilized and fertilized soils of spruceforest in the pre-alpine region in South-Western Germany inconnection with soil characteristics and soil solution composition.Results from field measurements spread over 15 years aresummarized and compared with data from soil analysis. Specialattention was devoted to the uptake of 137Cs by the plants fern (D.carthusiana) and blackberry (Rubus fruticosus) and its quantitativeassessment.
2. Materials and methods
2.1. Sampling sites, altitude, precipitation, soil type, geology
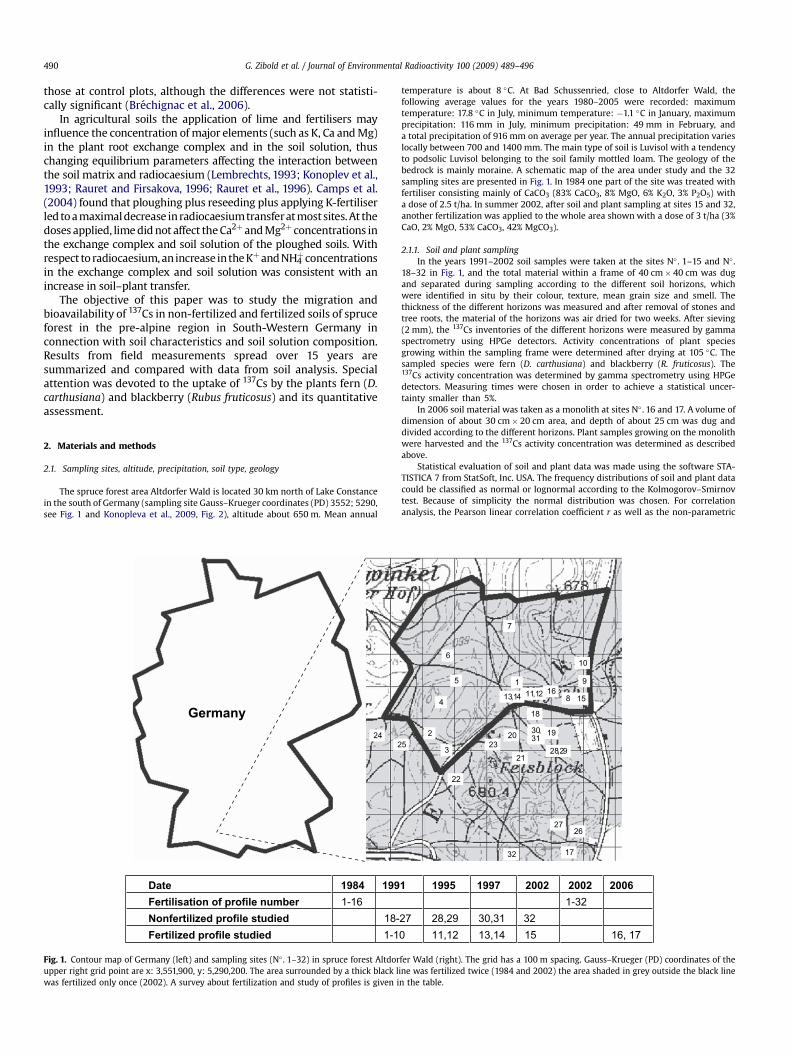
The spruce forest area Altdorfer Wald is located 30 km north of Lake Constancein the south of Germany (sampling site Gauss–Krueger coordinates (PD) 3552; 5290,see Fig. 1 and Konopleva et al., 2009, Fig. 2), altitude about 650 m. Mean annual
Date 1984 199
Fertilisation of profile number 1-16 Nonfertilized profile studied 18-Fertilized profile studied 1-1
242
Germany
Fig. 1. Contour map of Germany (left) and sampling sites (N� . 1–32) in spruce forest Altdorupper right grid point are x: 3,551,900, y: 5,290,200. The area surrounded by a thick black lwas fertilized only once (2002). A survey about fertilization and study of profiles is given i
temperature is about 8 �C. At Bad Schussenried, close to Altdorfer Wald, thefollowing average values for the years 1980–2005 were recorded: maximumtemperature: 17.8 �C in July, minimum temperature: �1.1 �C in January, maximumprecipitation: 116 mm in July, minimum precipitation: 49 mm in February, anda total precipitation of 916 mm on average per year. The annual precipitation varieslocally between 700 and 1400 mm. The main type of soil is Luvisol with a tendencyto podsolic Luvisol belonging to the soil family mottled loam. The geology of thebedrock is mainly moraine. A schematic map of the area under study and the 32sampling sites are presented in Fig. 1. In 1984 one part of the site was treated withfertiliser consisting mainly of CaCO3 (83% CaCO3, 8% MgO, 6% K2O, 3% P2O5) witha dose of 2.5 t/ha. In summer 2002, after soil and plant sampling at sites 15 and 32,another fertilization was applied to the whole area shown with a dose of 3 t/ha (3%CaO, 2% MgO, 53% CaCO3, 42% MgCO3).
2.1.1. Soil and plant samplingIn the years 1991–2002 soil samples were taken at the sites N� . 1–15 and N� .
18–32 in Fig. 1, and the total material within a frame of 40 cm� 40 cm was dugand separated during sampling according to the different soil horizons, whichwere identified in situ by their colour, texture, mean grain size and smell. Thethickness of the different horizons was measured and after removal of stones andtree roots, the material of the horizons was air dried for two weeks. After sieving(2 mm), the 137Cs inventories of the different horizons were measured by gammaspectrometry using HPGe detectors. Activity concentrations of plant speciesgrowing within the sampling frame were determined after drying at 105 �C. Thesampled species were fern (D. carthusiana) and blackberry (R. fruticosus). The137Cs activity concentration was determined by gamma spectrometry using HPGedetectors. Measuring times were chosen in order to achieve a statistical uncer-tainty smaller than 5%.
In 2006 soil material was taken as a monolith at sites N� . 16 and 17. A volume ofdimension of about 30 cm� 20 cm area, and depth of about 25 cm was dug anddivided according to the different horizons. Plant samples growing on the monolithwere harvested and the 137Cs activity concentration was determined as describedabove.
Statistical evaluation of soil and plant data was made using the software STA-TISTICA 7 from StatSoft, Inc. USA. The frequency distributions of soil and plant datacould be classified as normal or lognormal according to the Kolmogorov–Smirnovtest. Because of simplicity the normal distribution was chosen. For correlationanalysis, the Pearson linear correlation coefficient r as well as the non-parametric
1 1995 1997 2002 2002 2006
1-32 27 28,29 30,31 32 0 11,12 13,14 15 16, 17
10
9
8
1
7
6
5
4
2
3
18
1920
21
22
235
2627
28,29
11,1213,14
30,31
32
1516
17
fer Wald (right). The grid has a 100 m spacing. Gauss–Krueger (PD) coordinates of theine was fertilized twice (1984 and 2002) the area shaded in grey outside the black linen the table.

0 200 400 600 800 1000 1200 1400
Dep
th
, cm
137Cs, Bq/(m
²*cm)
0
4
8
12
16
LOf
Oh
Ah
B
0 1000 2000 3000 4000 5000 6000
Dep
th
, cm
137Cs, Bq/(m²*cm)
0
4
8
12
16
LOf
Oh
Ah
B
0 500 1000 1500 2000 2500 3000 3500
Dep
th
, cm
137Cs, Bq/(m² * cm)
Oh
B
L
Ah
Of
0
10
20
a
b
c
Fig. 2. Depth distribution of the 137Cs activity concentration at spruce sites a) site N� .30, non-fertilized; b) site N� . 13, fertilized in 1984; c) site N� . 16 fertilized in 1984 and2002. Profiles a) and b) were studied in 1997; profile c) in 2006. All activities are decaycorrected for May 1st, 1986. Ah horizons are visualized in black as border layer betweenorganic and mineral horizons.
G. Zibold et al. / Journal of Environmental Radioactivity 100 (2009) 489–496 491
Spearman Rank correlation coefficient R were calculated for the statistical signifi-cance p< 0.05. If only the correlation coefficient r is given, both evaluations agreesatisfactorily.
2.1.2. Aggregated transfer factor Tag soil–plantTag (in m2/kg) is defined by the caesium activity concentration (in Bq/kg) of the
dry mass of the plants, divided by the total inventory (in Bq/m2) of the soil. Thus, thevalue of Tag is related to the total inventory, which means that the geometry of plantroots, the depth distribution of 137Cs, and the availability of the 137Cs to plants in theroot zone layer are not taken into consideration. This causes a high variability of Tag.Measured values of Tag for a plant can vary by a factor 100–1000, depending onconditions in the soil and the distribution of roots of the respective plants (IAEA,1994). Tag determination was done for all soil profiles.
2.1.3. Transfer factor TF soil–plant, attributed to the root zoneTF (in Bq/kg/Bq/kg) is defined by the caesium activity concentration (in Bq/kg) of
the dry mass of the plants, divided by the caesium activity concentration (in Bq/kg)
of the air dried soil from the horizon, where most of the plant roots are located. Forfern and blackberry in spruce forest this is the Oh horizon. TF determination wasdone for sites 13, 14, 16, 17 fertilized and 30 and 31 non-fertilized at the date ofsampling. Five more sites in non-fertilized spruce forest in the neighbourhood werestudied and the results are given in Konopleva et al. (2009). Those results areconsidered in this discussion as well.
2.2. Radiocaesium interception potential (RIP)
The product of the distribution coefficient Kd (137Cs) and the potassiumconcentration in the soil represents the value of the radiocaesium interceptionpotential RIP(Kþ) in relation to potassium, which will be written as ‘‘RIP’’ in thiswork. RIP is a measure for the selective sorption of 137Csþ by soils.
2.2.1. RIP determination (Wauters et al., 1996)The air dried soil sample with organic matter being present (about 1 g) was
equilibrated with a mixed potassium–calcium solution (0.5 mM KClþ 100 mMCaCl2) to mask the regular exchange sites (RES) by Ca2þ and to saturate frayed edgesites (FES) by Kþ. After pre-saturation (3 times 20 h) a phase separation wasimplemented by centrifugation and the centrifuged soil sample was equilibratedwith the same K–Ca solution, now spiked with 137Cs. (The level of contamination ofthe original soil was <0.83 Bq/g 137Cs and the exchangeability was <17%, so we had<0.14 Bq 137Cs in solution. The level of the spiked solution was 10 Bq 137Cs, which isabout 100 times more than in the original soil). After 24 h the distribution coefficientKd (137Cs) was obtained by measuring the Cs activity remaining in the solution. RIPdetermination was done for sites 13, 14, 16, 17 and 30, 31 in this work and earlier forsite 30 by Konoplev et al. (1997) and for sites 13 and 30 by Konopleva et al. (1998)and Konoplev et al. (1999).
The radiocaesium interception potential in a NH4 scenario, RIP(NH4), wasmeasured in the same way, only NH4Cl was used instead of KCl. RIP(NH4) wasmeasured in order to estimate the selectivity coefficient KC(NH4/K) on frayed edgesites (FES) (Table 3).
2.2.2. 137Cs exchangeability aex, exchangeable cations and prediction of TF for 137CsAfter determining its 137Cs activity the soil sample (50 g) was equilibrated with
1 M NH4OAc during 24 h using a solid/liquid ratio of 1:10 for mineral layers and of1:20 for organic layers. The soil suspension was centrifuged and the solution wasfiltered through a 0.45 mm membrane filter. The ratio of 137Cs in the solution to thatin the soil is its exchangeability. Contents of exchangeable Caþ, Mgþ, and Kþ weremeasured in a 1 M NH4OAc extract. Exchangeable ammonium was determined inthe same way using a 2 M KCl extract. 137Cs exchangeability was determined for thesame sites as was RIP.
To predict the value of TF for 137Cs, one hypothesis has been to assume that TF isproportional to the fraction of 137Cs in the root exchange complex at the plasma-lemma, which depends on the composition of the soil solution (Smolders et al.,1997). Using this hypothesis Konoplev et al. (1996, 1998) and Konoplev and Kono-pleva, 1999, developed a model which describes the bioavailability of 137Cs in soil asexpressed in the form:
TF ¼ A$B ¼ aex
RIP$½K�ssþKcðNH4=KÞ$½NH4�ssffiffiffiffiffiffiffiffiffiffiffiffiffiffiffiffiffiffiffiffiffiffiffiffiffi
½Ca�ssþ½Mg�p
ss
$B (1)
In this formula A is the ‘‘availability’’ factor, B, the proportionality coefficientbetween A and TF, is a plant specific property and characterizes the ability ofa specific plant to sorb radiocaesium on the root exchange complex and transfer itthrough the cell wall, aex is the exchangeability of radiocaesium in soil, RIP isa measure for the selective sorption of 137Csþ by soils, Kc(NH4/K) is the selectivitycoefficient of NH4
þ ions with respect to the competing ion Kþ, in rectangular brackets[ ] are the cation concentrations in the soil solution. This model was successfullytested for forest soils from Upper Swabia, Russia, Sweden and Switzerland (Kono-plev et al., 1999, 2000). If sorption both on frayed edge sites (FES) and regularexchange sites (RES) is considered, this factor A can be rewritten as:
A ¼ aex�KFES
d þ KRESd
�� 1ffiffiffiffiffiffiffiffiffiffiffiffiffiffiffiffiffiffiffiffiffiffiffiffiffiffiffiffiffi½Ca�ssþ½Mg�ss
p (2)
where ðKFESd þ KRES
d Þ ¼ Kexd ðCsÞ was calculated. Kex
d is defined as the ratio of theconcentration of radionuclide reversibly sorbed by the solid phase to its concen-tration in the liquid phase (Konoplev et al., 1992)
Kexd ðCsÞ ¼ RIP
½K�ssþKFESc ðNH4=KÞ½NH4�ss
þ ½K�exþ½NH4�ex½K�ssþ½NH4�ss
(3)
[ ]ex are exchangeable cation concentrations in soil. These equations are used topredict the values of TF, the transfer of 137Cs from the root zone to the plant. Thesame equations were used by Konopleva et al. (2009) to explain that in spruce forestthe bioavailability of radiocaesium was on average seven times higher than in mixedforest on sites in the neighbourhood to those of this study (Lindner et al., 1994).
G. Zibold et al. / Journal of Environmental Radioactivity 100 (2009) 489–496492
Soil pH was measured in 0.01 M CaCl2 using a solid–liquid ratio of 1:2.5 formineral layers and a solid–liquid ratio of 1:5 for organic layers after 2 h ofequilibration.
Soil texture was determined using a hydrometer method (Gee and Bauder, 1986)after destruction of organic matter with hydrogen peroxide (30%). Classification ofthe soil by grain size was done according to USDA (US Department of Agriculture)standard.
The organic matter content in samples (OM in Table 2) was determined by loss onignition (10 h at 450 �C).
2.2.3. Soil solution isolationTo collect original soil solution at sites 16 and 17 a syringe without plunger was
supplied with a paper filter. Then the soil sample was added and covered with glassfiber as a plug. The syringe with the soil was centrifuged for 1 h at 1700 g. The soilsolution was filtered through a 0.45 mm membrane filter.
Soil solution at sites 13 and 30 was gained by rewetting dried soil samples ina solid/liquid ratio of 1:5.
Cation content (K, Ca, and Mg) in soil solution was determined using atomicabsorption spectrophotometry (AAS). The uncertainties are 0.1 mg/l for K and Mgand 0.2 mg/l for Ca. The NH4 in soil solution was measured with a colorimetricmethod by indophenol reaction (Krom, 1980). The uncertainty was about 5% astested by replicates.
3. Results for fertilized and non-fertilized soils
3.1. Depth distribution of 137Cs in forest soil
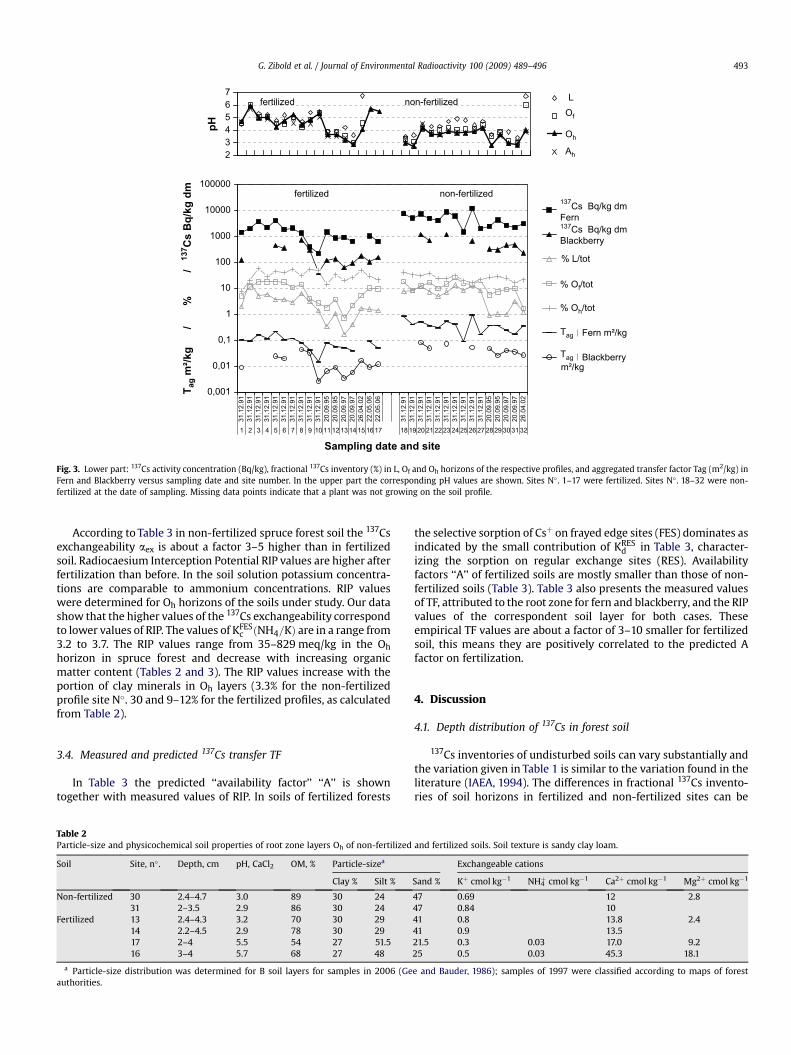
As can be seen in Fig. 2 the spatial distribution of 137Cs in typicalprofiles of spruce forest soil is changing only slightly under theinfluence of time and fertilization. Maxima of the 137Cs activityconcentration are found always in Oh or Ah horizons. The thicknessof the total humus layer (L, Of, and Oh) is independent of thetimespan of (13 or 22) years after fertilization and does not dependon fertilization (see also Table 1). Only the fraction of 137Cs in the Oh
horizon is larger in fertilized soil (see also Table 1).In Table 1, expectation values and standard deviations of the
properties of all soil profiles studied are given. The data sets used inTable 1 can be described with normal distributions according to theKolmogorov–Smirnov test and are thus characterized by thearithmetic mean and standard deviation of the correspondingnormal distribution. 137Cs inventories in the fertilized profilesstudied are about 20% higher than those in non-fertilized profilesand the variation in total inventories is substantial as indicated bythe large standard deviation in both fertilized and non-fertilizedplots. The mean fractional inventory is higher in non-fertilized L, Of
an Ah horizons than in the respective fertilized horizons. In fertil-ized Oh horizons the mean fractional inventory is highest andamounts to 34%. Mean values of pH are higher in fertilized L, Of, Oh
and Ah horizons than in non-fertilized horizons. Mean values of thelower bound of the depth of non-fertilized horizons are by 0.1–0.7 cm larger than in fertilized horizons (Table 1). For all thesequantities standard deviations are substantial indicating that thetrends described above are masked by the variability of thequantities.
Table 1Properties of soil profiles: Arithmetic mean and standard deviation (s.d.) calculated fromdistribution, (Kolmogorov–Smirnov p¼ non significant was fulfilled); 137Cs soil inventor
Soil Value 137Cs soil inventory 1.05.86 pH in soil horizons De
Total Fraction
L/tot Of/tot Oh/tot Ah/tot L Of Oh Ah L
Bq/m2 % cm
Non-fertilized Mean 12,377 6 13 26 27 4.3 3.9 3.5 3.6 1.5s.d. 2738 4 6 7 16 0.8 0.7 0.5 0.5 0.5
Fertilized Mean 16,155 3 9 34 19 4.9 4.5 4.6 4.3 1.4s.d. 3704 4 6 15 9 0.8 0.8 0.9 0.8 0.6
a The time-dependency of Tag is not considered in this table because ecological half-live
The understory biomass production on fertilized plots waslarger than on non-fertilized plots as observed qualitatively duringsampling.
3.2. Tag of fern and blackberry
According to Table 1, mean values of the 137Cs activity concen-tration of Fern and Blackberry are higher on non-fertilized plots byfactors 3.2 and 2.8. Mean values of Tag are higher on non-fertilizedplots by factor 4.4 and 5 than on fertilized plots respectively. InFig. 3 single values of the 137Cs activity concentration (Bq/kg),aggregated transfer factor (Tag) in Fern and Blackberry, the frac-tional 137Cs inventory (%) in L, Of and Oh horizons of the respectiveprofiles, and soil pH in L, Of, Oh and Ah horizons versus samplingdate and site number are shown. The following correlations existbetween the data sets given in Fig. 3:
For fertilized sites N�. 1–17 the data sets for activity concentra-tion of plants and Tag soil–plant are correlated with Pearsoncorrelation coefficients r¼ 0.97, p¼ 10�4 for fern and r¼ 0.93,p¼ 10�4 for blackberry. For non-fertilized sites N�. 18–32 the datasets for activity concentration of plants and Tag soil–plant arecorrelated with r¼ 0.91, p¼ 10�4 for fern and r¼ 0.94, p¼ 10�4 forblackberry, although values of activity concentration and Tag arehigher as indicated above. The fractional 137Cs inventory (%) infertilized L horizons is correlated to the aggregated transfer factor(Tag) of Blackberry with r¼ 0.92, p¼ 10�4, whereas for fern r¼ 0.24,p¼ 0.37 and R¼ 0.54, p< 0.05. For the fractional 137Cs inventory (%)of Of horizons of fertilized soils and Tag of fern and blackberry thestatistical parameters are r¼ 0.76, p¼ 0.001 and r¼ 0.59, p¼ 0.034respectively. The fractional 137Cs inventory (%) in non-fertilized Lhorizons is correlated with the value of Tag of blackberry withr¼ 0.72, p¼ 0.03. The fractional 137Cs inventory (%) in non-fertil-ized Of horizons is correlated with the value of Tag of blackberrywith r¼ 0.62, p¼ 0.73 and R¼ 0.7, p< 0.05. The fractional 137Csinventory (%) in Oh horizons are always higher than those of Of andL horizons. Soil pH is generally higher for fertilized plots as alreadymentioned and correlation coefficients of pH values and Tag of fernand blackberry are small except for the non-fertilized Ah horizonsr¼ 0.58, p¼ 0.99 but R¼ 0.68, p< 0.05. Single values of pH e.g. sitesN�. 14 and 31 can be small although the corresponding Tag valuesare small (14) or high (31). pH values are highest in L horizons, andsmallest in Oh or Ah horizons.
3.3. Main soil characteristics
According to Table 2, the soils under study can be characterizedas high organic matter soils with fractions of organic matter (OM)ranging between 54% and 89% in the Oh horizon. Fertilized soilsshow reduced organic matter content. Soil textures can be classifiedas sandy clay loam. As determined in 2006, silt is the dominantgrain size fraction with 48–51.5% in the mineral B horizon.
15 profiles non-fertilized and 17 profiles fertilized, under the assumption of a normalies and activity concentrations of plants are decay corrected for May 1st, 1986.
pth of soil horizons 137Cs activity conc. 1.05.86 Transfer factor Tag soil–planta
Of Oh Ah Fern Blackb. Fern Blackb.
(lower bound) Bq/kg dm m2/kg
2.7 4.7 6.9 4892 606 0.40 0.050.8 1.0 1.5 2926 356 0.23 0.022.4 4.6 6.2 1538 218 0.09 0.010.7 1.6 1.6 1077 196 0.05 0.01
s have a high statistical uncertainty (e.g. for fern non-fertilized Teco¼ (10�10) years).
234567
pH
Lfertilized non-fertilizedOf
Oh
Ah
0,001
0,01
0,1
1
10
100
1000
10000
100000
31.1
2.91
31.1
2.91
31.1
2.91
31.1
2.91
31.1
2.91
31.1
2.91
31.1
2.91
31.1
2.91
31.1
2.91
31.1
2.91
20.0
9.95
20.0
9.95
20.0
9.97
20.0
9.97
26.0
4.02
22.0
5.06
22.0
5.06
31.1
2.91
31.1
2.91
31.1
2.91
31.1
2.91
31.1
2.91
31.1
2.91
31.1
2.91
31.1
2.91
31.1
2.91
31.1
2.91
20.0
9.95
20.0
9.95
20.0
9.97
20.0
9.97
26.0
4.02
Sampling date and site
Tag m
²/kg
/ %
/ 137C
s B
q/kg
d
m
% L/tot
% Oh/tot
% Of/tot
Fern m²/kg
Blackberrym²/kg
fertilized non-fertilized
1 2 3 4 5 6 7 8 9 10 11 12 13 14 15 16 18 19 20 21 22 23 24 25 26 27 28 29 30 31 3217
Tag
Tag
137Cs Bq/kg dmBlackberry
137Cs Bq/kg dmFern
Fig. 3. Lower part: 137Cs activity concentration (Bq/kg), fractional 137Cs inventory (%) in L, Of and Oh horizons of the respective profiles, and aggregated transfer factor Tag (m2/kg) inFern and Blackberry versus sampling date and site number. In the upper part the corresponding pH values are shown. Sites N� . 1–17 were fertilized. Sites N� . 18–32 were non-fertilized at the date of sampling. Missing data points indicate that a plant was not growing on the soil profile.
G. Zibold et al. / Journal of Environmental Radioactivity 100 (2009) 489–496 493
According to Table 3 in non-fertilized spruce forest soil the 137Csexchangeability aex is about a factor 3–5 higher than in fertilizedsoil. Radiocaesium Interception Potential RIP values are higher afterfertilization than before. In the soil solution potassium concentra-tions are comparable to ammonium concentrations. RIP valueswere determined for Oh horizons of the soils under study. Our datashow that the higher values of the 137Cs exchangeability correspondto lower values of RIP. The values of KFES
c ðNH4=KÞ are in a range from3.2 to 3.7. The RIP values range from 35–829 meq/kg in the Oh
horizon in spruce forest and decrease with increasing organicmatter content (Tables 2 and 3). The RIP values increase with theportion of clay minerals in Oh layers (3.3% for the non-fertilizedprofile site N�. 30 and 9–12% for the fertilized profiles, as calculatedfrom Table 2).
3.4. Measured and predicted 137Cs transfer TF
In Table 3 the predicted ‘‘availability factor’’ ‘‘A’’ is showntogether with measured values of RIP. In soils of fertilized forests
Table 2Particle-size and physicochemical soil properties of root zone layers Oh of non-fertilized
Soil Site, n� . Depth, cm pH, CaCl2 OM, % Particle-sizea
Clay % Silt %
Non-fertilized 30 2.4–4.7 3.0 89 30 2431 2–3.5 2.9 86 30 24
Fertilized 13 2.4–4.3 3.2 70 30 2914 2.2–4.5 2.9 78 30 2917 2–4 5.5 54 27 51.516 3–4 5.7 68 27 48
a Particle-size distribution was determined for B soil layers for samples in 2006 (Geauthorities.
the selective sorption of Csþ on frayed edge sites (FES) dominates asindicated by the small contribution of KRES
d in Table 3, character-izing the sorption on regular exchange sites (RES). Availabilityfactors ‘‘A’’ of fertilized soils are mostly smaller than those of non-fertilized soils (Table 3). Table 3 also presents the measured valuesof TF, attributed to the root zone for fern and blackberry, and the RIPvalues of the correspondent soil layer for both cases. Theseempirical TF values are about a factor of 3–10 smaller for fertilizedsoil, this means they are positively correlated to the predicted Afactor on fertilization.
4. Discussion
4.1. Depth distribution of 137Cs in forest soil
137Cs inventories of undisturbed soils can vary substantially andthe variation given in Table 1 is similar to the variation found in theliterature (IAEA, 1994). The differences in fractional 137Cs invento-ries of soil horizons in fertilized and non-fertilized sites can be
and fertilized soils. Soil texture is sandy clay loam.
Exchangeable cations
Sand % Kþ cmol kg�1 NH4þ cmol kg�1 Ca2þ cmol kg�1 Mg2þ cmol kg�1
47 0.69 12 2.847 0.84 1041 0.8 13.8 2.441 0.9 13.521.5 0.3 0.03 17.0 9.225 0.5 0.03 45.3 18.1
e and Bauder, 1986); samples of 1997 were classified according to maps of forest

Table 3Selected characteristics of non-fertilized and fertilized soils: 137Cs exchangeability aex; Radiocaesium Interception Potential RIP(K), RIP(NH4); selectivity coefficientKFES
c ðNH4=KÞ; soil solution Kþ, NH4þ, Ca2þ and Mg2þ concentrations; percentage of 137Cs on RES KRES
d ; calculated availability factors (A); measured 137Cs soil–plant transferfactors TF attributed to root zone Oh.
Soil Site, n� . aex, % RIP(K),meq/kg
RIP(NH4),meq/kg
KFESc ,
meq/kgKþ, mM NH4
þ’ mM Ca2þ, mM Mg2þ, mM KRESd , % A 10�4 mM1/2,
kg/meqTF, Bq$kg�1/Bq$kg�1
Fern Blackberry
Non-fertilized 30 14.8 35 0.17 0.76 0.26 0.12 23.7 3.2 0.630 14.8 35 –a –a –a –a 239 3.2 0.631 17 74 –a –a –a –a 141 1.2 0.3
Fertilized 13 2.8 190 0.17 0.91 0.3 0.09 2.4 0.4 0.0313 2.8 190 –a –a –a –a 8 0.4 0.0314 5.3 108 –a –a –a –a 29 0.3 0.0417 2.2 829 223 3.2 0.03 0.05 1.34 1.02 1 0.03 0.9 0.2116 2.6 179 90 3.7 0.07 0.07 2.29 1.31 4 0.15 0.7 0.07
a Cation concentrations measured only in water extracts, S:L¼ 1:5.
G. Zibold et al. / Journal of Environmental Radioactivity 100 (2009) 489–496494
attributed to the stronger binding and the smaller bioavailability ofCs in Oh horizons of the fertilized sites, and agrees with the lowerfractional inventories found in the L, and Of horizons from this part,due to the lower activity concentrations of the plant cover (Lindneret al., 1994). The observed increase in pH after fertilization supportsthe observed smaller bioavailability on fertilized sites. The depth ofthe horizons in spruce forest soil is slightly larger on non-fertilizedplots caused by the lower rate of litter decomposition as comparedto fertilized plots; and possibly also due to the fact, that the biomassproduction is smaller on non-fertilized plots and so less organicmaterial is taken out of this soil (Zibold et al., 2003).
4.2. Tag of fern and blackberry
137Cs activity concentration (Bq/kg) and aggregated transferfactor (Tag) of Fern and Blackberry show smaller values on fertilizedsoil because of the higher values of soil pH after fertilization(Drissner et al., 1996; Zibold et al., 2003), however a correlationbetween observed values of pH and Tag (Fig. 3) is not found. Forfertilized profiles graphs for activity concentration and Tag in Fig. 3are correlated of course. For non-fertilized profiles there exists thesame correlation, however values of 137Cs activity concentration(Bq/kg) and aggregated transfer factor (Tag) are higher than those offertilized profiles. Comparing the graph of Tag to the graphs of thefractional 137Cs inventory (%) in L and Of horizons in Fig. 3 it can beseen, that small values of Tag are measured for small fractionalinventories in L and Of horizons, and thus the transfer of 137Cs fromthe L and Of horizons is decreasing with the fractional inventory inthese horizons which is supported by the correlation foundbetween these quantities. In the Oh horizon the fractional 137Csinventory is highest and it is unaffected by fertilization. Therefore,the uptake of 137Cs must be smaller in Oh horizons than in Of
horizons. pH values of Of horizons in Fig. 3 are higher than in Oh
horizons and thus support a lower 137Cs transfer from 137Csenriched Oh horizons and 137Cs depleted Of horizons. Even the lowvalue of pH at site 11 as compared to site 10 of Fig. 3 is reflected ina relatively large Tag value.
Table 4Soil properties collected from our earlier work: 137Cs exchangeability aex; Radiocaesium Intransfer factors attributed to root zone TF.
Soil Site, n� . Horizon OM, % aex, % RIP, meq/kg A, 10�4
Non-fertilized 30 Oh 81 6.4 21 190
30 Oh 81 10 25 240Fertilized 13 Ah 63 2.5 55 7
4.3. Main soil characteristics
Low soil solution Kþ concentrations in the root zone have anessential influence on the plant availability of 137Cs (Zhu andSmolders, 2000). The dependence of the 137Cs uptake by plants onpotassium in the Kþ concentration range of less than 1 mM hasbeen well studied (Smolders et al., 1996; Waegeneers et al., 2001).The plant to solution concentration ratio CF for 137Cs is reducedwith increased K concentration in the solution and the largest effectof K on Cs uptake was found in the Kþ concentration range of lessthan 0.25 mM (Zhu and Smolders, 2000). So, observed lowconcentrations of potassium in soil solution may cause higher 137Cssoil–plant transfer.
The RIP value characterizes the ability of soils to selectively sorbCsþ (Cremers et al., 1988). Taking into account the measuredpotassium and ammonium concentrations means that in most sitesammonium plays a more important role than potassium asa competing cation of radiocaesium for the selective sorption sites(FES) – not due to concentration but to its higher selectivity value(Table 3).
The smaller portion of clay minerals in the humus layers of non-fertilized spruce forest is caused by the lower rate of litterdecomposition. Coniferous litter decomposes very slowly andforms a thick humus horizon like mor or moder.
For soils in fertilized forests essentially higher RIP values ascompared to non-fertilized forests have been observed and fromEq. (1) can be expected that radiocaesium soil–plant transfer for thefertilized forests should be lower than that for non-fertilizedforests.
4.4. Measured 137Cs transfer TF and predicted A values
It can be seen from Table 3 that as expected fern has substan-tially higher TF values in comparison to blackberry. For soils infertilized forests essentially higher RIP values as compared to non-fertilized forests have been observed and it may be expected that
terception Potential RIP; calculated availability factors (A); measured 137Cs soil–plant
mM1/2 kg/meq TF, Bq$kg�1/ Bq$kg�1 Ref.
Fern Blackberry
2.8 0.4 Konopleva et al. (1998),Konoplev et al. (1998, 1999)
2.9 – Konoplev et al. (1997, 1998, 1999)0.2 0.05 Konopleva et al. (1998),
Konoplev et al. (1998, 1999)

G. Zibold et al. / Journal of Environmental Radioactivity 100 (2009) 489–496 495
radiocaesium soil–plant transfer for the fertilized forests should belower than that for non-fertilized forests.
Thus, Table 3 clearly shows that RIP plays a predominant role incharacterizing fertilized and non-fertilized forest soils in terms ofradiocaesium bioavailability. These results are supported by earlierwork which is collected in Table 4 for comparison.
A total of 6 fertilized samples and 5 non-fertilized samples havebeen investigated (Tables 3 and 4). Samples from sites 16 and 17have been investigated using the method of masking with a K–Camixture to determine RIP, for all other investigations the Ag(TU)4
method was used. Both methods yield essentially the same resultsconcerning A values (Tables 3 and 4). The following statements canbe made from the comparison of non-fertilized and fertilized soils:
� Oh horizons of non-fertilized soils have a higher organic matter(OM) fraction.� The exchangeability aex is higher in non-fertilized soils.� RIP of Oh horizons is about an order of magnitude smaller in
non-fertilized soils.� Predicted A values are about an order of magnitude higher for
non-fertilized soils.� Measured TF values of fern and blackberry are about an order of
magnitude higher on non-fertilized soils.
5. Conclusion
For predicting Cs uptake the performance of the RIP approachcan be compared to Tag monitoring.
Tag monitoring needs several but simple activity measurements;the geometry of plant roots, the depth distribution of 137Cs, and theavailability of the 137Cs to plants in the root zone layer are not takeninto consideration. In Fig. 3 the variation of the Tag of fern andblackberry in spruce forest is about 100% as measured in 15 or 17sampling sites. With respect to Cs uptake, this uncertainty stillallows to discriminate between fertilized or non-fertilized soils orbetween mixed forest and spruce forest (Lindner et al., 1994).
Besides the possibility to predict the transfer factor (TF) and toexplain its variations the advantage of the RIP approach is that onemay know in advance where to expect higher and where lower TFvalues only on the basis of soil properties which is important fortaking decision concerning countermeasures. It is possible to mapthe soil in terms of arbitrary TF values for emergency or for terri-tories with potential chronical sources. However, the RIP-appraochneeds a chemistry lab to determine sorption, exchangeability andion concentrations besides activity measurements; it can explainthe Cs uptake from soil to plant; it takes account of the geometry ofplant roots and the depth distribution of 137Cs. Uncertainties ofthese parameters add up and limit the information of single RIPmeasurements. However, these uncertainties associated with thepredicted transfer factors using the RIP approach can be avoided inselected cases, when a series of samples can be studied e.g. in thiswork or to explain the influence of the kind of stocking on radio-nuclide-uptake in forest (Konopleva et al., 2009). Under normalfield conditions the RIP approach is not feasible because the effortto access its input parameters is too high. From Tables 3 and 4 thevalue of A in the non-fertilized site 30 was predicted 3 times witha relative uncertainty of about 100%. In TF measurements the plantconcentration is related to the soil concentration of a specifichorizon; these concentrations are determined in general witha statistical accuracy of 5%.
In spruce forest soil treated with lime plus potassium andphosphorous fertiliser, values of pH, and radiocaesium interceptionpotential RIP were higher than corresponding values from non-fertilized reference plots whereas values of 137Cs exchangeabilityaex were smaller. Using this result, values of the bioavailability of
137Cs were predicted as at least 10 times higher for non-fertilizedsoil as compared to fertilized soil and they explained the measured137Cs soil–plant transfer factors TF attributed to the root zone forfern (D. carthusiana) and blackberry (R. fruticosus). These findingsexplain efficient reduction of radiocaesium soil–plant transfer onfertilized forest soil as compared to non-fertilized soil.
Acknowledgement
Funding by Baden-Wurttemberg Projektragerschaft Lebens-grundlage Umwelt und ihre Sicherung (BWPLUS) project N�. BWR24018 ‘‘Migration und Bioverfugbarkeit von Radiocasium in BodenSuddeutschlands’’ and continuous support by FD Dr. Bosch and hiscoworkers during sampling are gratefully acknowledged.
References
Bericht uber den Zustand des Waldes, 2006. http://www.bmelv.de Germany 2006.Brechignac, F., Moberg, L., Suomela, M., 2006. Long-term environmental behaviour
of radionuclides. I P S N - C E C association final report. ISPN, pp. 1–65.Camps, M., Rigol, A., Hillier, S., Vidal, M., Rauret, G., 2004. Quantitative assessment
of the effects of agricultural practices designed to reduce 137Cs and 90Sr soil–plant transfer in meadows. Science of the Total Environment 332, 23–38.
Cremers, A., Elsen, A., De Preter, P., Maes, A., 1988. Quantitative analysis of radio-caesium retention in soils. Nature 335 (6187), 247–249.
Drissner, J., Flugel, V., Klemt, E., Miller, R., Schick, G., Zibold, G., 1996. Transfer ofradiocesium in prealpine forest ecosystems. In: Amiro, B., Avadhanula, R.,Johansson, G., Larsson, C.M., Luning, M. (Eds.), Proc. International Symposiumon Ionizing Radiation ‘‘Protection of the Natural Environment’’. Sweden,Stockholm, pp. 218–223.
Fesenko, S., Voigt, G., Spiridonov, S., Gontarenko, I., 2005. Evaluation of the effec-tiveness of countermeasures in contaminated forests. Radioprotection 40(Suppl. 1), S825–S832.
Bodenschutzkalkung im Wald, 2000. Forstliche Versuchs- und ForschungsanstaltBW, Freiburg, Germany. Merkblatt 50.
Gee, G.W., Bauder, J.W., 1986. Particle-size analysis. In: Klute, A. (Ed.), Methods ofSoil Analysis. Part 1-Physical and Mineralogical Methods – Agronomy mono-graph, vol. 9, pp. 383–411. Madison, Wisconsin USA.
International Atomic Energy Agency (IAEA), 1994. Handbook of Parameter Valuesfor the Prediction of Radionuclide Transfer in Temperate Environments. Tech-nical Report Series N� . 364 Vienna, Austria.
Kaunisto, S., Aro, L., Rantavaara, A., 2002. Effect of fertilization on the potassium andradiocaesium distribution in tree stands (Pinus sylvestris L.) and peat on a pinemire. Environmental Pollution 117, 111–119.
Konoplev, A.V., Konopleva, I.V., 1999. Parameterisation of 137Cs soil–plant transferthrough key soil characteristics. Radiation Biology, Radioecology 39, 457–463(in Russian).
Konoplev, A.V., Bulgakov, A.A., Popov, V.E., Bobovnikova, Ts.I.,1992. Behaviour of long–lived Chernobyl radionuclides in a soil–water system. Analyst 117, 1041–1047.
Konoplev, A.V., Viktorova, N.V., Virchenko, E.P., Popov, V.E., Bulgakov, A.A.,Desmet, G.M., 1993. Influence of agricultural countermeasures on the ratio ofdifferent chemical forms of radionuclides in soil and soil solution. Science of theTotal Environment 137, 147–162.
Konoplev, A.V.,Drissner, J., Klemt, E., Konopleva, I.V., Zibold, G.,1996. Parameterisation ofradiocaesium soil–plant transfer using soil characteristics. In: Gerzabek, M. (Ed.),Proceedings of XXVIth Annual Meeting of ESNA. Working Group 3: Soil–PlantRelationships, Busteni (Romania) 12–16 September 1996, pp. 147–153.
Konoplev, A.V., Drissner, J., Klemt, E., Konopleva, I.V., Miller, R., Zibold, G., 1997.Characterisation of soil in terms of radiocaesium availability to plants. In:Proceedings of XXVII Annual Meeting of ESNA, Ghent, Belgium, 29. August–2.September 1997. Working Group 3: Soil-Plant-Relationships, pp. 163–169.
Konoplev, A.V., Avila, R., Bulgakov, A.A., Drissner, J., Johanson, K.J., Klemt, E.,Konopleva, I.V., Miller, R., Nikolova, I., Popov, V.E., Zibold, G., 1998. Modellingradiocaesium bioavailability in soil. In: Van der Stricht, E. (Ed.), Proceedings ofInternational Union of Radioecologists Topical Meeting, SCK-CEN, Mol, Belgium,1–5 June 1998, pp. 197–205.
Konoplev, A.V., Avila, R., Bulgakov, A.A., Drissner, J., Johanson, K.J., Klemt, E.,Konopleva, I.V., Miller, R., Nikolova, V.E., Popov, V.E., Zibold, G., 1999. Modellingradiocaesium bioavailability in forest soils. In: Linkov, I., Schell, W.R. (Eds.),Contaminated Forests. Proc. NATO Advanced Research Workshop, Kiev(Ukraine) 24–28. June 1998, pp. 217–229.
Konoplev, A.V., Avila, R., Bulgakov, A.A., Johanson, K.J., Konopleva, I.V., Popov, V.E.,2000. Quantitative assessment of radiocaesium bioavailability in forest soils.Radiochimica Acta 88, 789–792.
Konopleva, I.V., Drissner, J., Klemt, E., Konoplev, A.V., Miller, R., Zibold, G., 1998. Long-term influence of liming on biological availability of radiocaesium in forest soils.In: Gerzabek, M. (Ed.), Proc. XXVIIIth Annual Meeting of ESNA, Working Group 3:Soil–Plant Relationships. Brno (Tschechische Republik) 1998, pp. 108–114.

G. Zibold et al. / Journal of Environmental Radioactivity 100 (2009) 489–496496
Konopleva, I.V., Klemt, E., Konoplev, A.V., Zibold, G., 2009. Migration and bioavail-ability of 137Cs in forest soil of Southern Germany. Journal of EnvironmentalRadioactivity 100, 308–314.
Krom, M.D., 1980. Spectrophotometric determination of ammonia: a study ofa modified Berthelot reaction using salicilate and dichloroisocyanurate. Analyst105, 305–316.
Lembrechts, J., 1993. A review of literature on the effectiveness of chemicalamendments in reducing the soil-to-plant transfer of radiostrontium andradiocaesium. Science of the Total Environment 137, 81–98.
Levula, T., Saarsalmi, A., Rantavaara, A., 2000. Effects of ash fertilization andprescribed burning on macronutrient, heavy metal sulphur and 137Cs concen-trations in lingonberries (Vaccinium vitis-idaea). Forest Ecology and Manage-ment 126, 269–279.
Lindner, G., Drissner, J., Herrmann, T., Hund, M., Zech, W., Zibold, G., Zimmerer, R.,1994. Seasonal and regional variations in the transfer of caesium radionuclidesfrom soil to roe deer and plants in a prealpine forest. Science of the TotalEnvironment 157, 189–196.
Rauret, G., Firsakova, S., 1996. The Transfer of Radionuclides Through the TerrestrialEnvironment to Agricultural Products, Including the Evaluation of AgrochemicalPractices. EUR 16528 EN. European Commission, Luxembourg.
Rauret, G., Alexakhin, R.M., Kruglov, S.V., Cremers, A., Wauters, J., Valcke, E.,Ivanov, Y., Vidal, M., 1996. Physical and chemical factors influencing radionu-clide behavior in arable soils. In: Karaglou, A., Desmet, G., Kelly, G.N.,Menzel, H.G. (Eds.), The Radiological Consequences of the Chernobyl Accident.EUR 16544 EN. European Commission, Brussels, pp. 81–96.
Smolders, E., Kiebooms, L., Buysse, J., Merckx, R., 1996. 137Cs uptake in spring wheat(Triticum aestivum L. cv Tonic) at varying K supply. I. The effect in solutionculture. Plant and Soil 181, 205–210.
Smolders, E., Sweeck, L., Merckx, R., Cremers, A., 1997. Cationic interactions inradiocaesium uptake from solution by spinach. Journal of EnvironmentalRadioactivity 34, 161–170.
Waegeneers, N., Camps, M., Smolders, E., Merckx, R., 2001. Genotypic effects inphytoavailability of radiocaesium are pronounced at low K intensities in soil.Plant and Soil 235, 11–20.
Wauters, J., Elsen, A., Cremers, A., Konoplev, A.V., Bulgakov, A.A., Comans, R.N.J.,1996. Prediction of solid/liquid distribution coefficients of radiocaesium in soilsand sediments. Part one: a simplified procedure for the solid phase character-isation. Applied Geochemistry 11, 589–594.
Zhu, Y.G., Smolders, E., 2000. Plant uptake of radiocaesium: a review of mechanisms,regulation and application. Journal of Experimental Botany 51, 1635–1645.
Zibold, G., Drissner, J., Klemt, E., Konopleva, I.V., Konoplev, A.V., Miller, R., 1997.Biologische Verfugbarkeit von Casium-Radionukliden in Waldgebieten desnordlichen und sudlichen Voralpenlandes. In: Hecht, H., Honikel, K.O. (Eds.),Radiocasium in Wald und Wild. Bundesanstalt fur Fleischforschung, Kulmbach,pp. 43–64.
Zibold, G., Drissner, J., Harle, C., Klemt, E., Spasova, Y., 2003. Measurement andmodelling of 137Cs in soil and biomass of a prealpine spruce forest. In: Mitch-ell, N., Zibold, G. (Eds.), Proceedings of the XXXII Annual Meeting of ESNA,Warsaw, Poland, 10–13.September 2002 Working Group 3: Soil-to-Plant-Rela-tionships, pp. 32–37. ISSN 1611-9223.
Copyright © 2022 FDOKUMEN


![genetic variation of norway spruce (picea abies [l.] karst ...](https://static.fdokumen.com/doc/165x107/633d6582b988f9753c06267d/genetic-variation-of-norway-spruce-picea-abies-l-karst-.jpg)