Influence of corrosion layers on quantitative analysis
6
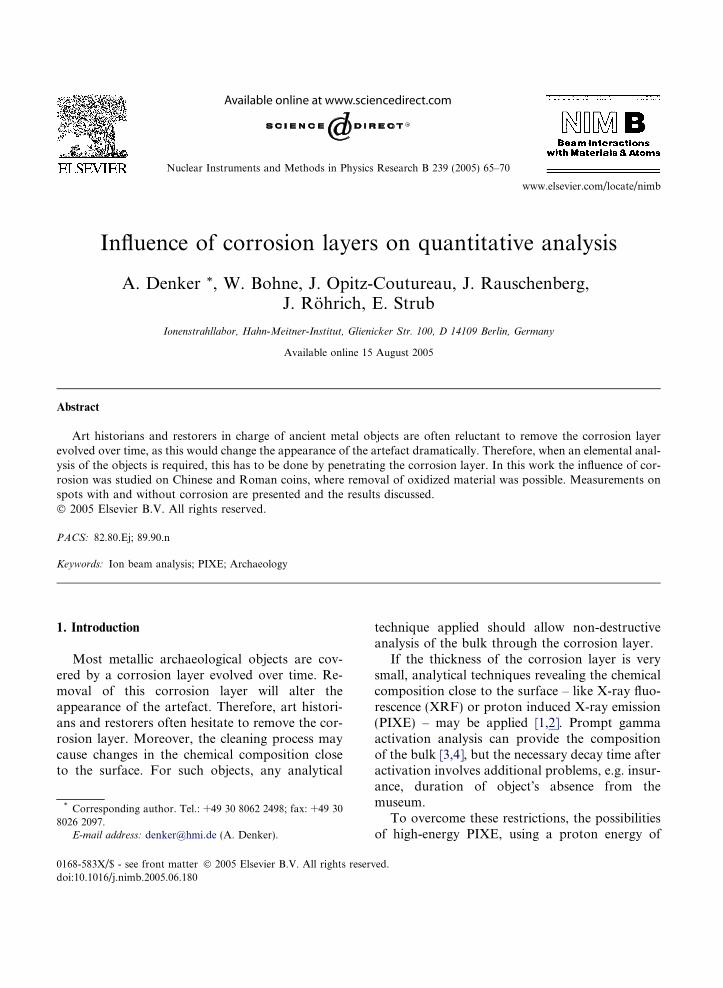
Influence of corrosion layers on quantitative analysis A. Denker * , W. Bohne, J. Opitz-Coutureau, J. Rauschenberg, J. Ro ¨ hrich, E. Strub Ionenstrahllabor, Hahn-Meitner-Institut, Glienicker Str. 100, D 14109 Berlin, Germany Available online 15 August 2005 Abstract Art historians and restorers in charge of ancient metal objects are often reluctant to remove the corrosion layer evolved over time, as this would change the appearance of the artefact dramatically. Therefore, when an elemental anal- ysis of the objects is required, this has to be done by penetrating the corrosion layer. In this work the influence of cor- rosion was studied on Chinese and Roman coins, where removal of oxidized material was possible. Measurements on spots with and without corrosion are presented and the results discussed. Ó 2005 Elsevier B.V. All rights reserved. PACS: 82.80.Ej; 89.90.n Keywords: Ion beam analysis; PIXE; Archaeology 1. Introduction Most metallic archaeological objects are cov- ered by a corrosion layer evolved over time. Re- moval of this corrosion layer will alter the appearance of the artefact. Therefore, art histori- ans and restorers often hesitate to remove the cor- rosion layer. Moreover, the cleaning process may cause changes in the chemical composition close to the surface. For such objects, any analytical technique applied should allow non-destructive analysis of the bulk through the corrosion layer. If the thickness of the corrosion layer is very small, analytical techniques revealing the chemical composition close to the surface – like X-ray fluo- rescence (XRF) or proton induced X-ray emission (PIXE) – may be applied [1,2]. Prompt gamma activation analysis can provide the composition of the bulk [3,4], but the necessary decay time after activation involves additional problems, e.g. insur- ance, duration of objectÕs absence from the museum. To overcome these restrictions, the possibilities of high-energy PIXE, using a proton energy of 0168-583X/$ - see front matter Ó 2005 Elsevier B.V. All rights reserved. doi:10.1016/j.nimb.2005.06.180 * Corresponding author. Tel.: +49 30 8062 2498; fax: +49 30 8026 2097. E-mail address: [email protected] (A. Denker). Nuclear Instruments and Methods in Physics Research B 239 (2005) 65–70 www.elsevier.com/locate/nimb
Transcript of Influence of corrosion layers on quantitative analysis
Nuclear Instruments and Methods in Physics Research B 239 (2005) 65–70
www.elsevier.com/locate/nimb
Influence of corrosion layers on quantitative analysis
A. Denker *, W. Bohne, J. Opitz-Coutureau, J. Rauschenberg,J. Rohrich, E. Strub
Ionenstrahllabor, Hahn-Meitner-Institut, Glienicker Str. 100, D 14109 Berlin, Germany
Available online 15 August 2005
Abstract
Art historians and restorers in charge of ancient metal objects are often reluctant to remove the corrosion layerevolved over time, as this would change the appearance of the artefact dramatically. Therefore, when an elemental anal-ysis of the objects is required, this has to be done by penetrating the corrosion layer. In this work the influence of cor-rosion was studied on Chinese and Roman coins, where removal of oxidized material was possible. Measurements onspots with and without corrosion are presented and the results discussed.� 2005 Elsevier B.V. All rights reserved.
PACS: 82.80.Ej; 89.90.n
Keywords: Ion beam analysis; PIXE; Archaeology
1. Introduction
Most metallic archaeological objects are cov-ered by a corrosion layer evolved over time. Re-moval of this corrosion layer will alter theappearance of the artefact. Therefore, art histori-ans and restorers often hesitate to remove the cor-rosion layer. Moreover, the cleaning process maycause changes in the chemical composition closeto the surface. For such objects, any analytical
0168-583X/$ - see front matter � 2005 Elsevier B.V. All rights reservdoi:10.1016/j.nimb.2005.06.180
* Corresponding author. Tel.: +49 30 8062 2498; fax: +49 308026 2097.
E-mail address: [email protected] (A. Denker).
technique applied should allow non-destructiveanalysis of the bulk through the corrosion layer.If the thickness of the corrosion layer is very
small, analytical techniques revealing the chemicalcomposition close to the surface – like X-ray fluo-rescence (XRF) or proton induced X-ray emission(PIXE) – may be applied [1,2]. Prompt gammaactivation analysis can provide the compositionof the bulk [3,4], but the necessary decay time afteractivation involves additional problems, e.g. insur-ance, duration of object�s absence from themuseum.To overcome these restrictions, the possibilities
of high-energy PIXE, using a proton energy of
ed.

Fig. 1. X-ray transmission for several elements (Fe, Sn, Pb) in acopper matrix as a function of depth. At the marks the protonenergy has decreased from the incident 68 MeV to the notedvalue.
66 A. Denker et al. / Nucl. Instr. and Meth. in Phys. Res. B 239 (2005) 65–70
68 MeV, were examined. Protons with such an en-ergy have a large range, i.e. information depth, inthe materials under investigation. As the X-rayproduction cross-sections for the K lines of heavyelements (Z > 50) are large enough [5,6], heavy ele-ments may be detected by their K X-rays with amuch smaller absorption coefficient in the ana-lysed material than the L X-rays [7]. Heavy ele-ments like gold can be detected even behind3 mm of lead glass [8]. The proton intensity re-quired to perform high-energy PIXE analysis islow due to the large cross-sections, hence, the riskof activation is small. All objects were checkedafter analysis for activation by the radiation safetydepartment. No activation was observed. The riskof radiation damage is proportional to the energyloss. For a bronze alloy of 2 mm thickness, the dif-ferential energy loss is below 10 keV/(mg/cm2).For homogeneous samples of a few millimetresthickness, quantitative analysis can be performedwith adequate precision [9].
Fig. 2. A dupondius Nero (left) and an As of Caligula (right).The drill holes were necessary for sampling for AAS analysis.High-energy PIXE was performed on the polished part and onspots with corrosion layers of different thickness.
2. Experimental set-up
The experimental set-up has been described indetail in [9]. The measurements were performedat the high-energy PIXE target station of theVan-de-Graaff cyclotron–accelerator combinationof the Ionenstrahllabor at the Hahn-Meitner-Insti-tut Berlin. The objects remained under ambientatmosphere, as the 68 MeV proton beam exitsthe vacuum of the beam line through an 80 lmKapton foil. The energy loss in the foil and inthe air was about 200 keV [10]. Typical experimen-tal parameters were: a beam intensity of 0.1 to1 pA, a beam diameter of 1 mm, and a measuringtime of 200 s. The beam intensity was measuredusing a commercial ionisation chamber. The ob-jects were mounted on an xy-table with a position-ing precision of about 0.1 mm. The beam positionon the object is marked by a laser cross-hair. TheX-rays were detected by a 300 mm2, 1 cm thickHPGe-detector (resolution 180 eV at 5.9 keV)mounted at an angle of 135� relative to the beamdirection.As can be seen in Fig. 1, a proton with an inci-
dent energy of 68 MeV is only slowed down to
about 65 MeV after penetrating 1 mm of Cu,hence, the cross-section for X-ray production canbe considered to be constant over this depth.Therefore, only the absorption of the X-rays willdefine the maximum analysable depth, which var-ies for different elements. For example, for Fe inCu, the maximum analysable depth is about40 lm, whereas Sn can be detected even at a depthof 1 mm. For Pb, two analysable depths areachieved by using either L or K X-rays for analy-sis: for depths larger than 100 lm of Cu, Pb can bedetected only by using the K X-rays.

A. Denker et al. / Nucl. Instr. and Meth. in Phys. Res. B 239 (2005) 65–70 67
In addition to the Cu X-rays, Cu may be de-tected by a c-line at 67.4 keV. This c-line is createdby the reaction 63Cu(p,3n)61Zn and two consecu-tive b+ decays, which lead to the formation of ex-cited 61Ni. The latter decays by the emission of the67.4 keV c-line, which can be used to perform pro-ton induced c-ray emission (PIGE). It is possibleto quantify the relationship between the Cu con-tent and the c-line intensity by measuring stan-dards of known composition [11]. The sameisotope is produced if Zn is present, and thereforeoverestimations of the Cu content in Zn-contain-
Table 1Elemental composition in mass percent (rounded) of 6 different Rom
Fe (%) Cu (%) Zn (%)
As Caligula, a copper coin
AAS-data 0.15 99.80 0.01
Clean surface n.d. 99.2 ± 0.3 n.d.
Thin corrosion 1.56 ± 0.06 97.9 ± 0.4 n.d.Thick corrosion 1.91 ± 0.07 97.8 ± 0.4 n.d.
Dupondius Nero, a brass coin
AAS-data 0.15 80.81 18.76
Clean surface 0.17 ± 0.04 81.2 ± 0.3 17.6 ± 0.2Thin corrosion 1.52 ± 0.05 88.0 ± 0.4 9.56 ± 0.21Thick corrosion 0.52 ± 0.05 84.9 ± 0.4 13.8 ± 0.21
Sesterce Titus, a brass coin
AAS-data 0.15 84.73 14.87
Clean surface 0.16 ± 0.04 83.3 ± 0.3 15.8 ± 0.20Thin corrosion 0.37 ± 0.05 86.2 ± 0.4 12.5 ± 0.20Thick corrosion 1.94 ± 0.08 86.2 ± 0.5 11.2 ± 0.27
Dupondius Faustina, a brass coin
AAS-data 0.34 88.07 11.33
Clean surface 0.43 ± 0.04 90.3 ± 0.4 8.43 ± 0.19Thin corrosion 0.89 ± 0.06 92.9 ± 0.4 5.77 ± 0.20Thick corrosion 2.56 ± 0.08 90.7 ± 0.4 5.75 ± 0.22
As Antonius Pius, a copper–lead alloy
AAS-data 0.07 97.95 0.34
Clean surface 0.14 ± 0.04 97.9 ± 0.31 n.d.
Thin corrosion 0.45 ± 0.04 97.6 ± 0.33 n.d.Thick corrosion 3.09 ± 0.10 93.5 ± 0.43 n.d.
Sesterce Gordian, a copper–lead alloy
AAS-data 0.03 97.32 0.11
Clean surface 0.07 ± 0.05 94.7 ± 0.4 n.d.
Thin corrosion 0.54 ± 0.06 92.4 ± 0.8 n.d.Thick corrosion 4.50 ± 0.12 88.9 ± 0.5 n.d.
The abbreviation n.d. stands for not detected. The agreement betweepolished spots (italic) is quite good. The errors include the fit uncertainmeans an estimated corroded layer up to 70 lm, whereas ‘‘thick corroThe influence of the corrosion layer is small, the major contribution beA classification of the coins is possible.
ing materials arise, e.g. if the Zn concentration ishigher than about 20%, apparent Cu concentra-tions larger than 100% are obtained.The analysed objects comprised Roman and
Chinese coins of different periods and in variousstates of preservation. The thickness of the corro-sion layer was estimated to be between 50 and100 lm for the Roman coins, and about 100 lmfor the Chinese coins. The coins were polishedon one half, and measurements of several spotson polished and on original surface parts wereperformed.
an coins
Ag (%) Sn (%) Sb (%) Pb (%)
0.01 0.01
0.07 ± 0.06 n.d. 0.09 ± 0.06 0.48 ± 0.09n.d. 0.11 ± 0.09 n.d. 0.38 ± 0.14n.d. n.d. n.d. 0.33 ± 0.17
0.06 0.05 0.16
0.20 ± 0.06 <0.09 0.23 ± 0.06 0.50 ± 0.100.15 ± 0.07 0.10 ± 0.07 0.10 ± 0.07 0.57 ± 0.110.11 ± 0.08 <0.15 <0.15 0.53 ± 0.12
0.03 0.08 0.13
n.d. 0.15 ± 0.07 0.09 ± 0.07 0.54 ± 0.11<0.12 0.12 ± 0.08 0.18 ± 0.08 0.66 ± 0.13<0.19 n.d. <0.18 0.59 ± 0.21
0.03 0.06 0.15
0.08 ± 0.07 0.12 ± 0.06 <0.11 0.59 ± 0.11n.d. <0.15 <0.12 0.42 ± 0.150.15 ± 0.09 0.15 ± 0.09 0.17 ± 0.09 0.52 ± 0.15
0.06 0.10 1.45
0.13 ± 0.06 n.d. 0.28 ± 0.07 1.57 ± 0.130.13 ± 0.07 0.11 ± 0.07 <0.14 1.69 ± 0.150.15 ± 0.12 0.15 ± 0.12 0.16 ± 0.12 2.99 ± 0.23
0.01 0.02 2.20
n.d. 2.88 ± 0.12 0.16 ± 0.07 2.15 ± 0.170.14 ± 0.08 4.1 ± 0.14 <0.12 2.83 ± 0.21n.d. 2.59 ± 0.17 n.d. 4.04 ± 0.31
n the AAS data (bold) and high-energy PIXE data obtained onties and the statistical error of the peak areas. ‘‘Thin corrosion’’sion’’ describes an estimated thickness between 70 and 100 lm.ing Fe, probably from the soil, as Ca is also visible in the spectra.

Fig. 3. Chinese coin L1-517 originating from the reign of theChinese Emperor Jen Tsung minted in the period of 1056 to1063. The left photograph shows the obverse of the coin withthe Emperor�s name and his motto ‘‘Chia–Yu’’. The rightphotograph shows the reverse, one half with the originalcorrosion and the other half cleaned.
68 A. Denker et al. / Nucl. Instr. and Meth. in Phys. Res. B 239 (2005) 65–70
3. Roman coins
The Roman coins were provided by the Rath-gen-Forschungslabor in Berlin: three brass coins,two Cu/Pb alloys, and one Cu coin. All of themhave been previously analysed by atomic absorp-tion spectroscopy (AAS), which explains the drillholes on the coins, visible in Fig. 2. High-energyPIXE was performed on both corroded and onpolished parts. Table 1 gives the results of thehigh-energy PIXE measurements compared tothe AAS data. The quoted errors originate fromthe fit uncertainties and the statistical errors ofthe peak areas and represent a lower limit, as theinfluence of surface roughness was not included.The agreement between the high-energy PIXE re-sults obtained on polished spots and the AAS datais quite good. The thickness of the corrosion layeron these coins was estimated to be between 50 and100 lm. Spectra obtained on spots with a corro-sion layer showed Ca and Fe as additional ele-ments. Ca was not included in the calculations ofthe concentrations of the elements in the coins,as it stems from the soil where the coins were bur-ied. The same holds for Fe, but if polishing is notallowed, it is impossible to distinguish between Fefrom the surface and Fe in the original alloy.Therefore, it was included in the calculations ofthe concentrations. The influence of the corrosionlayer on the concentrations is relatively small.Hence, high-energy PIXE is able to characterizethe coins without any modification.
Fig. 4. Comparison of the elemental concentrations of twolead–bronze coins as obtained by PIGE, high-energy PIXE,ICP-MS, and ERDA. Using high-energy PIXE, analysis can bemade using either the Pb K or L lines. The ERDA and PIXEdata match within the analytical errors. Errors for the ICP-MSdata were not given.
4. Chinese coins
The 7 Chinese coins analyzed stem from a pri-vate collection (E. Lietz). The coins have beenminted between 990 and 1117. Two coins (L-311and L-318) have been polished previously and ana-lysed by inductively-coupled-plasma mass spec-trometry (ICP-MS) [12]. The other five coins arecovered by a thick layer of corrosion. It was possi-ble to clean all these coins on one half. Fig. 3shows one of the coins on the reverse and on theobverse side. Fig. 4 depicts the results of high-en-ergy PIXE obtained on the fully polished coinsin comparison with the ICP-MS data. For most
elements, the deviation between the PIXE dataand the ICP-MS values is larger than the errorof the high-energy PIXE results. For the ICP-MSdata, no errors were given. Therefore, additionalanalysis was performed with the Berlin time-of-

Fig. 6. High-energy PIXE spectra of Chinese coin L2-609. Zn isobserved only when measuring the corroded part, not thepolished surface.
A. Denker et al. / Nucl. Instr. and Meth. in Phys. Res. B 239 (2005) 65–70 69
flight ERDA set-up [13] using a 350 MeV Aubeam. The relatively large error bars are due solelyto the uncertainties of the stopping-power param-eters used in the analysis. The ERDA results andthe high-energy PIXE results (average of resultsobtained by K and L lines) agree quite well.For most Chinese coins, the results obtained on
spots with corrosion showed a clear Fe signal, adecrease in the Cu concentration, a slight enhance-ment of Sn, and an increase of Pb, compared to theresults from the measurements on the polishedparts. Ca was found only on corroded parts andwas not included in the calculations of the elemen-tal concentrations (see Fig. 5). For one single coin,L2-609, a large Zn signal on the corroded part wasobserved (see Fig. 6). Without the measurement onthe polished spot, this might have lead to theassumption that the coin is made of a brass alloy.For all coins, the difference in the Pb concentra-
Fig. 5. Elemental composition of three Chinese bronze coinsobtained non-destructively by high-energy PIXE. Measure-ments of cleaned and corroded parts are compared. Using onlythe information obtained from the X-ray measurements on thecorroded surface, one would misleadingly classify the coin L2-609 as a brass coin.
tions when using the K or L-lines affirmed thepresence of a surface layer with a composition dif-ferent from that of the bulk material.Using only the X-rays, characterization of the
coins would be quite difficult. Additional infor-mation was obtained by using the 67.4 keV c-linefor the determination of the Cu content. Fig. 7
Fig. 7. Determination of the Cu content of three Chinesebronze coins using the high-energy proton induced c- and X-raysignals. The Cu-c signal yields similar values on the clean andthe corroded parts of the coins. The X-ray signals of thecorroded parts give smaller Cu concentrations. The PIXEresults of the corroded parts differ depending on whether Pb Kor L X-rays are used to determine the composition, whichreflects a surface layer with different composition than that ofthe bulk. The mean value of the Cu concentration obtained onthe polished parts is indicated (dashed line).

70 A. Denker et al. / Nucl. Instr. and Meth. in Phys. Res. B 239 (2005) 65–70
shows the overall results of the Cu concentrationobtained on polished and corroded parts usingCu X-rays and the c-line. The agreement betweenthe Cu content measured through the corrosionlayer by the c-line and the bulk concentration isgood. For coin L2-609, the apparent high Znconcentration of 60% must be concentratedmainly in the corrosion layer. Otherwise, theapparent Cu content calculated from the c-rayswould be more than 100%, as mentioned above.Thus, the pitfall of assuming a brass coin canbe ruled out.
5. Conclusions
When the corrosion layer is thin enough, high-energy PIXE can be used directly to characterizecoins without any polishing or sampling. Thedetermination of trace elements is, however,impossible, as one cannot distinguish betweenadditional elements in the corrosion layer or con-tributions from the bulk. The same problem arisesfor other non-destructive analytical methods, likeneutron activation analysis (NAA). In order toeliminate the contribution of the corrosion layer,one has to combine high-energy PIXE or NAAwith a surface sensitive technique. When the corro-sion layer is thick, high-energy PIXE in combina-tion with PIGE provides a fast, convenient toolfor the non-destructive characterisation of coinsthrough a corrosion layer by evaluating the K X-ray lines of the heavy elements and c-lines fromnuclear reactions: for heavy elements and for Cu,different analysable depths are obtained, givinginformation both on the bulk and on the surfacefrom one experiment.
Acknowledgements
The authors would like to thank the ISL crewfor all their help and R. Traum from the Kunsthis-torisches Museum, Vienna, for polishing the coins.The authors are indebted to E. Lietz for providingthe Chinese coins, and J. Riederer for lending theRoman coins. A part of this work was supportedby the European COST G8 action.
References
[1] K. Tsuji, J. Injuk, R. Van Grieken (Eds.), X-ray Spec-trometry: Recent Technological Advances, Wiley, NewYork, 2004.
[2] S.A.E. Johanson, J.L. Campbell, PIXE, A Novel Tech-nique For Elemental Analysis, Wiley, New York, 1988.
[3] G.L. Molnar, Handbook of Prompt Gamma ActivationAnalysis with Neutron Beams with CDROM, KluwerAcademic Publishers, 2003.
[4] J.N. Barrandon, J. Radioanal. Chem. 55 (1980) 317.[5] M. Peisach, C.A. Pineda, Nucl. Instr. and Meth. B 49(1990) 10.
[6] H. Paul, J. Sacher, At. Data Nucl. Data Tables 42 (1989)106.
[7] H. Hubbell, S.M. Seltzer, Tables of X-ray Mass Attenu-ation Coefficients and Mass Energy-Absorption Coeffi-cients, Originally published as NISTIR 5632, NationalInstitute of Standards and Technology, Gaithersburg, MD,1995.
[8] A. Denker, K.H. Maier, Nucl. Instr. and Meth. B. 150(1999) 118.
[9] A. Denker, J. Opitz-Coutureau, J.L. Campbell, J.A.Maxwell, T. Hopman, Nucl. Instr. and Meth. B 219–220C (2004) 130.
[10] http://www.srim.org/.[11] A. Denker et al., Nucl. Instr. and Meth. B 226 (2004) 163.[12] E. Lietz, private communication.[13] W. Bohne, J. Rohrich, G. Roschert, Nucl. Instr. and Meth.
B 139 (1998) 219.