Influence of continental air mass transport on atmospheric CO2 in the western North Pacific
12
Influence of continental air mass transport on atmospheric CO 2 in the western North Pacific Akira Wada, 1 Yousuke Sawa, 2 Hidekazu Matsueda, 2 Shoichi Taguchi, 3 Shohei Murayama, 3 Saki Okubo, 4 and Yukitomo Tsutsumi 5 Received 24 May 2006; revised 6 October 2006; accepted 29 October 2006; published 12 April 2007. [1] Since 1993, atmospheric carbon dioxide (CO 2 ) has been continuously observed by the Japan Meteorological Agency at Minamitorishima station (24°18 0 N, 153°58 0 E), located about 2000 km off the Asian continent in the western North Pacific. The long-term record shows high-frequency measurements with interesting episodic events with extremely low CO 2 mixing ratios 5–10 ppm below the background seasonal cycle. These extremely low CO 2 (ELC) events occur several times each year, primarily in July, August, and September, although the number of events varies from year to year. The origins of air masses associated with the ELC events were defined by backward trajectory analyses as well as chemical characterizations using simultaneous observations of other trace gases (CO, CH 4 , and O 3 ). The results indicate that the air masses with extremely low CO 2 were influenced by active biospheric uptake in summer over different continental sink regions in Siberia, northern Asia, and Southeast Asia due to rapid long-range transport driven by strong northerly or southerly winds. The spatial scale of the widespread low-CO 2 distribution for the ELC events in 2001 was captured by a simulation experiment using a three-dimensional chemical transport model. It clearly revealed that the Intertropical Convergence Zone around 20°N in the western North Pacific during summer blocked further southward intrusion of ELC events through the lower troposphere. Citation: Wada, A., Y. Sawa, H. Matsueda, S. Taguchi, S. Murayama, S. Okubo, and Y. Tsutsumi (2007), Influence of continental air mass transport on atmospheric CO 2 in the western North Pacific, J. Geophys. Res., 112, D07311, doi:10.1029/2006JD007552. 1. Introduction [2] Global levels of atmospheric carbon dioxide (CO 2 ) concentration have increased more than 30% since the preindustrial era because of fossil fuel combustion and deforestation by human activities. This increase will likely cause changes in global climate because CO 2 is estimated to have the largest contribution to anthropogenic radiative forcing. The CO 2 annual growth rate during the 1990s varied interannually from 0.9 to 2.8 ppm yr 1 , which is equivalent to 1.9 to 6.0 PgC yr 1 [Intergovernmental Panel on Climate Change, 2001], but many uncertainties remain regarding the prediction of annual changes in the CO 2 uptake by the land biosphere and ocean. An increase in atmospheric observations, in conjunction with improved global carbon cycle models, is needed to better constrain the CO 2 sources and sinks. [3] Temporal and spatial variations of atmospheric CO 2 have been observed by using ground-based monitoring stations [e.g., Tanaka et al., 1987a; Nakazawa et al., 1991a; Conway et al., 1994], aircraft [e.g., Tanaka et al., 1989; Nakazawa et al., 1991b; Matsueda et al., 2002], and ships [e.g., Tanaka et al., 1987b]. Most of the data from these observations were collected weekly or biweekly using flasks. However, flask sampling observations alone are inadequate for a full understanding of the large CO 2 variations associated with atmospheric transport processes on a synoptic or shorter timescale. Murayama et al. [2003] pointed out that sampling at an interval longer than such a synoptic timescale could lead to biased estimates of the interannual trend and seasonal cycle. It has also been reported that changes in the atmospheric circulation could contribute significantly to the observed year-to-year change in atmospheric CO 2 [Higuchi et al., 2002; Murayama et al., 2004]. These studies indicate that high-frequency measure- ments from in situ continuous measurement systems are needed to elucidate the carbon cycle more precisely. [4] CO 2 data are also essential for inversion modeling studies to estimate regional CO 2 sources and sinks. Previous inversion models used monthly mean data calculated from smoothed curve-fitting techniques to remove the influence JOURNAL OF GEOPHYSICAL RESEARCH, VOL. 112, D07311, doi:10.1029/2006JD007552, 2007 1 Meteorological College, Kashiwa, Japan. 2 Geochemical Research Department, Meteorological Research Institute, Tsukuba, Japan. 3 National Institute of Advanced Industrial Science and Technology, Tsukuba, Japan. 4 Nagano Local Meteorological Observatory, Japan Meteorological Agency, Nagano, Japan. 5 Global Environment and Marine Department, Japan Meteorological Agency, Tokyo, Japan. Copyright 2007 by the American Geophysical Union. 0148-0227/07/2006JD007552 D07311 1 of 12
-
Upload
independent -
Category
Documents
-
view
4 -
download
0
Transcript of Influence of continental air mass transport on atmospheric CO2 in the western North Pacific

Influence of continental air mass transport on atmospheric CO2 in the
western North Pacific
Akira Wada,1 Yousuke Sawa,2 Hidekazu Matsueda,2 Shoichi Taguchi,3
Shohei Murayama,3 Saki Okubo,4 and Yukitomo Tsutsumi5
Received 24 May 2006; revised 6 October 2006; accepted 29 October 2006; published 12 April 2007.
[1] Since 1993, atmospheric carbon dioxide (CO2) has been continuously observed by theJapan Meteorological Agency at Minamitorishima station (24�180N, 153�580E), locatedabout 2000 km off the Asian continent in the western North Pacific. The long-termrecord shows high-frequency measurements with interesting episodic events withextremely low CO2 mixing ratios 5–10 ppm below the background seasonal cycle. Theseextremely low CO2 (ELC) events occur several times each year, primarily in July,August, and September, although the number of events varies from year to year. Theorigins of air masses associated with the ELC events were defined by backward trajectoryanalyses as well as chemical characterizations using simultaneous observations of othertrace gases (CO, CH4, and O3). The results indicate that the air masses with extremely lowCO2 were influenced by active biospheric uptake in summer over different continentalsink regions in Siberia, northern Asia, and Southeast Asia due to rapid long-rangetransport driven by strong northerly or southerly winds. The spatial scale of thewidespread low-CO2 distribution for the ELC events in 2001 was captured by a simulationexperiment using a three-dimensional chemical transport model. It clearly revealed thatthe Intertropical Convergence Zone around 20�N in the western North Pacific duringsummer blocked further southward intrusion of ELC events through the lowertroposphere.
Citation: Wada, A., Y. Sawa, H. Matsueda, S. Taguchi, S. Murayama, S. Okubo, and Y. Tsutsumi (2007), Influence of continental air
mass transport on atmospheric CO2 in the western North Pacific, J. Geophys. Res., 112, D07311, doi:10.1029/2006JD007552.
1. Introduction
[2] Global levels of atmospheric carbon dioxide (CO2)concentration have increased more than 30% since thepreindustrial era because of fossil fuel combustion anddeforestation by human activities. This increase will likelycause changes in global climate because CO2 is estimated tohave the largest contribution to anthropogenic radiativeforcing. The CO2 annual growth rate during the 1990svaried interannually from 0.9 to 2.8 ppm yr�1, which isequivalent to 1.9 to 6.0 PgC yr�1 [Intergovernmental Panelon Climate Change, 2001], but many uncertainties remainregarding the prediction of annual changes in the CO2
uptake by the land biosphere and ocean. An increase inatmospheric observations, in conjunction with improved
global carbon cycle models, is needed to better constrainthe CO2 sources and sinks.[3] Temporal and spatial variations of atmospheric CO2
have been observed by using ground-based monitoringstations [e.g., Tanaka et al., 1987a; Nakazawa et al.,1991a; Conway et al., 1994], aircraft [e.g., Tanaka et al.,1989; Nakazawa et al., 1991b; Matsueda et al., 2002], andships [e.g., Tanaka et al., 1987b]. Most of the data fromthese observations were collected weekly or biweekly usingflasks. However, flask sampling observations alone areinadequate for a full understanding of the large CO2
variations associated with atmospheric transport processeson a synoptic or shorter timescale. Murayama et al. [2003]pointed out that sampling at an interval longer than such asynoptic timescale could lead to biased estimates of theinterannual trend and seasonal cycle. It has also beenreported that changes in the atmospheric circulation couldcontribute significantly to the observed year-to-year changein atmospheric CO2 [Higuchi et al., 2002; Murayama et al.,2004]. These studies indicate that high-frequency measure-ments from in situ continuous measurement systems areneeded to elucidate the carbon cycle more precisely.[4] CO2 data are also essential for inversion modeling
studies to estimate regional CO2 sources and sinks. Previousinversion models used monthly mean data calculated fromsmoothed curve-fitting techniques to remove the influence
JOURNAL OF GEOPHYSICAL RESEARCH, VOL. 112, D07311, doi:10.1029/2006JD007552, 2007
1Meteorological College, Kashiwa, Japan.2Geochemical Research Department, Meteorological Research Institute,
Tsukuba, Japan.3National Institute of Advanced Industrial Science and Technology,
Tsukuba, Japan.4Nagano Local Meteorological Observatory, Japan Meteorological
Agency, Nagano, Japan.5Global Environment and Marine Department, Japan Meteorological
Agency, Tokyo, Japan.
Copyright 2007 by the American Geophysical Union.0148-0227/07/2006JD007552
D07311 1 of 12

of nonbaseline variations from outlying measurements [e.g.,Bousquet et al., 2000]. However, Law et al. [2002] reportedthat the uncertainties of CO2 flux estimations were reducedby using nonbaseline data for an inversion model. It hasbeen strongly suggested that the use of outlying data onshorter timescales from high-frequency observations couldpotentially result in a more accurate estimate of the CO2
sources and sinks [Gurney et al., 2002].[5] In the western Pacific, large temporal and spatial
variations of CO2 and other trace gases are often observedwith episodic events due to the continental outflow [e.g.,Pochanart et al., 1999; Jaffe et al., 1997; Bey et al., 2001;Liu et al., 2003; Sawa et al., 2004], from Asia whichexperiences both strong anthropogenic emissions and aland-biospheric source and sink region. In addition, midlat-itude synoptic weather changes can cause larger short-termvariation in the atmospheric trace gases in the western NorthPacific. The influence of an Asian outflow by long-rangetransport to the central Pacific has been clearly revealed inprevious studies [e.g., Harris et al., 1992; Murayama et al.,2003]. However, a detailed study of the air transportassociated with shorter time variations of atmosphericCO2 in the western North Pacific has not been done.[6] Since 1994, the Japan Meteorological Agency (JMA)
has been monitoring atmospheric CO2 at Minamitorishimastation on a remote coral island in the western North Pacificusing a continuous measurement instrument [Watanabe etal., 2000]. This long-term record with high-frequencymeasurements is useful for investigating the shorter timevariation of CO2 relating to the long-range transport of theAsian continental outflow. In this study, we focus onextremely low CO2 events observed at Minamitorishimastation and examine their origins and transport in detail. Theseasonal and interannual occurrences of the low-CO2 events
are first analyzed using data from 1994–2004. Second, theorigins are examined by backward trajectory analysis aswell as chemical characterization of other trace gasesobserved simultaneously at this station. Third, the transportpathways and mechanism are analyzed using weather chartsas well as a three-dimensional chemical transport model.
2. Methods
2.1. Monitoring Site
[7] The station of Minamitorishima (24�180N, 153�580E,9 m above sea level) is situated on a remote coral island inthe western North Pacific, about 2000 km southeast ofTokyo (Figure 1). This station has been operated by theJapan Meteorological Agency (JMA) for long-term obser-vations of atmospheric trace gases under the Global Atmo-sphere Watch program of the World MeteorologicalOrganization (WMO/GAW). The island has an area of1.4 km2 and is covered with sparse evergreen shrub andgrass. Approximately 50 people from the JMA are dis-patched to the site each year, in addition to people sent bythe Japanese Marine Self-Defense Force and Coast Guard.Because the island is in the subtropical region and locatedon the southern edge of the Pacific high, maritime air fromeasterly winds prevails throughout the year. Continental airmasses from East Asia are sometimes transported by thesynoptic-scale weather perturbations, but the influences oflocal sources and sinks within this small island are negligi-ble for trace gas observations.
2.2. Sampling and Measuring Methods
[8] At the Minamitorishima station, carbon dioxide(CO2), carbon monoxide (CO), methane (CH4), and ozone(O3) have been measured by the Atmospheric Environmen-tal Division of JMA since March 1993. Since details of
Figure 1. Map showing the geographical location of Minamitorishima station (24�180N, 153�580E, 9 mabove sea level).
D07311 WADA ET AL.: LOW-CO2 EVENT AT MINAMITORISHIMA
2 of 12
D07311

continuous measurement systems have been previouslyreported by Japan Meteorological Agency [1994] andWatanabe et al. [2000], only brief descriptions of theanalytical methods are given here.[9] Sample air is collected from the top of a 10 m
observational tower. After drying the sample air, the CO2
concentration is measured using a nondispersive infraredanalyzer (NDIR: VIA510R, Horiba, Ltd., Japan) with theanalytical precision of about 0.02 ppm. All CO2 measure-ments used here were recalculated for consistency with theWMO CO2 mole fraction scale from the National Oceanicand Atmospheric Administration/Global Monitoring Divi-sion (NOAA/GMD, formerly NOAA/CMDL) [Matsueda etal., 2004a]. CO and CH4 are measured continuously usingan NDIR (GA-360S, Horiba, Ltd., Japan) with the overallanalytical precision of about ± 5 ppb. The concentration ofCH4 in the sample air is reported on the JMA primarystandard scale [Matsueda et al., 2004b], which is similar tothe WMO CH4 mole fraction scale from the NOAA/GMD[Dlugokencky et al., 2005]. The concentration of CO in thesample air is determined by standard gases assigned by theChemicals Evaluation and Research Institute of Japan.[10] Sample air for the O3 measurement is provided using
a different inlet installed on the top of the observatorybuilding. O3 is measured using an ozone analyzer(EG2001F, Ebara Jitsugyo Co., Ltd., Japan) with the overallprecision of less than 1%.
2.3. Observational Data
[11] The output data from the NDIR analyzers for theCO2, CO, and CH4 measurements are collected by dataloggers every second and then averaged for 30 s to calculatethe concentrations on the basis of regular measurements ofthe working standards. The O3 concentration is averaged for15 s and directly obtained from the analyzer. These aver-aged data sets along with their standard deviations are usedto perform careful quality assurance tests before generatinghourly data sets at JMA. The data are posted on the WMOWorld Data Center for Greenhouse Gases (WMO/WDCGG,http://gaw.kishou.go.jp/wdcgg.html) operated by the JMAin Tokyo. In this study, hourly data sets for CO2, CO, CH4,and O3 observed at the Minamitorishima station for 12 yearsbetween March 1993 and December 2004 are used.
2.4. Trajectory Analysis
[12] We applied a 10-day isentropic backward trajectoryanalysis to examine the transport pathways associated withobserved trace gas variations. Although the assumption ofthe adiabatic processes does not necessarily account for themovement of air parcels which are accompanied by precip-itation or strong wind shear, this assumption is acceptableon a synoptic scale of air motion in the free troposphere[Harris and Kahl, 1990]. The trajectory model used herewas developed at the Meteorological Research Institute, asreported in detail by Sawa [2005]. In this model, the globalanalysis data (GANAL) prepared by JMA was used asmeteorological data for the trajectory calculation. Thespatial resolution of the GANAL data was 1.25� � 1.25�after March 1996 and 1.875� � 1.875� prior to March 1996.The number of vertical layers is 18, with time intervals of6 hours after March 1996 and 12 hours prior to March 1996.
[13] Although the Minamitorishima station is located nearthe zero level, the trajectories were calculated at an altitudelevel of 1500 m in order to obtain a more representativetransport pathway in the boundary layer. To assess theprecision of trajectory analysis, we compared five trajectoriesat a center and four end points located in a 0.5� � 0.5� boxwith the actual observation site. When the pathways of thefive trajectories were quite distinct, the trajectories were notused for the interpretation of the air mass origins in thepresent study.
2.5. The 3-D Transport Model
[14] To quantitatively understand the spatial scale for theCO2 variations observed at Minamitorishima, a 3-D chem-ical transport model was used in this study. The model ofthe NIRE-CTM-96 was developed at the National Instituteof Advanced Industrial Sciences and Technology (AIST, theformer National Institute for Research and Environment) inJapan [Taguchi, 1996; Taguchi et al., 2002a]. This modelhas 1.125� horizontal resolution with 60 vertical levels, andits advection is calculated by using a semi-Lagrangianscheme. The model was compared with other models usedin international model intercomparison studies of the Trans-Com experimental series to characterize model behavior[Gurney et al., 2004]. In addition, model validations wereconducted by comparisons with observed data of CO2, CO,and radon [Taguchi et al., 2002a, 2002b, 2003]. In thisstudy, the model calculation was driven by the meteorolog-ical data from NCEP/NCAR with the biospheric exchangedata of CO2 from the Carnegie Ames Stanford Approach(CASA) model [Randerson et al., 1997]. The other exper-iment was also performed using the same model with totalCO2 fluxes including biospheric exchange, fossil fuel emis-sions [Andres et al., 1996], and oceanic exchange of CO2
[Takahashi et al., 2002].
3. Results and Discussion
3.1. CO2 Variations
[15] Figure 2 shows the hourly mean CO2 observed at theMinamitorishima station from March 1993 to December2004. The CO2 record clearly shows a long-term increasingtrend, a distinct seasonal cycle, and high-frequency short-term variations. The CO2 data record contains a minimaldiurnal signal with a mean amplitude of 0.6 ppm foundthroughout the year. The data have also been examined forlocal sources and sinks for the CO2. It is clear that neitherthe diurnal signal or local signal can account for theepisodic behavior.[16] The annual mean level of CO2 indicates a continuous
increase from 360 ppm in 1994 to 378 ppm in 2004. Theaveraged growth rate during the 11 years period (1994–2004) is about 1.8 ppm yr�1, with large interannual varia-tion of the CO2 growth rate from about 1 ppm yr�1 in 1996to 3 ppm yr�1 around 1997–1998 and 2002–2003. Asimilar increasing CO2 trend and interannual variabilityhas been observed by the wide-coverage observations fromthe JAL airliner [Matsueda et al., 2002] and from theground-based flask sampling network of NOAA/GMD[Conway et al., 1994].[17] The averaged seasonal cycle shows a minimum in
mid-September and a maximum in mid-May with a mean
D07311 WADA ET AL.: LOW-CO2 EVENT AT MINAMITORISHIMA
3 of 12
D07311
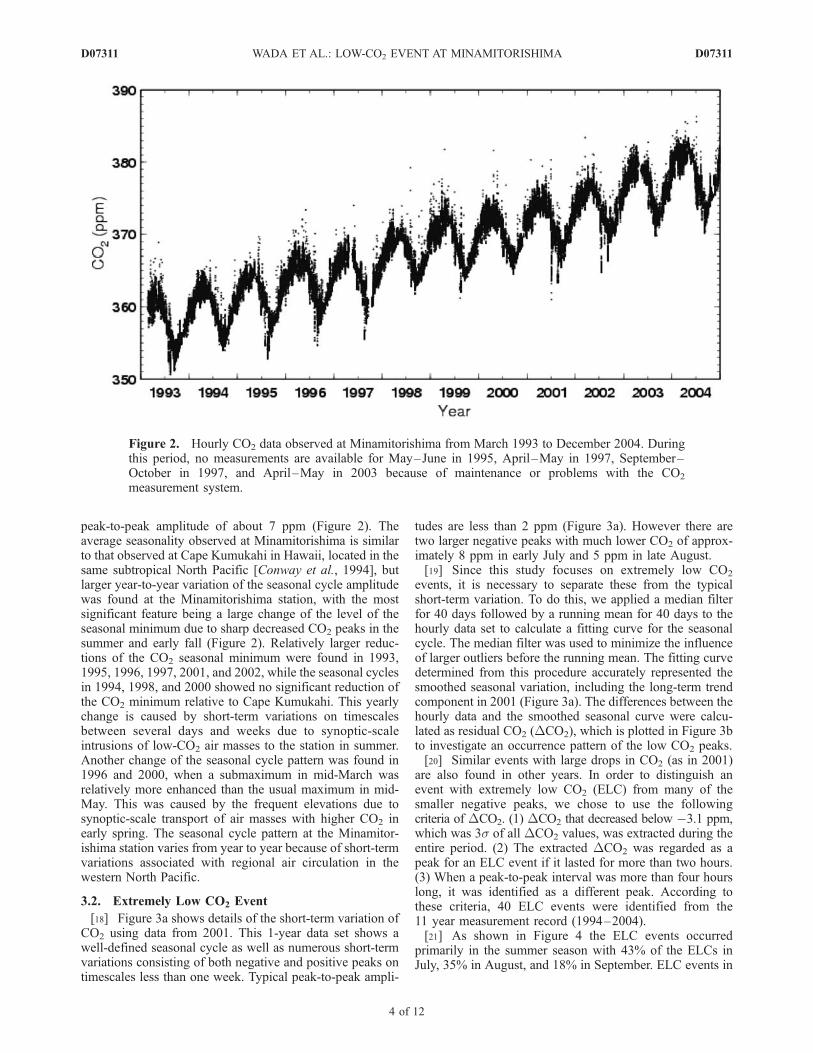
peak-to-peak amplitude of about 7 ppm (Figure 2). Theaverage seasonality observed at Minamitorishima is similarto that observed at Cape Kumukahi in Hawaii, located in thesame subtropical North Pacific [Conway et al., 1994], butlarger year-to-year variation of the seasonal cycle amplitudewas found at the Minamitorishima station, with the mostsignificant feature being a large change of the level of theseasonal minimum due to sharp decreased CO2 peaks in thesummer and early fall (Figure 2). Relatively larger reduc-tions of the CO2 seasonal minimum were found in 1993,1995, 1996, 1997, 2001, and 2002, while the seasonal cyclesin 1994, 1998, and 2000 showed no significant reduction ofthe CO2 minimum relative to Cape Kumukahi. This yearlychange is caused by short-term variations on timescalesbetween several days and weeks due to synoptic-scaleintrusions of low-CO2 air masses to the station in summer.Another change of the seasonal cycle pattern was found in1996 and 2000, when a submaximum in mid-March wasrelatively more enhanced than the usual maximum in mid-May. This was caused by the frequent elevations due tosynoptic-scale transport of air masses with higher CO2 inearly spring. The seasonal cycle pattern at the Minamitor-ishima station varies from year to year because of short-termvariations associated with regional air circulation in thewestern North Pacific.
3.2. Extremely Low CO2 Event
[18] Figure 3a shows details of the short-term variation ofCO2 using data from 2001. This 1-year data set shows awell-defined seasonal cycle as well as numerous short-termvariations consisting of both negative and positive peaks ontimescales less than one week. Typical peak-to-peak ampli-
tudes are less than 2 ppm (Figure 3a). However there aretwo larger negative peaks with much lower CO2 of approx-imately 8 ppm in early July and 5 ppm in late August.[19] Since this study focuses on extremely low CO2
events, it is necessary to separate these from the typicalshort-term variation. To do this, we applied a median filterfor 40 days followed by a running mean for 40 days to thehourly data set to calculate a fitting curve for the seasonalcycle. The median filter was used to minimize the influenceof larger outliers before the running mean. The fitting curvedetermined from this procedure accurately represented thesmoothed seasonal variation, including the long-term trendcomponent in 2001 (Figure 3a). The differences between thehourly data and the smoothed seasonal curve were calcu-lated as residual CO2 (DCO2), which is plotted in Figure 3bto investigate an occurrence pattern of the low CO2 peaks.[20] Similar events with large drops in CO2 (as in 2001)
are also found in other years. In order to distinguish anevent with extremely low CO2 (ELC) from many of thesmaller negative peaks, we chose to use the followingcriteria of DCO2. (1) DCO2 that decreased below �3.1 ppm,which was 3s of all DCO2 values, was extracted during theentire period. (2) The extracted DCO2 was regarded as apeak for an ELC event if it lasted for more than two hours.(3) When a peak-to-peak interval was more than four hourslong, it was identified as a different peak. According tothese criteria, 40 ELC events were identified from the11 year measurement record (1994–2004).[21] As shown in Figure 4 the ELC events occurred
primarily in the summer season with 43% of the ELCs inJuly, 35% in August, and 18% in September. ELC events in
Figure 2. Hourly CO2 data observed at Minamitorishima from March 1993 to December 2004. Duringthis period, no measurements are available for May–June in 1995, April–May in 1997, September–October in 1997, and April–May in 2003 because of maintenance or problems with the CO2
measurement system.
D07311 WADA ET AL.: LOW-CO2 EVENT AT MINAMITORISHIMA
4 of 12
D07311

other months were rare (<3%). The peaks in winter withaveraged DCO2 of �3.5 ppm were smaller than thoseobserved in summer. The yearly frequency of the ELCevents contains a large interannual variation with thenumber of events being 5–7 in 1995, 1996, 2002, and2004, with fewer than 3 events in each of 1994, 1997, 1998,and 2003. The magnitude of DCO2 minimum for the ELCevents also varied year by year with the DCO2 minimumranging from 4 to 10 ppm, and not related to the yearlyvariation of the number of the ELC events. These resultssuggest that conditions favorable for the transport of low-CO2 air masses to Minamitorishima occur in the summer
over the western North Pacific with significant year-to-yearvariability.
3.3. Origin of Air Masses With Low CO2
[22] We examined the 10-day isentropic backward trajec-tories for all ELC events in order to deduce the most likelyorigins for the air masses with extremely low CO2. Since thetrajectories were calculated at an interval of 6 hours, severaltrajectories were obtained for each event. Figure 5 shows allof the trajectories classified into 5 trajectory origin sectors,i.e., north (N), west (W), south (S), east (E), and complex(C). Trajectories were assigned when they passed over the
Figure 4. Seasonal variation of the number of the extremely low CO2 (ELC) events during 1994–2004.
Figure 3. (a) Observed hourly CO2 data (dots) and smoothed seasonal curve (solid line) atMinamitorishima in 2001. A detailed procedure describing the seasonal curve analysis is included in thetext. (b) Residual CO2 (DCO2) data (dots) from the differences between the hourly data and the seasonalcurve and a range of DCO2 variability (dotted lines) within ± 3.1 ppm, using data in Figure 3a.
D07311 WADA ET AL.: LOW-CO2 EVENT AT MINAMITORISHIMA
5 of 12
D07311

area of each sector. The range of the area was defined as50�N–80�N and 100�E–160�W for the N sector, 20�N–50�N and 100�E–130�E for the W sector, 20�N–0� and100�E–130�E for the S sector, and 50�N–0� and 180�–160�W for the E sector. Others were classified as theC sector.[23] The trajectories for the N sector clearly show the
low-CO2 air masses originated from the higher latitudesaround Siberia as well as from the Bering Sea. It is mostlikely that extremely low CO2 was produced by activeuptake from boreal forests in Siberia in summer and thenflowed out into the oceanic region around the Bering Sea. Inthe case of the trajectories for the W sector, the air masses
were transported from the directions of northern China andJapan, where the CO2 concentration likely decreased as aresult of uptake by the temperate mixed forests. Thetrajectories for the S sector showed that the air masses weretransported from the directions of the tropical forests inSoutheast Asia and/or southern China in East Asia. Thus itis likely that active uptake by the land biosphere in summergenerated continental air masses for the ELC events in thetrajectories for the N, W, and S sectors. However, no strongsink regions for the E and C sectors could be identified bythe 10-day trajectories because maritime air masses domi-nated in both sectors. Murayama et al. [2003] reported thatlarge CO2 variations were observed episodically by ship-
Figure 5. The 10-day isentropic backward trajectories for the ELC events classified into five sectors:(a) north (N), (b) west (W), (c) south (S), (d) east (E), and (e) complex (C). Detailed classificationprocedures for the trajectory sectors are described in the text.
D07311 WADA ET AL.: LOW-CO2 EVENT AT MINAMITORISHIMA
6 of 12
D07311

board observations around a synoptic-scale front on thecentral Pacific, but no front system was found on theweather charts around Minamitorishima before the observedELC events in the present study.[24] The yearly frequency of the 5 different transport
pathways largely depended on the years from 1994 to2004. In 1995, 1997, 2002, and 2003, continental air massesfor the N or W sectors accounted for 60–100% of the totalELC events. The pathways for the S sector occupied 50% in1999. In 1995, 1996, 1999, and 2001, various transportpathways are included. This result suggested that sinkregions for the low CO2 in the ELC events were changedby a regional weather system in the western North Pacificyear by year. When we examined a monthly frequency ofthe 5 transport pathways, the predominant pathways for theELC events varied much from month to month. About onehalf of the trajectories in July showed transport from theW sector, while the transport from the N sector waspredominant in August. In September, both trajectories forthe W and N sectors decreased, with the primary transportpathway originating from the C sector. Thus differencesindicated that the air mass origin for the ELC event varied
from month to month because of a seasonal change of theweather system in the western North Pacific.
3.4. Enhancement of Other Trace Gases
[25] We find that CH4, CO, and O3 are simultaneouslyenhanced when ELC events are observed at the Minamitor-ishima station. Enhanced concentrations are calculated asDCO, DCH4, andDO3 using the same procedure applied toCO2. Figure 6 shows themeanDCH4,DCO, andDO3 for thefive transport pathways from the N, W, S, E, and C sectors inthe ELC events from 1994 to 2004. The mean values wereobtained from averaging all enhanced concentrationscorresponding to the DCO2 below �3.1 ppm, as the criteriaof the ELC events. The results clearly show that the DCH4,DCO, and DO3 were different among the air mass originsclassified by the trajectory analyses because the geographicaldistribution of sources and sinks largely influences thesetrace gases.[26] For DCH4, relatively larger enhancements of 30 to
40 ppb were found in air masses from the N and W sectors.This result suggests that the enhanced CH4 in both the Nand W sectors was influenced by increased CH4 emissions
Figure 6. Enhanced mixing ratios of (a)DCH4, (b)DCO, and (c)DO3 for five trajectory types of N, W,S, E, and C for the ELC events. Detailed calculation procedures for the trace gas enhancements aredescribed in the text.
D07311 WADA ET AL.: LOW-CO2 EVENT AT MINAMITORISHIMA
7 of 12
D07311

from wetlands in Siberia in summer [Fung et al., 1991;Dlugokencky et al., 1994]. Another cause is the transport ofthe air masses from northern high latitudes as a source ofCH4 due to the north-to-south gradient for background CH4
which has a latitudinal difference of around 40 ppb between50�N and 20�N in summer [Dlugokencky et al., 1994]. Incontrast, the DCH4 for the pathway from the S sector showsa relatively smaller enhancement, suggesting the differentair mass origin.[27] For DCO, a smaller enhancement of less than 10 ppb
was found in the transport in the E sector, but other pathwaysshowed enriched-CO air masses with DCO of 35 to 40 ppbfor the N and S sectors, and about 26 ppb for the W and Csectors. The CO enhancements are caused by polluted airmasses from East Asia and Southeast Asia [Bey et al., 2001;Jaffe et al., 1997; Liu et al., 2003] and/or the substantialnorth-to-south gradient of around 30 ppb between 50�N and20�N in summer [Novelli et al., 2003]. This indicates thatmost of the air masses with higher DCO were transportedfrom the continent or northern higher latitudes.[28] ForDO3, relatively higher values of more than 15 ppb
were found in the air masses from the N and S sectors.These O3 enhancements are associated with higher levels ofDCO, suggesting the photochemical production of O3
during transport to Minamitorishima. In addition, the largerDO3 was partly influenced by the steep north-to-southgradient in the western North Pacific in summer [Tanimotoet al., 2005].[29] The origins of the air masses from both the C and
E sectors are not well defined by the 10-day trajectoryanalyses, but the chemical compositions of the DCH4,DCO, and DO3 indicated a large difference in the twocases. The larger enhancements of DCH4 and DCO in thecase of C were similar to those in the cases of the N and W,strongly suggesting that the air masses originated from thecontinent or higher latitudes. On the other hand, the lowerDCH4, DCO, and DO3 in the case of the E sector wereassociated with the smaller DCO2 decreases for the ELCevents. It is likely that dilution by maritime air woulddiminish the continental signal.
3.5. Transport Mechanism of Low CO2
[30] In order to clarify the detailed transport mechanismfor the ELC events, we investigated weather charts over thewestern North Pacific and compared them with the transportpathways calculated from the backward trajectories. As aresult of this approach, a specific weather system could beidentified for each transport pathway in summer. Theweather charts were created by the JMA.[31] As an example of transport from N sector, Figures 7a
and 7b show the weather charts at 0000 UTC on 17 and19 August 2001 before the ELC event observed on21 August at Minamitorishima. The trajectory analysis forthis event indicated that air masses were transported south-ward from Siberia to Minamitorishima. In the weather charton 17 August, 4 days before the event, it clearly shows thatthe air parcel around 45�N was located between the high-pressure system over the Amur River and the low-pressuresystem over the Kamchatka Peninsula. This air parcelrapidly moved southward to about 31�N in about 2 daysthrough the pathway between the low- and high-pressuresystems, as shown in the weather chart on 19 August. These
results indicated that strong northerly winds produced bythe arrangement with the high-pressure system on the westside and the low-pressure system on the east side were adriving force for the rapid southward transport of the low-CO2 to Minamitorishima. The same synoptic weather pat-tern over the northern part of the western North Pacific wasfound in all of the other ELC events for the transportpathway in the N sector. This weather pattern appearsseveral times a month in summer, although it was morefrequent in August than July.[32] In the case of the transport pathway from the
W sector, Figures 7c and 7d show the weather charts at0000 UTC on 3 and 7 July 2002 before the ELC eventobserved on 10 July at Minamitorishima. The trajectory forthis event indicates that the air masses over northern Chinamoved slowly eastward across Japan to the Pacific and werethen suddenly transported southward to Minamitorishima.The weather chart on 3 July one week before the eventrevealed that the eastward transport of continental airmasses occurred north of a long Mei-yu front along about35�N that was usually stationary from late June to early Julyover this region. However, the Mei-yu front in the weatherchart on 7 July broke down at around 150�E, and the airmasses suddenly moved toward the south through the rift ofthe front. The rapid southward transport was driven bystrong northerly winds produced by the arrangement withthe high-pressure system on the west side and the low-pressure system on the east side. This arrangement ofpressure systems was similar to that in the case of theN sector, but the events in the W sector were relatively morefrequent in July than those in the N sector because of theformation of a Mei-yu front.[33] In the case of the transport pathway in the S sector,
Figures 7e and 7f show the weather charts at 0000 UTC on10 and 12 August 1999 before the ELC event observed on17 August at Minamitorishima. The trajectory for this eventindicated that an air parcel over the Philippine Islandsrapidly moved northward and then turned to the east toproceed toward Minamitorishima. The weather chart on10 August one week before the event revealed that therapid northward movement of the air parcel was driven bystrong southerly winds between the tropical depression overJapan and a high-pressure system over Minamitorishima.After the northward shift of the depression on 12 August,the air parcel moved eastward along the rim of the high-pressure system. This case suggested that the tropicaldepression played an important role in the northwardtransport of low-CO2 influenced by the tropical region.
3.6. The 3-D Model Approaches
[34] In order to examine the spatial scale of the ELCevents observed at Minamitorishima, the CO2 distributionwas simulated by a 3-D chemical transport model withbiospheric fluxes. Figure 8 shows hourly CO2 data atMinamitorishima from the model calculation in 2001 incomparison with the observed data. The two ELC events on6 July and 23 August as well as the seasonal cycle were wellreproduced in the model result. In particular, the magnitudeand timing of the decreased CO2 for the ELC events arequite similar between the model and the observation in2001. The ELC events in 2002 are also captured accurately,indicating intrusions of low-CO2 air masses largely influ-
D07311 WADA ET AL.: LOW-CO2 EVENT AT MINAMITORISHIMA
8 of 12
D07311

enced by biological uptake on land. When we used totalCO2 fluxes including anthropogenic emissions and oceanfluxes for the model calculation, the magnitude of DCO2
minimum for the ELC events was reduced by 0.3 to 1.9 ppmthat corresponded to 10 to 28% for the amplitudes of thedecreased CO2 peaks. It is strongly suggested that anthro-pogenic CO2 emissions somewhat weaken biological uptakesignal for the ELC events, although their anthropogenic
influence may depend on the transport pathways over thecontinent.[35] Figure 9 shows the global distributions of surface
CO2 for the ELC events produced by the model at1200 UTC on 7 July 0600 UTC and 22 August 2001,respectively. It is clearly revealed that Minamitorishimaduring both ELC events was covered by a large streamwith low CO2 that extended southward from the highlatitudes, but their low-CO2 origins were different from
Figure 7. Surface weather charts before the ELC events observed at Minamitorishima on (a) 17 and(b) 19 August 2001 as trajectory type N, on (c) 3 and (d) 7 July 2002 as trajectory type W, and on (e) 10and (f) 12 August 1999 as trajectory type S. The gray and dashed circles represent locations of air massescalculated by the backward trajectory analysis and Minamitorishima station, respectively. The weathercharts were created by the Japan Meteorological Agency.
D07311 WADA ET AL.: LOW-CO2 EVENT AT MINAMITORISHIMA
9 of 12
D07311

Figure 9. Spatial surface CO2 distributions obtained by the 3-D model at (a) 0600 UTC on 7 July and(b) 1200 UTC 22 August 2001 when the low CO2 events were observed. The white circle in each plotrepresents the location of Minamitorishima.
Figure 8. Comparison of hourly CO2 data in 2001 between the observation (dots) and the 3-D modelresults (solid line).
D07311 WADA ET AL.: LOW-CO2 EVENT AT MINAMITORISHIMA
10 of 12
D07311

each other. In the case of the ELC event in July, the lowCO2 flowed out from the northern part of China to thewestern North Pacific and then turned south to proceedtoward Minamitorishima. On the other hand, the ELC eventin August showed that the low-CO2 outflows from thestrong CO2 sinks in Siberia widely distributed over thewestern North Pacific and branched to the southwardtransport toward Minamitorishima.[36] It was determined in both ELC events that the
low-CO2 stream around the Minamitorishima stationspread out longitudinally between 140�E and 165�E(Figure 9). However, the low-CO2 stream did not expandsouthward across the subtropical region around 20�N. Inthis western North Pacific, the Intertropical ConvergenceZone (ITCZ) shifts northward to about 20�N during thesummer season, as reported by the climatology of thehighly reflective cloud data set [Waliser and Gautier,1993]. The outgoing longwave radiation (OLR) dataduring the both ELC events in 2001 provided by theNOAA/OAR/ESRL (http://www.cdc.noaa.gov/) showedthat high cloud belt indicative of the ITCZ was locatedin the subtropics between 20�N and 10�N over thewestern North Pacific. It appears that the ITCZ aroundthe subtropics blocked further southward transport of thelow CO2 through the surface air and was then conveyedupward into the middle and upper troposphere.
4. Conclusions
[37] In this study, the long-term observational record ofatmospheric CO2 at Minamitorishima in the western NorthPacific was analyzed to focus on the origin and transportmechanism of extremely low CO2 (ELC) events. When theELC events were extracted using a criterion of more than3.1 ppm below the seasonal cycle, 40 events were found forthe 11 year period from 1994 to 2004. Most ELC eventsoccurred in summer between July and September, althoughthe number of the events varied from year to year. Using10-day backward trajectory analyses, air masses for ELCevents were classified into 5 transport pathways of the N,W, S, E, and C sectors. In addition, the air mass origins forthe 5 trajectory categories were consistent with the varia-tions of CO, CH4, and O3 observed simultaneously atMinamitorishima.[38] The trajectory and chemical analyses indicate that the
low-CO2 air masses were formed by the active uptake ofCO2 by the land biosphere over several different sinkregions, such as Siberia, northern China, and SoutheastAsia. The long-range transport from these continental sinkregions to Minamitorishima was driven by rapid north-to-south or south-to-north movement of air masses. Suchtransport occasionally occurred in summer because of thearrangement of the low- and high-pressure systems overthe western North Pacific. This transport mechanism for theELC event was apparently different from the frequentoutflow of Asian pollution driven by the moving springcold fronts [e.g., Bey et al., 2001; Liang et al., 2004]. TheELC events in 2001 and 2002 were accurately reproducedby the 3-D model calculation. This calculation clearlyrevealed that the widespread distribution of the low CO2
was prevented by the ITCZ in the subtropics over thewestern North Pacific in summer.
[39] The results of the present study suggested that theELC event is an important process for the vigorous mixingof CO2 in the interior of the Northern Hemisphere in thesummer. In particular, the western North Pacific played animportant role in the rapid exchange of CO2 between thehigh latitudes and subtropical regions because of synoptic-scale weather changes. Thus, to learn more about globalCO2 circulation, it will be necessary to focus on short-termvariations on the basis of continuous observations.
[40] Acknowledgments. We would like to acknowledge all membersof the Japan Meteorological Agency for operating the trace gas measuringsystems at Minamitorishima station. We also thank the anonymousreviewers for their valuable comments on this manuscript.
ReferencesAndres, R. J., G. Marland, I. Fung, and E. Matthews (1996), A 1� � 1�distribution of carbon dioxide emissions from fossil fuel consumptionand cement manufacture, 1950–1990, Global Biogeochem. Cycles,10(3), 419–429.
Bey, I., D. J. Jacob, J. A. Logan, and R. M. Yantosca (2001), Asian che-mical outflow to the Pacific in spring: Origins, pathways, and budgets,J. Geophys. Res., 106(D19), 23,097–23,113.
Bousquet, P., P. Peylin, P. Ciais, C. Le Quere, P. Friedlingstein, and P. P.Tans (2000), Regional changes in carbon dioxide fluxes of land andoceans since 1980, Science, 290, 1342–1346.
Conway, T. J., P. P. Tans, L. S. Waterman, K. W. Thoning, D. R. Kitzis,K. A. Masarie, and N. Zhang (1994), Evidence for interannual variabilityof the carbon cycle from the National Oceanic and Atmospheric Admin-istration/Climate Monitoring and Diagnostics Laboratory Global AirSampling Network, J. Geophys. Res., 99(D11), 22,831–22,855.
Dlugokencky, E., L. P. Steele, P. M. Lang, and K. A. Masarie (1994), Thegrowth rate and distribution of atmospheric methane, J. Geophys. Res.,99(D8), 17,021–17,043.
Dlugokencky, E. J., R. C. Myers, P. M. Lang, K. A. Masarie, A. M.Crotwell, K. W. Thoning, B. D. Hall, J. W. Elkins, and L. P. Steele(2005), Conversion of NOAA atmospheric dry air CH4 mole fractionsto a gravimetrically prepared standard scale, J. Geophys. Res., 110,D18306, doi:10.1029/2005JD006035.
Fung, I. Y., J. John, J. Lerner, E. Matthews, M. Prather, L. P. Steele, and P. J.Fraser (1991), Three-dimensional model synthesis of the global methanecycle, J. Geophys. Res., 96(D7), 13,033–13,065.
Gurney, K. R., et al. (2002), Towards robust regional estimates of CO2
sources and sinks using atmospheric transport models, Nature, 415,626–630.
Gurney, K. R., et al. (2004), Transcom 3 inversion intercomparison: Modelmean results for the estimation of seasonal carbon sources and sinks,Global Biogeochem. Cycles, 18, GB1010, doi:10.1029/2003GB002111.
Harris, J. M., and J. D. Kahl (1990), A descriptive atmospheric transportclimatology for the Mauna Loa observatory, using clustered trajectories,J. Geophys. Res., 95(D9), 13,651–13,667.
Harris, J. M., P. P. Tans, E. J. Dlugokencky, K. A. Masarie, P. M. Lang,S. Whittlestone, and L. P. Steele (1992), Variations in atmosphericmethane at Mauna Loa observatory related to long-range transport,J. Geophys. Res., 97(D5), 6003–6010.
Higuchi, K., S. Murayama, and S. Taguchi (2002), Quasi-decadal variationof the atmospheric CO2 seasonal cycle due to atmospheric circulationchanges: 1979–1998, Geophys. Res. Lett., 29(8), 1173, doi:10.1029/2001GL013751.
Intergovernmental Panel on Climate Change (2001), Climate Change 2001:The Scientific Basis: Contribution of Working Group I to the ThirdAssessment Report of the Intergovernmental Panel on Climate Change,edited by J. T. Houghton et al., 881 pp., Cambridge Univ. Press, NewYork.
Jaffe, D., A. Mahura, J. Kelley, and J. Atkins (1997), Impact of Asianemissions on the remote North Pacific atmosphere: Interpretation ofCO data from Shemya, Guam, Midway and Mauna Loa, J. Geophys.Res., 102(D23), 28,627–28,635.
Japan Meteorological Agency (1994), Summary report on the backgroundair pollution monitoring by the Japan Meteorological Agency (in Japa-nese), Sokkou Jiho, 61(4), 145–179.
Law, R. M., P. J. Rayner, P. L. Steele, and I. G. Enting (2002), Using hightemporal frequency data for CO2 inversions, Global Biogeochem. Cycles,16(4), 1053, doi:10.1029/2001GB001593.
Liang, Q., L. Laegle, D. A. Jaffe, P. Weiss-Penzias, and A. Heckman(2004), Long-range transport of Asian pollution to the northeast Pacific:
D07311 WADA ET AL.: LOW-CO2 EVENT AT MINAMITORISHIMA
11 of 12
D07311

Seasonal variations and transport pathways of carbon monoxide, J. Geo-phys. Res., 109, D23S07, doi:10.1029/2003JD004402.
Liu, H., D. J. Jacob, I. Bey, R. Yantosca, B. N. Duncan, and G. W. Sachse(2003), Transport pathways for Asian pollution outflow over the Pacific:Interannual and seasonal variations, J. Geophys. Res., 108(D20), 8786,doi:10.1029/2002JD003102.
Matsueda, H., H. Y. Inoue, and M. Ishii (2002), Aircraft observation ofcarbon dioxide at 8–13 km altitude over the western Pacific from 1993 to1999, Tellus, Ser. B, 54, 1–21.
Matsueda, H., et al. (2004a), Re-evaluation for scale and stability of CO2
standard gases used as long-term observations at the Japan Meteorologi-cal Agency and the Meteorological Research Institute (in Japanese), Tech.Rep. Meteorol. Res. Inst., 45, 1–64.
Matsueda, H., Y. Sawa, A. Wada, H. Y. Inoue, K. Suda, Y. Hirano,K. Tsuboi, and S. Nishioka (2004b), Methane standard gases for atmo-spheric measurements at the MRI and JMA and intercomparison experi-ments, Pap. Meteorol. Geophys., 54, 91–109.
Murayama, S., K. Harada, K. Gotoh, T. Kitao, T. Watai, and S. Yamamoto(2003), On large variations in atmospheric CO2 concentration observedover the central and western Pacific Ocean, J. Geophys. Res., 108(D8),4243, doi:10.1029/2002JD002729.
Murayama, S., S. Taguchi, and K. Higuchi (2004), Interannual variation inthe atmospheric CO2 growth rate: Role of atmospheric transport in theNorthern Hemisphere, J. Geophys. Res., 109, D02305, doi:10.1029/2003JD003729.
Nakazawa, T., S. Aoki, S. Murayama, M. Fukabori, T. Yamanouchi,H. Murayama, M. Shiobara, G. Hashida, S. Kawaguchi, and M. Tanaka(1991a), The concentration of atmospheric carbon dioxide at the JapaneseAntarctic Station, Syowa, Tellus, Ser. B, 43, 126–135.
Nakazawa, T., K. Miyashita, S. Aoki, and M. Tanaka (1991b), Temporaland spatial variations of upper tropospheric and lower stratospheric car-bon dioxide, Tellus, Ser. B, 43, 106–117.
Novelli, P. C., K. A. Masarie, P. M. Lang, B. D. Hall, R. C. Myers, and J. W.Elkins (2003), Reanalysis of tropospheric CO trends: Effects of the1997–1998 wildfires, J. Geophys. Res., 108(D15), 4464, doi:10.1029/2002JD003031.
Pochanart, P., J. Hirokawa, Y. Kajii, and H. Akimoto (1999), Influence ofregional-scale anthropogenic activity in northeast Asia on seasonal var-iations of surface ozone and carbon monoxide observed at Oki, Japan,J. Geophys. Res., 104(D3), 3621–3631.
Randerson, J. T., M. V. Thompson, T. J. Conway, I. Y. Fung, and C. B.Field (1997), The contribution of terrestrial sources and sinks to trends inthe seasonal cycle of atmospheric carbon dioxide, Global Biogeochem.Cycles, 11, 535–560.
Sawa, Y. (2005), A study of variations and transport of carbon monoxide inthe free troposphere over the western Pacific, D.Sc. thesis, Fac. Sci.,Tohoku Univ., Sendai, Japan.
Sawa, Y., H. Matsueda, Y. Makino, H. Y. Inoue, S. Murayama, M. Hirota,Y. Tsutsumi, Y. Zaizen, M. Ikegami, and K. Okada (2004), Aircraftobservation of CO2, CO, O3 and H2 over the North Pacific during thePACE-7 campaign, Tellus, Ser. B, 56, 2–20.
Taguchi, S. (1996), A three-dimensional model of atmospheric CO2 trans-port based on analyzed winds: Model description and simulation resultsfor TRANSCOM, J. Geophys. Res., 101(D10), 15,099–15,110.
Taguchi, S., H. Matsueda, H. Y. Inoue, and Y. Sawa (2002a), Long-rangetransport of CO from tropical ground to upper troposphere: A case studyfor Southeast Asia in October 1997, Tellus, Ser. B, 54, 22–40.
Taguchi, S., T. Iida, and J. Moriizumi (2002b), Evaluation of the atmo-spheric transport model NIRE-CTM-96 by using measured radon-222concentrations, Tellus, Ser. B, 54, 250–268.
Taguchi, S., S. Murayama, and K. Higuchi (2003), Sensitivity of interann-ual variation of CO2 seasonal cycle at Mauna Loa to atmospheric trans-port, Tellus, Ser. B, 55, 547–554.
Takahashi, T., et al. (2002), Global sea-air CO2 flux based on climatologicalsurface ocean pCO2, and seasonal biological and temperature effects,Deep Sea Res. II, 49(9–10), 1601–1622.
Tanaka,M., T. Nakazawa,M. Shiobara, H. Ohshima, S. Aoki, S. Kawaguchi,T. Yamanouchi, Y.Makino, and H.Murayama (1987a), Variations of atmo-spheric carbon dioxide concentration at Showa Station (69�000S, 39�350E),Antarctica, Tellus, Ser. B, 39, 72–79.
Tanaka, M., T. Nakazawa, and S. Aoki (1987b), Seasonal and meridionalvariations of atmospheric carbon dioxide in the lower troposphere of thenorthern and southern hemispheres, Tellus, Ser. B, 39, 29–41.
Tanaka, M., T. Nakazawa, and S. Aoki (1989), Time and space variations oftropospheric carbon dioxide over Japan, Tellus, Ser. B, 39, 3–12.
Tanimoto, H., Y. Sawa, H. Matsueda, I. Uno, T. Ohara, K. Yamaji,J. Kurokawa, and S. Yonemura (2005), Significant latitudinal gradientin the surface ozone spring maximum over East Asia, Geophys. Res.Lett., 32, L21805, doi:10.1029/2005GL023514.
Waliser, D. E., and C. Gautier (1993), A satellite-derived climatology of theITCZ, J. Clim., 6, 2162–2174.
Watanabe, F., O. Uchino, Y. Joo, M. Aono, K. Higashijima, Y. Hirano,K. Tsuboi, and K. Suda (2000), Interannual variation of growth rate ofatmospheric carbon dioxide concentration observed at the JMA’s threemonitoring stations: Large increase in concentration of atmospheric car-bon dioxide in 1998, J. Meteorol. Soc. Jpn., 78, 673–682.
�����������������������H. Matsueda and Y. Sawa, Geochemical Research Department,
Meteorological Research Institute, 1-1 Nagamine, Tsukuba-shi, Ibaraki-ken 305, Japan.S. Murayama and S. Taguchi, National Institute of Advanced Industrial
Science and Technology, 16-3 Onogawa, Tsukuba 305-8569, Japan.S. Okubo, Nagano Local Meteorological Observatory, Japan Meteor-
ological Agency, 1-8-18 Hakosimizu, Nagano, Japan.Y. Tsutsumi, Global Environment and Marine Department, Japan
Meteorological Agency, 1-3-4 Otemachi, Chiyoda-ku, Tokyo 100-8122,Japan.A. Wada, Meteorological College, 7-4-81 Asahi-cho, Kashiwa, Chiba
277-0852, Japan. ([email protected])
D07311 WADA ET AL.: LOW-CO2 EVENT AT MINAMITORISHIMA
12 of 12
D07311