On the group theoretical background of assigning stepwise mutations onto phylogenies
Upload
midwesternCategory
view
4download
0
Inferring Species Phylogenies From Multiple Genes:Concatenated Sequence Tree Versus ConsensusGene Tree
SUDHINDRA R. GADAGKAR,1* MICHAEL S. ROSENBERG,2,3 and
SUDHIR KUMAR2,3*
1Department of Biology, University of Dayton, Dayton, Ohio 46469-23202School of Life Sciences, Arizona State University, Tempe, Arizona 85287-45013Center for Evolutionary Functional Genomics, The Biodesign Institute,Arizona State University, Tempe, Arizona 85287-5301
ABSTRACT Phylogenetic trees from multiple genes can be obtained in two fundamentallydifferent ways. In one, gene sequences are concatenated into a super-gene alignment, which is thenanalyzed to generate the species tree. In the other, phylogenies are inferred separately from eachgene, and a consensus of these gene phylogenies is used to represent the species tree. Here, we havecompared these two approaches by means of computer simulation, using 448 parameter sets,including evolutionary rate, sequence length, base composition, and transition/transversion ratebias. In these simulations, we emphasized a worst-case scenario analysis in which 100 replicatedatasets for each evolutionary parameter set (gene) were generated, and the replicate dataset thatproduced a tree topology showing the largest number of phylogenetic errors was selected torepresent that parameter set. Both randomly selected and worst-case replicates were utilized tocompare the consensus and concatenation approaches primarily using the neighbor-joining (NJ)method. We find that the concatenation approach yields more accurate trees, even when thesequences concatenated have evolved with very different substitution patterns and no attempts aremade to accommodate these differences while inferring phylogenies. These results appear to holdtrue for parsimony and likelihood methods as well. The concatenation approach shows 495%accuracy with only 10 genes. However, this gain in accuracy is sometimes accompanied byreinforcement of certain systematic biases, resulting in spuriously high bootstrap support forincorrect partitions, whether we employ site, gene, or a combined bootstrap resampling approach.Therefore, it will be prudent to report the number of individual genes supporting an inferred clade inthe concatenated sequence tree, in addition to the bootstrap support. J. Exp. Zool.(Mol. Dev. Evol.)304B:64–74, 2005. r 2005 Wiley-Liss, Inc.
INTRODUCTION
Owing to the rapid advances in DNA sequen-cing, a considerable amount of sequence data isnow available to molecular systematists for infer-ring the evolutionary history of species. Conse-quently, multiple gene and genome sequencedatasets can now be used to reconstruct morerobust evolutionary relationships (e.g., Delsucet al., 2003; Hoofer et al., 2003; Teeling et al.,2003; Hedges et al., 2004; Wolf et al., 2004). Thereare many ways of inferring phylogenetic treesfrom multiple genes for the same set of species (deQueiroz et al., ’95; Huelsenbeck et al., ’96; Yang,’96; Nei et al., 2001; Suchard et al., 2003), but two
fundamentally different ways are considered mostoften. In one, phylogenetic reconstruction is doneafter the gene sequences are concatenated head-to-tail to form a super-gene alignmentFtheconcatenation (Ct) approach. In the other, phylo-genies are inferred separately for each gene and
Grant sponsor: University of Dayton; Grant sponsor: NationalInstitutes of Health; Grant sponsor: National Science Foundation
*Correspondence to: Sudhir Kumar, School of Life Sciences andCenter for Evolutionary Functional Genomics, The Biodesign Insti-tute, Arizona State University, Tempe, AZ 85287-5301. E-mail:[email protected]; or S.R. Gadagkar, Department of Biology, Uni-versity of Dayton, Dayton, OH 46469-2320.E-mail: [email protected]
Received 28 July 2004; Accepted 30 September 2004Published online 18 November 2004 in Wiley InterScience
(www.interscience.wiley.com). DOI: 10.1002/jez.b.21026
r 2005 WILEY-LISS, INC.
JOURNAL OF EXPERIMENTAL ZOOLOGY (MOL DEV EVOL) 304B:64–74 (2005)

the resulting gene trees are used to generate aconsensus phylogeny (the Cn approach).The Ct approach has been used for its presumed
statistical advantages: greater phylogenetic accu-racy conferred by the increased sample size(number of sites) for the given set of taxa.This increased sample size works in differentways towards improving phylogenetic accuracy(e.g., Barrett et al., ’91). For example, Olmsteadand Sweere (’94) found that combining datafrom any two out of three different moleculardatasets produced a more resolved phylogenythan when a single gene was used (also seeRokas et al., 2003). Today, many multigenestudies routinely use the concatenation approach(e.g., Amrine-Madsen et al., 2003; Delsuc et al.,2003; Hoofer et al., 2003; Rokas et al., 2003;Teeling et al., 2003; Hedges et al., 2004; Wolf et al.,2004).The Cn approach, on the other hand, sum-
marizes congruence among individual gene treesand produces high resolution in the branchingpattern only when there is at least a majorityconsensus among the different data sets. Thus, itgives a ‘‘conservative’’ or ‘‘safe’’ estimate of thephylogeny (Hillis, ’87). The argument in favor ofthe Cn approach includes the fact that it accountsfor extensive differences in evolutionary rates andsubstitution patterns among genes in a gene-specific manner (Bull et al., ’93; de Queiroz, ’93;Rodrigo et al., ’93; Huelsenbeck et al., ’94). Whilemethods have now been developed for modelingdifferent substitution parameters onto subsets ofthe concatenated sequence set as part of aphylogenetic analysis (e.g., Yang, ’96), mostinvestigators continue to simply concatenate se-quences and apply a single substitution model tothe entire alignment (e.g., Rokas et al., 2003;Hedges et al., 2004; Wolf et al., 2004).Interestingly, there have even been suggestions
that neither the Ct nor the Cn approach should beused in case individual gene phylogenies are notidentical (e.g., Bull et al., ’93; de Queiroz et al., ’95).To resolve some of these issues, we conducted a
computer simulation study to examine the relativemerits of the Ct and Cn approaches, usingbiologically realistic evolutionary parameters ob-tained from a set of 448 mammalian genes forwhich extensive data exists in the public databases(see Rosenberg and Kumar, 2003). In this study,we have particularly focused on the comparisonbetween the Ct and Cn approaches for the casewhere individual gene trees resolve the phylogenypoorly. We examined the relative merits of the two
approaches principally using the neighbor-joining(NJ) method of phylogenetic inference (Saitou andNei, ’87).
MATERIALS AND METHODS
Computer simulations to generate datasets
Figure 1 shows the model tree topology withrelative branch lengths selected for computersimulations. This phylogeny is based on anindependent analysis of 66 mammalian speciesusing a variety of methods for phylogeneticanalysis (Eizirik et al., 2001; Murphy et al., 2001;Rosenberg and Kumar, 2003). This tree topologyand relative branch lengths were used to generatesequence data by computer simulations using 448sets of realistic evolutionary parameters availablefrom Rosenberg and Kumar (2003). In brief,Rosenberg and Kumar (2003) obtained all avail-able mammalian DNA sequences for 448 nucleargenes from the HOVERGEN database (Duretet al., ’94). The average base frequencies and theaverage number of codons were estimated for eachgene and the third codon positions in thesesequences were used to estimate the mean evolu-tionary rate (r) and the transition–transversionrate ratio (k) for a given gene; see Rosenberg andKumar (2003) for details and distribution ofevolutionary parameters. For each set of evolu-tionary parameters (448 different sets), the branchlengths of the model tree were estimated using thecorresponding evolutionary rate and 100 replicatedatasets were generated under the HKY model ofnucleotide substitution. This yielded a total of44,800 datasets.
Phylogenetic analysis
The neighbor-joining (NJ) method of phyloge-netic inference (Saitou and Nei, ’87) was used withthe Jukes–Cantor (JC) (’69) and Tamura–Nei(TN) (’93) methods of estimating pairwise dis-tances. Phylogenetic analysis was carried outusing PAUP* 4.0b10 (Swofford, 2001). For a givendataset (whether containing an alignment of onegene or the concatenation of multiple genes), asingle model of nucleotide substitution was used inthe phylogenetic analysis and no attempts weremade to model differences in evolutionary para-meters among genes. This was done to ensure thatour procedures were similar to the approachemployed in many empirical studies. Finally, theNJ method was the primary focus of analysisbecause it is known for its speed and efficiency in
ACCURACY OF MULTIGENE PHYLOGENIES 65

inferring small as well as large phylogenies(Kumar and Gadagkar, 2000; Rosenberg andKumar, 2001; Tamura et al., 2004), although somephylogenetic analyses were also conducted usingthe maximum parsimony and maximum likelihoodmethods (see Table 1 for a description) in order toassess the generality of the conclusions reachedfrom the NJ analysis.
Assessing the accuracy of the inferredphylogeny
The accuracy of the phylogenetic trees inferredwas measured by the percentage of clades recon-structed correctly (PC). This was obtained by PC =100 [1 � dT/(2m � 6)], where dT is the topologicaldistance between the inferred and model trees and
Megaptera novaeangliaeTursiops truncatus
Hippopotamus amphibiusTragelaphus eurycerus
Okapia johnstoniSus scrofa
Lama glamaCeratotherium simum
Tapirus indicusEquus caballus
Felis catusLeopardus pardalis
Panthera oncaCanis familiaris
Ursus arctosManis pentadactyla
Artibeus jamaicensisNycteris thebaica
Pteropus giganteusRousettus lanosus
Erinaceus concolorSorex araneous
Asioscalops altaicaCondylura cristata
Cavia tschudiiHydrochoeris hydrochaeris
Agouti taczanowskiiErethizon dorsatum
Myocastor coypusDinomys branickii
Hystrix brachyuraHeterocephalus glaber
Mus musculusRattus norvegicus
Cricetus griseusPedetes capensis
Castor canadensisDipodomys heermanni
Tamias striatusMuscardinus avellanarius
Sylvilagus floridanusOchotona hyperborea
Hylobates concolorHomo sapiensMacaca mulatta
Ateles fuscicepsCallimico goeldii
Cynocephalus variegatusLemur catta
Tarsius sp.Tupaia minor
Choloepus hoffmanniCholoepus didactylus
Tamandua tetradactylaMyrmechophaga tridactyla
Euphractus sexcinctusChaetophractus villosus
Trichechus manatusLoxodonta africana
Procavia capensisEchinops telfairi
Orycteropus aferMacroscelides proboscideusElephantulus rufescens
Didelphis virginianusMacropus eugenii
5
9
10 14
15
19
24
25
26
27
33
3536
39
42
43
50
56
57
5861
12
34
6
78
111213
1617
18
2021
22
23
28
2930
3132
34
37
40
41
44
38
4546
47
48
49
51
5253
54
55
5960
62
63
63
Fig. 1. The 66-taxa model tree used in computer simulations (Eizirik et al., 2001; Murphy et al., 2001; Rosenberg andKumar, 2003). All branches are drawn to relative scale, and each clade is identified by a number.
S.R. GADAGKAR ET AL.66

m is the number of sequences in the phylogeny(Robinson and Foulds, ’81; Penny and Hendy,’85). All comparisons were made betweenthe inferred trees and the model tree given inFigure 1.
Construction of multigene datasets
For comparing the performance of the Ct andCn approaches, 100 simulated datasets for each of448 sets of evolutionary parameters (genes) wereavailable (see above). In the construction ofmultigene datasets, we needed to select onedataset from the 100 simulation replicate datasetsfor each gene (parameter set). This selection wasdone in two ways. In one (the random-casescenario, RS), all analyses were conducted usingrandomly chosen replicates to represent individualgenes. In the other, we specifically selected thesimulation replicate for a given gene that pro-duced a phylogeny with the lowest PC, i.e., withthe highest number of incorrect clades whencompared to the model tree. This is referred toas the worst-case scenario (WS). Throughout thispaper the RS and WS simulation replicates willalso be referred to as RS and WS genes.The Ct approach consisted of a simple head-to-
tail concatenation of the gene sequences, whichwas followed by phylogenetic analysis. In the Cnapproach, individual gene trees were first inferredand then the majority-rule consensus tree wasgenerated to represent the multigene phylogeny.We used the ‘‘LE-50’’ option in PAUP* to fullyresolve all multifurcations in this consensus tree.
We preferred using the majority rule consensusapproach for combining unrooted gene treesbecause other applicable approaches (e.g., strictconsensus) would yield many polytomies, whichwould make it difficult to compare consensus andconcatenation approaches.
RESULTS
Concatenating two-gene datasets
First, we investigated if adding a single gene toan existing one improves the accuracy of phyloge-netic reconstruction. Results in Table 1 (in the‘‘Overall’’ columns) show that concatenated align-ments containing two genes, in general, producedmore accurate phylogenies than those inferredfrom the single, initial gene (Z96% for WS genesand Z74% for RS genes). The percentage ofcorrectly inferred clades per tree improved afterconcatenation by 17–31% for WS genes and 7–11%for RS genes. Greater improvement in accuracy isseen for NJ–TN as compared to NJ–JC. This couldbe attributed to at least two facts. First, the initialNJ–TN trees are known to contain more errorsthan NJ–JC [see Rosenberg and Kumar (2001)and Nei and Kumar (2000)]. This means thatthere is more room for improvement in the NJ–TNcase (see also the difference in the amount ofimprovement in WS and RS replicates for thesame tree making method). Second, the concate-nation procedure leads to longer sequences andthus reduced variance in the distance estimates.Because the reduction in variance occurs for bothTN and JC distances, the absolute amount of
TABLE1. Change in phylogenetic accuracy when a gene sequence is concatenated to an existing gene1
Worst-case scenario Random-case scenario
Method Overall Poorer gene is added Overall Poorer gene is added
NJ^JC 96 (19) 91 (9) 89 (9) 82 (5)NJ^TN 98 (26) 95 (12) 84 (9) 75 (4)MP2 98 (31) 97 (21) 74 (7) 61 (3)ML3 97 (17)4 93 (9)4 86 (11)5 74 (3)5
Note: All comparisons are made with the randomly chosen intial gene. ‘‘Poorer gene is added’’ indicates the performance when the tree from theadded gene contained more errors than the tree from the intial gene.1The numbers in the columns refer to the percentage of multigene sets (from 10,000 trials) that showed improved accuracy after concatenation, withthe average amount of improvement (change in PC) over all trials shown in parentheses in each case. PC=100 [1^dT/(2m�6)], where dT is the topolo-gical distance between the inferred and model trees andm is the number of sequences in the phylogeny (see text).2MP analyses were done using heuristic searches with nearest neighbor interchange (NNI) branch swapping, with the initial tree obtained by astepwise addition procedure. All sites were uniformly weighted.3For the ML method, a heuristic search with NNI branch swapping was conducted (NJ tree as the initial tree) and the HKYmodel of nucleotidesubstitutuion was used. (In the case of MP and ML analyses, a 50 percent majority-rule consensus tree was obtained when there were multipleequally parsimonious or equally likely trees for a given analysis).4Based on 658 trials.5Based on 207 trials.
ACCURACY OF MULTIGENE PHYLOGENIES 67

reduction in variance of TN distances is muchlarger than that for JC distances, as the multi-parameter-based multiple-hit correction in TNdistance leads to a manifold higher variance.We also examined whether phylogenetic accu-
racy decreases if a worse performing gene is addedto the initial gene. In Table 1 the column ‘‘Poorergene is added’’ provides the percentage of con-catenated datasets in which the Ct tree was moreaccurate, even in cases where the tree from theadded gene had more errors than the tree from theinitial gene. When the WS genes were used, a vastmajority of cases (Z91%) showed improvement inphylogenetic accuracy, with a minimum improve-ment of 9%. The improvement is slightly lower forthe RS genes, partly because there was much lessroom for improvement as random, rather thanworst-performing, replicates were used.We investigated the effect of the relative
accuracy of the added gene on the improvement(or decline) in the correctness of the inferred Ct-phylogeny, as compared to the accuracy of theinitial gene tree. Figure 2 shows the relationshipbetween the difference in accuracy of the initial
and the added gene trees (DPC = PC,added �PC,initial) with the extent of improvement in theCt tree (DPC,Ct = PC,Ct � PC,initial). Each point inFig. 2 is an average of 100 gene pairs, and theseaverages are arranged in the order of increasingpercent difference in DPC (difference in accuracybetween the added and initial gene trees). Nega-tive values indicate cases in which the NJ–TN treefor the added gene had more errors than thoseobserved in the initial gene tree. It is clear fromFig. 2 that even if the correct branches in the treefrom the added gene are only 50% of that found inthe initial gene tree, the concatenation of thesegenes still (on average) leads to improvement inphylogenetic accuracy. As expected, the improve-ment in the Ct tree increases as the accuracy of theadded gene tree increases. This is true in both WSand RS cases, although, as seen earlier (Table 1)the extent of improvement is higher in the case ofthe WS genes.
These results clearly show that concatenating asecond gene improves the accuracy of phylogeneticinference substantially over that from the initialgene. This is in spite of the fact that we simplyconcatenated the sequences without making anattempt to accommodate gene-specific differencesin substitution pattern during phylogenetic in-ference. Our investigations into the effect of theobserved differences in substitution parameters(between the genes that were concatenated) on thechange in the phylogenetic accuracy of the Ct treeover the initial gene tree, did not yield anysignificant patterns, except that, as expected, theaddition of a longer gene (sequence) producedgreater improvement (results not shown). We didnot apply the Cn approach to these two-genedatasets, as each clade will occur with either 100%or 50% frequency in the consensus tree, making itimpossible to generate an unequivocal Cn phylo-geny in most cases.
Progressive addition of genes
Next, we investigated the effect of a progressiveaddition of genes on phylogenetic accuracy whenusing Ct and Cn approaches. For this purpose, westarted with six randomly chosen genes and addedother randomly chosen genes one-by-one until theconcatenated dataset contained 20 genes. Thisprocedure was repeated five times and the averagePC computed for both WS and RS datasets.Figure 3 shows the results for NJ–TN trees. It isclear that an increase in the number of genesimproves the accuracy of phylogenetic inference
0
25
50
75
100
-50 -25 0 25 50 75 100
Relative accuracy of added gene (∆P )C
Imp
ree
∆Pro
vem
ent i
nC
t t(
)C
,Ct
Fig. 2. Effect of the accuracy of the tree from the addedgene on the performance of the Ct tree (relative to theaccuracy of the tree from the initial gene in both cases). Thepercent difference in PC (=100 [1 � dT/(2m � 6)], where dT isthe topological distance between the inferred and model treesand m is the number of sequences in the phylogeny; see text)between the tree from the added gene and the tree from theinitial gene (DPC) is plotted on the X axis, and the percentdifference in PC between the Ct tree and the tree from theinitial gene (DPC,Ct) is plotted on the Y axis. Negative valuesfor DPC indicate cases in which the tree from the added genehad more errors than that from the initial gene. A total of10,000 trials were carried out, and each plotted pointrepresents an average from 100 trials. All phylogeneticanalyses were done using NJ–TN. The filled and open circlesrefer to results from WS (simulation replicates with thelargest phylogenetic error) and RS (randomly chosen simula-tion replicates), respectively.
S.R. GADAGKAR ET AL.68

regardless of the approach used (Cn or Ct) or thetype of dataset available (WS or RS). Figure 3 alsoshows that, in general, the Ct approach consis-tently produced more accurate trees than the Cnapproach, within each scenario (WS or RS). Theextent of improvement with gene addition isdifferent for the Cn and Ct approaches as itdepends upon whether RS or WS genes are used.In the Cn–WS case (open circles), B80% partitionswere inferred correctly with six genes in thedataset. This increased rapidly and reached aplateau at B86% but needed more than 20 genes(between 20 and 448 genes) to reach an accuracyof around 94%. In Ct–WS case (open triangles), thelevel of accuracy was more than 90% with sixgenes and it leveled off at B97% when only 10–20genes were used. Interestingly, this level ofaccuracy remained unchanged even when all 448genes were concatenated. The Ct approach wasalso better for the analysis of RS datasets, where itreached 100% accuracy with o15 genes, whereasthe Cn approach required 420 genes (Fig. 3).
In the WS case, neither approach (Ct or Cn)produced the correct tree even when all 448 geneswere used. The tree inferred using the Ctapproach was missing two correct clades, whereasthe Cn approach produced a tree in which fourcorrect clades were missing. Two errors (in nodes#33 and #61, both of which are shallow nodeswith two taxa each) were common to bothapproaches, whereas the Cn approach producedtwo additional errors concerning deeper nodeswith multiple taxa (#50 and #56). Figure 4 showsthe percentage of gene trees in which each of theclades in the true tree was recovered in the WS(above branches) and RS (below branches) data-sets, when the Cn approach was used. Thesenumbers indicate the number of gene trees inwhich the given correct phylogenetic partition wasobserved. In a consensus gene tree, this may bereferred to as the gene-support-frequency (GSF).In Cn–WS analysis, GSF is 26%, 11%, 27%, and21%, for clades #33, #50, #56, and #61, respec-tively. These four clades also show relatively lowGSF in Cn–RS analysis: 50%, 72%, 47%, and 44%,respectively.
DISCUSSION
Our results indicate that the use of multiplegenes produces more accurate phylogenieswhether we use consensus or concatenationapproaches when using the NJ method. We findthat the concatenation approach produces a great-er increase in accuracy as compared to theconsensus approach. Table 1 also contains resultsfrom limited Maximum Parsimony (MP) andMaximum Likelihood (ML) analysis, where thetrees resulting from concatenation of two genesare compared to the tree from the single initialgene. They are consistent with those obtainedusing the NJ method. For instance, adding a geneto a one-gene initial dataset increases the accuracyby B10% for MP and ML analyses of the WSgenes. (Of course, there are differences in phylo-genetic accuracy of NJ–JC, NJ–TN, MP, and MLmethods; see Rosenberg and Kumar (2001) andNei and Kumar (2000) for discussion.)
Part of the increase in accuracy afforded byconcatenating multiple genes is contributed by thefact that many branches in individual gene treesmay have experienced no substitutions (or only afew), due to reasons such as low evolutionary ratefor the gene, short elapsed time after divergence,and small gene sequences, resulting in multi-furcating internal branches. These gene-specific
705 10 15 20 448
75
80
85
90
95
100
Number of genes/gene trees
Perc
ent b
ranc
hes
infe
rred
cor
rect
ly (
PC)
Ct tree, RS
Ct tree, WS
Cn tree, RS
Cn tree, WS
Fig. 3. Effect of a progressive addition of genes on theaccuracy of the inferred species tree. A randomly chosensimulation replicate was progressively added to an initial setof six randomly chosen genes until the dataset contained atotal of 20 genes. With each addition, the analysis was doneusing the concatenation (Ct) and consensus (Cn) approaches.For the trees inferred using the Ct approach, the PC values (PC
= 100 [1 � dT/(2m � 6)], where dT is the topological distancebetween the inferred and model trees and m is the number ofsequences in the phylogeny; see text) show the percentbranches inferred correctly in the NJ–TN tree (neighbor-joining tree with Tamura–Nei distances). For the Cnapproach, the PC value was computed from the majority-ruleconsensus tree that was constructed such that partitions withfrequency o50% were also retained to obtain a fully resolvedtree if they were not in conflict with the rest of the tree(‘‘LE50’’ option in PAUP*). Each PC value plotted is theaverage from five rounds of progressive gene addition. Resultsare shown for the worst-case (WS) genes and random-case(RS) genes.
ACCURACY OF MULTIGENE PHYLOGENIES 69

Megaptera
Tursiops
Hippopotamus
Tragelaphus
Okapia
Sus
Lama
Ceratotherium
Tapirus
Equus
Felis
Leopardus
Panthera
Canis
Ursus
Manis
Artibeus
Nycteris
Pteropus
Rousettus
Erinaceus
Sorex
Asioscalops
Condylura
Cavia
Hydrochoeris
Agouti
Erethizon
Myocastor
Dinomys
Hystrix
Heterocephalus
Mus
Rattus
Cricetus
Pedetes
Castor
Dipodomys
Tamias
Muscardinus
Sylvilagus
Ochotona
Hylobates
Homo
Macaca
Ateles
Callimico
Cynocephalus
Lemur
Tarsius
Tupaia
Choloepus hoffmanni
Choloepus didactylus
Tamandua
Myrmechophaga
Euphractus
Chaetophractus
Trichechus
Loxodonta
Procavia
Echinops
Orycteropus
Macroscelides
Elephantulus
Didelphis
Macropus
9981
10090
3996
7598
32
1796
10069
38
23
7792
100
25
64 53
100
50
24
56
49
21
98
8387
8498
26
81
5337
9998
27
59
98
23
25
43
9998
97
100
72
11
98
82100
99
100
27
87
4490
66
21
100
100
10093
10094
5798
10084
51
4799
10082
60
45
9097
100
51
83 74
100
72
54
84
72
49
99
9094
90100
50
90
7560
100100
56
83
99
39
45
62
10099
99
100
87
47
98
90100
99
100
60
83
6394
80
44
99
100
Fig. 4. Majority rule consensus tree from 448 gene trees, each obtained using the neighbor-joining method with Tamura–Neidistances (NJ–TN). Percent frequency with which individual clades were inferred for worst-case (above branch) and random-case (below branch) scenarios are shown. For incorrectly inferred partitions, percent frequencies are shown in bold. Themajority-rule consensus tree was constructed using PAUP* using the LE50 option, which also retains all compatible partitionswith frequency o50%, if they are not in conflict with the rest of the tree.
S.R. GADAGKAR ET AL.70

polytomies are not resolvable (see Kumar andGadagkar, 2000) using a single gene, even if thespecies tree is truly bifurcating. Adding genes to adataset by concatenation increases the absolutenumber of evolutionary changes on such branchesand makes it possible to infer them with greateraccuracy. Furthermore, an overall increase insequence length would lead to smaller variancesfor evolutionary distances and other parameters inmodel based methods (e.g., NJ and ML). There isevidence in the literature that this may be the casewhen multiple gene sequence alignments producetrees with higher bootstrap support (e.g., Barrettet al., ’91; Doyle et al., ’94; Olmstead and Sweere,’94; Baldauf, ’99).The multigene concatenated datasets performed
better despite the fact that we did not make aneffort to account for large variations in evolu-tionary rate, sequence length, transition–trans-version rate ratio, and base composition (G+Ccontent) among the sequences concatenated. Thisindicates that the increase in phylogenetic signaldue to the concatenation is much higher than anybias introduced by using a single substitutionpattern applied to the entire concatenated se-quence. It is possible that the use of gene-specificsubstitution parameters (Yang, ’96) may improvethe accuracy of concatenated sequence analysis,but the Ct approach produces more accuratephylogenies than the Cn approach even when theyare not used (Fig. 3). This observation amelioratessome concerns such as the following: becausedifferent genes are likely to give independentestimates of the phylogeny, it is unlikely that thesame (wrong) phylogeny will be supported by allthe genes when analyzed individually, whereas ifthey are concatenated, some genes may dominateand sweep the signal (e.g., Doyle, ’92; de Queiroz,’93; Miyamoto and Fitch, ’95). Sometimes thecongruence of datasets in terms of the phyloge-netic trees produced is advocated prior to datacombination (e.g., Bull et al., ’93; Rodrigo et al.,’93; de Queiroz et al., ’95). In our studies, we didnot test for congruence among the genes that werecombined but still saw significant improvements,especially with WS genes that individually pro-duced vastly different trees. Therefore, it may bebetter not to discard genes producing incongruentphylogenies, as they may provide additionalinformation for resolving some short branches(also see Shevchuk and Allard, 2001; Rokas et al.,2003). On the other hand, if individual gene treescontain systematic errors that may result insimilar (but wrong) phylogenies, then the use of
congruent phylogenies may actually result in amore severe reinforcement of this error.
Recently, Rokas et al. (2003) conducted anempirical study with seven species of Saccharo-myces and an outgroup, and showed that con-catenated datasets with subsets of 106 genesproduced the same tree as the concatenated setof all 106 genes [but see Phillips et al. (2004) for adifferent treatment of the same dataset]. Rokaset al. (2003) suggested that a set of onlyB20 genesis needed to be sampled to obtain a speciesphylogeny that would be similar to that obtainedwith a much larger number of genes. Their resultsare consistent with ours (see Fig. 3), except for onedifference. Rokas et al. (2003) assumed that theconcatenation of all genes yielded the true phylo-geny because different phylogenetic methodsproduced the same tree, whereas our Ct analysisof 448 WS genes resulted in an identical, butincorrect, tree when different methods were used.Hence, this assumption may not always hold. Ourresults show that although the Ct approach isbetter than the Cn approach, it is not perfect,especially with WS datasets. We found that the Ctanalysis of WS datasets yielded a phylogenetic treewith two true clades missing (#33, #61; Fig. 1) inour simulation investigations. Instead, two other(incorrect) clades appeared: Myocastor coypus(nutria) and Echinops telfairi (the lesser hedgehogtenrec) became basal to Dinomys branickii (pacar-ena) and Orycteropus afer (aardvark), respectively,rather than sister taxa (see clade #33 and #61 inFig. 1). The difficulty observed with correctinference of clades #33 and #61 in WS simula-tions also cannot be attributed to shortness oftheir branch length because there are 10 otherinternal branches with the same length. Also,clades #33 and #61 do not stand out as the onlyshallow clades of two taxa each, as other clades ofsimilar depth (#13 and #14) were inferredcorrectly. This led us to explore the relationshipbetween the accuracy of reconstruction of aninternal branch in the tree and the lengths ofthe neighboring branches relative to that of theinternal branch (see schematic in Fig. 5A). Figure5B shows the proportion of gene trees in whichbranches of various lengths (x) were inferredcorrectly in the worst-case replicates. As expected,the frequency of correct reconstruction is higherfor longer internal branches. The problembranches (#33 and #61) belong to a set of 12shortest internal branches in the tree, all of whichhave an identical length of 3.71 substitutions pergene (see Fig. 1). For these 12 branches, the
ACCURACY OF MULTIGENE PHYLOGENIES 71
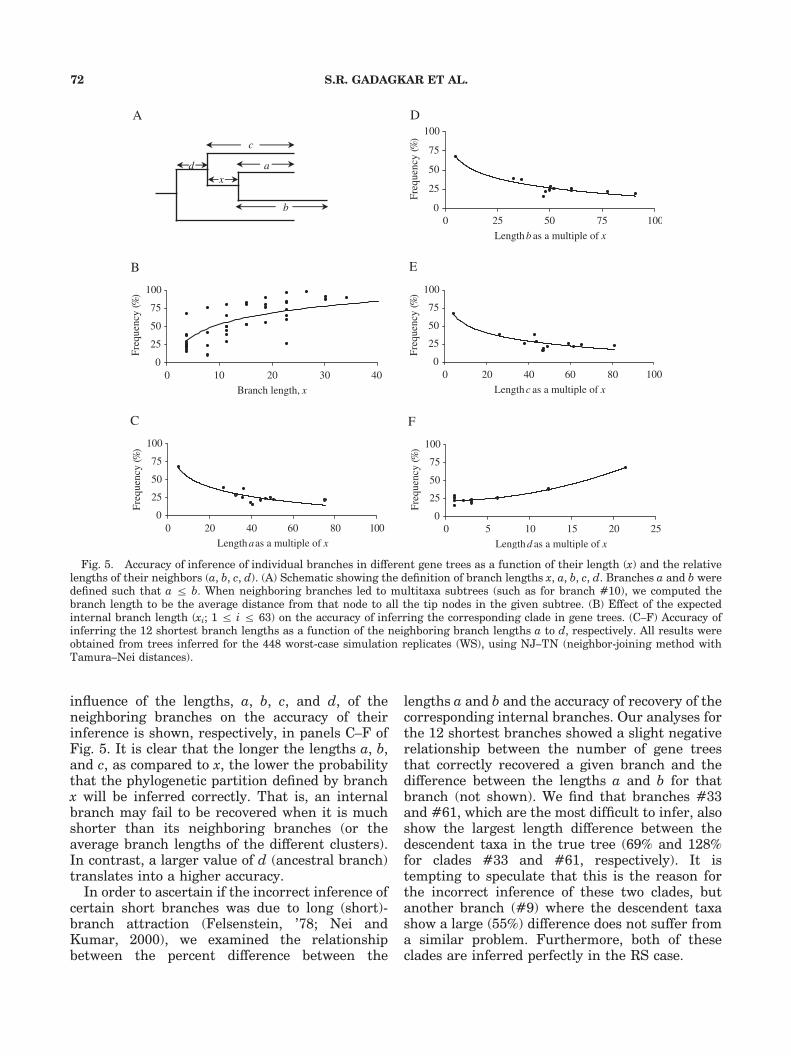
influence of the lengths, a, b, c, and d, of theneighboring branches on the accuracy of theirinference is shown, respectively, in panels C–F ofFig. 5. It is clear that the longer the lengths a, b,and c, as compared to x, the lower the probabilitythat the phylogenetic partition defined by branchx will be inferred correctly. That is, an internalbranch may fail to be recovered when it is muchshorter than its neighboring branches (or theaverage branch lengths of the different clusters).In contrast, a larger value of d (ancestral branch)translates into a higher accuracy.In order to ascertain if the incorrect inference of
certain short branches was due to long (short)-branch attraction (Felsenstein, ’78; Nei andKumar, 2000), we examined the relationshipbetween the percent difference between the
lengths a and b and the accuracy of recovery of thecorresponding internal branches. Our analyses forthe 12 shortest branches showed a slight negativerelationship between the number of gene treesthat correctly recovered a given branch and thedifference between the lengths a and b for thatbranch (not shown). We find that branches #33and #61, which are the most difficult to infer, alsoshow the largest length difference between thedescendent taxa in the true tree (69% and 128%for clades #33 and #61, respectively). It istempting to speculate that this is the reason forthe incorrect inference of these two clades, butanother branch (#9) where the descendent taxashow a large (55%) difference does not suffer froma similar problem. Furthermore, both of theseclades are inferred perfectly in the RS case.
0
25
50
75
100
0 100
Length aas a multiple of x
C
0
25
50
75
100
0
Branch length, x
B
0
25
50
75
100
100
Length b as a multiple of x
Fre
quen
cy (%
)
D
0
25
50
75
100
0 100
Length c as a multiple of x
Fre
quen
cy (%
)
E
0
25
50
75
100
0 5 10 15 20 25
Length d as a multiple of x
Fre
quen
cy (%
)
Fre
quen
cy (%
)F
requ
ency
(%)
F
a
b
c
dx
A
250 50 75
10 20 30 40 20 40 60 80
20 40 60 80
Fig. 5. Accuracy of inference of individual branches in different gene trees as a function of their length (x) and the relativelengths of their neighbors (a, b, c, d). (A) Schematic showing the definition of branch lengths x, a, b, c, d. Branches a and b weredefined such that a r b. When neighboring branches led to multitaxa subtrees (such as for branch #10), we computed thebranch length to be the average distance from that node to all the tip nodes in the given subtree. (B) Effect of the expectedinternal branch length (xi; 1 r i r 63) on the accuracy of inferring the corresponding clade in gene trees. (C–F) Accuracy ofinferring the 12 shortest branch lengths as a function of the neighboring branch lengths a to d, respectively. All results wereobtained from trees inferred for the 448 worst-case simulation replicates (WS), using NJ–TN (neighbor-joining method withTamura–Nei distances).
S.R. GADAGKAR ET AL.72
Our study shows additional evidence that theconcatenation approach is not necessarily a pana-cea for the accurate recovery of the species tree.This was revealed when we conducted a bootstraptest by resampling sites in order to determine ifthe two incorrectly inferred nodes (#33 and #61)in the Ct tree of all the 448 WS genes representedsignificant systematic errors (Felsenstein, ’85). Ifthe incorrect inferences made (instead of clades#33 and #62) were by chance alone, then theirfrequency in the bootstrap consensus tree isexpected to be low. (We refer to the frequency ofoccurrence of a clade in the bootstrap replicatetree as the bootstrap support frequency [BSF].)Our results showed that the two correct clades(#33 and #61) did not appear in any of thebootstrap replicate tree, that is, BSF = 0% forboth clades. Instead, we found that the twoincorrect clades (that appeared instead) weresupported with increasingly higher BSF as thenumber of genes concatenated increased, ulti-mately reaching 100% for the case of 448 WSgenes. In fact, BSF for all branches in the Ct–WStree was 100%!Recently, Nei et al. (2001) suggested that the
genes, rather than sites [as used in the originalproposal by Felsenstein (’85)], be used as the unitof resampling in the bootstrap estimation. In ourstudy, we resampled 448 WS genes with replace-ment and generated Ct trees for 100 bootstrapreplicates. Still, all branches (including the twoincorrect ones) were supported with a BSF =100%. A more comprehensive bootstrap resam-pling regime is to actually resample genes and tothen resample sites within each gene in order toaccount for site as well as gene sampling errors.This combined procedure also produced BSF =100% for concatenation analysis of 448 WS genes.These results are particularly disturbing becausethe incorrect clades inferred (and supported withBSF = 100%) were found in only 34% and 33%individual gene trees, respectively, as compared tothe correct clades (#33 and #61), which appearedin 26% and 21% gene trees. Therefore, it is clearthat weak phylogenetic signal can be substantiallyreinforced when sequences are concatenated. Mostoften, this signal amplification happens for thecorrect partitions (see Fig. 4), but in some cases itcan also boost support for the erroneous infer-ences.In conclusion, a simple concatenation appears to
be better than consensus for phylogenetic recon-struction when multigene data are available,especially when the individual genes yield inaccu-
rate trees. However, neither approach may guar-antee a completely accurate species phylogenyeven when a large number of genes are used,apparently due to the effect of certain systematicbiases. Indeed, there is no magic number of genesthat, when concatenated, will yield the correct treein all instances, because addition of genes does notadd to the accuracy of the tree in the presence ofsystematic biases. In the future, it will beimportant to examine if these biases can beovercome by using gene-specific patterns of sub-stitution in the concatenation approach. However,because these systematic errors can lead to veryhigh bootstrap values, we recommend that thenumber of gene trees supporting a given partition(gene support frequency, GSF) be presented alongwith its bootstrap support frequency (BSF) toguard against conveying spurious high confidencein evolutionary inferences based on the analysis ofmultiple genes.
ACKNOWLEDGMENTS
We thank S. Subramanian and Balaji Ramanu-jam for help with computational analyses. Thisresearch was supported by start-up support fromthe University of Dayton (to S.R.G.) and grantsfrom the National Institutes of Health (to S.K.) andNational Science Foundation (to James P. Collins,ASU, the Principal Investigator for the grant,which provided partial funding for this work).
LITERATURE CITED
Amrine-Madsen H, Koepfli KP, Wayne RK, Springer MS.2003. A new phylogenetic marker, apolipoprotein B, pro-vides compelling evidence for eutherian relationships.Mol Phylogenet Evol 28:225–240.
Baldauf SL. 1999. A search for the origins of animals andfungi: comparing and combining molecular data. Am Nat154:S178–S188.
Barrett M, Donoghue MJ, Sober E. 1991. Against consensus.Syst Zool 40:486–493.
Bull JJ, Huelsenbeck JP, Cunningham CW, Swofford DL,Waddell PJ. 1993. Partitioning and combining data inphylogenetic analysis. Syst Biol 42:384–397.
de Queiroz A. 1993. For consensus (sometimes). Syst Biol42:368–372.
de Queiroz A, Donoghue MJ, Kim J. 1995. Separate versuscombined analysis of phylogenetic evidence. Annu Rev EcolSyst 26:657–681.
Delsuc F, Stanhope MJ, Douzery EJP. 2003. Molecularsystematics of armadillos (Xenarthra, Dasypodidae): con-tribution of maximum likelihood and Bayesian analyses ofmitochondrial and nuclear genes. Mol Phylogenet Evol28:261–275.
Doyle JA. 1992. Gene trees and species trees: molecularsystematics as one-character taxonomy. Syst Botany17:144–163.
ACCURACY OF MULTIGENE PHYLOGENIES 73

Doyle JA, Donoghue MJ, Zimmer EA. 1994. Integration ofmorphological and rRNA data on the origin of angiosperms.Ann Missouri Bot Gard 81:419–450.
Duret L, Mouchiroud D, Gouy M. 1994. HOVERGEN: adatabase of homologous vertebrate genes. Nucleic Acids Res22:2360–2365.
Eizirik E, Murphy WJ, O’Brien SJ. 2001. Molecular datingand biogeography of the early placental mammal radiation.J Hered 92:212–219.
Felsenstein J. 1978. Cases in which parsimony or compat-ibility methods will be positively misleading. Syst Zool27:401–410.
Felsenstein J. 1985. Confidence limits on phylogenies: anapproach using the bootstrap. Evolution 39:783–791.
Hedges SB, Blair JE, Venturi ML, Shoe JL. 2004. A moleculartime scale of eukaryote evolution and the rise of complexmulticellular life. BMC Evol Biol 4:2.
Hillis DM. 1987. Molecular versus morphological approachesto systematics. Annu Rev Ecol Syst 18:23–42.
Hoofer SR, Reeder SA, Hansen EW, Van den Bussche RA.2003. Molecular phylogenetics and taxonomic review ofnoctilionoid and vespertilionoid bats (Chiroptera: Yango-chiroptera). J Mammal 84:809–821.
Huelsenbeck JP, Bull JJ, Cunningham CW. 1996. Combiningdata in phylogenetic analysis. Trends Ecol Evol 11:152–158.
Huelsenbeck JP, Swofford DL, Cunningham CW, Bull JJ,Waddell PJ. 1994. Is character weighting a panacea for theproblem of data heterogeneity in phylogenetic analysis? SystBiol 43:288–291.
Jukes TH, Cantor CR. 1969. Evolution of protein molecules.In: Munro HN, editor. Mammalian protein metabolism.New York: Academic Press. p 21–132.
Kumar S, Gadagkar SR. 2000. Efficiency of the neighbor-joining method in reconstructing deep and shallow evolu-tionary relationships in large phylogenies. J Mol Evol51(6):544–553.
Miyamoto MM, Fitch WM. 1995. Testing species phylogeniesand phylogenetic methods with congruence. Syst Biol 44:64–76.
Murphy WJ, Eizirik E, Johnson WE, Zhang YP, Ryderk OA,O’Brien SJ. 2001. Molecular phylogenetics and the origins ofplacental mammals. Nature 409:614–618.
Nei M, Kumar S. 2000. Molecular evolution and phylogenetics.New York: Oxford University Press.
Nei M, Xu P, Glazko G. 2001. Estimation of divergence timesfrom multiprotein sequences for a few mammalian speciesand several distantly related organisms. Proc Natl Acad SciU S A 98:2497–2502.
Olmstead RG, Sweere JA. 1994. Combining data in phyloge-netic systematicsFan empirical approach using 3 moleculardata sets in the Solanaceae. Syst Biol 43:467–481.
Penny D, Hendy MD. 1985. The use of tree comparisonmetrics. Syst Zool 34:75–82.
Phillips MJ, Delsuc F, Penny D. 2004. Genome-scale phylo-geny and the detection of systematic biases. Mol Biol Evol21:1455–1458.
Robinson DF, Foulds LR. 1981. Comparison of phylogenetictrees. Math Biosci 53(1–2):131–147.
Rodrigo AG, Kellyborges M, Bergquist PR, Bergquist PL.1993. A randomization test of the null hypothesis that twocladograms are sample estimates of a parametric phyloge-netic tree. New Zealand J Bot 31:257–268.
Rokas A, Williams BL, King N, Carroll SB. 2003. Genome-scale approaches to resolving incongruence in molecularphylogenies. Nature 425:798–804.
Rosenberg MS, Kumar S. 2001. Traditional phylogeneticreconstruction methods reconstruct shallow and deepevolutionary relationships equally well. Mol Biol Evol18:1823–1827.
Rosenberg MS, Kumar S. 2003. Heterogeneity of nucleotidefrequencies among evolutionary lineages and phylogeneticinference. Mol Biol Evol 20:610–621.
Saitou N, Nei M. 1987. The neighbor-joining method: a newmethod for reconstructing phylogenetic trees. Mol Biol Evol4:406–425.
Shevchuk NA, Allard MW. 2001. Sources of incongruenceamong mammalian mitochondrial sequences: COII, COIII,and ND6 genes are main contributors. Mol Phylogenet Evol21:43–54.
Suchard MA, Kitchen CMR, Sinsheimer JS, Weiss RE. 2003.Hierarchical phylogenetic models for analyzing multipartitesequence data. Syst Biol 52:649–664.
Swofford DL. 2001. PAUP*. Phylogenetic analysis usingparsimony (*and other methods). Version 4.0b10. Sunder-land, MA: Sinauer Associates.
Tamura K, Nei M. 1993. Estimation of the number ofnucleotide substitutions in the control region of mitochon-drial DNA in humans and chimpanzees. Mol Biol Evol10:512–526.
Tamura K, Nei M, Kumar S. 2004. Prospects for inferring verylarge phylogenies by using the neighbor-joining method.Proc Natl Acad Sci U S A 101(30):11030–11035.
Teeling EC, Madsen O, Murphy WJ, Springer MS, O’Brien J.2003. Nuclear gene sequences confirm an ancient linkbetween New Zealand’s short-tailed bat and South Amer-ican noctilionoid bats. Mol Phylogenet Evol 28:308–319.
Wolf YI, Rogozin IB, Koonin EV. 2004. Coelomata and notecdysozoa: evidence from genome-wide phylogenetic analy-sis. Genome Res 14:29–36.
Yang ZH. 1996. Maximum-likelihood models for combinedanalyses of multiple sequence data. J Mol Evol 42:587–596.
S.R. GADAGKAR ET AL.74
Copyright © 2022 FDOKUMEN