
Inferring Social Preferences over Income Distributions through Axioms
45
Discussion Papers in Economics Department of Economics and Related Studies University of York Heslington York, YO10 5DD No. 2009/18 Inferring Social Preferences over Income Distributions through Axioms By John Hey, University of York and LUISS, Rome, Italy and Carmen Pasca, LUISS, Rome, Italy
Transcript of Inferring Social Preferences over Income Distributions through Axioms

Discussion Papers in Economics
No. 2000/62
Dynamics of Output Growth, Consumption and Physical Capital in Two-Sector Models of Endogenous Growth
Department of Economics and Related Studies
University of York Heslington
York, YO10 5DD
No. 2009/18
Inferring Social Preferences over Income Distributions through Axioms
By
John Hey, University of York and LUISS, Rome, Italy
and
Carmen Pasca, LUISS, Rome, Italy

1
Inferring Social Preferences over Income Distributions through Axioms
John D Hey* and Carmen Pasca**
*University of York, UK and LUISS, Rome, Italy **LUISS, Rome, Italy
Abstract
Numerous prior experimental studies have attempted to elicit people’s preferences over income
distributions through appropriately incentivated questions asking subjects to choose between distributions.
Instead, we follow the theoretical literature and start with the principles underlying these preferences.
Such principles include, for example, the Rawlsian principle and the Lorenz principle. We implement
possibly the first incentivated experiment concentrating solely and directly on these underlying principles.
In essence, the experiment asks subjects to state their preferred principles, with the appropriate incentive
being provided by the experimenter using the stated axioms to choose a preferred distribution from a
randomly generated set, and this preferred distribution then being implemented on the participants in the
experiment. Thus one of the subjects becomes the Social Planner. (We have two treatments, one in which
the Social Planner is part of society and the second in which the Social Planner is outside society.) We solve
problems implied when the chosen set of principle is either mutually contradictory or incomplete (by
allowing sequential choice). We observe that the implied social preferences are different from those
inferred indirectly through choice over distributions as in the earlier experimental studies, and that elicited
preferences are different between the two treatments, suggesting that the disinterested Social Planner is
more Equality-preferring than the Social Planner with self-interest.
Keywords: principles, social preferences, axioms, experimental methods, social planner, direct versus
indirect inferences.
JEL Codes: I3, D6.
2
Inferring Social Preferences over Income Distributions through Axioms
John D Hey and Carmen Pasca
1. Introduction
Most economic theories of preferences are constructed on the basis of axioms. For example, Expected
Utility theory is built on the axioms of completeness, transitivity, independence and continuity. In testing
experimentally such theories, and hence in testing the axioms on which they are based, economists
typically adopt an indirect approach. For example, in the field of decision making under risk, subjects are
typically asked to choose between pairs of risky prospects.
The economist then checks their responses for consistency with the theory under test, and hence indirectly
for consistency with the axioms underlying the theory. This method has also been frequently used to elicit
preferences of various types. It can be considered an indirect way of inferring preferences, and hence their
consistency with axioms.
In particular, this methodology has been used to indirectly elicit social preferences over income
distributions. Good examples include the experiments reported in Amiel and Cowell (1999), and in the
references in that volume. Amiel and Cowell also report results based on directly asking subjects about
their preferences. However, these latter questions are typically asked without any appropriate incentives.
In contrast, in this paper we report the results of an experiment in which subjects are given incentives to
give honest responses.
The motivation for such an experiment can be found elsewhere. Returning to the axioms underlying
Expected Utility theory, we note that many people express agreement with the independence axiom when
presented in an abstract way: the apparent logical ‘truth’ of the axiom being appealing to many. However,
3
when asked pairwise choice questions over lotteries designed to test the independence axiom,
inconsistencies with the axiom are observed. The question then arises: do people not understand the
meaning and implications of the axiom, or are experimentalists rather clever at designing questions which
‘trick’ subjects into apparent violation? Perhaps the subjects make mistakes or their responses are special
cases? The former is an appealing story and is consistent with the fact that subjects’ behaviour in
experiments is usually noisy. Alternatively, it may be the case that subjects generally believe in the
independence axiom but they reserve the right to make exceptions. That is, the axiom is generally true but
there are exceptions. Perhaps in the past, experimentalists have concentrated too much on the exceptions
and not on the general truth of the principles?
In this paper, we enquire directly into whether subjects agree with the axioms underlying the theory of
social choice over income distributions. We give them appropriate incentives in a way that we describe
shortly. As we are interested in social preferences, we follow the literature in having two treatments, one
in which the Social Planner (whose preferences will be imposed on the other subjects, the other members
of society) is a member of that society, and a second in which the Social Planner is outside the society.
In the next two sections, we describe the philosophy behind the axioms under test, and their practical
implementation. In the following two sections, we describe the way that the experiment was implemented,
and present our results. We then compare our findings with earlier results from the literature. A final
section concludes.
2. The philosophy behind the axioms in the experiment
Of the many axioms studied in the theory of social preferences over income distributions, we chose the
most fundamental and popular. These are well-known and we refer to them here as Rawls, Dispersion,
Transfer, Group Transfer and Lorenz. We give details in the next section. We also included for each of them

4
their reverse, which we indicate by pre-pending the word Reverse to the name of the axiom. We might
generally refer to the basic five as Equality principles, and their reverse as Inequality principles1.
There is either a potential or a real conflict between the principles in that they might pick out different sub-
sets of preferred distributions from any given set of income distributions. Interestingly, between Rawls and
Reverse Rawls, there may be a conflict but there may not: to take a simple example, if the total amount to
be distributed is 40 and there are four people in society, then out of the set of distributions consisting of
just the following two – (2, 10, 10, 18) and (1, 11, 11, 17) – then both principles would select the first of
these distributions. Whether there is a conflict or not depends upon the set of distributions from which the
selection is to be made and the actual composition of these distributions.
Between the Dispersion principle and its reverse, there is bound to be a conflict as long as there exist two
distributions with different dispersions.
The Transfer principle (nor its converse) does not necessarily produce a uniquely preferred distribution
from any given set of distributions: it may be the case that we can eliminate many distributions because
others can be obtained from these by transfers, but we may end up with a sub-set of distributions, none of
which can be obtained from the others by transfers. The same is true with Group Transfers (and its
reverse). And indeed the same must be true for Lorenz (and its reverse) simply because the Transfer
principle is exactly the same as the Lorenz principle.
We might regard the five basic principles, which we have referred to as Equality principles, as essentially
left-wing and the reverse principle as right-wing. We might therefore think that a person who agrees with
one of the basic principles and also one of the reverse principles as necessarily confused in some sense.
But if, as we do, we allow people to implement principles sequentially, rather than simultaneously, then the
apparent confusion might be abated. We shall have more to say on this in due course.
1 We note that we confine attention to distributions of the same total amount, and thus distributions with the same mean.

5
3. Details on the axioms under test
In our experiment, all income distributions had the same mean (or total) income2. In all sessions of the
experiment there was the same number of ‘members of society’. Because the total income and the number
of people were fixed, we concentrate solely on the distribution of income. Underlying all theories of social
preferences over income distributions is a set of axioms, or principles, which govern the preferences. The
set varies from theory to theory. As we have already noted above, we concentrate on the most popular.
We have a basic set of 5 axioms; we also include the ‘reverse’ of each axiom, in a way that is obvious from
the description below. Our set consists of the following:
1. The Rawlsian Principle
2. The Reverse Rawlsian Principle
3. The Dispersion Principle
4. The Reverse Dispersion Principle
5. The Transfer Principle
6. The Reverse Transfer Principle
7. The Group Transfer Principle
8. The Reverse Group Transfer Principle
9. The Lorenz Principle
10. The Reverse Lorenz Principle
2 The total income was equal to €150 over the 10 ‘members of society’ in each experimental session.

6
In the experiment much thought was given to the precise wording of these principles. The precise wording3
in the experiment is reported below. Subjects were asked to state for each of the principles whether they
agreed with them or not.
1 (2)4: “If the poorest (richest) person in distribution 1 has a higher income than the poorest (richest)
person in distribution 2, then I prefer distribution 1.”
3 (4)5: “I prefer the distribution where the dispersion of income is the smallest (largest).”
5 (6)6: “I think that the distribution improves if we take €1 from some individual and give it to a poorer
(richer) individual.”
7 (8)7: “I think that the distribution improves if we take €1 from a group of individuals and give it to a group
of poorer (richer) individuals.”
9 (10)8: “If the n poorest (richest) people in distribution 1 have a greater proportion of the total income
than the n poorest (richest) people in distribution 2, for all values of n between 1 and 10, then I prefer
distribution 1.
Our interest is firstly whether subjects agree or not with these principles, and secondly whether they
implement their agreed-to principles.
3 The experiment was actually carried out in Italy; the English wording here is the English translation of the Italian text. The full
instructions are appended to this paper. It will be noted that the principles were first enunciated as above, with more detail being
given later. (See subsequent footnotes.)
4 Subjects were told that this principle would be implemented lexicographically, though we did not specifically use this word: we
used simple words to say how it would be implemented.
5 Subjects were told that the standard deviation would be used as the measure of dispersion.
6 Subjects were told that this principle could be implemented several times.
7 Subjects were told that this principle could be implemented several times and they were asked to specify the group size(s).
8 In the detailed statement of the principles, this was spelt out in detail.

7
4. The Experimental Design
As noted above, we had two treatments of the experiment9: Treatment 1, in which there were 10 subjects
in each session, all of which would be members of the society, of which one would be chosen at random at
the end of the session to be the Social Planner; Treatment 2, in which there were 11 subjects in each
session, 10 of which would be the members of society, and the 11th
(chosen at random at the end of the
session) would be the Social Planner but not a member of society. The idea of the two treatments was to
see precisely whether being a member of society influenced the preferences10
. Clearly the preferences of
the Social Planner determine the distribution of income in both cases, but the self-interest of the Social
Planner is greater in Treatment 1. We wanted to see if the preferences in the two treatments were
different. In total we ran five sessions of each treatment, giving us 50 subjects in Treatment 1 and 55
subjects in Treatment 2. To allow for learning, we had 3 repetitions within each session, and chose one of
these at random at the end of the session for the payment of the subjects.
On each repetition within a session, subjects were first asked, for each of the 10 principles, whether they
agreed with the principle or not. In the case of Principles 7 and 8 they were also asked to state the group
sizes to which the Principle should be applied11
. They were then asked in which order they wanted the
agreed-with principles implemented.
To clarify what this latter means, we need to anticipate a little the future discussion. On each repetition,
subjects were told that the computer would generate at random 100 distributions, all with the same (mean
and) total income, the latter equal to €150. Subjects were not told the actual values of these distributions –
only the way that they would be generated. Their agreed-to principles would be used (if possible) to select
9 In keeping with normal practice, we first carried out a pilot experiment. However, in this paper we report solely on the main
experiment.
10 Treatment 1 could be considered as a decision problem under risk.
11 They could choose any of group sizes 2, 3, 4, 5 or 6.

8
a unique distribution from this set. (If their principles did not imply a unique distribution12
, but instead a
subset of the 100 distributions, then one of this subset would be chosen at random to be the unique
distribution.) The unique distribution of the randomly chosen Social Planner on the randomly chosen
repetition would then be implemented on the members of the society (with the positions being chosen at
random at the end of the session) and the subjects paid accordingly. The Social Planner in Treatment 2
would receive a flat payment of €15.
We return now to the issue of the order of implementation of the principles. With 100 distributions it is
clear that different principles could select different distributions from the set – that is, there are potential
conflicts between the principles13
. Moreover, some principles (specifically 1, 2, 3 and 4) imply directly a
unique distribution, whilst the others do not. So the order of implementation is important. We therefore
allowed the subjects to state in which order they wanted to implement their agreed-to principles. So, for
example, if they agreed with Principles 1 and 5, they might want to implement 5 first, thus reducing the set
of 100 distributions to a smaller subset, and then use 1 to select a preferred distribution from this
remaining subset. If subjects stated a subset of axioms which conflicted with each other, they were told to
select a different subset. If the subset was not internally inconsistent but did not imply a unique
distribution, they were then asked to select a further agreed-to principle to implement. This continued until
either a unique distribution was implied or they had no agreed-to principles left to implement (though, as
we have already noted, this latter was never the case).
The full Instructions are appended to this paper. The software, written in Visual Basic 6, is available on
request.
5. The experimental results
12 In fact this never occurred.
13 We note that Principal 9 (10) is actually the same as Principal 5 (6) but stated in a different way.

9
5.1 Principles agreed-to and principles implemented
Tables 1 report agreed-to principles: table 1.1 giving the totals and table 1.2 giving, for each principle, the
percentage relative to the total number of principles agreed-to. Recall that in Treatment 1, there were 50
subjects in total, and, in Treatment 2, 55 subjects. It is clear from Table 1.1 that subjects were generally in
agreement with several principles: indeed, on average in Treatment 1, they were in agreement with 5.33 of
the 10 principles, and with 5.07 of the 10 in Treatment 2.
We note that there is very little evidence of changes between the three repetitions. Overall, there is no
significant difference (chi-square value = 0.98) between the distributions of principles agreed-to between
the two treatments – indicating that subjects were generally able, in Treatment 1, to disassociate
themselves from the fact that they would be a member of society from their social preferences. However,
there is a modest increase from Treatment 1 to Treatment 2 in the percentage of the time that principle 3
(Dispersion) was agreed-to. Moreover, overall, the percentage of Equality-based agreed-to principles rose
from 61.2% to 66.5%. So there is some slight evidence of a treatment effect.
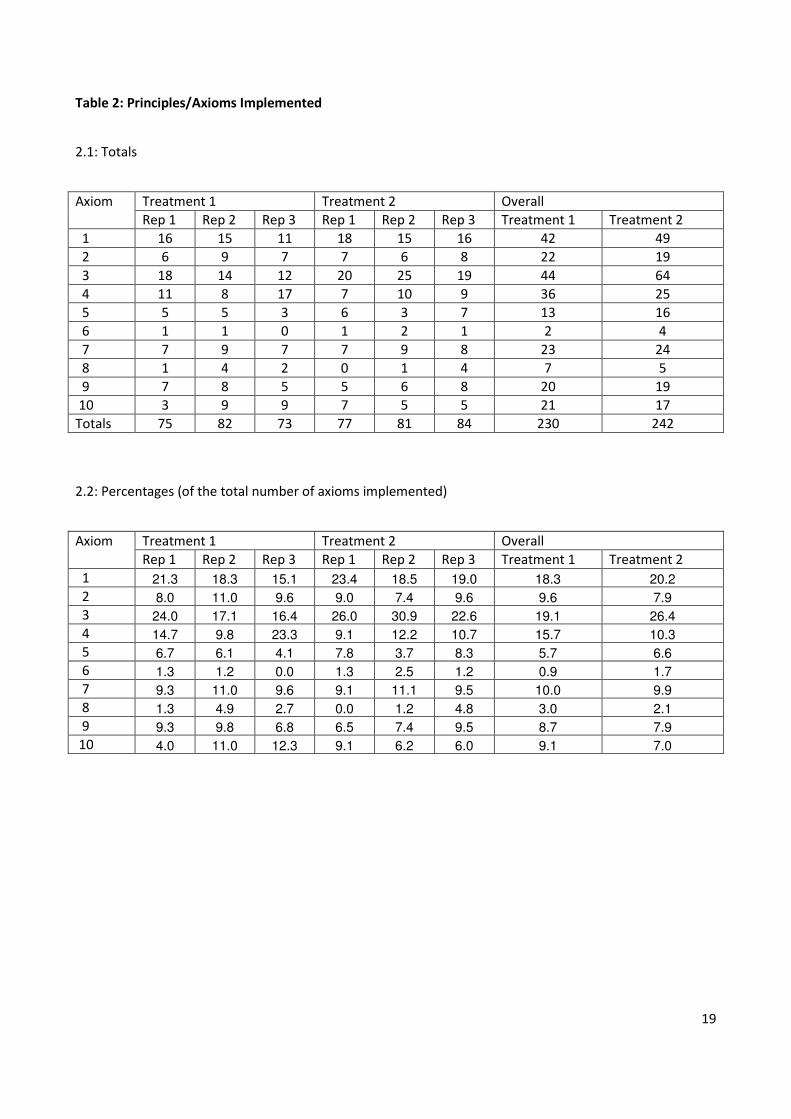
Tables 2 report principles implemented: table 2.1 giving the totals and table 2.2 giving, for each principle,
the percentage relative to the total number of principles implemented. We observe that in general more
than one principle was implemented in every repetition: on average 1.53 in Treatment 1 and 1.47 in
Treatment 2. Here we observe a slight decline in the percentage of times that Rawls was implemented
through the three repetitions, and a switch in Treatment 1 from Dispersion to Reverse Dispersion. In the
aggregate results we see a marked increase, between Treatments 1 and 2, in the implementation of
Dispersion and a corresponding decline in Reverse Dispersion. Indeed there is a shift towards the
implementation of Equality-based principles from Treatment 1 to Treatment 2, rising from 61.8% to 71.0%.
This seems to reflect the disassociation from personal preferences to social preferences as we move from
Treatment 1 to Treatment 2. This provides further evidence of a treatment effect. As we have already
noted there was a similar but slightly smaller increase in the percentage of agreed-to Equality principles
(rising from 61.2% in Treatment 1 to 66.5% in Treatment 2).

10
Table 3 compares the percentages of agreed-to principles with the percentages implemented. It will be
seen that in both treatments the percentages of principles implemented were greater than the percentages
of agreed-to principles for principles 1, 3 and 4; were smaller for principles 2, 5, 6, 7, 9 and 10; and were
approximately the same for principle 8. Recall that principles 1, 3 and 4 are decisive principles in that they
imply a uniquely preferred distribution from any set, while 5 to 10 are not necessarily decisive. This may
explain these differences.
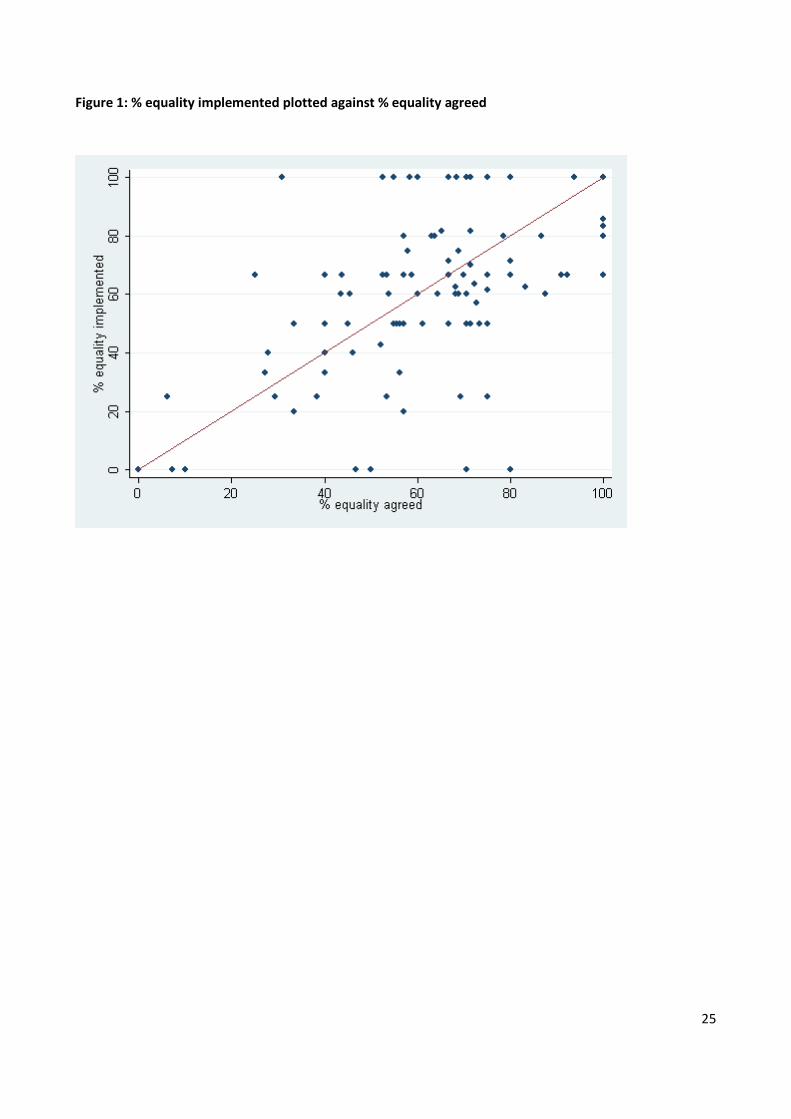
Figure 1 shows the percentage of Equality-based principles implemented as a function of the percentage of
Equality-based principles agreed to (with a forty-five degree line superimposed). It will be seen that, on
average, the former is less than the latter. The regression below confirms this result.
2% Equality-based implemented = 14.0 + 0.735 % Equality-based agreed-to =0.31
(1.9) (6.5)
(t-statistics in parentheses)
R
(1)
Hence it appears that subjects are more Equality-based in their agreed-to principles than in the principles
that they actually implement.
We collected data on age and sex from our subjects. We note that there is not a significant relationship
between the percentage of principles agreed-to that were Equality-based and these two variables.
However, a regression of the percentage of principles implemented that were Equality-based, ppil, gave the
following results:
2138 11.2 sex 3.7 age 0.08
(4.0) (2.0) (2.4)
ppil R= + − = (2)
(with t-statistics in parentheses and where sex=0 for men and sex=1 for women). Thus, women are more
likely to implement Equality-based principles than men, while increasing age leads to a smaller
implementation of Equality-based principles.
11
5.2 Sets of principles agreed-to and sets of an principles implemented
It is clear from the above that subjects generally agreed to and implemented more than 1 principle. We
now give an analysis of the various sets of principles agreed-to and implemented. Table 4 gives information
on the former and Table 5 on the latter.
It will be noted from Table 4 that there was considerable variety in the sets of principles to which the
subjects agreed on one or other of the three repetitions. The most popular sets of principles are: (1 3 5 7 9,
29 times) which is entirely Equality-based; (2 4 6 8 10, 12 times) which is entirely Inequality-based; (1 2 3 9
10, 10 times), (1 2 4 9 10, 10 times), (1 4 5 7 9, 18 times), (1 2 3 5 9 10, 13 times), (1 2 3 7 9 10, 11 times), (1
2 3 5 7 9 10, 33 times), and (1 2 4 5 7 9 10, 20 times) which are all a mixture, though predominately
Equality-based. There is noticeably a tendency to agree to both 9 and 10 at the same time.
Table 5 is easier to digest, and perhaps more informative. This table gives information about the order of
implementation of the principles. For example, on repetition 1 of Treatment 1 principle 1 was first
implemented by 10 subjects out of the 50 and so on. It will be noted that principle 3 was the most
frequently implemented principle overall and on each treatment individually, though principle 1 is a close
second. As far as Treatment 1 is concerned, 65% of the principle sets implemented were equity-based,
while in Treatment 2, the figure was 67%; the difference is small, reinforcing the point made earlier that
there seems little treatment effect.
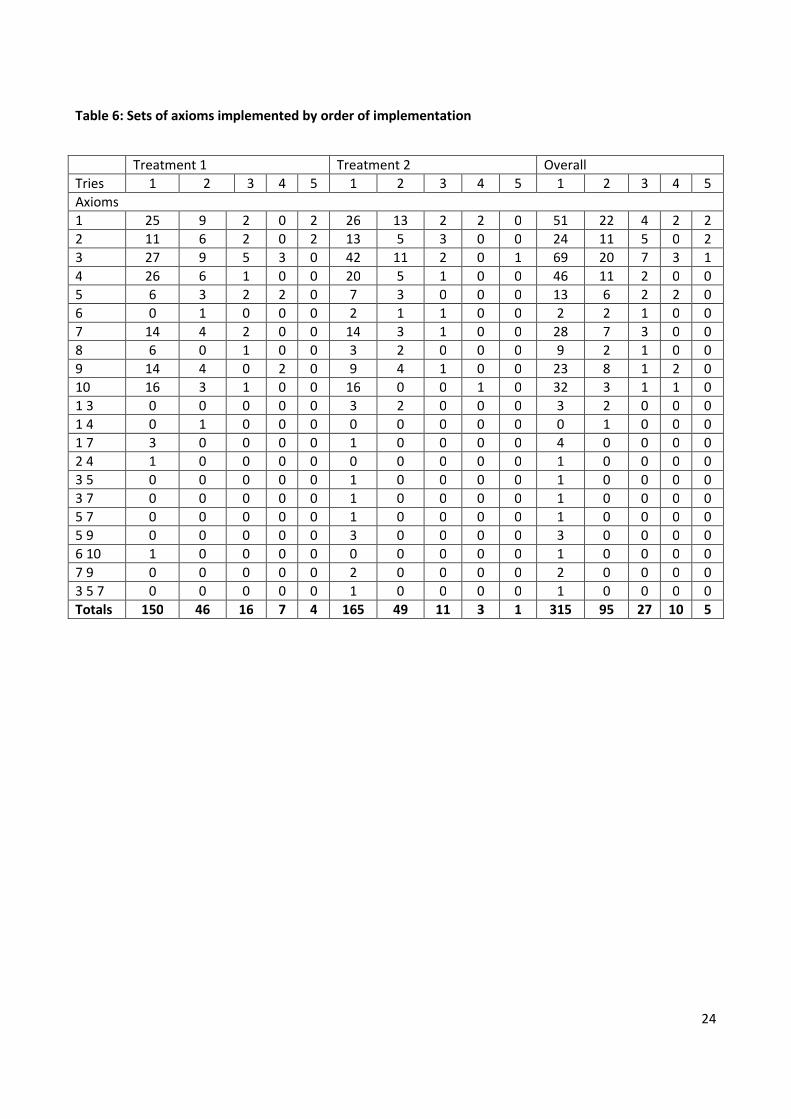
Table 6 gives further information on the order of the implementation of the various sets of principles. In
this we have aggregated the data across the three repetitions. The row labelled ‘Tries’ indicates the order
of implementation. For example, in Treatment 1 (where there were 50 subjects each doing 3 repetitions),
on 25 of these 150 occasions, Rawls (principle 1) was implemented first, Reverse Rawls (principle 2) was
implemented first 11 times, and so on. It will be seen that on Treatment 1, one or other of (or a
combination of) the Equality-based principles (the odd-numbered ones) was implemented first 89 times
out of 150 – 60% of the time. In Treatment 2 the corresponding figure was 111 out of 165 – slightly higher

12
at 67%. The fact that subjects were allowed to implement principles sequentially meant that they could
resolve any conflicts within their preferences – by, for example, implementing an Equality-based principle
first and then an Inequality-based principle.
6. Comparison with previous experiments
Direct comparisons are not plentiful, mainly because different authors investigate different axiom sets.
However, we can give a few examples. We start with some results from Amiel and Cowell’s book Thinking
about Inequality. In their Table 4.3 they report the following data, where, by “Numerical”, they mean
findings from pairwise choice (indirect) questions, and, by “Verbal”, findings from (un-incentivated) direct
questions.
Numerical Verbal
Agree 35% 60%
Strongly Disagree 42% 24%
Disagree 22% 14%
The Numerical responses come from a question in which subjects were asked to choose between the
following two distributions: (1, 4, 7, 10, 13) and (1, 5, 6, 10, 13). Amiel and Cowell refer to this question as a
test of the Transfer principle. Indeed, it is true that one can go from the first to the second distribution by
taking one unit of income away from the third person in the distribution and giving it to the second. Hence,
if someone believes in the Transfer principle, then this person should prefer the second distribution to the
first. But note also that the second distribution would be preferred to the first by someone, for example,
who believes in Rawls, or Dispersion. So this Numerical question is not only potentially an indirect test of
the Transfer principle, it is also not necessarily a test of that principle. It is odd then, that the percentage
that is in agreement with this test to is so low, and indeed lower than the percentage who agree to the
Verbal statement of the Transfer principle. A similar small percentage is found in the study by Gaertner and
Namzie (2003). In respect of the Verbal result, we recall the finding reported in Table 1.1, that in our

13
experiment the percentage agreement with the Transfer principle, across both treatments and across all
repetition is 59.3% - remarkably close to the answers obtained from the un-incentivated question Verbal
question of Amiel and Cowell.
Other comparisons are difficult as other studies have investigated different sets of axioms – usually
because the objectives of their experiments were different. For example, Amiel and Cowell (1992), and
indeed Amiel and Cowell (1999), investigated Anonymity, Scale Invariance, Translation Invariance, Principle
of Population, Transfer and Decomposability. Anonymity was implicit in our experimental implementation,
while Scale Invariance, Translation Invariance and Principle of Population were excluded because all our
distributions had the same mean. In a sense, the principle of Decomposability is irrelevant to our study as it
is a principle of Inequality, rather than a principle of preferences over income distributions. Indeed, the
other axioms mentioned in this paragraph can also be viewed in the same light. For these the issue is
Inequality; to get from these to preferences over income distributions, we need to add some axioms
describing how Inequality maps into social preferences over income distributions. This was not the concern
of our study.
One major concern was whether subjects’ apparent preferences differed between the two treatments. In
Treatment 1 they had an obvious self-interest, while in Treatment 2 there was no self-interest – they were
truly impartial social planners. We found a larger percentage of Equality-based agreed-to principles in
Treatment 2 than in Treatment 1, and a considerably larger percentage of Equality-based principles-
implemented in Treatment 2 compared to Treatment 1, suggesting that subjects were not always able, in
Treatment 1, to disassociate themselves from the fact that they would be a member of society. One might
conclude that Treatment 2 gives a more reliable picture of true social preferences, while Treatment 1
reveals only private risk preferences. Other authors have also investigated this possibility, though using
indirect rather than direct questions. For example, Traub et al (2009) implemented four different
treatments, two of which are relevant to our present study: these Traub et al called the “Social
Preferences” treatment and the “Social Planner” treatment. They found no significant differences between
14
the two treatments. In contrast, we found a modest increase, not only in the agreed-to Equality principles
but also in the implemented Equality-based principles from Treatment 1 to Treatment 2. The differences
between our results and those of Traub et al may well be a consequence of the fact that we used a direct
method while they used an indirect method.
7. Conclusions
Social preferences lie at the heart of social choice theory. In particular, social preferences over income
distributions are central to issues concerning the appropriate distribution of income in a society. Political
scientists and economists have long been interested in the basic axioms or principles underlying such social
preferences. Such principles shape society. In a sense these principles capture the idea of a “Social
Planner”, who plans the distribution of income in society in a disinterested manner, although it is difficult
to say who is the Social Planner, and whether his or her preferences are an aggregate, in some sense, of the
preferences of the members of society. An alternative interpretation is that all of us have embodied in
ourselves, and hence can articulate, the preferences of this disinterested Social Planner.
Experimental economists have been active for some time in trying to identify social preferences, usually
following the second interpretation above – by asking questions to subjects which enable the experimenter
to identify the subjects’ underlying preferences. There are two ways that one might do this: first, by directly
enquiring of subjects what their preferences are; second, by inquiring indirectly, by asking subjects to
choose between income distributions. The experiments that have followed the former route usually have
done so without appropriate incentives. The majority of incentivised experiments have followed the latter
route. Forgetting the issue of incentives for the moment, it is of interest to ask which method might be the
best. Proponents of the indirect route argue that subjects are not able to articulate general statements
about underlying principles, and indeed are not able to appreciate the implications of general principles.
Hence, they argue, it is better to give subjects concrete and specific examples (choices between income

15
distributions). However, these examples might well be special cases (carefully chosen by the experimenter)
and the responses may not shed light on the general principles underlying them. There are thus good
reasons for trying the direct approach. This we do in this paper. Moreover we provide appropriate
incentives to our subjects.
We do this in two separate scenarios, or treatments. In Treatment 1 each subject may end up as the Social
Planner and also a member of society. In Treatment 2 each subject may end up as the Social Planner, and if
so, not a member of society. In this latter case, the subjects should be less self-interested, and thus more
concerned about the actual members of society, who are, in our case, the other subjects in the
experimental session.
We focus on the major axioms or principles invoked in social choice theory: Rawls, Dispersion, Transfer,
Group Transfer and Lorenz. These can all be considered Equality-based principles. We also include, for each
of these five basic principles, their reverse, which can be considered Inequality-based principles. We ask
subjects first, for each principle, whether they agree with it or not, and then we ask them to state the order
in which they want their agreed-to principles implemented. At the end of the session, one subject is chosen
to be the Social Planner, and his or her preferences are used to select a unique distribution (from a large
set of randomly generated distributions) which will be distributed amongst the members of society – who,
in Treatment 1, are all the subjects in the experimental session, and who, in Treatment 2, are the other
subjects in the experimental session. Clearly in this latter case, where the Social Planner receives a fixed
payment for participation in the experiment, the subjects have no direct interest in the implications of their
preferences over the chosen distribution. This treatment faithfully reproduces the disinterested Social
Planner.
As noted above, we provide appropriate incentives. In Treatment 1 all subjects received a payment given by
the chosen distribution, with the subjects allocated to the members of society in a random manner. In
Treatment 2, all subjects received a payment determined in the same way, except for the Social Planner,
who received a fixed payment for his or her participation. Moreover, we provided opportunities for

16
learning – in that we carried out three identical repetitions in each experimental session, though, of course,
subjects could change their reported preferences between the various repetitions. We thought that
learning may be an important element of the experiment.
It turned out not to be the case: reported preferences did not change in any significant manner through the
three repetitions. However there were differences in the elicited preferences in the two treatments: in
Treatment 1, where subjects had an obvious self-interest, they reported preferences slightly less Equality-
based than those in Treatment 2, where they were obviously disinterested outside observers. There was an
even bigger rise in the number of Equality-based principles implemented from Treatment 1 to Treatment 2.
This finding is rather different from the findings from experiments using the indirect method of inferring
social preferences (for example Traub et al (2009) – who find no treatment effect).
61.2% of the agreed-to principles were Equality-based in Treatment 1 and 66.5% in Treatment 2. 61.8% of
the implemented principles were Equality-based in Treatment 1 and 71.0% in Treatment 2. Women were
more likely to implement Equality-based principles than men. Younger people also were more likely to
implement Equality-based principles than older people.
In the basic principles, there were obviously conflicts, clearly so between Equality-based principles and
Inequality-based principles, but also within the Equality-based principles and within the Inequality-based
principles. We allowed for the implementation of apparently conflicting principles by allowing subjects to
implement principles sequentially. So they could use one principle to reduce the set of possible
distributions to a smaller subset, and then use some other principle (possibly conflicting on a direct basis)
to select from that subset. In no cases, did we have to use the default (selecting from the remaining subset
at random) as all subjects always agreed to enough principles to select a uniquely best distribution
(according to their principles).
The bottom line is that we do observe a treatment effect. Both the percentage of Equality-based agreed-to
principles and the percentage of Equality-based principles implemented are higher in Treatment 2 than in
17
Treatment 2. Being disinterested seems to make people more equality-preferring. This is a different finding
from the results of experiments in which the indirect method of inferring social preferences is used.
Moreover, the general incidence of Equality-preference (in both treatments) is higher using our direct
method. We remain agnostic, however, about which are the ‘true’ social preferences.
References
Amiel Y and Cowell F A (1999), Thinking About Inequality, Cambridge UP.
Bosmans K and Schokkaert E (2004), “Social Welfare, the Veil of Ignorance and Purely Individual Risk: An
Empirical Examination”, in Cowell FA Inequality, Welfare and Income Distribution: Experimental
Approaches, Elsevier.
Gaertner W and Namazie C (2003), “Income inequality, risk, and the transfer principle. A questionnaire–
experimental investigation”, Mathematical Social Sciences, 45, 229-245.
Traub S, Seidl C and Schmidt U (2009), “An Experimental Study on Individual Choice, Social Welfare, and
Social Preferences”, European Economic Review, 53, 385-400.

18
Table 1: Principles/Axioms Agreed-To
1.1: Totals
Axiom Treatment 1 Treatment 2 Overall
Rep 1 Rep 2 Rep 3 Rep 1 Rep 2 Rep 3 Treatment 1 Treatment 2
1 40 38 43 47 42 46 121 135
2 32 33 33 29 30 35 98 94
3 29 29 21 36 33 32 79 101
4 21 24 31 19 20 20 76 59
5 31 27 34 34 31 30 92 95
6 5 8 7 4 9 13 20 26
7 32 29 34 36 35 34 95 105
8 6 10 9 4 7 10 25 21
9 39 40 42 46 37 40 121 123
10 33 37 33 27 25 29 103 81
Totals 268 275 287 281 268 288 830 837
1:2: Percentages (of the total number of axioms agreed-to)
Axiom Treatment 1 Treatment 2 Overall
Rep 1 Rep 2 Rep 3 Rep 1 Rep 2 Rep 3 Treatment 1 Treatment 2
1 14.9 13.8 15.0 16.4 15.3 15.6 14.6 15.8
2 11.9 12.0 11.5 10.3 11.2 12.2 11.8 11.2
3 10.8 10.5 7.3 12.8 12.3 11.1 9.5 12.1
4 7.8 8.7 10.8 6.8 7.5 6.9 9.2 7.0
5 11.6 9.8 11.8 12.1 11.6 10.4 11.1 11.4
6 1.9 2.9 2.4 1.4 3.4 4.5 2.4 3.1
7 11.9 10.5 11.8 12.8 13.1 11.8 11.4 12.5
8 2.2 3.6 3.1 1.4 2.6 3.5 3.0 2.5
9 14.6 14.5 14.6 16.4 13.8 13.9 14.6 14.7
10 12.3 13.5 11.5 9.6 9.3 10.1 12.4 9.7
19
Table 2: Principles/Axioms Implemented
2.1: Totals
Axiom Treatment 1 Treatment 2 Overall
Rep 1 Rep 2 Rep 3 Rep 1 Rep 2 Rep 3 Treatment 1 Treatment 2
1 16 15 11 18 15 16 42 49
2 6 9 7 7 6 8 22 19
3 18 14 12 20 25 19 44 64
4 11 8 17 7 10 9 36 25
5 5 5 3 6 3 7 13 16
6 1 1 0 1 2 1 2 4
7 7 9 7 7 9 8 23 24
8 1 4 2 0 1 4 7 5
9 7 8 5 5 6 8 20 19
10 3 9 9 7 5 5 21 17
Totals 75 82 73 77 81 84 230 242
2.2: Percentages (of the total number of axioms implemented)
Axiom Treatment 1 Treatment 2 Overall
Rep 1 Rep 2 Rep 3 Rep 1 Rep 2 Rep 3 Treatment 1 Treatment 2
1 21.3 18.3 15.1 23.4 18.5 19.0 18.3 20.2
2 8.0 11.0 9.6 9.0 7.4 9.6 9.6 7.9
3 24.0 17.1 16.4 26.0 30.9 22.6 19.1 26.4
4 14.7 9.8 23.3 9.1 12.2 10.7 15.7 10.3
5 6.7 6.1 4.1 7.8 3.7 8.3 5.7 6.6
6 1.3 1.2 0.0 1.3 2.5 1.2 0.9 1.7
7 9.3 11.0 9.6 9.1 11.1 9.5 10.0 9.9
8 1.3 4.9 2.7 0.0 1.2 4.8 3.0 2.1
9 9.3 9.8 6.8 6.5 7.4 9.5 8.7 7.9
10 4.0 11.0 12.3 9.1 6.2 6.0 9.1 7.0

20
Table 3: Agreement and implementation (in percentage terms)
Axiom Treatment 1 Treatment 2
Agreed-to Implemented Agreed-to Implemented
1 14.6 18.3 15.8 20.2
2 11.8 9.6 11.2 7.9
3 9.5 19.1 12.1 26.4
4 9.2 15.7 7.0 10.3
5 11.1 5.7 11.4 6.6
6 2.4 0.9 3.1 1.7
7 11.4 10.0 12.5 9.9
8 3.0 3.0 2.5 2.1
9 14.6 8.7 14.7 7.9
10 12.4 9.1 9.7 7.0

21
Table 4: Sets of axioms agreed-to
Axiom sets Treatment 1 Treatment 2 Both Treatments
R1 R2 R3 Total R1 R2 R3 Total Overall Total
4 1 1 2 4 0 0 0 0 4
1 9 0 0 0 0 0 0 1 1 1
2 3 0 0 0 0 0 1 0 1 1
2 10 0 0 0 0 0 1 0 1 1
3 5 1 0 0 1 0 0 0 0 1
3 7 0 0 0 0 1 1 0 2 2
4 7 0 0 0 0 1 1 1 3 3
1 3 7 0 0 0 0 0 1 0 1 1
1 3 9 1 0 0 1 1 0 0 1 2
1 3 10 0 1 0 1 0 0 0 0 1
1 4 5 0 0 1 1 0 0 0 0 1
1 4 9 0 0 0 0 1 1 1 3 3
2 3 10 0 0 0 0 0 0 1 1 1
2 4 10 0 0 0 0 0 1 1 2 2
3 5 7 1 0 0 1 0 1 1 2 3
3 8 10 1 0 0 1 0 0 0 0 1
4 5 7 0 0 0 0 1 0 0 1 1
4 6 8 0 0 0 0 0 1 0 1 1
1 2 3 9 0 0 0 0 0 1 1 2 2
1 2 3 10 1 0 1 2 0 0 0 0 2
1 2 4 5 0 0 0 0 0 0 1 1 1
1 2 4 10 0 0 0 0 2 0 0 2 2
1 3 5 7 0 0 0 0 1 3 2 6 6
1 3 5 9 0 0 0 0 0 0 1 1 1
1 3 7 9 0 1 0 1 2 2 1 5 6
1 3 9 10 1 0 0 1 0 0 0 0 1
1 4 5 9 1 0 1 2 0 0 0 0 2
1 4 6 9 0 0 0 0 0 1 0 1 1
1 4 7 9 1 1 2 4 0 0 1 1 5
1 5 7 9 0 0 0 0 1 1 1 3 3
2 3 6 8 0 0 0 0 0 1 1 2 2
2 4 5 9 0 1 0 1 0 0 0 0 1
2 4 8 10 0 1 0 1 0 0 0 0 1
2 6 8 10 0 0 0 0 0 0 1 1 1
3 5 7 9 1 2 0 3 0 0 0 0 3
3 5 7 10 0 0 0 0 1 0 0 1 1
4 5 7 10 1 1 0 2 0 0 0 0 2
1 2 3 5 9 0 0 0 0 0 1 0 1 1
1 2 3 5 10 0 1 0 1 0 0 0 0 1
1 2 3 7 9 1 0 0 1 0 0 0 0 1
1 2 3 9 10 2 3 1 6 2 1 1 4 10
1 2 4 5 9 0 0 0 0 1 0 0 1 1
1 2 4 9 10 1 2 2 5 3 1 1 5 10
1 2 5 9 10 0 0 0 0 1 1 1 3 3
1 3 5 7 9 3 4 3 10 8 5 6 19 29
1 3 5 9 10 1 1 0 2 0 0 1 1 3
1 3 7 9 10 0 0 0 0 2 0 1 3 3
1 4 5 7 9 3 2 5 10 3 4 1 8 18
1 4 6 7 9 0 0 1 1 0 0 0 0 1
1 4 6 8 9 0 1 0 1 0 0 0 0 1
1 4 7 9 10 0 1 1 2 0 0 0 0 2
2 3 5 7 9 0 0 1 1 1 1 0 2 3
2 3 6 8 9 0 0 0 0 1 0 0 1 1
2 3 6 8 10 0 2 0 2 0 0 0 0 2
2 3 7 8 10 1 0 0 1 0 0 0 0 1
2 3 8 9 10 0 0 1 1 0 0 0 0 1
2 4 5 7 9 1 0 0 1 0 0 0 0 1
2 4 5 7 10 0 0 0 0 0 1 0 1 1
2 4 5 9 10 1 0 0 1 0 0 0 0 1
2 4 6 8 10 1 3 2 6 0 3 3 6 12
3 4 5 6 10 0 0 1 1 0 0 0 0 1

22
1 2 3 5 7 9 1 0 1 2 1 0 2 3 5
1 2 3 5 9 10 1 1 3 5 4 3 1 8 13
1 2 3 6 8 10 1 0 0 1 1 1 0 2 3
1 2 3 6 9 10 1 0 0 1 1 1 1 3 4
1 2 3 7 8 10 0 0 0 0 0 0 1 1 1
1 2 3 7 9 10 1 3 0 4 1 3 3 7 11
1 2 4 5 7 9 0 0 0 0 3 2 1 6 6
1 2 4 5 7 10 1 0 0 1 0 0 0 0 1
1 2 4 6 8 9 1 0 0 1 0 0 1 1 2
1 2 4 6 8 10 1 0 0 1 0 0 1 1 2
1 2 4 7 9 10 2 1 2 5 0 1 0 1 6
1 3 5 7 9 10 1 0 0 1 0 2 0 2 3
1 3 7 8 9 10 0 0 0 0 1 0 0 1 1
1 4 6 8 9 10 0 1 0 1 0 0 0 0 1
2 3 4 5 9 10 0 1 0 1 1 0 0 1 2
2 4 6 8 9 10 0 0 0 0 1 0 0 1 1
1 2 3 5 7 9 10 8 6 6 20 5 3 5 13 33
1 2 4 5 6 7 9 0 0 0 0 0 0 1 1 1
1 2 4 5 7 8 10 0 0 1 1 0 0 0 0 1
1 2 4 5 7 9 10 5 4 7 16 1 1 2 4 20
1 2 4 6 8 9 10 0 1 1 2 0 0 1 1 3
1 3 4 5 7 9 10 0 0 0 0 1 0 0 1 1
1 2 3 4 5 7 9 10 0 2 0 2 0 1 1 2 4
1 2 3 5 6 7 9 10 0 0 0 0 0 0 1 1 1
1 2 3 5 7 8 9 10 0 1 2 3 0 0 0 0 3
1 2 4 5 6 7 9 10 0 0 0 0 0 0 1 1 1
1 2 4 5 6 7 8 9 10 0 0 1 1 0 1 1 2 3
1 2 3 4 5 6 7 8 9 10 0 0 1 1 0 0 0 0 1

23
Table 5: Sets of axioms implemented
Treatment 1 Treatment 2 Overall
Repetition 1 Repetition 2 Repetition 3 Repetition 1 Repetition 2 Repetition 3 T1 T2 Both Try
Set
1 2 3 4 5 1 2 3 4 5 1 2 3 4 5 1 2 3 4 5 1 2 3 4 5 1 2 3 4 5
1 10 3 0 0 1 7 4 1 0 1 8 2 1 0 0 10 3 2 0 0 7 4 0 1 0 9 6 0 1 0 38 43 81 2 4 0 1 0 1 5 2 1 0 0 2 4 0 0 1 4 3 0 0 0 4 2 0 0 0 5 0 3 0 0 21 21 42 3 12 3 2 1 0 6 4 3 1 0 9 2 0 1 0 14 2 0 0 0 16 4 1 0 0 12 5 1 0 1 56 44 100 4 9 1 0 0 0 5 2 0 0 0 12 3 1 0 0 6 1 0 0 0 6 3 1 0 0 8 1 0 0 0 33 26 59 5 3 1 0 1 0 2 2 1 0 0 1 0 1 1 0 3 0 0 0 0 0 1 0 0 0 4 2 0 0 0 10 13 23 6 0 1 0 0 0 0 0 0 0 0 0 0 0 0 0 1 0 0 0 0 1 1 0 0 0 0 0 1 0 0 1 4 5 7 5 1 0 0 0 4 2 1 0 0 5 1 1 0 0 2 2 0 0 0 6 0 1 0 0 6 1 0 0 0 29 18 38 8 0 0 1 0 0 4 0 0 0 0 2 0 0 0 0 0 0 0 0 0 1 0 0 0 0 2 2 0 0 0 7 5 12 9 5 1 0 1 0 7 0 0 1 0 2 3 0 0 0 2 1 0 0 0 4 1 0 0 0 3 2 1 0 0 20 14 34 10 1 1 1 0 0 6 2 0 0 0 9 0 0 0 0 7 0 0 0 0 5 0 0 0 0 4 0 0 1 0 20 17 37 1 3 0 0 0 0 0 0 0 0 0 0 0 0 0 0 0 1 1 0 0 0 2 1 0 0 0 0 0 0 0 0 0 5 5 1 4 0 1 0 0 0 0 0 0 0 0 0 0 0 0 0 0 0 0 0 0 0 0 0 0 0 0 0 0 0 0 1 0 1 1 7 1 0 0 0 0 2 0 0 0 0 0 0 0 0 0 1 0 0 0 0 0 0 0 0 0 0 0 0 0 0 3 1 4 2 4 0 0 0 0 0 1 0 0 0 0 0 0 0 0 0 0 0 0 0 0 0 0 0 0 0 0 0 0 0 0 1 0 1 3 5 0 0 0 0 0 0 0 0 0 0 0 0 0 0 0 1 0 0 0 0 0 0 0 0 0 0 0 0 0 0 0 1 1 3 7 0 0 0 0 0 0 0 0 0 0 0 0 0 0 0 0 0 0 0 0 1 0 0 0 0 0 0 0 0 0 0 1 1 5 7 0 0 0 0 0 0 0 0 0 0 0 0 0 0 0 0 0 0 0 0 1 0 0 0 0 0 0 0 0 0 0 1 1 5 9 0 0 0 0 0 0 0 0 0 0 0 0 0 0 0 1 0 0 0 0 1 0 0 0 0 1 0 0 0 0 0 3 3 6 10 0 0 0 0 0 0 0 0 0 0 1 0 0 0 0 0 0 0 0 0 0 0 0 0 0 0 0 0 0 0 0 0 1 7 9 0 0 0 0 0 0 0 0 0 0 0 0 0 0 0 1 0 0 0 0 0 0 0 0 0 1 0 0 0 0 0 2 2 3 5 7 0 0 0 0 0 0 0 0 0 0 0 0 0 0 0 1 0 0 0 0 0 0 0 0 0 0 0 0 0 0 0 1 1 Totals 50 13 5 3 2 50 18 7 2 1 50 15 4 2 1 55 13 2 0 0 55 17 3 1 0 55 19 6 2 1
24
Table 6: Sets of axioms implemented by order of implementation
Treatment 1 Treatment 2 Overall
Tries 1 2 3 4 5 1 2 3 4 5 1 2 3 4 5
Axioms
1 25 9 2 0 2 26 13 2 2 0 51 22 4 2 2
2 11 6 2 0 2 13 5 3 0 0 24 11 5 0 2
3 27 9 5 3 0 42 11 2 0 1 69 20 7 3 1
4 26 6 1 0 0 20 5 1 0 0 46 11 2 0 0
5 6 3 2 2 0 7 3 0 0 0 13 6 2 2 0
6 0 1 0 0 0 2 1 1 0 0 2 2 1 0 0
7 14 4 2 0 0 14 3 1 0 0 28 7 3 0 0
8 6 0 1 0 0 3 2 0 0 0 9 2 1 0 0
9 14 4 0 2 0 9 4 1 0 0 23 8 1 2 0
10 16 3 1 0 0 16 0 0 1 0 32 3 1 1 0
1 3 0 0 0 0 0 3 2 0 0 0 3 2 0 0 0
1 4 0 1 0 0 0 0 0 0 0 0 0 1 0 0 0
1 7 3 0 0 0 0 1 0 0 0 0 4 0 0 0 0
2 4 1 0 0 0 0 0 0 0 0 0 1 0 0 0 0
3 5 0 0 0 0 0 1 0 0 0 0 1 0 0 0 0
3 7 0 0 0 0 0 1 0 0 0 0 1 0 0 0 0
5 7 0 0 0 0 0 1 0 0 0 0 1 0 0 0 0
5 9 0 0 0 0 0 3 0 0 0 0 3 0 0 0 0
6 10 1 0 0 0 0 0 0 0 0 0 1 0 0 0 0
7 9 0 0 0 0 0 2 0 0 0 0 2 0 0 0 0
3 5 7 0 0 0 0 0 1 0 0 0 0 1 0 0 0 0
Totals 150 46 16 7 4 165 49 11 3 1 315 95 27 10 5
25
Figure 1: % equality implemented plotted against % equality agreed

26
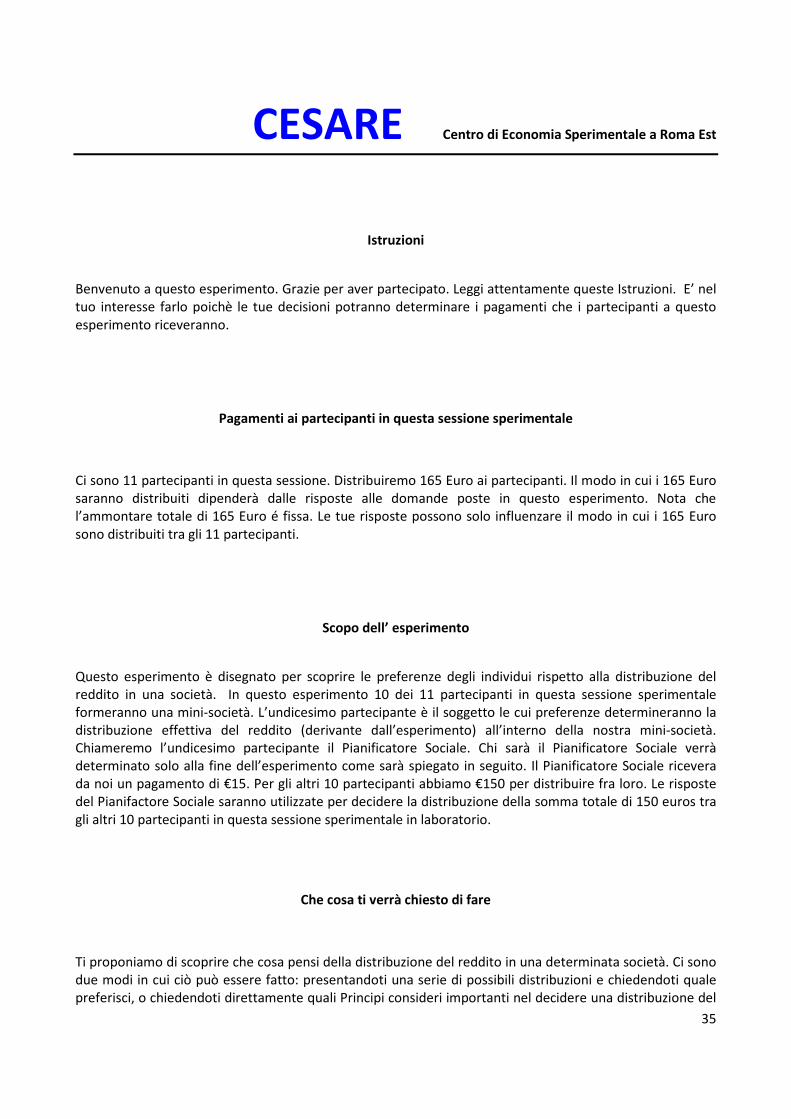
CESARE Centro di Economia Sperimentale a Roma Est
Istruzioni
Benvenuto a questo esperimento. Grazie per aver partecipato. Leggi attentamente queste Istruzioni. E’ nel
tuo interesse farlo poichè le tue decisioni potranno determinare i pagamenti che i partecipanti a questo
esperimento riceveranno.
Pagamenti ai partecipanti in questa sessione sperimentale
Ci sono 10 partecipanti in questa sessione. Distribuiremo 150 Euro ai partecipanti. Il modo in cui i 150 Euro
saranno distribuiti dipenderà dalle risposte alle domande poste in questo esperimento. Nota che
l’ammontare totale di 150 Euro é fissa. Le tue risposte possono solo influenzare il modo in cui i 150 Euro
sono distribuiti tra gli 10 partecipanti.
Scopo dell’ esperimento
Questo esperimento è disegnato per scoprire le preferenze degli individui rispetto alla distribuzione del
reddito in una società. In questo esperimento i 10 partecipanti in questa sessione sperimentale
formeranno una mini-società.
Che cosa ti verrà chiesto di fare
Ti proponiamo di scoprire che cosa pensi della distribuzione del reddito in una determinata società. Ci sono
due modi in cui ciò può essere fatto: presentandoti una serie di possibili distribuzioni e chiedendoti quale
preferisci, o chiedendoti direttamente quali Principi consideri importanti nel decidere una distribuzione del
reddito. In questo esperimento seguiremo il secondo modo. Ti verrà presentata una serie di possibili
Principi sulla base dei quali determinerai la distribuzione del reddito e ti verrà chiesto con quale sei
d’accordo. In altre parole dovrai scegliere un sotto-insieme di Principi, e tale sotto-insieme sarà quello che
tu pensi debba essere usato nel determinare la distribuzione del reddito di una società. Se il tuo sotto-
27
insieme è completo e coerente, allora potrai selezionare una distribuzione preferita da ogni possibile set di
distribuzioni, ossia la tua distribuzione preferita per quell’insieme.
Come sarai pagato per la partecipazione a questo esperimento
Dopo che tutti i partecipanti avranno ultimato l'esperimento, selezioneremo a caso chi di voi sarà il
Pianificatore Sociale. Il computer selezionerà poi a caso 100 distribuzioni differenti di €150 tra 10 individui,
e useremo i Principi del Pianificatore Sociale per selezionare la sua distribuzione del reddito preferita
nell’ambito di tale selezione. Questa distribuzione da lui preferita costituirà i pagamenti ai 10 partecipanti
in questa sessione. Ti prego di notare che ogni distribuzione ha la stessa somma di denaro di €150 ad
distribuire – sara diverso solo il modo in quale il reddito totale viene distribuito.
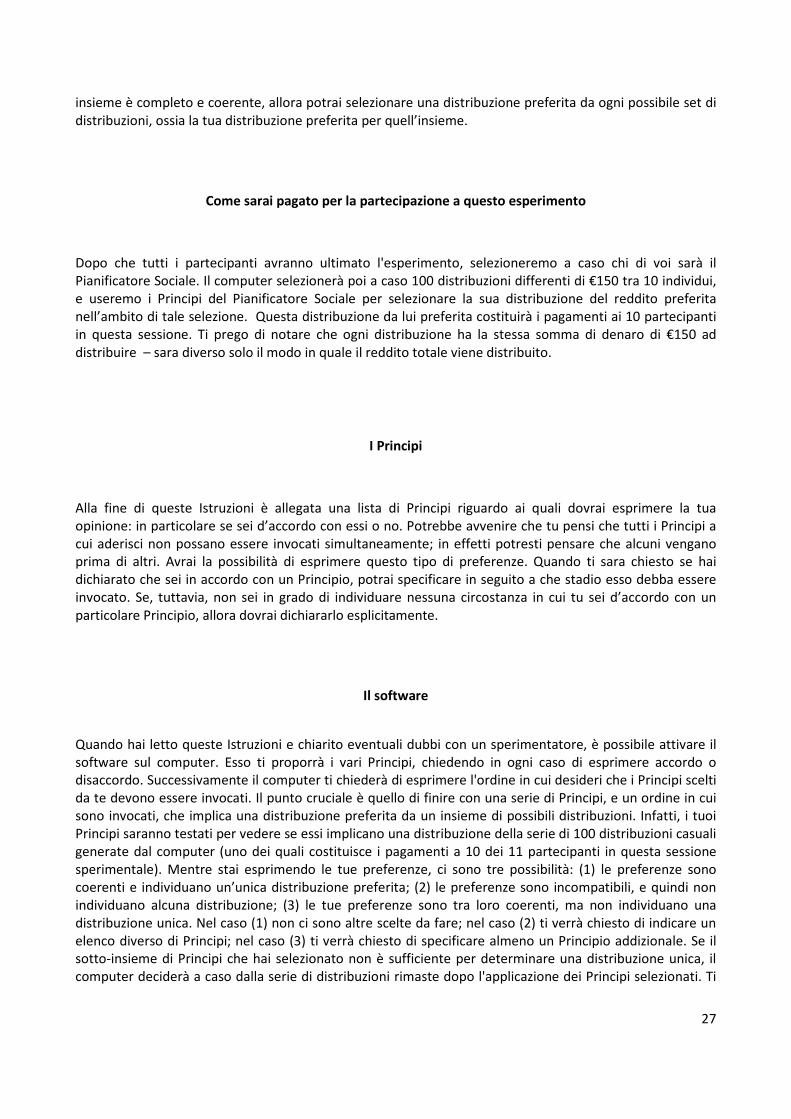
I Principi
Alla fine di queste Istruzioni è allegata una lista di Principi riguardo ai quali dovrai esprimere la tua
opinione: in particolare se sei d’accordo con essi o no. Potrebbe avvenire che tu pensi che tutti i Principi a
cui aderisci non possano essere invocati simultaneamente; in effetti potresti pensare che alcuni vengano
prima di altri. Avrai la possibilità di esprimere questo tipo di preferenze. Quando ti sara chiesto se hai
dichiarato che sei in accordo con un Principio, potrai specificare in seguito a che stadio esso debba essere
invocato. Se, tuttavia, non sei in grado di individuare nessuna circostanza in cui tu sei d’accordo con un
particolare Principio, allora dovrai dichiararlo esplicitamente.
Il software
Quando hai letto queste Istruzioni e chiarito eventuali dubbi con un sperimentatore, è possibile attivare il
software sul computer. Esso ti proporrà i vari Principi, chiedendo in ogni caso di esprimere accordo o
disaccordo. Successivamente il computer ti chiederà di esprimere l'ordine in cui desideri che i Principi scelti
da te devono essere invocati. Il punto cruciale è quello di finire con una serie di Principi, e un ordine in cui
sono invocati, che implica una distribuzione preferita da un insieme di possibili distribuzioni. Infatti, i tuoi
Principi saranno testati per vedere se essi implicano una distribuzione della serie di 100 distribuzioni casuali
generate dal computer (uno dei quali costituisce i pagamenti a 10 dei 11 partecipanti in questa sessione
sperimentale). Mentre stai esprimendo le tue preferenze, ci sono tre possibilità: (1) le preferenze sono
coerenti e individuano un’unica distribuzione preferita; (2) le preferenze sono incompatibili, e quindi non
individuano alcuna distribuzione; (3) le tue preferenze sono tra loro coerenti, ma non individuano una
distribuzione unica. Nel caso (1) non ci sono altre scelte da fare; nel caso (2) ti verrà chiesto di indicare un
elenco diverso di Principi; nel caso (3) ti verrà chiesto di specificare almeno un Principio addizionale. Se il
sotto-insieme di Principi che hai selezionato non è sufficiente per determinare una distribuzione unica, il
computer deciderà a caso dalla serie di distribuzioni rimaste dopo l'applicazione dei Principi selezionati. Ti

28
ricordiamo che se stai invocando i Principi in sequenza, anche le distribuzioni saranno selezionate in
sequenza, utilizzando i Principi secondo l’ordine che hai scelto.
Ripetizioni
Ti ricordiamo che ogni volta che dichiarerai un Principio, il reddito totale da redistribuire e una soma fissa di
€150. Per essere sicuro di aver capito queste Istruzioni, dovrai effetuare l`intero esperimento per tre volte.
Le risposte del Pianificatore Sociale su di una di queste tre ripetizioni scelta a caso sarà utilizzata, come
descritto sopra, per determinare i pagamenti ai partecipanti in questa sessione sperimentale.
Per qualsiasi dubbio, puoi rivolgerti agli sperimentatori.
John Hey Carmen Pasca
Giugno 2009

29
I Principi Indicati
Principio 1: Se il più povero della distribuzione 1 ha un reddito più alto del più povero della distribuzione 2,
allora preferisco la distribuzione 1.
Principio 2: Se il più ricco della distribuzione 1 ha un reddito più alto del più ricco della distribuzione 2,
allora preferisco la distribuzione 1.
Principio 3: Preferisco la distribuzione in cui la dispersione del reddito è minore.
Principio 4: Preferisco la distribuzione in cui la dispersione del reddito è maggiore.
Principio 5: Penso che la distribuzione migliori se togliamo 1 euro ad un individuo e lo diamo ad uno più
povero.
Principio 6: Penso che la distribuzione migliori se togliamo 1 euro ad un individuo e lo diamo ad uno più
ricco.
Principio 7: Penso che la distribuzione migliori se togliamo 1 euro ad un gruppo di individui e lo diamo ad
un gruppo di più poveri.
Principio 8: Penso che la distribuzione migliori se togliamo 1 euro ad un gruppo di individui e lo diamo ad
un gruppo di più ricchi.

30
Principio 9: Se gli n individui più poveri della distribuzione 1 hanno un reddito totale più alto degli n
individui più poveri della distribuzione 2, per tutti i valori di n compresi tra 1 e 10, preferisco la distribuzione
1.
Principio 10: Se gli individui n più ricchi della distribuzione 1 hanno un reddito totale più alto degli n
individui più ricchi della distribuzione 2, per tutti i valori di n compresi tra 1 e 10, preferisco la distribuzione
1.

31
Alcuni dettagli aggiuntivi sui Principi
Principio 1: Esso può essere ulteriormente chiarito come segue. Se i più poveri delle due distribuzioni
hanno lo stesso reddito, allora se la seconda persona più povera della distribuzione 1 ha un reddito più alto
della seconda persona più povera della distribuzione 2, allora preferisco la distribuzione 1; se le due
persone più povere nelle due distribuzione hanno gli stessi redditi, se la terza persona più povera nella
distribuzione 1 ha un reddito più alto della terza persona più povera della distribuzione 2, allora preferisco
la distribuzione 1, e così via.
Principio 2: Esso può essere ulteriormente chiarito come segue. Se i più ricchi delle due distribuzioni hanno
lo stesso reddito, allora se la seconda persona più ricca della distribuzione 1 ha un reddito più alto della
seconda persona più ricca della distribuzione 2, allora preferisco la distribuzione 1; se le due persone più
ricche nelle due distribuzione hanno gli stessi redditi, se la terza persona più ricca nella distribuzione 1 ha
un reddito più alto della terza persona più ricca della distribuzione 2, allora preferisco la distribuzione 1, e
così via.
Principio 3: Qui la deviazione standard dei redditi (radice quadrata della varianza) è usata come misura di
dispersione.
Principio 4: Qui la deviazione standard dei redditi (radice quadrata della varianza) è usata come misura di
dispersione.
Principio 5: Questo Principio può essere applicato molte volte, sempre togliendo un euro da qualcuno per
darlo a qualcuno più povero.
Principio 6: Questo Principio può essere applicato molte volte, sempre togliendo un euro da qualcuno per
darlo a qualcuno più ricco.

32
Principio 7: La dimensione del gruppo va decisa. Il Principio non dice nulla riguardo agli effetti di una
redistribuzione all’interno del gruppo stesso.
Principio 8: La dimensione del gruppo va decisa. Il Principio non dice nulla riguardo agli effetti di una
redistribuzione all’interno del gruppo stesso.
Principio 9: Questo Principio può essere espresso in modo più esteso come segue. Se la persona più povera
della distribuzione 1 ha un reddito totale più alto della persona più povera della distribuzione 2; se le due
persone più povere della distribuzione 1 hanno un reddito totale più alto delle due persone più povere
della distribuzione 2; se le tre persone più povere della distribuzione 1 hanno un reddito totale più alto
delle tre persone più povere della distribuzione 2; se le quattro persone più povere della distribuzione 1
hanno un reddito totale più alto delle quattro persone più povere della distribuzione 2; se le cinque
persone più povere della distribuzione 1 hanno un reddito totale più alto delle cinque persone più povere
della distribuzione 2; se le sei persone più povere della distribuzione 1 hanno un reddito totale più alto
delle sei persone più povere della distribuzione 2; se le sette persone più povere della distribuzione 1
hanno un reddito totale più alto delle sette persone più povere della distribuzione 2; se le otto persone più
povere della distribuzione 1 hanno un reddito totale più alto delle otto persone più povere della
distribuzione 2; se le nove persone più povere della distribuzione 1 hanno un reddito totale più alto delle
nove persone più povere della distribuzione 2; allora preferisco la distribuzione 1.
Principio 10: Questo Principio può essere espresso in modo più esteso come segue. Se la persona più ricca
della distribuzione 1 ha un reddito totale più alto della persona più ricca della distribuzione 2; se le due
persone più ricche della distribuzione 1 hanno un reddito totale più alto delle due persone più ricche della
distribuzione 2; se le tre persone più ricche della distribuzione 1 hanno un reddito totale più alto delle tre
persone più ricche della distribuzione 2; se le quattro persone più ricche della distribuzione 1 hanno un
reddito totale più alto delle quattro persone più ricche della distribuzione 2; se le cinque persone più ricche
della distribuzione 1 hanno un reddito totale più alto delle cinque persone più ricche della distribuzione 2;
se le sei persone più ricche della distribuzione 1 hanno un reddito totale più alto delle sei persone più
ricche della distribuzione 2; se le sette persone più ricche della distribuzione 1 hanno un reddito totale più
alto delle sette persone più ricche della distribuzione 2; se le otto persone più ricche della distribuzione 1
hanno un reddito totale più alto delle otto persone più ricche della distribuzione 2; se le nove persone più
ricche della distribuzione 1 hanno un reddito totale più alto delle nove persone più ricche della
distribuzione 2; allora preferisco la distribuzione 1.

33
Esempi delle distribuzioni possibili
Partecipante 1 2 3 4 5 6 7 8 9 10
Distribuzione 1 2 5 6 8 9 14 17 29 30 30
Distribuzione 2 0 3 8 14 14 17 20 21 23 30
Distribuzione 3 0 1 7 11 13 19 21 23 27 28
Distribuzione 4 0 3 12 14 17 18 20 21 22 23
Distribuzione 5 3 3 9 10 10 20 21 21 24 29
Distribuzione 6 2 2 5 7 15 16 16 28 29 30
Distribuzione 7 3 4 11 14 15 16 17 19 25 26
Distribuzione 8 0 6 8 12 16 16 17 21 26 28
Distribuzione 9 2 2 7 9 14 14 19 26 27 30
Distribuzione 10 0 2 4 13 18 18 19 24 26 26
Distribuzione 11 0 5 11 12 15 17 18 20 25 27
Distribuzione 12 0 4 8 10 11 18 21 24 27 27
Distribuzione 13 0 4 5 9 12 17 24 26 26 27
Distribuzione 14 1 2 2 11 16 20 20 21 27 30
Distribuzione 15 0 2 9 11 14 14 22 24 26 28
Distribuzione 16 2 5 9 11 12 15 18 22 26 30
Distribuzione 17 1 1 8 11 11 18 21 23 26 30
Distribuzione 18 2 3 7 7 15 16 19 25 26 30
Distribuzione 19 4 9 10 12 14 14 19 21 22 25
Distribuzione 20 7 9 10 10 11 13 14 19 28 29
Distribuzione 21 0 5 11 12 13 17 19 20 26 27
Distribuzione 22 3 4 4 14 17 18 18 21 22 29

34
Distribuzione 23 1 3 11 15 16 18 19 21 22 24
Distribuzione 24 2 4 4 4 18 21 23 23 24 27
Distribuzione 25 0 4 6 6 13 15 23 25 28 30
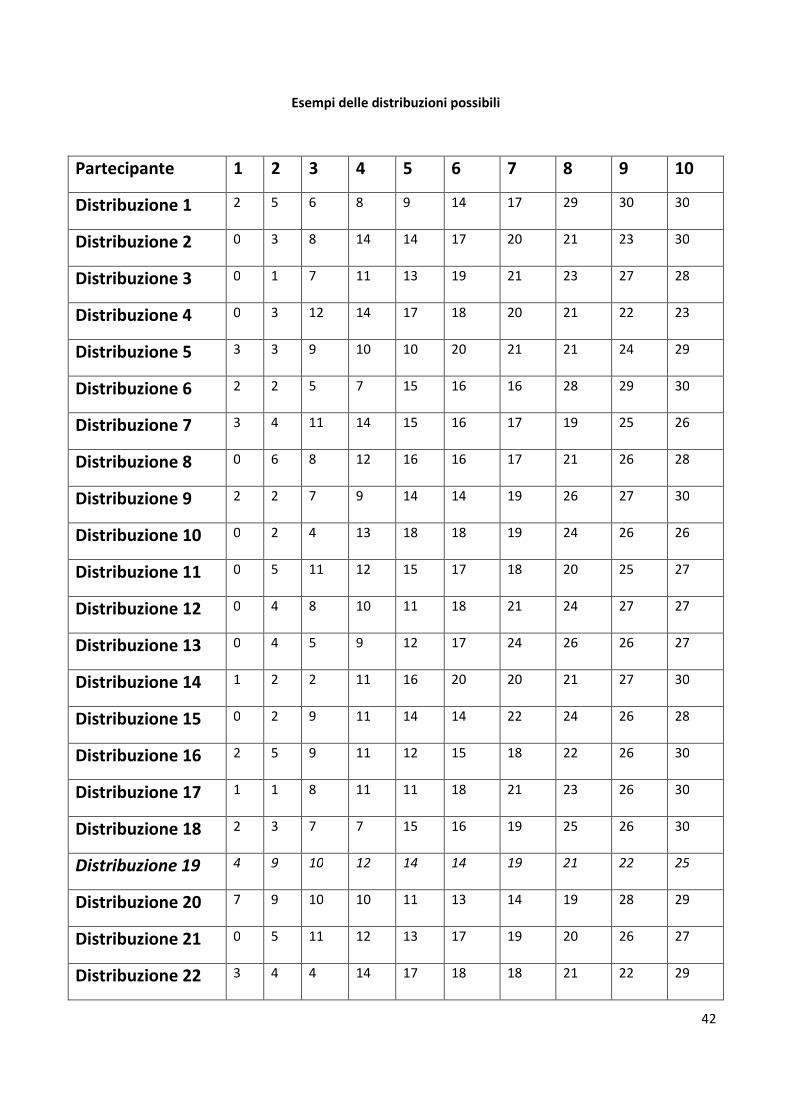
Ogni distribuzione nella tabella è stata generata a caso dal computer. In ogni caso, il reddito totale è €150.
Alla fine dell’esperimento, scegleremo una distribuzione come descritto sopra, e daremo ai partecipanti i
pagamenti nella tabella. Sceglieremo l’ordine dei 10 partecipanti a caso. Per esempio, se la distribuzion 19 è
scelta usando i principi del Pianificatore Sociale, noi diamo al partecipante 1, €4; al partecipante 2, €9; al
partecipante 3, €10; al partecipante 4, €12; al partecipante 5, €14; al partecipante 6, €14; al partecipante 7,
€19; al partecipante 8, €21; al partecipante 9, €22; ed al partecipante 10, €25.
35
CESARE Centro di Economia Sperimentale a Roma Est
Istruzioni
Benvenuto a questo esperimento. Grazie per aver partecipato. Leggi attentamente queste Istruzioni. E’ nel
tuo interesse farlo poichè le tue decisioni potranno determinare i pagamenti che i partecipanti a questo
esperimento riceveranno.
Pagamenti ai partecipanti in questa sessione sperimentale
Ci sono 11 partecipanti in questa sessione. Distribuiremo 165 Euro ai partecipanti. Il modo in cui i 165 Euro
saranno distribuiti dipenderà dalle risposte alle domande poste in questo esperimento. Nota che
l’ammontare totale di 165 Euro é fissa. Le tue risposte possono solo influenzare il modo in cui i 165 Euro
sono distribuiti tra gli 11 partecipanti.
Scopo dell’ esperimento
Questo esperimento è disegnato per scoprire le preferenze degli individui rispetto alla distribuzione del
reddito in una società. In questo esperimento 10 dei 11 partecipanti in questa sessione sperimentale
formeranno una mini-società. L’undicesimo partecipante è il soggetto le cui preferenze determineranno la
distribuzione effettiva del reddito (derivante dall’esperimento) all’interno della nostra mini-società.
Chiameremo l’undicesimo partecipante il Pianificatore Sociale. Chi sarà il Pianificatore Sociale verrà
determinato solo alla fine dell’esperimento come sarà spiegato in seguito. Il Pianificatore Sociale ricevera
da noi un pagamento di €15. Per gli altri 10 partecipanti abbiamo €150 per distribuire fra loro. Le risposte
del Pianifactore Sociale saranno utilizzate per decidere la distribuzione della somma totale di 150 euros tra
gli altri 10 partecipanti in questa sessione sperimentale in laboratorio.
Che cosa ti verrà chiesto di fare
Ti proponiamo di scoprire che cosa pensi della distribuzione del reddito in una determinata società. Ci sono
due modi in cui ciò può essere fatto: presentandoti una serie di possibili distribuzioni e chiedendoti quale
preferisci, o chiedendoti direttamente quali Principi consideri importanti nel decidere una distribuzione del

36
reddito. In questo esperimento seguiremo il secondo modo. Ti verrà presentata una serie di possibili
Principi sulla base dei quali determinerai la distribuzione del reddito e ti verrà chiesto con quale sei
d’accordo. In altre parole dovrai scegliere un sotto-insieme di Principi, e tale sotto-insieme sarà quello che
tu pensi debba essere usato nel determinare la distribuzione del reddito di una società. Se il tuo sotto-
insieme è completo e coerente, allora potrai selezionare una distribuzione preferita da ogni possibile set di
distribuzioni, ossia la tua distribuzione preferita per quell’insieme.
Come sarai pagato per la partecipazione a questo esperimento
Dopo che tutti i partecipanti avranno ultimato l’esperimento, selezioneremo a caso chi di voi sarà il
Pianificatore Sociale. Il computer selezionerà poi a caso 100 differenti distribuzioni di €150 tra 10 individui e
useremo i Principi del Pianificatore Sociale per selezionare la sua distribuzione del reddito preferita
nell’ambito di tale selezione. Questa distribuzione da lui preferita costituirà il pagamento degli altri 10
partecipanti a questa sessione. Il Pianificatore Sociale riceverà un pagamento di €15. Il pagamento che tutti
i partecipanti (ad eccezione del Pianificatore Sociale) riceveranno dipende dalle preferenze del Pianificatore
Sociale. Quindi le tue risposte alle domande dell’esperimento possono determinare la distribuzione dei
pagamenti tra i partecipanti a questa mini-società. E’ per questo motivo che le tue risposte sono
importanti. Ti prego di notare che ogni distribuzione ha la stessa somma di denaro di €150 ad distribuire –
sara diverso solo il modo in quale il reddito totale viene distribuito.
I Principi
Alla fine di queste Istruzioni è allegata una lista di Principi riguardo ai quali dovrai esprimere la tua
opinione: in particolare se sei d’accordo con essi o no. Potrebbe avvenire che tu pensi che tutti i Principi a
cui aderisci non possano essere invocati simultaneamente; in effetti potresti pensare che alcuni vengano
prima di altri. Avrai la possibilità di esprimere questo tipo di preferenze. Quando ti sara chiesto se hai
dichiarato che sei in accordo con un Principio, potrai specificare in seguito a che stadio esso debba essere
invocato. Se, tuttavia, non sei in grado di individuare nessuna circostanza in cui tu sei d’accordo con un
particolare Principio, allora dovrai dichiararlo esplicitamente.
Il software
Quando hai letto queste Istruzioni e chiarito eventuali dubbi con un sperimentatore, è possibile attivare il
software sul computer. Esso ti proporrà i vari Principi, chiedendo in ogni caso di esprimere accordo o
disaccordo. Successivamente il computer ti chiederà di esprimere l'ordine in cui desideri che i Principi scelti
da te devono essere invocati. Il punto cruciale è quello di finire con una serie di Principi, e un ordine in cui
sono invocati, che implica una distribuzione preferita da un insieme di possibili distribuzioni. Infatti, i tuoi
Principi saranno testati per vedere se essi implicano una distribuzione della serie di 100 distribuzioni casuali
generate dal computer (uno dei quali costituisce i pagamenti a 10 dei 11 partecipanti in questa sessione

37
sperimentale). Mentre stai esprimendo le tue preferenze, ci sono tre possibilità: (1) le preferenze sono
coerenti e individuano un’unica distribuzione preferita; (2) le preferenze sono incompatibili, e quindi non
individuano alcuna distribuzione; (3) le tue preferenze sono tra loro coerenti, ma non individuano una
distribuzione unica. Nel caso (1) non ci sono altre scelte da fare; nel caso (2) ti verrà chiesto di indicare un
elenco diverso di Principi; nel caso (3) ti verrà chiesto di specificare almeno un Principio addizionale. Se il
sotto-insieme di Principi che hai selezionato non è sufficiente per determinare una distribuzione unica, il
computer deciderà a caso dalla serie di distribuzioni rimaste dopo l'applicazione dei Principi selezionati. Ti
ricordiamo che se stai invocando i Principi in sequenza, anche le distribuzioni saranno selezionate in
sequenza, utilizzando i Principi secondo l’ordine che hai scelto.
Ripetizioni
Ti ricordiamo che ogni volta che dichiarerai un Principio, il reddito totale da redistribuire e una soma fissa di
€150. Per essere sicuro di aver capito queste Istruzioni, dovrai effetuare l`intero esperimento per tre volte.
Le risposte del Pianificatore Sociale su di una di queste tre ripetizioni scelta a caso sarà utilizzata, come
descritta sopra, per determinare i pagamenti a 10 dei 11 partecipanti in questa sessione sperimentale. Il
Pianificatore Sociale riceverà un pagamento di €15.
Per qualsiasi dubbio, puoi rivolgerti agli sperimentatori.
John Hey Carmen Pasca
Giugno 2009

38
I Principi Indicati
Principio 1: Se il più povero della distribuzione 1 ha un reddito più alto del più povero della distribuzione 2,
allora preferisco la distribuzione 1.
Principio 2: Se il più ricco della distribuzione 1 ha un reddito più alto del più ricco della distribuzione 2,
allora preferisco la distribuzione 1.
Principio 3: Preferisco la distribuzione in cui la dispersione del reddito è minore.
Principio 4: Preferisco la distribuzione in cui la dispersione del reddito è maggiore.
Principio 5: Penso che la distribuzione migliori se togliamo 1 euro ad un individuo e lo diamo ad uno più
povero.
Principio 6: Penso che la distribuzione migliori se togliamo 1 euro ad un individuo e lo diamo ad uno più
ricco.
Principio 7: Penso che la distribuzione migliori se togliamo 1 euro ad un gruppo di individui e lo diamo ad
un gruppo di più poveri.
Principio 8: Penso che la distribuzione migliori se togliamo 1 euro ad un gruppo di individui e lo diamo ad
un gruppo di più ricchi.

39
Principio 9: Se gli n individui più poveri della distribuzione 1 hanno un reddito totale più alto degli n
individui più poveri della distribuzione 2, per tutti i valori di n compresi tra 1 e 10, preferisco la distribuzione
1.
Principio 10: Se gli individui n più ricchi della distribuzione 1 hanno un reddito totale più alto degli n
individui più ricchi della distribuzione 2, per tutti i valori di n compresi tra 1 e 10, preferisco la distribuzione
1.

40
Alcuni dettagli aggiuntivi sui Principi
Principio 1: Esso può essere ulteriormente chiarito come segue. Se i più poveri delle due distribuzioni
hanno lo stesso reddito, allora se la seconda persona più povera della distribuzione 1 ha un reddito più alto
della seconda persona più povera della distribuzione 2, allora preferisco la distribuzione 1; se le due
persone più povere nelle due distribuzione hanno gli stessi redditi, se la terza persona più povera nella
distribuzione 1 ha un reddito più alto della terza persona più povera della distribuzione 2, allora preferisco
la distribuzione 1, e così via.
Principio 2: Esso può essere ulteriormente chiarito come segue. Se i più ricchi delle due distribuzioni hanno
lo stesso reddito, allora se la seconda persona più ricca della distribuzione 1 ha un reddito più alto della
seconda persona più ricca della distribuzione 2, allora preferisco la distribuzione 1; se le due persone più
ricche nelle due distribuzione hanno gli stessi redditi, se la terza persona più ricca nella distribuzione 1 ha
un reddito più alto della terza persona più ricca della distribuzione 2, allora preferisco la distribuzione 1, e
così via.
Principio 3: Qui la deviazione standard dei redditi (radice quadrata della varianza) è usata come misura di
dispersione.
Principio 4: Qui la deviazione standard dei redditi (radice quadrata della varianza) è usata come misura di
dispersione.
Principio 5: Questo Principio può essere applicato molte volte, sempre togliendo un euro da qualcuno per
darlo a qualcuno più povero.
Principio 6: Questo Principio può essere applicato molte volte, sempre togliendo un euro da qualcuno per
darlo a qualcuno più ricco.

41
Principio 7: La dimensione del gruppo va decisa. Il Principio non dice nulla riguardo agli effetti di una
redistribuzione all’interno del gruppo stesso.
Principio 8: La dimensione del gruppo va decisa. Il Principio non dice nulla riguardo agli effetti di una
redistribuzione all’interno del gruppo stesso.
Principio 9: Questo Principio può essere espresso in modo più esteso come segue. Se la persona più povera
della distribuzione 1 ha un reddito totale più alto della persona più povera della distribuzione 2; se le due
persone più povere della distribuzione 1 hanno un reddito totale più alto delle due persone più povere
della distribuzione 2; se le tre persone più povere della distribuzione 1 hanno un reddito totale più alto
delle tre persone più povere della distribuzione 2; se le quattro persone più povere della distribuzione 1
hanno un reddito totale più alto delle quattro persone più povere della distribuzione 2; se le cinque
persone più povere della distribuzione 1 hanno un reddito totale più alto delle cinque persone più povere
della distribuzione 2; se le sei persone più povere della distribuzione 1 hanno un reddito totale più alto
delle sei persone più povere della distribuzione 2; se le sette persone più povere della distribuzione 1
hanno un reddito totale più alto delle sette persone più povere della distribuzione 2; se le otto persone più
povere della distribuzione 1 hanno un reddito totale più alto delle otto persone più povere della
distribuzione 2; se le nove persone più povere della distribuzione 1 hanno un reddito totale più alto delle
nove persone più povere della distribuzione 2; allora preferisco la distribuzione 1.
Principio 10: Questo Principio può essere espresso in modo più esteso come segue. Se la persona più ricca
della distribuzione 1 ha un reddito totale più alto della persona più ricca della distribuzione 2; se le due
persone più ricche della distribuzione 1 hanno un reddito totale più alto delle due persone più ricche della
distribuzione 2; se le tre persone più ricche della distribuzione 1 hanno un reddito totale più alto delle tre
persone più ricche della distribuzione 2; se le quattro persone più ricche della distribuzione 1 hanno un
reddito totale più alto delle quattro persone più ricche della distribuzione 2; se le cinque persone più ricche
della distribuzione 1 hanno un reddito totale più alto delle cinque persone più ricche della distribuzione 2;
se le sei persone più ricche della distribuzione 1 hanno un reddito totale più alto delle sei persone più
ricche della distribuzione 2; se le sette persone più ricche della distribuzione 1 hanno un reddito totale più
alto delle sette persone più ricche della distribuzione 2; se le otto persone più ricche della distribuzione 1
hanno un reddito totale più alto delle otto persone più ricche della distribuzione 2; se le nove persone più
ricche della distribuzione 1 hanno un reddito totale più alto delle nove persone più ricche della
distribuzione 2; allora preferisco la distribuzione 1.
42
Esempi delle distribuzioni possibili
Partecipante 1 2 3 4 5 6 7 8 9 10
Distribuzione 1 2 5 6 8 9 14 17 29 30 30
Distribuzione 2 0 3 8 14 14 17 20 21 23 30
Distribuzione 3 0 1 7 11 13 19 21 23 27 28
Distribuzione 4 0 3 12 14 17 18 20 21 22 23
Distribuzione 5 3 3 9 10 10 20 21 21 24 29
Distribuzione 6 2 2 5 7 15 16 16 28 29 30
Distribuzione 7 3 4 11 14 15 16 17 19 25 26
Distribuzione 8 0 6 8 12 16 16 17 21 26 28
Distribuzione 9 2 2 7 9 14 14 19 26 27 30
Distribuzione 10 0 2 4 13 18 18 19 24 26 26
Distribuzione 11 0 5 11 12 15 17 18 20 25 27
Distribuzione 12 0 4 8 10 11 18 21 24 27 27
Distribuzione 13 0 4 5 9 12 17 24 26 26 27
Distribuzione 14 1 2 2 11 16 20 20 21 27 30
Distribuzione 15 0 2 9 11 14 14 22 24 26 28
Distribuzione 16 2 5 9 11 12 15 18 22 26 30
Distribuzione 17 1 1 8 11 11 18 21 23 26 30
Distribuzione 18 2 3 7 7 15 16 19 25 26 30
Distribuzione 19 4 9 10 12 14 14 19 21 22 25
Distribuzione 20 7 9 10 10 11 13 14 19 28 29
Distribuzione 21 0 5 11 12 13 17 19 20 26 27
Distribuzione 22 3 4 4 14 17 18 18 21 22 29

43
Distribuzione 23 1 3 11 15 16 18 19 21 22 24
Distribuzione 24 2 4 4 4 18 21 23 23 24 27
Distribuzione 25 0 4 6 6 13 15 23 25 28 30
Ogni distribuzione nella tabella è stata generata a caso dal computer. In ogni caso, il reddito totale è €150.
Alla fine dell’esperimento, scegleremo una distribuzione come descritto sopra da una lista di 100
distribuzioni generate a caso dal computer, e daremo a 10 dei 11 partecipanti i pagamenti indicati così nella
tabella. Sceglieremo l’ordine dei 10 partecipanti a caso. Per esempio, se la distribuzione 19 è scelta usando i
principi del Pianificatore Sociale, noi diamo al partecipante 1, €4; al partecipante 2, €9; al partecipante 3,
€10; al partecipante 4, €12; al partecipante 5, €14; al partecipante 6, €14; al partecipante 7, €19; al
partecipante 8, €21; al partecipante 9, €22; ed al partecipante 10, €25. Il Pianificatore Sociale riceverà un
pagamento di €15.